
Toward Unified pH of Saline Solutions
by
 , , , and
Silvie Lainela
1,2,3,* ,
,
Ivo Leito
2,
Agnes Heering
2,
Gaëlle Capitaine
3,
Bárbara Anes
4,
Filomena Camões
4 and
Daniela Stoica
3,* 1
Department of Marine Systems, Tallinn University of Technology, Akadeemia tee 15a, 12618 Tallinn, Estonia
2
Institute of Chemistry, University of Tartu (UT), 14a Ravila Street, 50411 Tartu, Estonia
3
Laboratoire National de Métrologie et d’Essais (LNE), 1 Rue Gaston Boissier, 75015 Paris, France
4
FCiências. ID (FC.ID), Centro de Química Estrutural, Faculdade de Ciências da Universidade de Lisboa, Campo Grande, 1749-016 Lisboa, Portugal
*
Authors to whom correspondence should be addressed.
Water 2021, 13(18), 2522; https://doi.org/10.3390/w13182522
Submission received: 3 August 2021
/
Revised: 5 September 2021
/
Accepted: 10 September 2021
/
Published: 15 September 2021
(This article belongs to the Section Oceans and Coastal Zones)
Abstract
:Fluctuations of pH in coastal systems are generally surveyed through potentiometric pH measurements. A new concept of a unified pH scale was introduced with the great advantage of enabling comparability of absolute values, pHabs, pertaining to any medium. Using water as an anchor solvent, yielding , enables referencing the pHabs values to the conventional aqueous pH scale. The current work aims at contributing to implement to saline solutions. To this purpose, differential potentiometric measurements, with a salt bridge of ionic liquid [N2225][NTf2], were carried out aiming at overcoming problems related to residual liquid junction potentials that affect the quality of such measurements. The ability to measure with acceptable uncertainty was evaluated using Tris-Tris·HCl standard buffer solutions prepared in a background matrix close to the characteristics of estuarine systems (salinity of 20) as well as with NaCl solutions with ionic strength between 0.005 and 0.8 mol kg−1. The present study shows that for high ionic strength solutions, such as seawater, challenges remain when addressing the assessment and quantification of ocean acidification in relation to climate change. Improvements are envisaged from the eventual selection of a more adequate ionic liquid.
1. Introduction
Seawater pH values are of the highest relevance in marine chemistry studies, not only by being acidity indicators but also due to the control played by H+(aq) over the various simultaneous equilibria occurring in seawater.
In the context of seawater pH measurement, the ability to observe trends is most important. Metrological aspects are particularly important when attempting to discriminate between different sources of medium variability and to detect small changes between experimental results for discovering long-term trends or spatial variations.
Increasing atmospheric CO2 dissolution in seawater with a predictable decrease in pH is referred to as ocean acidification. The worldwide community has targeted to minimize and address the impacts of ocean acidification as part of the Sustainable Development Goals (SDG 14.3). Reliable ocean acidification monitoring places the highest demands on pH determination and needs small uncertainty. The uncertainty goal to strive for is the “climate” goal, defined as measurements of a quality sufficient to assess long-term anthropogenically driven changes, where standard uncertainty is determined by the Global Ocean Acidification Observation Network as 0.003 in pH [1]. The minimum uncertainty goal is the “weather” goal, determined as 0.02 in pH [1]. This level of uncertainty is suitable for coastal and nearshore environments to identify relative spatial patterns and short-term variations. Coastal systems are influenced by processes in their catchment areas, and the magnitude of these processes per unit area is much larger in comparison with the open ocean, resulting in much more dynamic systems. Therefore, estuaries exhibit much greater diurnal and seasonal variation in pH than the open ocean. Fluctuations of pH in these environments are generally surveyed through direct potentiometric pH measurements, calibrated using standard buffer solutions, e.g., the work of [2].
Routine potentiometric pH measurements mostly rely on H+-sensitive glass electrodes (GE), most often a combination glass electrode. The difference of potential is measured between a glass electrode whose potential, EGE, is linearly related to pH, and an external reference electrode (RE) of constant potential, ERE. GE and RE electrodes are immersed in separate solutions. GE in the tested solution and its potential is H+(aq)-dependent, and RE, generally a silver-silver chloride electrode, Ag/AgCl, in its own internal chloride-containing solution of constant ionic composition and high ionic strength, hence constant potential. RE is linked with the tested solution by means of a junction, which allows electric contact while preventing the mixing of the solutions. The internal solution is typically a saturated (sat. ≈ 4.2 mol dm−3) or highly concentrated (≥3.5 mol dm−3) KCl aqueous solution (R1). GE and RE are often combined into a single rod forming a combination pH electrode (identified by B in Figure 2).
Ag | AgCl | sat. KCl (aq) || Test Solution | GE
The difference of potential occurring in the R1, EI, is linked to pH through the Nernst equation, Equation (1):
where is a constant term, the intercept (mV), and k is the practical slope (mV/pH), both obtained from the calibration of the glass electrode with standard buffer solutions. Such standard buffers have a fundamental role in the calibration hierarchy for pH measurement setups.
The contact between the two solutions, sat. KCl (aq) and tested solution (R1), forms a liquid junction that generates a liquid junction potential, LJP [3], thus playing an important role in the quality of measured pH values. It is an additional potential that can neither be directly measured nor easily calculated. Therefore, it is a major source of bias in classical pH measurements and is considered the Achilles’s heel of potentiometric measurements. The value of LJP depends on the interfacing solutions and on the shape and form of the junction. There are many different physical designs and chemical compositions of junctions (porous, capillary, sleeve, glass frit, ceramic, free flow, etc.), which affect the ion flow and thereby the LJP.
The key assumption in terms of the LJP in routine pH measurements is that the LJP at the liquid junction is the same in the case of the tested solution and the calibration solutions. In order to achieve this, it is useful to have LJP that is (1) as low as possible and (2) as far as possible determined by the inner electrolyte of the RE. For this, the inner electrolyte of the RE should have anion and cation with as similar conductance as possible (K+ and Cl− are suitable examples in this respect) and ionic strength significantly higher than both the tested solutions and calibration solutions. Under such circumstances, LJP is similar in tested and calibration solutions and cancels to a large extent. The part of LJP, which is not canceled, is called residual liquid junction potential, RLJP. In routine pH measurement, RLJP is usually ignored. Importantly, RLJP becomes problematic if the ionic strength of the tested solution is high. Seawater is a typical example of such a solution.
(i) One possibility to reduce the magnitude of RLJP is to calibrate glass electrodes with standard buffer solutions that match in terms of composition and ionic strength of the analyzed sample [4,5,6]. However, the overall ionic strength of seawater with a practical salinity of 35 is approximately 0.7 mol kg−1, which is significantly out and above the limits of the assumptions used to assign pH values to standard buffer solutions. Attempts have been made to characterize buffer solutions consisting of 2-amino-2-hydroxymethyl-1,3-propanediol (Tris) and Tris hydrochloride, Tris·HCl, in saline background. However, limitations concerning the Pitzer model in high ionic strength solutions restrict the assessment of the individual chloride activity coefficient, , to only 25 °C, hence limiting the characterization of such pH buffers to a few specialized metrology institutes.
(ii) Another option to reduce the magnitude of RLJP is the use of reference electrodes with a double junction (DJ RE; Figure 1) due to the introduction of an additional electrolyte between the test solution and the inner solution of the reference electrode. This additional electrolyte forms a salt bridge with two junctions. In the case of such electrodes, there will be liquid junction potentials at both junctions, and the overall LJP will be their algebraic sum. If the ionic strength of the bridge electrolyte is sufficiently higher than the ionic strengths of the tested solution and the reference electrode solution, then the LJP contributions will to a large extent, cancel. This means that with this kind of electrode, the RLJP will typically be smaller than LJP in the case of single-junction reference electrodes. The choice of the bridge electrolyte is driven by various factors, e.g., protecting the reference electrode from contamination by the sample solution, overcoming eventual incompatibility between the sample solution and KCl of the inner compartment, matching solvent with the sample, aiming at reducing the RLJP contribution, etc.
To overcome the problem of RLJP, traditionally, salt bridges of a concentrated aqueous potassium chloride (KClSB) solution have been used. Work of [7] tested different junction designs (capillary, sleeve, platinum, and ceramics) with traditional buffer solutions and concluded that the lowest uncertainties are obtained with electrodes having capillary junctions and the highest with electrodes equipped with ceramic junctions. However, KClSB never managed to reduce the LJP sufficiently; additionally, it requires a long time period before reaching a stable potential and therefore indicates problems of KClSB leaking into the sample.
(iii) The development of hydrophobic ionic liquid salt bridges (ILSB) has contributed to overcoming several weaknesses determined for the usage of electrolytes such as KCl. At the interface between the hydrophobic ionic liquid phase and the aqueous phase, free from leakage and clogging [8], a phase-boundary not dependent on time develops and results in stable potential. Recently, an ILSB composition has been developed [9,10], which in many systems behaves in a close-to-ideal manner. This tailor-made ionic liquid salt bridge is the triethylamylammonium bis(trifluoromethylsulfonyl)imide, also noted as [N2225][NTf2]. It was demonstrated that the salt bridge formed by the mentioned IL yields negligible LJP values in a number of systems, involving solvents with very different properties, such as water, dimethylformamide, and acetonitrile [10]. There are advantages of using this ILSB: the used ionic liquid cancels the two LJPs formed at the ends of the capillary with solutions made in different solvents with RLJP = 0 mV ± 6.3 mV [9,10]. However, importantly, the ionic strengths of the solutions that were used for those experiments were in the range of 0.1 to 10 mmol dm−3, while seawater’s ionic strength is typically approximately 0.7 mol dm−3. The standard uncertainty of ±6.3 mV covers various solvents but is expected to be lower if measurements are carried out in low ionic strength aqueous solutions. The use of this ILSB with solutions of high ionic strength, such as seawater, has not yet been fully investigated.
(iv) Recently, it was demonstrated that the ILSB advantageously contributes to the implementation and experimental realization of an intersolvental pH scale based on a single universal reference point for all media, the ideal proton gas at p = p ⦵ = 105 Pa and T = 298.15 K, comprising absolute pH values, pHabs. These enable valid and comparable values for all systems, including non-aqueous and aqueous organic solvents. For practical reasons and due to the key role of water as a solvent, pHabs is shifted by a constant in order to link the absolute acidity to the aqueous pH scale [11].
The present paper focuses on the implementation of the concept to saline solutions (concurrently in two different laboratories). This is performed by the use of high-order Tris-Tris·HCl pH reference solutions prepared in simplified seawater background, covering salinity (S = 20) and pH range close to the values of coastal systems [12]. Reference pH values are assigned by the primary setup based on the Harned cell and are traceable to the SI via the LNE’s standard measurement procedure. Furthermore, the study addresses issues concerning the cancelation of the RLJPs when ILSB is established between aqueous solutions with ionic strength ranging from 0.005 to 0.8 mol kg−1.
2. Materials and Methods
2.1. Reagents and Solution Preparation
All solutions were prepared by gravimetry. Sodium chloride and potassium chloride salts were purchased from VWR. The mass fraction of halide content was assessed by coulometry with an expanded relative uncertainty (k = 2) of 0.037%. Tris(hydroxymethyl)methylamine (Tris) was purchased from NIST (SRM723e). A hydrochloric acid stock solution was prepared from a commercial 30% HCl solution purchased from Merck. The amount content of chloride in the HCl stock solution was estimated by titrimetry with an expanded relative uncertainty (k = 2) of 0.14%.
The ionic liquid triethylpentylammonium bis(trifluoromethanesulfonyl)imide, [N2225][NTf2], was obtained from Iolitec GmbH (Heilbornn, Germany; courtesy of Dr. V. Radtke, University of Freiburg).
2.2. Measurement Methods
An overview of the used methods is given in Figure 2. All the measurements were carried out at 25.00 ± 0.05 °C.
2.2.1. Primary Method Used to Assign Reference pH Values for Tris-Tris·HCl Buffer Solutions
Three Tris-Tris·HCl buffer solutions of different molality ratios were prepared in an artificial seawater medium (Table 1). The artificial seawater matrix was composed of NaCl only. The ionic strength of the solutions was calculated from the target salinity S = 20 using Equation (2) [13]:
The composition of pH buffer solutions used in the present study is given in Table 1.
The primary method relies experimentally on the measurement of the difference of potential between a hydrogen gas electrode as an H+ indicator electrode and a silver-silver chloride reference electrode, Ag/AgCl, immersed in the same solution. The primary cell, also called the Harned cell, is designed to avoid any liquid junction. The electrochemical cell can be written as:
Pt | H2 | buffer(S), Cl− | AgCl | Ag
The method is well described in the literature [3]. The primary pH values were calculated using Equation (3):
where EII is the potential difference of the R2, E° represents the standard potential of Ag/AgCl electrode, indicates the molality of chloride ions, m° is the standard molality taken as 1 mol kg−1 and represents the activity coefficient of chlorides. For the present study, was calculated with the Pitzer model.
2.2.2. pH Measurements with Classical Combination pH Electrodes
A Metrohm 867 pH Module and pH glass electrodes, two Unitrode and two Primatrode electrodes purchased from Metrohm, were used to conduct pH measurements with classical glass electrodes. The electrodes differ by the nature of their diaphragm. According to the manufacturer, Unitrode electrodes have a fixed ground-joint diaphragm, whereas Primatrode electrodes have a ceramic diaphragm.
The first approach (Method 1.1 in Figure 2) corresponds to the current practices for measuring seawater pH with the potentiometric method. Prior to the measurements, each electrode was calibrated using a three-point calibration approach with commercial standard buffer solutions traceable to SI (nominal pH 4, 7, and 10) purchased from Hach Lange. Standard uncertainties assigned by the manufacturer are 0.005 pH at 25 °C. All Tris-Tris·HCl buffer solutions were considered as unknown samples.
In the second experiment (Method 1.2 in Figure 2), a two-point bracketing calibration procedure with saline pH buffers 1 and 3 has been applied to perform pH measurements of saline Tris-Tris·HCl buffer number 2 that was treated as an unknown sample.
The calibration parameters were calculated manually using the operating principle of the pH meter and used to assign pH values. Accuracy has been estimated based on the potentiometric measurements performed at the primary level with the Harned cell.
The pH of each sample is measured in three different flasks, and for each flask, a series of three measurements are carried out over about 120 s (one point every 2 s). The mean pH values are given in Table 4.
2.2.3. Measurements
The concept of unified pH scale was realized in two configurations: in differential cells using two solid-contact glass electrode (SCGE) half-cells from Izmeritelnaya tekhnika EST-0601 (Moscow, Russia) and an ILSB (cell C, Method 2.1 in Figure 2) [14]. Secondly, a configuration between a solid-contact glass electrode half-cell and a double junction Ag/AgCl RE (DJ RE) with two filling solutions: a 3 M KCl (aq) inner solution, and ionic liquid outer filling solution, acting as an ILSB (cell D, Method 2.2 in Figure 2) [15].
The operational realization of method 2.1 is based on the potential difference between two SCGEs (SCGE1 and SCGE2) without a RE. The electrodes are immersed in different solutions, S1 and S2, respectively, and the half-cells are connected via a capillary filled with ionic liquid (R3):
SCGE2 | S2 | bridge solution [N2225][NTf2] | S1 | SCGE1
The measured output is the potential difference between the different tested and calibration solutions (ΔEIII; Equation (4)), which is converted into difference ().
The RLJP is assumed to be 0 mV, and no corrections are made to the measured potentials. The values are obtained by the least-squares minimization process described in more detail in the work of [14].
Method 2.2 is easier to implement in routine laboratory analysis. R4 corresponds to this method and can be written:
SCGE | Solution | [N2225][NTf2] | 3 M KCl (aq) | AgCl | Ag
values were calculated from Equation (5):
where ΔEIV is the measured potential of the R4, I and k represent the intercept and slope of the glass electrode, respectively, determined based on the calibration step.
measurements were conducted in two different laboratories: at the University of Tartu in Estonia and at LNE in France. Table 2 summarizes the details of measurements corresponding to the two configurations implemented by both laboratories.
2.2.4. Determination of RLJP
Measurements for the evaluation of the RLJP have been performed using a tailor-made cell. The difference of potential between a DJ RE and a “primary” Ag/AgCl electrode was measured. The “primary” Ag/AgCl electrode is a junction-free thermo-electrolytic electrode made at LNE and used for primary pH measurements. In a first approach, the inner compartment of the DJ RE was filled with KCl 3.5 mol kg−1 and the outer compartment with IL (noted a and d in Figure 1, respectively). The electrochemical cell is written as:
Ag | AgCl | NaCl (m) || IL || KCl 3.5 m | AgCl | Ag
A second configuration has been tested, this time filling both compartments of the DJ RE with KCl 3.5 mol kg−1. The electrochemical cell is represented as:
Ag | AgCl | NaCl (m) || KCl 3.5 m || KCl 3.5 m | AgCl | Ag
Between two consecutive measurements, the electrolytes in both compartments of the DJ RE were completely renewed with the same volume of liquid. To this purpose, after preparation, the stock electrolyte solution was divided into several vials filled to the brim.
The glass cell used to perform measurements of RLJP is jacketed to ensure temperature control through a water circulation circuit from a LAUDA ECO GOLD RE 2025 GN cryothermostat. Measured temperatures were within ±0.05 °C of the target value of 25 °C. Between two measurements, the cell was thoroughly washed with Milli-Q water then rinsed with absolute ethanol before being dried in an oven at 110 °C for at least 30 min.
The difference of potential measurements was carried out with a digital multimeter Agilent 34972A. The values were collected every 20 s using the Agilent Benchlink Data Logger software. To limit the electromagnetic noise and have a stable signal, the setup was placed in a Faraday cage (Bio-Logic FC-45). Data obtained over 1000 s after stabilization were used for data treatment.
Experiments were carried out with six NaCl solutions with molalities between 0.005 and 0.8 mol kg−1. ERE is calculated using Equation (6):
where ΔE represents the measured potential, E° is the standard potential of primary Ag/AgCl electrode and represents the activity of chloride ions of the NaCl tested solutions. The E° corresponding to the primary Ag/AgCl electrode is assigned using Harned cell and primary pH setup in an HCl solution of molality 0.01 mol kg−1.
The activity of chloride ions is calculated with Equation (7) as the product between the molality, , and the activity coefficient, of the chlorides:
The activity coefficients were calculated using the Debye–Hückel equation with the Bates–Guggenheim convention Equation (8) for solutions with ionic strength below 0.1 m and with the Pitzer equation for solutions with ionic strength above 0.1 m.
The calculated activity coefficients of chloride ions, as well as the activities of chloride ions, are given in Table 3 for each tested NaCl solution.
3. Results and Discussion
The main intention of the current work, while contributing to linking saline solution pH to the IUPAC pH scale, is at the same time to implement measurements of saline solutions, identify eventual problems, and envisage ways to overcome them. It was performed by the use of high-order Tris-Tris·HCl reference solutions prepared in simplified seawater background. Salinity (S = 20, I ≈ 0.41 mol kg−1) for the artificial seawater pH buffer solutions was chosen close to the characteristics of estuarine systems. A simplified matrix composed only of water and NaCl was selected in order to more easily highlight the effects of using different methodologies. The applied concepts include measurements with combination glass electrodes, implementation of a unified pH scale with the use of ILSB (concurrently in two different laboratories), and calculations of RLJP.
The practices for the potentiometric measurement of seawater pH have been applied through method 1.1 (Figure 2) on buffer solutions prepared in the saline background and characterized with the primary pH method. The results are presented in Table 4 and illustrate the experimental problems, which hinder achieving the level of accuracy suitable to study pH variability in seawater media and discrimination between different sources of medium variability (natural vs. anthropogenic).
Table 4 first column presents the primary pH values for the three Tris-Tris·HCl buffer solutions together with their respective associated standard (k = 1) uncertainties. Similar to what is common for low ionic strength buffer solutions [3], these uncertainties do not take into account the contribution coming from the activity coefficient of chloride.
Table 4 summarizes overall the pH and measurement values obtained for the three Tris-Tris·HCl buffer solutions with different configurations of methods 1 and 2.
As expected, the results obtained by calibrating the combination glass electrodes with low ionic strength solutions show a bias of 0.09 with all three buffers. This is confirmed by the pH results obtained with buffer 2 after calibrating the electrodes with saline solutions according to method 1.2. The main advantage of this method is the minimization of the RLJP that leads to more accurate pH values. However, at the moment, theoretical difficulties arise from the assignment of the activity coefficient of chlorides, as theories and equations used for solutions with I < 0.1 are not valid for the seawater matrix. Pitzer model is referred to in the bibliography [16,17], but there is no yet consensus neither on the values to be used nor on their contribution to the overall uncertainty of pH value. This explains the absence of commercially available appropriate standards, which hinders the achievement of accurate and reliable measurement of pH values for seawater samples that are traceable to the IUPAC pH scale. In this context, the concept could be an interesting option as it may enable to overcome the needs for the development of new standards.
scale is equivalent to the IUPAC scale [14]. The equivalence and the robustness of the measurements procedures applied here as methods 2.1 and 2.2 have been demonstrated within an interlaboratory exercise [14,15] with 10 participants, each having their own setup, i.e., cells, electrodes, and measurement system. From Table 4, very suitable consistency can be noted between the results for buffers 1 and 3 obtained by UT and LNE and between the two configurations. The magnitude of standard uncertainty of values is about 0.1 pH units. The dominant uncertainty contribution is due to the RLJP, amounting to 6.3 mV. Taking into account this considerable uncertainty level, for all the buffer solutions, the values are statistically equivalent to the primary pH values but not fit for specific oceanographic purposes. The standard uncertainty of 6.3 mV assigned to RLJP represents the junctions established between a range of different solvents. One would expect that for measurements between solutions made in the same solvent, e.g., water, the uncertainty is lower. On the other hand, the 6.3 mV standard uncertainty refers to solutions with ionic strengths of 0.1 mmol dm−3 to 10 mmol dm−3, which is orders of magnitude lower than in the case of seawater, thereby increasing uncertainty because the ILSB is not as efficient in compensating the LJP anymore.
Additionally, the data in Table 4 demonstrate that the obtained values obtained with methods 2.1 and 2.2 are very close to pH values obtained after calibration of combination glass electrodes with dilute standard buffer solutions (method 1.1). This finding confirms that the behavior of the IL [N2225][NTf2] deviates from ideality when measuring high ionic strength solutions against low ionic strength solutions, even if made in the same solvent. According to V. Radtke [18], this specific IL meets several requisites for a salt bridge, i.e., (i) a strong binary electrolyte of which cations and anions exhibit equal transference numbers through the whole cell; (ii) absence of solvent avoids its contribution to liquid junction effects. (iii) cancelation of the contribution to the liquid junction potentials arising from the differences in solvation free energies and mobilities of the involved ions in different solvents.
RLJP emerging from the electrolyte concentration of the measured solution has been verified based on additional investigations with NaCl solutions with ionic strength between 0.005 and 0.8 mol kg−1. Table 5 summarizes the data obtained when the salt bridge is formed by the IL and KCl based on measurements carried out with the method described in Section 2.2.4.
Measurements have been performed in ascending order of the molality of NaCl solutions. With the aim of verifying the reproducibility of obtained values, the measurements with the solution of the lowest molality, i.e., 0.005 m, were made again after completing all the measurements, Table 5.
Under the configuration of ILSB (R5), two junctions occur: one at the boundary between IL and the internal compartment filled with KCl 3.5 m, noted Φ1, and another between IL and the analyzed NaCl solution, noted Φ2. Experimentally, there is no possibility to separate these contributions; therefore, only the sum of the two LJPs can be determined, noted as . The junction established between IL and the internal compartment is unchanged and supposed to remain constant during the measurements with different NaCl solutions. Under this hypothesis, for each analyzed solution, an attempt has been made to quantify the RLJP by subtracting the value determined for NaCl solution at 0.1 m from their respective value. This amounts to estimating the RLJP between two different aqueous NaCl solutions of different molality. The effect of this RLJP on measurement values was evaluated. The results confirm the existence of a bias coming from the RLJP and explain the bias in the results obtained with the saline buffer solutions. The bias in terms of pH values introduced by the RLJP in the case of the IL appears to be relatively stable and specific to a range of concentrations: around 0.02 for I < 0.1 mol kg−1 and around 0.1 ionic strength between 0.4 and 0.8 mol kg−1. An interesting perspective allowing RLJP contribution to be negligible could be replacing the studied IL [N2225][NTf2] with another IL, eventually more efficient in that respect. Some criteria for choosing the IL have been discussed in the work of [19]. An alternative perspective could be to determine in detail the relationship between bias and salinity and use the relationship for corrections.
For the configuration of R6 with KClSB, it is expected that the LJP between the salt bridge and the inner compartment is very close to zero, as it is usually obtained when the same electrolyte at the same concentration is on each side of the junction. Consequently, each experiment enables measuring the LJP between KClSB and the analyzed NaCl solution. The RLJP and its effect on pH were estimated using the same approach described beforehand. The KClSB decreases the magnitude of the bias affecting measurement results, but the accuracy problems persist.
4. Conclusions
The overall aim of the current study is to contribute to the development of knowledge on the measurement of seawater pH in the IUPAC pH scale, as well as in the form of relative to a unified scale of absolute values, pHabs. Using high-order standard buffer solutions with assigned primary pH values traceable to SI is a valuable approach to estimate the quality and performances of a given method.
The various steps of the potentiometric method and procedures, in the differential mode and in alternative configurations, have been investigated in detail through pH measurements in artificial seawater; salinity (S = 20, I ≈ 0.41 mol kg−1) for the pH buffer solutions chosen in accordance with the characterization of estuarine systems. A simplified matrix composed only of water and NaCl was selected in order to more easily highlight the effects of using different methodologies. More sound extrapolation of conclusions to a range of complex solutions, namely real estuarine samples, is linked with additional fundamental and experimental studies that are running in parallel. For the sake of minimizing the contribution of liquid junction potentials, the use of electrodes with KCl salt bridge as opposed to the [N2225][NTf2] IL salt bridge looks to be more appropriate for seawater pH measurements. This points to the need to investigate further on the selection of an eventually more adequate IL or possibly a combination of ILs.
Despite the progress achieved in improving the quality of measured pH values, accurate potentiometric pH measurements in seawater still remain a challenge for science, particularly when aiming at assessing and quantifying ocean acidification in terms of long-term anthropogenically driven changes.
Author Contributions
Conceptualization, S.L., I.L., A.H., B.A., F.C. and D.S.; methodology, A.H., D.S., I.L., G.C. and F.C.; validation, F.C., D.S. and I.L.; formal analysis, D.S., G.C. and A.H.; investigation, S.L., I.L., A.H., G.C., B.A., F.C. and D.S.; resources, S.L., I.L., A.H., B.A., F.C. and D.S.; data curation, A.H. and D.S.; writing—original draft preparation, S.L.; writing—review and editing, S.L., I.L., A.H., G.C., B.A., F.C. and D.S.; visualization, A.H., D.S. and G.C.; supervision, I.L. and D.S.; project administration, D.S.; funding acquisition, D.S. and I.L. All authors have read and agreed to the published version of the manuscript.
Funding
The project 17FUN09 UnipHied was funded by the EMPIR program co-financed by the Participating States and from the European Union’s Horizon 2020 research and innovation program. The work at UT was additionally supported by the Estonian Research Council grant PRG690.
Acknowledgments
FC.ID, whose work was developed in Centro de Química Estrutural, thanks Fundação para a Ciencia e Tecnologia for funding under project UID/QUI/00100/2020.
Conflicts of Interest
The authors declare no conflict of interest. The funders had no role in the design of the study, in the collection, analyses, or interpretation of data, in the writing of the manuscript, or in the decision to publish the results.
References
- Newton, J.A.; Feely, R.A.; Jewett, E.B.; Williamson, P.; Mathis, J. Global Ocean Acidification Observing Network: Requirements and Governance Plan, 2nd ed. GOA-ON. Available online: http://www.goa-on.org/documents/general/GOA-ON_2nd_edition_final.pdf (accessed on 22 July 2021).
- Tiwari, T.; Buffam, I.; Sponseller, R.A.; Laudon, H. Inferring scale-dependent processes influencing stream water biogeochemistry from headwater to sea. Limnol. Oceanogr. 2017, 62, S58–S70. [Google Scholar] [CrossRef]
- Buck, R.P.; Rondinini, S.; Covington, A.K.; Baucke, F.G.K.; Brett, C.M.A.; Camoes, M.F.; Milton, M.J.T.; Mussini, T.; Naumann, R.; Pratt, K.W.; et al. Measurement of pH. Definition, standards, and procedures. Pure Appl. Chem. 2002, 74, 2169–2200. [Google Scholar] [CrossRef] [Green Version]
- Dickson, A.G.; Camões, M.F.; Spitzer, P.; Fisicaro, P.; Stoica, D.; Pawlowicz, R.; Feistel, R. Metrological challenges for measurements of key climatological observables. Part 3: Seawater pH. Metrologia 2015, 53, R26. [Google Scholar] [CrossRef]
- Stoica, D.; Anes, B.; Fisicaro, P.; Camões, M.F. Feasibility of multifunction calibration of H+ responsive glass electrodes in seawater. J. Pure Appl. Chem. 2021. [Google Scholar] [CrossRef]
- Anes, B.; da Silva, R.J.B.; Oliveira, C.; Camões, M.F. Seawater pH measurements with a combination glass electrode and high ionic strength TRIS-TRIS HCl reference buffers—An uncertainty evaluation approach. Talanta 2019, 193, 118–122. [Google Scholar] [CrossRef] [PubMed]
- Naumann, R.; Alexander-Weber, C.; Eberhardt, R.; Giera, J.; Spitzer, P. Traceability of pH measurements by glass electrode cells: Performance characteristic of pH electrodes by multi-point calibration. Anal. Bioanal. Chem. 2002, 374, 778–786. [Google Scholar] [CrossRef] [PubMed]
- Kakiuchi, T. Salt bridge in electroanalytical chemistry: Past, present, and future. J. Solid State Electrochem. 2011, 15, 1661–1671. [Google Scholar] [CrossRef]
- Radtke, V.; Ermantraut, A.; Himmel, D.; Koslowski, T.; Leito, I.; Krossing, I. The Ideal ionic liquid salt bridge for the direct determination of gibbs energies of transfer of single ions, Part I: The concept. Angew. Chem. 2018, 57, 2344–2347. [Google Scholar] [CrossRef] [PubMed]
- Ermantraut, A.; Radtke, V.; Gebel, N.; Himmel, D.; Koslowski, T.; Leito, I.; Krossing, I. The ideal ionic liquid salt bridge for direct determination of gibbs energies of transfer of single ions, Part II: Evaluation of the role of ion solvation and ion mobilities. Angew. Chem. 2018, 57, 2348–2352. [Google Scholar] [CrossRef] [PubMed]
- Suu, A.; Jalukse, L.; Liigand, J.; Kruve, A.; Himmel, D.; Krossing, I.; Roses, M.; Leito, I. Unified pH values of liquid chromatography mobile phases. Anal. Chem. 2015, 87, 2623–2630. [Google Scholar] [CrossRef] [PubMed]
- Carstensen, J.; Duarte, C.M. Drivers of pH variability in coastal ecosystems. Environ. Sci. Technol. 2019, 53, 4020–4029. [Google Scholar] [CrossRef] [PubMed]
- Dickson, A.G. Standard potential of the reaction: AgCl (s)+ 12H2 (g)= Ag (s)+ HCl (aq), and the standard acidity constant of the ion HSO4- in synthetic sea water from 273.15 to 318.15 K. J. Chem. Thermodyn. 1990, 22, 113–127. [Google Scholar] [CrossRef]
- Heering, A.; Stoica, D.; Camões, F.; Anes, B.; Nagy, D.; Nagyné Szilágyi, Z.; Quendera, R.; Ribeiro, L.; Bastkowski, F.; Born, R.; et al. Symmetric potentiometric cells for the measurement of unified pH values. Symmetry 2020, 12, 1150. [Google Scholar] [CrossRef]
- Bastkowski, F.; Heering, A. EMPIR JRP FUN-09 realisation of a unified pH scale—Deliverable 2—Report on interlaboratory comparison to evaluate the performance of measurement procedures. (unpublished work).
- Anes, B.; da Silva, R.J.B.; Martins, H.F.; Oliveira, C.S.; Camoes, M.F. Compatibility of activity coefficients estimated experimentally and by Pitzer equations for the assessment of seawater pH. Accredit. Qual. Assur. 2016, 21, 1–7. [Google Scholar] [CrossRef]
- Camões, M.F.; Anes, B. Traceability of pH to the Mole. Water 2015, 7, 4247–4255. [Google Scholar] [CrossRef] [Green Version]
- Radtke, V.; Stoica, D.; Leito, I.; Camões, F.; Krossing, I.; Anes, B.; Roziková, M.; Deleebeeck, L.; Veltzé, S.; Näykki, T.; et al. A unified pH scale for all solvents Part I Intention and Reasoning. J. Pure Appl. Chem. 2021. [Google Scholar] [CrossRef]
- Lindner, E.; Guzinski, M.; Khan, T.A.; Pendley, B.D. Reference electrodes with ionic liquid salt bridge: When will these innovative novel reference electrodes gain broad acceptance? ACS Sens. 2019, 4, 549–561. [Google Scholar] [CrossRef] [PubMed]
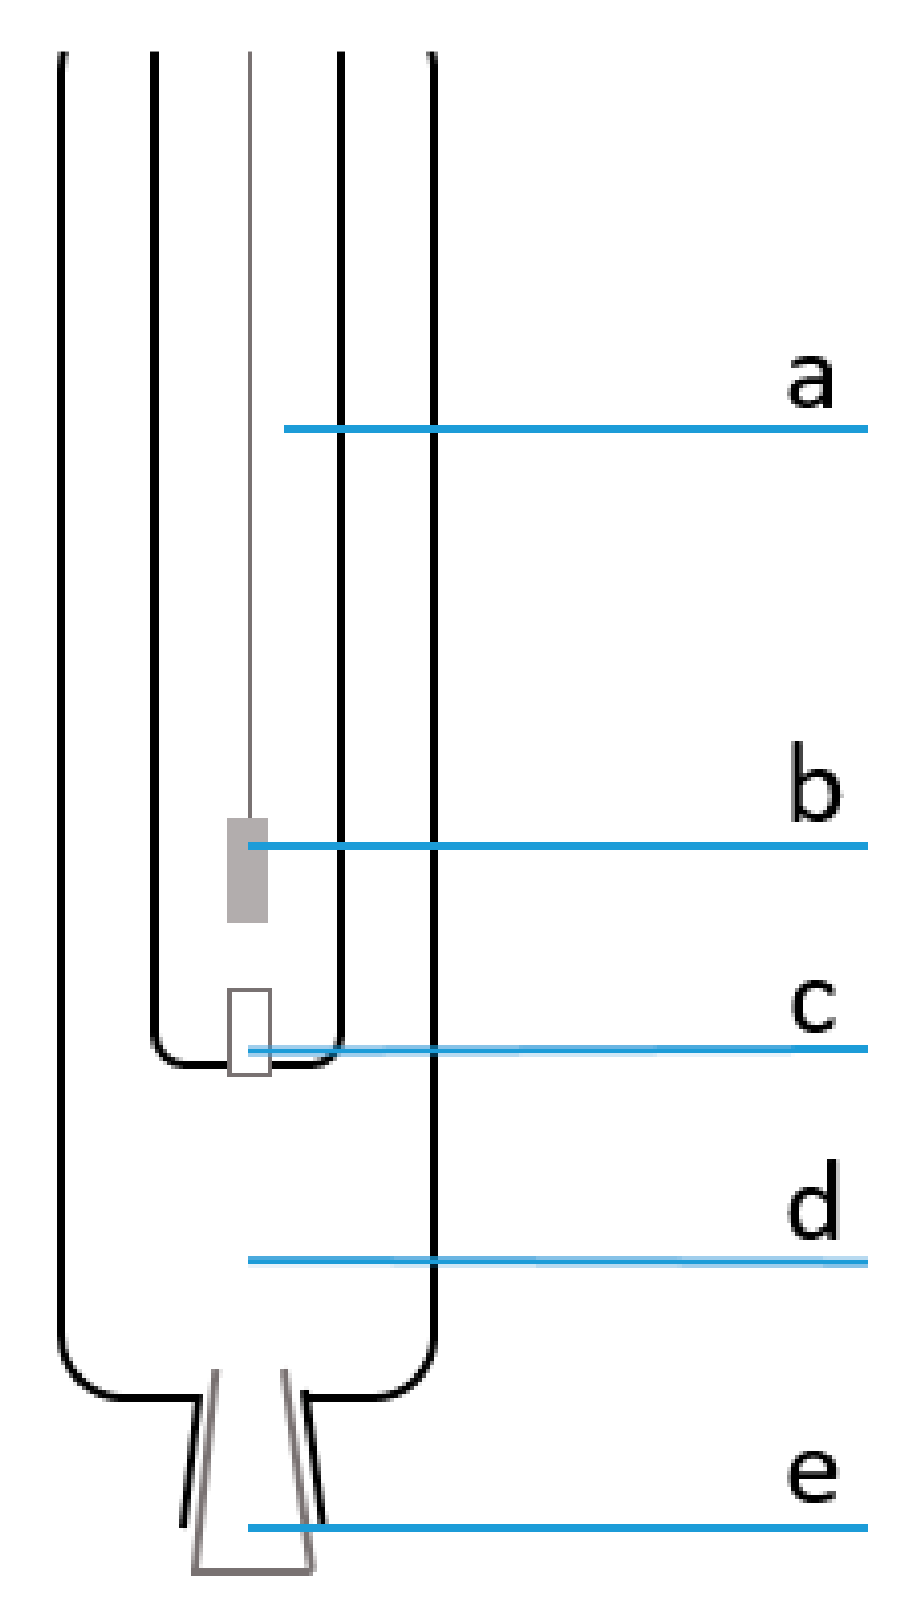
Figure 1.
Schematic view of the double junction Ag/AgCl reference electrode (DJ RE): (a) inner compartment; (b) silver wire coated with silver chloride; (c) diaphragm separating the inner from the outer compartment; (d) outer compartment; (e) ground-joint sleeve junction separating the outer compartment from the test solution.

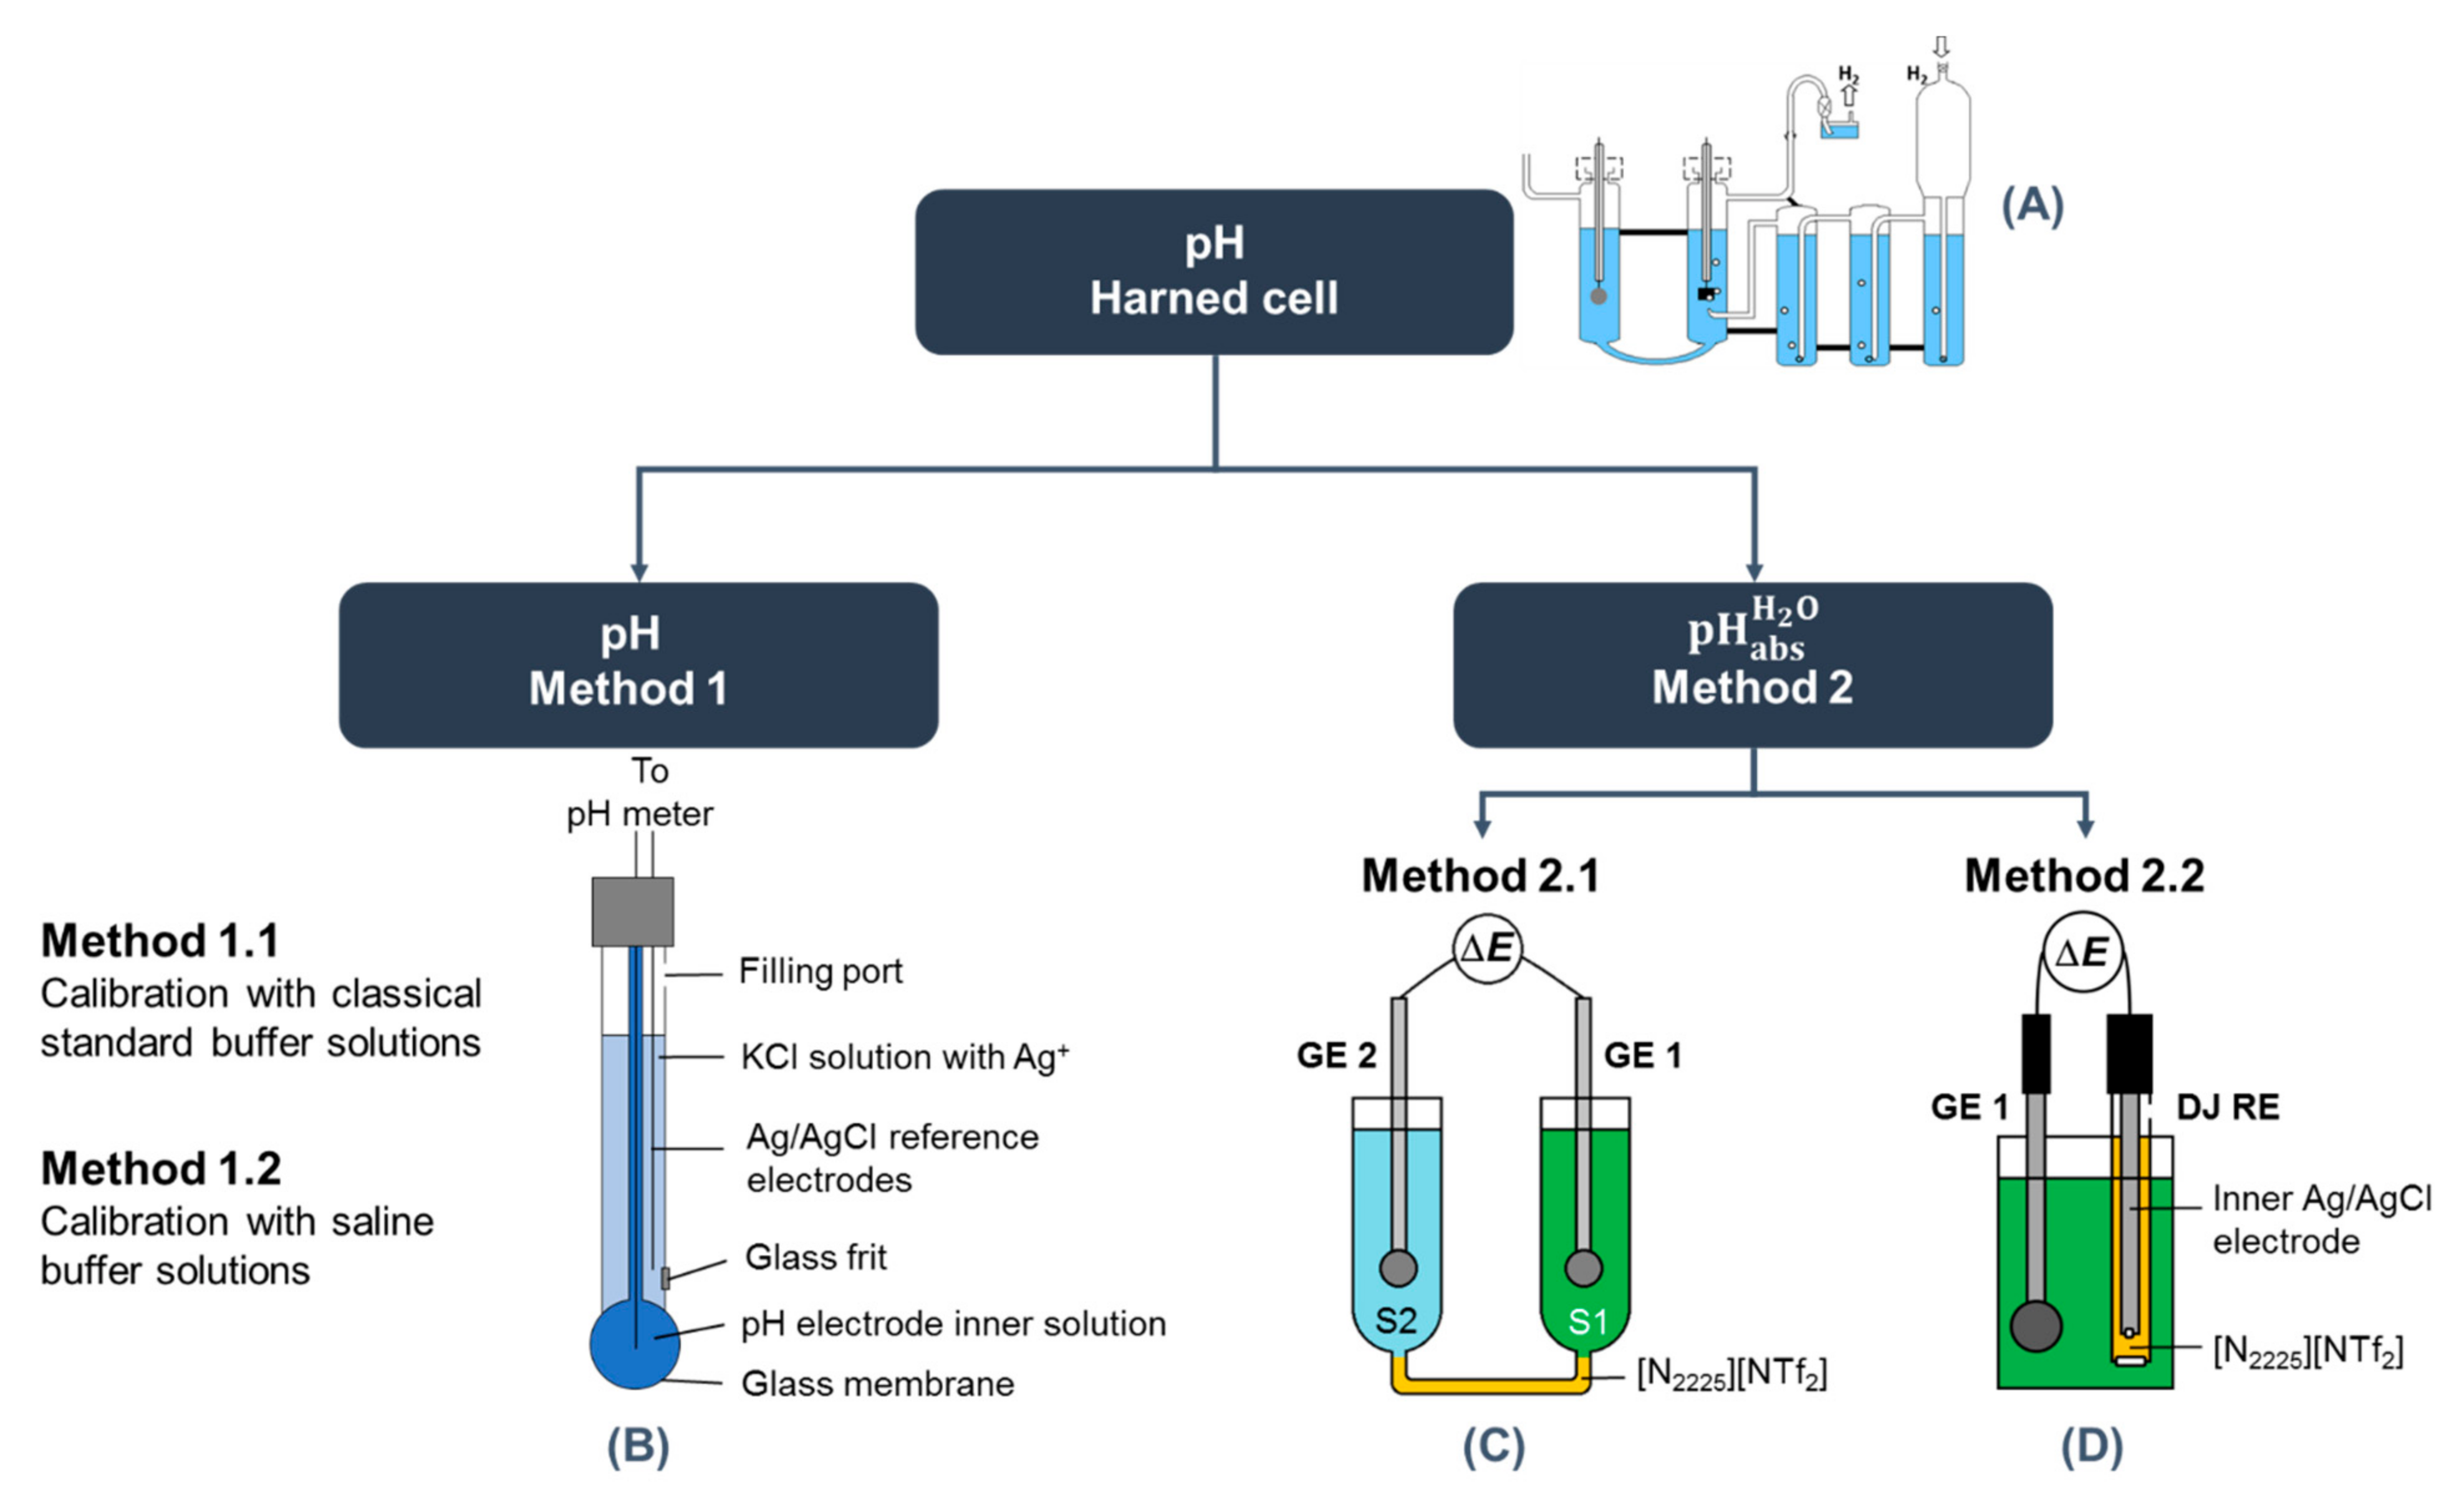
Figure 2.
Schematic overview of conducted measurements with different methods: (A) Harned cell; (B) schematic overview of combination glass electrode; (C,D) differential potentiometric cell used for measurement of reference values. GE represents the glass electrode, S the solution, and DJ RE is the double junction reference electrode.


Table 1.
pH buffer solutions compositions in artificial seawater (I ≈ 0.41 mol kg−1).
| m(Tris·HCl)/mol kg−1 | m(Tris) | m(HCl) | m(NaCl) | |
|---|---|---|---|---|
| /mol kg−1 | ||||
| buffer 1 | 0.03 | 0.079999 | 0.029999 | 0.376533 |
| buffer 2 | 0.04 | 0.080002 | 0.040000 | 0.366522 |
| buffer 3 | 0.05 | 0.079992 | 0.050001 | 0.356519 |
Table 2.
Detailed summary of measurements configurations implemented by UT and LNE.
| Method 2.1 | Method 2.2 | |
|---|---|---|
| Scheme | SCGE2 | S2 | [N2225][NTf2] | S1 | SCGE1 R3 | UT: SCGE | Solution | [N2225][NTf2] | sat. KCl (aq) | AgCl | Ag LNE: SCGE | Solution | [N2225][NTf2] | 3 M KCl (aq) | AgCl | Ag R4 |
| Cell | UT: Special water-jacketed glass cell from Gebr. Rettberg (Göttingen, Germany) LNE: Special thermostating water jacket from Hubert Košt’ál, Czech | UT: The same cell was used as in method 2.1, but the whole cell was filled only with single solution LNE: Analyzed solutions and electrodes were placed in a PP tube, and the whole was immersed in a flow-through glass cell to enable temperature control |
| SCGE calibration | Aqueous standard buffers with nominal pH 4, 7, and 10. UT: Buffer solutions purchased from FlukaTM, Honeywell, Charlotte, NC, USA LNE: Buffer solutions purchased from Hach Lange (Radiometer) | |
| UT: Measurements against a Radiometer K401 (Copenhagen, Denmark) saturated calomel reference electrode LNE: Measurements against a Radiometer XR300 (Hach) saturated Ag/AgCl reference electrode | UT: Measurements against a double junction Methrom Ag/AgCl reference electrode 6.0729.100 LNE: Measurements against a double junction Methrom Ag/AgCl reference electrode 6.0729.100 | |
| Instrument for potential measurement | UT: Metrohm 713 pH meter. The cell and electrodes were all placed inside a Faraday cage (VistaShield™, Gamry Instruments, Warminster, PA, USA) LNE: Bio-Logic SP200 potentiostat equipped with a low current module. Analog filtering at 5 Hz was carried out to limit the electromagnetic noise and obtain a smooth signal. The cell and electrodes were all placed inside a Faraday cage (Bio-Logic) | |
| Data collection | UT: Collection over 1 h with a sampling interval of 5 s. Data collection started after the electrodes were inserted. LNE: Collection over at least 30 min with a sampling interval of 10 s. Data collection started after the electrodes were inserted | UT: Collection over 900 s with a sampling interval of 5 s. Data collection started after the electrodes were inserted. LNE: Collection over at least 30 min with a sampling interval of 10 s. Data collection started after the electrodes were inserted |
| Data analysis | UT: Average of data collected between 30 and 60 min (361 points) LNE: The most stable data over consecutively 15 min (91 points) | UT: Average of data collected between 300 and 360 s (13 points) LNE: The most stable data over consecutively 15 min (91 points) |
Table 3.
Activity coefficients of chloride ions for each tested NaCl solution based on which were calculated the activities of chloride ions.
Table 3.
Activity coefficients of chloride ions for each tested NaCl solution based on which were calculated the activities of chloride ions.
| Molality of NaCl Solution/mol kg−1 | |||
|---|---|---|---|
| 0.005 | 0.9276 | 0.0046 | −2.333 |
| 0.010 | 0.9028 | 0.0090 | −2.044 |
| 0.100 | 0.7771 | 0.0777 | −1.109 |
| 0.407 | 0.6909 | 0.2809 | −0.551 |
| 0.670 | 0.6680 | 0.4475 | −0.349 |
| 0.800 | 0.6622 | 0.5298 | −0.276 |
Table 4.
Primary pH values assigned to the buffer solutions by the Harned method, pH and values obtained for the Tris-Tris·HCl buffer solutions with different configurations of methods 1 and 2. pHprimary and values are associated with standard (k = 1) uncertainties, pH values with intermediate precision standard deviation.
| Sample | pH | ||||||
|---|---|---|---|---|---|---|---|
| pHprimary | Method 1.1 | Method 1.2 | Method 2.1 | Method 2.2 | |||
| UT | LNE | UT | LNE | ||||
| buffer 1 | 8.494 ± 0.003 | 8.40 ± 0.01 | / | 8.40 ± 0.13 | 8.40 ± 0.12 | 8.39 ± 0.13 | 8.41 ± 0.12 |
| buffer 2 | 8.270 ± 0.003 | 8.18 ± 0.01 | 8.28 ± 0.01 | 8.21 ± 0.13 | 8.20 ± 0.12 | 8.17 ± 0.13 | 8.11 ± 0.12 |
| buffer 3 | 8.048 ± 0.003 | 7.96 ± 0.01 | / | 7.98 ± 0.13 | 7.98 ± 0.12 | 7.95 ± 0.13 | 7.98 ± 0.12 |
Table 5.
Evaluation of RLJP based on measurements with NaCl solutions and DJ RE with salt bridge formed by IL and KCl. represents the sum of the two LJPs occurring at each end of the salt bridge.
Table 5.
Evaluation of RLJP based on measurements with NaCl solutions and DJ RE with salt bridge formed by IL and KCl. represents the sum of the two LJPs occurring at each end of the salt bridge.
| Molality of NaCl Solution/mol kg−1 | ILSB | KClSB | ||||||
|---|---|---|---|---|---|---|---|---|
| ΔEmeas/mV | RLJP/mV | Effect on pH | ΔEmeas/mV | ϕ/mV | RLJP/mV | Effect on pH | ||
| 0.005 | −204.921 | −49.184 | 1.553 | 0.026 | 0.595 | 0.0101 | 3.0439 | 0.051 |
| 0.010 | −188.392 | −49.767 | 0.970 | 0.016 | −0.232 | −0.0039 | 2.2166 | 0.037 |
| 0.100 | −134.051 | −50.737 | 0 | 0 | −2.449 | −0.0414 | 0 | 0 |
| 0.407 | −106.439 | −56.134 | −5.397 | −0.091 | −4.595 | −0.0777 | −2.1455 | −0.036 |
| 0.670 | −94.462 | −56.129 | −5.392 | −0.091 | −5.204 | −0.0880 | −2.7553 | −0.046 |
| 0.800 | −91.170 | −57.169 | −6.432 | −0.109 | −6.112 | −0.1033 | −3.6632 | −0.062 |
| 0.005 (back) | −205.86 | 50.125 | 0.611 | 0.010 | 0.4036 | 0.0068 | 2.8526 | 0.048 |
Publisher’s Note: MDPI stays neutral with regard to jurisdictional claims in published maps and institutional affiliations. |
© 2021 by the authors. Licensee MDPI, Basel, Switzerland. This article is an open access article distributed under the terms and conditions of the Creative Commons Attribution (CC BY) license (https://creativecommons.org/licenses/by/4.0/).
Share and Cite
MDPI and ACS Style
Lainela, S.; Leito, I.; Heering, A.; Capitaine, G.; Anes, B.; Camões, F.; Stoica, D. Toward Unified pH of Saline Solutions. Water 2021, 13, 2522. https://doi.org/10.3390/w13182522
AMA Style
Lainela S, Leito I, Heering A, Capitaine G, Anes B, Camões F, Stoica D. Toward Unified pH of Saline Solutions. Water. 2021; 13(18):2522. https://doi.org/10.3390/w13182522
Chicago/Turabian StyleLainela, Silvie, Ivo Leito, Agnes Heering, Gaëlle Capitaine, Bárbara Anes, Filomena Camões, and Daniela Stoica. 2021. "Toward Unified pH of Saline Solutions" Water 13, no. 18: 2522. https://doi.org/10.3390/w13182522
Note that from the first issue of 2016, this journal uses article numbers instead of page numbers. See further details here.