Article

Characterization of Regional Groundwater System Based on Aquifer Response to Recharge–Discharge Phenomenon and Hierarchical Clustering Analysis

1
Department of Civil Engineering, National Central University, Chung-Li 32001, Taiwan
2
Department of Agricultural Engineering, PMAS-Arid Agriculture University Rawalpindi, Rawalpindi 46000, Pakistan
*
Author to whom correspondence should be addressed.
Water 2021, 13(18), 2535; https://doi.org/10.3390/w13182535
Submission received: 18 August 2021 / Revised: 6 September 2021 / Accepted: 13 September 2021 / Published: 15 September 2021
(This article belongs to the Special Issue Methods and Tools for Assessment of Groundwater)

Abstract

:
The investigations of groundwater hydrograph reasonably reflect the aquifer response to recharge–discharge phenomenon and its characteristics. A better understanding of aquifer characteristics such as regional aquifer classification, recharge and discharge patterns, aquifer geology and flow patterns are the surface indicators that may be more effective and less costly for interpreting basic regional hydrogeological conditions and assessments. This study deals with the application of Hierarchical Clustering Analysis to understand the groundwater spatio-temporal patterns and to visualize/classify the nature of the aquifer in the regional area of Kaohsiung City, Taiwan. Groundwater level fluctuation patterns and slopes of rising and recession limbs are used to identify the pumping effects and classify aquifers. The results of clustering analysis show that the groundwater observation wells in the study area can be divided into five major characteristics along with the upstream to downstream of Kaoping River. The clusters are consistent with basic lithology distribution and age of sedimentary, which represents the characteristics of groundwater level fluctuation. The identified groundwater hydrographs patterns provide newer insights related to aquifer response to recharge–discharge phenomenon, types of aquifers and their behaviors. The knowledge of water level fluctuations in the observation wells provides a piece of prior information about the abstraction of groundwater. The proposed aquifer classification and pumping effect have great potential for applied use in groundwater management e.g., save drilling cost.

1. Introduction

The complex behavior of aquifers is under constant evolution with knowledge of physical parameters such as permeability, porosity, storativity, recharge, flow, confining/un-confining status, etc., that define the aquifer spatial-temporal characteristics. In turn, these characteristics are responsible for the aquifer response to the recharge–discharge phenomenon. This phenomenal response can be interpreted by observed groundwater hydrograph and its fluctuation. Many research studies have been conducted for the investigation of groundwater level fluctuations using long-term groundwater level hydrograph in the world, for example, Shahid and Hazarika in Bangladesh [1]; Raj and Mukherjee et al. in India [2,3]; Li et al. and Wang and Zhao in China [4,5]; Ebrahimi et al. and Shahmohammadi-Kalalagh et al. in Iran [6,7]; Almedeij and Al-Ruwaih in Kuwait [8]; Theodossiou and Latinopoulos in Greece [9]; Bacani et al. in Croatia [10]; Lemieux et al. in Canada [11]; and Luczaj and Masarik in the United States [12]. Analysis of such continuous groundwater level hydrographs reasonably reflects the aquifer natural classification (unconfined, semi-confined or confined) and the recharge and discharge behavior. Groundwater level fluctuations are the principal source of information about the hydrological stresses acting on aquifer [13]. The groundwater hydrographs are recurring with seasonal vibrational characteristics [14] and can be used for the estimation of aquifer recharge and its parameters [2]. The slope of the recession limb of groundwater level hydrograph represents discharge of aquifer [7] to hydraulically connected streams that is predominantly related to the aquifer geometry and the diffusivity. Thus, the analysis of recession curve provides prior knowledge of the diffusivity that can be used to estimate transmissivity or hydraulic conductivity. Similarly, the slope of the rising limb indicates recharge and can be used to estimate the specific yield of the aquifer.
The particular patterns of observed groundwater level data are also affected by groundwater recharge and pumping at a specific site. The knowledge of a true hydrograph for water level fluctuations at a scale provides a piece of prior information about the abstraction of groundwater. This kind of information can be used for the management of groundwater available resources. In this study, aquifers classification has been made based on the response to recharge–discharge phenomenon in the form of groundwater hydrographs and Hierarchical Clustering Analysis (HCA) method. HCA is an unsupervised pattern recognition method, most widely used in earth sciences for cluster formation sequentially [15,16,17]. Literature studies covered the application of HCA for hydro-geochemical characteristics and groundwater quality evaluation/classification based on sampled data. For example, Chai et al. and Liu et al. suggested that HCA is a powerful tool for evaluating groundwater pollution and identifying groundwater hydro-geochemical characteristics in China [18,19]. Similarly, HCA has been used for groundwater classification in Southern Ghana [20]; water quality assessment in East Algeria [21]; hydro-geochemical analysis of groundwater in Iran [22] to name a few. Most researches only focused on cluster analysis of groundwater pollutants and no relevant HCA research is used in the analysis of groundwater level fluctuation.
In this study, we tried to (i) identify the regular spatial-temporal patterns of aquifer response if any (ii) interpret the characteristics behaviors responsible for such regular patterns of aquifer response (iii) classification of aquifers based on aquifer response similarities (iv) identify the pumping effects via groundwater level fluctuations and with the slope of rising and recession limbs.

2. Materials and Methods

Keeping the study objectives in view, the proposed methodology consists of two parts. The first part deals with clustering analysis for grouping/classification of groundwater observation wells based on similarities in groundwater fluctuation. The second part describes aquifers classification based on the response to recharge–discharge phenomenon. In this way, we tried to evaluate the characteristics of the regional groundwater system and the forces involved.

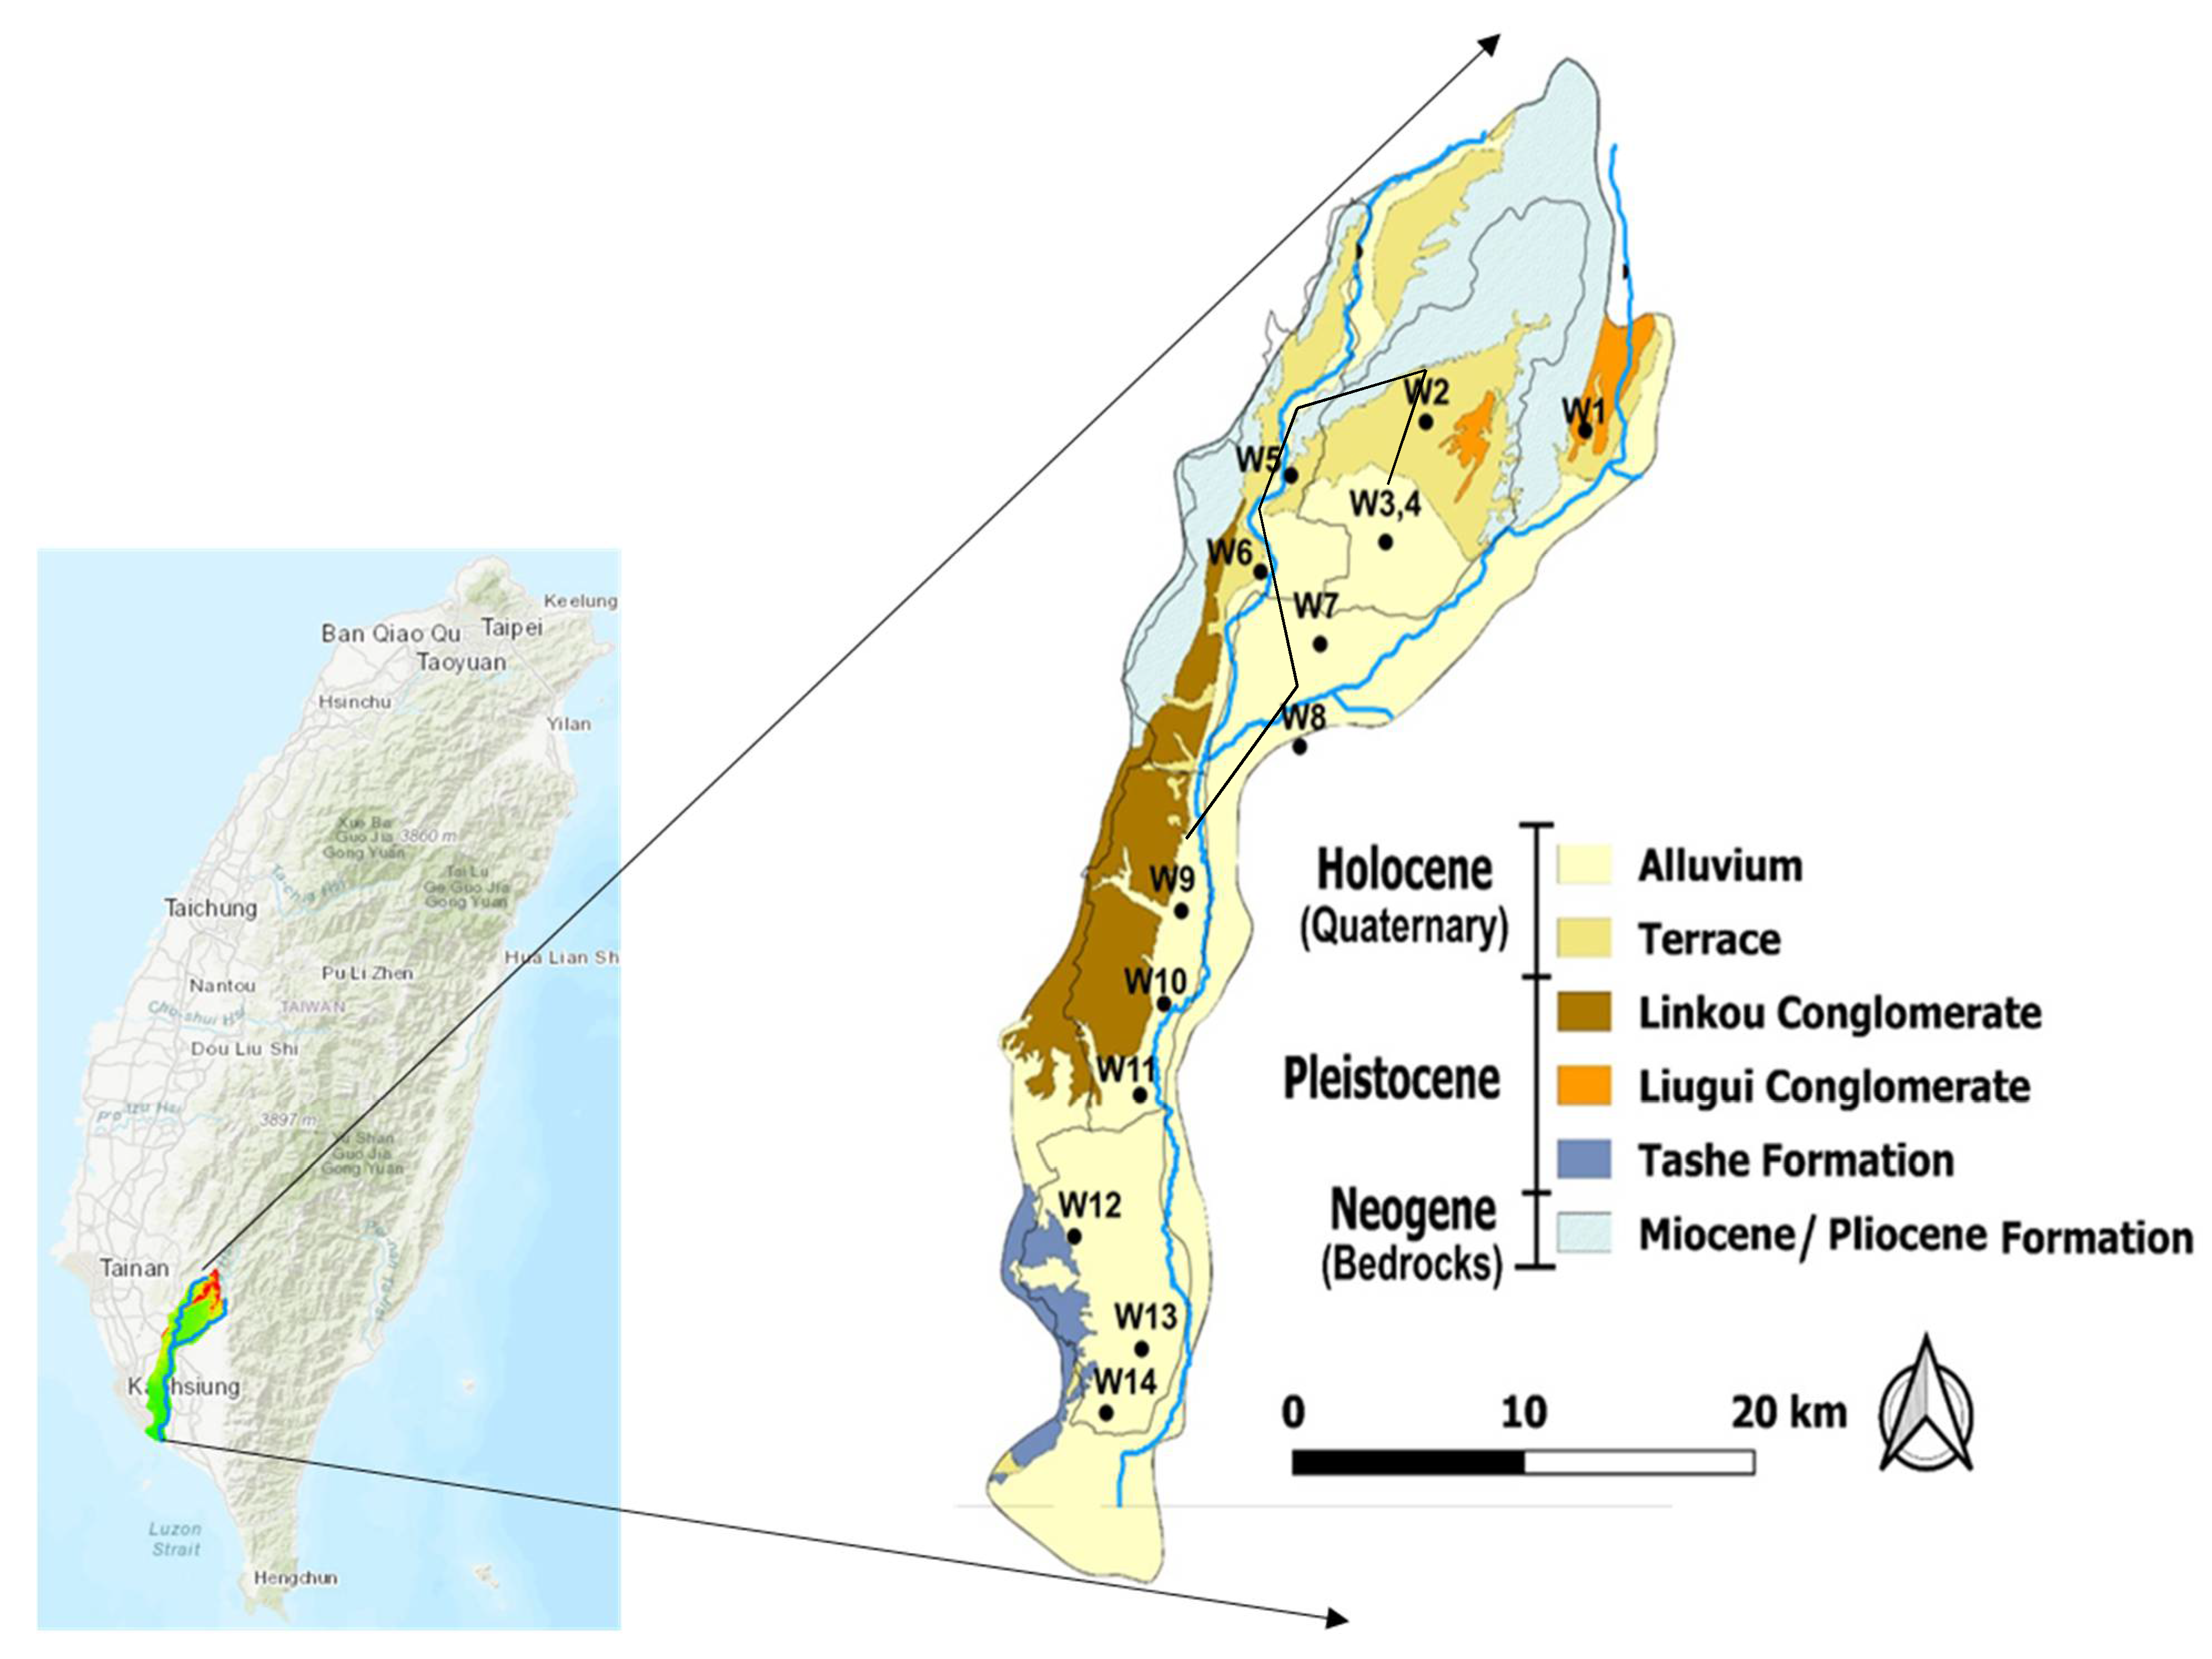
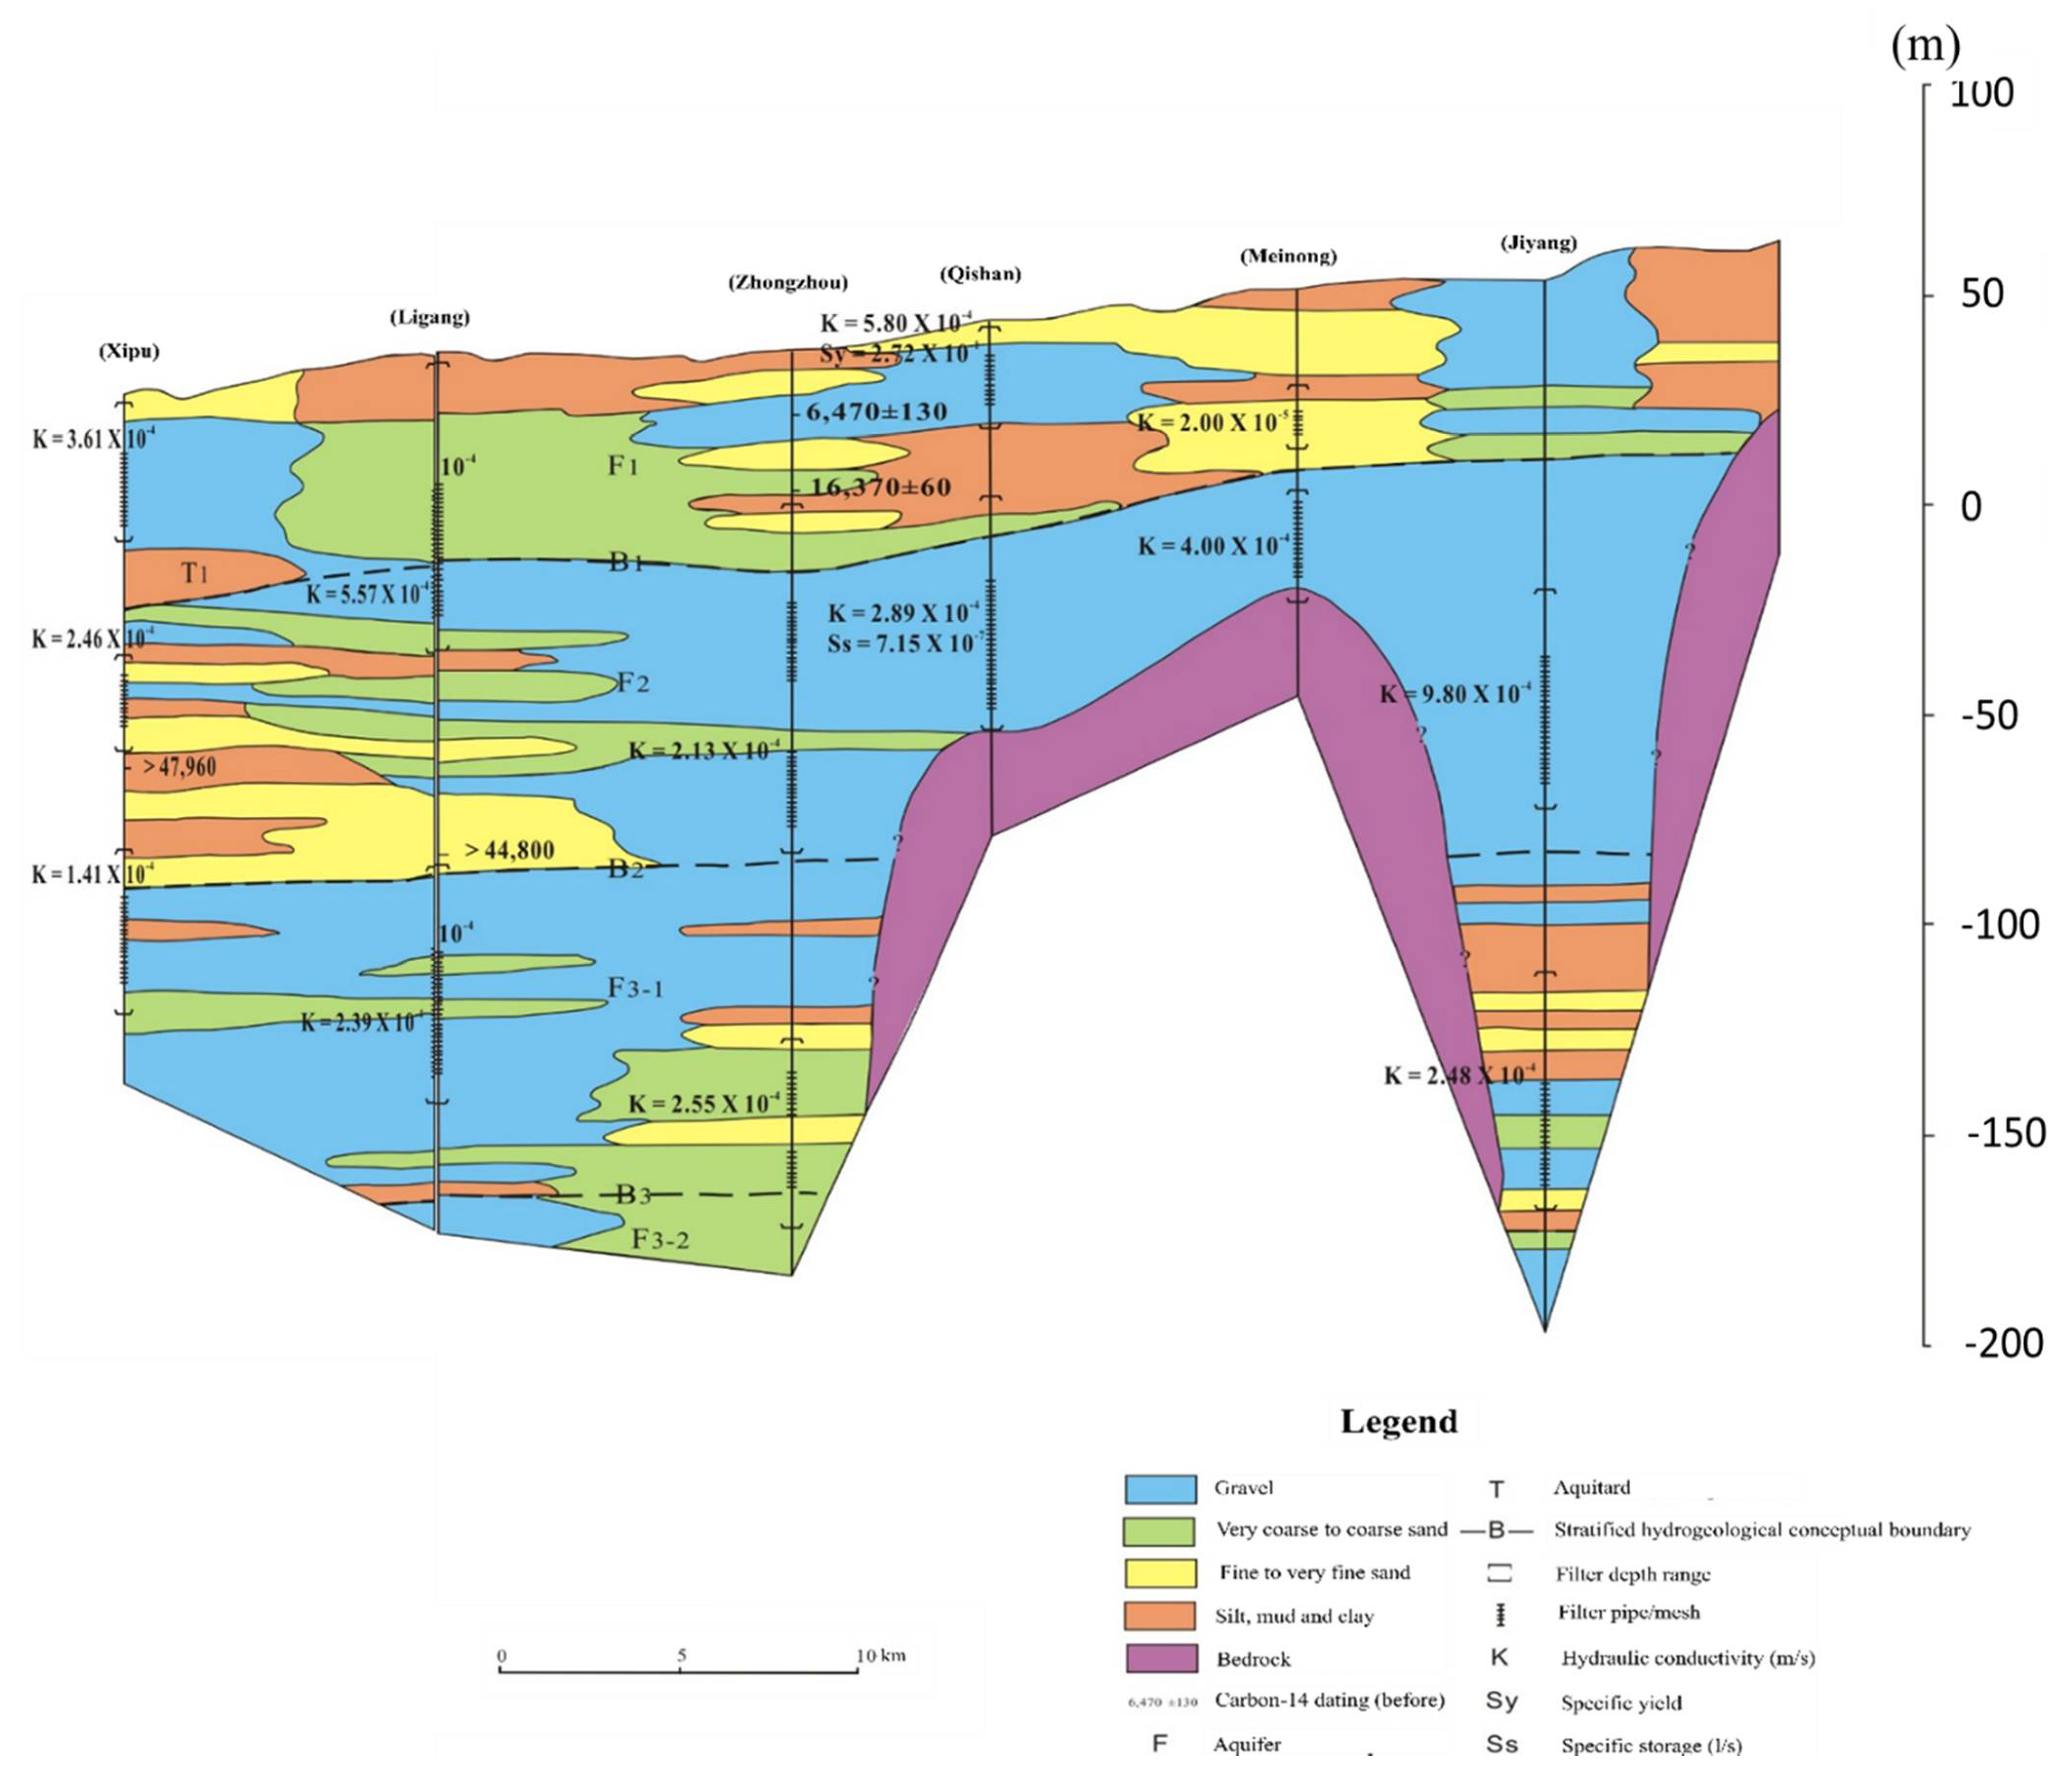
2.1. Study Area Description

This study was conducted in a regional area of Kaohsiung city, consists of four districts, namely Meinong, Qishan, Dashu and Daliao [23]. The outcropped formation is shown in Figure 1. Generally, the formation is comprised of sedimentary rocks, and their ages vary from the Holocene and Pleistocene (Quaternary) to the Pliocene and Miocene (Neogene). The Holocene alluvium and the terrace deposits consist of gravel, sand, and mud. The Pleistocene formations include the Linkou and Liugui conglomerates and the Tashe formation. The Linkou conglomerate consists mainly of clastic support, while the Liugui conglomerate consists of matrix support. Tashe formation consists of thick mudstones with interbedded sandstone and conglomerates. The Pleistocene formations are weakly cemented and are usually not heavily jointed. The hydraulic conductivity is slightly lower than that of the Holocene sediments but generally higher than that of the Neogene (Miocene to Pliocene) bedrocks [24]. These geological features provide useful hints related to groundwater flow and contribution. There are 14 observation wells inside the study area as shown in Figure 1 [25].
The attributes of these observation wells are listed in Table 1. Meinong district geology formation is Holocene (Alluvium and Terrace) and Pleistocene (Liugui conglomerate) where observation wells (W1–4 and W7–8) are located. Qishan district has two observation wells (W5 and W6) in Terrace formation. Dashu District has three observation wells (W8–11) in the alluvium formation near Pleistocene (Linkou conglomerate). Daliao district also has three wells (W12–14) inside the alluvium formation near Pleistocene (Tashe) formation.
The geological investigation indicated that all of the aquifers are connected. An unconfined and three confined aquifers, namely, F1 (layer 1), F2, F3–1 and F3–2 (layer 4), were identified from shallow to 200 m depth as shown in Figure 2.

2.2. Explanatory Data Analysis (EDA)

The groundwater level data from observation wells have been collected from the Water Resources Agency (WRA), Seventh River Management Office, Taiwan. In the study area, there is a total of 14 observation wells (Figure 1) used for analysis. According to WRA, the aquifer depth is divided into two different layers. Layer-1 is considered a shallow aquifer and depth range 27 to 70 m while layer-2 aquifer is deep and depth up to 200 m. The observation well information, daily and hourly groundwater level data from 2001 to 2019 were collected and analyzed. An automatic water level recorder records the continuous groundwater level data. The data so obtained for each observation well were retrieved and arranged in MS Excel 2016. Then the groundwater level hydrographs of each observation well were generated in MATLAB 2017b for an acquired period. Fourteen representative true groundwater hydrographs having more than one annual cycle in a uniform format were compared and analyzed. The slope of rising and recession limbs was obtained by fitting a straight-line equation on the hydrograph curve for each year. The regional area spatially distributed over about 594.07 km2 has alluvium to bedrock formations and was classified into different aquifer nature (confined or unconfined) based on the comparison of apparent line thickness of true hydrographs while the crest and trough shape of similarities curves represents aquifers response to recharge–discharge phenomena.

2.3. Hierarchical Clustering Analysis (HCA)

Cluster analysis is a technique that simplifies and classifies statistical data. It has been widely used in many fields, including machine learning, data mining, pattern recognition, image analysis, etc. It is a method that organizes the data according to the hierarchical structures based on the proximity or similarity matrix [26]. Generally, there are two types of hierarchical clustering (agglomerative and divisive method) based on how the hierarchical decomposition is performed. In this study, the agglomerative method is used. At present, almost no relevant research is used in the analysis of groundwater level fluctuation, and most of them are used in the cluster analysis of groundwater pollutants [27].
Clustering is the static classification of similar objects, and the closer data are classified together by calculating the “distance”. It can be divided into hierarchical and non-hierarchical approaches. Hierarchical clustering analysis first treats each piece of data as a group and uses different distance algorithms to sort the data that are close to each other. The common distance algorithms are the following three types: (1) Euclidean distance; (2) Manhattan distance; (3) Canberra distance.
However, to understand the spatial and temporal characteristics of groundwater changes, the proximity matrix cannot be determined based on the “distance” in space, but the pattern similarity of the groundwater level changes of each monitoring station. Therefore, this study adopted an innovative distance definition method. We used the “Pearson’s Correlation Coefficient” between the observing stations as the input of the distance matrix, which means the correlation coefficient matrix is used as the index of spatial-temporal hierarchical clustering. The stations with the higher correlation of the temporal fluctuation pattern clustered into the same category first, and finally the classification was completed through agglomerative hierarchical clustering. Equation (1) defines Pearson’s Correlation Coefficient r for any x and y stations with i observation datasets:
r = ( x i x ¯ ) × ( y i y ¯ ) ( x i x ¯ ) 2 × ( y i y ¯ ) 2 ,
Now, the basis of the “distance” characteristic of cluster analysis is a correlation. First, we classify any two stations with the closest “distance” into the same group, and then repeat the grouping of any three stations, any four stations, etc., until all the stations are divided into the same group. There are five types of agglomerative techniques, including complete linkage, single linkage, average linkage, centroid linkage, and Ward’s linkage method, which are commonly used. In this paper, Ward’s linkage method has been applied. This clustering analysis is performed by the SciPy library in the Python programming language platform.

3. Results

The study area has defined the rainy monsoon season from June to September and almost 90% of rainfall occurs during this period. Based on this rainfall distribution, the area has a dry and wet season. The seasonal change is reflected in the patterns of groundwater hydrographs via the one rising and two recession limbs annually as shown in Figure 3 for demonstration. Noting, there is a corresponding rise in groundwater level with the daily rainfall hyetograph in the rainy season from June to September. The continuous rainfall recharge was observed with the proceeding of rainfall spells from the starting date 19 May 2019. The groundwater level started rising from 34.42 m and reached to a maximum of 39.49 m on 21 August 2019. There was a total of 2490 mm annual rainfall in 2019, approximately a 5.1 m rise in groundwater level at Qishan (W5) location.
Thus, the recharging and discharging phenomena of the aquifer can be represented with the rising and recession limbs of the true groundwater hydrograph. The crest/peak shape of the rising limb is due to the seasonal groundwater level fluctuation response to the aquifer recharge phenomenon. The shape of recession limb (i.e., trough) response to the aquifer discharge phenomenon. The annual pattern and shape of groundwater hydrograph for a particular observation well remains nearly identical in subsequent years for a long period of time despite the changes in its magnitude due to annual variation in discharge or recharge from or to the aquifer. The magnitudinal variation may be segmental or in the whole response curve based on recharging capacity, but the overall shape of the annual recharge–discharge hydrograph remains the same due to the characteristic aquifer response of each observation well site (Figure 4). These findings suggested that the aquifer response (which depends on aquifer properties such as the hydrogeological conditions) is the predominant key controlling the overall shape of the recharge–discharge phenomena of the true hydrograph.
For a better understanding of the recharge and discharge status of shallow and deep aquifers, we adopted the technique of linear fittings in the rising and recession part of the groundwater level hydrograph for each year at each site. The slope of the rising limb indicates recharge while the slope of the recession limb representing discharge of aquifer. After getting the slopes of both parts for each well for a long period from 2001 to 2019, the increasing and decreasing patterns were analyzed as shown in Figure 5. The blue and grey color bars with the same linear trend line colors represent recharge status in aquifer-1 and aquifer-2, respectively, while orange and gold color bars with the lines of the same color represent discharge status in aquifer-1 and aquifer-2, respectively. In Meinong station (W2), both ascending and descending bars in both aquifers indicate increasing trends, which represent an increase in recharge and discharge rates in the aquifers over time. The increase in recharge rate may be due to alluvial soil and aquifer geology that enhanced soil permeability while the increase in discharge rate directly relates to more usage of groundwater via pumping. The ratio of discharge slope to recharge slope is 1.33 in aquifer-1 while it is 2.5 times in aquifer-2, indicating the discharge rate is higher than the recharge rate and more importantly, there is more discharge from aquifer-2. This condition inevitably calls for the essential requirement to manage aquifer operations in the future. Similar to Meinong station, Jiyang (W3) and Jiyang Gongzhou (W4) stations showed the same kind of patterns in aquifer-1. In Qishan (W5), Zhongzhou (W6), Tuku (W7) and Ligang (W8) stations, the trend of recharge slope is in decreasing form while the discharge slope is in an increasing trend. Both kinds of trends are not prominent, indicating some kind of balance between recharge and discharge rate in these four stations. However, the decrease in recharge rate might be cautious to properly manage aquifers. Xipu (W9), Dashu (W10) and Jiuqu (W11) sites indicating different patterns of recharge and discharge rate in both aquifers. At all sites, there is a decreasing trend of recharge rate in both aquifers. The discharge trend is in increasing form in aquifer-1 and decreasing in aquifer-2 at Xipu site while at Dashu site; it is increasing in aquifer-2 and decreasing in aquifer-1. At Yongfung (W12) and Chaoliao (W13) sites, the recharge and discharge rates are decreasing in both aquifers while at the Zhaoming (W14) site, the recharge is increasing in aquifer-1 and decreasing in aquifer-2 as the discharge is decreasing in both aquifers. Understanding the reason for such changes highlights the consideration of all factors affecting recharge and discharge, including hydrology, hydrogeology, water resource consumption, etc., in the study area during the study period.

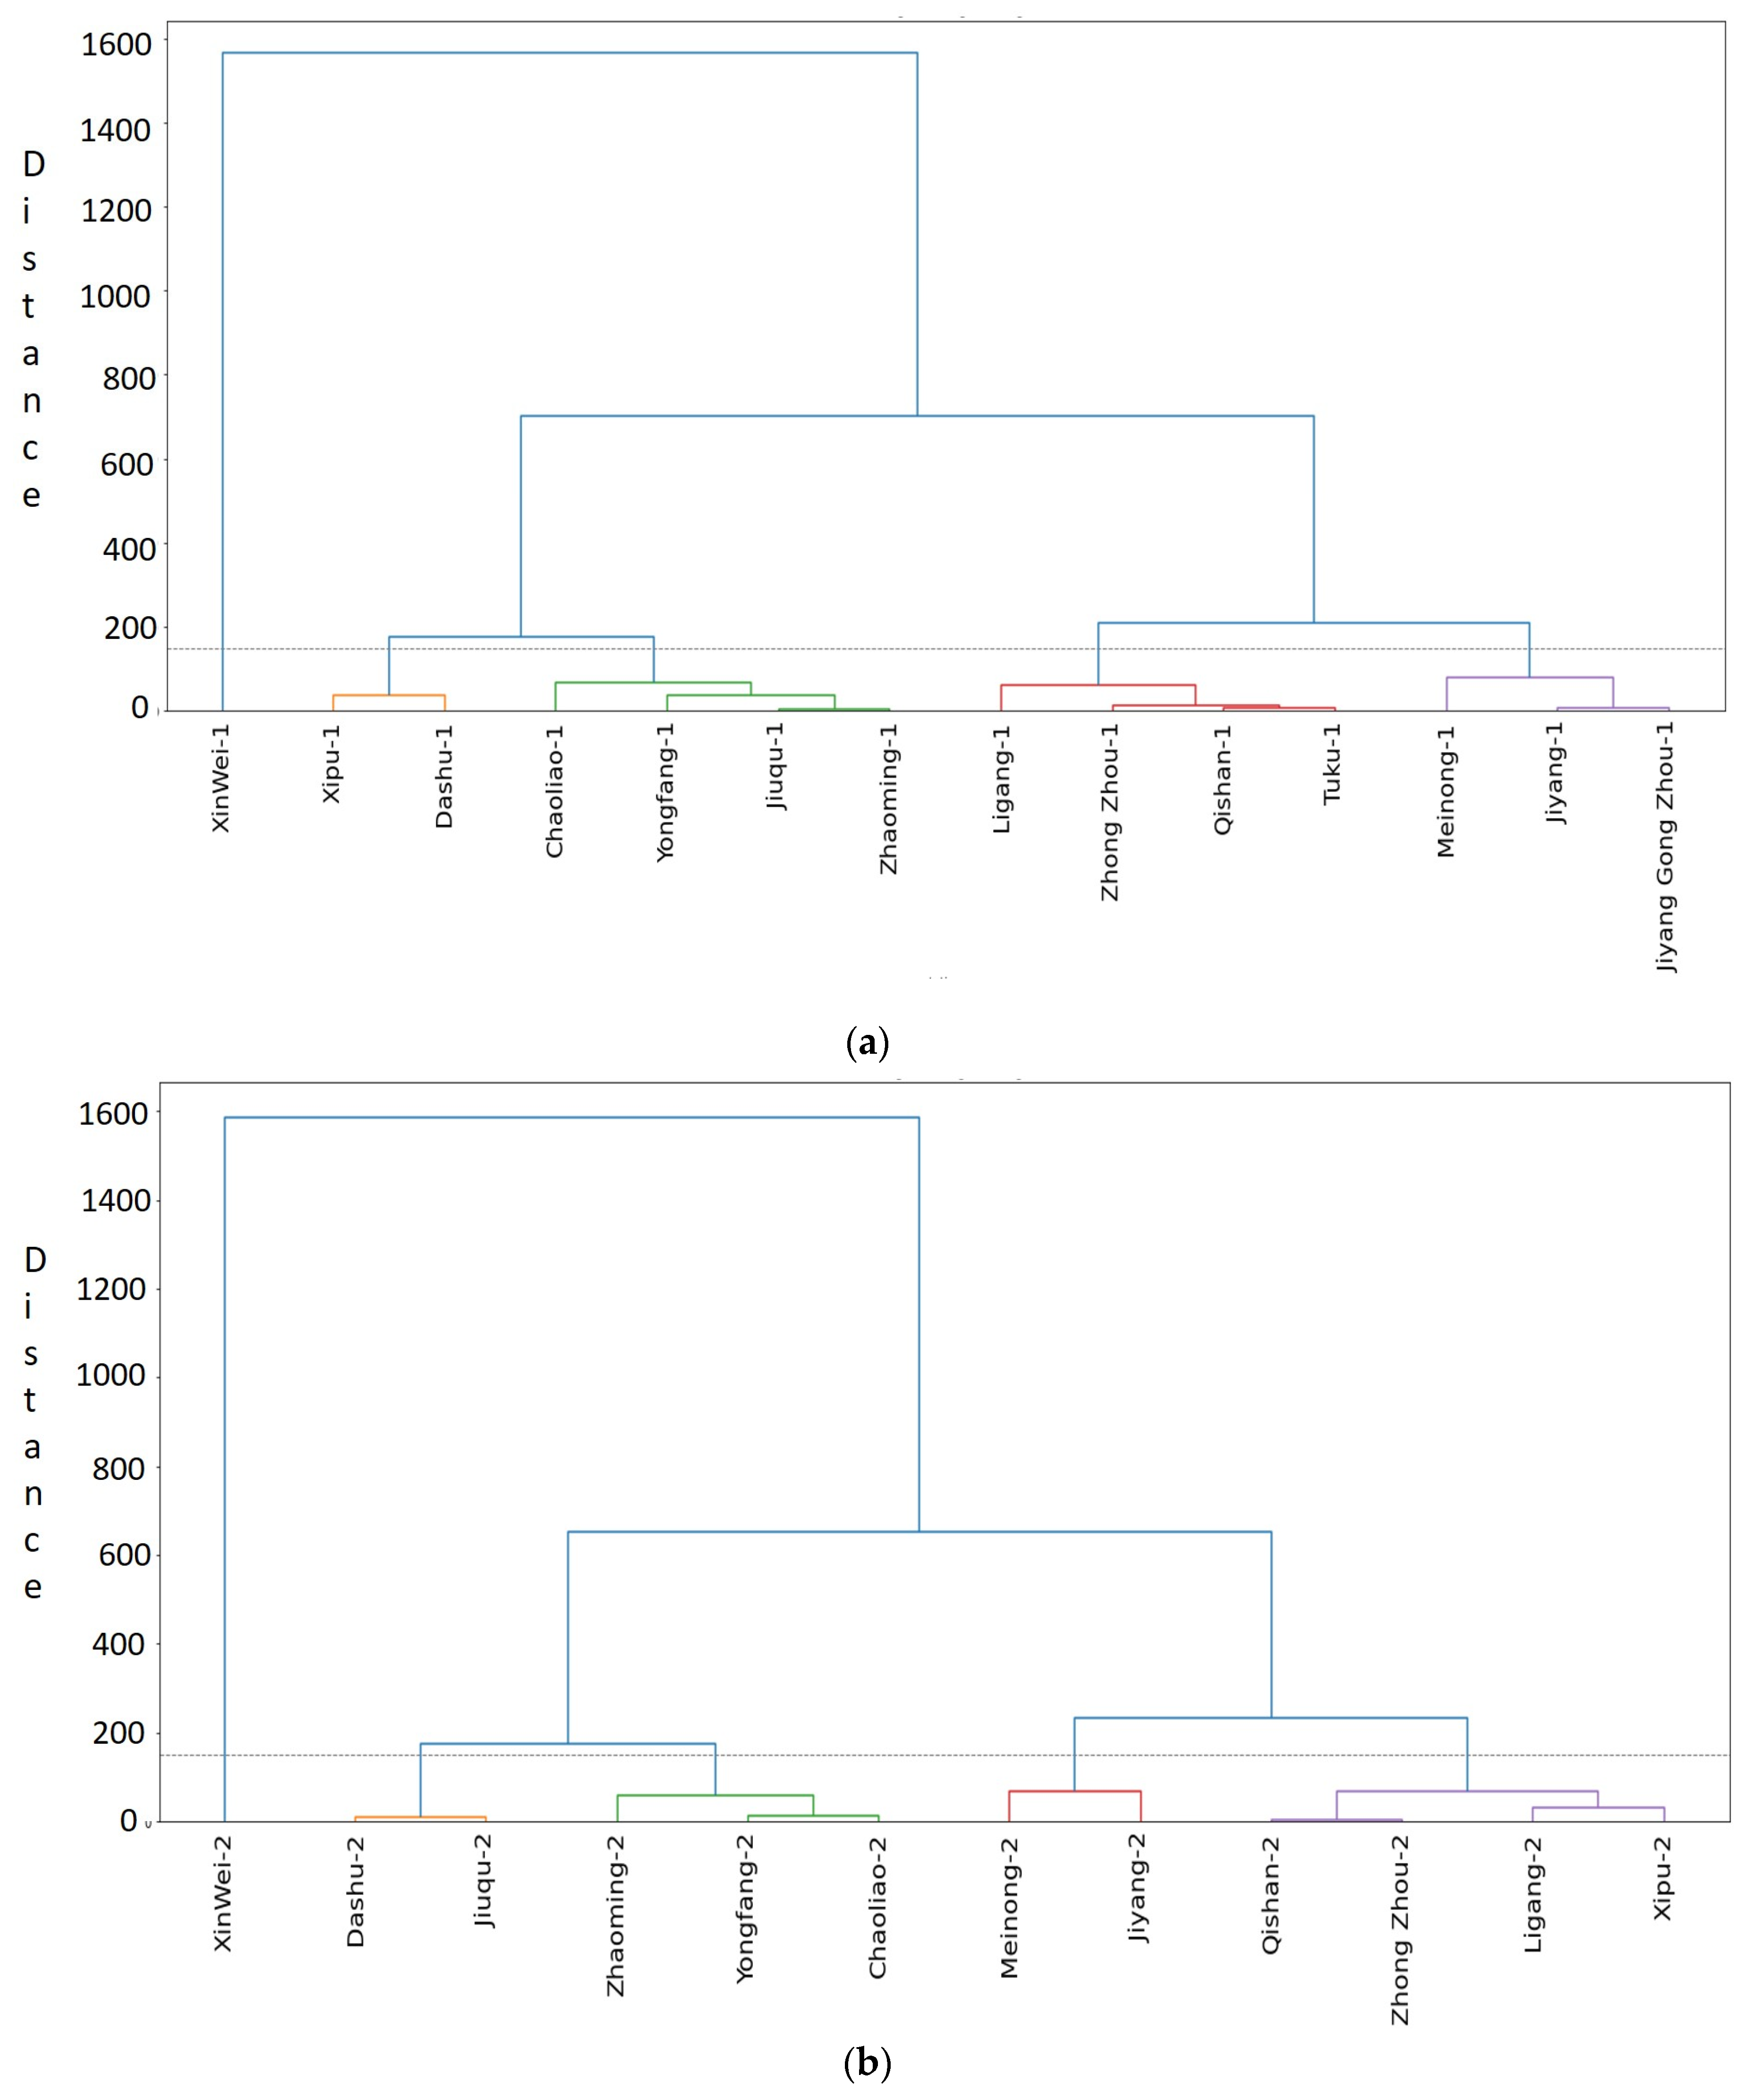
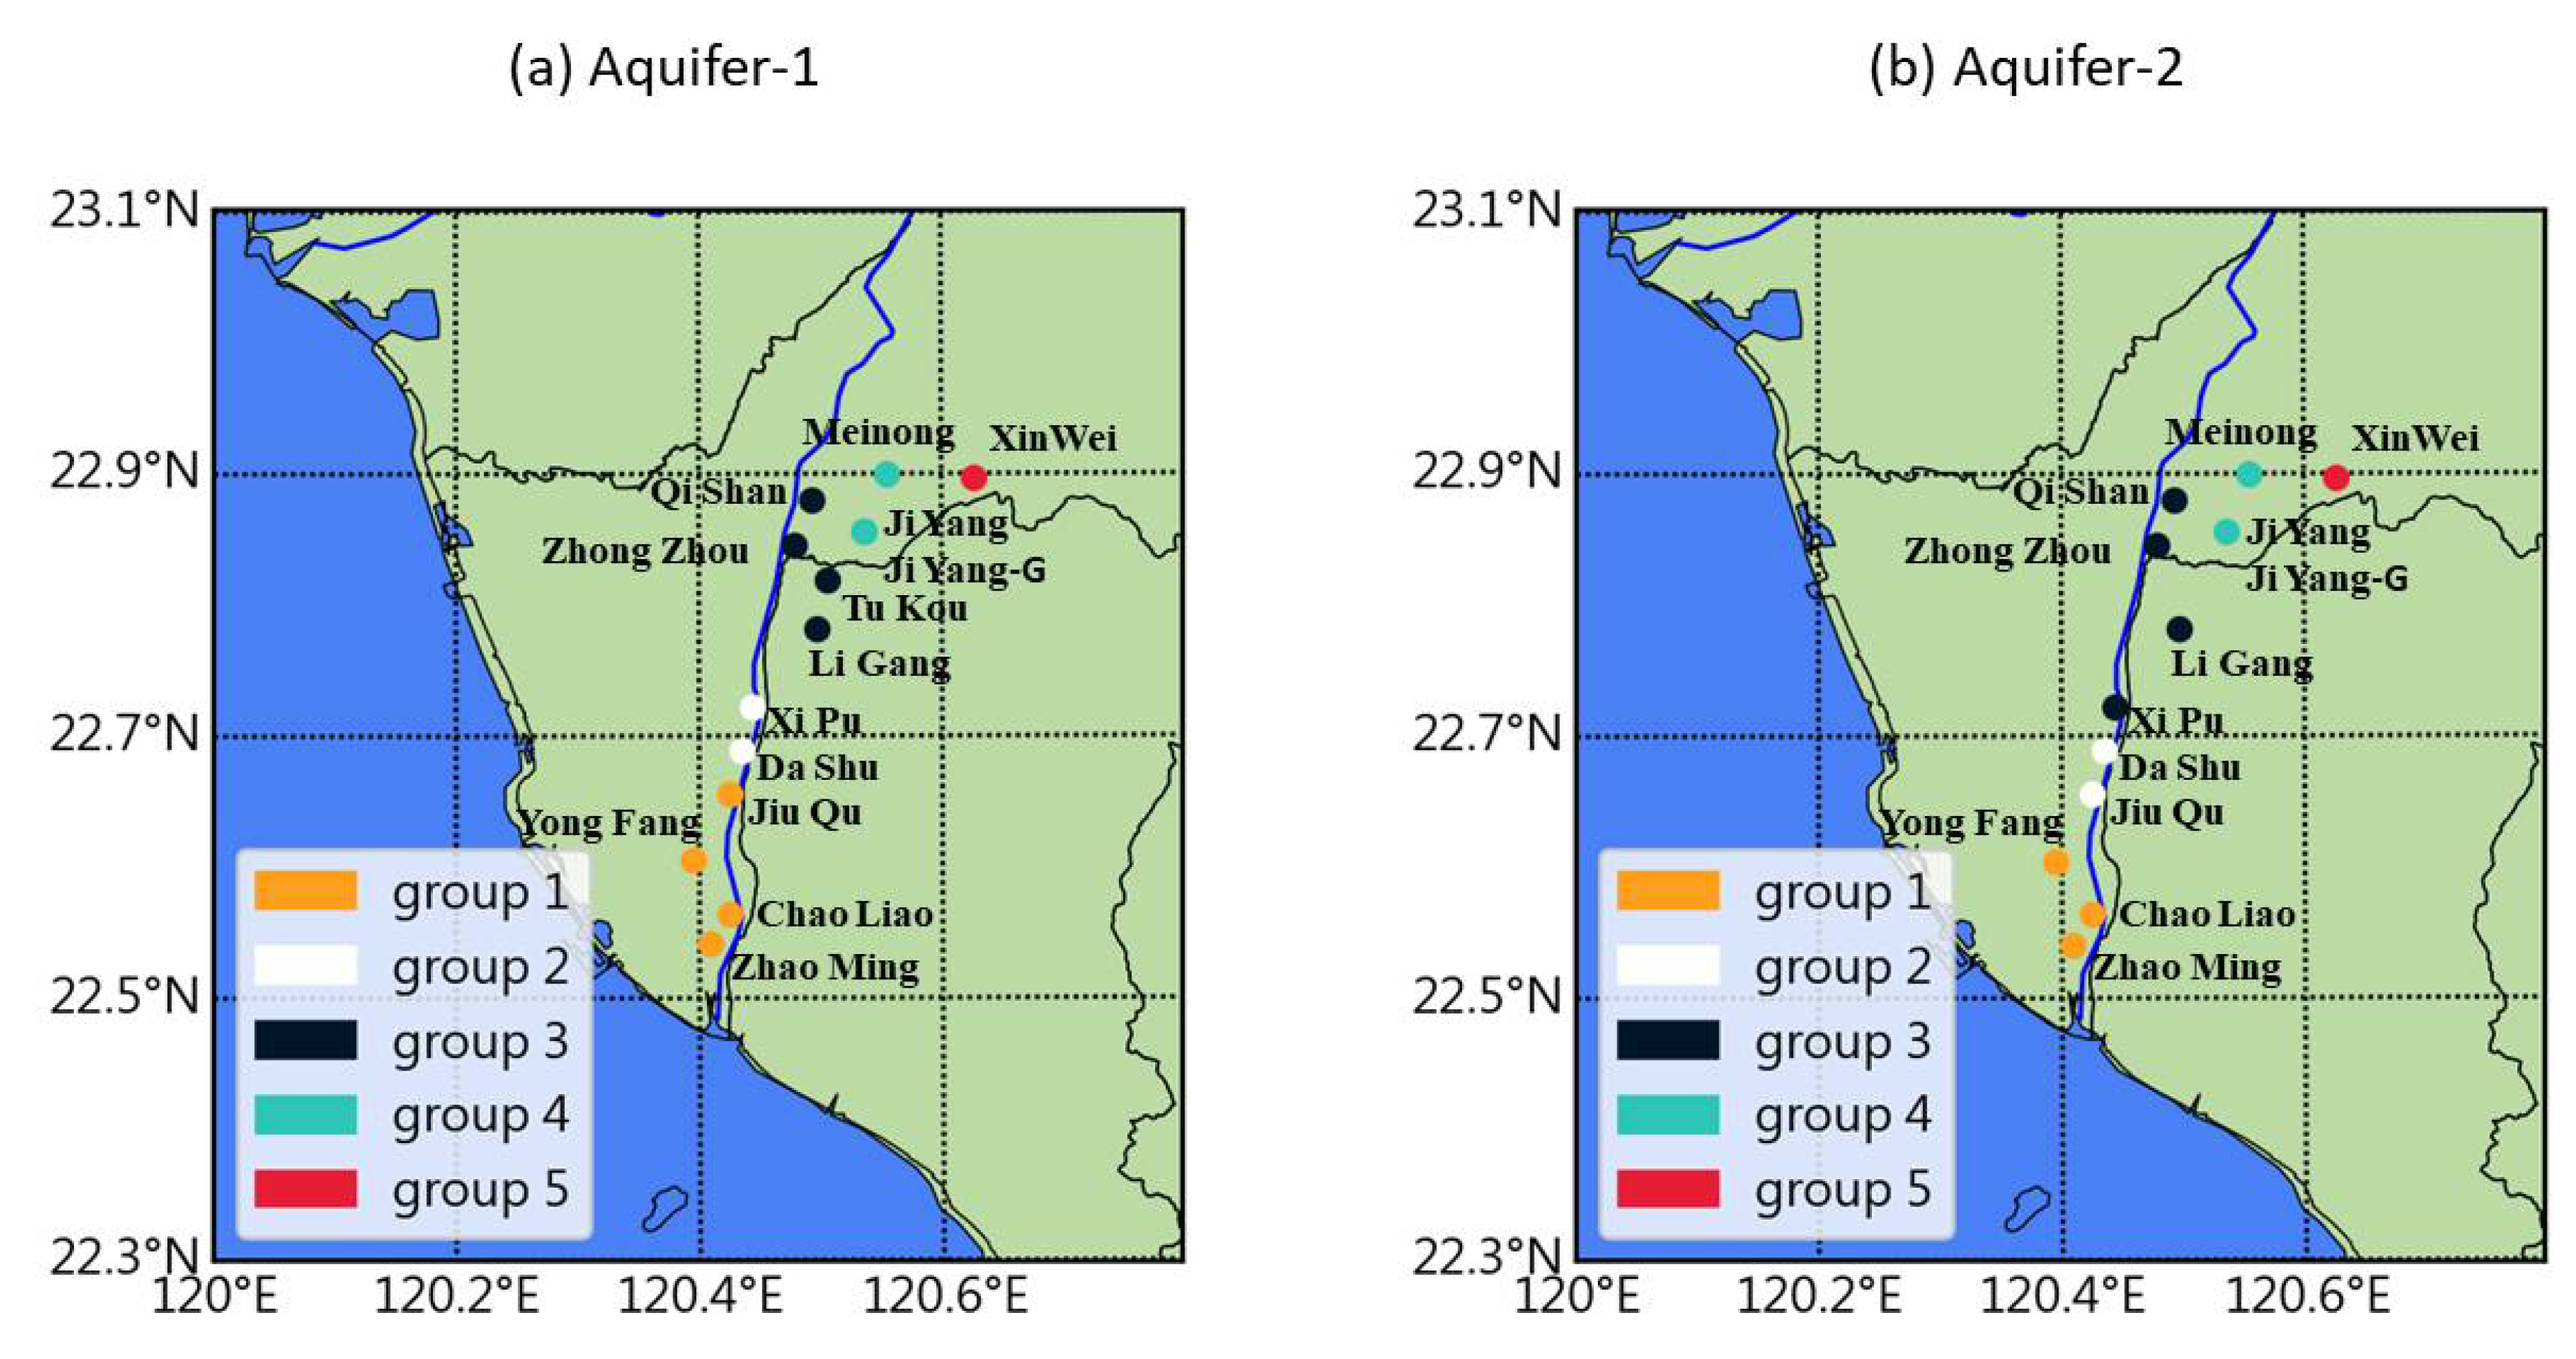
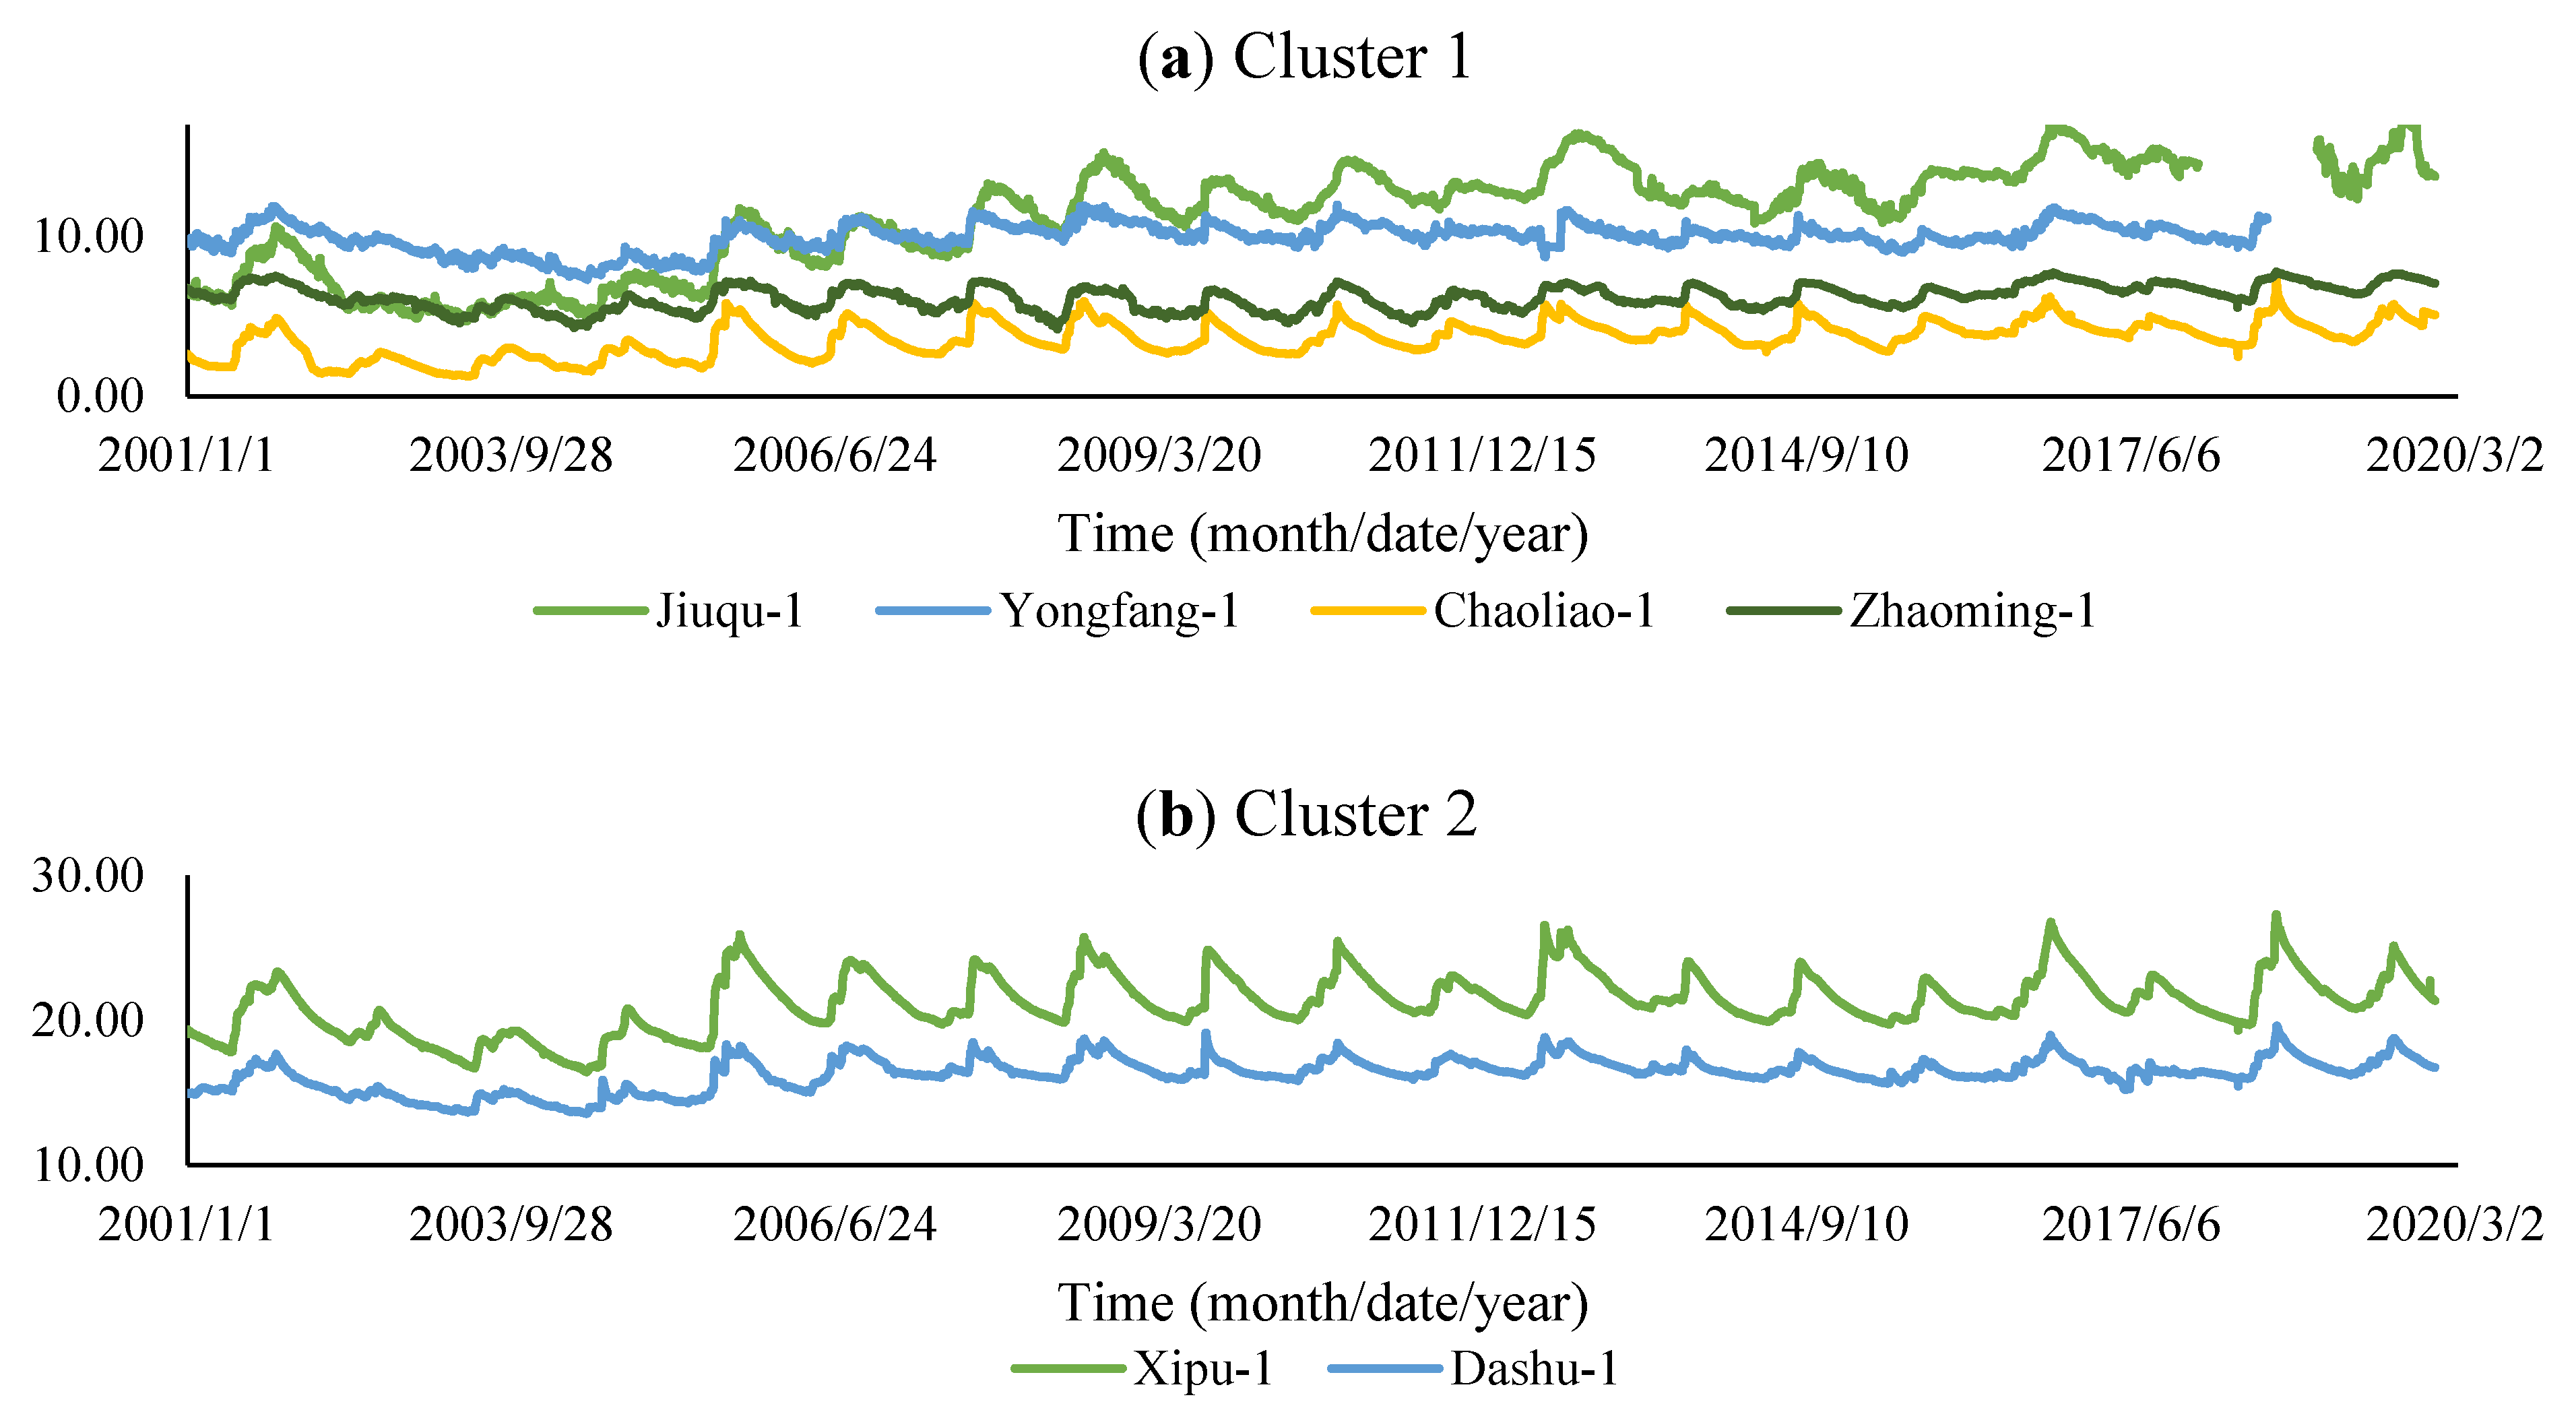
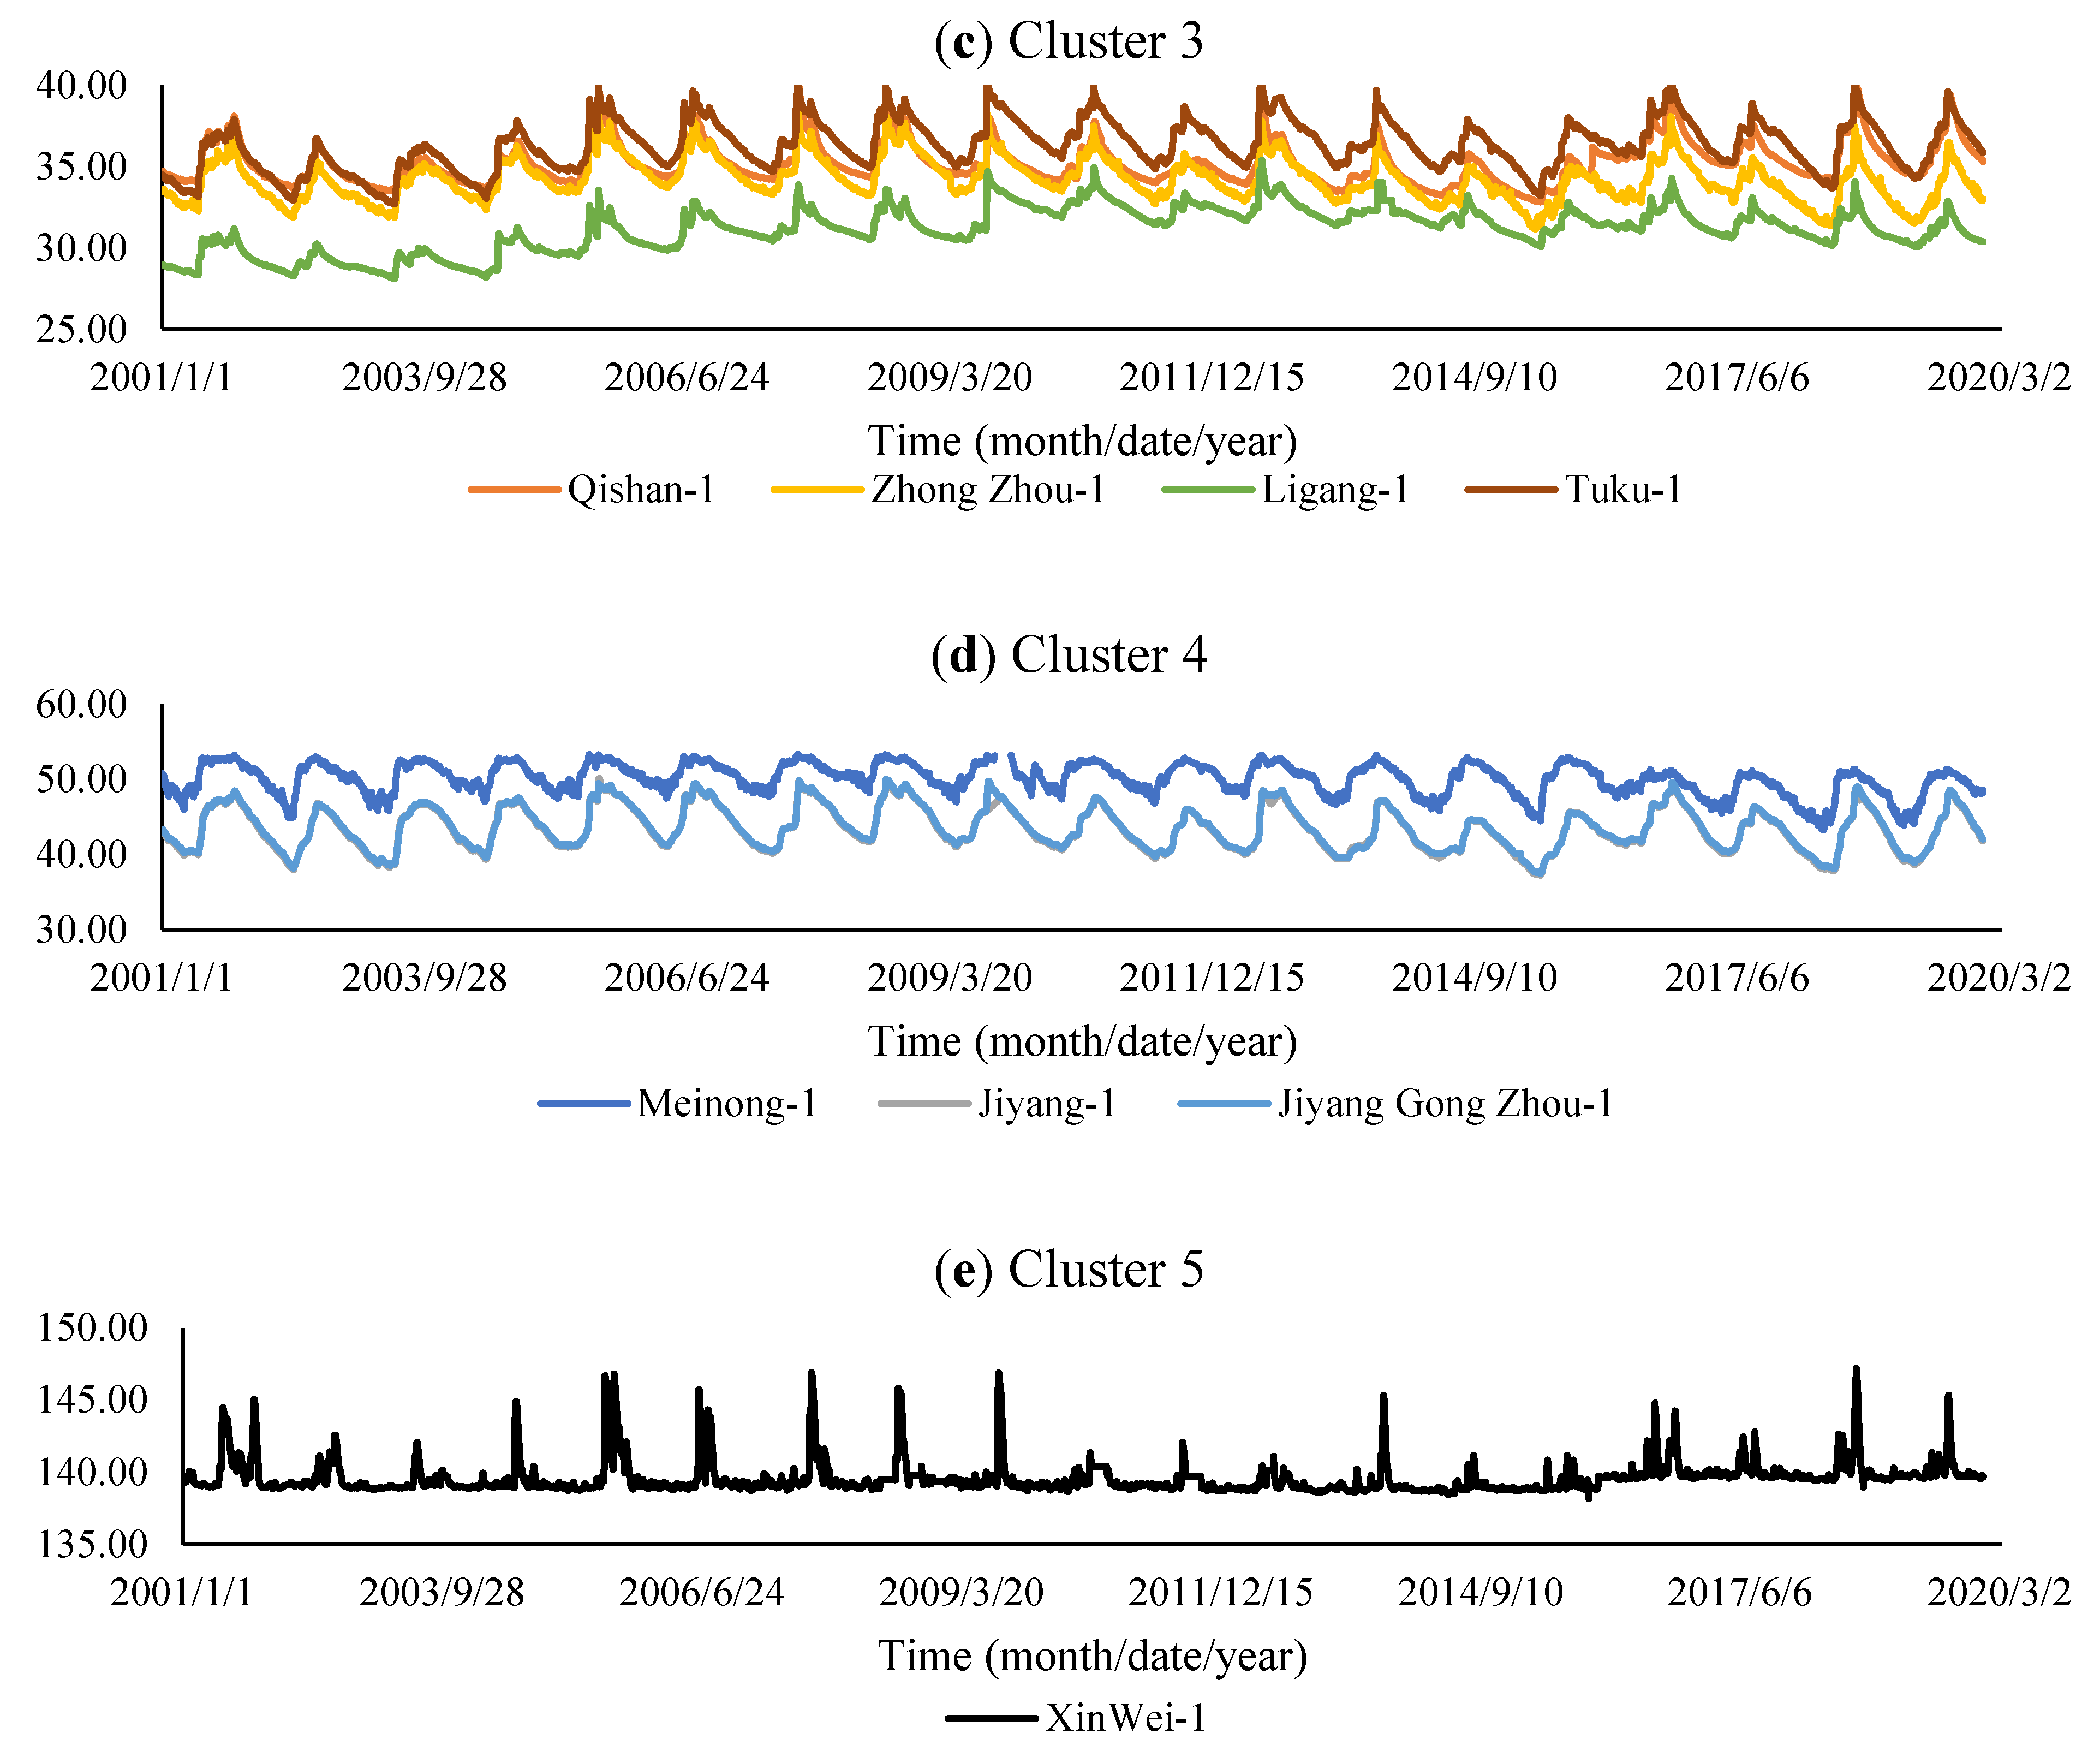
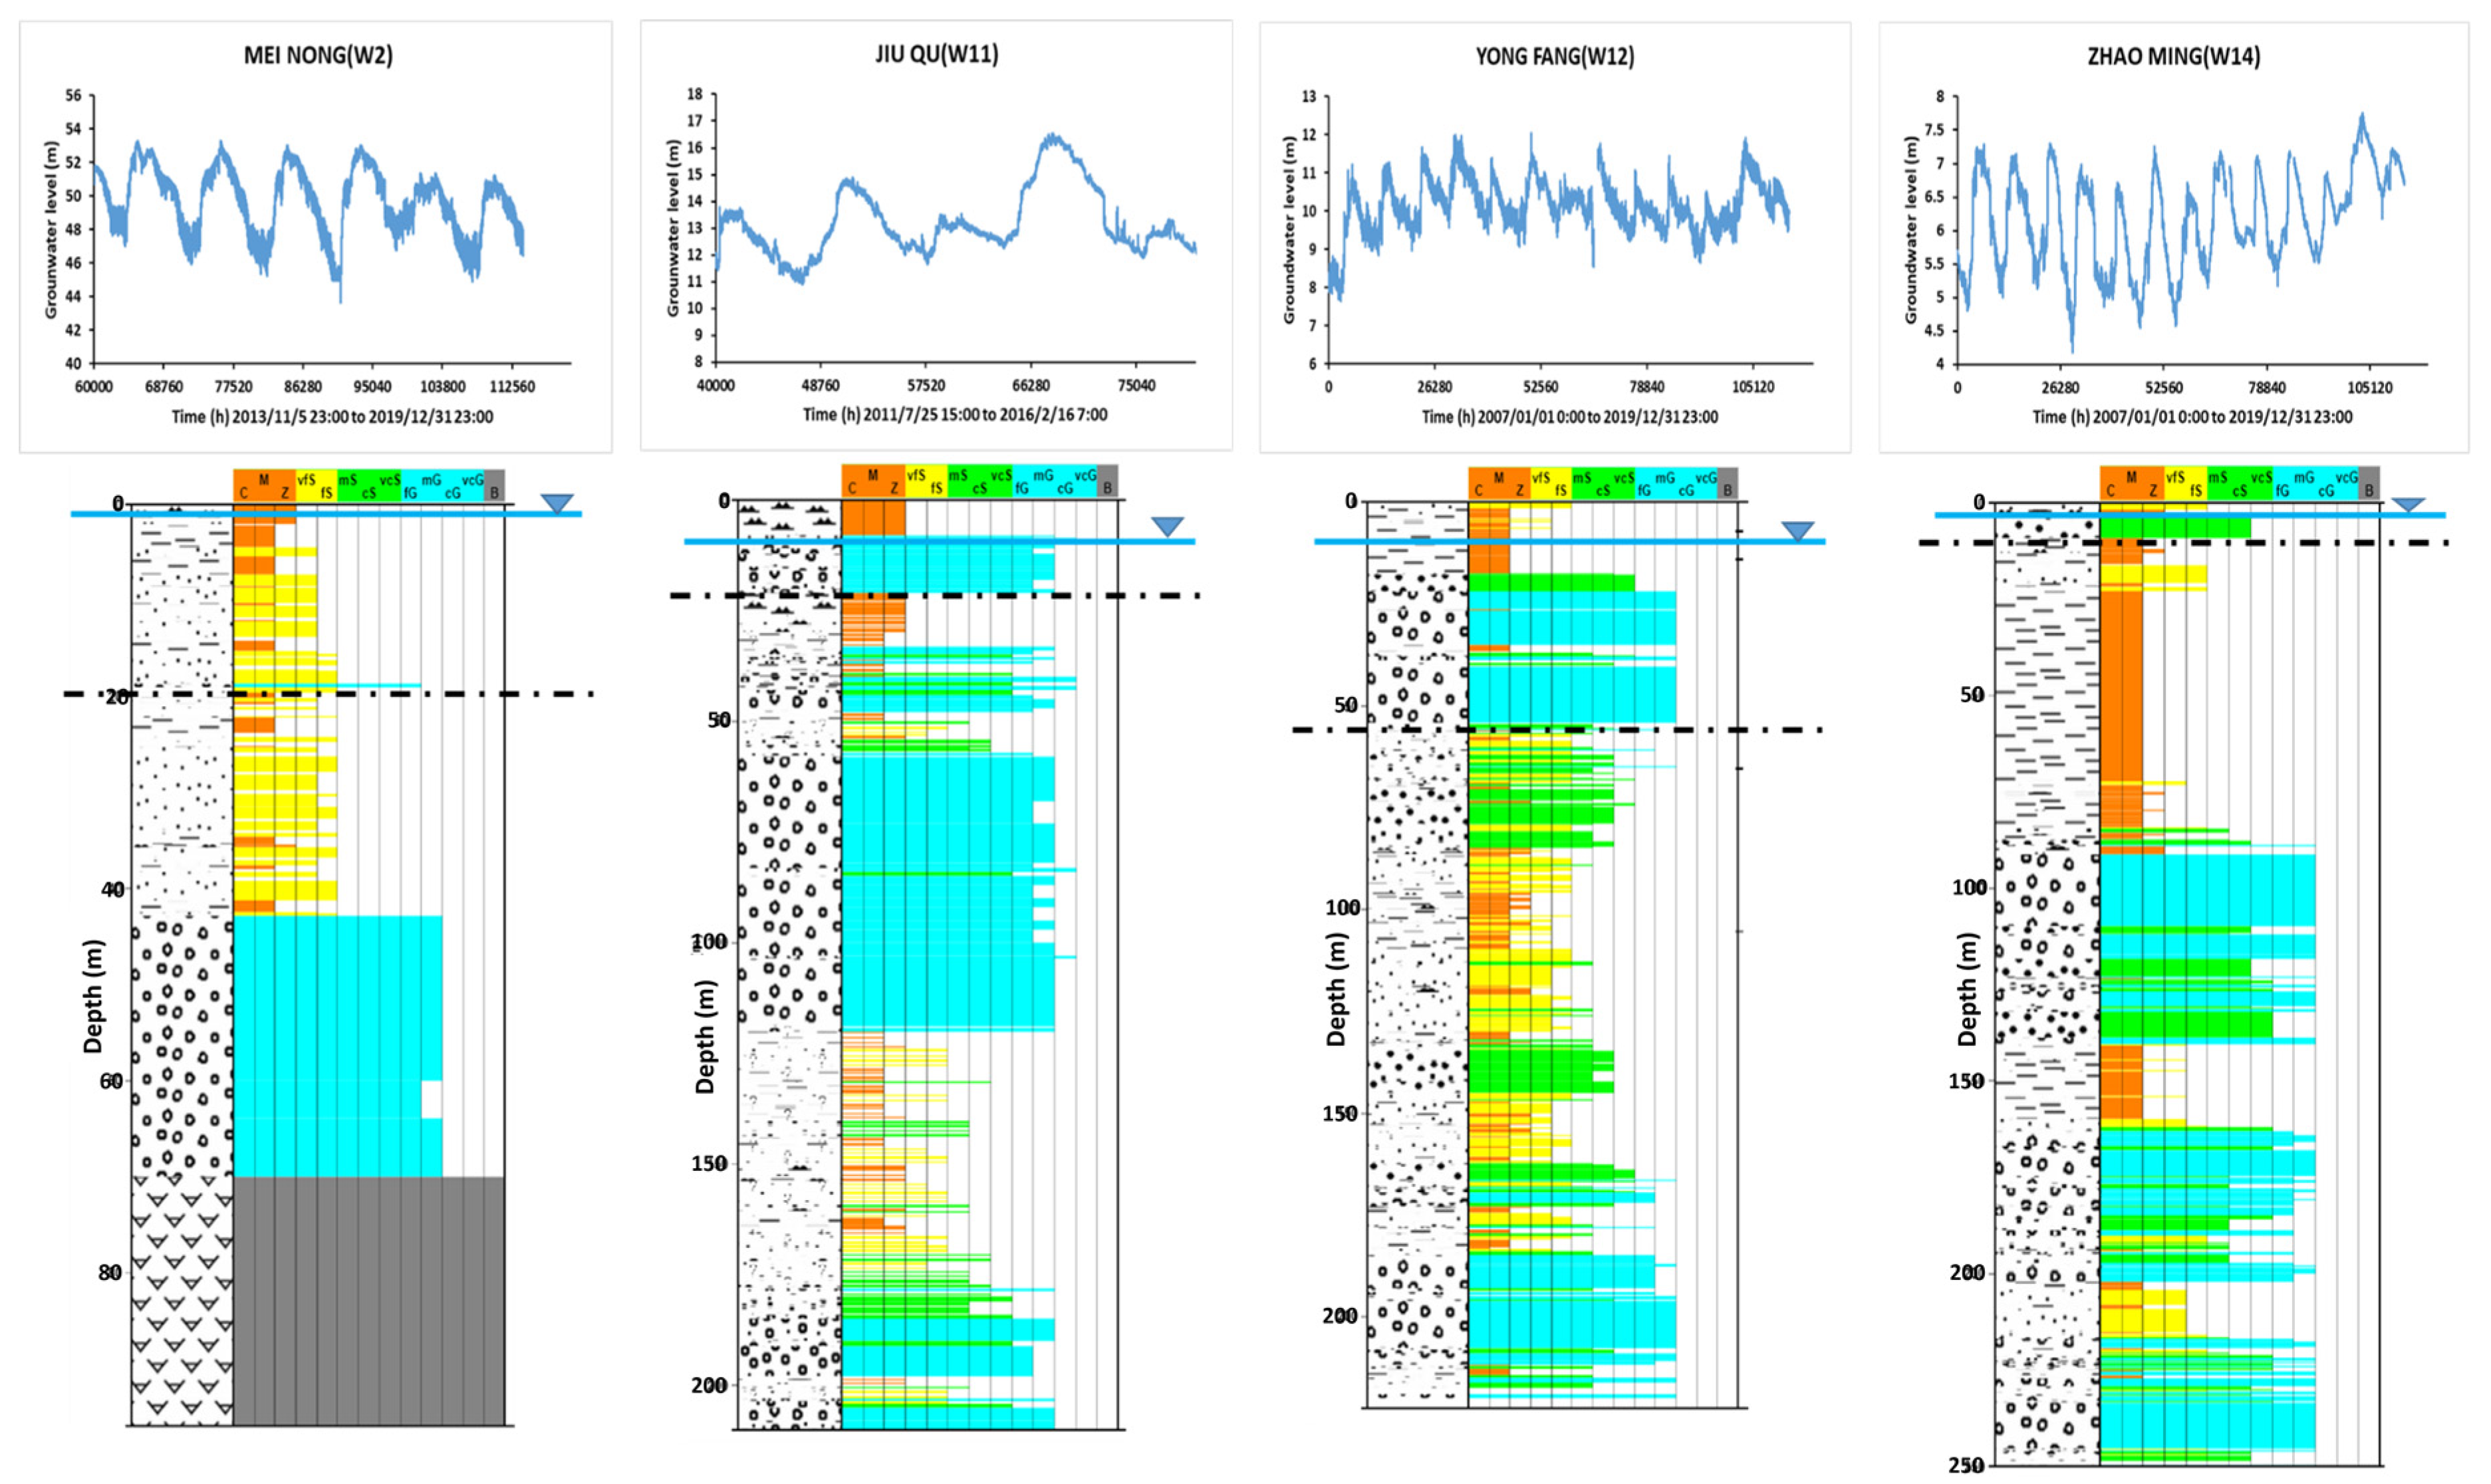
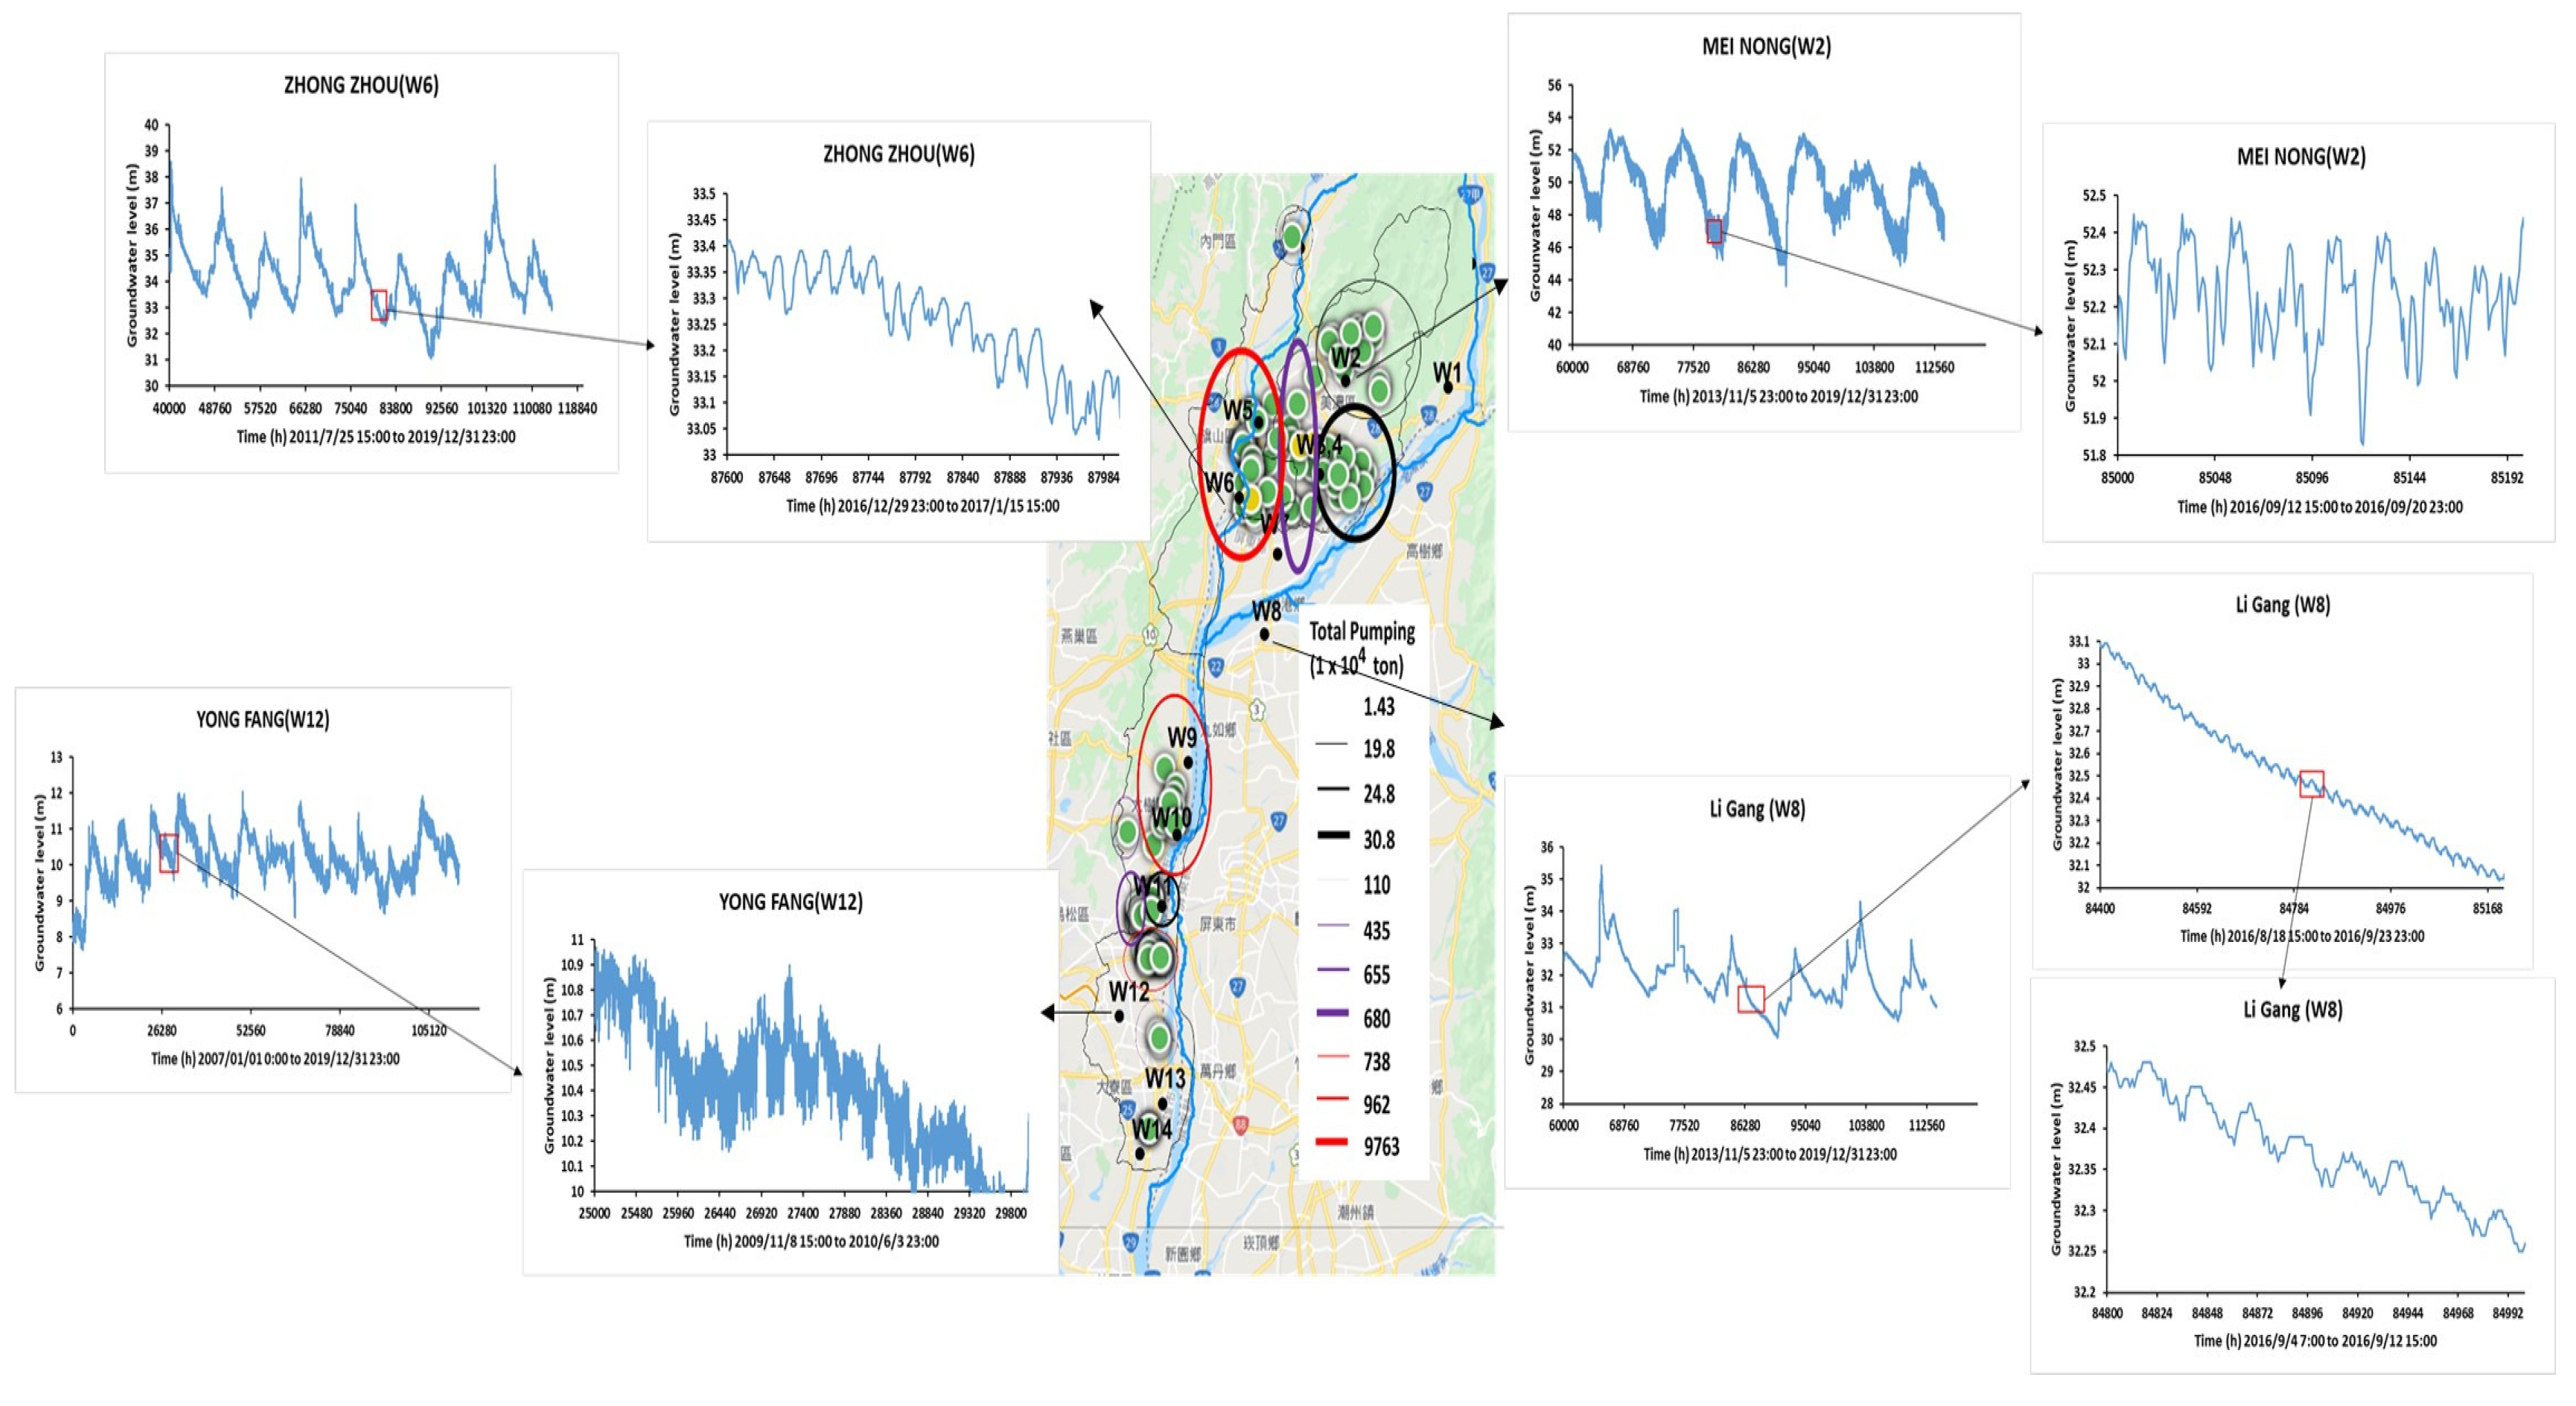
3.1. HCA Results and Aquifer Classification

The dendrogram of hierarchical clustering analysis is shown in Figure 6. The spatial distribution of clustering analysis is shown in Figure 6. Based on the similarity of groundwater level fluctuation, the clustering groups can be classified as five groups for both aquifer 1 and aquifer 2. In order to make the number of clusters more explanatory in terms of hydrogeological conditions, we adopt a more subjective number of clusters based on the experts of groundwater to set the criteria and compare them with the results of EDA. The clustering analysis results show that the groundwater observation wells in the study area can be divided into five major characteristics along with the upstream to downstream of Kaoping River, that is, from the mountainous top of the alluvial fan to the estuary, the river has gradual and different characteristics. From the perspective of the dendrogram, whether it is the first aquifer or the second aquifer, XinWei (W1) has a considerable pattern difference from all other stations, so it is divided into one category independently. This is because XinWei is located at the top of the Laonong River alluvial fan in the upper reaches of Kaoping River near the foot of the mountain along the canyon, and is separated from other observation wells by mountains and hills. Moreover, XinWei is located inside the floodplain area of Kaoping River and it is obvious that the closer a well to a river, the more affected it is by the river. In our understanding, XinWei (W1) is well connected to surface water since its groundwater level hydrograph is similar to a river hydrograph.
According to the characteristics of sedimentation affecting hydrogeological conditions, the gravel layer with higher hydraulic conductivity at the top of the alluvial fan is often thicker. As the downstream of the stream, fine-grained sediments increase, the characteristics of the groundwater changes in the estuary are gradually different, and this is reflected in the cluster analysis. In Figure 7, from the top of the alluvial fan along the altitude slope along the Kaoping River, it is naturally classified as Group 5: XinWei; Group 4: Meinong, Ji Yang, Ji Yang-G; Group 3: Qi Shan, Zhong Zhou, Tu Kou, Li Gang; Group 2: Xi Pu, Da Shu; Group 1: Jiu Qu, Yong Fang, Chao Liao, Zhao Ming. The results of aquifer 2 are similar to those of aquifer 1, except that Xi Pu is classified as Cluster 3 and Jiu Qu is classified as Cluster 2.
Figure 8 is the original time series of different groups of aquifer 1 observation wells based on the classification of Hierarchical Clustering Analysis. From the time series diagram of each observation well in Figure 8, it can be seen that after classification by cluster analysis, the characteristic changes have significant differences between groups, while the changes within the group have similar patterns. For example, the variation of Cluster 5 is very different from others, and the peaks of Cluster 2 and Cluster 3 are obviously sharper than other clusters, but the seasonal variation of Cluster 3 is more significant than that of Cluster 2. In Cluster 1, which is located in the estuary, the seasonal variation of groundwater is less obvious but has more high-frequency fluctuation characteristics, which may be caused by more human pumping factors and local hydrogeological conditions of lower hydraulic conductivity with more fine particles.
The result of clustering analysis is also consistent with the lithology distribution in Figure 1, which represents the clustering analysis of groundwater level fluctuation characteristics that can effectively reflect the basic lithology distribution and the age of sedimentary. From upstream to downstream, group 5 is the only one located in Liuqui Conglomerate, group 4 and 3 is located in terrace and alluvium, group 2 is next to Linkou Conglomerate, and group 1 is next to Tashe Formation (Figure 1).

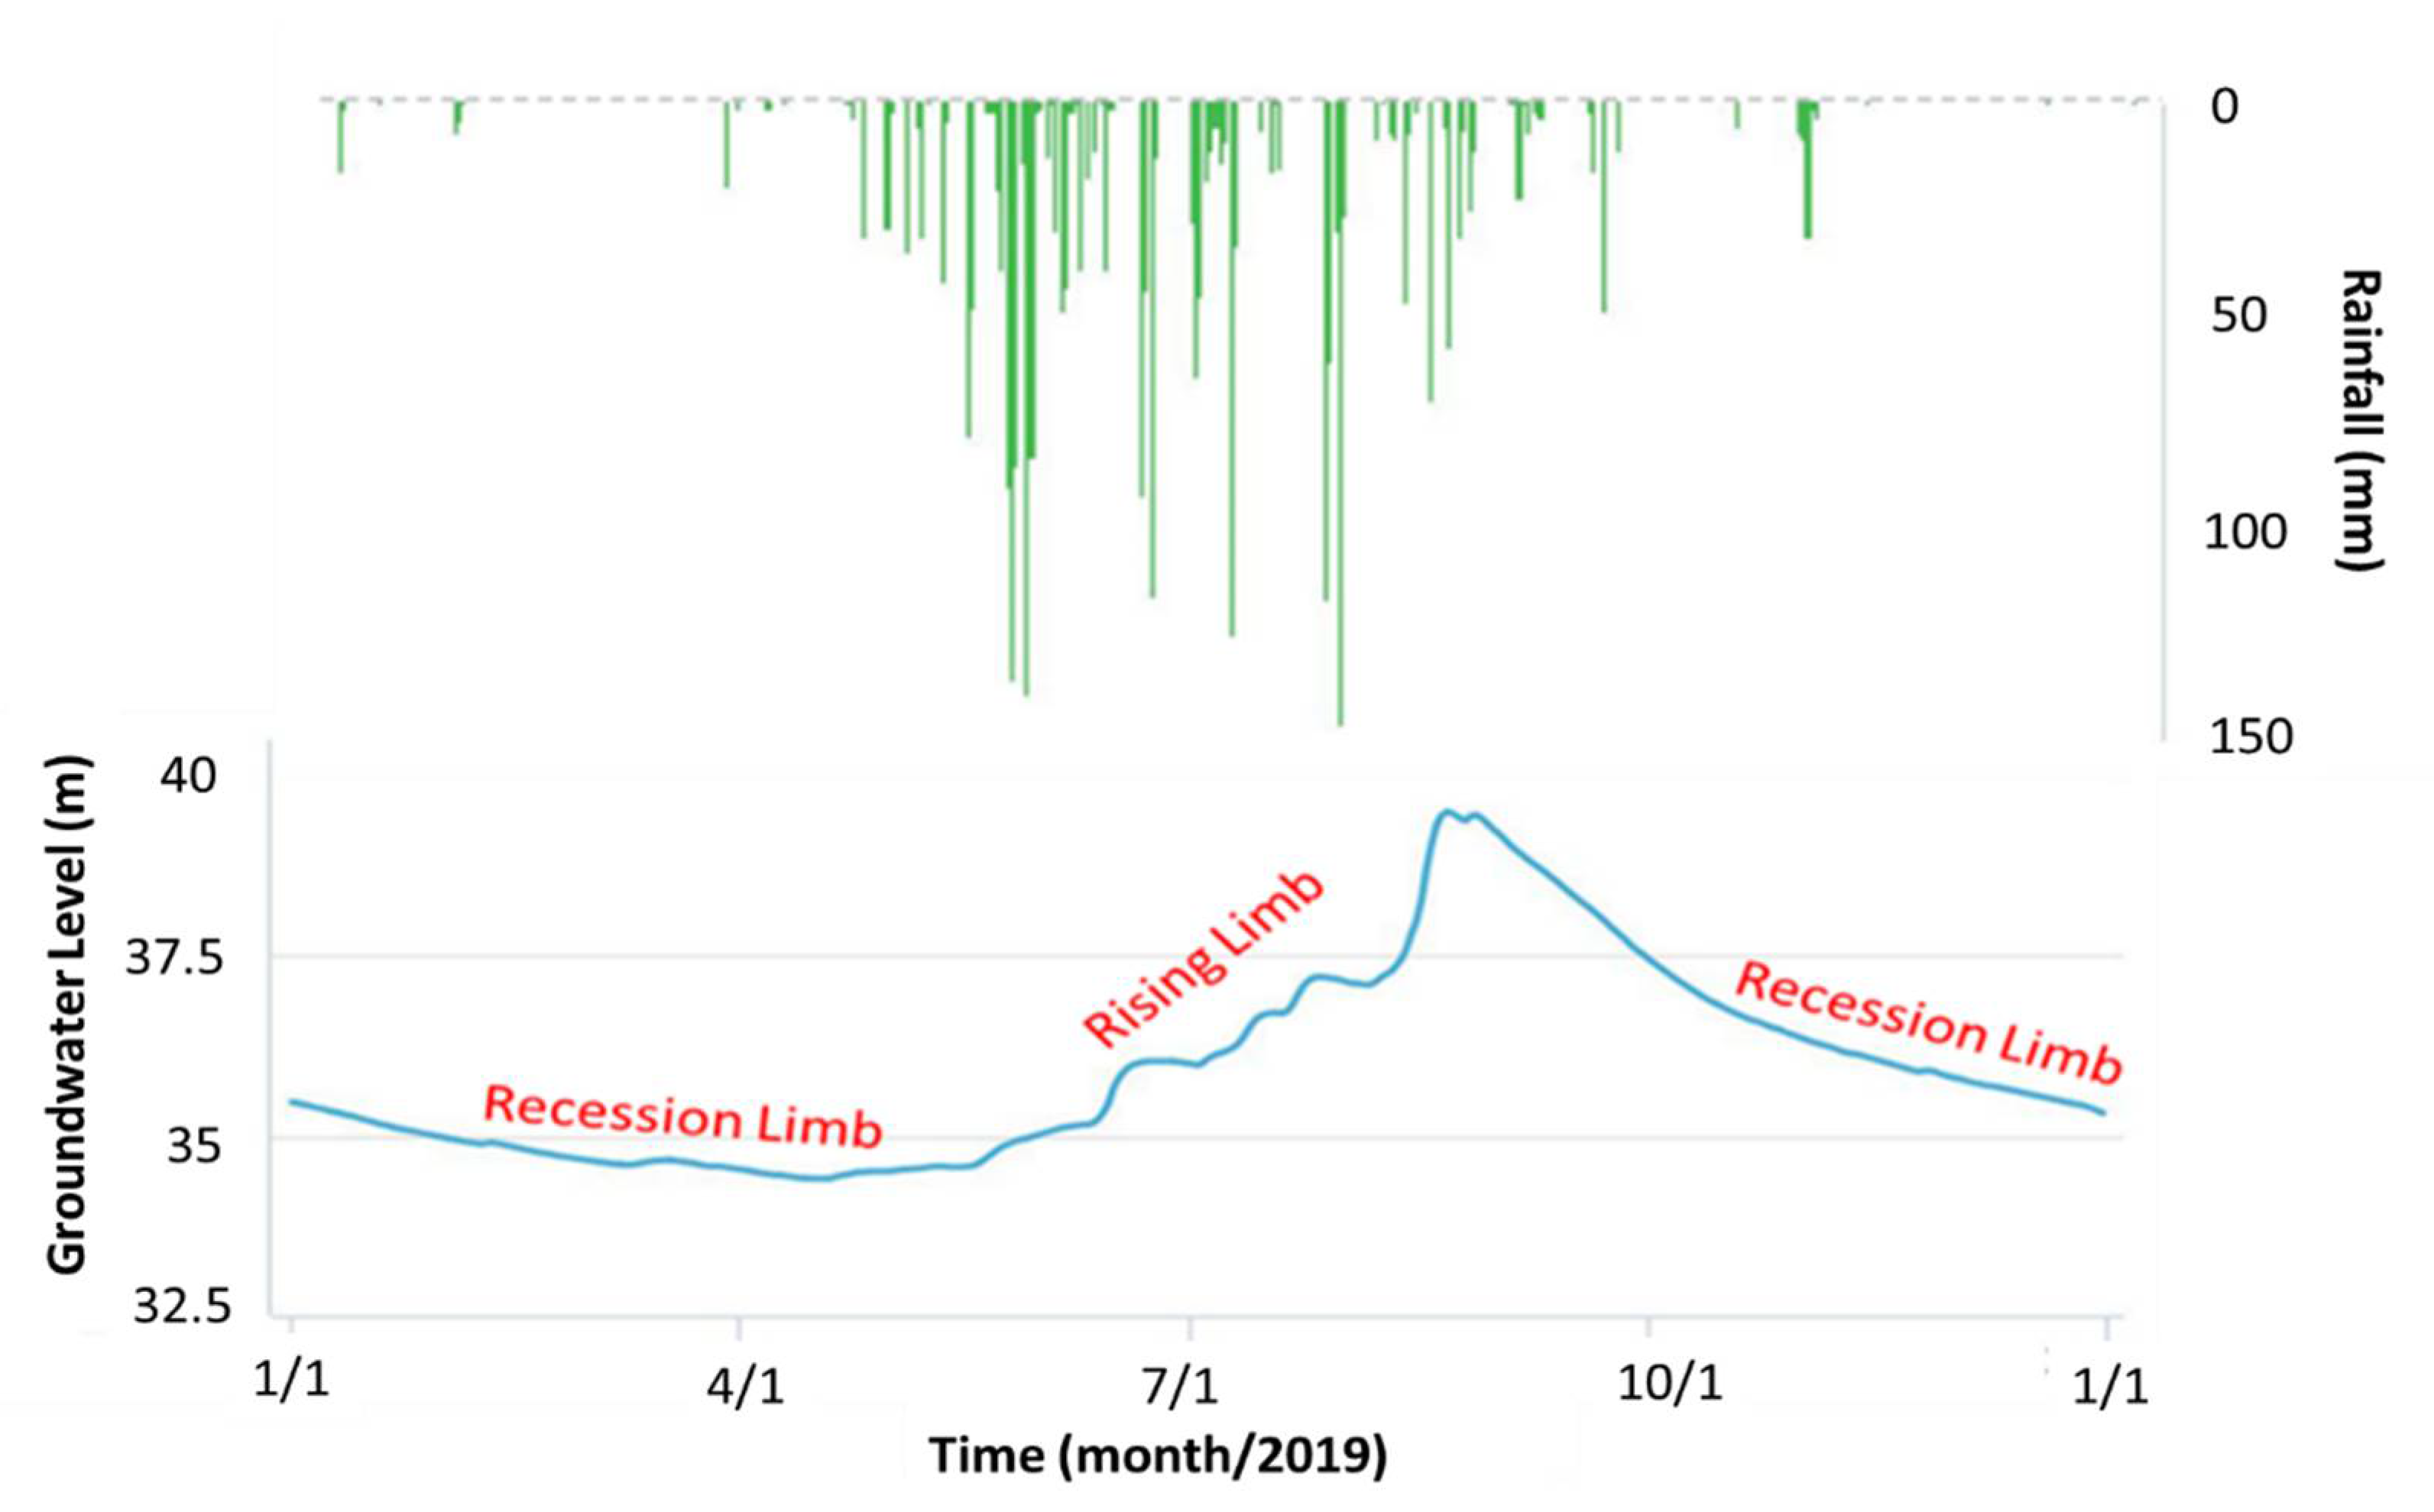
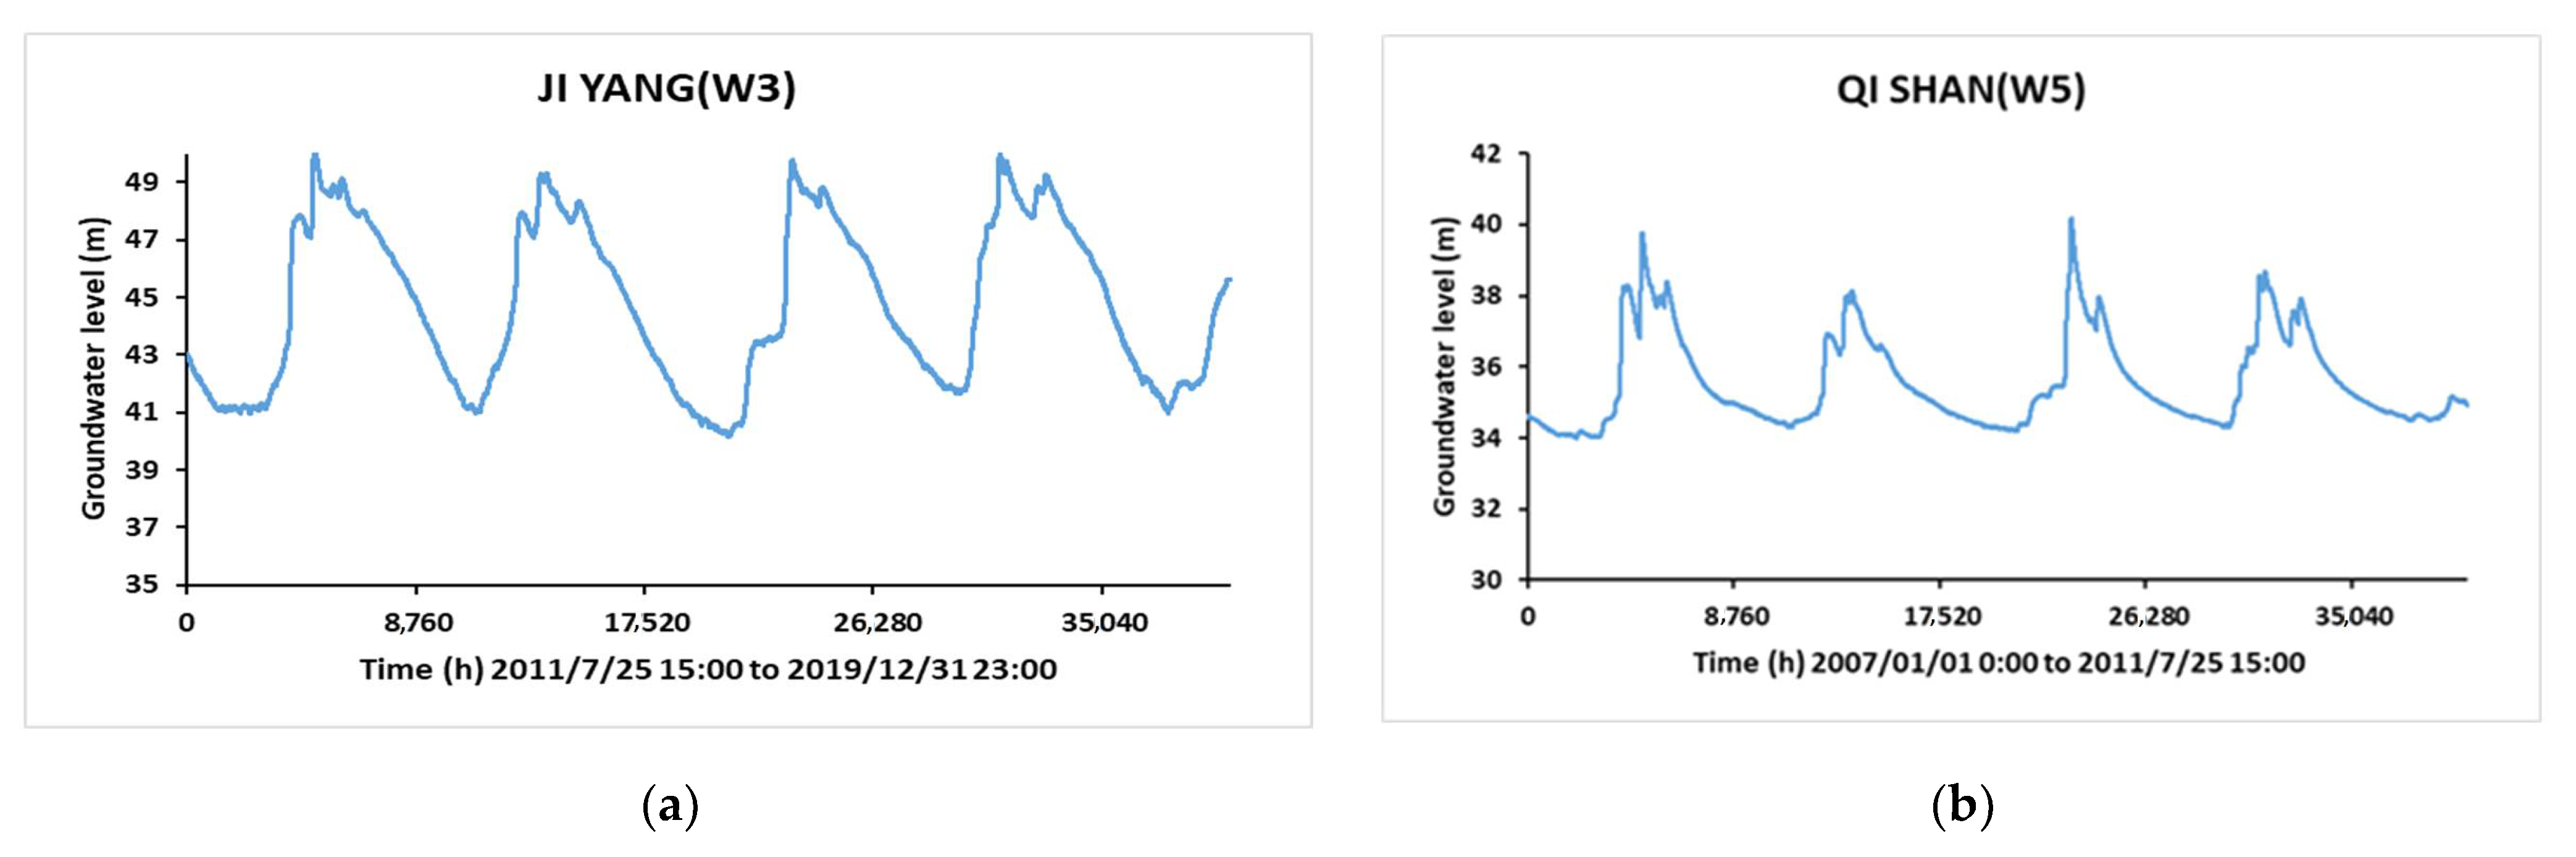
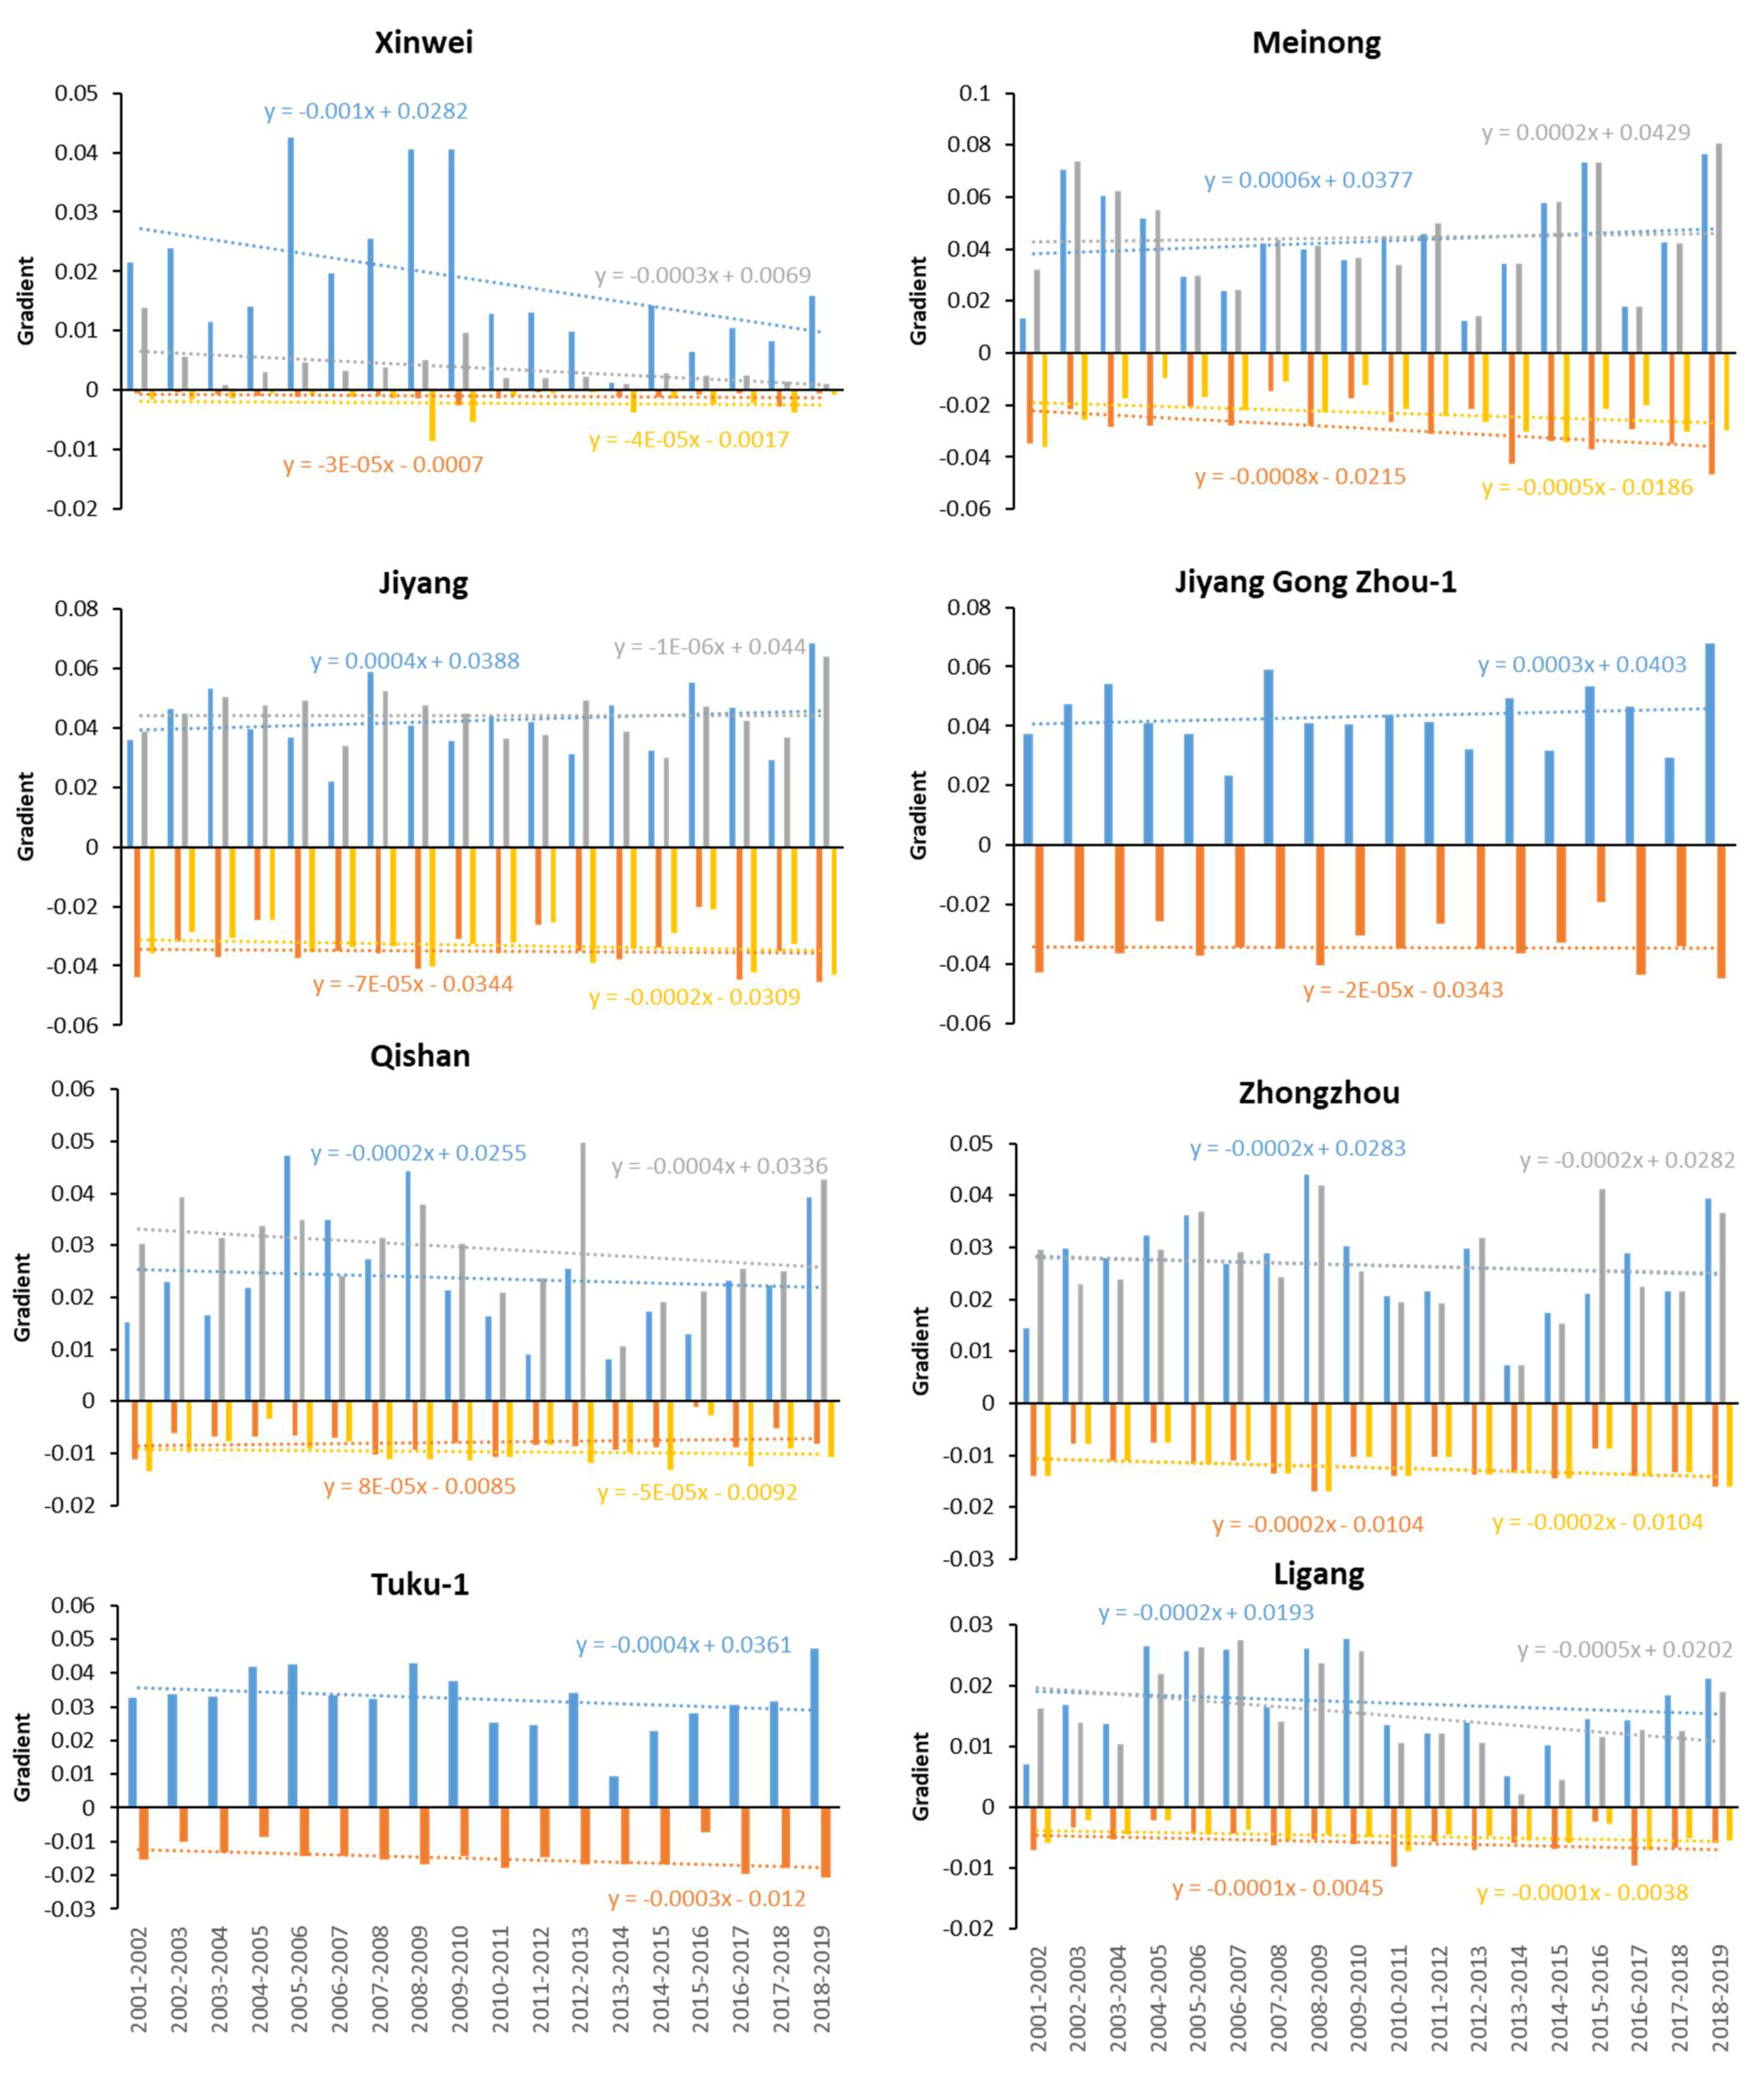
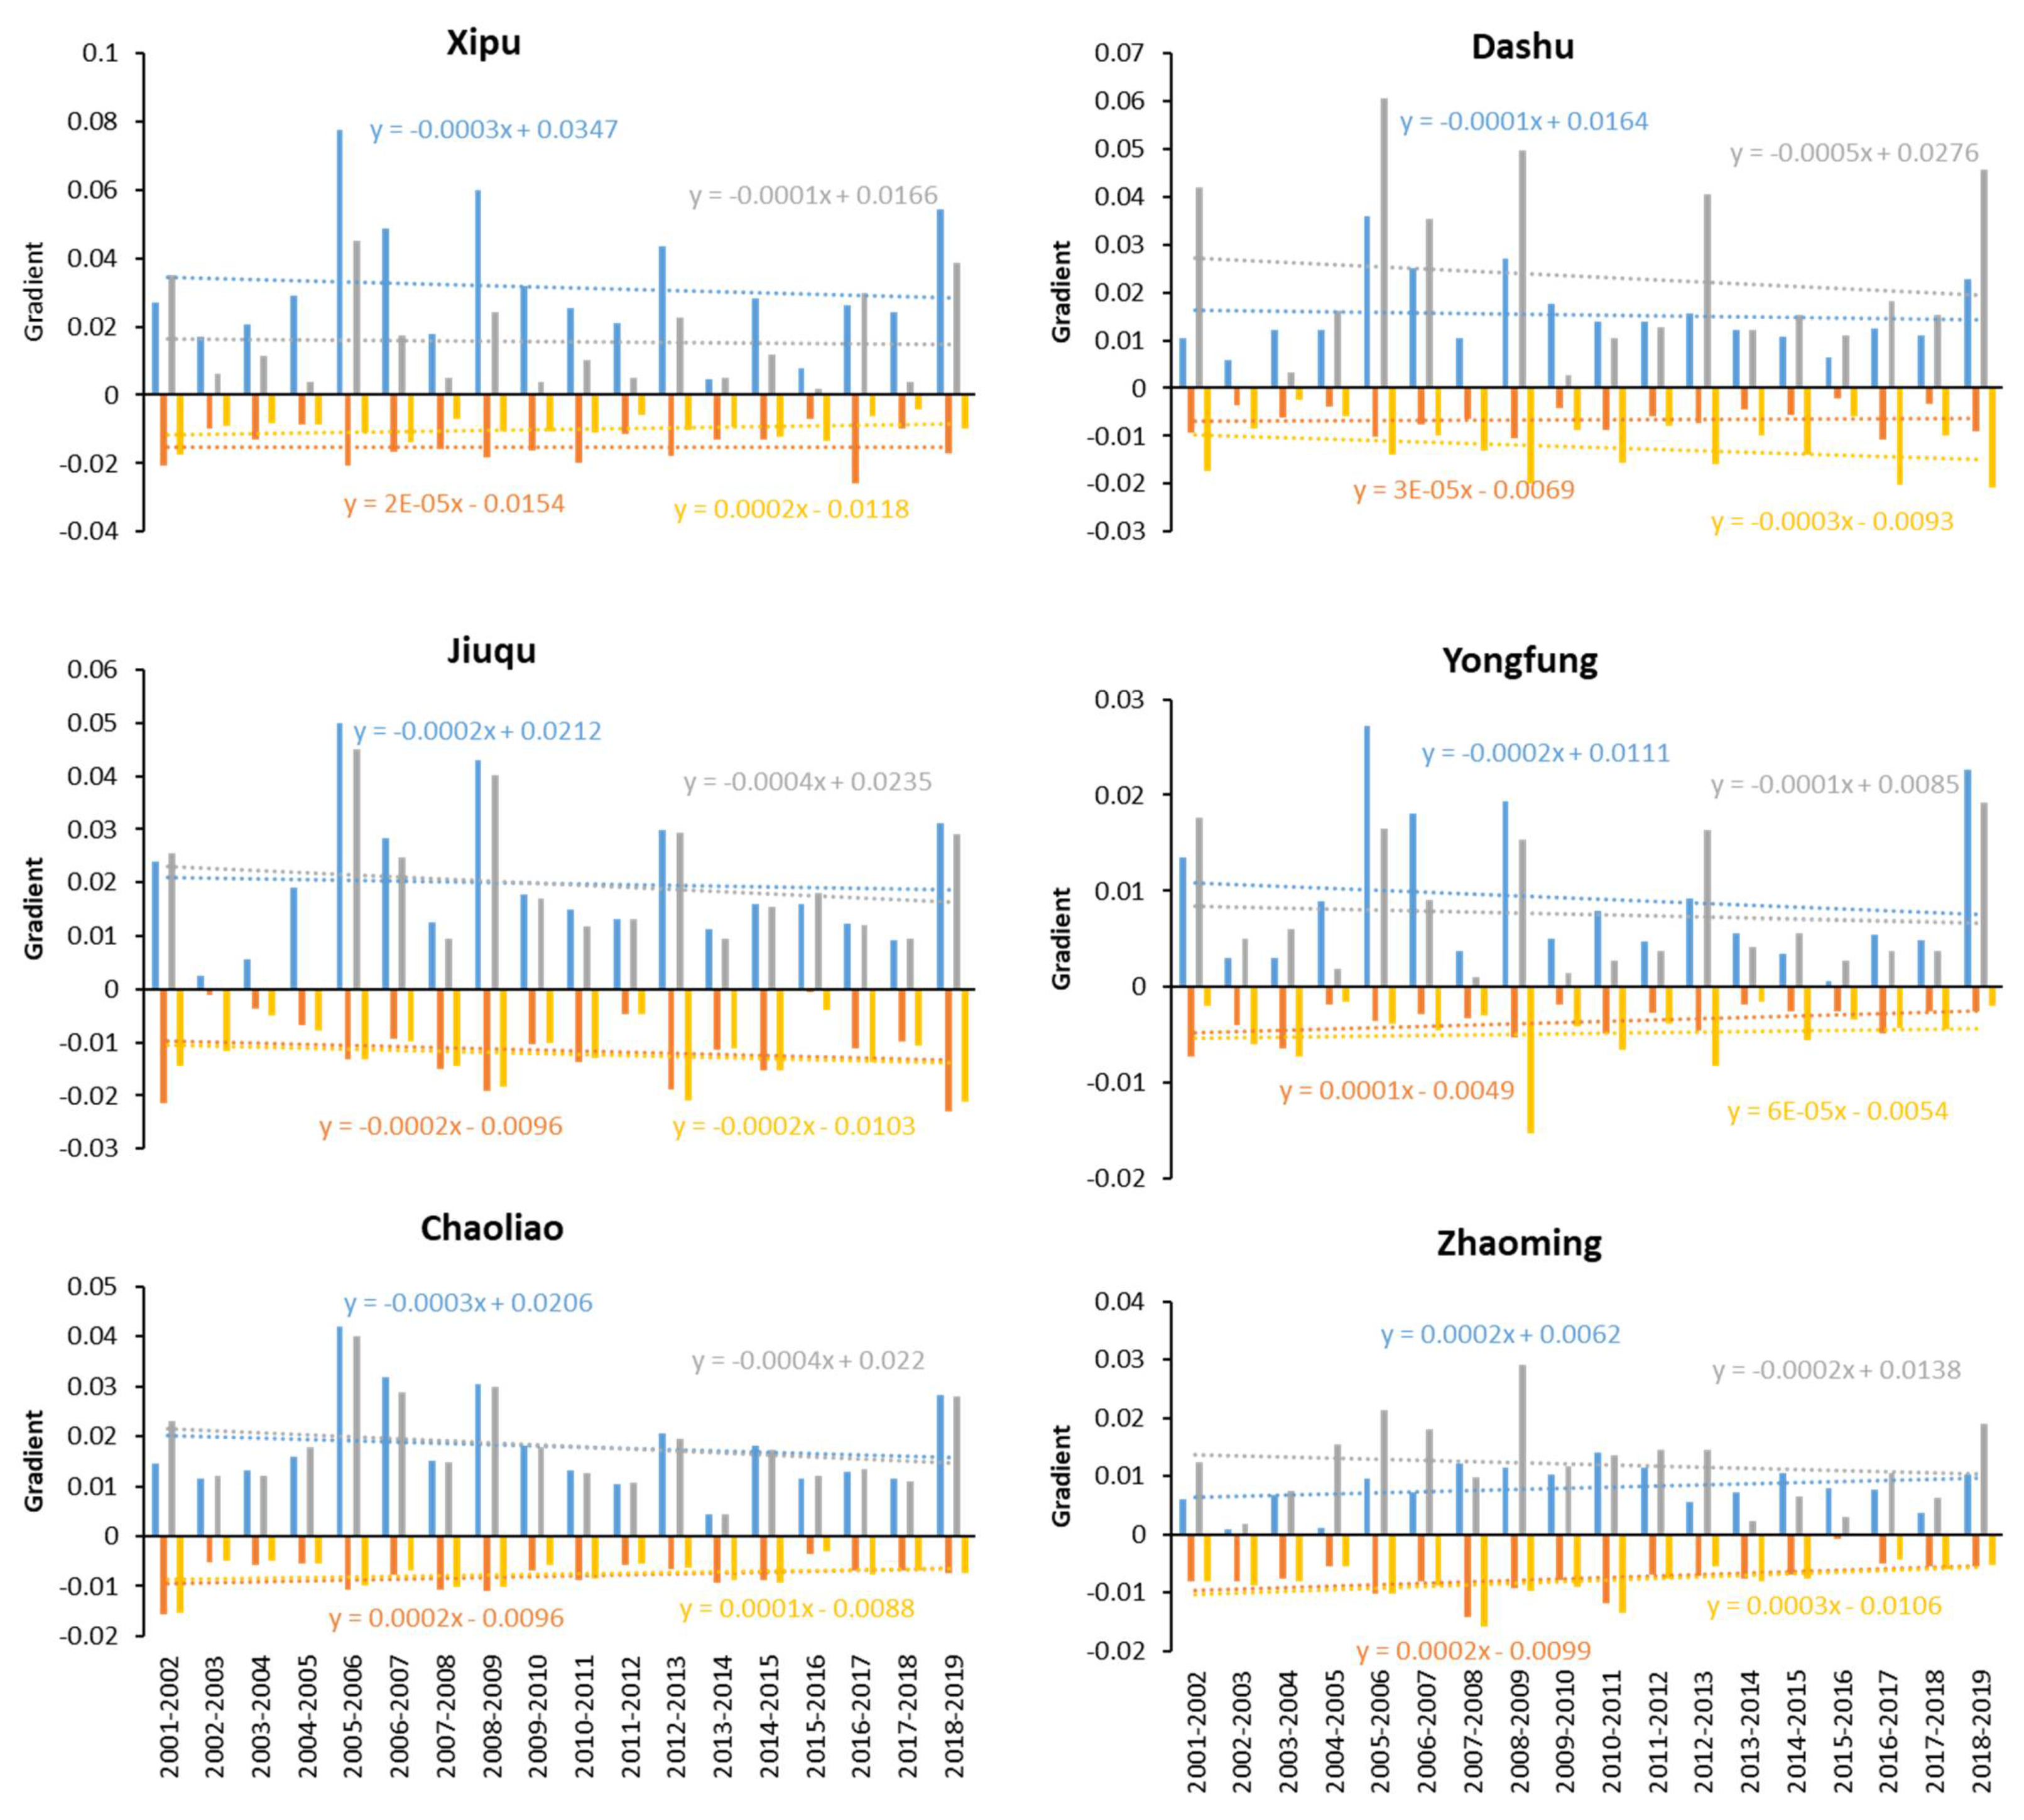
3.2. Apparent Line Patterns of Groundwater Hydrograph and Correlation Analysis

The apparent line thickness of the cyclical groundwater hydrograph can be visually compared as thick or thin lines based on its compact minute fluctuations in groundwater levels. The comparison of apparent line thickness of hydrograph curves can be used for the classification of aquifers. Unconfined and confined aquifers showed a different response to discharge and recharge events based on aquifer characteristics. The magnitude of fluctuation depends on discharge or recharge quantum. According to our understanding, the apparent thin line represents the unconfined aquifer because the change in the water level requires a change in saturation level within the unconfined aquifer that does not occur so frequently as compared to frequent pressure head change in the confined aquifer that produced thicker apparent line. This is verified according to lithology data from Central Geological Survey, MOEA (https://hydro.moeacgs.gov.tw/map/zh-tw accessed date: 5 July 2021) and time series hourly groundwater hydrograph from WRA (https://gweb.wra.gov.tw/HydroInfo/?id=Index# accessed date: 5 July 2021), the aquifer at Mei Nong (W2), Jiu Qu (W11), Yong Fang (W12) and Zhao Ming (W14) is confined as shown in Figure 9.
The thick line appearance can be formed may be due to two diverse reasons. Frequent irregular fluctuations due to pressure head/water level change in unconfined to confined aquifers produce natural thick lines. The second reason for thick lines can be due to periodic pumping around the observation wells. The pumping effects are verified with the help of Figure 10, which showed the locations of pumping stations and the total amount of pumping. It indicated that observation wells from W3 to W6 and W9 to W12 are under the pumping stress as shown with clear fluctuations in the time series true hydrographs. However, the effects of pumping in an unconfined aquifer do not affect the overall shape and thickness of the hydrograph, for example in the observation wells (W6 and W8). There is a regular fluctuation with a smooth top in recession curves due to regular pumping. A similar kind of pattern was also observed in other observation wells (W3, 4, 5, 7, 9 and 10) which are not shown here. In a confined aquifer, the fluctuations are shaped due to changes in pressure head or due to the effect of pumping or both as can be seen in Figure 10 at W2 and 12 observation wells.
The correlation analysis has been conducted between observation wells based on time series water level data as shown in Table 2. It was analyzed that some observation wells showed heterogeneity while those located inside alluvium aquifer have a high correlation with each other. Xin Wei (W1) observation well is located inside the river plains and showed a quick aquifer response. Mei Nong (W2) shallow aquifer is confined and dominated with fluctuations patterns while the deep aquifer is unconfined. The aquifer of W2 has a U type curve that enables the drainage of groundwater toward observation wells (W3, 4 and W6, 7) because the correlation with these observation wells is up to 0.75. The observation wells (W3, 4) are located in an unconfined alluvium aquifer while having mixed U and V type curves, these characteristics made the drainage of groundwater toward W6 and W7) with high correlation (0.95) while some parts also contributed to W5 and W9. Observation well (W5) also has a strong correlation (0.87) with W6 and W7 while W6 and W7 are also strongly correlated (0.92) with each other. This analysis indicated that observation wells W3 to W7 and W9 have similar aquifer responses and characteristics. W11 and W12 showed heterogeneous behaviors with nearby wells while W9, W10, W13 and W14 correlate with each other.

4. Discussion

The fluctuations (rise and fall) in groundwater levels would not occur if the rate of discharge was equal to the rate of constant recharge. According to Weeks [28] and Rojstaczer [29], the unconfined aquifers showed response time (time lag) to rainfall due to the pressure head change through the unsaturated zone to the water table. This phenomenal behavior is due to air movement through the unsaturated zone to the water table, because of pressure head imbalance between waters in the observation well and the aquifer until the pressure front arrives at the water table. This imbalance yields a change in groundwater level in the observation well. The actual seasonal fluctuations data provides a rational and reliable groundwater estimation based on the choice of accurate pre and post rainy season time and duration of groundwater hydrographs. Similarly, the optimal specific yield can be estimated by a water balance study of peak to the lowest water table. Thus, it is important to identify the time of occurrence and level of peaks and lowest water table. Further, the pumping stress on aquifer can be perceived through groundwater level fluctuations in hydrograph. The minor rise in the recession curve may indicate the aquifer stress release due to the discontinuing of extraction from aquifer or non-pumping of groundwater.
The features of groundwater hydrograph (i.e., the shape of crest and trough, and annual cyclical patterns) are the product of aquifer character and recharge and discharge quantum. These features have been used as a tool for aquifer classification, identification of pumping aquifers and interpretation of aquifer response to recharge–discharge phenomenon. The recharge phenomenon was interpreted using a hydrograph crest shape. The pointed crest mimics immediate water diffusion, whereas rounded crest signposts delayed and/or slow diffusivity. All groundwater hydrographs showed a predominant cyclical yearly response to dry and wet seasons. With the inception of the rainy season, the curve forms the rising limb of the hydrograph and once the rainy season retrieves the curve starts forming a recession limb, which continues until the next rainy season.
With the full knowledge of groundwater level fluctuation, the hydraulic conductivity of the aquifer can be calculated by analyzing the recession curve of the observation well hydrograph [30,31,32]. The recession curve rapid decline corresponds to better infiltration conditions [33]. Therefore, comparatively, it can be expressed that the U shape curves resemble higher hydraulic conductivity than the V shape aquifers. Most of the observation wells are located in alluvium and terrace deposits and the shape of the curve is purely U type and a combination of U and V types. Curve shape correlation according to lithology location indicated that both U and V type curve was found in Holocene and Pleistocene formations. Therefore, the similarity of curve shape indicated the similarity in porosity and permeability pattern within different lithology units.
The comparison of apparent line thickness of hydrograph curves can be used for the classification of aquifers. Unconfined and confined aquifers showed a different response to discharge and recharge events based on aquifer characteristics. The magnitude of fluctuation depends on discharge or recharge quantum. The unconfined aquifers shaped thin lines of groundwater hydrographs because the change in the water level requires a change in saturation level within the unconfined aquifer that does not occur so frequently as compared to frequent pressure head change in the confined aquifer that produced thicker apparent line. The regular pumping produces a regular fluctuation with a smooth top while the pumping duration remains comparatively smaller than non-pumping. The non-pumping duration produces a smoother line while pumping yields a fall in smooth line level. This pumping and non-pumping scenario harvest a typical pattern of groundwater hydrograph that differs significantly from natural fluctuation due to pressure head change. The clustering analysis appeared as a powerful tool for the classification of groundwater level fluctuation that effectively reflects the basic lithology distribution and the age of sedimentary, accordingly. To the best of our knowledge, this technique is used for the first time for groundwater level fluctuation characteristics to correlate with lithology distribution, human pumping factors and local hydrogeological conditions. Although there are many other commonly used clustering methods, such as K-means and DBSCAN, they are more suitable for clustering based on the distance or the location. For the similarity of time series expressed by the correlation coefficient, the hierarchical clustering method is better to express the relationship between the measuring stations, especially through the dendrogram. In the past, some studies also tried to use the perspective of data mining for the analysis of groundwater in Pingtung plain, and the results are consistent with this study [34]. However, our study is more successful in classifying the spatial differences of groundwater observation data in detail. Moreover, this study highlights the future directions to investigate the factors responsible for the change in the recharge–discharge phenomenon of the study area. The information from groundwater hydrographs can be used as a tool for groundwater resources prediction and planning with the aquifer recharge and discharge management. In addition, the water use efficiency can be enhanced based on aquifer classification for water security. The proposed aquifer classification via this unique methodology has great potential for applied use in groundwater modeling and management e.g., saving drilling cost etc. Better understanding of aquifer characteristics such as regional aquifer classification, recharge and discharge patterns, aquifer geology and flow patterns are the surface indicators that may be more effective and less costly for interpreting basic regional hydrogeological conditions and assessments. These data from limited boreholes limit the constraints for subsequent well/borehole drilling operations and environmental impact assessment [35].

5. Conclusions

The aquifer response to the recharge–discharge phenomenon of bedrock and alluvial aquifers has been investigated by analyzing over 14 observation wells groundwater hydrographs, collected from four districts of Kaohsiung city, Taiwan. The hydrographs were based on the continuous groundwater levels time series data. The correlation analysis indicated that alluvium aquifer observation wells have similar nature of hydrographs while confined aquifer observation wells showed heterogeneity. However, the recurring annual hydrographs pattern of each observation well continued to be similar in shape while the fluctuation level varied based on discharge–recharge quantum. This behavior reflected that the hydrograph shape depends on the aquifer characteristic and is controlled by its response and does not totally hinge on discharge–recharge quantum and its pattern.
The clustering analysis results show that the groundwater observation wells in the study area can be divided into five major characteristics along with the upstream to downstream of Kaoping River, that is, from the mountainous top of the alluvial fan to the estuary have gradual and different characteristics. The result of clustering analysis is also consistent with the lithology distribution, which represents the clustering analysis of groundwater level fluctuation characteristics that can effectively reflect the basic lithology distribution and the age of sedimentary. The apparent thin line of groundwater hydrograph indicated an unconfined aquifer while the thicker line represents a confined aquifer. The regular water level fluctuation in observation wells provides information about aquifer pumping. The identified hydrographs patterns provide newer insights related to the aquifer response to recharge–discharge phenomenon. Types of aquifers and their behaviors were derived from the observed hydrograph patterns. The relative potential of the aquifers can also be assessed from these patterns. The proposed aquifer classification and pumping effect have great potential for applied use in groundwater modeling and management.

Author Contributions

Conceptualization, R.-S.W. and F.H.; Data curation, T.-Y.Y. and K.-C.Y.; Formal analysis, R.-S.W., F.H., Y.-C.L. and K.-C.Y.; Funding acquisition, R.-S.W. and Y.-C.L.; Investigation, F.H. and Y.-C.L.; Methodology, F.H. and Y.-C.L.; Project administration, R.-S.W.; Resources, R.-S.W. and Y.-C.L.; Software, F.H., T.-Y.Y. and K.-C.Y.; Supervision, R.-S.W.; Validation, R.-S.W., F.H. and Y.-C.L.; Visualization, R.-S.W.; Writing—original draft, F.H.; Writing—review and editing, R.-S.W. and Y.-C.L. All authors have read and agreed to the published version of the manuscript.

Funding

This research is conducted with the financial support of the Ministry of Science and Technology Taiwan under Grant no. MOST-108-2621-M-008-001 and MOST 109-2636-E-008-008.

Institutional Review Board Statement

Not applicable.

Informed Consent Statement

Not applicable.

Data Availability Statement

The data reported in the results can be found by a special request to the corresponding author.

Acknowledgments

The authors are grateful to various authorities and agencies, such as Central Geological Survey (CGS) MOEA, Water Resource Agency (WRA), and Central Weather Bureau (CWB) for providing valuable data.

Conflicts of Interest

The authors declare no conflict of interest.

References

  1. Shahid, S.; Hazarika, M.K. Groundwater drought in the northwestern districts of Bangladesh. Water Resour. Manag. 2009, 24, 1989–2006. [Google Scholar] [CrossRef]
  2. Raj, P. Classification and interpretation of piezometer well hydrographs in parts of southeaster peninsular India. Environ. Geol. 2004, 46, 808–819. [Google Scholar] [CrossRef]
  3. Mukherjee, A.; Gupta, A.; Ray, R.K.; Tewari, D. Aquifer response to recharge–discharge phenomenon: Inference from well hydrographs for genetic classification. Appl. Water Sci. 2017, 7, 801–812. [Google Scholar] [CrossRef] [Green Version]
  4. Li, F.; Feng, P.; Zhang, W.; Zhang, T. An integrated groundwater management mode based on control indexes of groundwater quantity and level. Water Resour. Manag. 2013, 27, 3273–3292. [Google Scholar] [CrossRef]
  5. Wang, G.; Zhao, W. The spatio-temporal variability of groundwater depth in a typical desert-oasis ecotone. J. Earth Syst. Sci. 2015, 124, 799–806. [Google Scholar] [CrossRef] [Green Version]
  6. Ebrahimi, H.; Ghazavi, R.; Karimi, H. Estimation of groundwater recharge from the rainfall and irrigation in an arid environment using inverse modeling approach and RS. Water Resour. Manag. 2016, 30, 1939–1951. [Google Scholar] [CrossRef]
  7. Shahmohammadi-Kalalagh, S.; Taran, F.; Nasiri, H. Investigating groundwater level fluctuations via analyzing groundwater hydrograph: A case study of Naqadeh plain in north-west of Iran. Sustain. Water Resour. Manag. 2020, 6, 1–11. [Google Scholar] [CrossRef]
  8. Almedeij, J.; Al-Ruwaih, F. Periodic behavior of groundwater level fluctuations in residential areas. J. Hydrol. 2006, 328, 677–684. [Google Scholar] [CrossRef]
  9. Theodossiou, N.; Latinopoulos, P. Evaluation and optimisation of groundwater observation networks using the Kriging methodology. Environ. Modell. Softw. 2006, 21, 991–1000. [Google Scholar] [CrossRef]
  10. Bacani, A.; Posavec, D.; Parlov, J. Groundwater quantity in the Zagreb aquifer. In Proceedings of the XXXVIII IAH congress groundwater quality sustainability, Krakow, Poland, 12–17 September 2010; pp. 87–92. [Google Scholar]
  11. Lemieux, J.M.; Sudicky, E.A.; Peltier, W.R.; Tarasov, L. Dynamics of groundwater recharge and seepage over the Canadian landscape during the Wisconsinian glaciation. J. Geophys. Res. Earth 2008, 113. [Google Scholar] [CrossRef] [Green Version]
  12. Luczaj, J.; Masarik, K. Groundwater quantity and quality issues in a water-rich region: Examples from Wisconsin, USA. Resources 2015, 4, 323–357. [Google Scholar] [CrossRef]
  13. Taylor, C.J.; Alley, W.M. Ground-Water-Level Monitoring and the Importance of Long-Term Water-Level Data; Circular 1217; U.S. Geological Survey: Denver, CO, USA, 2001; p. 74.
  14. Thakur, G.S.; Thomas, T. Analysis of groundwater levels for detection of trend in Sagar district, Madhya Pradesh. J. Geol. Soc. India 2011, 77, 303–308. [Google Scholar] [CrossRef] [Green Version]
  15. Gorgoglione, A.; Gioia, A.; Iacobellis, V. A framework for assessing modeling performance and effects of rainfall-catchment-drainage characteristics on nutrient urban runoff in poorly gauged watersheds. Sustainability 2019, 11, 4933. [Google Scholar] [CrossRef] [Green Version]
  16. Ouarda, T.B.M.J.; Charron, C.; Hundecha, Y.; St-Hilaire, A.; Chebana, F. Introduction of the GAM model for regional low-flow frequency analysis at ungauged basins and comparison with commonly used approaches. Environ. Model. Softw. 2018, 109, 256–271. [Google Scholar] [CrossRef]
  17. Wu, B.; Wang, G.; Wang, Z.; Liu, C.; Ma, J. Integrated hydrologic and hydrodynamic modeling to assess water exchange in a data-scarce reservoir. J. Hydrol. 2017, 555, 15–30. [Google Scholar] [CrossRef]
  18. Chai, Y.; Xiao, C.; Li, M.; Liang, X. Hydrogeochemical characteristics and groundwater quality evaluation based on multivariate statistical analysis. Water 2020, 12, 2792. [Google Scholar] [CrossRef]
  19. Liu, G.; Ma, F.; Liu, G.; Guo, J.; Duan, X.; Gu, H. Quantification of water sources in a coastal gold mine through an end-member mixing analysis combining multivariate statistical methods. Water 2020, 12, 580. [Google Scholar] [CrossRef] [Green Version]
  20. Yidana, S.M. Groundwater classification using multivariate statistical methods: Southern Ghana. J. Afr. Earth Sci. 2010, 57, 455–469. [Google Scholar] [CrossRef]
  21. Tiri, A.; Lahbari, N.; Boudoukha, A. Assessment of the quality of water by hierarchical cluster and variance analyses of the Koudiat Medouar Watershed, East Algeria. Appl. Water Sci. 2017, 7, 4197–4206. [Google Scholar] [CrossRef] [Green Version]
  22. Rahbar, A.; Vadiati, M.; Talkhabi, M.; Nadiri, A.A.; Nakhaei, M.; Rahimian, M. A hydrogeochemical analysis of groundwater using hierarchical clustering analysis and fuzzy C-mean clustering methods in Arak plain, Iran. Environ. Earth Sci. 2020, 79, 342. [Google Scholar] [CrossRef]
  23. Hussain, F.; Wu, R.-S.; Yu, K.-C. Application of Physically Based Semi-Distributed HEC-HMS Model for Flow Simulation in Tributary Catchments of Kaohsiung Area Taiwan. J. Mar. Sci. Technol. 2021, 29, 42–62. [Google Scholar] [CrossRef]
  24. Hussain, F.; Yu, K.-C.; Wu, R.-S. Estimation of hydrogeological parameters using physically based hydrological modelling and lithology data in ungauged creek catchments of southern Taiwan. Hydrol. Sci. J. 2021, 66, 703–728. [Google Scholar] [CrossRef]
  25. Hussain, F. A systematic review on integrated surface–subsurface modeling using watershed WASH123D model. Model. Earth Syst. Environ. 2021. [Google Scholar] [CrossRef]
  26. Halder, S.; Roy, M.B.; Roy, P.K. Analysis of groundwater level trend and groundwater drought using standard groundwater level index: A case study of an eastern river basin of West Bengal, India. SN Appl. Sci. 2020, 2, 507. [Google Scholar] [CrossRef] [Green Version]
  27. Barzegar, R.; Moghaddam, A.A.; Tziritis, E.; Fakhri, M.S.; Soltani, S. Identification of hydrogeochemical processes and pollution sources of groundwater resources in the Marand plain, northwest of Iran. Environ. Earth Sci. 2017, 76, 297. [Google Scholar] [CrossRef]
  28. Weeks, E.P. Barometric fluctuations in wells tapping deep unconfined aquifers. Water Resour. Res. 1979, 15, 1167–1176. [Google Scholar] [CrossRef]
  29. Rojstaczer, S. Determination of fluid flow properties of the response of water level in well to atmospheric loading. Water Resour. Res. 1988, 24, 1927–1938. [Google Scholar] [CrossRef] [Green Version]
  30. Posavec, K.; Bacani, A.; Nakic, Z. A visual basic spreadsheet macro for recession curve analysis. Groundwater 2006, 44, 764–767. [Google Scholar] [CrossRef] [PubMed]
  31. Sujono, J.; Shikasho, S.; Hiramatsu, K. A comparison of techniques for hydrograph recession analysis. Hydrol. Process. 2004, 18, 403–413. [Google Scholar] [CrossRef]
  32. Ferdowsian, R.; Pannell, D.J.; McCarron, C.; Ryder, A.T.; Crossing, L. Explaining groundwater hydrographs: Separating atypical rainfall events from time trends. Aust. J. Soil Res. 2001, 39, 861–876. [Google Scholar] [CrossRef] [Green Version]
  33. Gailuma, A.; Vitola, I.; Lauva, A.D.; Vircavs, V.; Veinbergs, A.; Dimanta, Z. Recession curve analysis for groundwater levels: Case study in Latvia. In Proceedings of the EGU General Assembly 2012, Geophysical Research Abstracts, Vienna, Austria, 22–27 April 2012; Volume 14. EGU2012-713. [Google Scholar]
  34. Yu, H.-L.; Lin, Y.-C. Analysis of space-time non-stationary patterns of rainfall-groundwater interactions by integrating empirical orthogonal function and cross wavelet transform methods. J. Hydrol. 2015, 525, 585–597. [Google Scholar] [CrossRef]
  35. Lewis, J.; Liljedahl, B. Groundwater surveys in Developing Regions. Air Soil Water Res. 2020, 3. [Google Scholar] [CrossRef] [Green Version]
Figure 1. Description of study area with outcrop formation, locations of observation wells and Kaoping River indicated by blue line in the map [25].
Water 13 02535 g001
Figure 2. The geological cross-section along the black line is in Figure 1.
Water 13 02535 g002
Figure 3. A typical groundwater hydrograph of Qishan (W5) observation well in aquifer 1.
Water 13 02535 g003
Figure 4. Identical annual curves of true hydrograph of successive years from two locations (a) V shape patterns at Ji-Yang (W3); (b) U shape patterns at Qi-Shan (W5).
Water 13 02535 g004
Figure 5. The slope analysis of rising limb (recharge) and recession limb (discharge) of groundwater level hydrograph of each observation well located inside study area for the 2001–2019 period. The blue and grey color ascending bars with the same linear trend line colors represent recharge status in aquifer-1 and aquifer-2, respectively, while orange and gold color descending bars with the lines of the same color represents discharge status in aquifer-1 and aquifer-2, respectively. Meinong, Jiyang and Jiyang Gongzhou stations showed the same kind of patterns in aquifer-1. In Qishan, Zhongzhou, Tuku and Ligang stations indicating some kind of balance between recharge and discharge rate. Xipu, Dashu and Jiuqu sites indicating different patterns of recharge and discharge rate in both aquifers. At Yongfung and Chaoliao sites, the recharge and discharge rates are de-creasing in both aquifers.
Water 13 02535 g005aWater 13 02535 g005b
Figure 6. The dendrogram of hierarchical clustering analysis. (a) Aquifer 1 (b) Aquifer 2.
Water 13 02535 g006
Figure 7. The spatial distribution of hierarchical clustering analysis.
Water 13 02535 g007
Figure 8. The original time series groundwater hydrograph of different groups of aquifer 1 observation wells based on the classification of Hierarchical Clustering Analysis. There are five clusters (a) Cluster 1 consist of Juiqu, Yongfang, Chaoliao and Zhaoming observation wells (b) Cluster 2 comprised of Xipu and Dashu (c) Cluster 3 contains Qishan, Zhongzhou, Ligang and Tuku (d) Cluster 4 covers Meinong, Jiyang and Jiyang Gongzhou while (e) Cluster 5 consist of Xinwei only.
Water 13 02535 g008aWater 13 02535 g008b
Figure 9. Confined aquifers verification with true hydrograph line thickness and lithology data. Confined aquifer nature is in Meinong, Jiuqu, Yongfang and Zhaoming observation wells. The black dotted line represents the bottom of layer 1 (shallow aquifer) while the blue line is the water table. CMZ represent clay, mud and silt; vfS and fS mean very fine sand and fine sand; mS, cS, vcS indicate medium sand, coarse sand and very coarse sand while fG, mG, cG, vcG are fine gravels, medium gravels, coarse gravels and very coarse gravels.
Water 13 02535 g009
Figure 10. Effects of pumping and change in pressure head on groundwater level fluctuations in unconfined and confined aquifers. It was analyzed that observation wells Yong Fang (W12) and Zhao Ming (W14) are producing natural fluctuation due to pressure head change from unconfined to confined aquifer because fluctuations are irregular in size and arrangement. The pumping effect only can be observed at Mei Nong (W2) site where pumping produces the top smooth line and drop-in level from that line. Generally, when talking about Jiu Qu (W11), the patterns are mixed with pumping and pressure head difference but pumping effects are more as compared to pressure head variation from unconfined to confined. This pumping and non-pumping scenario harvest a typical pattern of groundwater hydrograph that differs significantly from natural fluctuation due to pressure head change. Thus, the nature of the aquifer (confined or unconfined) can be predicted based on the apparent line thickness of the groundwater hydrograph.
Water 13 02535 g010
Table 1. Observation wells depth and aquifers position in study area.
IDW1W2W3W4W5W6W7W8W9W10W11W12W13W14
NameXin WeiMei NongJi YangJi Yang-GQi ShanZhong ZhouTu KouLi GangXi PuDa ShuJiu QuYong FangChao LiaoZhao Ming
Total depth (m)87.476.8218.240.496.9206.553.5116.686173.3184.2145138
Aquifer 1 position (m)12–3330–3690–1200–08–2060–780–036–6615–3318–3699–1146–2122–34
Aquifer 2 position (m)63–8152–70192–21662–92174–183144–17468–80141–153186–198110–140108–132
Table 2. Correlation of observation wells with each other in the study area.
W1W2W3W4W5W6W7W8W9W10W11W12W13W14
W11
W20.361
W30.480.741
W40.460.721.001
W50.710.590.870.871
W60.580.740.950.940.881
W70.540.730.920.920.870.921
W80.340.550.520.540.540.570.771
W90.350.570.830.830.770.800.880.731
W100.450.620.750.740.720.760.840.790.901
W110.050.010.240.250.310.160.410.580.580.541
W120.300.300.590.600.580.580.630.570.780.780.661
W130.460.550.740.730.750.650.810.710.870.850.670.691
W140.410.370.680.680.720.590.710.450.750.650.560.540.871
Publisher’s Note: MDPI stays neutral with regard to jurisdictional claims in published maps and institutional affiliations.

