
Comparison of Seasonal Flow Rate Change Indices Downstream of Three Types of Dams in Southern Quebec (Canada)


Department of Environmental Sciences and the Research Centre for Watershed-Aquatic Ecosystem Interactions (RIVE, UQTR), University of Quebec at Trois-Rivières, 3351 Boulevard des Forges, Trois-Rivières, QC G9A 5H7, Canada
*
Author to whom correspondence should be addressed.
Water 2021, 13(18), 2555; https://doi.org/10.3390/w13182555
Submission received: 14 June 2021
/
Revised: 12 September 2021
/
Accepted: 14 September 2021
/
Published: 17 September 2021
(This article belongs to the Special Issue Impacts of Climate Change and Anthropogenic Activities on the Spatio-Temporal Variability of River Flow)
Abstract
:The objective of this study is to use two hydrological indices (coefficients of variation and immoderation) to analyze the impacts of dam management methods on seasonal daily flow rate change downstream of three dams: Manouane (diversion-type management method), Ouareau (natural-type management method) and Matawin (inversion-type management method). The results show that this change is far greater downstream of the Matawin dam (characterized by an inversion-type management method) than downstream of the two other dams. Moreover, downstream of the Matawin dam, this daily flow rate change increases significantly over time, while decreasing downstream of the two other dams and in natural rivers. Lastly, this change is better correlated with climate downstream of the Ouareau dam than downstream of the two other dams. It is positively correlated with winter and spring temperatures as well as summer and fall rain. Contrary commonly accepted hypothesis, this study shows that the impacts of dams generally result in an increase of the seasonal flow rate change in Quebec.
1. Introduction
According to the ecological concept of natural flow [1,2], river flow can be broken down into five core characteristics: magnitude, duration, timing, frequency and variability. Of these five characteristics, variability is the least studied in both aquatic ecology and hydrology. However, in natural rivers, both ecologically and geomorphologically speaking, this characteristic significantly influences the functioning and evolution of river ecosystems, just as much as the other four characteristics. As has already been mentioned by Assani et al. [3], macrophytes and riparian vegetation are influenced by flow rate change. It is same with habitat volumes and the availability of food for aquatic and semi-aquatic fauna. It also affects the exchanges between the low-flow channel and adjacent alluvial plain [4]. Furthermore, the dynamic and evolution of banks and channels also are influenced by flow rate change (e.g., [5]). Finally, it affects the permanent or intermittent nature of flows (e.g., [6,7]).
In many countries, there are several studies already devoted to impacts of dams on the flow rate change at hourly, daily, monthly, seasonal and intra-annual scales [1,2,5,8,9,10,11,12]. Downstream, the impacts of dams are generally known to result in a considerable decrease in flow rate change annually due to lower maximum and higher minimum flow. The major ecological consequence of this decrease in flow rate change is the loss of biodiversity, leading to a homogenization of wildlife, especially downstream of dams [2,13]. By contrast, daily flow generally changes quite significantly downstream of dams (e.g., [14,15]). This sharp fluctuation can have a number of ecological impacts, including washout of riparian plants and failed seedling establishment [14,16,17,18,19].
In Quebec, hundreds of hydroelectric dams have been built to enhance the natural resources of the Province. Four different methods for managing the regulated hydrological regimes of dams were characterized according to their impacts on monthly flow (e.g., [20,21,22,23]): inversion, natural, homogenization and diversion. The inversion-type regulated hydrological regime is characterized by the occurrence of maximum monthly flow in winter and minimum monthly flow in spring during snowmelt. This hydrological cycle is completely opposite to that observed in natural rivers. The natural-type regulated hydrological regime is characterized by the occurrence of maximum monthly flow in spring and minimum monthly flow in winter or summer, similar to as in natural rivers. This management method differs from natural rivers by the decrease in maximum monthly flow and slight increase in minimum monthly flow. The homogenization-type regulated hydrological regime is characterized by monthly flow that remains almost constant throughout the year. Intermonthly flow change therefore becomes nearly non-existent downstream of dams. Lastly, the final regulated hydrological regime is characterized by a significant decrease in monthly minimum flow, with monthly maximum flow almost unchanged. This hydrological regime is observed only downstream of diversion dams, that is, dams intended to transfer water from one watershed to another. However, no detailed yet study exists on the impacts of these four management methods on the flow rate change. The first objective of this study is to fill this gap. It is based on this following assumption: the rate change of seasonal-scales flows downstream of dams strongly depends on their management methods. To verify this hypothesis, the averages of flow rate change indices of seasonal daily flows will be compared by means of several statistical tests.
Moreover, the temporal variability of flow characteristics downstream of dams is affected by two types of factors: climate factors, on the one hand, and man-made factors related to dam management methods, on the other. The second objective of this study is to compare the stationarity of hydrological series of flow rate change indices using the Lombard method. The hypothesis underlying this objective is to verify whether this stationarity depends on the mode of dam management. It is important to specify that this objective aims to verify whether inter-annual variability of flow rate change indices is synchronous in pristine (stations) rivers and in regulated rivers (from downstream from dams) according to dam management mode. Finally, the third objective is to determine the influence of dam management methods on the relationship between flow rate change and climate (temperature and precipitation). It will be based on the correlation analysis between the flow rate change indices and the two climatic variables. In the context of current climate change, this correlation is useful because it will make it possible to determine whether the flow rate change indices in natural rivers and downstream from dams are correlated with the same climatic variables in order to be able to predict their evolution in the next decades depending on that the temperature and precipitation. This objective does not aim to explain how temperatures and precipitations explain the inter-daily and inter-seasonal variability of flow rate change indices, but how the dam management mode influences the relationship between these indices and these two climatic variables.
2. Materials and Methods
2.1. Watersheds and Data Sources
The choice of watersheds was dictated by the following two criteria:
- -
- Type of dam management method or type of regulated hydrological regime. Three management methods were selected for this study: inversion, natural and diversion. The homogenization management method was not analyzed due to the absence of data measured in a natural river and downstream of a dam.
- -
- The existence of continuous flow measurements in natural rivers and downstream of a dam over a longer period of time (at least 10 years).
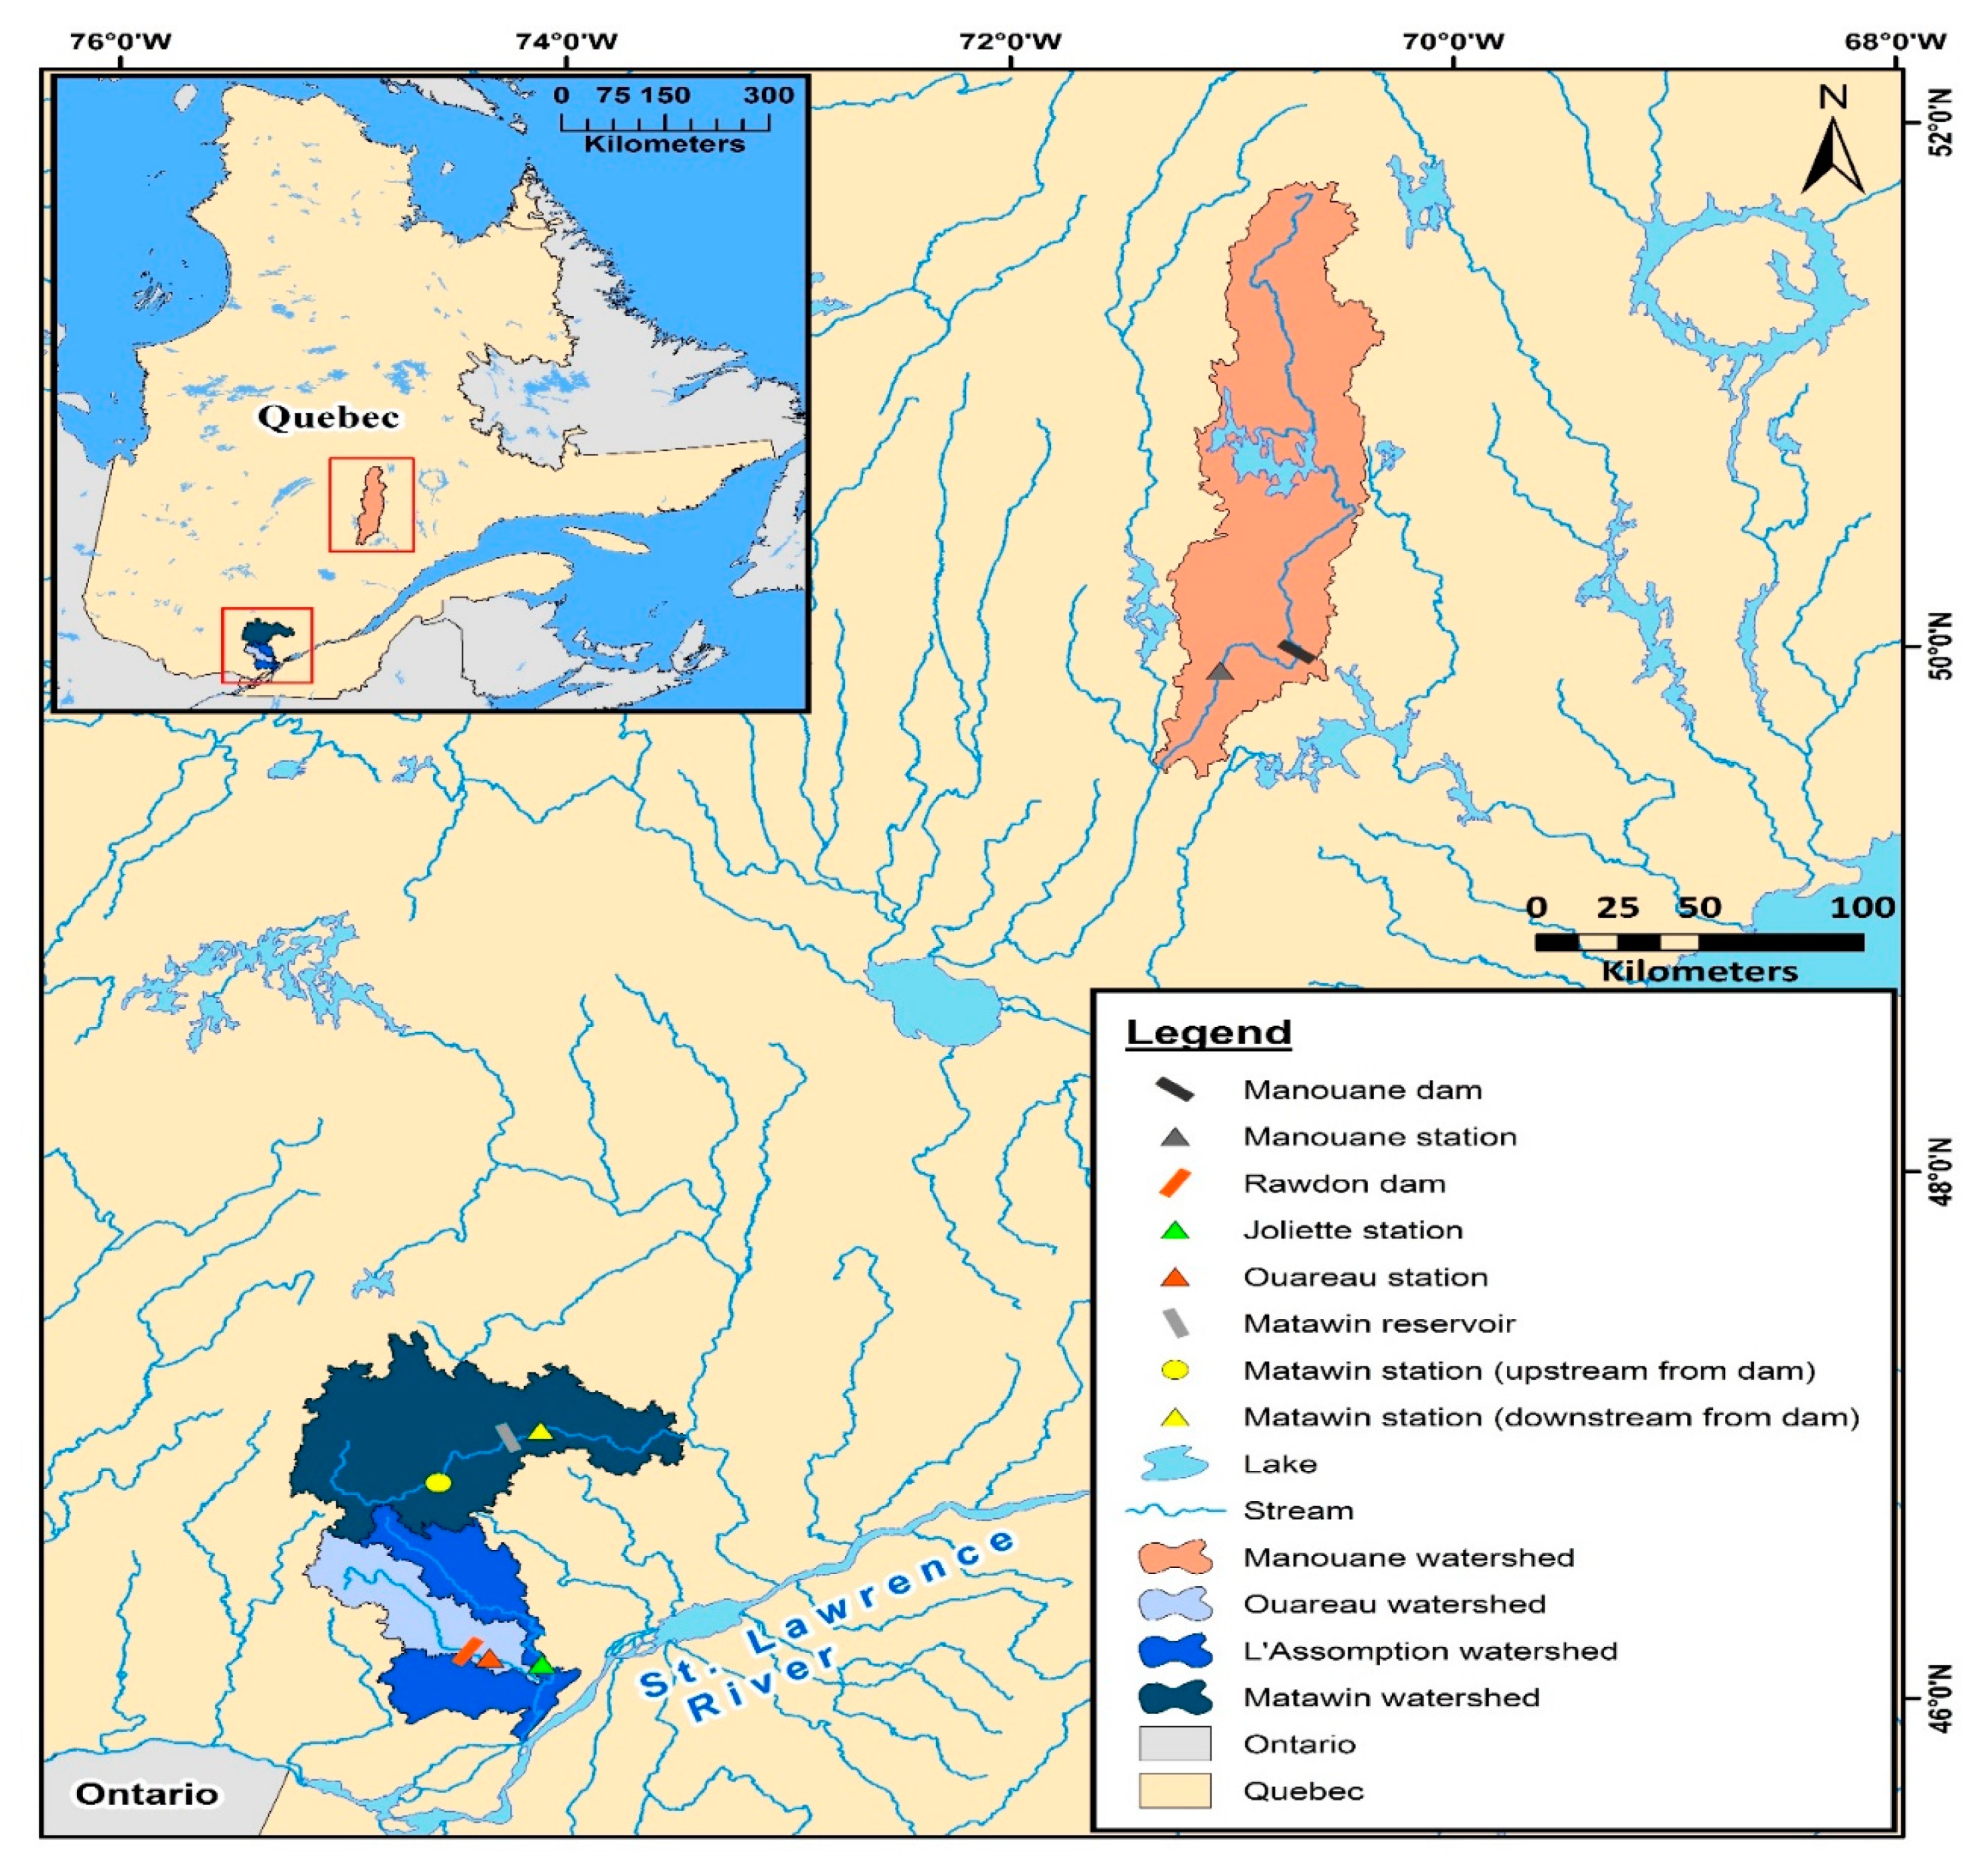
Three watersheds were selected based on these criteria (Figure 1). The first watershed is the L’Assomption River watershed. Two-thirds of this watershed lie in the Canadian Shield, whereas one-third lies in the Saint Lawrence Lowlands. In natural conditions, flow is measured at the Joliette station (1340 km2) located in the Saint Lawrence Lowlands. In the L’Assomption watershed, two dams were built on its main tributary, the Ouareau River (Figure 1). For this study, we selected the first dam (Rawdon dam or generating station), whose primary purpose is to support low flows from the Ouareau and L’Assomption rivers for recreational and tourism activities and to supply homes with hydroelectric power. This concrete dam was built in 1913. Its height and total holding capacity are 14.6 m and 5,976,417 m3, respectively. It drains a total surface area of 1259 km2. This dam created a natural-type regulated hydrological regime. This type of regime is characterized by the occurrence of maximum monthly mean flow in spring during snowmelt and minimum monthly mean flow in winter. This annual hydrological cycle is comparable to that observed in natural rivers. The second watershed is the Matawin River watershed, adjacent to the first (Figure 1). It lies entirely in the Canadian Shield. The Matawin River is the main tributary of the Saint-Maurice River. In 1930, a reservoir dam was built primarily to supply water to hydroelectric power plants on the Saint-Maurice River in winter, at a time when river flow is lowest due to the storage of precipitation as snow on slopes. It does not have a hydroelectric power plant. It is a large concrete dam with a height of 25 m and a total holding capacity of 946,000,000 m3. It drains a surface area of 4070 km2. It created an inversion-type regulated hydrological regime. This regime is characterized by the occurrence of maximum monthly mean flow in winter and minimum monthly mean flow in spring during snowmelt. Flow under natural conditions is measured continuously at the Saint-Michel-Des-Saints station (1390 km2) located upstream of the Matawin dam. It does not influence the flow measured at this station ([24]). Lastly, the last watershed selected is the Manouane River watershed (Figure 1). In 2003, a dam (Manouane dam) was built that diverts water from this river to the Betsiamites River in order to increase the capacity of the Pipmuacan reservoir, which supplies the Bersimis-1 and Bersimis-2 hydroelectric power plants. The Manouane dam created a diversion-type regulated hydrological regime characterized by the occurrence of maximum monthly mean flow in spring and minimum monthly mean flow in winter. The dam’s height and total holding capacity are 9.5 m and 70,000,000 m3, respectively. It drains a 4600 km2 watershed. Continuous flow measurements have been available since 1979, that is, before and after the dam’s construction.
Flow data were taken from the website of the Centre d’expertise hydrique du Québec of the Quebec Ministère de l’Environnement (https://www.cehq.gouv.qc.ca/, accessed on 30 May 2017). For the Matawin River, flow data downstream of the dam were extracted from the Environment Canada CD-ROM until 1994. After that date, flow data were kindly provided by Hydro-Québec, the operator of this structure. Precipitation and temperature data measured in the three watersheds were taken from the Environment Canada website (https://www.ec.gc.ca/, accessed on 24 June 2017). In the watershed of the L’Assomption and Matawin rivers, temperature and precipitation are measured at the Joliette and Saint-Michel-Des-Saints stations, respectively. For the Manouane River watershed, these data are measured at the Bagotville station (a military airport), which is the reference station in the region.
2.2. Definition of Hydroclimatic Variables
To fully characterize seasonal flow rate change with respect to hydrological variables, two indices suggested by Assani et al. [3] were used. The first index is the coefficient of variation (CV), which is the ratio of standard deviation to the mean calculated over a daily flow series. It was expressed as a percentage. This index measures interdaily fluctuations in flow in a given season. The higher the CV value, the greater the day-to-day fluctuations in flow. The second index is the coefficient of immoderation (CI), which is the ratio of the highest daily flow (maximum daily flow) to the lowest daily flow (minimum daily flow) measured in a season. The CI index measures the maximum amplitude of changes in daily flow during a season. The higher the CI value, the greater the difference between the maximum daily flow and the minimum daily flow in a given season. The two indices were calculated using daily flow for each of the following four seasons: winter (January to March), spring (April to June), summer (July to September) and fall (October to December).
For climate variables, we compiled the following six series of seasonal daily temperature and precipitation means:
- -
- The series of mean daily maximum temperatures (Tmax);
- -
- The series of mean daily minimum temperatures (Tmin);
- -
- The series of daily mean temperatures (Tme);
- -
- The series of total snowfall (TSF);
- -
- The series of total rainfall (TRF);
- -
- The series of total precipitation (rain and snow, TP).
These series were assembled for each of the four seasons (except for snowfall in summer) over the period from 1930 to 2008.
2.3. Statistical Data Analysis
Statistical analysis was conducted in three steps:
- -
- In the first step, we compared the means of two CV and CI indices calculated in natural rivers and downstream of dams in the three watersheds using the Kruskal-Wallis non-parametric and parametric variance analysis (ANOVA) tests. The purpose of this step is to identify the influence of dam management methods on flow rate change index values.
- -
- The second step consisted in analyzing the temporal variability of these two indices (CI and CV) to compare their stationarity on the basis of dam management methods. We applied the Lombard test to analyze this stationarity [25,26]. The rationale for selecting this test is that it can detect abrupt or gradual breaks in means, in contrast with all other statistical tests used in hydrology. Such as with the other tests, it also helps determine the dates of such breaks. The test has already been widely described in our previous work (e.g., [27]). Given a series of independent observations where Xi is the observation taken at time It is important to assess whether the mean of this series has changed at some unknown time. To this end, one considers as a possible pattern for the mean of these observations the smooth-change model introduced by [25], where the mean of Xi is defined by:
The mean changes gradually from to between the times and . As a special case, one has the usual abrupt-change model when . In order to test formally that the mean of a univariate series is stable, or on the contrary that is follows model (1), one can use the statistical procedure by Lombard [25]. To this end, let denote the rank of among X1, …, Xn and define the rank score of Xi by:
where is Wilcoxon’s score function, while:
Lombard’s test statistic is:
where:
There is a shift in the mean value of this series at the 5% probability when Sn is greater than 0.0403 derived for a series of observations. This value of 0.0403 corresponds to the asymptotic theoretical (critical) value as obtained by Lombard [25]. The absence of autocorrelation is necessary for the validity Lombard’s test (see [25,26]).
The rate of variation R of the mean values before and after shifts detected using the Lombard method was derived using the following formula [27]:
where M1 and M2 are, respectively, the mean values of flow after and before the shift, R being expressed as a percentage. Lastly, in the final step, we correlated the two CI and CV indices with the six climate variables to determine the influence of dam management methods on the relationship between the two hydrological indices and climate variables.
R = (M2 − M1)/M1
- -
- Finally, the last step statistical analysis consisted of analyzing the correlation between the flow rate change indices and the six climatic variables in pristine (stations) rivers and downstream from dams.
3. Results
3.1. Comparison of the Mean Values of Flow Rate Change Indices in Pristine Rivers and Downstream from Dams
A comparison of the means of the two seasonal flow rate change indices in natural rivers and downstream of dams during all four seasons is presented in Table 1 (Manouane River), Table 2 (L’Assomption and Ouareau rivers) and Table 3 (Matawin River). For the Manouane River, characterized by a diversion-type regulated hydrological regime, significant change in the values of the flow rate change indices was observed in the fall (CI and CV index) and spring (CV index) after dam construction. In fall, the flow rate change decreased after dam construction. On the other hand, in spring the value of CV index increased significantly after dam construction (Table 1).
For the L’Assomption and Ouareau rivers, this gap increased significantly downstream of the Rawdon dam on the Ouareau River only in spring (Table 2). By contrast, downstream of the Taureau reservoir on the Matawin River, the values of the two flow rate change indices increased significantly during the four seasons relative to the values calculated upstream of this reservoir. This increase is much larger for the coefficient of immoderation than for the coefficient of variation (Table 3). Therefore, despite increasing the size of the watershed downstream of the reservoir, daily flow change is greater than upstream in all four seasons.
Finally, for the seasonal variation in means of the two flow rate change indices, the same trend was observed in the three watersheds both in natural rivers and downstream of dams. This trend is characterized by very high means in spring, but very low means in winter. Daily flow rate change is therefore much greater in spring during flooding, but much lower in winter during low flow.
3.2. Analysis of the Temporal Variability of Flow Rate Change Indices
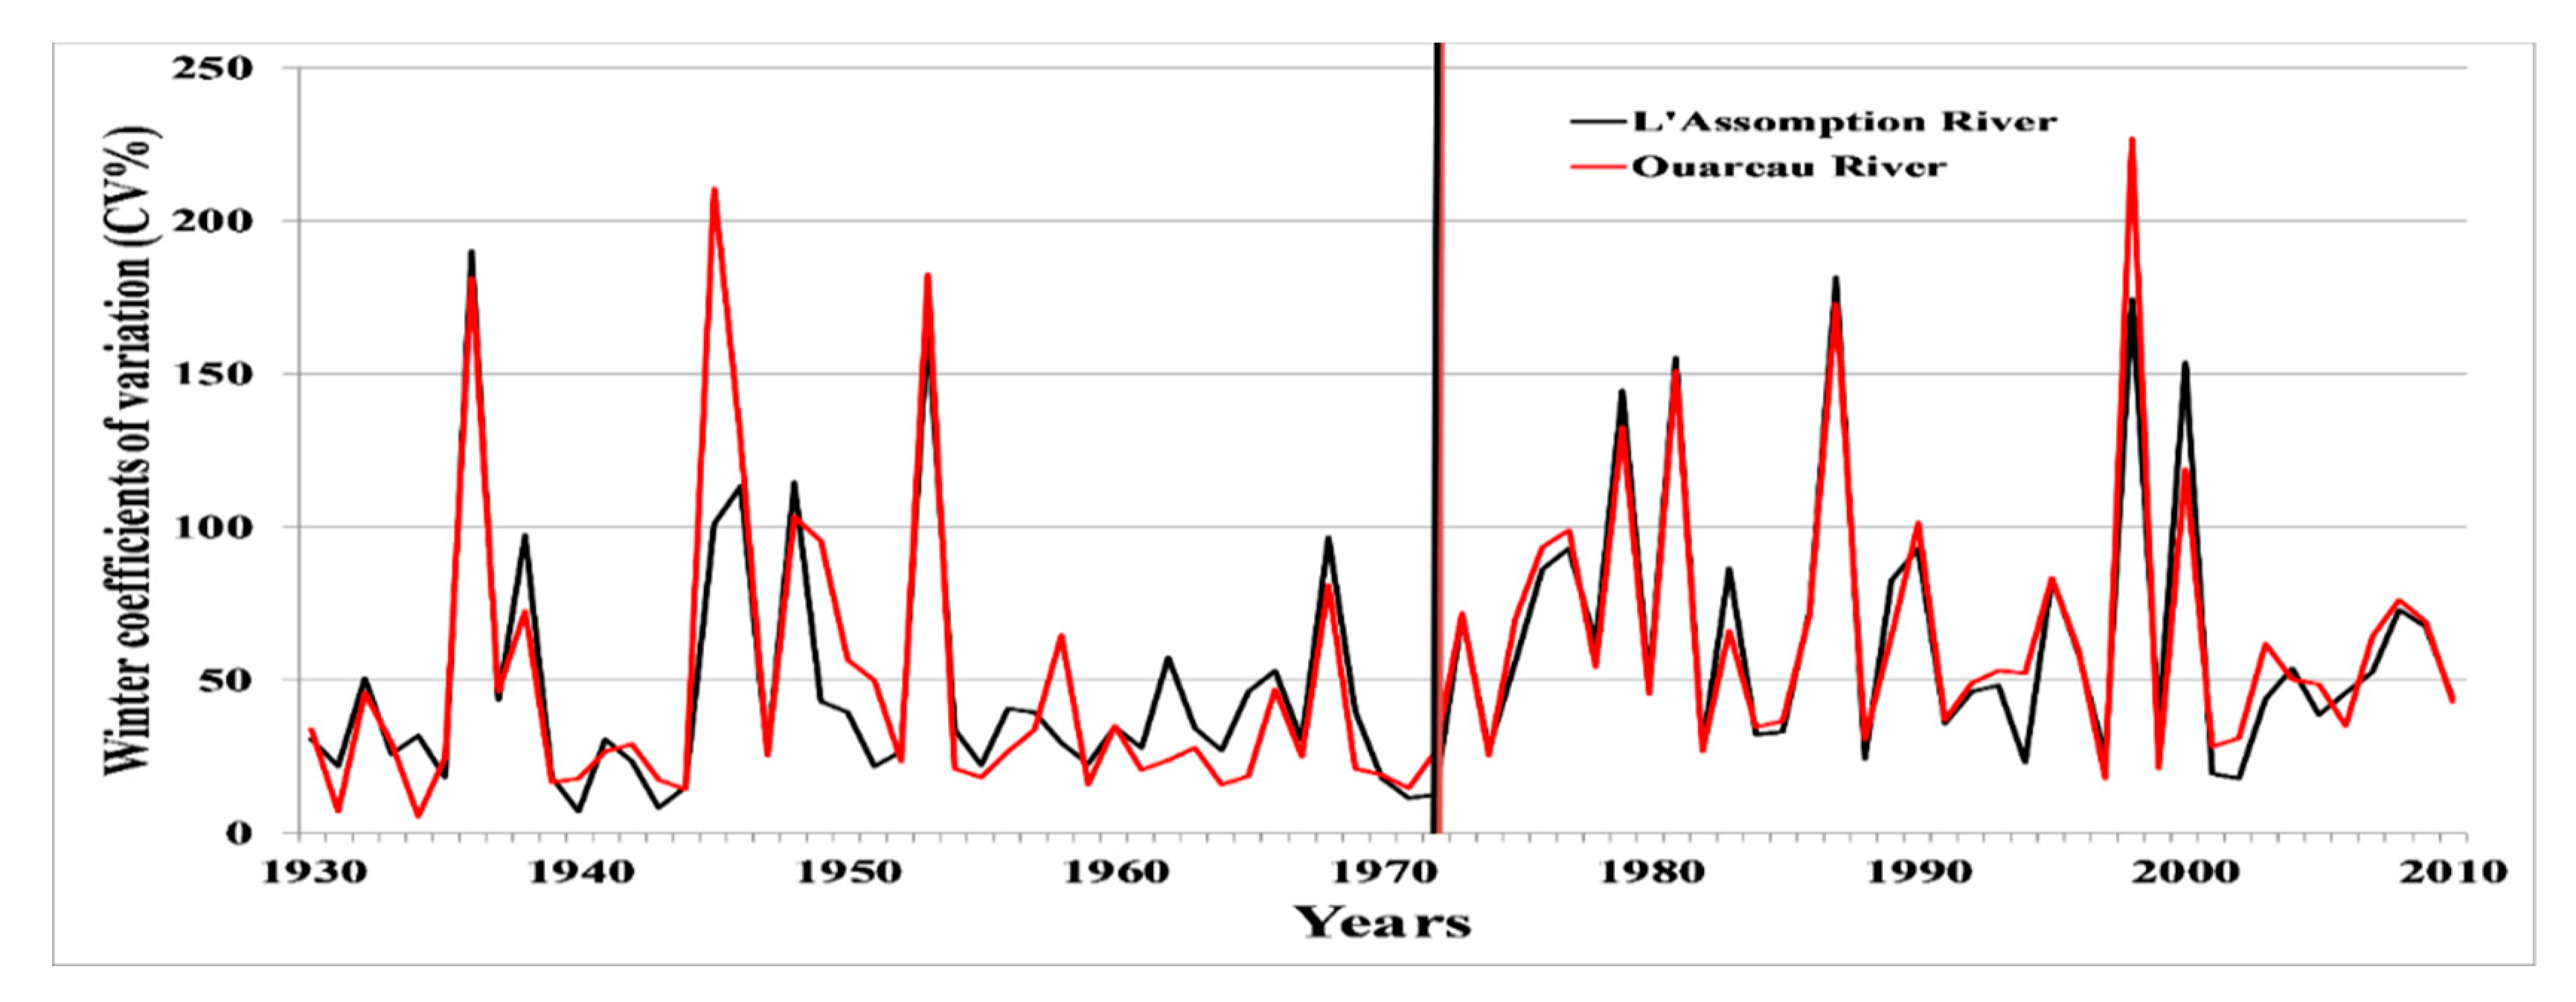
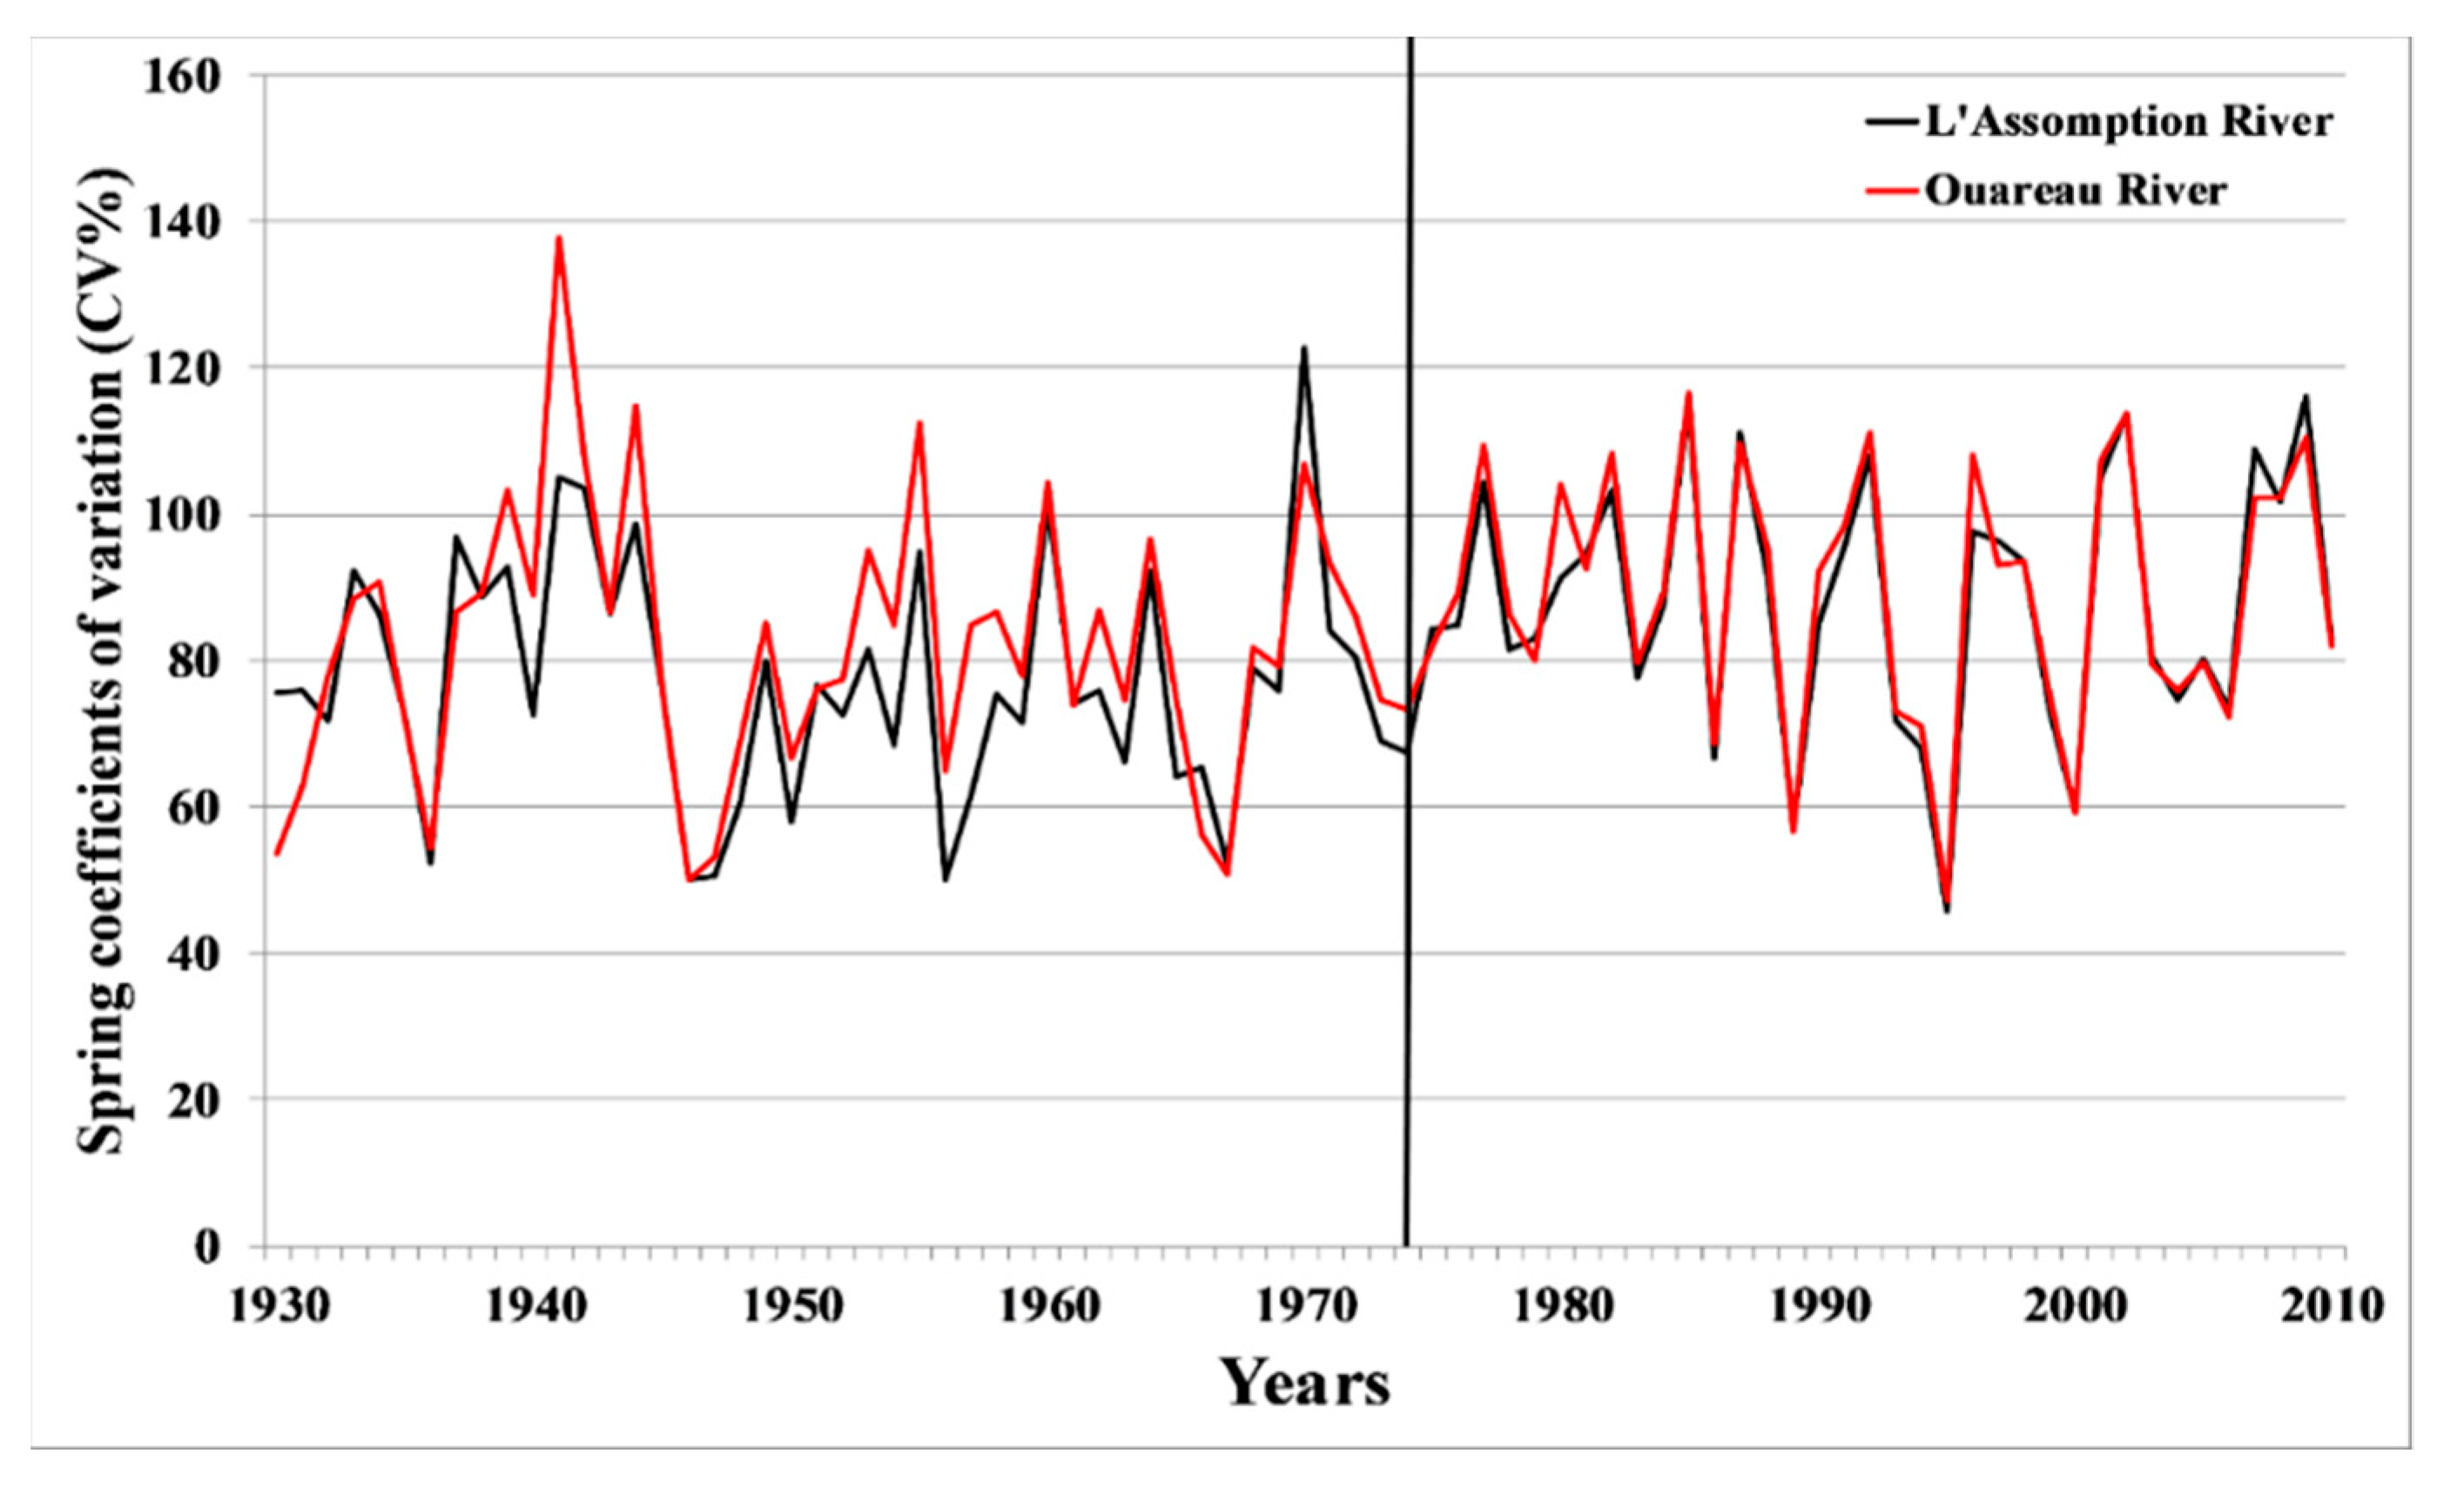
The analysis results obtained through the Lombard test are shown in Table 4 for the L’Assomption and Ouareau rivers and in Table 5 for the Matawin River. Figure 2, Figure 3, Figure 4 and Figure 5 illustrate this temporal variability in winter and spring. This test was not applied to Manouane River data, as the length of the hydrological series before and after dam construction is less than 50. For the first two rivers, the difference between the regulated regime influenced by the dam (Ouareau River) and the natural regime (L’Assomption River) is observed only in spring for both indices. Downstream of the Rawdon dam on the Ouareau River, flow rate change did not change significantly over time, whereas over the same period, it decreased significantly at the Joliette station on the L’Assomption River. In winter and summer, flow rate change decreased significantly over time both downstream of the dam and in the natural river. The rate of this decrease is comparable for both rivers. However, the dates of the breaks in mean are not synchronous, except for the CV index in winter. The date of the break in the mean for this index occurred early downstream of the dam. In contrast, for the CI index, this break date occurred early in the natural river. Lastly, these breaks in mean were all abrupt, with the exception of the CI index in summer downstream of the Rawdon dam. This break was gradual. All these breaks in mean occurred as of the 1970s, with the exception of that of the CI index, which occurred before that decade in winter and spring at the Joliette station. In the fall, no significant change in mean of the series of the two indices was observed in either the natural river or downstream of the dam.
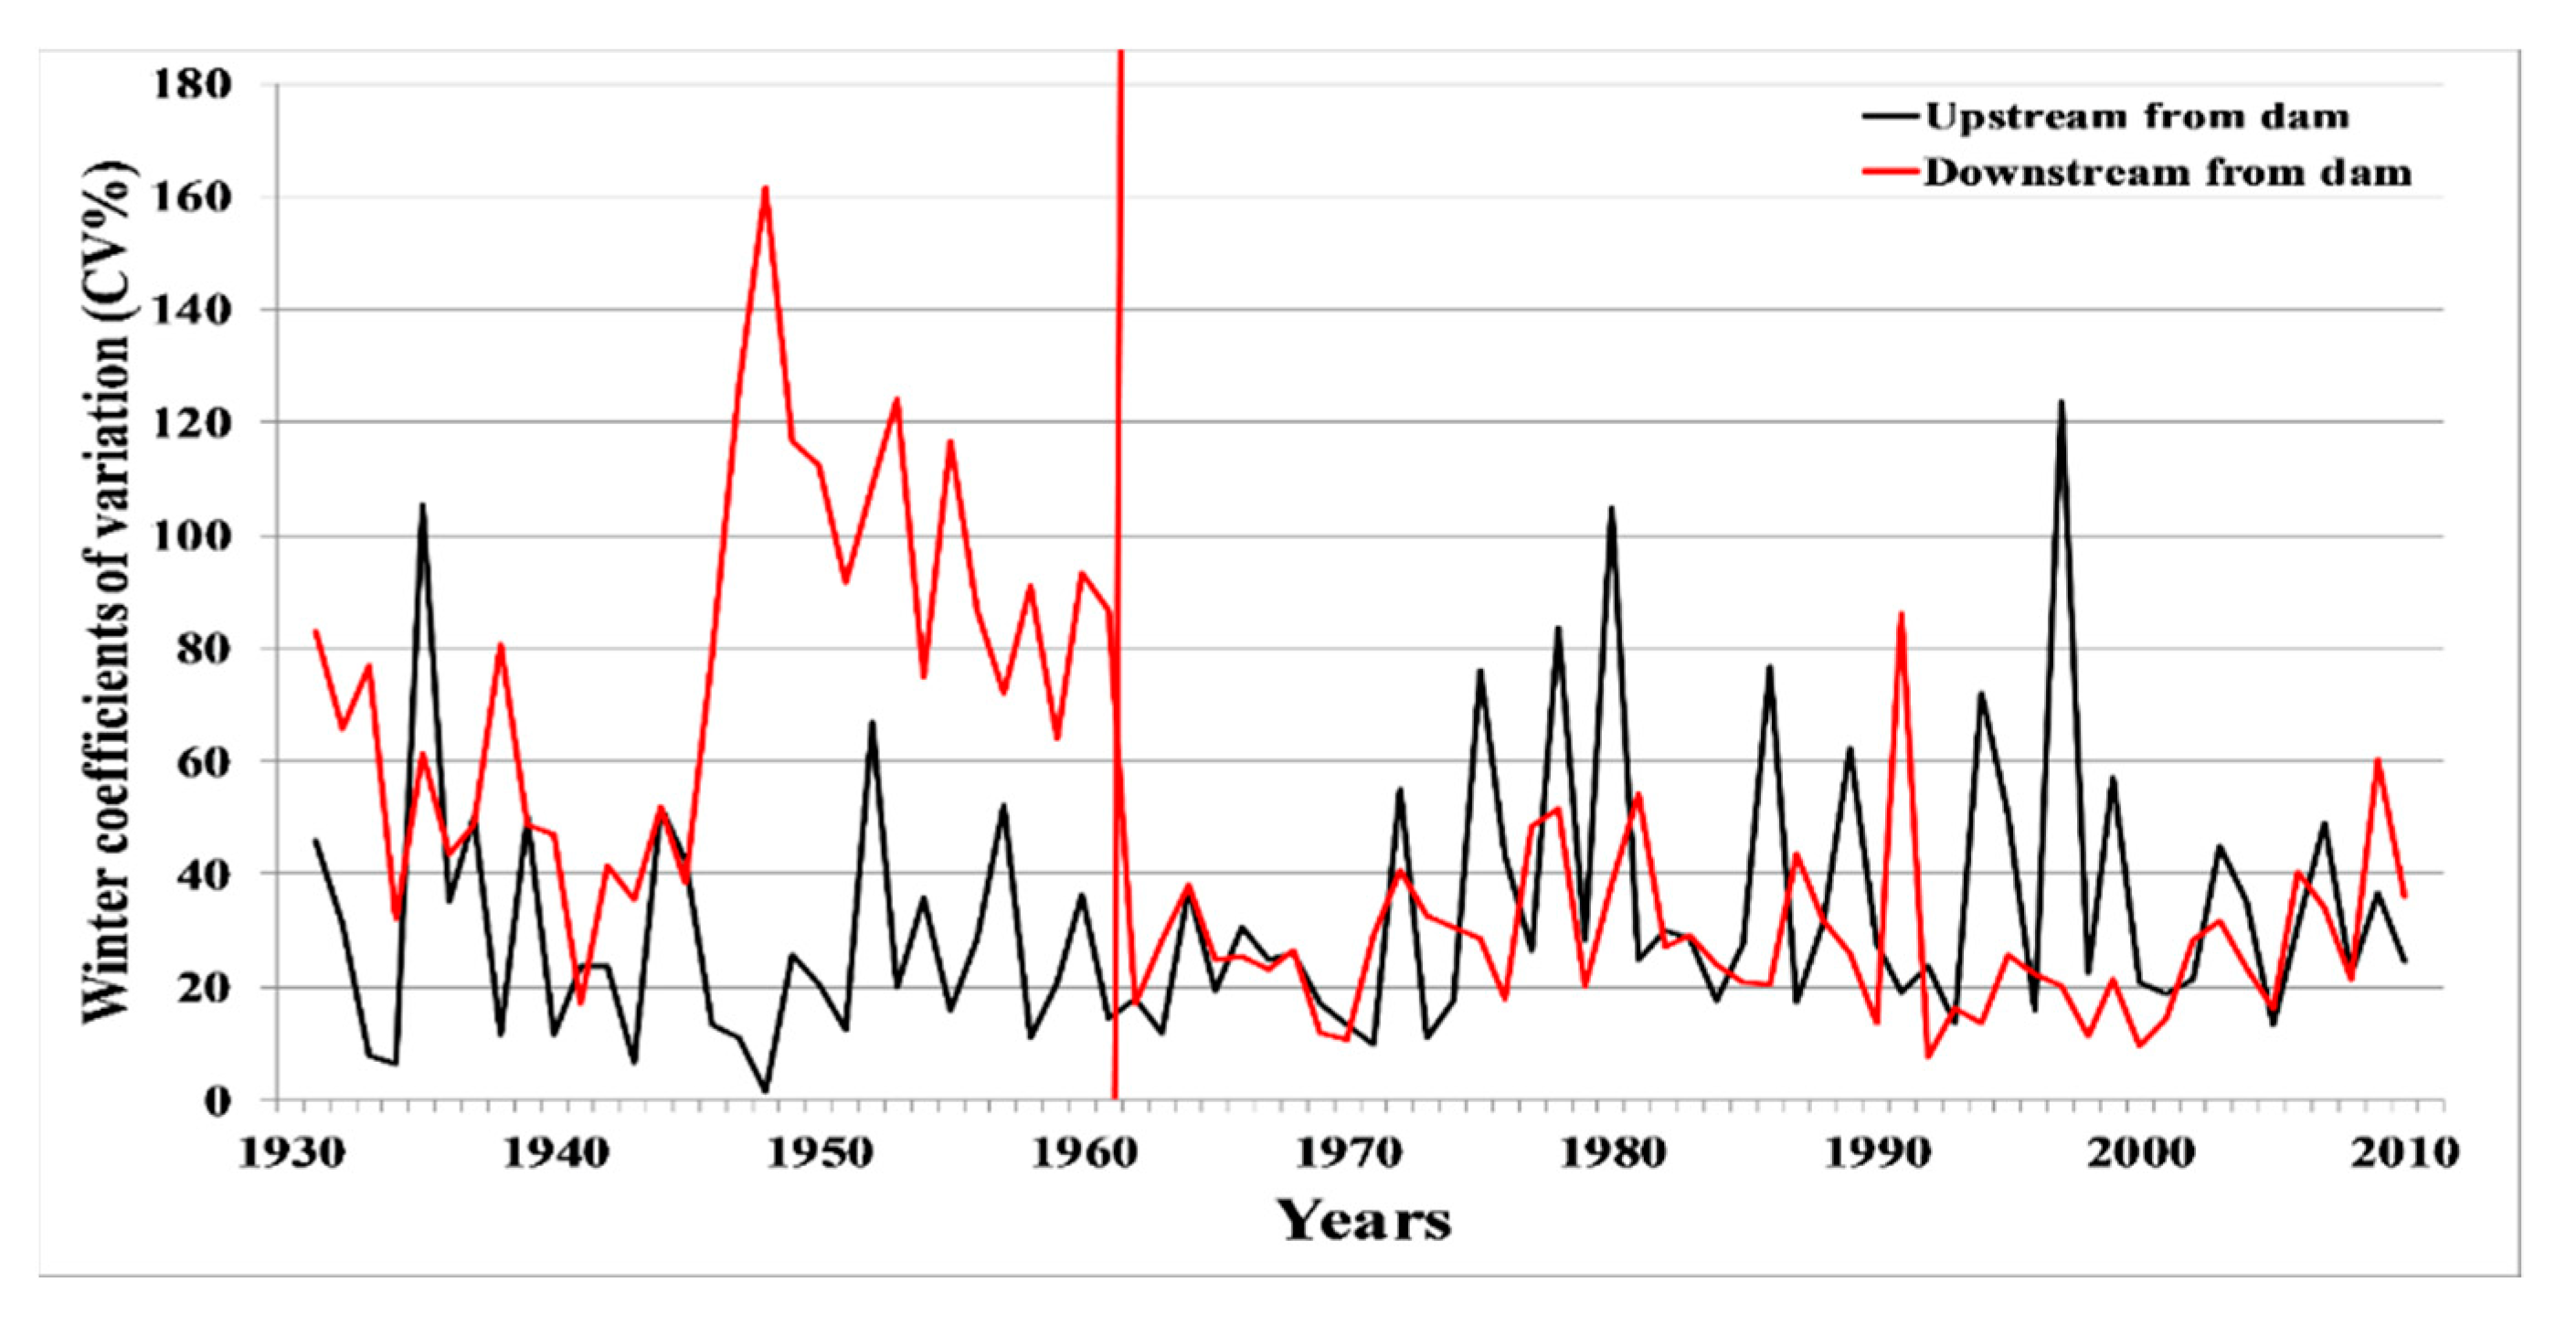
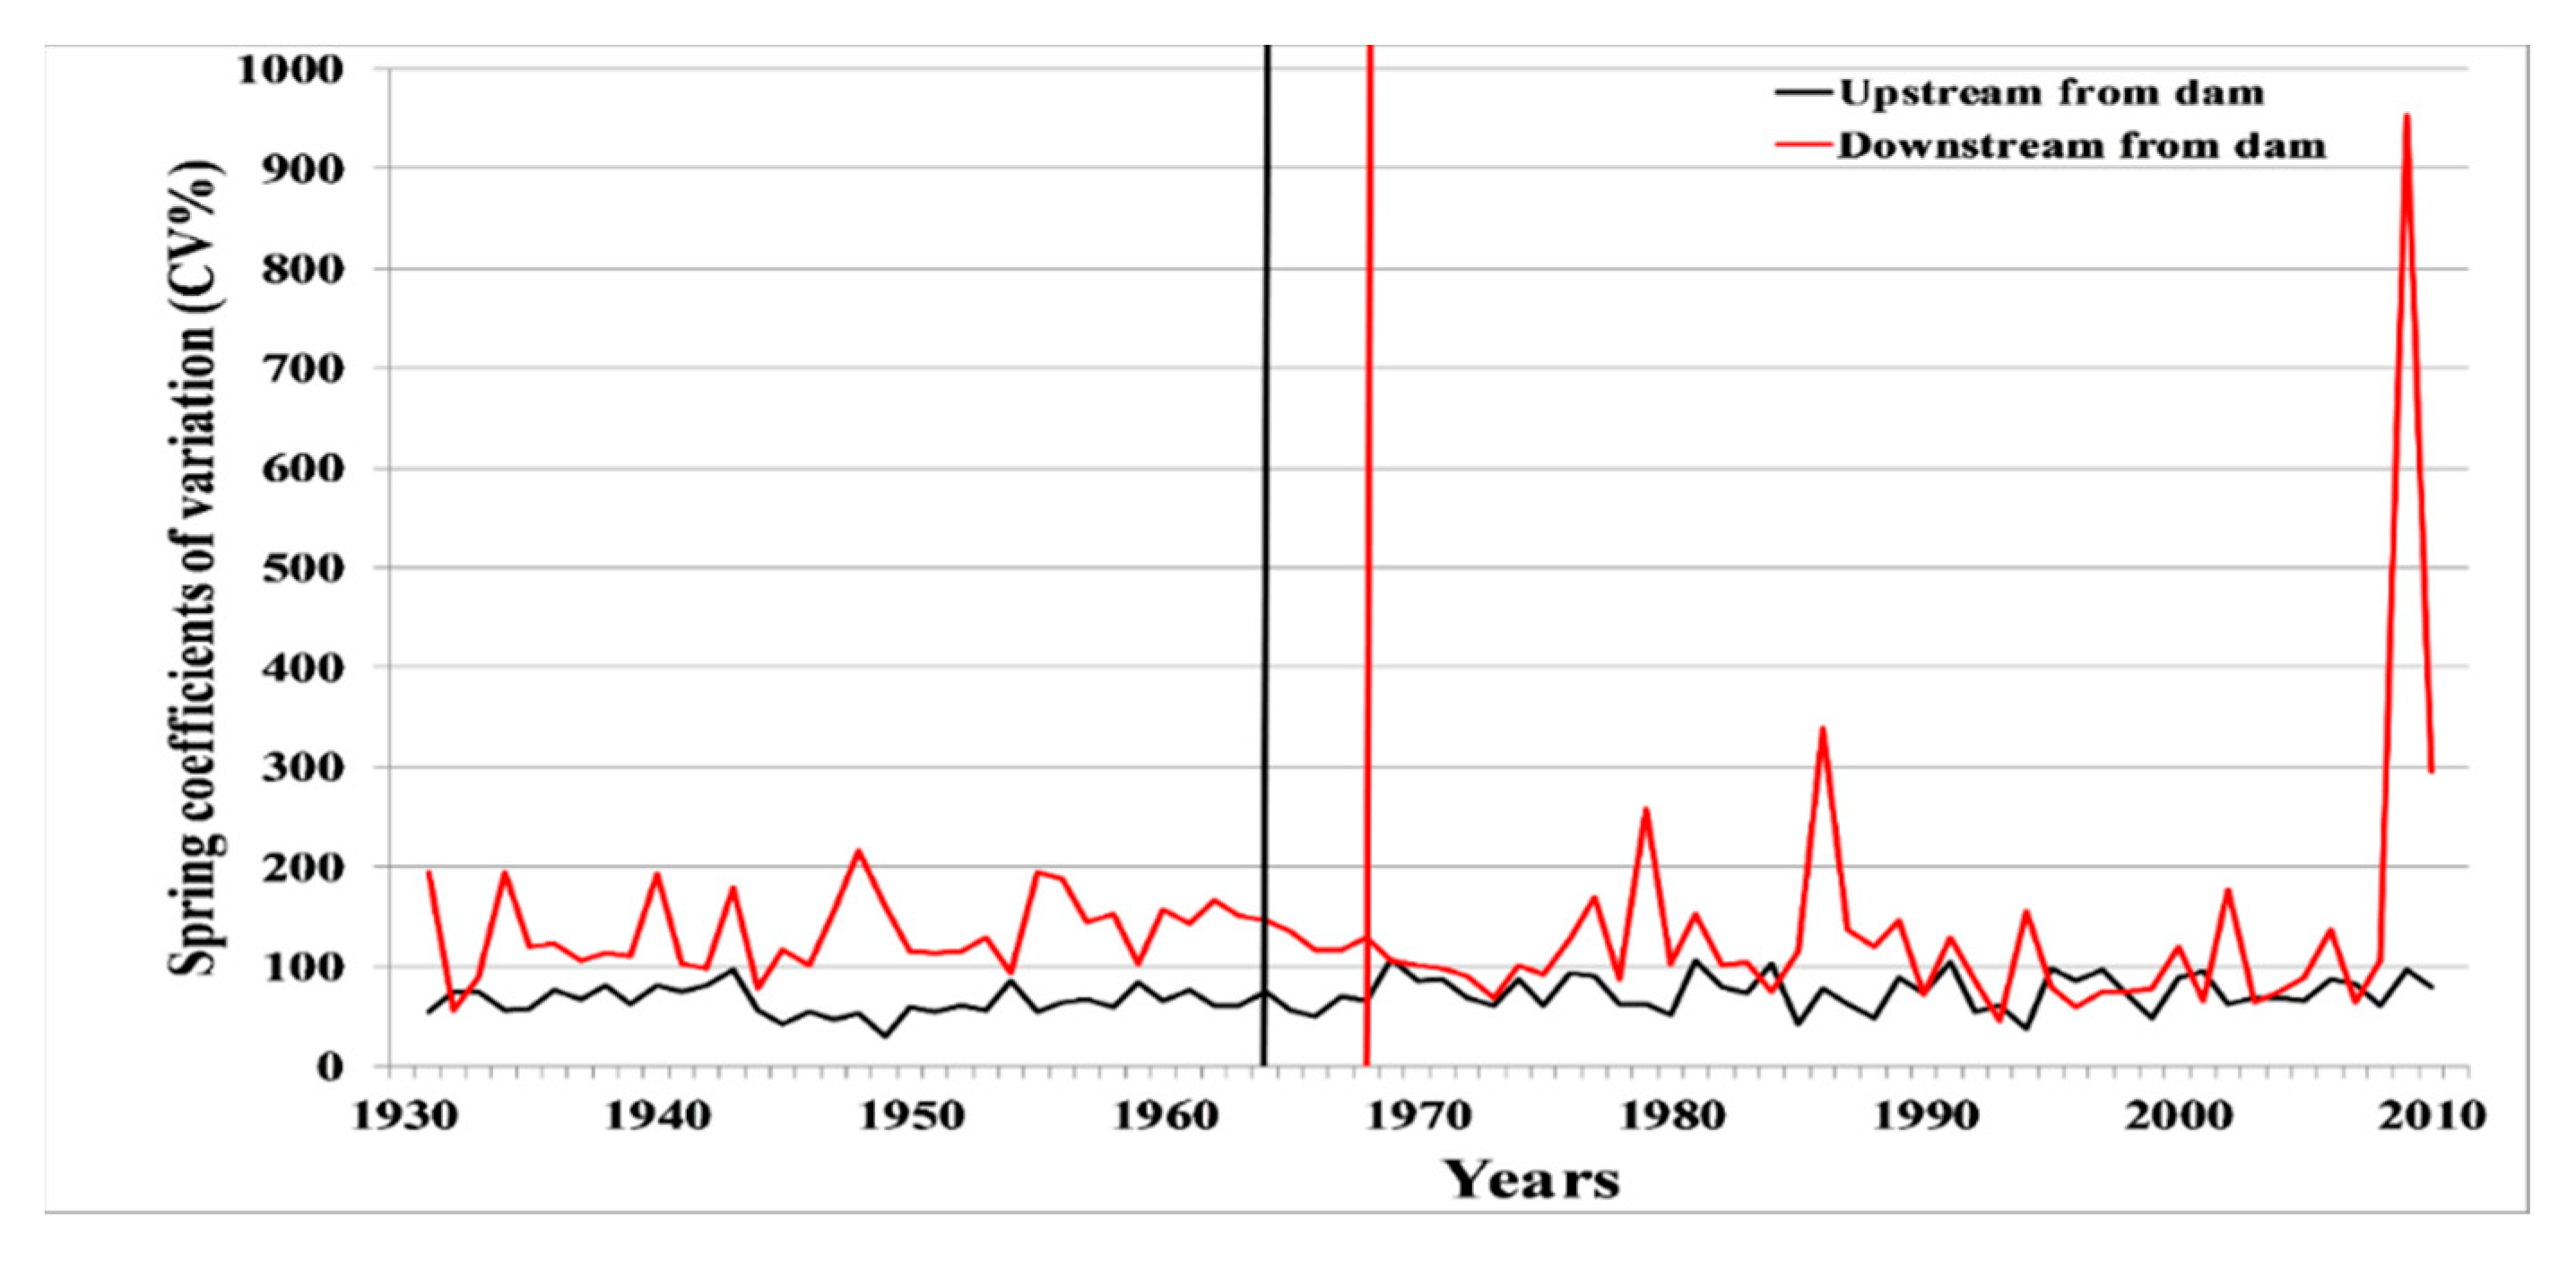
In the Matawin River watershed, whose dam is characterized by an inversion-type management method, there is a very large difference in the temporal variability of the two flow rate change indices upstream and downstream of the dam. Upstream, temporal variability is characterized by a significant decrease in flow rate change over time, whereas downstream of the dam, it is characterized by a significant increase over time. Other than this difference, no significant changes in mean were observed upstream of the dam in spring for the CI index and in winter for the CV index. By contrast, downstream of the dam, no change in mean was observed only in summer for the CV index. For all seasons, the rate of increase in the mean of the two indices downstream of the dam is higher than the rate of decrease in these indices upstream. In addition, the dates of the breaks in mean of these two indices were not synchronous upstream and downstream of the dam, even though most of them were abrupt and occurred as of the 1970s.
3.3. Analysis of the Influence of Dam Management Modes on the Relationship between Flow Rate Indices and Climate Variables
Correlation coefficient values calculated between the two flow rate indices and climate variables in natural rivers and downstream of dams are presented Table 6 (L’Assomption River and Ouareau rivers) and Table 7 (Matawin River). For the Manouane River, no correlation coefficient is statistically significant at the 5% threshold before and after dam construction for the four seasons. In the L’Assomption River watershed, correlation coefficient values vary with the seasons. In fall, the two flow rate indices are correlated positively with both the amount of rain and the total amount of precipitation at both stations (aside from the CI index at the Joliette station on the L’Assomption River, which is not correlated with the latter climate variable). In winter, both flow rate indices are correlated positively with temperature, the amount of rain and the total amount of precipitation at both stations. However, downstream of the Rawdon dam on the Ouareau River, the CI is correlated negatively with the total amount of snow. In spring, both flow rate indices are correlated positively with temperature, except for the CI index downstream of the Rawdon dam, which is not significantly correlated with mean and minimum daily temperatures. Note also that downstream of this dam, the CV index is correlated negatively with the total amount of rain. In summer, the two indices are not significantly correlated with any climate variable at the Joliette station on the L’Assomption River. By contrast, downstream of the Rawdon dam on the Ouareau River, the CI index is positively correlated with daily minimum and mean temperatures as well as the total amount of rain. For the CV index, it is correlated only with the latter climate variable.
In the Matawin River watershed, the same seasonal differences are also observed. In fall, the CI index is correlated positively with both the amount of rain and the amount of total precipitation upstream of the Matawin dam. This latter variable is also correlated with the CV index. By contrast, downstream of the dam, neither index is significantly correlated with any climate variable. The same applies in winter and summer. Upstream of the dam, in winter, both indices are correlated negatively with the amount of snow, but positively with the amount of rain for the CV index. In summer, only the CI index is correlated positively with daily maximum and mean temperatures. In spring, upstream of the dam, the CV index is correlated positively with the amount of rain and the total amount of precipitation, whereas downstream of the dam, this correlation becomes negative. The CI index, meanwhile, is correlated positively with these two climate variables only downstream of the dam.
4. Discussion
A comparison of the two seasonal flow rate change indices (coefficients of immoderation and variation) in natural rivers and downstream of dams in three watersheds in Quebec revealed the influence of two factors: dam management methods and seasons. With respect to the influence of the latter factor, it has been shown that daily flow rate change is much higher in spring than in the other three seasons. Let us reiterate that in Quebec, the largest annual flooding occurs in spring due to snowmelt. During that season, flow therefore increases rapidly during the flood rising phase and decreases equally rapidly during the flood recession phase, resulting in relatively high daily flow rate change. By contrast, flow rate change is much lower in winter than in the other seasons. In winter, precipitation is stored as snow on slopes, inhibiting runoff. Rivers are fed almost exclusively by groundwater, whose draining is much slower than recession. This results in very little flow rate change from one day to the next.
This general pattern is observed both in natural rivers and downstream of dams. However, the extent of this variability in daily flow depends on dam management methods. Downstream of dams that create a diversion-type regulated regime, the amplitude of daily flow rate change (CI) and interday variability (CV) decreased in fall after dam construction. On the other hand, CV index increased in spring after dam construction. Water diversion occurs in fall and to a lesser extent in spring. So, in fall, the two-flow rate change index decreased after dam construction. In spring, the quantity of water released downstream from dam depends on the water level in the reservoir and the natural inputs from snowmelt. These two factors thus lead to relatively high interday variability in flow than in natural conditions (before construction from dam). Downstream of dams characterized by a natural-type regulated hydrological regime, the difference with natural rivers is observed in spring and summer only with respect to differences between maximum and minimum flows. This increase in the amplitudes of extreme flow variation downstream of dams is due to the fact that significant snowmelts in spring or severe thunderstorms in summer cause much larger flows to be released than those observed in natural rivers, creating a large difference between maximum and minimum flows. Lastly, downstream of dams characterized by an inversion-type hydrological regime, daily flow rate change is much higher than in natural rivers in all four seasons. The increase in flow fluctuations downstream of these dams is much greater than downstream of the two other types of dams. The inversion-type management method is characterized by the storage of water during the warm season (spring and summer) and its release during the cold season (fall and winter) (e.g., [20,22,23,24,28]). During the cold season, water is released daily to supply hydroelectric power plants so that they can generate hydroelectric power. However, the amount of water released can vary greatly from day to day, leading to very high flow rate change downstream of dams. During the warm season, all water is first stored in the reservoir at the beginning of spring flooding. Then, once the reservoir is full, the flood is allowed to run slowly. This results in high flow rate change towards the end of the spring season. In summer, during large storm inputs, water is no longer stored because the reservoirs are already full from snowmelt waters. In addition, recreational and tourism activities that require water releases are practised downstream of most dams. This implies a higher fluctuation in daily flow downstream of these dams than in natural rivers.
Regarding the temporal variability (stationarity) of flow rate change indices, for the natural-type regulated regime, the difference between the station in the natural river and the station downstream of a dam was observed only in spring. The decrease in daily flow rate change at the first station was not observed downstream of the dam. Nonetheless, both in the natural river and downstream of the dam, daily flow rate change decreased significantly over time in winter and summer. We should recall that both stations are located in an agricultural watershed. This decrease in daily flow rate change over time suggests that the runoff process would have decreased significantly over time due to anti-erosion farming practices adopted to further protect soils and thus increase agricultural yield since the 1970s. Alongside the adoption of these practices, gradual reforestation of agricultural watersheds has occurred in Quebec since the 1960s [29]. These two factors may therefore explain the decrease in daily flow rate change over time in the L’Assomption agricultural watershed because of the decrease in runoff. In the Matawin River watershed, daily flow rate change decreased significantly over time upstream of the dam, as did the L’Assomption River watershed adjacent to it. By contrast, downstream of the Matawin dam, this variability increased significantly, except in summer. This increase in variability cannot be associated with a change in soil allocation because neither agriculture nor deforestation ever took place in the watershed. It is the result of a change in the way in which daily flow is managed. However, we did not find any factors that could account for this increase. This would likely result from a combination of many factors, such as the development of recreational and tourism activities, flood control, higher demand for electricity and so on [28].
The temporal variability of seasonal flow rate change indices also depends in part on the climate. This relationship is also influenced by dam management methods. In the Manouane River watershed, characterized by a diversion-type hydrological regime, no difference was observed before or after dam construction: neither of the two seasonal flow rate change indices is significantly correlated with temperature or precipitation. By contrast, in the L’Assomption River watershed, characterized by a natural-type regulated hydrological regime, the two indices are correlated with the same climate variables, namely winter and spring temperatures and fall and summer rainfall. This correlation is positive with these two climate variables for all four seasons. In winter and spring, runoff, the main factor of daily flow rate change in rivers, is strongly influenced by temperatures mainly due to snowmelt. In fall and summer, runoff is almost entirely dependent on the amount of rain. In the Matawin River watershed, the two hydrological indices are no longer nearly correlated with the same climate variables. However, when they are, as is the case in spring, the sign of correlation changes from upstream to downstream of the dam. Therefore, upstream of the dam, the coefficient of variation is correlated positively with rainfall, but this correlation becomes negative downstream of the dam due to the reversal of the long-term trend downstream of the dam.
Lastly, in the L’Assomption and Matawin watersheds, daily flow rate change is correlated negatively with the total amount of snow in winter and spring. This negative correlation is due to the fact that when precipitation falls as snow, no more liquid water is being contributed to rivers through the runoff process. Daily flow therefore varies little because it is fed exclusively by aquifers.
5. Conclusions
One of the five fundamental flow rate characteristics, flow rate change affects the function and evolution of river ecosystems to varying degrees. Downstream of dams, it is well known that this change is very low on an annual basis, causing biodiversity to deplete. On a daily basis, however, this change is very high, generating many ecological impacts as well. No studies have ever looked at flow rate change at the seasonal level. To fill this gap, this study compared flow rate change using two hydrological indices downstream of three dams characterized by different management methods. It revealed that this change increases downstream of these three dams. However, the extent of this increase depends on the dam management method and season. Flow rate change is higher in spring during a major flood than in winter during low flow. It is stronger downstream of the dam characterized by an inversion-type management method than downstream of the two other types of dams. With respect to temporal variability, the most significant change was also observed downstream of the dam characterized by an inversion-type management method. This change resulted in a significant increase in this variability over time downstream of the dam, whereas upstream of the dam, this variability decreased significantly over time. This study also revealed that dam management has little effect on the relationship between the two seasonal flow rate change indices and climate. Downstream of dams characterized by natural- and diversion-type management methods, dams have virtually no influence on this relationship. By contrast, downstream of the dam characterized by an inversion-type management method, the sign of correlation between the two types of variables is opposite upstream and downstream of the dam. Lastly, flow rate change is better correlated with climate for all four seasons downstream of the dam characterized by a natural-type regime than downstream of the two other types of dams. It is correlated with temperature in winter and spring and precipitation in summer and fall. In the case of the diversion dam, no significant correlation was found between daily flow rate change and climate during the four seasons.
From an ecological standpoint, the results of this study suggest that downstream of dams, increased seasonal flow rate change could generate impacts similar to those caused by increased daily flow rate change. This hypothesis will be examined later. In Quebec, these impacts will be greater downstream of dams characterized by the inversion-type management method than downstream of dams characterized by other types of management methods. This strong variability in the seasonal flows results a gradual increase terrestrial plant species in the low flow channel downstream from Matawin Reservoir dependent on obligate wetland species [30,31]. This aspect should be considered in policy for developing flow management standards intended to restore the ecological integrity of regulated rivers.
Finally, this study analyzed the hydrological impacts only on three regulated rivers, each subject to a different dam management mode. However, its conclusions can be generalized to others regulated rivers subject to the same types of dam management modes. Furthermore, previous studies have already shown that each of these three dam management methods induces the same types of hydrological impacts regardless of the climate and the size of the watersheds in Quebec, e.g., [20,22,23].
Author Contributions
Conceptualization: F.D. and A.A.A.; methodology: F.D. and A.A.A.; formal analysis: F.D.; investigation: F.D. and A.A.A.; writing— original draft preparation: F.D. and A.A.A.; writing—review and editing, F.D. and A.A.A.; funding acquisition, A.A.A. All authors have read and agreed to the published version of the manuscript.
Funding
This research was funded by NSERC, grant number 261274/2019.
Institutional Review Board Statement
Not applicable.
Informed Consent Statement
Not applicable.
Data Availability Statement
The date presented in this study are available on reque from the corresponding author.
Conflicts of Interest
Authors declare no conflict of interest.
References
- Ritcher, B.D.; Baumgartner, J.V.; Braun, D.P.; Powell, J. A spatial assessment of hydrologic alteration within a river network. Regul. Rivers Res. Manag. 1996, 14, 329–340. [Google Scholar]
- Poff, N.L.; Allan, J.D.; Bain, M.B.; Karr, J.R.; Prestegaard, K.L.; Richter, B.D.; Sparks, R.E.; Stromberg, J.C. The natural flow regime. Bioscience 1997, 47, 769–784. [Google Scholar] [CrossRef]
- Assani, A.A.; Landry, R.; Delisle, F. Effects of land use on flow rate change indices. Forests 2015, 6, 4349–4359. [Google Scholar] [CrossRef] [Green Version]
- Arthington, A.H. Environmental Flows: Saving Rivers in the Third Millennium; University of California Press: Berkeley, CA, USA, 2012. [Google Scholar]
- Richter, B.D.; Richter, H.E. Prescribing flood regimes to sustain riparian ecosystems along meandering rivers. Conserv. Biol. 2000, 14, 1467–1478. [Google Scholar] [CrossRef]
- Assani, A.A.; Simard, É.; Gravel, É.; Ibrahim, G.; Campeau, S. The impact of “Man-Made Hydrological drought” on plant species abundance in the low-flow channel downstream from the Matawin dam, Quebec. Water 2013, 5, 875–892. [Google Scholar] [CrossRef] [Green Version]
- Larned, S.T.; Datry, T.; Arscott, D.B.; Tockner, K. Emerging concepts in temporary-river ecology. Freshw. Biol. 2010, 55, 717–738. [Google Scholar] [CrossRef]
- Gebremicael, T.G.; Mohamed, Y.A.; Van Zaag, P.; Hagos, E.Y. Temporal and spatial changes of rainfall and streamflow in the Upper Tekeze-Atbara River basin, Ethiopia. Hydrol. Earth Syst. Sci. 2017, 21, 2127–2142. [Google Scholar] [CrossRef] [Green Version]
- Haas, N.A.; O’Connor, B.L.; Hayse, J.W.; Bevelhimer, M.S.; Endreny, T.A. Analysis of daily peaking and run-of-river operations with flow variability metrics, considering subdaily to seasonaly time scales. J. Am. Water Res. Assoc. 2014, 50, 1622–1640. [Google Scholar] [CrossRef]
- Li, D.N.; Long, D.; Zhao, J.S.; Lu, H.H.; Hong, Y. Observed changes in flow regimes in the Mekong River basin. J. Hydrol. 2017, 551, 217–232. [Google Scholar] [CrossRef]
- Mori, T.; Onoda, Y.; Kayaka, Y. Geographical patterns of flow-regime alterations by flood-control dams in Japan. Limnology 2018, 19, 53–67. [Google Scholar] [CrossRef]
- Peñas, F.J.; Barquin, J. Assessment of large-scale patterns of hydrological alteration caused by dams. J. Hydrol. 2019, 572, 706–718. [Google Scholar] [CrossRef]
- Moyle, P.B.; Mount, J.F. Homogenous rivers, homogenous fauna. Proc. Nat. Acad. Sci. USA 2007, 104, 5711–5712. [Google Scholar] [CrossRef] [Green Version]
- Cushman, R.M. Review of ecological effects of rapidly varying flows downstream from hydroelectric facilities. N. Am. J. Fish. Manag. 1985, 5, 330–339. [Google Scholar] [CrossRef]
- Zimmerman, J.K.H.; Letcher, B.; Nislow, K.H.; Lutz, K.A.; Magillan, J.F. Determining the effects of dams on subdaily variations in river flows at a whole-basin scale. Rivers Res. Appl. 2010, 26, 1246–1260. [Google Scholar]
- Grelsson, G. Vegetational changes on two eroding banks of a short-term regulated river reservoir in northern Sweden. N. J. Bot. 1986, 5, 581–614. [Google Scholar] [CrossRef]
- Nilsson, C.; Svedmark, M. Basic principles and ecological consequences of changing water regimes: Riparian plant communities. Environ. Manag. 2002, 30, 468–480. [Google Scholar] [CrossRef]
- Rood, S.B.; Mahoney, J.M.; Reid, D.E.; Zilm, L. Instream flows and the decline of riparian cottonwoods along the St. Mary River, Alberta. Can. J. Bot. 1995, 73, 1250–1260. [Google Scholar] [CrossRef]
- Rood, S.B.; Tabouchalnas, K.; Bradley, C.E.; Kalischuk, A.R. Influence of flow regulation on channel dynamics and riparian cottonwoods along the Bow River, Alberta. Water 1999, 7, 33–48. [Google Scholar]
- Assani, A.A.; Gravel, E.; Buffin-Bélanger, T.; Roy, A.G. Impacts des barrages sur les débits annuels minimums en fonction des régimes hydrologiques artificialisés au Québec (Canada). J. Water Sci. 2005, 18, 103–127. [Google Scholar] [CrossRef] [Green Version]
- Assani, A.A.; Stichelbout, E.; Roy, A.G.; Petit, F. Comparison of impacts of dams on the annual maximum flow characteristics in the three regulated hydrological regimes in Québec. Hydrol. Process. 2006, 20, 3485–3501. [Google Scholar] [CrossRef]
- Lajoie, F.; Assani, A.A.; Roy, A.G.; Mesfioui, M. Impacts of dams on monthly flow characteristics. The influence of watershed size and seasons. J. Hydrol. 2007, 334, 423–439. [Google Scholar] [CrossRef]
- Matteau, M.; Assani, A.A.; Mesfioui, M. Application of multivariate statistical analysis methods to the dam hydrologic impact studies. J. Hydrol. 2009, 371, 120–128. [Google Scholar] [CrossRef]
- Assani, A.A.; Buffin-Bélanger, T.; Roy, A.G. Analyse des impacts d’un barrage sur le régime hydrologique de la rivière Matawin (Québec, Canada). J. Water Sci. 2002, 15, 557–574. [Google Scholar]
- Lombard, F. Rank tests for change-point problems. Biometrika 1987, 74, 615–624. [Google Scholar] [CrossRef]
- Quessy, J.-F.; Favre, A.-C.; Saïd, M.; Champagne, M. Statistical inference in Lombard’s smooth-change model. Environmetrics 2011, 22, 882–893. [Google Scholar] [CrossRef]
- Assani, A.A. The usefulness of the Lombard method for analyzing the hydrological impacts of dams: The case of the Manouane River diversion dam, Quebec, Canada. Water 2016, 8, 410. [Google Scholar] [CrossRef] [Green Version]
- Fortier, C.; Assani, A.A.; Mesfioui, M.; Roy, A.G. Comparison of the interannual and interdecadal variability of heavy flood charactristics upstream and downstream from dams in inversed hydrologic regime: Case study of Matawin River (Québec, Canada). Rivers Res. Appl. 2011, 27, 1277–1289. [Google Scholar] [CrossRef]
- Assani, A.A.; Chauvette, L.; Campeau, S. Analysis of the Impacts of Changes in Streamflow and of Reforestation on the Morphological Evolution of the Matambin River Channel in the St. Lawrence Lowlands (Quebec, Canada); Shukla, D.P., Ed.; Geomorphology, Intech: London, UK, 2017. [Google Scholar] [CrossRef] [Green Version]
- Dubeau, S.; Assani, A.A.; Ibrahim, G.; Rodríguez, M.A. Temporal variability of streamflow and plant species abundance on islets as they relate to ENSO events downstream from an inversion-type reservoir. River Res. Appl. 2017, 33, 1411–1419. [Google Scholar] [CrossRef]
- Assani, A.A.; Leduc, S. The influence of the charactersitics of geomorphological deposits on terrestrial plant species richness in the low flow channel downstream from an inversion-tyep reservoir. Int. J. Environ. Sci. Nat. Res. 2021, 28, 556232. [Google Scholar] [CrossRef]
Figure 1.
Location of watersheds and stations.

Figure 2.
Comparison of the interannual variability of values of winter coefficients of variation from 1930 to 2010. Vertical bars indicate years of breaks in mean.
Figure 2.
Comparison of the interannual variability of values of winter coefficients of variation from 1930 to 2010. Vertical bars indicate years of breaks in mean.

Figure 3.
Comparison of the interannual variability of values of winter coefficients of variation upstream and downstream of the Matawin dam during the period from 1930 to 2010.
Figure 3.
Comparison of the interannual variability of values of winter coefficients of variation upstream and downstream of the Matawin dam during the period from 1930 to 2010.

Figure 4.
Comparison of the interannual variability of values of spring coefficients of variation at the Joliette station (L’Assomption) and downstream of the Rawdon station (Ouareau) during the period from 1930 to 2010. Vertical bars indicate years of breaks in mean.
Figure 4.
Comparison of the interannual variability of values of spring coefficients of variation at the Joliette station (L’Assomption) and downstream of the Rawdon station (Ouareau) during the period from 1930 to 2010. Vertical bars indicate years of breaks in mean.

Figure 5.
Comparison of the interannual variability of values of spring coefficients of variation upstream and downstream of the Matawin dam during the period from 1930 to 2010.
Figure 5.
Comparison of the interannual variability of values of spring coefficients of variation upstream and downstream of the Matawin dam during the period from 1930 to 2010.


Table 1.
Comparison of means (M1 and M2) of coefficients of immoderation (CI) and variation (CV) before (1980–2002) and after (2004–2014) the construction of the Manouane River diversion dam during the period from 1980 to 2014.
Table 1.
Comparison of means (M1 and M2) of coefficients of immoderation (CI) and variation (CV) before (1980–2002) and after (2004–2014) the construction of the Manouane River diversion dam during the period from 1980 to 2014.
| Seasons | Indices | Before | After | p-Value (KW) | p-Value (t) | R (%) |
|---|---|---|---|---|---|---|
| M1 | M2 | |||||
| Fall | CI | 7.88 (4.13) | 5.21 (1.83) | 0.027 | 0.011 | −33.9 |
| CV | 55.63 (16.62) | 45.13 (12.51) | 0.041 | 0.036 | −18.9 | |
| Winter | CI | 1.82 (0.70) | 2.10 (1.84) | 0.671 | 0.594 | − |
| CV | 16.64 (10.53) | 17.06 (20.44) | 0.117 | 0.944 | − | |
| Spring | CI | 29.75 (11.29) | 28.19 (14.96) | 0.854 | 0.740 | − |
| CV | 82.52 (14.55) | 99.09 (24.24) | 0.039 | 0.032 | +20.1 | |
| Summer | CI | 6.04 (2.89) | 7.10 (3.48) | 0.421 | 0.349 | − |
| CV | 47.32 (14.14) | 48.86 (11.79) | 0.815 | 0.733 | − |
(4.13) = standard deviation; KW = Kruskal-Wallis test; t = Student’s t-test; R = mean variation rate (+ = increase; − = decrease) for coefficients of immoderation (CI) and variation (CV). R = mean variation rate (+ = increase; − = decrease) for coefficients of immoderation and variation. Statistically significant p-Value are shown in bold.
Table 2.
Comparison of means (M1, M2) of coefficients of immoderation (CI) and variation (CV) of the L’Assomption River (natural station) and Ouareau River (downstream of the Rawdon dam) during the period from 1930 to 2010.
Table 2.
Comparison of means (M1, M2) of coefficients of immoderation (CI) and variation (CV) of the L’Assomption River (natural station) and Ouareau River (downstream of the Rawdon dam) during the period from 1930 to 2010.
| Seasons | Indices | L’Assomption River | Ouareau River | p-Value (KW) | p-Value (t) | R (%) |
|---|---|---|---|---|---|---|
| M1 | M2 | |||||
| Fall | CI | 9.56 (7.03) | 11.26 (15.88) | 0.291 | 0.354 | − |
| CV | 53.79 (21.25) | 53.61 (18.54) | 0.879 | 0.928 | − | |
| Winter | CI | 7.35 (8.73) | 9.36 (14.66) | 0.714 | 0.747 | − |
| CV | 55.00 (42.89) | 56.42 (47.25) | 0.895 | 0.945 | − | |
| Spring | CI | 19.73 (9.32) | 26.00 (14.96) | 0.001 | 0.001 | +31.78 |
| CV | 81.84 (17.47) | 85.16 (18.27) | 0.213 | 0.239 | − | |
| Summer | CI | 9.45 (6.47) | 15.84 (20.53) | 0.049 | − | +67.62 |
| CV | 57.36 (21.94) | 59.64 (25.93) | 0.664 | 0.661 | − |
(7.03) = standard deviation; KW = Kruskal-Wallis test; t = Student’s t-test; R = mean variation rate (+ = increase; − = decrease) for coefficients of immoderation and variation. Statistically significant p-Value are shown in bold.
Table 3.
Comparison of means (M1 and M2) of coefficients of immoderation (CI) and variation (CV) upstream and downstream of the Matawin River dam during the period from 1930 to 2010.
Table 3.
Comparison of means (M1 and M2) of coefficients of immoderation (CI) and variation (CV) upstream and downstream of the Matawin River dam during the period from 1930 to 2010.
| Seasons | Indices | Upstream from Dam | Downstream from Dam | p-Value (KW) | p-Value (t) | R (%) |
|---|---|---|---|---|---|---|
| M1 | M2 | |||||
| Fall | CI | 5.02 (2.31) | 111.72 (71.74) | 0.000 | − | +2125.5 |
| CV | 40.50 (12.45) | 90.85 (40.40) | 0.000 | 0.000 | +126.84 | |
| Winter | CI | 3.52 (3.10) | 49.93 (66.37) | 0.000 | − | +1318.47 |
| CV | 32.37 (24.02) | 46.94 (33.40) | 0.000 | 0.002 | +43.28 | |
| Spring | CI | 13.61 (6.40) | 134.56 (100.16) | 0.000 | − | +888.68 |
| CV | 69.90 (17.20) | 135.17 (105.88) | 0.000 | 0.000 | +933.38 | |
| Summer | CI | 7.22 (3.95) | 93.09 (63.03) | 0.000 | 0.000 | +1189.34 |
| CV | 52.93 (17.37) | 94.03 (30.72) | 0.000 | 0.000 | +77.65 |
(7.03) = standard deviation; KW = Kruskal-Wallis test; t = Student’s t-test; R = mean variation rate (+ = increase; − = decrease) for coefficients of immoderation and variation. Statistically significant p-Value are shown in bold.
Table 4.
Comparison of the temporal variability of two seasonal flow rate indices (CI and CV) from 1930 to 2010.
Table 4.
Comparison of the temporal variability of two seasonal flow rate indices (CI and CV) from 1930 to 2010.
| Seasons | CI | CV | ||||||||||
|---|---|---|---|---|---|---|---|---|---|---|---|---|
| L’Assomption River | Ouareau River | L’Assomption River | Ouareau River | |||||||||
| Sn | T1/T2 | R (%) | Sn | T1/T2 | R (%) | Sn | T1/T2 | R (%) | Sn | T1/T2 | R (%) | |
| Fall | 0.0099 | - | − | 0.0024 | − | − | 0.0045 | − | − | 0.0006 | − | − |
| Winter | 0.0940 | 1951/52 | −41.46 | 0.0569 | 1973/74 | −2.27 | 0.0594 | 1971/72 | −41.36 | 0.0745 | 1971/72 | −42.01 |
| Spring | 0.0688 | 1994/95 | −27.08 | 0.0052 | − | − | 0.0498 | 1973/74 | −13.04 | 0.0244 | − | − |
| Summer | 0.0688 | 1994/95 | −70.56 | 0.1410 | 1976/97 | −78.50 | 0.1062 | 1994/95 | −50.08 | 0.1420 | 1982/85 | −52.84 |
Statistically significant Sn values (>0.0403) are shown in bold. T1 and T2 are the years of the beginning and end, respectively, of breaks in mean. R = positive (+) or negative (−) mean change rate in time series.
Table 5.
Comparison of the temporal variability of two seasonal flow rate indices (CI and CV) upstream and downstream of the Matawin dam during the period from 1930 to 2010.
Table 5.
Comparison of the temporal variability of two seasonal flow rate indices (CI and CV) upstream and downstream of the Matawin dam during the period from 1930 to 2010.
| Seasons | CI | CV | ||||||||||
|---|---|---|---|---|---|---|---|---|---|---|---|---|
| Upstream from dam | Downstream from Dam | Upstream from Dam | Downstream from Dam | |||||||||
| Sn | T1/T2 | R (%) | Sn | T1/T2 | R (%) | Sn | T1/T2 | R (%) | Sn | T1/T2 | R (%) | |
| Fall | 0.0770 | 1961/62 | −33.64 | 0.1173 | 1982/83 | +48.30 | 0.0472 | 1986/87 | −27.03 | 0.3150 | 1959/72 | +46.21 |
| Winter | 0.0819 | 1970/71 | −52.44 | 0.3079 | 1958/68 | +80.26 | 0.0316 | − | − | 0.3020 | 1960/61 | +59.76 |
| Spring | 0.0207 | − | − | 0.0886 | 1981/82 | +37.00 | 0.0699 | 1963/64 | −16.67 | 0.0546 | 1967/68 | 0.32 |
| Summer | 0.1009 | 1992/96 | −82.82 | 0.2728 | 1986/87 | +58.94 | 0.0894 | 1993/94 | −31.83 | 0.0144 | − | − |
Statistically significant Sn values (>0.0403) are shown in bold. T1 and T2 are the years of the beginning and end, respectively, of breaks in mean. R = positive (+) or negative (−) mean change rate in time series.
Table 6.
Comparison of correlation coefficients calculated between climate variables and the flow rate change indices of the L’Assomption River (upstream) and Ouareau River (downstream of the Rawdon dam) for the period from 1930 to 2010.
Table 6.
Comparison of correlation coefficients calculated between climate variables and the flow rate change indices of the L’Assomption River (upstream) and Ouareau River (downstream of the Rawdon dam) for the period from 1930 to 2010.
| Fall | Winter | Spring | Summer | |||||||||||||
|---|---|---|---|---|---|---|---|---|---|---|---|---|---|---|---|---|
| L’Assomption River | Ouareau River | L’Assomption River | Ouareau River | L’Assomption River | Ouareau River | L’Assomption River | Ouareau River | |||||||||
| CI | CV | CI | CV | CI | CV | CI | CV | CI | CV | CI | CV | CI | CV | CI | CV | |
| Tmax | 0.063 | −0.031 | 0.088 | 0.032 | 0.251 | 0.305 | 0.280 | 0.319 | 0.401 | 0.415 | 0.230 | 0.366 | 0.107 | 0.103 | 0.076 | 0.035 |
| Tmin | 0.156 | 0.091 | 0.140 | 0.086 | 0.305 | 0.319 | 0.263 | 0.316 | 0.314 | 0.317 | 0.175 | 0.229 | 0.046 | 0.120 | 0.272 | 0.181 |
| Tmoy | 0.129 | 0.040 | 0.135 | 0.071 | 0.308 | 0.340 | 0.292 | 0.333 | 0.383 | 0.402 | 0.209 | 0.324 | 0.109 | 0.013 | 0.366 | 0.172 |
| TRF | 0.502 | 0.425 | 0.388 | 0.408 | 0.586 | 0.645 | 0.447 | 0.532 | −0.168 | −0.175 | −0.105 | −0.231 | 0.134 | 0.124 | 0.236 | 0.266 |
| TSF | −0.105 | −0.196 | −0.059 | −0.198 | −0.132 | −0.201 | −0.239 | −0.207 | 0.163 | 0.076 | 0.086 | 0.000 | − | − | − | − |
| TP | 0.313 | 0.217 | 0.329 | 0.226 | 0.343 | 0.311 | 0.164 | 0.228 | −0.118 | −0.118 | −0.074 | −0.195 | 0.134 | 0.124 | 0.238 | 0.266 |
Statistically significant correlation coefficient values at the 5% threshold are shown in bold.
Table 7.
Comparison of correlation coefficients calculated between climate variables and the flow rate change indices upstream and downstream of the Matawin River dam for the period from 1930 to 2010.
Table 7.
Comparison of correlation coefficients calculated between climate variables and the flow rate change indices upstream and downstream of the Matawin River dam for the period from 1930 to 2010.
| Fall | Winter | Spring | Summer | |||||||||||||
|---|---|---|---|---|---|---|---|---|---|---|---|---|---|---|---|---|
| Upstrteam | Downstream | Upstrteam | Downstream | Upstrteam | Downstream | Upstrteam | Downstream | |||||||||
| CI | CV | CI | CV | CI | CV | CI | CV | CI | CV | CI | CV | CI | CV | CI | CV | |
| Tmax | −0.029 | 0.052 | 0.203 | 0.041 | 0.030 | 0.029 | 0.054 | −0.060 | −0.023 | 0.010 | −0.206 | 0.092 | 0.242 | 0.193 | −0.175 | 0.034 |
| Tmin | 0.013 | 0.012 | 0.101 | 0.203 | 0.066 | 0.126 | 0.184 | 0.080 | −0.043 | −0.019 | −0.118 | −0.118 | 0.131 | 0.142 | −0.022 | 0.073 |
| Tmoy | −0.012 | 0.030 | 0.177 | 0.118 | 0.035 | 0.073 | 0.129 | 0.022 | −0.031 | 0.003 | −0.150 | −0.001 | 0.223 | 0.190 | −0.109 | 0.056 |
| TRF | 0.232 | 0.216 | −0.210 | 0.009 | 0.211 | 0.280 | −0.030 | −0.020 | 0.141 | 0.281 | 0.317 | −0.531 | −0.161 | −0.111 | −0.046 | −0.128 |
| TSF | 0.075 | 0.113 | −0.065 | −0.143 | −0.275 | −0.279 | 0.134 | 0.253 | 0.077 | 0.065 | 0.193 | 0.016 | − | − | − | − |
| TP | 0.271 | 0.272 | −0.189 | −0.040 | −0.148 | −0.125 | 0.124 | 0.234 | 0.165 | 0.299 | 0.343 | −0.515 | −0.163 | −0.113 | −0.046 | −0.129 |
Statistically significant correlation coefficient values at the 5% threshold are shown in bold.
Publisher’s Note: MDPI stays neutral with regard to jurisdictional claims in published maps and institutional affiliations. |
© 2021 by the authors. Licensee MDPI, Basel, Switzerland. This article is an open access article distributed under the terms and conditions of the Creative Commons Attribution (CC BY) license (https://creativecommons.org/licenses/by/4.0/).
Share and Cite
MDPI and ACS Style
Delisle, F.; Assani, A.A. Comparison of Seasonal Flow Rate Change Indices Downstream of Three Types of Dams in Southern Quebec (Canada). Water 2021, 13, 2555. https://doi.org/10.3390/w13182555
AMA Style
Delisle F, Assani AA. Comparison of Seasonal Flow Rate Change Indices Downstream of Three Types of Dams in Southern Quebec (Canada). Water. 2021; 13(18):2555. https://doi.org/10.3390/w13182555
Chicago/Turabian StyleDelisle, Francis, and Ali Arkamose Assani. 2021. "Comparison of Seasonal Flow Rate Change Indices Downstream of Three Types of Dams in Southern Quebec (Canada)" Water 13, no. 18: 2555. https://doi.org/10.3390/w13182555
Note that from the first issue of 2016, this journal uses article numbers instead of page numbers. See further details here.