
Integrated Water Quality Management Model for the Rural Transboundary River Basin—A Case Study of the Sutla/Sotla River


1
Department of Civil Engineering, Zagreb University of Applied Sciences, Av. V. Holjevca 15, 10000 Zagreb, Croatia
2
Faculty of Civil Engineering, University of Rijeka, Radmile Matejčić 3, 51000 Rijeka, Croatia
3
Department of Agriculture, University of Ljubljana Biotechnical Faculty, SI-1000 Ljubljana, Slovenia
*
Author to whom correspondence should be addressed.
Water 2021, 13(18), 2569; https://doi.org/10.3390/w13182569
Submission received: 12 August 2021
/
Revised: 11 September 2021
/
Accepted: 14 September 2021
/
Published: 17 September 2021
(This article belongs to the Section Water Quality and Contamination)
Abstract
:The intensive use of soil and water resources results in a disbalance between the environmental and economic objectives of the river basin. The water quality management model supports good water status, especially downstream of dams and reservoirs, as in the case of the Sutla/Sotla river basin. This research aims to develop a new, improved integrated water quality management model of rural transboundary basins to achieve environmental objectives and protection of the Natura 2000 sites. The model uses river basin pressure analysis to assess the effects of climate and hydrological extreme impacts, and a programme of basic and supplementary measures. The impact assessment of BASE MODEL, PAST, and FUTURE scenarios was modelled using the soil and water assessment tool (SWAT) based on land use, climate and hydrological data, climate change, presence or lack of a reservoir, and municipal wastewater and agriculture measures. Eight future climate change scenarios were obtained with optimistic (RCP4.5) and pessimistic (RCP8.5) forecasts for two periods (2020–2050 and 2070–2100), both with and without a reservoir. The model shows that the most significant impacts on the waterbody come from the nutrients and sediment hotspots, also shows the risk of not achieving good water status, and water eutrophication risk. The modelled average annual increase in sediment is from 4 to 25% and in total N from 1 to 8%, while the change in total P is from −5 to 6%. The conducted analysis provides a base for the selection of tailor-made measures from the catalogue of the supplementary measures that will be outlined in future research.
1. Introduction
As a consequence of the intensive use of soil and water in river basins, it is necessary to balance environmental objectives with developmental objectives, which can be achieved by sustainable development that considers the economy, environment, and society [1]. In the last century, due to a need to solve water-related problems, the definition of integrated water resource management (IWRM) was created. The Global Water Partnership [2] defined IWRM as “the process that promotes the coordinated development and management of water, soil and related resources in a way that maximizes the results of economic and sociological wellbeing on equal footing without compromising the sustainability of vital ecosystems”. The adoption of the Water Framework Directive (WFD) [3] created the foundation of the European Union’s (EU) water policy, aimed at protecting and improving water status and water ecosystems, promoting sustainable water uses, and implementing integrated river basin management (IRBM). The WFD encouraged the development of methods for assessing the ecological status of water and assessing the status of European waters [4]. The implementation of the WFD is regularly evaluated, and its revision was scheduled for 2019. The functionality of aquatic ecosystems and their positions in river basins were the planned points of focus. Despite disappointing results in improving surface and groundwater quality within the EU, the WFD will not be revised because member states must first prepare better river basin management plans [5]. The first verification of WFD implementation was achieved through A Blueprint to Safeguard Europe’s Water Resources [6]. The document stressed the need for better implementation and greater integration of WFD goals into sectoral policies, such as the Common Agricultural Policy (CAP), cohesion and structural funds, renewable energy policies, and the integrated governance of floods and droughts.
The CAP and WFD represent the two most influential EU policies in environmental issues and for problems in rural areas. According to the Organization for Economic Cooperation and Development (OECD), rural areas are defined as less than 150 inhabitants per km2. According to the new EU methodology, and based on the revised OECD approach, 45.8% of inhabitants in Croatia live in rural areas [7].
Climate changes that cause extreme hydrological events can impact river basin hydrological regimes and water quality. The sixth climate change report by the Intergovernmental Panel on Climate Change (IPPC) in 2017 emphasizes the need to model impacts and take mitigation and adaptation measures to address climate change. Regarding the WFD and the European Union (EU) strategy for biodiversity to 2020, objective 2, river basin natural environmental objectives are a more significant challenge than achieving good water status.
Rural transboundary river basins present challenges for each state’s innovative water quality management. Due to the lack of sanitation, agglomerations of less than 2000 population equivalent (PE), as well as agricultural activities with high biological diversity and numerous Natura 2000 areas, present more challenges for each state’s innovative water quality management. The pollution reduction approach must be applied at the national and river basin levels to achieve a good status for all waterbodies and environmental objectives for river basins.
According to the United Nations, there are almost 245 transboundary water basins worldwide. The need for cooperation and harmonization of policies for transboundary water basins is high. Approximately 40% of the global population and 55% of Europe’s population live in transboundary river basins [8]. In Croatia, most of the large water courses of the Black Sea basin are of interstate importance, a border, or transboundary, as is the case with the Sutla/Sotla river basin [9,10]. Most of the published papers deal with various transboundary problems related to water use and public participation [11,12]. However, they do not deal with the methodology of water quality management in rural transboundary river basins. Traditional watershed modelling does not effectively capture system heterogeneity, limiting its ability to effectively represent the two-way interaction between human and natural systems. Modelling both natural and human behavior, especially for transboundary river basins, can help reveal the reciprocal interactions of natural and human systems that can be helpful in integrated water quality management and modelling. To ensure adequate tools for the end user, the European Commission has financially supported the EUROHARP project [13,14,15]. The aim of the project was to develop guidance for choosing the appropriate quantification tools to satisfy existing European requirements on harmonization, transparency, and quantification of nutrients from diffuse sources. The soil and water assessment tool (SWAT) model was found to be an appropriate model for all types of scenario analyses for transboundary rural river basins [2,9,16] used the SWAT model to investigate the impact of climate change on large transboundary river basins, while Abbaspour, K.C. et al. 2015 [17] used SWAT for analyses of transboundary rural river basins for the whole of Europe.
The SWAT model is a physically based, deterministic, watershed-scale simulation model developed by the United States Department of Agricultural Research Service [16]. The SWAT model was developed to assist the water managers in examining the impacts of agricultural activities in catchments (Arnold et al., 1998). The SWAT model is widely used for modelling hydrology in terms of the quantity of water (discharge, soil water, and snow and water management), the quality of water (land use, production technologies, good agricultural practices, and agri-environmental measures), and the effects of climate changes [17,18,19].
Such a diagnostic tool uses WFD monitoring system data to recommend a hierarchy of measure implementations and the integration of water policies into other sectors to achieve the objectives of the WFD, especially in agricultural policy, and stronger integration in spatial planning [16,17,18,19].
The contribution of agriculture to nonpoint source pollution of surface waters is estimated to be 55% for the European Union [20], and the problem of agriculture nonpoint source pollution also exists on other continents. Several papers have analyzed problems and proposed solutions for agriculture nonpoint source pollution (Volk, M. et al., 2009; Piniewski, M., 2017; Epelde, A.M. et al., 2015; Glavan, M. et al., 2012; Glavan, M. et al., 2020 [21,22,23,24,25]).
A prerequisite for achieving WFD environmental objectives and ecosystem services (ES) is based on the driving forces-pressures-state-impact-response (DPSIR) approach. This approach involves the analysis of pressures and impacts in the river basin, the monitoring and assessment of both the water status and the programme of measures (PoMs), which includes assessing the effectiveness of basic measures and the need for supplementary measures and information about them according to the WFD [16,20,21,22].
Basic wastewater measures included in the preparation of water quality management include requirements and standards related to protecting the environment from the adverse effects of urban wastewater discharges. Water protection is defined in the Urban Wastewater Treatment Directive (Council Directive 91/271/EEC) and EU standards. It concerns the collection, treatment, and discharge of urban wastewater and wastewater from specific industrial sectors. Depending on the size of the agglomeration and the sensitivity of the receiving water, the deadline for the construction or extension of the required urban wastewater collection and treatment systems has been 2018, 2020, or 2023.
Basic agricultural measures included in the preparation of agricultural management include cross-compliance requirements and standards related to the protection of water sources defined in the Nitrate Directive (Council Directive 91/676/EEC) and by EU standards on the good agricultural and environmental conditions of land (GAEC). Measures from the Nitrate Directive include a maximum amount of 170 kg of organic N per year, and define periods when organic N application is allowed. GAEC standards for maintaining good agricultural and environmental conditions of land include base measures for the prevention of soil erosion by defining minimum soil cover and minimum land management practices (soil coverage and tillage at the proper time). This document consists of sub-measures addressing multiple environmental issues. Supplementary measures specified in this study addressed the conflict between water resources and crop production issues (green cover, green manure, and crop rotation).
Additionally, the specific, tailor-made river basin measures and the use of ES, as the WFD measure, must be analyzed to optimize the set of measures in the river basin economically. Those are measures from the catalog of RDPS natural water retention measures (NWRM). These are multifunctional measures that aim to protect water resources using natural means and processes, and contribute to reducing the risk of floods, water scarcity, and drought by improving the status of surface and groundwater bodies. They can be found in the SWAT catalogue of measures or can be adapted to the SWAT model to demonstrate their efficiency as tailor-made measures.
Additional benefits of using ES include human wellbeing and improvement of the quality of human life, and it is an important step in a holistic approach to integrated water management. Today, climate change, awareness of public, public participation, and the integration of new methodologies and models are the most important challenges [5,11,12,26,27].
This research aims to develop an integrated water quality management model for transboundary and rural river basins, which balances environmental and development goals to achieve good water status and reduce the risk of eutrophication [9,27,28]. The model is applied to the case study of the Sutla/Sotla river basin.
The proposed water quality management model is based on applying different tools to determine the impact of current basic measures on the present situation and the impact of measures applied in the past. Modelling the future situation by implementing basic agricultural measures, climate change, and possible reservoir reconstruction creates the basis for the analysis and recommendations for an additional, “tailor-made” set of measures, including ES, which will be analyzed in future research on the Sutla/Sotla river basin [9].
2. Materials and Methods
2.1. The Sutla River Basin: Case Study
The Sutla (in the Croatian language)/Sotla (in Slovenian) River is a border river between the Republic of Croatia and the Republic of Slovenia (Figure 1). The Sutla River originates at an altitude of 717 m a.s.l. below Macelj Hill and flows into the Sava River southeast of Brežice town (Figure 1). The terrain of the catchment area is approximately 1000 m a.s.l. The river is 91 km long. After 3 km of headwater section, the river becomes a national border between Slovenia (on the right side of the river) and Croatia (on the left side). In the downstream section, before it flows into the Sava River, the national border lies on the Sutla River’s former course (before the regulation). The catchment area is 590.6 km2, of which 78% is in Slovenia, and the rest is in Croatia [10]. The basin is a narrow belt with an average width of 1–2 km (maximum 5 km). The Slovenian side has larger tributaries, including the Mestinjščica and Bistrica (ob Sotli), and smaller torrential tributaries are on the Croatian side. The average annual rainfall in the Sutla river basin is 1200 mm, and evapotranspiration is approximately 650 mm. The Sutla River has a significant initial decline of over 7 km, changing from 620 m a.s.l. to 250 m a.s.l. Subsequently, the drop decreases to 112 m a.s.l. at the mouth of the Sava River. At the Zelenjak water meter (downstream from the dam), the average flow is 7.3 m3/s (minimum 0.9 m3/s and maximum 129 m3/s). Zelenjak is a hydrological and water quality monitoring station [10].
The Sutla River flow regime is of the Pannonian type with two identical peaks, one in early spring and the other in late autumn. Low flows occur in summer and winter, and the lowest flows occur in August [1,29]. Measuring stations that monitor the quantity and quality of Sutla River water are presented in Figure 1. The only lake that existed for a short period on the Sutla River was Sutla Lake, the artificial lake behind the Vonarje dam. Sutla Lake/Vonarje Reservoir was created using natural retention by constructing the dam as a multipurpose hydrotechnical facility to provide public water supply, irrigation, flood protection, and a location for tourism. The site has eutrophicated and was discharged in 1989. The Sutla Lake/Vonarje Reservoir, with a volume of 12.4 million m3 and a length of approximately 6 km, covered an area of 195 ha (Figure 2). Of that, 3.7 million m3 is required for 100-year flood protection. Currently, it is used as retention in the case of high flood water [9,29,30,31].
Sutla Lake is located 150 km upstream from the mouth of the Mestinjščica tributary (Figure 2). The biological minimum flow determination downstream from the Vonarje dam was defined as 120 L/s in 1980. The monitoring stations are Luke Poljanske (2.5 km downstream) and Bratkovec (9.1 km downstream). Immediately below Sutla Lake, the river declines within the medium river catchment area before the tributaries join. The upper course of the Sutla River has a large longitudinal slope and torrent flow. In contrast, the longitudinal slope decreases and passes into a lowland flow with meanders in the middle course. Thus, the source of the Sutla River can be categorized as type 1 (a mountain and lowland small river), while the lower part of the Sutla River can be categorized as type 4 (a lowland medium-large river). At the bottom of the retention area, a wetland ecosystem has developed, the dam has been restored, and plans involve re-establishing Sutla Lake (Figure 2) [10].
Based on the available data sources obtained from the monitoring of the Sutla river basin (hydrology, water quality, and sediment over the last few years), and available knowledge of the river basin (hydro-morphology) (Figure 2), as is presented in the article Flajsig et al. (2020) [32], assessment of the water state has been prepared for the following water quality stations:
- −
- Prišlin (upstream of the dam) regarding the monitoring of sediment has significant anthropogenic impact and significant hydro-morphological changes, and, regarding the monitoring of water quality has a water status ranging from bad, poor to good (depending on the group of indicators).
- −
- Luke Poljanske (downstream of the dam) has anthropogenic impacts and slightly changed hydro- morphology status and, regarding water quality has the water status ranging from bad, poor to good.
- −
- Zelenjak has anthropogenic impacts and slightly changed hydro-morphology status and, and regarding water quality has the water status ranging from good to poor.
- −
- Harmica has anthropogenic impacts and slightly changed hydro-morphology status and, and regarding water quality has the water status ranging from good to poor [32].
The Sutla River, as part of the Natura 2000 ecological network, is vital for the conservation of seven fish species and one shellfish species under the Habitats Directive [31,32,33,34,35,36]. Initiatives to re-establish Sutla Lake stimulate the development of the water quality management model related to the main sources of nutrient pollution (inhabitants and agriculture) and the risk of not achieving good water status and river basin environmental objectives. Notably, the sanitation of agglomerations of less than 2000 PE is not included in the basic measures of European water policy but should be addressed by the national implementation programme [1].
2.2. Input Data and Database
For this research, which is based on the DPSIR approach, all data related to water and land management were collected from official public sources (public databases, indicators, and data), projects, and studies, and no data were measured. The sources of the official data are from the national monitoring systems and the statistical census and registers and were collected for the longest period available.
All model input data sources for the SWAT model are official public data with additional field trip data. Table 1 provides an overview of the SWAT model input data.
For each cluster, the authors collected all available data for the longest period possible, and data on pressures and states are interpreted. Each dataset was examined for homogeneity, completeness, errors, and accuracy. Storage, handling, retrieval, processing, management, analysis, and data manipulation were essential for data processing.
2.3. Integrated Water Quality Management Model for Rural Transboundary River Basin
The most important part of rural transboundary river basin management is modelling land use and quantifying pollution to manage water quality. The major source of nutrients, the threat to achieving good water status, and the environmental objectives of the river basin are the most important issues. In the case of transboundary river basins, the challenge is even greater because of a range of factors related to the diversity of water quality management, backgrounds, approaches, interests, and development scenarios for the defined area. The greatest challenge arises from the fact that transboundary river basin management is ruled by different water policies, even for EU Members. The integrated water quality management model for rural transboundary river basins developed here (Figure 3) includes the key tools for solving such issues based on the relevant EU directives, laws, and expert knowledge. Additional complexity in water management results from climate change impacts (with uncertainties) on land use, land cover, water resources, water use, and various other environmental aspects [11,12,33,34,35,36,37], including Natura site locations and touristic activities. The basic framework approach for achieving these research aims is to develop a transboundary, rural, integrated water quality management model that balances environmental and economic developmental goals. European and international experiences in rural areas’ management use a life-cycle concept with the problem-oriented DPSIR framework approach. According to the application of directives, the model is based on river basin pressure analysis, the assessment of climate change impacts of extreme hydrological events, and the application of measures. The model serves as a basis for the proposition of “tailor-made” river basin measures and water monitoring. The integrated water quality management model (IRBM) used in this research has been prepared based on the above requirements with the following key steps, marked with a green dashed line on the flow chart (Figure 3).
Implementation of the WFD is a crucial starting point for IRBM. Based on the DPSIR approach, the achievement of environmental goals and gap analysis identifies waterbodies at risk of not achieving good water status and environmental goals [10,32,38,39,40]. This approach forms the critical basis for providing ESs and enhancing human wellbeing. Additionally, the objectives for the protection of river basin waters under Natura 2000 can be analyzed. Therefore, the DPSIR approach is chosen as the basic framework for achieving the main aim of this research: the development of the transboundary, rural, integrated water quality management model. The DPSIR framework is used as an analytical tool for assessing and modelling water issues and research in papers [1,3,4,5,6]. This approach is adequate, problem-oriented, and methodological in assessing the risk of failing to achieve good ecological status in the IRBM according to the requirements of the WFD. Adopting the river basin as the optimal management unit, in line with the IRBM paradigm, the WFD treats the river basin as an interconnected system with the development of management responses to improve water quality because of improving ecosystem health, which was the reason to propose the conceptual framework DPSIR for water quality management and design of the mathematical model for Sutla River water quality, with an emphasis on Sutla Lake [9,40,41].
2.3.1. DPSIR Approach, Identification of the Problem, and Analysis of the Available Data
The flow chart of the DPSIR approach for the integrated water quality management model (Figure 3) consists of several steps and iterations. The first step is observing the problem in the river basin and collecting and analyzing the necessary available data to solve the problems that are encountered. In rural river basins, the most common problems are the risk of eutrophication and not achieving good water status.
Using the DPSIR approach alongside ArcView, based on the collected data, an analysis is performed and the impact on water is assessed. If the data are not sufficient, it is not possible to prepare pressure quantification data, and it is therefore necessary to return to the first step and collect the necessary data.
2.3.2. Pressure Indicator Identification
For the DPSIR approach, datasets, indicators, and a geographical information system (GIS) have been used in this research for spatial analysis and presentation [37,38,39,40,41] because they provide the tools for making maps and analyzing geographic information. The authors have focused the research on nutrient pollution and eutrophication. Higher and lower pressures were analyzed based on the public, official, and available pressure, state, and impact indicators. The impact indicators used in connection with eutrophication vary depending on the water category. However, they are generally sensitive to nutrients, and are either directly (biological indicators) or indirectly (physicochemical indicators) affected by biological processes.
2.3.3. Pressure and Impact Quantification
After obtaining the first results from the analyzed indicators and data from the official public sources, if it is necessary, additional research with additional data must be conducted. When all available data is collected, data on pressures and states are interpreted. If the available data are insufficient, it is necessary to reanalyze the problem and the available data and collect new data. On the other hand, if the available data are sufficient, the pressure quantification prepared by the DPSIR approach and GIS can be used as indicators.
However, it is necessary to prepare a more precise quantification of indicators for the BASE MODEL scenario using adequate tools.
2.3.4. Modelling the Impact
According to Figure 3, if available data that has been collected are sufficient to conduct a qualitative analysis and prepare pressure quantification, it is possible to pass to the next step. If the impact assessment is not satisfactory, it is necessary to go back to the first step and check all of the available data again. If it is satisfactory, it is possible to go to the next step. Ensure that it is possible to model the impacts: the risk of not achieving good water status; the influence of the establishment of the reservoir; eutrophication; Natura 2000, environmental flow, and analysis of the old maps; hydromorphological pressures; analysis of the longitudinal profile and the cross-section of the watercourse; the input of nutrients on the characteristic points of waterbody with SWAT model; analysis of river basin to define the scenarios, basic measures, and supplementary measures.
For a better understanding of the DPSIR approach and a better impact assessment, ArcSWAT with ArcGIS is an excellent tool.
2.3.5. The SWAT Model
A large group of models can be used for river basin modelling. However, a small number of models are available and suitable for modelling agriculture in rural river basins [20,24,42,43]. The SWAT model integrates all relevant ecohydrological processes, including water flow, nutrient transport and turnover, vegetation growth, and land use and water management [18,24].
The SWAT model enables water managers to model the quality and quantity of river basin surface water and has proven to be the most suitable for small transboundary rural river basins. The model combines studies of water quantity (river discharge, surface flow, subsurface flow, irrigation, reservoirs, and lakes), water quality (weather, erosion, plant growth, nutrient cycles, pesticides, soil temperatures, agricultural land management, crop production, urban land management, and agri-environmental measures) and climate change. The model can prepare yearly, monthly, daily, or hourly simulations over long periods [41,42,43]. The model can represent sediment and nutrient load concentrations and cumulative distributions related to available public data.
The SWAT model with GIS visualization and presentation has been used to model the rural characteristics of the river basin and emphasizes the research on modelling land use and the quantification of pollution for water quality management [32,43,44]. The SWAT model is used to calculate the total maximum daily load (TMDL) and to simulate the application of various measures, including best management practice (BMP) and best agriculture practice (BAP). As Volk et al., 2009, [21], “SWAT uses readily available inputs, has the capability of routing runoff and chemical through streams and reservoirs, and allows for the addition of flows and the inclusion of measured data from point sources. Moreover, SWAT has the capability to evaluate the relative effects of different management scenarios on water quality, sediment, and agricultural chemical yield in large, ungauged basins.”
The SWAT model is set up to maximize spatial and computational efficiency. The model has fast access to input data and allows the user to study long-term effects. The model enables scenario simulation, calibration, validation, optimization, and visualization of the optimal solution [44,45,46,47]. The model can represent the hydrological response units (HRUs) in a spatially semi-distributed way.
Land use, soil, and slope heterogeneity of the model are accounted for through subbasins, but this approach ignores flow and pollutant routing between HRUs. Additionally, a weakness in the model is that a wide range of different data needs to be obtained to run the model. Numerous parameters need to be modified during calibration, which discourages modellers from using the SWAT model. Adjustments are usually not measurable because they are made using the modellers’ experiences, best knowledge, and subjective assessment of the study area [9,41]. This format keeps the model simple and supports the application of the model to almost every river basin. However, the environment is complex, and disregarding or underestimating the importance of parameters could lead to inaccurate model results and evaluations [48]. Erosion and sediment yield are estimated for each HRU with the modified universal soil loss equation (MUSLE). The SWAT model tracks the movement and transformation of several forms of nitrogen and phosphorus in the soil profile, shallow aquifer, reach, reservoir, pond, and wetland. In an innovative impact approach, pressure quantification of input pollution in water using a SWAT model and an analysis of the condition of the water ecosystem concerning the climatological-hydrological conditions and abiotic and biotic factors have been used [9].
2.3.6. Key Impact Assessment
Impact assessment modelling using the DPSIR approach and the SWAT model with GIS includes the input of nutrient data at certain points along the river basin and the waterbody, to help model the risk of not achieving good water status and eutrophication [9,27,28]. The analysis of the river basin includes the influence of the establishment of the reservoir on the place of natural retention [10,30,31], Natura 2000 [32,35,36,44], environmental flow (E-flow) [32], analysis of old maps, hydromorphological pressures, sediment analysis [9,32,35,47], and analysis of the longitudinal profile and cross-section of watercourses [29,30,47,49] to define scenarios and possible basic and supplementary measures (Figure 3).
After this step, with the relevant knowledge of the river basin’s processes, it is possible to move forward to the next step: scenario definition and the implementation of basic and supplementary measures.
2.3.7. Definition of the Future Alternative Scenarios
The aim of evaluating different water quality management scenarios (Figure 3) under different conditions and measures is to assess scenarios in terms of the future management of river basin water quality with “tailor-made” measures, including ES and human wellbeing. The scheme of the SWAT water quality management model, presented in Figure 4, was created based on the methodological scheme for assessing hydrologic services based on grey water footprint (WF), from Taffarello, D. et al. (2018) [50]. The scheme was upgraded and developed with several alternative scenarios, including assessing the impact of climate change.
The preparation of the SWAT integrated water quality management model requires basic data: the digital elevation model (DEM) data, soil type data, data on land use according to soil type, land use and land management data, climatological and meteorological monitoring station data for the regional climate model data, data from meteorological monitoring stations, data from water quality and quantity monitoring stations, and wastewater treatment plant data. Also, the quantitative and qualitative public data were used in the SWAT model for the preparation of the BASE MODEL with existing land use hydrological conditions based on a series of 30 years of data and present measures, including agriculture and wastewater treatment.
Calibration and validation of the BASE MODEL were performed using the SWAT CAP tool. After this step, it became possible to prepare different scenarios. Two past scenarios and future scenarios were created based on present land use and on 30 years of meteorological data. PAST scenarios (1a and 1b) have used past municipal wastewater and agriculture measures, and FUTURE scenarios (2a and 2b) have been constructed to reflect future agriculture and wastewater treatment measures. In addition, the FUTURE scenarios (with and without reservoir) were prepared with the planned municipal wastewater and agricultural measures in mind. These scenarios also integrated the European framework for action (COM/2009/147) was issued in April 2009 and sets out a framework to reduce the EU’s vulnerability to the impact of climate change. They were also designed based on the climate change adaptation strategies for Croatia (until 2070) [51] and Slovenia (until 2050) [52] and the results of the regional and national models of Slovenian Environmental Agency (ARSO). These relied on the future scenario (prepared on the basis of BASE MODEL) with six models, for the RCP4.5 (moderately optimistic scenario) and RCP8.5 (pessimistic scenario) for the 2020–2050 and 2070–2100 periods for the Sutla river basin (Figure 5). Six dynamically downscaled regional climate models (RCMs), CCLM4 (drivModel: CNRM-CERFACS-CNRM-CM5), CCLM4 (drivModel: MPI-M-MPI-ESM-LR), HIRHAM5, INERIS, RACMO22E and RCA4 (Figure 4), were prepared at the local river basin level using bias correction (BC) methods. To prevent unrealistic results at the daily level, BC was performed for precipitation, maximum air temperature, minimum air temperature, relative humidity, global solar radiation, and wind speed.
For the Sutla river basin, eight FUTURE scenarios (with reservoir: 2a1 RCP 4.5 2020–2050, 2a2 RCP 4.5 2070–2100, 2a3 RCP 8.5 2020–2050, and 2a4 RCP 8.5 2070–2100; and without reservoir: 2b1 RCP 4.5 2020–2050, 2b2 RCP 4.5 2070–2100, 2b3 RCP 8.5 2020–2050, and 2b4 RCP 8.5 2070–2100) were developed (Figure 4). After calculation and analysis of the PAST scenarios and the FUTURE scenarios, it is possible to propose additional supplementary measures. These are presented in this paper. Not included as part of this paper’s results are: the preparation of scenario 3 with a “tailor-made” set of measures, and the possibility for the preparation guidelines for the improvement of the methodology. This will be the subject of future research.
For each scenario, six characteristic climate models were used to obtain the variability in inputs and outputs (Figure 5).
2.3.8. Impact Assessment for Alternative Scenarios
In this step, an impact assessment for each scenario was prepared for the basic and supplementary measures, including ES (Figure 4). Usage of the SWAT model, in the BASE MODEL and all scenarios (PAST and FUTURE), showed that the most significant impact of the nutrients and sediment was on the surface water, which results in the risk of not achieving good water status and water eutrophication.
A supplementary wastewater measure related to WFD is the proposed environmental flow. Supplementary agricultural measures were selected among measures of rural development programmes (RDPs). This set of measures will be formed on the subbasin level for the hot spots which have the highest risk of eutrophication and nonachievement of good water status (including hydromorphological states).
Primarily, this assessment will emphasize the need to model impacts and take mitigation measures to adapt to climate change. Available information has been analyzed, including existing measures, water use, ecosystem requirements, analysis of the historical flow of the river before the construction of the dam, and other hydrotechnical interventions affecting the regulation of the river. Analyzing the river’s longitudinal profiles and reservoir volumes are prerequisites for maintaining the river ecosystem upstream and downstream from the reservoir and the lake ecosystem itself.
Successful management of rural areas includes various measures ranging from expensive sanitation of points and diffuse sources of pollution to low-cost solutions for pollution prevention in water bodies. If the available data are insufficient, it is necessary to reanalyze the problem and the available data, collect new data, or model the impact or scenario definition and implementation of the basic measures. If the available data are sufficient, the possibility of applying basic and supplementary measures and applying the ecosystem service as an equal WFD measure will be analyzed. The preparation of monitoring proposals for water status related to the effectiveness of the implemented optimal set of water quality management measures and the preparation of the methodology improvement guideline is not part of this article.
After that, it is possible to prepare an impact assessment for each scenario and a recommendation of the first set of supplementary measures, including the ecosystem service. It is the end of the research presented in this paper. In the next step, it will be possible to select the “tailor-made” measures for the river basin. If the “tailor-made” measures, selected using the SWAT model for the proposed scenario, give satisfying results, it will be possible to move forward to the next step. It is the monitoring of the implemented “tailor-made” measures that will help achieve the river basin environmental protection objectives. If selected “tailor-made” measures are not satisfactory, it is necessary to go back to the scenario definition to check it again. If they are satisfactory, it is possible to move forward to the next step, but if they are not, then it is necessary to check the modelling of the impact, and even to go back to the first step and recheck the available data. Each step in the flow chart is very important and must be successfully finished. The number of iterations, and any returns to the previous step or steps, depends on the results obtained at each stage.
2.4. Model Performance Objective Functions
Objective functions show that the simulated total flow is within the acceptable range. To achieve acceptable calibration and validation results for a BASE MODEL a list of model parameters was changed from default to final values for the model performance for flow. Calibration was based on the official monitoring data [52]. After the base model calibration was completed, the parameters remained fixed for further use in scenario modelling.
The calibration of the model parameters varied within an acceptable range until a satisfactory correlation was achieved between the measured and simulated data. Usually, the parameter values are changed uniformly on the catchment level. The first step in the calibration and validation process in the SWAT model is to determine the most sensitive parameters for a given basin. For the sensitivity analysis and calibration, special software called SWAT-CUP is used, which includes the sequential uncertainty fitting (SUFI-2) algorithm [53,54]. The sensitivity analysis was performed using measured data for the Sutla River. The analysis was carried out for average daily flow and monthly sediment, nitrate–nitrogen, and phosphorus levels. The default lower and upper bound parameter values for all parameters were used [9]. The defined streamflow was found to be sensitive to changes. The streamflow had the most significant impact on the model output when changed. Therefore, the most sensitive parameters were used to perform model calibration. In this study, calibration of the model was performed for daily flow and monthly sediment, nitrate–nitrogen, and phosphorous levels.
3. Results and Discussion
In relation to the main aim of this research, and according to the proposed methodology that was presented in the flow charts representing the integrated water quality management river basin model (Figure 3) and the scenario scheme (Figure 4), the research included the input data and databases that have been used. The transboundary, rural, integrated water quality management model has been developed for the Sutla river basin, and consists of a range of technically tested tools, and is presented with the obtained results and discussion related to them in the following section. All elements of the model and all tools applied in the order shown in the flow diagram (Figure 3) impact the results and their description and clarification. The results are presented with spatial and numerical presentations of the calculated sediment, nitrate–nitrogen, and phosphorus levels in the Sutla river basin. This section is divided by subheadings and provides a concise and precise description of the model results.
3.1. DPSIR Approach, Identification of the Problem, and Analysis of the Available Data
A previous study performed by the authors observed problems in the Sutla river basin [9]. The study analyzed all of the available public data, including climatological, hydrological, hydraulic, water status, and protected area monitoring programmes, as well as measures implemented in the river basin [9]. As a result, all the specific issues for the rural transboundary river basin that related to achieving the river basin’s environmental objectives were checked. This includes an analysis of natural and human activities and the human-induced input of nutrient enrichment corresponds that leads to the risk of failing good ecological status and the risk of water body eutrophication and the loss of ecosystem health, as described in Section 2.3.1. The lack of sanitation in settlements with less than 2000 PE, which involves the need to construct the third stage of purification for the settlement of Rogaška Slatina, combined with agricultural activities, represents the issues in water quality management.
The proposed measures for the locations in the Sutla river basin are the result of the DPSIR approach with GIS visual presentation [9,10]. In addition, many local and regional initiatives support filling Sutla Lake with water again, building tourist and recreational facilities, and using water for irrigation and drinking water supply. All of the stated facts indicate an urgent need to improve the water quality of the Sutla River and redefine Sutla Lake as a multipurpose lake [10].
3.2. Pressure Indicator Identification
The Sutla river basin model applies a life-cycle concept within the DPSIR framework approach, as presented in Section 2.3.2. The first analysis of the results (Table 2 shows a significant input of nutrients into the Sutla River. The identified sources are untreated municipal wastewater and excess nitrogen from agricultural land [9].
Excessive inputs of nutrients, adverse oxygen conditions due to high temperatures, and low flow rates have led to high risks of eutrophication of water. The reduced risk of eutrophication has to be based on the interests of all users of the river basin, ES, and human wellbeing. In the case of transboundary river basins, such as the river basin of the Sutla, the challenge is even greater because of various factors related to the diversity of water management, background approaches, interests, and development scenarios for the defined area. The problem of eutrophication is a problem that needs preventive and continuous work. The DPSIR framework approach for the Sutla River basin with specific datasets and indicators is presented in Table 2.
For each cluster, the authors collected all available data for the longest period possible. The sources are national monitoring systems, statistical censuses, registers, and authors focused on research on water quality, nutrients, and eutrophication. Thus, river restoration based on the revitalizating role of nature retention in water quality management and site-specific ecological requirements are urgently needed, primarily in relation to nature protection areas and recreation resorts [10,27,31]. Pressure indicators are nutrient emissions and nutrient loads for all water bodies. State indicators and monitoring indicators are phosphorus concentrations (Total P and orthophosphate) and nitrogen concentrations (Total N, NO3) for all waterbodies. Impact indicators are ecological status and macrozoobenthos (community composition, biomass), for all water bodies; phytoplankton (chlorophyll a, biovolume), Secchi depth, macrophytes, and bottom water oxygen concentrations, for waterbodies of lakes; and phytobentos (benthic algae community composition), for waterbodies of rivers and lakes [9]. GIS did not provide a visual presentation of DPSIR and only improved the indicator’s understanding (Table 2).
Constant anthropogenic pressure from point and diffuse sources of pollution on ichthyofauna are always present, as in the case of the Sutla River. The main pressures are the spatial distribution and quantification of pollution, the channeling of watercourses, and the appearance of foreign and invasive species [9,31,32].
The official monitoring system provided all input data that were used. Measures may be established when the significant pressures [33,40] have been identified and nutrient reduction objectives have been set. Most agglomerations of less than 2000 PE still use individual permeable septic tanks or emit wastewater directly into the environment.
3.3. SWAT River Basin Model—BASE MODEL
Based on the methodology from Section 2.3.4., a spatial representation of the water impact and the simulation of sediment, nitrate–nitrogen, and phosphorus levels in the Sutla river basin are given in Figure 6. The red colour represents areas with a critical level of calculated sediment and nitrate–nitrogen and phosphorus transport out of the HRUs. The critical source areas (CSAs) were determined through analysis of theBASE MODEL, i.e., where the source and transport areas connected to waterbodies coincide. For example, HRUs where the annual average sediment yield exceeded 0.5 t/ha and average nitrate–nitrogen loading from groundwater exceeded 5 kg/ha were CSAs (Figure 6). These areas have geologies and soil types that are susceptible to soil erosion and, for that reason, are subject to the action of weather forces. The spatial variability in sediment yield is influenced by many factors, particularly land use, management practice, slope, and soil characteristics. The impact of land management on erosion and nitrogen leaching and its graphical representations greatly depends on the accuracy of the spatial and attribute data used in the modelling process. The average annual sediment and nitrogen yields at the HRU level were divided into six classes (Figure 6).
The sediment source in this river catchment is spatially heterogeneous and, on average, 0.78 t/ha/year. This study shows that in certain HRUs, sediment yield can reach up to 31.61 t/ha/year (Figure 6). This value can be exceeded during periods of heavy rainfall.
The highest amount of sediment was transported from vineyards (3.51 t/ha/year), followed by arable lands (1.91 t/ha/year) (Table 3).
The areas with arable fields, especially those on shallower soils and lowland sandy soils, are exposed to nitrogen and phosphorus losses, with nitrogen and phosphorus secreted into the main river channel. Losses are spatially concentrated on agricultural land and are 1.97 kg/ha/year of N and 0.60 kg/ha/year of P on average. This study shows that in certain HRUs, nitrate–nitrogen and soluble phosphorus yield can reach up to 54.53 kg/ha/year and 12.99 kg/ha/year, respectively (Figure 6). The average highest amount of nitrate–nitrogen is transported from orchards (4.5 kg/ha/year), followed by vineyards (3.83 kg/ha/year) and arable fields (3.61 kg/ha/year). On the other hand, the average highest amount of soluble phosphorus in mineral forms is transported into the main channel from arable fields (1.7 kg/ha/year), followed by orchards (0.78 kg/ha/year) and vineyards (0.69 kg/ha/year). Modelling results for the study period between 2004 and 2014 also showed that, on average, almost 14,000 tons/year of sediment, 1741 tons/year of total nitrogen, and 125 tons/year of total phosphorus could be expected at the main catchment outlet at the confluence with the Sava River. The results showed that the main point sources (wastewater treatment plants) under normal conditions contribute minimal quantities of N (10.75 tons/year) (0.62%) and P (4.29 tons/year) (3.43%) on an average daily basis. The official monitoring system provided all input data that was used, but it is necessary to continue collecting new data and further develop the SWAT model.
Results of Indices Analysis for Algae as Eutrophication Indicators
Measured nutrients, N from agricultural activities and P from point sources, at their critical ratio can cause eutrophication of the freshwater ecosystem [9]. Algae, as a biological element of water quality, were used in water analysis and as an indicator of eutrophication. Analysis of the SWAT model results, including the available water quality data based on surveillance monitoring, was carried out by Croatian Waters; the results of the investigative monitoring were analyzed, and an analysis of the indices for the biological elements of water quality and the presence of algae as an indicator of eutrophication was performed. The indices used in the analysis are the trophic diatom index (TDI), the saprobic index (saprobity) (SI), and the nondiatom index (NDI). These indices indicate an increase in the trophy level at station Prišlin, which was particularly observable from the TDI, NDI, and poor water status. The Prišlin station data show the worst water quality due to nutrient loads (two larger settlements with the industrial areas located upstream). On the other hand, the Zelenjak and Harmica stations indicated good water status [9,10,32,35].
For the period of 2004–2012, the SWAT model and monitoring showed higher trophic state TDI and NDI values in the Sutla River. It is necessary to carry out more detailed research on biological elements of water quality in the future, especially periphyton and macrophyte vegetation, which were directly related to eutrophication. The pollutant impacts on aquatic ecosystems and other quality parameters under different development scenarios (hydrology and hydraulics, pollution, chemical parameters, and aquatic ecology) were crucial for proposing remediation measures.
3.4. Model Performance Objective Functions
The Sutla River catchment area was subdivided into 11 subbasins and 1970 HRUs. The number of HRUs in each subbasin was set by a minimum threshold area of 0%:0%:0% for land use, soil, and slope classes. The high number of HRUs is correlated with a steep topography, dispersed agricultural areas, and 39 soil types in the study area. Daily river flow time step sensitivity analysis and calibration were performed for subbasin 11 outlets for 2009–2014, with a three-year warm-up period (2001–2003) and one validation period (2004–2008). Sediment and nutrient (NO3-N, PO42−) monthly time step and river flow daily time step sensitivity analyses and calibrations were performed for the water quality monitoring point at the subbasin 11 outlets between 2004 and 2012.
Objective functions for monthly time step sediment, nitrate–nitrogen, and phosphorus calibration (Table 4) show that the model is acceptable for predicting all of them. The Nash–Sutcliff coefficient (ENS) is in the range of very good results for sediment and nitrate–nitrogen and satisfactory for phosphorus, and the negative percent bias (PBIAS) is in the range of satisfactory model performance for sediment and very good for nitrate–nitrogen and phosphorus [24].
The results of the validation in this research are in line with the calibration results.
Negative percent bias (PBIAS) (Table 4) values are in the range presented in Table 4 in the article Moriasi, D.N. et al. (2007) [53], which indicates a minor overestimation of the simulated values. Values for the ENS range from negative infinity (poor model)) to 1.0 (perfect model) [54], and related to the present results, the Nash–Sutcliffe efficiency (ENS) at daily time steps is acceptable [53].
However, the ENS coefficient is very sensitive to values that stand out from the average [53]. The SWAT model simulated good and very good streamflow trends, as simulated streamflow values do not exceed the measured streamflow data by more than 15% [54,55].
It is important to stress that quality of the calibration and validation results should have an impact on the selection of methods applied in the construction of alternative scenarios. Therefore, each of the presented scenarios in this paper was established on base model original calibration and validation. That allowed us to start scenario modelling from the same starting point. Each of the scenarios added a different multi-objective view on the present and foreseen state of the catchment. We propose that multiple variations for each scenario should be developed to better understand how to achieve each one of the objectives, which means that specific elements should be introduced gradually. Our study gradually added elements in scenario variations, such as changed agricultural management, reservoir placement, updated/foreseen network of wastewater treatment plants, and climate change data. This allowed us to better understand the impact of past or future farmland management, the efficiency of wastewater treatment plants, and reservoir placement. Effects of these elements on river water quality and quality were tested under climate change conditions. Finally, multi-objective comparative analysis results were added to the integrated water quality management model.
When modelling climate change, SWAT model parameters were not changed. The purpose of the scenarios is to investigate the impacts of changing climatic conditions in river basins on the river flow, sediment load, and nutrient load in the river.
3.5. Key Impact Assessment Analysis
In the BASE MODEL and all scenarios (PAST and FUTURE) using the SWAT model, the most significant impacts on the waterbody from river basin nutrients and sediment and the risk of not achieving good water status and water eutrophication were demonstrated. As the result of the key impact assessment analysis, the significant pressures that have affected the transboundary rural Sutla river basin can cause changes in the hydrological regime and biological elements of water quality. Nutrients are a key factor in eutrophication and should be included in the PoMs to reduce hot spots and a total load of nutrient pollution pressures. This is in the interest of all river basin users, as well as the ES and human wellbeing. Environmental objectives, linked to river water resource processes and ES, can be achieved if appropriate water quality, river flow, sediment regimes, and related river morphology are guaranteed.
The proposed eutrophication methodology assessment applies data obtained based on naturally observed values. It was not possible to simulate eutrophication by SWAT due to the lack of measured data during the period of the reservoir’s operation.
Based on a key impact analysis, an IWRM plan is the central element that ideally fulfils the requirements of different water-related policies, such as the WFD, Urban Wastewater Treatment Directive (UWWTD), Nitrate Directive (ND), and other national legislation [4,33,39].
Monitoring programmes for the assessment of eutrophication consist of two different monitoring concepts: monitoring biological quality element(s), including supporting quality elements, and monitoring nutrients (and other physicochemical quality elements) as a screening tool. Generally, monitoring of nutrients will be conducted at a higher frequency than monitoring biological quality elements [4,9,56].
Basic mandatory measures, according to UWWTD, have been implemented for agglomerations larger than 2000 PE. However, wastewater in other settlements is collected in individual permeable septic tanks if not emitted directly into small creeks and rivers. Out of a total of 54,839 residents living in the Sutla river basin, only 11,070 inhabitants are connected to the sewage system and wastewater treatment plant (WWTP).
The holistic approach defines the E-flow for the profile downstream of the dam, as presented in the paper [32], linking hydrological, morphological, and ecological characteristics based on the exploration of the Sutla River and its biological communities. The E-flow obtained by the hydrological method of vegetation, which amounts to 0.504 m3/s, should be increased to 0.68 m3/s to meet the requirements of fish bioindicators (Barbus balcanicus) and allow the ecosystem to function normally (Figure 7) [32].
Barbus balcanicus spawn between April and June, and the spawning period requires a water depth greater than 40 cm and a water velocity greater than 49 cm/s. The analysis of the river’s longitudinal profile and the Sutla Lake (reservoir) volume are prerequisites for maintaining the river ecosystem upstream and downstream from the lake ecosystem itself, and the proposal for the definition of an E-flow downstream of the dam has been prepared in previous research [32].
Based on the available data, a holistic E-flow assessment was prepared using three profiles of different locations, including Bratkovec, Luke Poljanske, and Zelenjak, in different periods of the hydrological year (dry and rainy) and following the requirements of the WFD to achieve good water status. Dams disrupt the flow of sediment and the capacity of the stream to convey sediment, with consequences for the morphology and the biota that use the river and adjacent areas. E-flow management can manage the flow and sediment regimes downstream of dams [32]. The E-flow was defined for the Bratkovec profile by linking hydrological, morphological, and ecological characteristics based on the fish bioindicator Barbus balcanicus. If the reservoir is fully restored, it will be necessary to define the E-flow again because of the importance of preserving the biodiversity of the Sutla River, which flows throughout the Natura 2000 area.
3.6. Impact Assessment for Alternative Scenarios of Future River Basin Management
After defining PAST and FUTURE scenarios for the river basin management, the numerical modelling results of the impact assessment for all scenarios are presented in Table 5. Values for Qav., year (m3/s), sediment (t), and total N (kg) for the measurement profile before the Sutla River flows into the Sava River are shown. The values for all scenarios (except the BASE MODEL) represent the average percentage increase or decrease in the value in relation to the BASE MODEL. In the brackets, the range of percentage values relative to the six models used is shown.
According to the BASE MODEL, for PAST scenarios (without and with reservoir), there was no significant change in the flow of the Sutla River. However, there was significantly more sediment in the past (72%, 81%), with the highest level of sediment calculated in the Bistrica stream. For the PAST scenarios, the values of Qav./year are similar to the values of the BASE MODEL. The values of the sediment, total N and total P are significantly higher than the value of the BASE MODEL, given the implemented wastewater and agricultural basic measures that did not exist in the past. The results show that the main point sources (wastewater treatment plants) under normal conditions contribute minimal quantities of N and P on an average daily basis. Most phosphorus pollution comes from households and industry. Approximately 20% of the population is connected to the public sewage system (UWWTD), and the influence of small settlements is important, but with the impact on the local area.
High levels of total N (38%, 53%) and total P (55%, 53%) resulted in water eutrophication in the past. The main reason was agricultural land management of fields with autumn ploughing and leaving soil bare during the winter. Significantly higher values in the past than today can be explained because basic wastewater and agriculture management measures based on new environmental policies and their obligations were implemented. We can conclude, that in relation to the results of the BASE MODEL, the main source of nitrogen pollution in the Sutla river basin was runoff from agricultural land and forest.
For FUTURE scenarios, expected mean annual flow values range from 4 to 22%, with the minimum annual flows expected to decrease −22%, with a maximum expected increase of 66%, which is in line with expected extreme events due to climate change. Expected average annual sediment values range from 4 to 25%, with maximum annual sediment values set to reach 84%. Expected average annual total N values are set to increase from 1 to 8% and total P from −5% to 6%.
Values for mean annual flow, for the FUTURE scenarios, are expected to increase, with values ranging from 4% to 22%. Values for minimum annual flows are expected to range from −13% to 5.7%, and a significant increase for values of maximum flows, ranging from 9.3% to 66%, is expected. The expected increase in annual sediment values ranges from 4% to 25%, in minimum annual sediment values ranges from −2% to 19%, and in maximum annual sediment values ranges from 19% to 84%. For total N, expected mean annual values range from 1% to 8%, minimum annual values range from −5% to −14%, and maximum annual values range from 9% to 39%. For total P, expected mean annual values range from −5% to 6%, minimum annual values range from −4% to −21%, maximum annual values range from −4% to 31%. The values of Qav./year for the FUTURE scenarios are lowest for RCP4.5 (2020–2050), followed by the values for RCP8.5 (2070–2100). In some scenarios, the range of these values shows an average flow of up to 17% (−7; 50) or 25% for sediment (−3; 84), while in total N and total P, these changes are lower.
The results of climate change scenarios indicate a potentially significant increase in Sutla River flow and sediment transport, but not for nutrients, which was the result of the basic measures that were implemented. However, hot spots in some subbasins have been identified, and the set of tailor-made measures from the catalogue of supplementary measures will be proposed. It was expected that all values would be significantly higher due to climate change, which occurs with the average flow and sediment. However, the total N and total P values were lower as N and P applications to agricultural land were better utilized. In the scenario for RCP 4.5 2020–2050 without the reservoir, the increase in value was up 4%, and in the total P, there was a decrease in value compared with the present scenario of −6%. In the reservoir scenarios, the values were slightly higher. In the RCP 4.5 2070–2100 scenario both without and with a reservoir, the values were significantly higher for flow and sediment. In the scenario RCP 8.5 2020–2050, the values were slightly lower than for RCP 4.5 2070–2100. In the scenario without the reservoir, there was even a drop in total P of −3%. In the RCP 8.5 2070–2100 scenario, higher mean values were observed, especially for average flow and sediment, but extremely large value ranges, especially large maximum values, were also observed. These scenarios indicate the possibility of highly problematic situations in the river basin. These scenarios open the discussion about the impact of RCM selection on modelling climate changes within river basin models, such as the SWAT model. This article also raises questions for the usability of the results for policy and decision makers concerning the implementation of the results for short- or long-term water strategies or water/river management plans.
In the FUTURE scenario, the spatial analysis revealed that the hot spots were in the same places as in the BASE MODEL and PAST scenarios and appropriate measures had to be applied to them. One of the very convenient, straightforward, and practical measures was applying a buffer zone 3 m from the watercourse. If there was a significant amount of sediment, soil loss, or erosion, it was necessary through agricultural education to influence agricultural land to be overgrown (and never bare). In critical cases, afforestation should be implemented to prevent erosion and sediment removal. Similar results have been presented in papers by Glavan, M. & Pintar, M., 2012; Epelde, A.M., 2014; Piniewski, M, 2017 [22,23,24], where it was concluded that for the rural Reka river basin in Slovenia, climate change scenarios exhibited a slightly stronger trend towards the long-term increase in sediment concentration, but showed that the trend could have gone in the opposite direction as well. Additionally, in the case of the Sutla River, the average results showed that the river flow increases slightly. Changes in precipitation patterns were expected to lead to increased loss of soils and nutrients through erosion and leaching processes and could result in moderately higher sediment and total nitrogen (TN) and total phosphorous (TP) concentrations than those currently observed, as in the Sutla river basin.
Data for minimum and maximum flow values indicate hydrological extremes, but also the change in the occurrence of extremes according to the seasons. A significant increase of the sediment is expected, in contrast to the little increase in total N and total P due to the basic and supplementary measures that can be implemented. Perhaps due to better soil moisture, crop nutrient uptake is better, and not so many nutrients are available for leaching and runoff. Due to the above, it is necessary for the future to choose tailor-made measures from the catalogue of supplementary measures to avoid the risk of eutrophication and the risk of not achieving good water status. These are measures of integrated water management that enable the use of ecosystem services and prevent significant sediment input and total N and total P inputs.
According to the FUTURE scenario, less flow and more sediment are predicted, thus jeopardizing the survival of the Barbus balcanicus and emphasizing the need to define E-flow.
Based on the impact results for the flow, sediment, total N, and total P, agricultural and water management measures are proposed in the Conclusion. In this paper, the last two steps shown in Figure 3 (the flow chart of the DPSIR approach for the integrated water quality management model) are not analyzed.
By evaluating the results of the proposed model and comparing them with the results of other authors in similar basins, the results were logical and acceptable. Therefore, the proposed model was acceptable for solving the problem of water quality management under the influence of climate change [16,44].
Concerning the existing situation and identified hot spots at the subbasin level, it was necessary to identify additional measures, which will be the subject of further research. Recommended measures for reducing nutrient intake from agricultural areas include agri-environmental policies, such as the implementation of a protection zone (i.e., a buffer zone for the river), and financial support for organic and ecological food production, as well as management plans for lower diffuse pollution loads, efficient organic and artificial fertilizer use. Increased nitrate and phosphorus levels in stream water has reflected changes in agricultural management, and the implementation of vegetative buffer strips (VBS) would decrease the average annual loads of sediment, nitrate nitrogen, and total phosphorus in the streamflow [25].
In further work, the most acceptable basic and supplementary measures should be defined to prepare a scenario with a “tailor-made” river basin set of measures, which will be tested in the proposed water quality management model. The idea was to prepare and test one “tailor-made” set of measures, although more than one “tailor-made” set of measures could be applied (with and without reservoir) and multi-criteria optimization could be conducted to select the optimal set of “tailor-made” measures.
The PoMs to reduce nutrient pollution pressures fulfils the requirements of WFD, UWWTD, ND, and national legislation. It must be cost-effective, and stakeholders must be brought into the discussion, including better cross-sectoral integration and payment for ES [56,57]. Considering that the Sutla river basin is transboundary, it is necessary to harmonize hydrological and water quality monitoring and the locations of monitoring stations concerning the new requirements.
The Evaluation of the Results
Other authors [21,22,23,24] studying rural river basins of similar areas in temperate continental aridity have reached similar conclusions regarding the management of rural river basin water quality, which contributes to the implementation of WFD policies and sustainable development. Future scenarios contribute to the prediction of water quantity and quality related to the establishment of the reservoir, irrigation opportunities, and tourism. The assessment here agrees with authors [16,22,23,24,25,26,27,28,29,50] who have dealt with the same issue using the SWAT model.
It should be noted that we created new data based on existing data that can be used in further research because all relevant data from both countries were collected and evaluated. Data, experience, and knowledge contributed by Slovenia were used for modelling the impact of climate change, which is especially important considering the fact that 78% of the Sutla river basin is in Slovenia.
Although Croatia and Slovenia are members of the EU, the special problem was the collection of data because each state has its own hydrological and meteorological measuring stations, and only Croatia has water quality stations. The administrations of the states collect and process various data in the river basin, and prepare their own studies. Each state implements its own water policy because there is no single river basin management plan, and certain water problems are solved bilaterally.
The common practice in the past with overexploitation of river water for various uses must be limited, especially in the light of the impact of climate change and the increasing likelihood of extremely dry and wet periods. The development should coincide with environmental policy, including the protection of aquatic resources.
Despite the fact that the Sutla River is the national border between Croatia and Slovenia, it is the important bridge linking inhabitants on both sides of the river that have been living together for centuries. The prerequisite for successful water quality management of this transboundary river basin is better cooperation between Croatia and Slovenia to avoid negative experiences with eutrophication from the past.
4. Conclusions
Seasonal hydrological extremes are especially important in water quality management. High temperatures and low flow in the watercourse pose a threat to the aquatic ecosystem. Also, the intensive precipitation results in greater runoff and more intensive leaching of sediment and nutrients, and with the runoff of sediment and nutrients to the river, protected species are endangered. The increased amount of sediment poses a special threat to the fish, more than the increased amount of nutrients.
The presented DPSIR approach for the integrated water quality management model is able to prepare a reliable water impact assessment and based on the analyzed scenarios propose an optimal set of measures that should significantly improve the achievement of environmental goals. The approach is concentrated on water quality, including sediment, total nitrogen, and total phosphorus load. The proposed methodology for eutrophication assessment applies the DPSIR approach in combination with GIS spatial analysis and the SWAT model.
The presented research contributes to the knowledge and understanding of the impact of climate change using long-term predictions of six different RCMs on the level of local river basin quantity (river flow) and quality (sediment load, total nitrogen load, and total phosphorus load) states of surface waters.
The application of the developed methodology has proven to be appropriate for the Sutla river basin case study. This method enables the broader acquisition of basic knowledge and includes natural processes and sources of pollution. The analysis of the eutrophication process and decreasing the risk of eutrophication by selecting the optimal set of mitigation measures, would protect endangered species, especially Barbus balcanicus.
As a result of the applications of the developed methodology, the impact of the population and agriculture in the Sutla river basin, the possible restructuring of the Sutla Lake/Vonarje Reservoir, and the impact of climate change are acceptable.
The official monitoring system provided all of all the input data that were used, and for the further development of the SWAT model, it is necessary to continue collecting new data. In the future, it will be necessary to carry out more detailed research on biological elements of water quality, especially periphyton and macrophyte vegetation, which are directly related to eutrophication.
The results of this study show that decisions made regarding the introduction of measures for preserving water quantity and quality, based on BASE MODEL and PAST scenarios, and FUTURE climate change impact scenarios, need to be discussed in depth among decision-makers and policymakers before the implementation of additional “tailor-made” measures. The proposed model brings policymakers the opportunity to manage the quality of river basin water holistically and make decisions related to the application of optimal, “tailor-made” river basin measures that include basic and supplementary measures and ES.
In future research, “tailor-made” measures for reducing hot spots of nutrients in the Sutla river basin should be proposed and verified with a new scenario that includes the optimal set of “tailor-made” measures within the developed integrated water quality management model and with SWAT support. The development of scenarios with different sets of “tailor-made” measures and the selection of optimal measures with multicriteria optimization methods should be also investigated. The scientific contribution of the presented research consists of the innovative integrated water quality management model for rural and transboundary river basins developed here, the methodology for the development of scenario analyses that include the impact of climate change in the future, and the implementation of measures.
This approach is implemented in the Sutla river basin case study, but the methodology could be implemented on similar transboundary rural river basins. Further and widespread application of this approach will enable a more comprehensive acquisition of basic knowledge for the river basin, which includes natural processes, pollution generation, and a decreasing risk of eutrophication.
Author Contributions
Conceptualization, G.Ć.-F., B.K. and M.G.; methodology, G.Ć.-F., B.K. and M.G; software, G.Ć.-F. and M.G.; validation, G.Ć.-F. and M.G.; formal analysis, G.Ć.-F., B.K. and M.G.; investigation, G.Ć.-F.; resources, G.Ć.-F.; data curation, G.Ć.-F.; writing—original draft preparation, G.Ć.-F., B.K. and M.G.; writing—review and editing, G.Ć.-F., B.K. and M.G.; visualization, G.Ć.-F., B.K. and M.G.; supervision, B.K.; project administration, B.K.; funding acquisition, B.K. and M.G. All authors have read and agreed to the published version of the manuscript.
Funding
The research for this article and the publication of this article were funded by the University of Rijeka within the projects “Implementation of Innovative Methodologies, Approaches and Tools for Sustainable River Basin Management” (UNIRI-TEHNIC-18-129) and “Hydrology of Water Resources and Identification of Flood and Mudflow Risk in Karst” (UNIRI-TEHNIC-18-54). The research for this article and publication of this article were further funded by the University of Ljubljana within the OPTAIN project (OPtimal strategies to retAIN and re-use water and nutrients in small agricultural catchments across different soil-climatic regions in Europe, cordis.europa.eu) which has received funding from the European Union’s Horizon 2020 research and innovation programme under grant agreement No. 862756.
Acknowledgments
Thanks to Luka Honzak for interpreting the climate database prepared by the Slovenian Environmental Agency—ARSO on the base modelled future scenario with six models, for the RCP 4.5 (moderately optimistic scenario) and RCP 8.5 (pessimistic scenario) for the periods 2020–2050 and 2070–2100.
Conflicts of Interest
The authors declare no conflict of interest.
References
- Ćosić-Flajsig, G.; Karleuša, B.; Kompare, B. Planning wastewater collection and treatment in agglomerations below 2000 PE in protected areas. In Proceedings of the 13th International Symposium on Water Management and Hydraulic Engineering, Bratislava, Slovakia, 9–12 September 2013. [Google Scholar]
- Global Water Partnership—GWP. Integrated Water Resources Management. TAC Backgr. Pap. 2000, 4. [Google Scholar]
- European Union (EU). EU Water framework Directive, Directive 2000/60/EC. In European Parliament and Council; European Union: Maastricht, The Netherlands, 2000. [Google Scholar]
- European Environment Agency. (EEA) Report. European Water Assessment of Status and Pressures; No 7/2018; Publication Office of the European Union: Luxembourg, 2018; ISSN 1977-8449. [Google Scholar] [CrossRef]
- The Water Framework Directive Will Not Be Revised. Available online: https://watereurope.eu/the-water-framework-directive-will-not-be-revised (accessed on 3 May 2021).
- European Commission. Communication from the Commission to the European Parliament, the Council, the European Economic and Social Committee and the Committee of the Regions a Blueprint to Safeguard Europe’s Water Resources. COM/2012/0673. Final. 2012. Available online: http://eur-lex.europa.eu/legal-content/EN/TXT/?uri=CELEX:52012DC0673 (accessed on 16 September 2021).
- Pavić Rogošić, L. Ruralni razvoj u Hrvatskoj (Rural Development in Croatia). In Proceedings of the EU-Croatia Joint Consultative Committee, 8. Sastanak, Zagreb, Croatia, 27 November 2011. [Google Scholar]
- Eurostat Regional Yearbook 2010, A Revised Urban-Rural Typology. Available online: https://ec.europa.eu/eurostat/web/productsstatistical-books/-/KS-HA-10-001-15 (accessed on 3 May 2021).
- Ćosić-Flajsig, G.; Karleuša, B.; Vučković, I.; Glavan, M. Analysis of the eutrophication factors in the Sutla River Basin. Acta Hydrol. Slovaca 2017, 18, 290–300. [Google Scholar]
- Ćosić-Flajsig, G.; Globevnik, L.; Karleuša, B. Water Quality of the river Sutla and possibility of river restoration. In Proceedings of the People, Buildings and Environment 2014, An International Scientific Conference, Kroměříž, Czech Republic, 15–17 October 2014; pp. 531–544. [Google Scholar]
- Voulvoulis, N.; Arpon, K.D.; Giakoumis, T. The EU Water Framework Directive: From great expectations to problems with implementation. Sci. Total. Environ. 2017, 575, 358–366. [Google Scholar] [CrossRef] [PubMed] [Green Version]
- Giakoumis, T.; Voulvoulis, N. The Transition of EU Water Policy Towards the Water Framework Directive’s Integrated River Basin Management Paradigm. Environ. Manag. 2018, 62, 819–831. [Google Scholar] [CrossRef] [Green Version]
- Bouraoui, F.; Grizzetti, B.; Adelsköld, G.; Behrendt, H.; De Miguel, I.; Silgram, M.; Gómez, S.; Granlund, K.; Hoffmann, L.; Kronvang, B.; et al. Basin characteristics and nutrient losses: The EUROHARP catchment network perspective. J. Environ. Monit. 2009, 11, 515–525. [Google Scholar] [CrossRef] [PubMed]
- Kronvang, B.; Borgvang, S.A.; Barkved, L.J. Towards European Harmonized Procedures for Quantification of Nutrient Losses from Diffuse Sources the EUROHARP project. J. Environ. Monit. 2009, 11, 503–505. [Google Scholar] [CrossRef]
- Schoumans, O.F.; Silgram, M.; Groenendijk, P.; Bouraoui, F.; Andersen, H.E.; Kronvang, B.; Behrendt, H.; Arheimer, B.; Johnsson, H.; Panagopoulos, Y.; et al. Description of nine nutrient loss models: Capabilities and suitability based on their characteristics. J. Environ. Monit. 2009, 11, 506–514. [Google Scholar] [CrossRef]
- Čerkasova, N.; Umgiesser, G.; Erturk, A. Development of a hydrology and water quality model for a large watershed to investigate the impacts of climate change—A SWAT application. Ecol. Eng. 2018, 124, 99–115. [Google Scholar] [CrossRef]
- Abbaspour, K.C.; Rouholahnejad, E.; Vaghefi, S.; Srinivasan, R.; Yang, H.; Kløve, B. A continental-scale hydrology and water quality model for Europe: Calibration and uncertainty of a high-resolution large-scale SWAT model. J. Hydrol. 2015, 524, 733–737. [Google Scholar] [CrossRef] [Green Version]
- Gassman, P.W.; Sadeghi, A.M.; Srinivasan, R. Applications of the SWAT Model Special Section: Overview and Insights. J. Environ. Qual. 2014, 43, 1–8. [Google Scholar] [CrossRef]
- Krysanova, V.; Arnold, J.G. Advances in ecohydrological modelling with SWAT—A review. Hydrol. Sci. J. 2008, 53, 939–947. [Google Scholar] [CrossRef]
- Kersebaum, K.C.; Steidl, J.; Bauer, O.; Piorr, H.-P. Modelling scenarios to assess the effects of different agricultural management and land use options to reduce diffuse nitrogen pollution into the river Elbe. Phys. Chem. Earth Parts A/B/C 2003, 28, 537–545. [Google Scholar] [CrossRef]
- Volk, M.; Fohrer, N.; Schmalz, B.; Ullrich, A. Application of the SWAT model for ecohydrological modelling in Germany. CAB Int. Soil Hydrol. Land Use Agric. 2011, 176–195. [Google Scholar] [CrossRef]
- Piniewski, M.; Szcześniak, M.; Huang, S.; Kundzewicz, Z. Projections of runoff in the Vistula and the Odra river basins with the help of the SWAT model. Hydrol. Res. 2017, 49, 303–317. [Google Scholar] [CrossRef]
- Epelde, A.M.; Cerro, I.; Sánchez-Pérez, J.M.; Sauvage, S.; Srinivasan, R.; Antigüedad, I. Application of the SWAT model to assess the impact of changes in agricultural management practices on water quality. Hydrol. Sci. J. 2015, 60, 825–843. [Google Scholar] [CrossRef]
- Glavan, M.; Pintar, M. Modeling of Surface Water Quality by Catchment Model SWAT. In Studies on Water Management Issues; InTech: Vienna, Austria, 2012; Available online: www.intechopen.com (accessed on 16 September 2021)ISBN 978-953-307-961-5.
- Glavan, M.; Bele, S.; Curk, M.; Pintar, M. Modelling Impacts of a Municipal Spatial Plan of Land-Use Changes on Surface Water Quality—Example from Goriška Brda in Slovenia. Water 2020, 12, 189. [Google Scholar] [CrossRef] [Green Version]
- Carvalho, L.; Mackay, E.B.; Cardoso, A.C.; Baattrup-Pedersen, A.; Birk, S.; Blackstock, K.L.; Borics, G.; Borja, A.; Feld, C.K.; Ferreira, M.T.; et al. Protecting and restoring Europe’s waters: An analysis of the future development needs of the Water Framework Directive. Sci. Total. Environ. 2018, 658, 1228–1238. [Google Scholar] [CrossRef] [PubMed]
- Rismal, M. Vodna akumulacija Vonarje je že 28 let prazna (The Vonarje water reservoir has been empty for 28 years). In Urbani Izziv; Posebna Izdaja: Ljubljana, Slovenia, 2016. [Google Scholar]
- European assessment of eutrophication abatement measures across land-based sources, inland, coastal and marine waters. In ETC/ICM Technical Report—2/2016; European Environment Agency: Copenhagen, Denmark, 2016. Available online: http://water.eionet.europa.eu (accessed on 19 May 2017)ISBN 978-3-944280-55-4.
- Projekt FRISCO1. FRISCO1 (Cross-Border Harmonised Slovenian-Croatian Flood Risk Reduction 1–Non Structural Measures) Project EU The Cooperation Programme INTERREG V-A Slovenia–Croatia; 2014–2020. Available online: https://frisco-project-eu/sl/porecja/sotla/ (accessed on 3 May 2021).
- ARSO. Atlas Okolja (Environmental Atlas). FRISCO Project EU. Available online: http://gis.arso.gov.si/atlasokolja (accessed on 3 May 2021).
- Šemnički, P.; Sutla, R. Natura 2000 Područje (Sutla River—Natura 2000 Area). In Javna Ustanova za Upravljanje Zaštićenim Dijelovima Prirode Krapinsko-Zagorske Županije; InTech: Rijeka, Croatia, 2014. [Google Scholar]
- Ćosić-Flajsig, G.; Vučković, I.; Karleuša, B. An Innovative Holistic Approach to an E-flow Assessment Model. Civ. Eng. J. 2020, 6, 2188–2202. [Google Scholar] [CrossRef]
- Commission Staff Working Document, Report on the progress in implementing the Water Framework Directive Programmes of Measures, Accompanying the document: Communication from the Commission to the European Parliament and the Council. In The Water Framework Directive and the Floods Directive: Actions towards the “Good Status” of EU Water and to Reduce Flood Risks; European Commission: Brussels, Belgium, 2015; COM (2015), 50 Final.
- European Communities. Common Implementation Strategy for the Water Framework Directive (2000/60/EC), Guidance document No. 24 River Basin Management in a Changing Climate. Tech. Rep. 2009, 40. Available online: http://ec.europa.eu (accessed on 16 September 2021).
- Karleuša, B.; Rubinić, J.; Radišić, M.; Krvavica, N. Analysis of Climate Change Impact on Water Supply in Northern Istria (Croatia). Teh. Vjesn. Tech. Gaz. 2018, 25, 366–374. [Google Scholar] [CrossRef]
- Glavan, M.; Ceglar, A.; Pintar, M. Assessing the impacts of climate change on water quantity and quality modelling in small Slovenian Mediterranean catchment—Lesson for policy and decision makers. Hydrol. Process. 2015, 29, 3124–3144. [Google Scholar] [CrossRef]
- Ćosić-Flajsig, G.; Vučković, I.; Karleuša, B. Stanje voda rijeke Sutle i mogućnosti restauracije rijeke (Water status of Sutla river and possibilities of river restoration). In Proceedings of the 6. Hrvatska Konferencija o Vodama, Hrvatske vode na Investicijskom valu (6 th Croatian Water Conference with International Participation, Croatian Waters on the Investment Waves), Opatija, Croatia, 2–23 May 2015; pp. 297–305. [Google Scholar]
- IMPRESS. Guidance for the Analysis of Pressures and Impacts in Accordance with the Water Framework Directive, Common Implementation Strategy Working Group 2.1; Office for Official Publications of the European Communities: Luxembourg, 2002; COM (2012) 710 Final; Available online: http://forum.Europa.eu.int/Public/irc/env/wfdlibrary (accessed on 12 July 2021)ISBN 92-894-5123.
- Report from the Commission to the European Parliament and the Council on the implementation of the Water Framework Directive (2000/60/EC) River Basin Management Plans; European Commission: Brussels, Belgium, 2012.
- Guipponi, C. From the DPSIR Reporting Framework to a System for a Dynamic and Integrated Decision-Making Process. In Proceedings of the MULINO Conference on “European Policy and Tools for Sustainable Water Management”, Venice, Italy, 21–23 November 2002. [Google Scholar]
- Ćosić-Flajsig, G.; Karleuša, B. An Approach to Water Quality Management in Rural Areas. In Proceedings of the International Scientific Conference People, Buildings and Environment 2014 (PBE2014), Kroměříž, Czech Republic, 15–17 October 2014; Available online: www.fce.vutbr.cz/ekr/PBE (accessed on 3 May 2021).
- Brzozowski, J.; Miatkowski, Z.; Śliwiński, D.; Smarzyńska, K.; Śmietanka, M. Application SWAT Model to Small Agriculture Catchment in Poland. In Proceedings of the International SWAT Conference, Boulder, CO, USA, 3–7 August 2009; pp. 163–170. [Google Scholar]
- Mihelic, R.; Cop, J.; Jakše, M.; Štampar, F.; Majer, D.; Tojnko, S.; Vršic, S. Guidelines for Professionally Justified Fertilization (Smernice za Strokovno Utemeljeno Gnojenje); Ministry of Agriculture, Forestry and Food of Republic of Slovenia: Ljubljana, Slovenia, 2010.
- Gassman, P.W.; Reyes, M.R.; Green, C.H.; Arnold, J.G. The Soil and Water Assessment Tool: Historical Development, Application, and Future Research Directions. Trans. Asabe 2017, 50, 1211–1250. [Google Scholar] [CrossRef] [Green Version]
- Arnold, J.G.; Moriasi, D.N.; Gassman, P.W.; Abbaspour, K.C.; White, M.J.; Srinivasan, R.; Santhi, C.; Harmel, R.D.; van Griensven, A.; van Liew, M.W.; et al. Swat: Model Use, Calibration, and Validation. Trans. Asabe 2012, 55, 1491–1508. [Google Scholar] [CrossRef]
- Tuppad, P.; Kannan, N.; Srinivasan, R.; Rossi, C.G.; Arnold, J.G. Simulation of Agricultural Management Alternatives for Watershed Protection. Water Resour. Manag. 2010, 24, 3115–3144. [Google Scholar] [CrossRef]
- Neitsch, S.L.; Arnold, J.G.; Kiniry, J.R.; Williams, J.R. Soil and Water Assessment Tool Theoretical Documentation—Version 2005; Agricultural Experiment Station, Blackland Research Center, Agricultural Research Service, Grassland, Soil and Water Research Laboratory: Temple, TX, USA, 2005.
- Abbaspour, K.C.; Yang, J.; Maximov, I.; Siber, R.; Bogner, K.; Mieleitner, J.; Zobrist, J.; Srinivasan, R. Modeling hydrology and water quality in the pre-alpine/alpine Thur watershed using SWAT. J. Hydrol. 2007, 333, 413–430. [Google Scholar] [CrossRef]
- Douglas-Mankin, K.R. Soil and Water Assessment Tool (SWAT) Model, Current Development and Application. Am. Soc. Agric. Biol. Eng. 2010, 53, 1423–1431. [Google Scholar] [CrossRef]
- Taffarello, D.; Srinivasan, R.; Mohor, G.S.; Guimarães, J.L.B.; Calijuri, M.D.C.; Mendiondo, E.M. Modeling freshwater quality scenarios with ecosystem-based adaptation in the headwaters of the Cantareira system, Brazil. Hydrol. Earth Syst. Sci. 2018, 22, 4699–4723. [Google Scholar] [CrossRef] [Green Version]
- Strategija Prilagodbe Klimatskim Promjenama u Republici Hrvatskoj za razdoblje do 2040. Godine s Pogledom na 2070. Godinu (Strategy for Adaptation to Climate Change in the Republic of Croatia for the Period Up to 2040 with a View to 2070). NN 46/2020. Available online: https://narodne-novine.nn.hr/clanci/sluzbeni/2020_04_46_921.html (accessed on 16 September 2021).
- ARSO. Ocena Podnebnih Sprememb v Sloveniji do Konca 21. Stoletja (Assessment of Climate Change in Slovenia by the End of the 21st Century). 2019. Available online: https://meteo.arso.gov.si/uploads/probase/www/climate/text/sl/publications/OPS21_povzetek_posodobljeno.pdf (accessed on 16 September 2021).
- Krause, P.; Boyle, D.P.; Bäse, F. Comparison of different efficiency criteria for hydrological model assessment. Adv. Geosci. 2005, 5, 89–97. [Google Scholar] [CrossRef] [Green Version]
- Moriasi, D.N.; Arnold, J.G.; Van Liew, M.W.; Bingner, R.L.; Harmel, R.D.; Veith, T.L. Model Evaluation Guidelines for Systematic Quantification of Accuracy in Watershed Simulations. Trans. ASABE 2007, 50, 885–900. Available online: https://doi.org/10.13031/2013.23153 (accessed on 16 September 2021). [CrossRef]
- Johnston, J.M.; McGarvey, D.J.; Barber, M.C.; Laniak, G.; Babendreier, J.; Parmar, R.; Wolfe, K.; Kraemer, S.R.; Cyterski, M.; Knightes, C.; et al. An Integrated Modeling Framework for Performing Environmental Assessments: Application to Ecosystem Services in the Albemarle Pamlico Basins (NC and VA, USA). Ecol. Modeling 2011, 222, 2471–2484. [Google Scholar] [CrossRef]
- Vlachopoulou, M.; Coughlin, D.; Forrow, D.; Kirk, S.; Logan, P.; Voulvoulis, N. The Potential of Using the Ecosystem Approach in the Implementation of the EU Water Framework Directive. Sci. Total Environ. 2014, 470, 684–694. [Google Scholar] [CrossRef]
- Ćosić-Flajsig, G.; Karleuša, B.; Vučković, I. Analiza značaja upravljanja sedimentom na primjeru rijeke Sutle (Analysis of the importance of sediment management on the example of the river Sutla). In Okrugli stol s Međunarodnim Sudjelovanjem, Nanos u Vodnim Sustavima—Stanje i Trendovi (The Round Table with International Participation, Sediment in Water Systems—Current State and Trends); Oskoruš, D., Rubinić, J., Eds.; Varaždin MIODIO d.o.o: Rijeka, Croatia, 2020; pp. 37–48. [Google Scholar]
Figure 1.
Transboundary Sutla river basin: (a) river network and subbasins, precipitation stations, and climate change model points; (b) land use of the Sutla river basin, river network, and subbasins and UWWTPs. Data source: Geodetic Survey of the Republic of Slovenia, Ministry of Agriculture, Forest and Food RS, Ministry for Agriculture RH, Ministry of Environment and Spatial planning RS, Copernicus Land Monitoring Service EU, Year: 2021.

Figure 2.
Transboundary Sutla river basin: (a) location of Sutla Lake, surface water bodies, and monitoring stations [18]; (b) Sutla Lake in the past [9]; (c) Sutla Lake in 2019 [9].

Figure 3.
Flow chart of the DPSIR approach for the integrated water quality management model.

Figure 4.
Scheme of the SWAT integrated water quality management model.

Figure 5.
Climate models: (a) average temperature (°C), BC deviation from 1981–2010 related to RCP 4.5 and RCP 8.5, six characteristic climate models and periods; (b) average precipitation (mm), BC deviation from 1981–2010 related to RCP 4.5 and RCP 8.5, and six characteristic climate models and periods.

Figure 6.
Spatial representation of simulated sediment, nitrate–nitrogen and phosphorus levels in the Sutla river basin for the 2004–2012 period [9].
Figure 6.
Spatial representation of simulated sediment, nitrate–nitrogen and phosphorus levels in the Sutla river basin for the 2004–2012 period [9].

Figure 7.
Swamp (hrv.: potočna mrena) Barbus balcanicus..


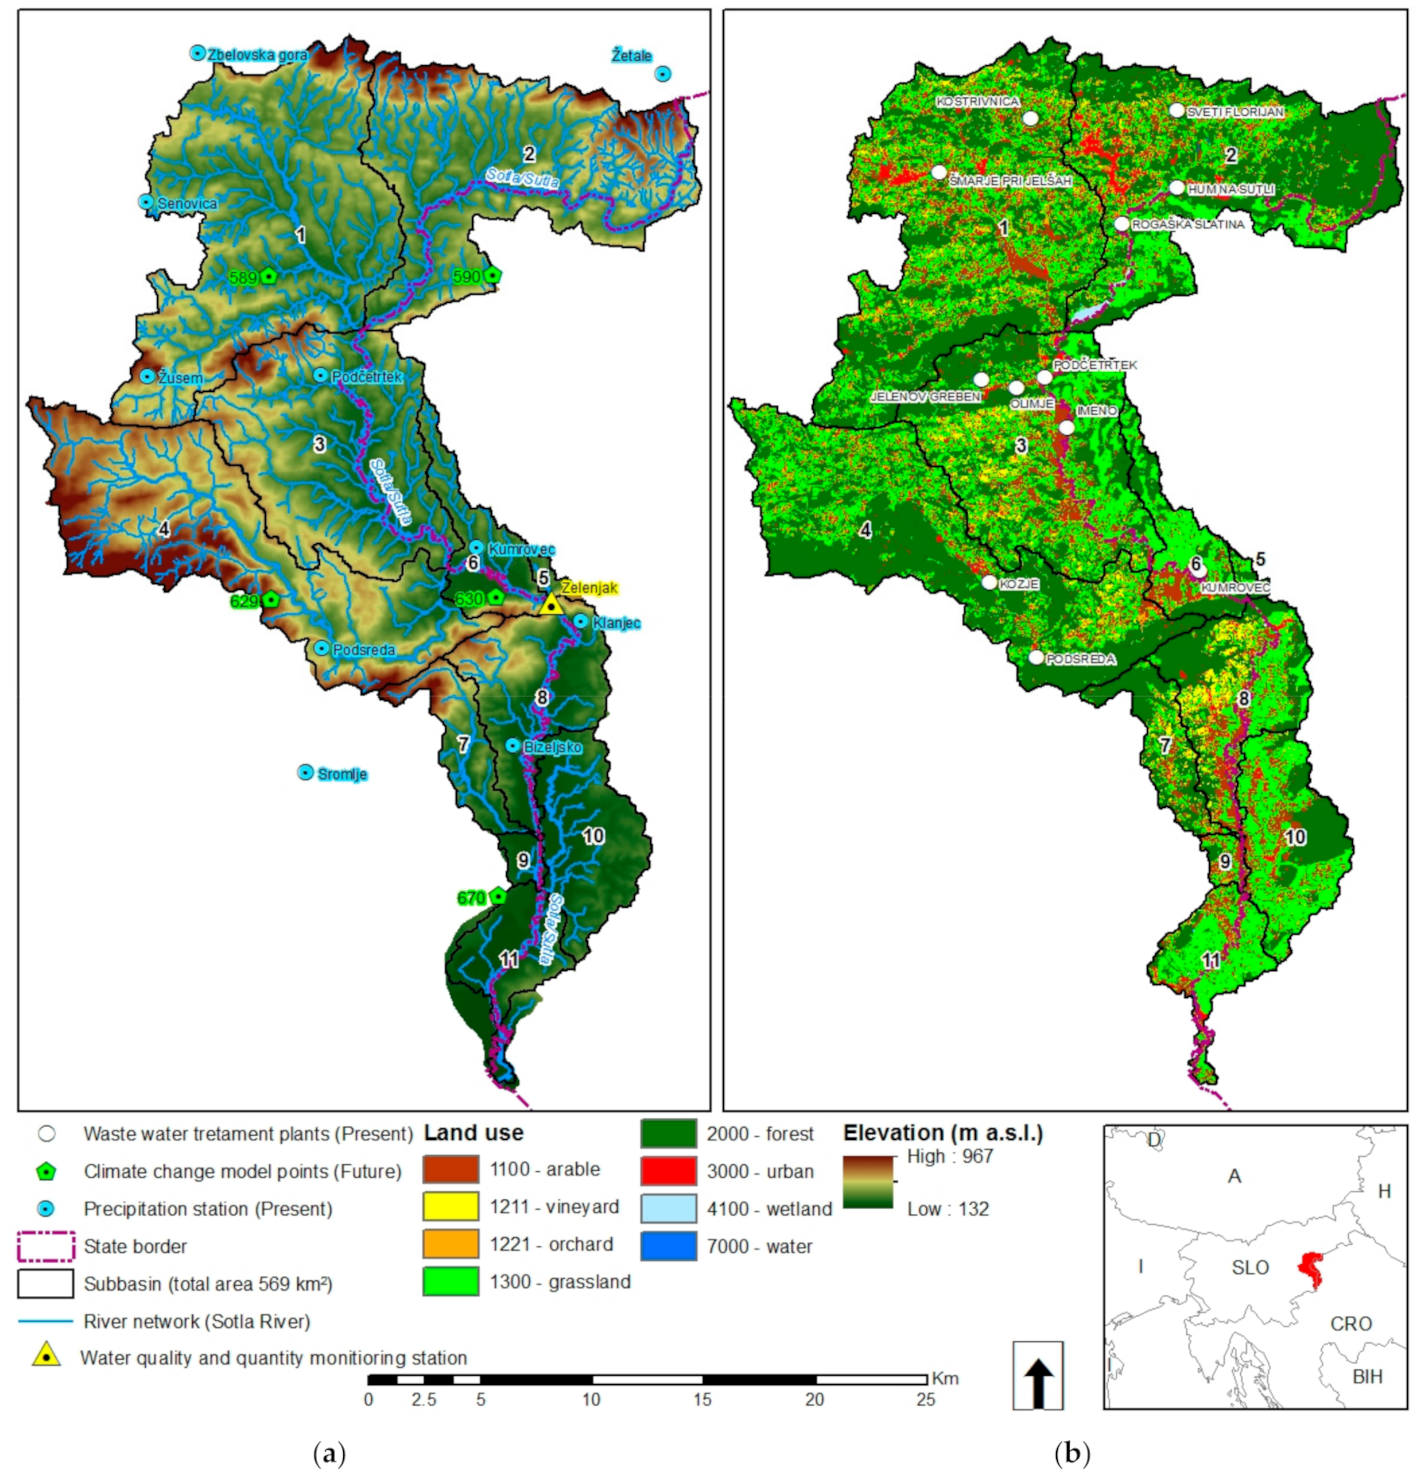
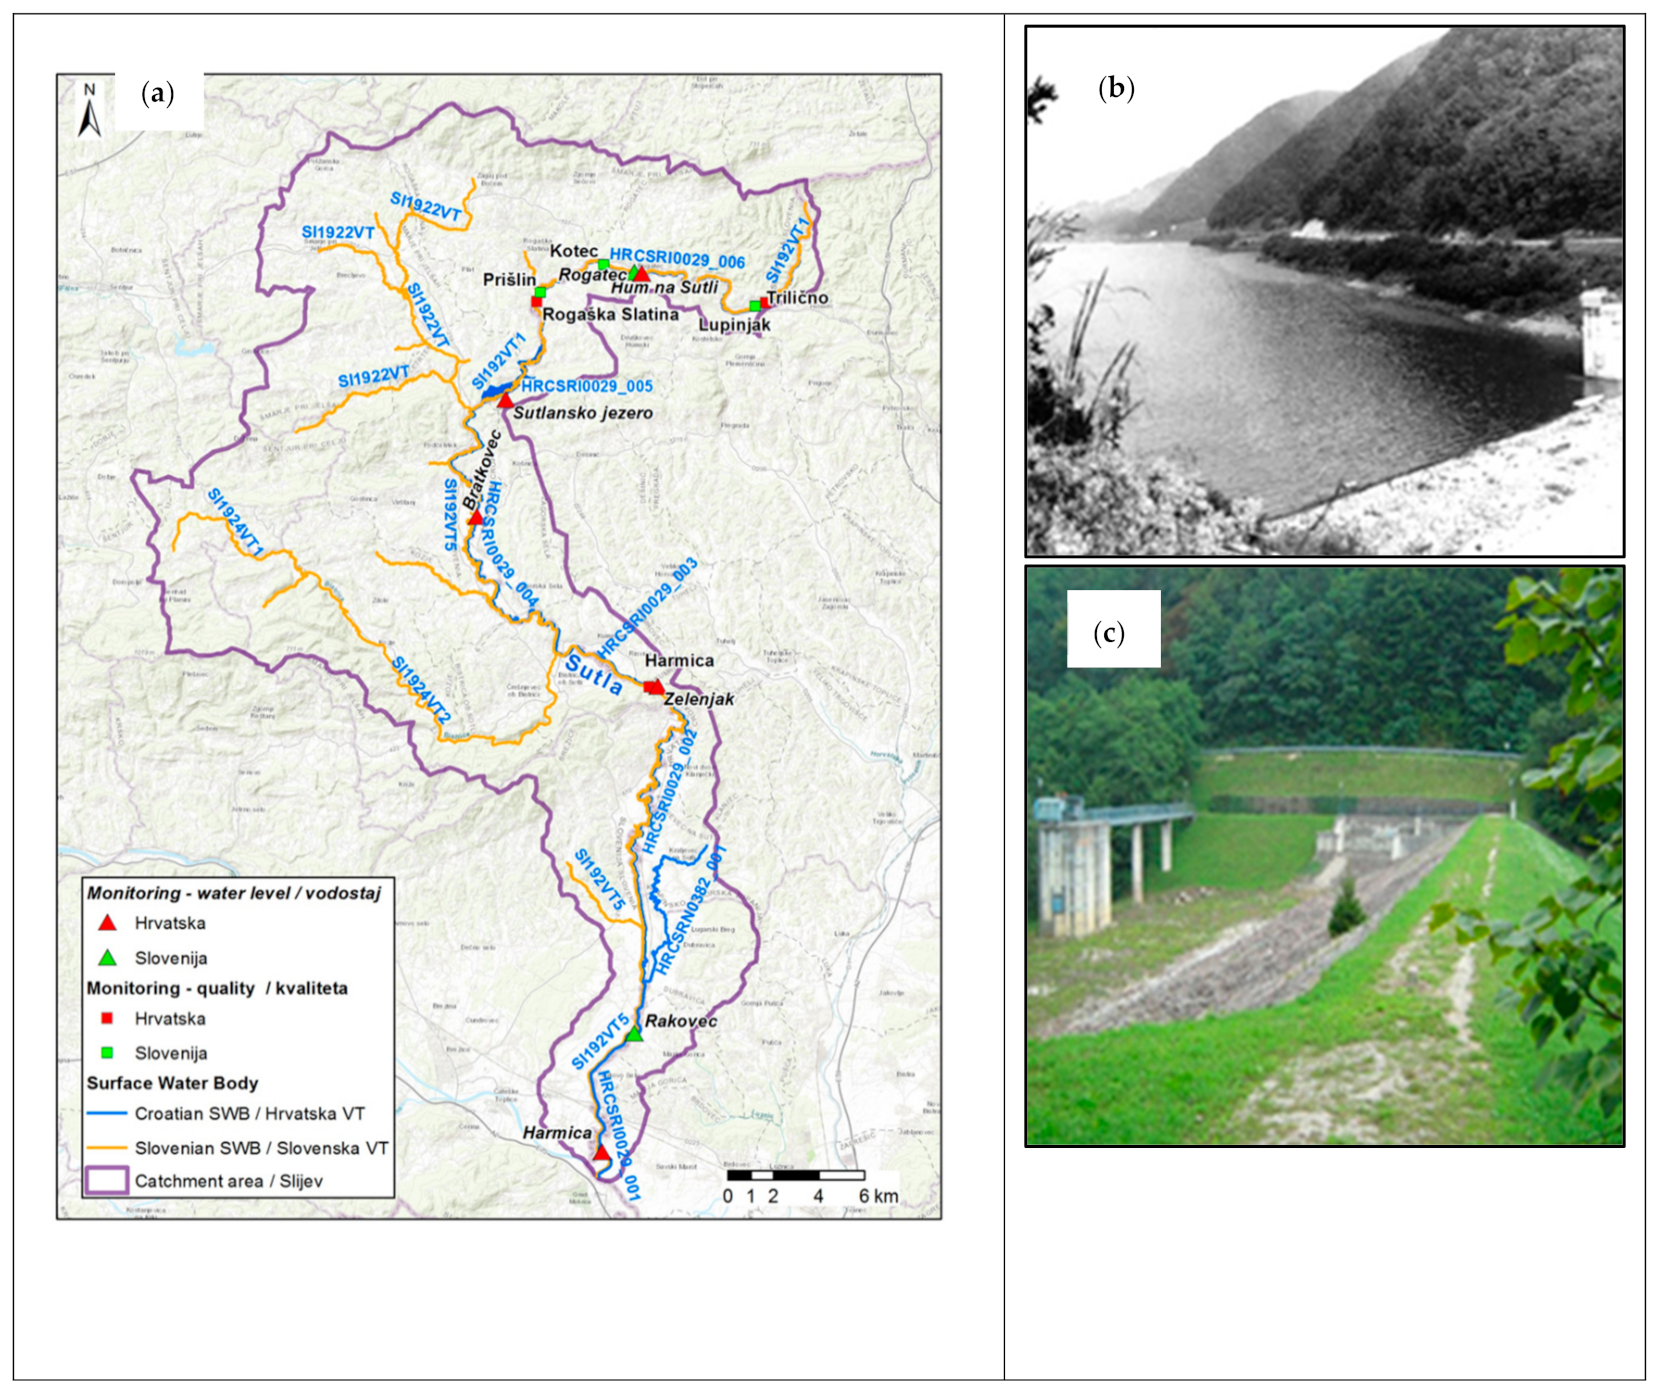
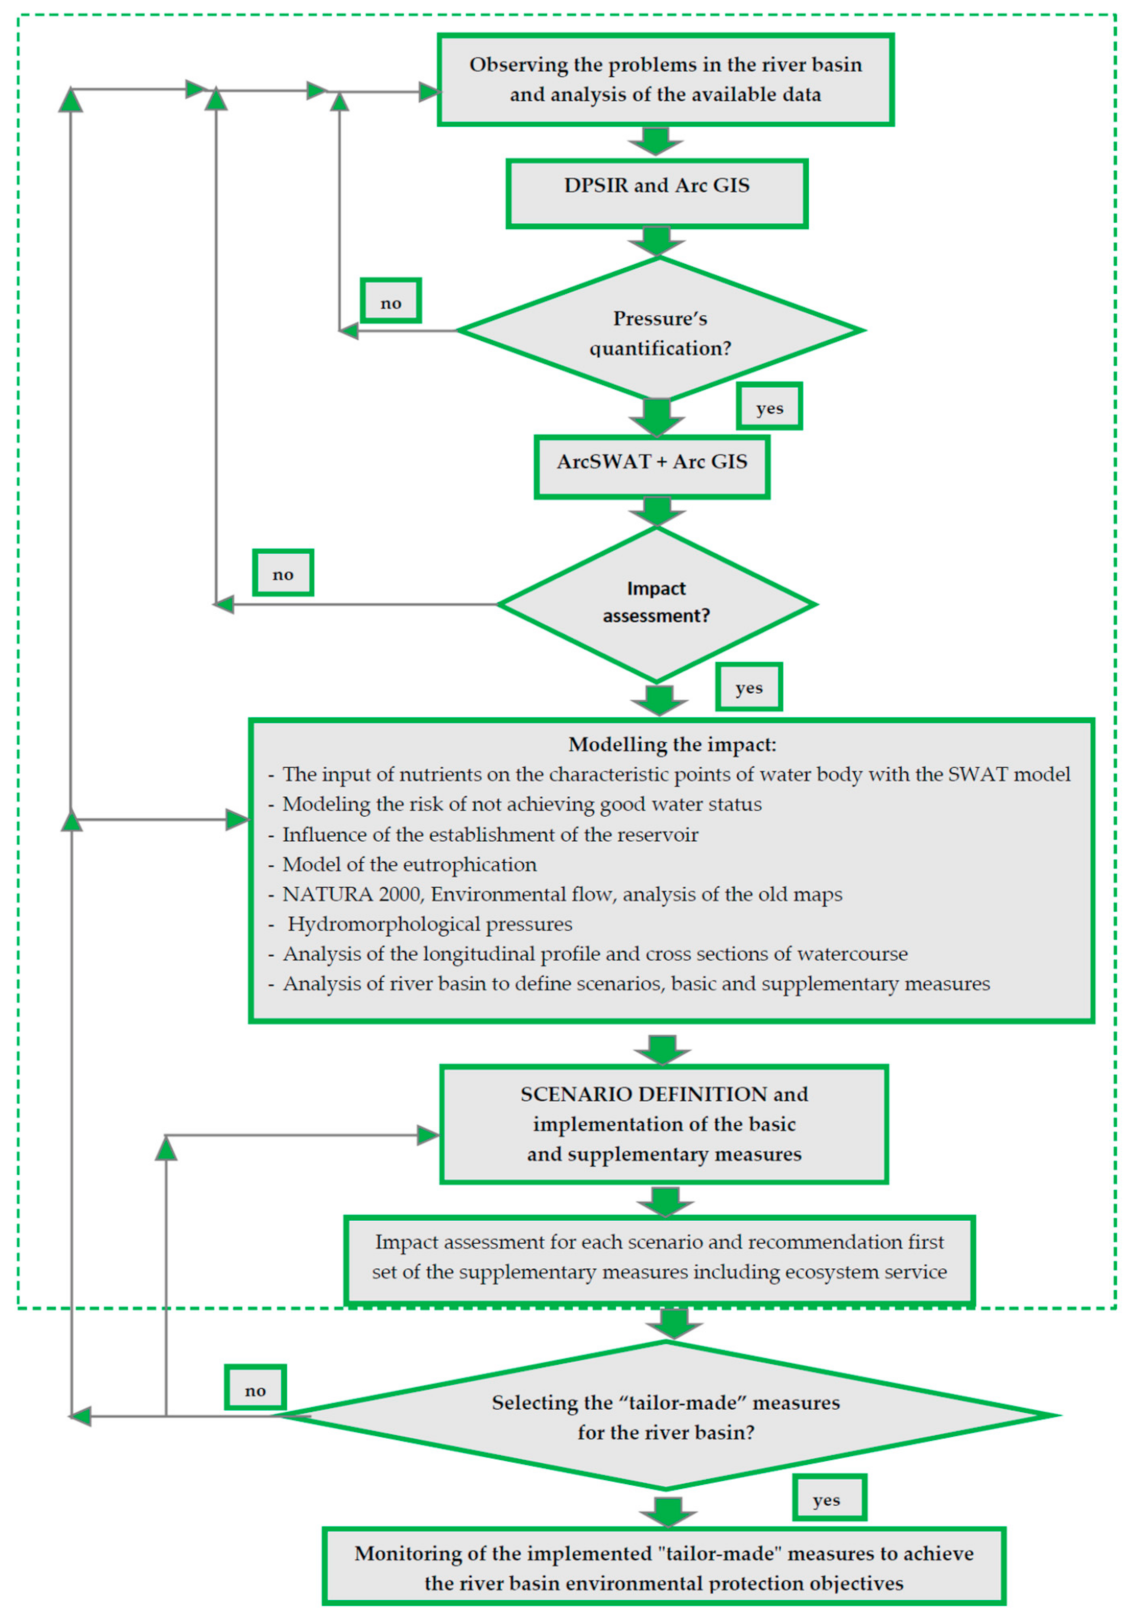
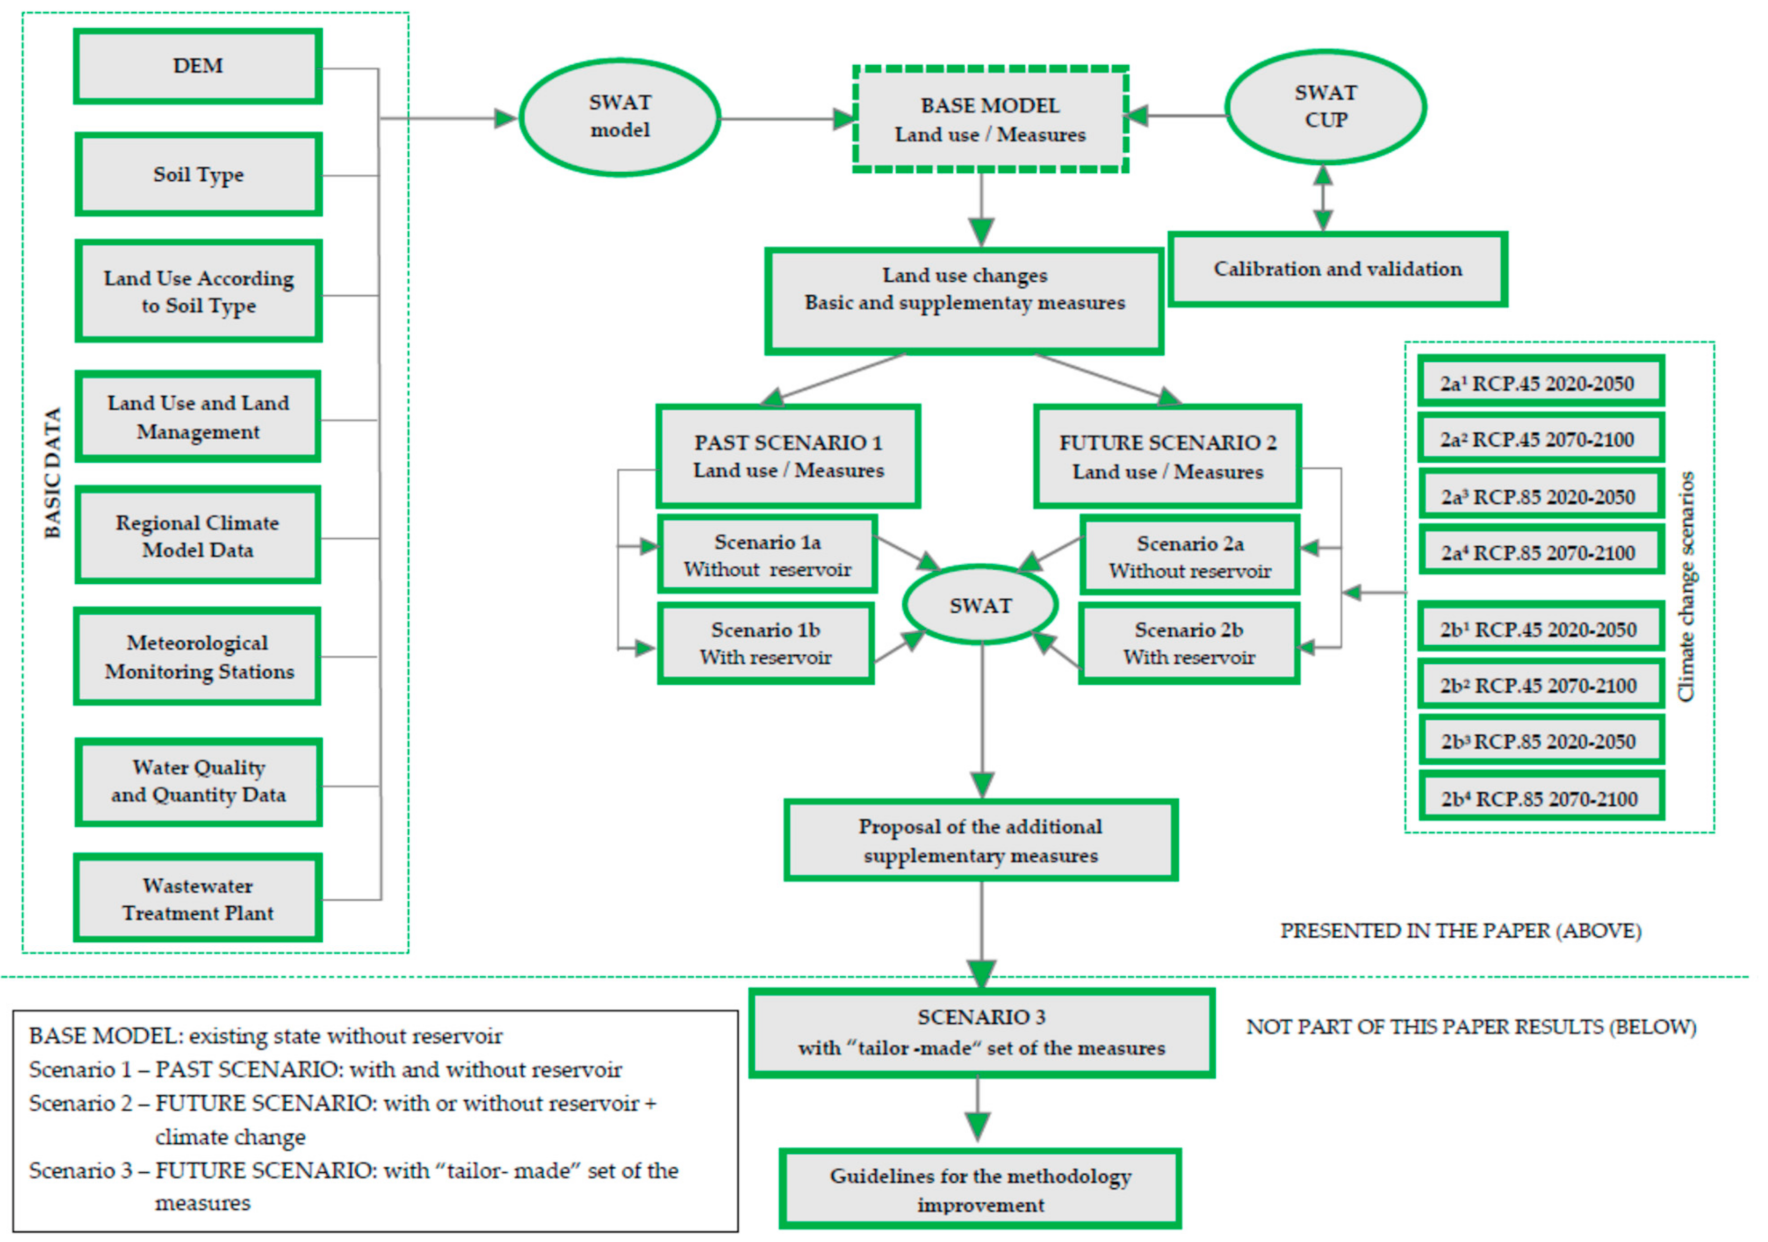
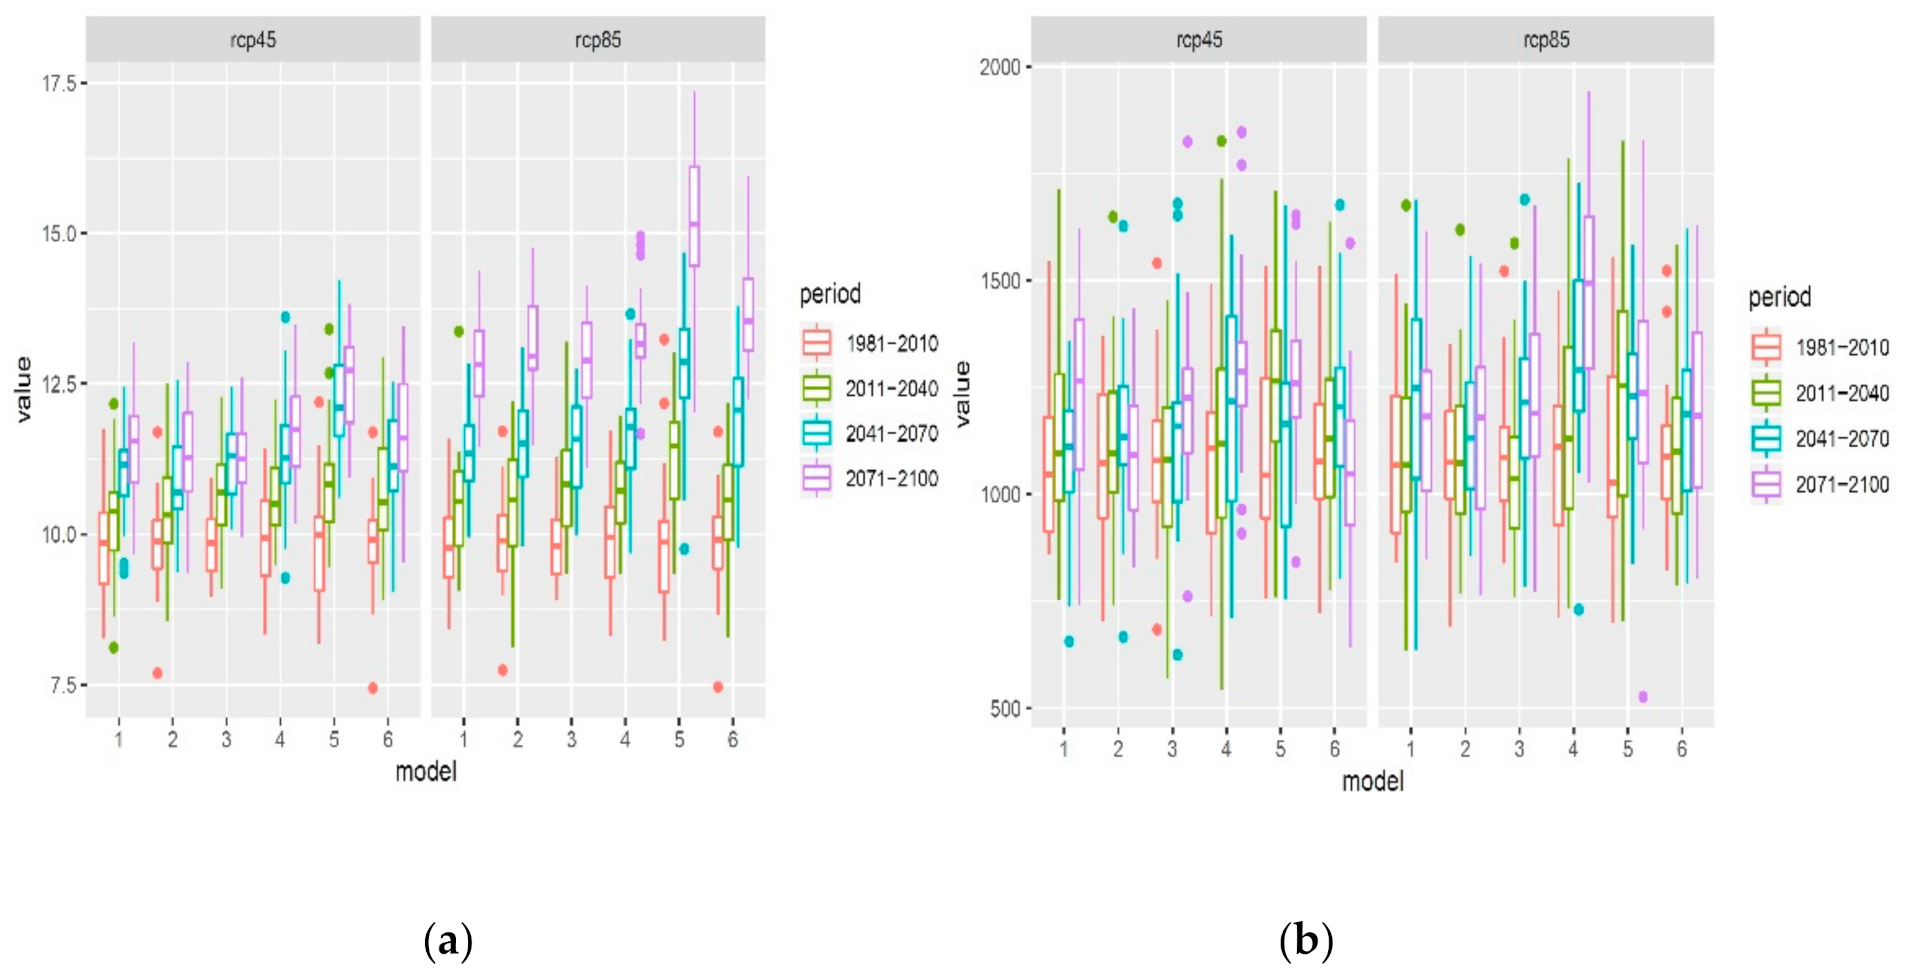
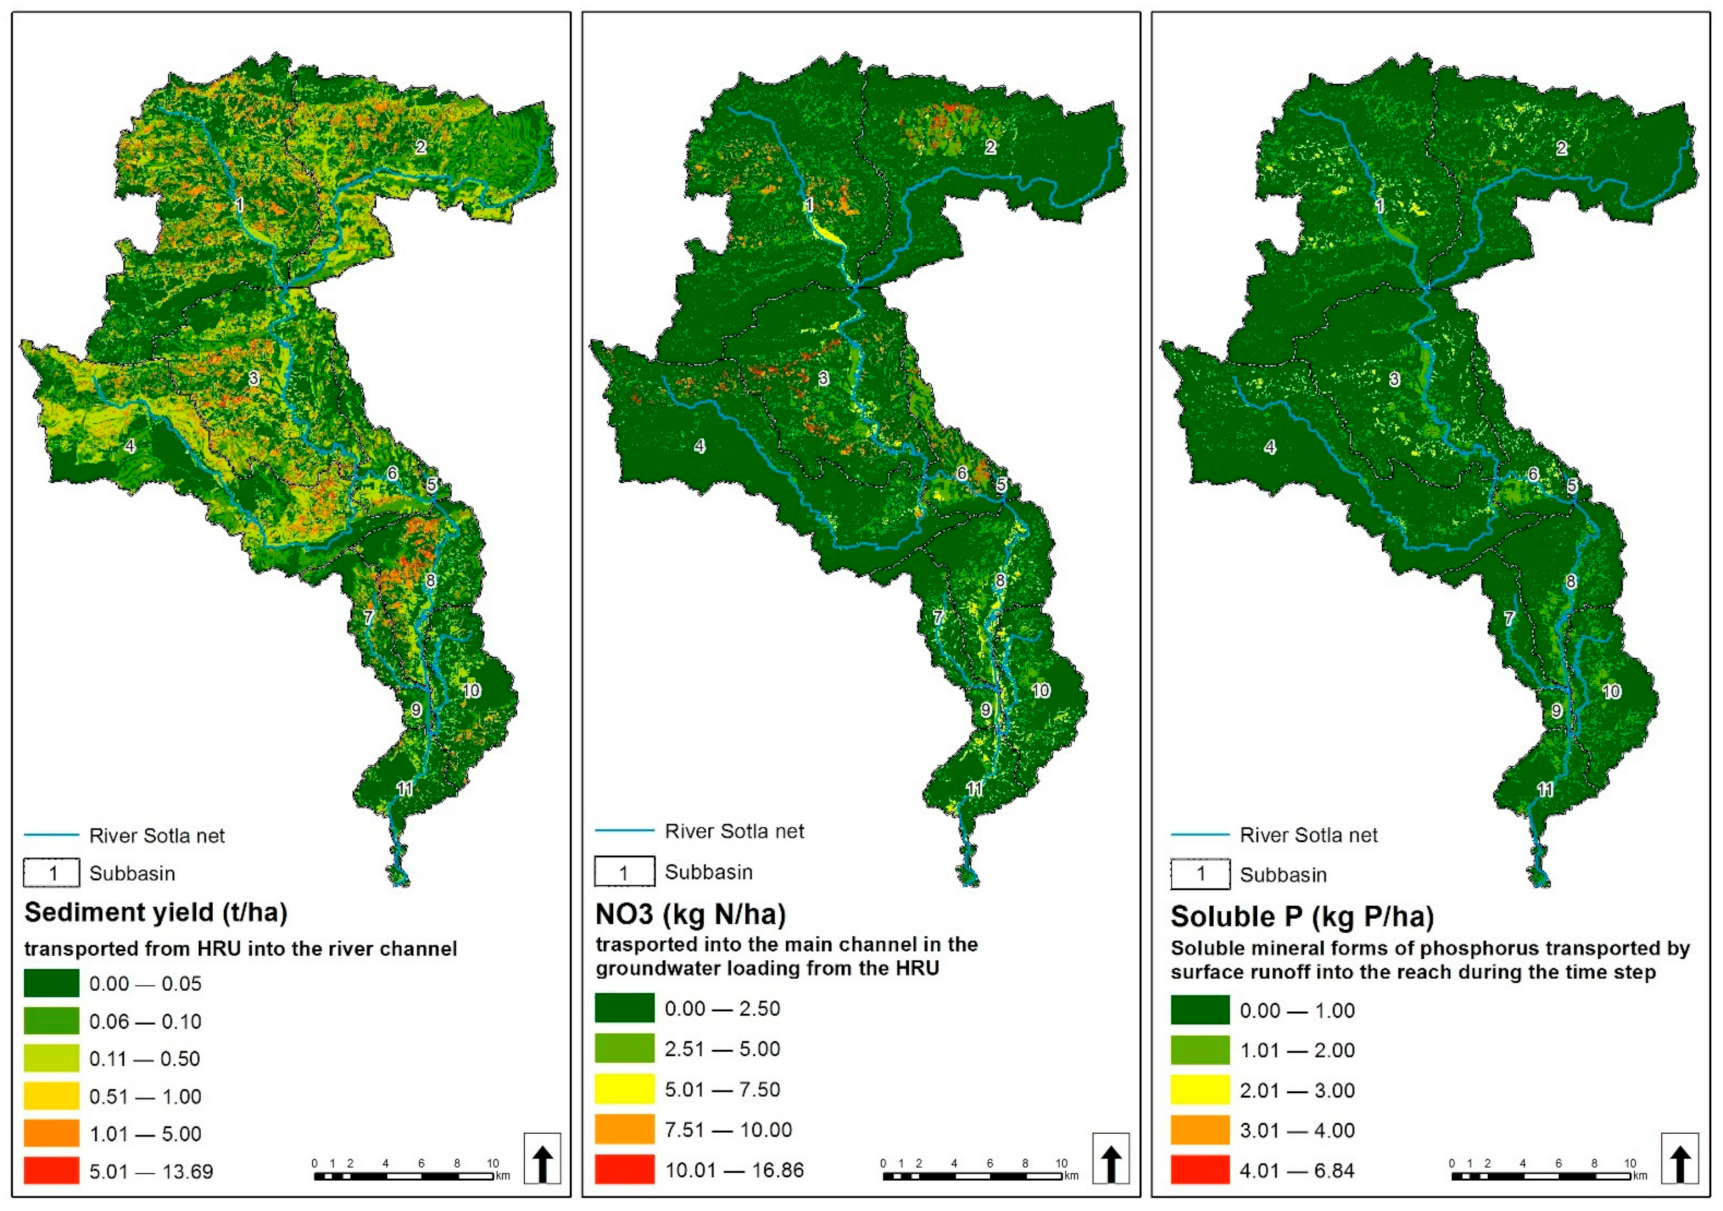
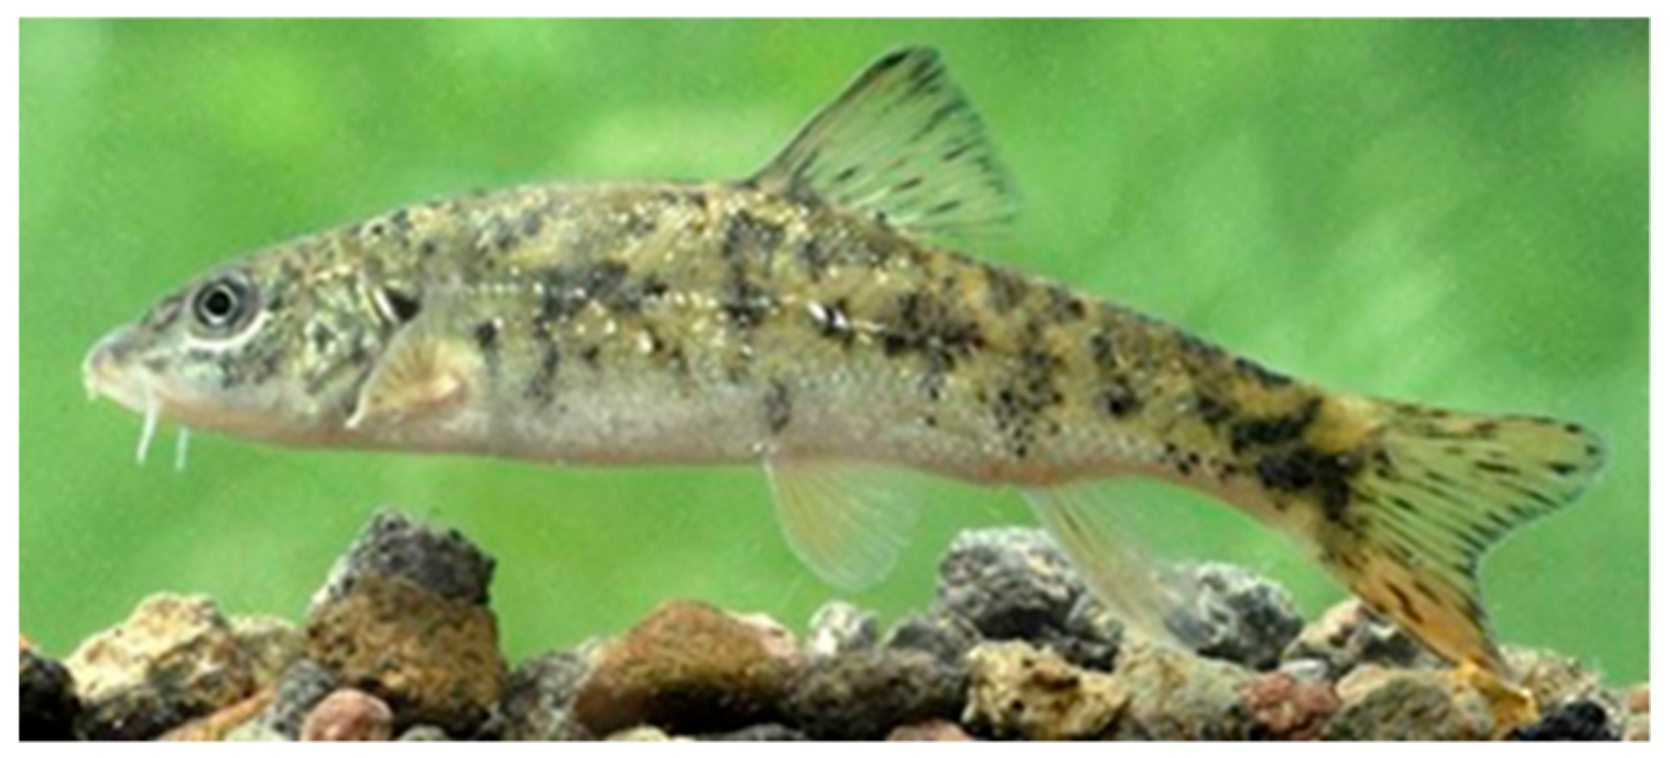
Table 1.
SWAT model input data sources for the Sutla river basin.
| Type Data | Characteristics and Data Description | Source | Scenario |
|---|---|---|---|
| Topography (DEM raster) | Slovenia: 25 m—Elevation Austria: 1 m—Elevation | CLS EEA | All scenarios |
| Soils | Slovenia: 1:25,000 Croatia: 1:25,000 Spatial soil variability, soil types and properties | MAFFS BFULJ FAUZ | All scenarios |
| Land Use | Slovenia, Croatia: 1 m Vector data (Graphical Units of Agricultural Land) Croatia: 100 m Corina Land cover (CLC), 2012, Version 18.5.1 Land use, Land cover classification and spatial representation | MAFFS BFULJ FAUZ | All scenarios |
| Land Management | Crop rotations (harvesting, planting, management), fertilizer application (rates and time) | CAFS Field trip | All scenarios |
| Weather | Daily precipitation, temperature (max., min.), relative humidity, wind, solar radiation from 2001–2014 | EARS CMHS | PRESENT and PAST scenarios |
| Climate change data | Daily precipitation, temperature (max., min.), relative humidity, wind, solar radiation from 2020–2050 and 2070–2100 | EARS CMHS | RCMs data FUTURE scenarios |
| River Discharge | Daily flow data (m3/s) from 2001–2014 | EARS CMHS | PRESENT scenario |
| Water quality | 1 monitoring point (CRO-Zelenjak) TSS, NO3−, PO42−, TP, TN (2001–2012) | monthly monitoring HV | PRESENT scenario |
| Reservoir data | Reservoir: volume, surface area, the month of operational, sediment concentration, hydraulic conductivity, outflow | project documentation | PAST and FUTURE scenarios |
| Agglomerations | PE, spatial position prepared in GIS | EARS HV | FUTURE scenarios |
| WWTP | Average daily discharge of orgP, sediment and orgN and other parameters | EARS HV | All scenarios |
| Septic tanks | Septic systems: year became operational, permanent residents, the average area of the drained area | EARS HV | All scenarios |
WWTP = Wastewater treatment plant; CLS = Copernicus land services; EEA = European Environment Agency; MAFFS = Ministry of Agriculture, Forestry and Food of the Republic of Slovenia; BFULJ = Biotechnical Faculty University of Ljubljana; FAUZ = Faculty of Agriculture University of Zagreb; EARS = Environmental Agency of the Republic of Slovenia; CMHS = Croatian Meteorological and Hydrological Service; HV = Croatian Water, Croatian legal entity for water management; CAFS = Chamber of Agriculture and Forestry of Slovenia, Agricultural Advisory Service.
Table 2.
DPSIR model input data sources for the Sutla River Basin [10] and added input data sources.
Table 2.
DPSIR model input data sources for the Sutla River Basin [10] and added input data sources.
| Sutla/Sotla River Basin | Slovenian Part of the River Basin | Croatian Part of the River Basin |
|---|---|---|
| Surface of the river basin | 459.9 km2 (78% of the whole) | 130.7 km2 (22% of the whole) |
| Driving forces: | Tourism and recreation, protection of cultural and natural heritage | Agriculture, protection of cultural and natural heritage, traffic |
| Pressure—Urbanization: Settlements; settl. ≥ 2000 inh. Density; Population density | 84; 1 38139; 85/km2 | 67; 1 16700; 120/km2 |
| Pressure—Land Use | 62% of agricul. land; 36.3% forests; 8.6% pastures; permanent crops 0.4; scrub 0.5 | 65% of agricul. land; 22% forests; 20.1% pastures; perm. crops 0; scrub 10.2 |
| Pressure—Agriculture rural population | 10% of the pop.; agricul. activity: livestock; fragment. farms | 30% of the pop.; agricul. activity: vineyards, livestock; fragmented farms |
| Pressure—Industry/ Entrepreneurship, Tourism | Glass manufacturing; sparkling water—drink production; 250 small enterprises | Industry in Hum na Sutli, manufact. in Klanjec, Livestock in G. Čemehovec |
| Pressure—Tourism/Recreation/Parks | Health C. Rog. Slatina; Spa C. Olimje; Reg. Park Kozjansko; Lands.P. Boč and Jovsi; | Ethno village Kumrovec |
| Pressure—Natura 2000 | Whole river Sutla/Sotla | |
| Pressure indicators | Nutrient emissions, nutrient loads—for all water bodies | |
| State-water status [8] | Sutla-Prišlin station—poor status, Sutla-Zelenjak and Sutla-Harmica—good status | |
| State indicators | Phosphorus concentrations (Total-P, orthophosphate), nitrogen concentrations (Total N, NO3)—for all water bodies | |
| Impact indicators | Ecological status and macrozoobenthos (community composition, biomass); phytoplankton (chlorophyll a, biovolume) and Secchi depth; macrophytes (lower growing depth); phytobentos (benthic algae) | |
Table 3.
Numerical modelling average HRU results for the BASE MODEL study period between 2004 and 2014 [9].
Table 3.
Numerical modelling average HRU results for the BASE MODEL study period between 2004 and 2014 [9].
| Land Use | Sediment Yield Average (t/ha) | Nitrate Nitrogen Average (kg N/ha) | Soluble P Average (kg P/ha) |
|---|---|---|---|
| arable land | 1.91 | 3.61 | 1.80 |
| orchard | 0.02 | 4.54 | 0.78 |
| grassland | 0.08 | 0.76 | 0.31 |
| forest | 0.02 | 0.61 | 0.08 |
| vineyards | 3.51 | 3.83 | 0.69 |
| urban | 0.23 | 0.21 | 0.31 |
| water | 0.00 | 0.00 | 0.00 |
| wetlands | 0.08 | 0.93 | 0.29 |
| Total average for river basin | 0.78 | 1.97 | 0.60 |
Table 4.
Statistical values for the calibration of river flow (m3/s) (2004–2014) and sediment concentration (mg/L), nitrate–nitrogen concentration (mg/L) and load (kg/day) and mineral phosphorus load in the Sutla River (2004–2012) [9].
Table 4.
Statistical values for the calibration of river flow (m3/s) (2004–2014) and sediment concentration (mg/L), nitrate–nitrogen concentration (mg/L) and load (kg/day) and mineral phosphorus load in the Sutla River (2004–2012) [9].
| Objective Function | ||
|---|---|---|
| ENS | PBIAS | |
| River flow (daily) | ||
| Calibration (2009–2014) | 0.59 | −10.58 |
| Validation (2004–2008) | 0.54 | 0.59 |
| Sediment (monthly) | ||
| Load Calibration (2004–2012) | 0.72 | 34.35 |
| Nitrate–nitrogen (monthly) | ||
| Concentration Calibration (2004–2012) | 0.82 | −1.96 |
| Load Calibration (2004–2012) | 0.65 | 31.30 |
| Mineral phosphorus (monthly) | ||
| Load Calibration (2004–2012) | 0.41 | 2.32 |
Table 5.
Numerical modelling results for BASE MODEL, PAST and FUTURE SCENARIOS.
| Scenario | Qav,year (m3/s) av. (min; max)% | Sediment (t) av. (min; max)% | Total N (t) av. (min; max)% | Total P (t) av. (min; max)% |
|---|---|---|---|---|
| BASE MODEL | 7.76 | 13853 | 1898 | 119 |
| PAST2a | 1% | 72% | 38% | 55% |
| PAST2b | 0% | 81% | 53% | 53% |
| FUTURE 3a1 | 4% (5.7; 9.3) | 4% (−12; 19) | 1% (−13; 10) | −6% (−21; −4) |
| FUTURE 3a2 | 17% (−7; 51) | 9% (−15; 35) | 4% (−14; 23) | 5% (−21; 13) |
| FUTURE 3a3 | 12% (1; 29) | 12% (−5; 26) | 5% (−4; 17) | −3% (−10; 6) |
| FUTURE 3a4 | 23% (3; 67) | 22% (−5; 77) | 8% (−9:39) | −3% (−15; 23) |
| FUTURE 3b1 | 5% (−13; 19) | 10% (−19; 29) | 2% (−12; 10) | 2% (−12; 11) |
| FUTURE 3b2 | 17% (−7; 50) | 12% (−13; 39) | 4% (−13; 23) | 2% (−12; 20) |
| FUTURE 3b3 | 12% (1; 29) | 15% (−2; 32) | 5% (−5; 16) | 4% (−4; 11) |
| FUTURE 3b4 | 22% (3; 66) | 25% (−3; 84) | 7% (−9; 38) | 3% (−10; 31) |
Note: Average percentage change values for PAST and FUTURE scenarios (in the brackets are the minimum and maximum % change according to the different climate models) are defined according to the absolute values of the BASE MODEL.
Publisher’s Note: MDPI stays neutral with regard to jurisdictional claims in published maps and institutional affiliations. |
© 2021 by the authors. Licensee MDPI, Basel, Switzerland. This article is an open access article distributed under the terms and conditions of the Creative Commons Attribution (CC BY) license (https://creativecommons.org/licenses/by/4.0/).
Share and Cite
MDPI and ACS Style
Ćosić-Flajsig, G.; Karleuša, B.; Glavan, M. Integrated Water Quality Management Model for the Rural Transboundary River Basin—A Case Study of the Sutla/Sotla River. Water 2021, 13, 2569. https://doi.org/10.3390/w13182569
AMA Style
Ćosić-Flajsig G, Karleuša B, Glavan M. Integrated Water Quality Management Model for the Rural Transboundary River Basin—A Case Study of the Sutla/Sotla River. Water. 2021; 13(18):2569. https://doi.org/10.3390/w13182569
Chicago/Turabian StyleĆosić-Flajsig, Gorana, Barbara Karleuša, and Matjaž Glavan. 2021. "Integrated Water Quality Management Model for the Rural Transboundary River Basin—A Case Study of the Sutla/Sotla River" Water 13, no. 18: 2569. https://doi.org/10.3390/w13182569
Note that from the first issue of 2016, this journal uses article numbers instead of page numbers. See further details here.