Article

Size Matters, but Species Do Not: No Evidence for Species-Specific Swimming Performance in Co-Occurring Great Basin Stream Fishes

1
Department of Biology, Brigham Young University, Provo, UT 84604, USA
2
Federal Energy Regulatory Commission, 100 1st Street, Suite 2300, San Francisco, CA 94105, USA
3
Department of Civil and Environmental Engineering, Brigham Young University, Provo, UT 84604, USA
*
Author to whom correspondence should be addressed.
Water 2021, 13(18), 2570; https://doi.org/10.3390/w13182570
Submission received: 24 July 2021 / Revised: 8 September 2021 / Accepted: 14 September 2021 / Published: 17 September 2021

Abstract

:
For fishes, swimming performance is an important predictor of habitat use and a critical measure for the design of effective fish passage systems. Few studies have examined burst and prolonged types of swimming performance among several co-occurring species, and swimming performance in many fish communities is undocumented. In this study, we characterize both burst (c-start velocity) and prolonged speed (critical swim speed) across a poorly documented, co-occurring group of stream fishes within the Great Basin of the western USA. We documented the variation in swim speed associated with species, habitat, and body size. Body size had an overwhelming effect on both burst speed and prolonged speed, whereas habitat use and species identity were not significant predictors. Among species, there is no evidence of a trade-off between burst swim speed and prolonged swim speed. Lack of a trade-off in performance between burst swim speed and prolonged swim speed among species may be due to unexpectedly high prolonged swim speeds exhibited by species that used substrate-bracing behaviors. Incorporating body size and variation in behavior, such as substrate-bracing behaviors, into fish passage models will likely be sufficient to ensure the passage of all species without the need to account for species-specific swimming abilities. However, these results characterize the swimming performance for threatened and common fish species such that other comparisons can be made and species-specific studies can access accurate data.

1. Introduction

Swimming performance is an important measure of fitness in fishes. Flowing water in stream systems imposes constraints and generates selective forces affecting swimming performance [1,2]. These constraints and subsequent selective forces on swimming performance have been shown to affect fish traits, including swimming mode, body size, shape, physiology, temperature-dependent performance [3,4,5,6,7], prey capture [8], predator evasion tactics [9,10], reproductive success [11], and evolutionary fitness [12,13,14]. Thus, swimming performance is an integrative trait critical in exploring influences from a wide range of ecological and evolutionary forces.
Fish swim speed is largely influenced by two phenotypic traits: body size and shape [15]. Different body shapes are adapted for different swimming modes, and optimal body shapes for high burst swimming speed performance vary from optimal shapes for high prolonged swimming speed performance [16,17,18,19]. For example, prolonged speed (maximal speed that fish can maintain without fatigue for greater than 20 s [3]) is favored in taxa with a narrow caudal peduncle, a large anterior body depth and mass, a caudal fin with high aspect ratio (i.e., large span, low chord) and lunate shape (i.e., crescent-shaped), and a relatively stiff and streamlined anterior body [17,20,21]. Burst speed (the highest instantaneous speed attainable by fish [3]) is favored in species that can displace large amounts of water during the initial c-start, including those with a large caudal fin, a flexible muscular body relative to body mass, and a large body depth around the caudal region [17,22]. Consequently, inherent trade-offs exist between prolonged and burst swimming among species with differing body shapes [23,24,25,26,27,28]. Habitat acts as a selective force through which different body shapes may be favored [29,30]. In stream environments, the continuously flowing water in the midwater column selects for different swimming modes and body shapes compared to the benthic environment, which has less influence of flow [6]. Thus, stream habitat can be used to predict shape, which can be used to predict swimming mode and performance.
In addition to variability in swimming performance resulting from body shape and associated habitat differences, size can significantly impact swimming performance [31]. Fish exhibit allometric changes in body size during growth that may be manifest as a differential rate of increase in both burst and prolonged swimming speeds [32]. The effect of body size on relative swimming performance is of particular interest, as larger individuals experience competing forces associated with increased muscle mass and increased drag. Examining size as it relates to swimming allometry reveals inherent trade-offs and selective pressures that influence the form and function of fish during the course of development [33].
Historically, studies on swimming performance have disproportionally focused on species of commercial value, such as salmonids [34,35,36,37]. As a result of this, other species in the same environment are often underrepresented, and little is known about their ability to pass through potential flow barriers (i.e., culverts and designed fish passages) [34]. More recently, several studies have focused on swimming performance in a variety of non-salmonid fish species, and they have shown that swimming performance varies widely among species such that salmonid swimming performance does not reflect the variation in swimming mode or performance found in other species [31,38,39,40]. To fully understand fish swimming performance and to be able to predict fish passage, it is important to measure both burst and prolonged swim speed in all species in a given assemblage and to relate swimming performance to species-specific differences in habitat use and body size.
In this study, we quantified the swimming performance of seven naturally co-occurring stream fishes from the Great Basin of the western USA. Our primary goal was to characterize and compare the burst swimming speed and prolonged swimming speed of this group of fishes. We test for variation in swimming performance based on species-specific differences (i.e., habitat use and corresponding body shape), and on body size. Second, we test for predicted trade-offs between burst speed and prolonged speed performance among species. To do this, we compared the swimming speeds of fishes that are benthic-oriented to those that are found in the mid-water column. If the body shape and corresponding habitat are important in determining swim speeds, then mid-water stream fishes should have greater prolonged speed compared to benthic stream fishes, and benthic stream fishes should have higher burst speeds than prolonged speeds relative to mid-water fishes.

2. Materials and Methods

Swimming performance was measured in seven co-occurring stream fish species in the Great Basin of the western USA, representing four families and six genera. Species tested included: Cottus bairdii Girard (mottled sculpin), Catostomus platyrhynchus Cope (mountain sucker), Rhinichthys cataractae Valenciennes (longnose dace), Rhinichthys osculus Girard (speckled dace), Lepidomeda aliciae Jouy (southern leatherside chub), Richardsonius balteatus Richardson (redside shiner), and Oncorhynchus clarkii utah Suckley (Bonneville cutthroat trout). These species were selected because they represent most of the native co-occurring species of stream fishes in this area. Additionally, L. aliciae and O. clarkii utah are endemic species that are of conservation concern in the state of Utah. The benthic stream species group consisted of C. platyrhynchus, R. osculus, R. cataractae, and C. bairdii; the mid-water stream group consisted of O. clarkii utah, L. aliciae, and R. balteatus. All species were measured across the entire juvenile to adult size range except O. clarkii utah, which were only available in the juvenile size range.

2.1. Collection & Maintenance
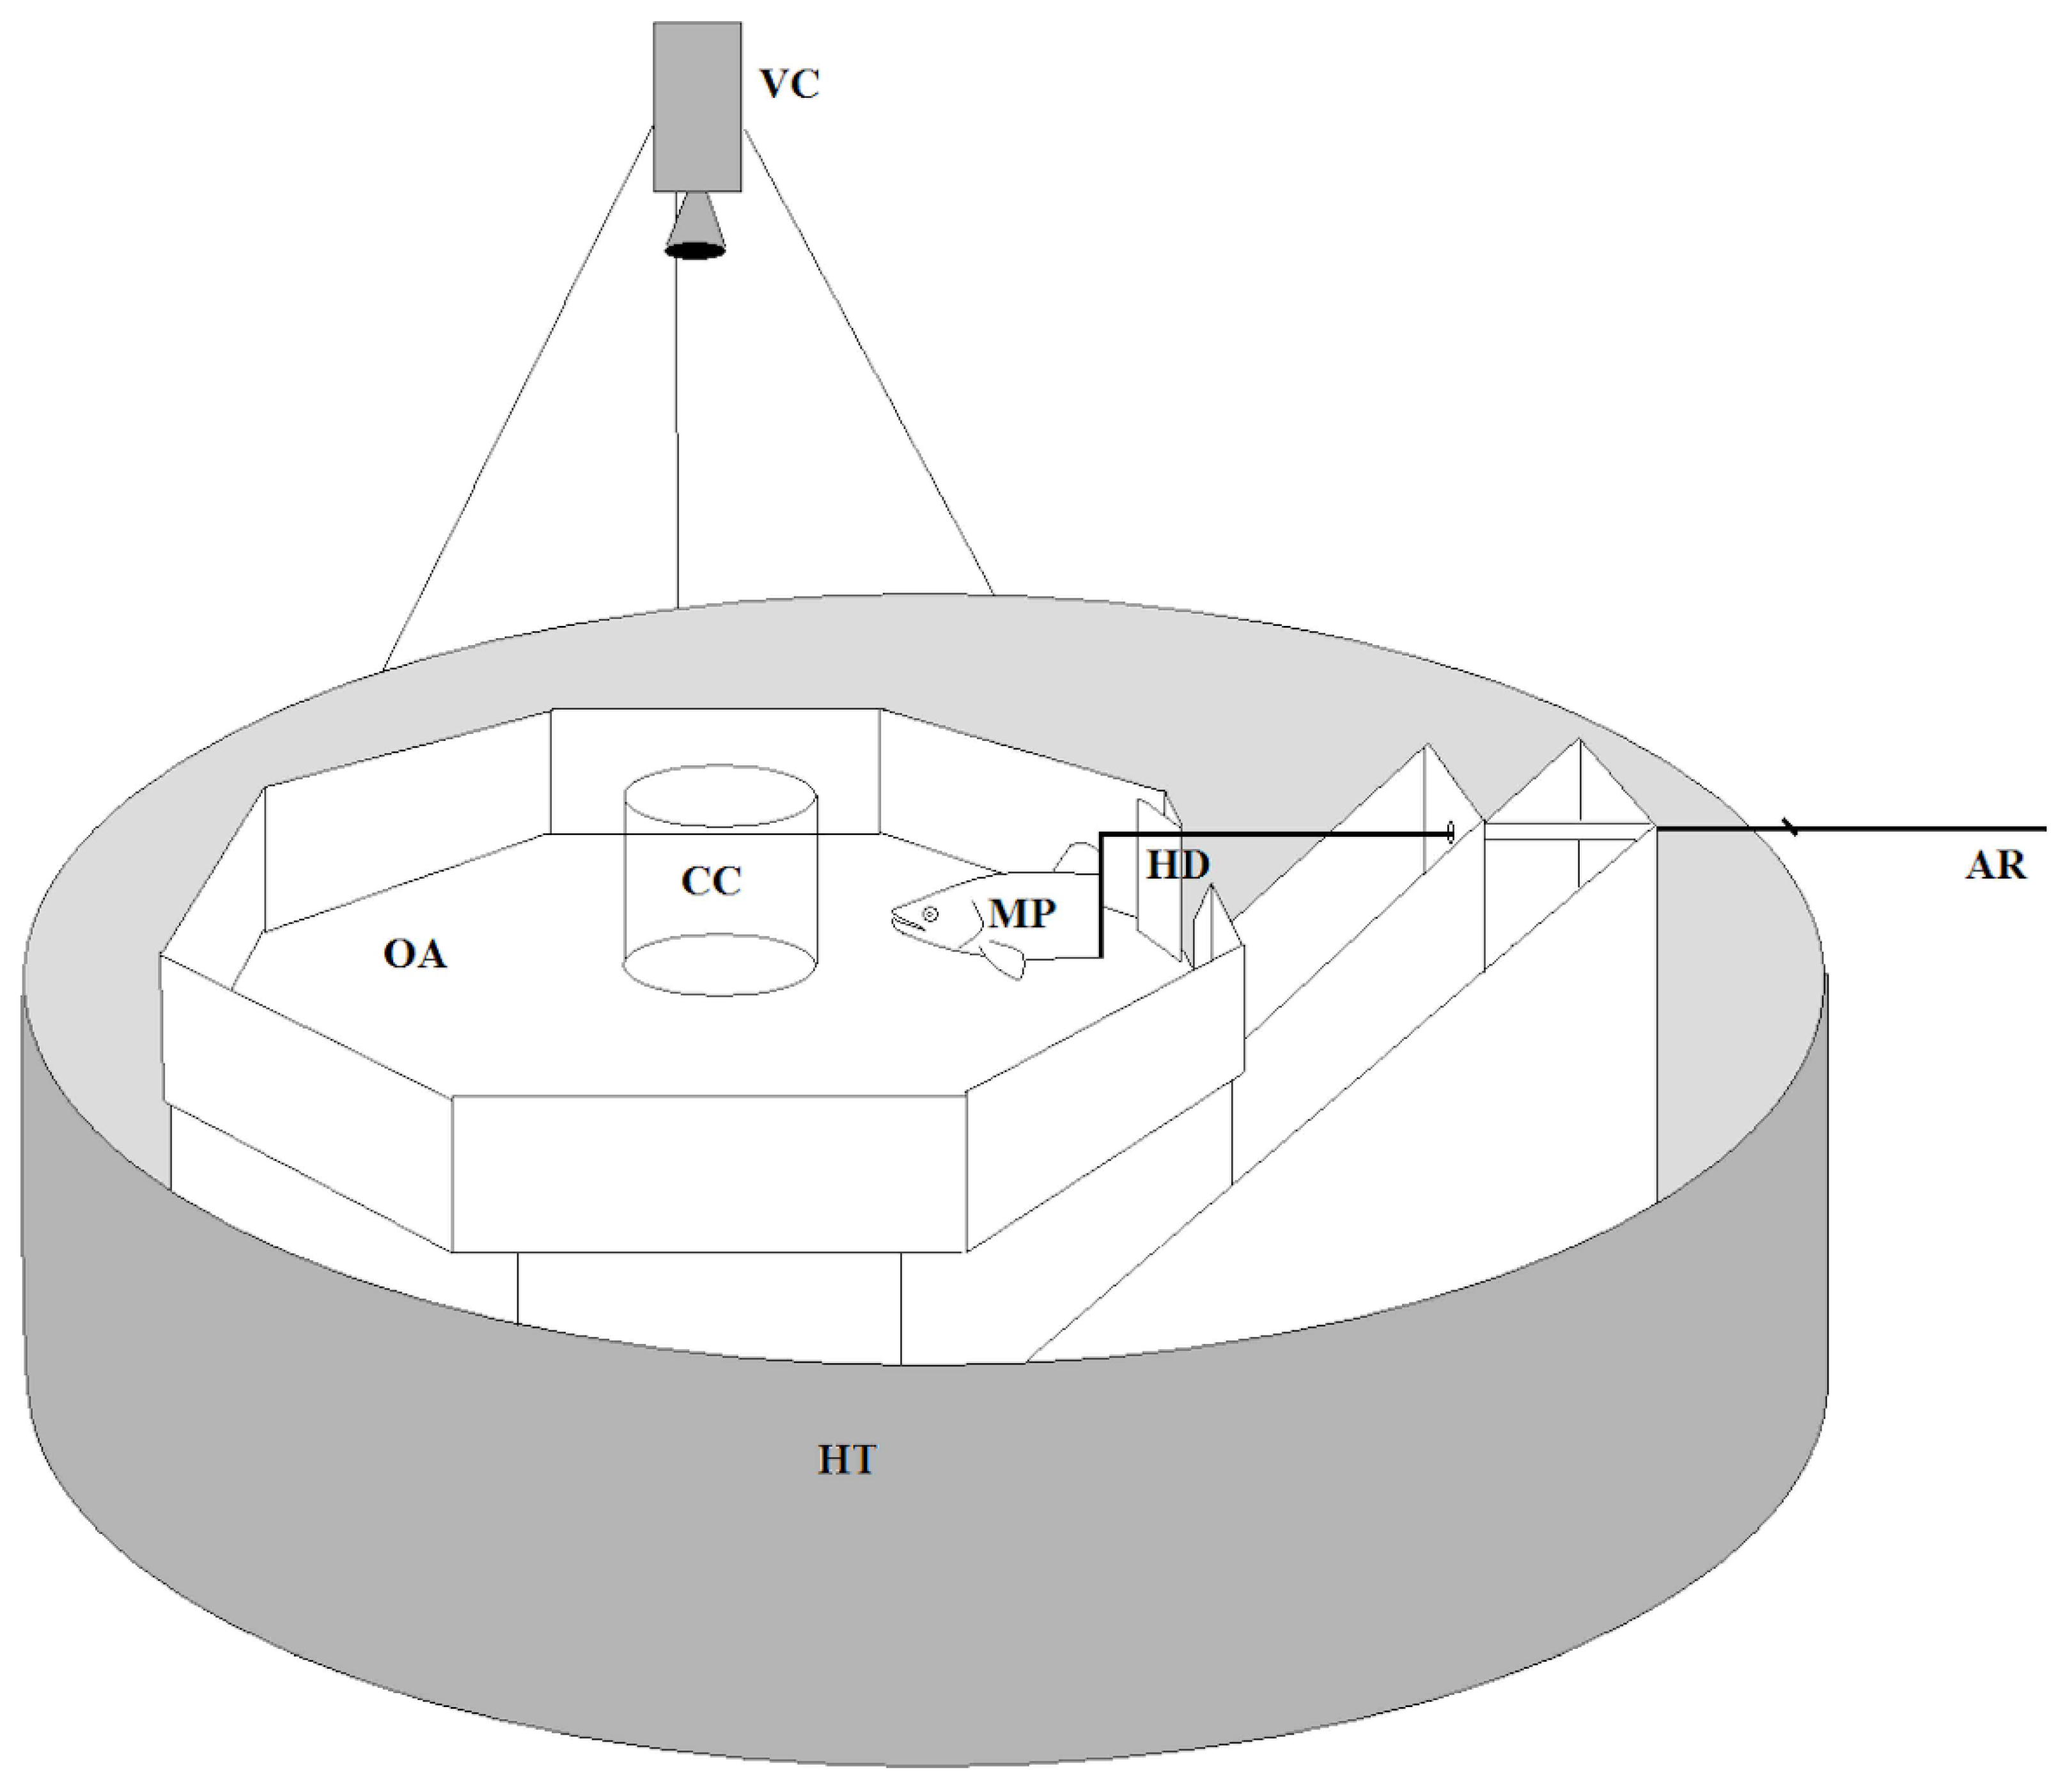
Individuals for six of the seven species were collected from wild populations in central Utah via elecrofishing, and individuals of O. clarkii utah were obtained from captive-reared populations (Table 1). Immediately after capture, we transported all individuals in aerated coolers containing water from the location of origin to laboratory facilities at Brigham Young University. We collected and tested all fish between 31 July 2007 and 23 October 2007 during low flow periods. As a result of the similar environmental conditions associated with the collection time (i.e., low water velocities, no extremes in temperature), all individuals are assumed to be similarly physically conditioned.
All tests were completed within one week after capture to ensure that the performance of collected individuals would not reflect long-term acclimation to lab conditions. We tested only one species in a given week. During this week of testing fish, we housed them in large round tanks (1100 L volume) in the Evolutionary Ecology Laboratories facility at Brigham Young University, Utah. We allowed fish to rest in laboratory conditions for at least 24 h prior to the commencement of swimming trials. We fed fish small pellets of Silver Cup fish feed daily as needed, and we maintained photoperiod at 12:12 light/dark. We changed water in both the holding and testing facilities each week between swimming trials for each species.
Water temperatures in the holding aquaria were maintained at 17.0 °C ± 0.5 °C and near saturation with oxygen. This represents the mean water temperature of all sample sites during the collection period (range = 14–20 °C) and falls within the range of preferred temperatures for all species tested [41].

2.2. Burst Speed

A simulated predator attack was used in a laboratory observation arena to measure burst speed (Figure 1). The arena consisted of a 100 cm × 100 cm octagonal arena with 15 cm high walls. The center of the arena contained a 20 cm diameter clear-plexiglass cylinder that receded into the bottom of the arena, constraining individuals to the center of the observation arena while acclimating previous to the simulated attack. The attack consisted of the rapid projection of a model predator (adult brown trout, Salmo trutta) into the arena toward the test individual. A white cloth covering the observation arena eliminated outside disturbances and the premature startling of acclimating fish. We maintained the water at 17.0 °C ± 0.5 °C, 15 cm depth, and near saturation with oxygen.
For each burst swimming trial, a single individual was introduced into the clear confinement cylinder in the center of the tank and allowed to acclimate for 15 min. After acclimation, the cylinder was lowered to the bottom of the arena, and the mock-predator was rapidly propelled into the arena toward the test subject. Test fish were always facing the model before the mock attack was initiated. We recorded burst speed response from directly above the tank at 200 frames·s−1 using a high-speed digital video camera (Phantom v4.2, Vision Research, Wayne, NJ, USA). We measured burst speed with the aid of the Phantom Camera Control software v8.4 (Vision Research Inc., Wayne, NJ, USA, 1992–2005). This software electronically calculates the velocity of a moving object using the distance divided by time equation. Time is measured by multiplying the inverse of the framing rate by the number of frames recorded from start to finish of a user-defined video recorded event. Distance is calculated by indicating a two-point distance from the starting and ending position of the measured object set to a user-defined distance scale. We used a 1 cm square grid on the bottom of the arena as a length reference to create the distance scale.
Burst speed was measured using the insertion of the dorsal fin as a reference point. The insertion of the dorsal fin is near the center of mass for an individual fish, which reduces variation in swimming performance due to undulations of the tail and head. Burst speed occurs in three distinct stages [24]. Stage one consists of a unilateral contraction of muscles, bending the fish into a C-shape. Stage two consists of a strong propulsive stroke of the tail, projecting the fish forward, and it ends when the tail stroke reaches maximum exertion on the opposite side of the body. Stage three consists of a gliding or continuous swimming behavior. We measured burst speed (m·s−1) from the end of stage 1 to the end of stage 2. Burst speed trials were always performed previous to prolonged speed trials.

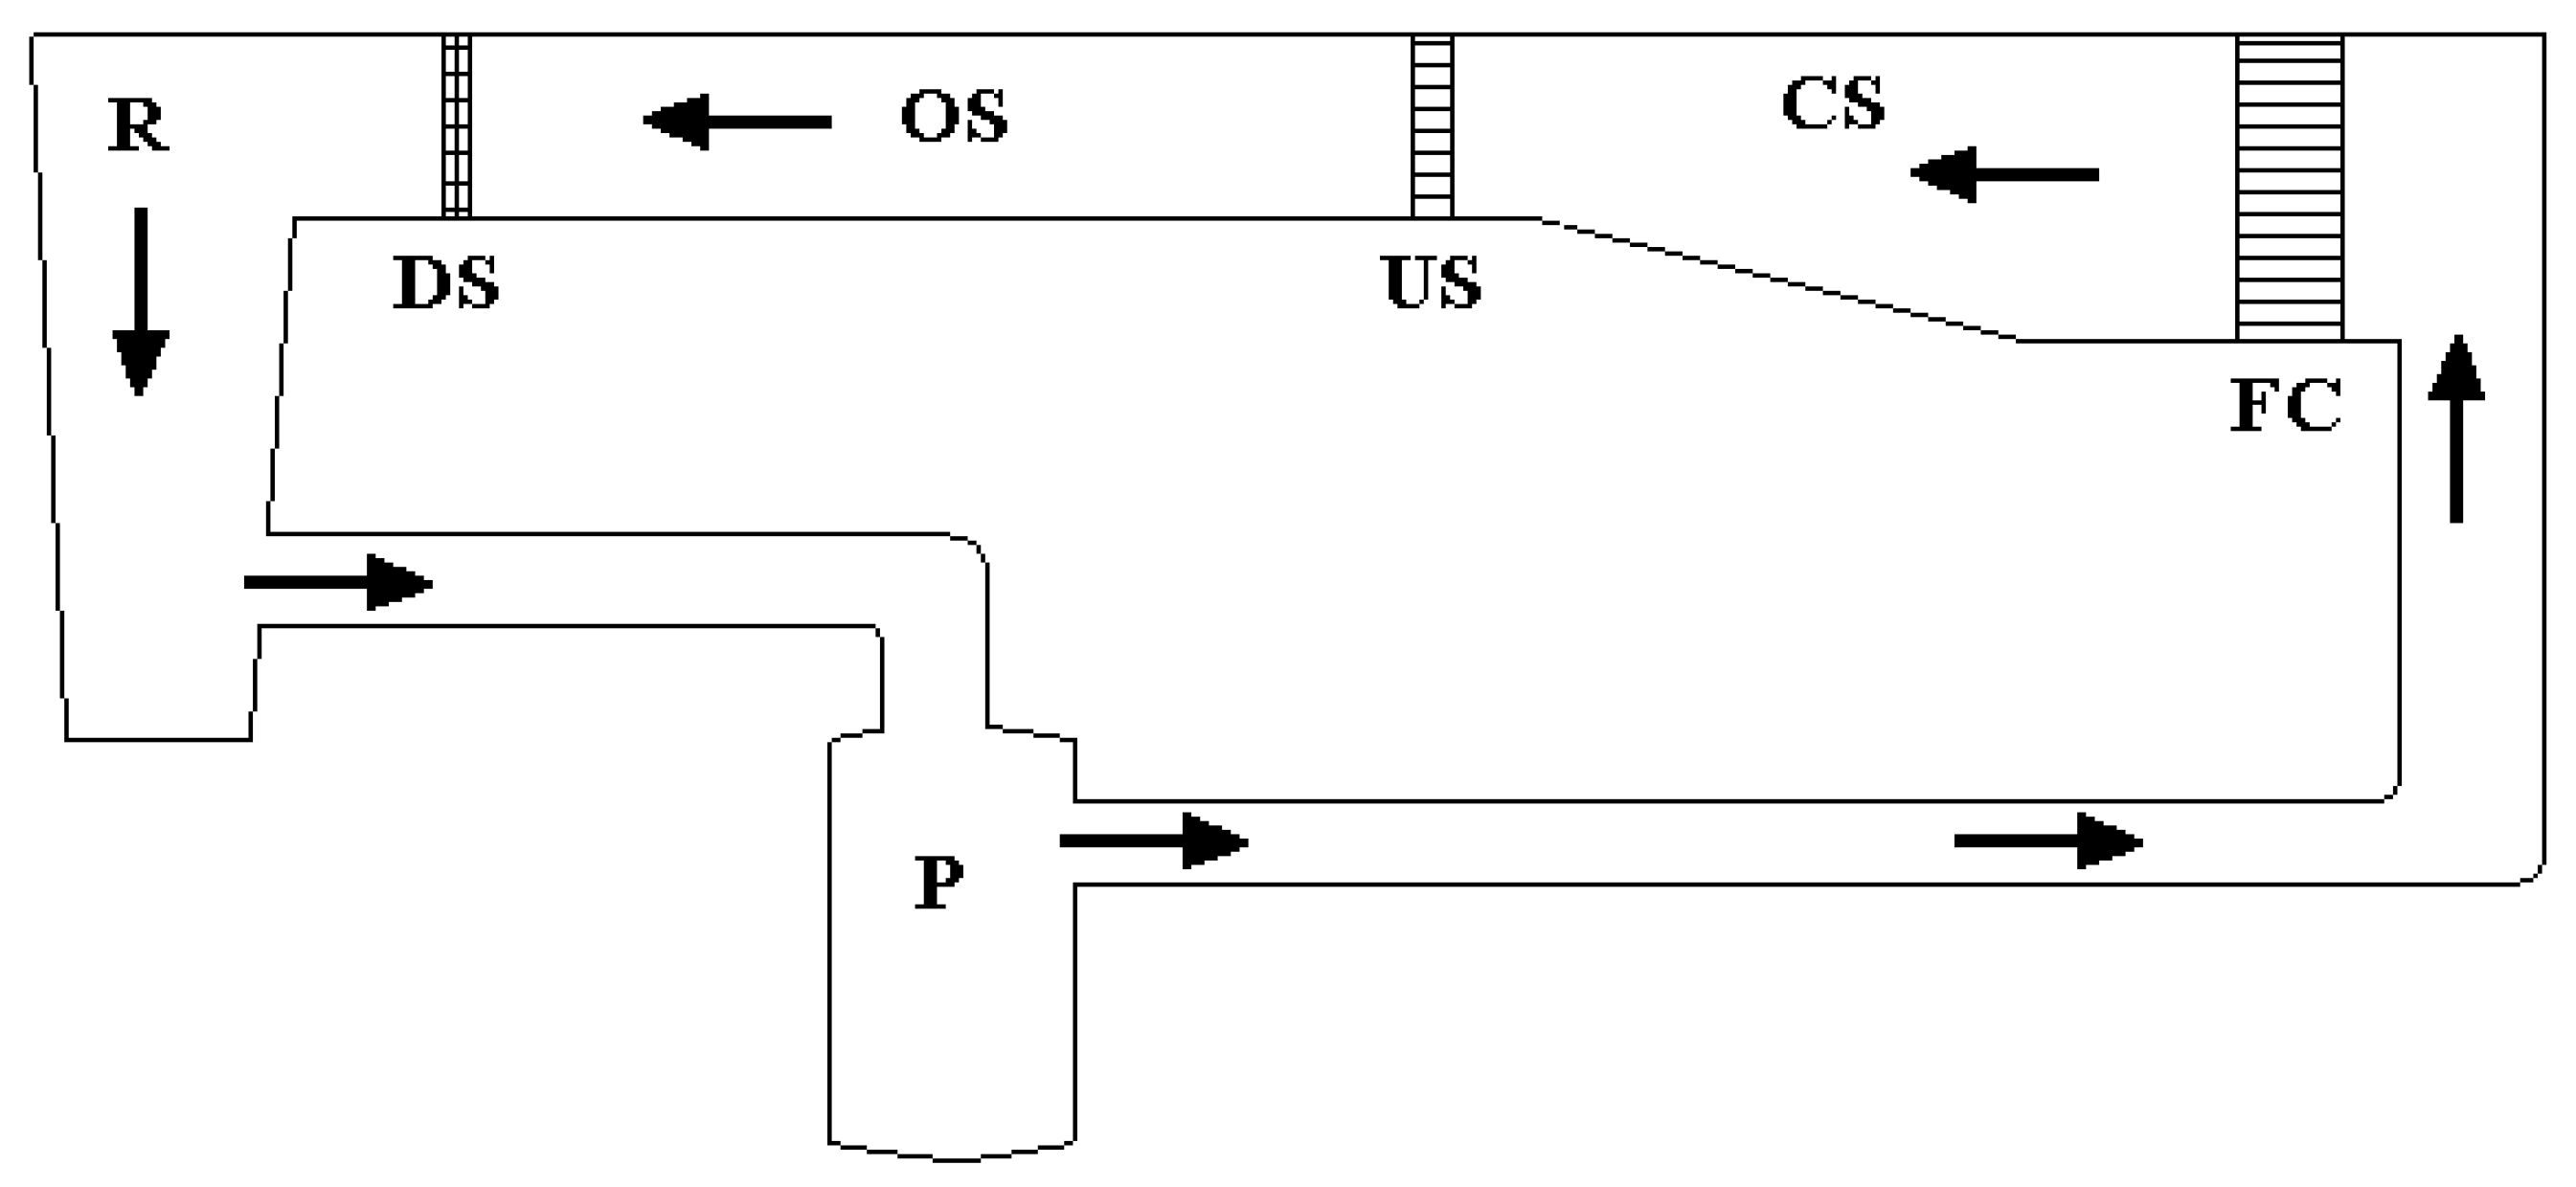
2.3. Prolonged Speed

Prolonged speed was quantified as the critical swim velocity at which a fish can no longer maintain position and becomes impinged on the downstream barrier of a Blazka-type swimming chamber [37]. The Blazka-type chamber consisted of a clear acrylic rectangular observation area (20 cm tall × 20 cm wide × 80 cm long) connected to a downstream reservoir and an upstream section designed to reduce turbulence (Figure 2). An impeller-powered 5.6 kW motor situated between the reservoir and upstream section cycled water through the observation area. To reduce turbulence, all water passing through the pump was directed through the upstream section, which consisted of a plastic honeycomb with 7 mm wide openings held in place by a wire mesh with 1 mm wide openings. Following the upstream section, water passed through a contraction section, which reduced the cross-sectional area and accelerated the flow into the observation section. Fish were restricted to the observation area by a plasic grid with 7 mm diameter round openings on the upstream end, and a metal screen with 7 mm square openings on the downstream end. During all trials, water was maintained at 17.0 °C ± 0.5 °C and near saturation with oxygen. We measured the average water velocity in the swim chamber by averaging the velocity measurements of nine equally spaced quadrants across a cross-section of the observation area with a Swoffer model 3000 flow meter.
Critical swimming velocity, or the velocity at which fish become fatigued, (prolonged speed, measured in m·s−1) was calculated using the following formula [37]:
Prolonged Speed = Vp + (Tf/Ti)Vi
where Ti was the time a fish was held at a specific current velocity (5 min), Vp was the highest current velocity maintained for a full 5 min period (m·s−1), Vi was the current velocity increment (0.1 m·s−1), and Tf was the elapsed time at the fatigue velocity. We initiated trials by placing a single individual in the observation section for 15 min without flow. After this acclimation period, water velocities were increased by 0.1 m·s−1 every 5 min until the fish was impinged on the downstream barrier. Upon impingement, we gave several successive taps on the fish’s caudal peduncle to stimulate continued swimming. When an individual would no longer respond to stimulation following impingement, the swimming trial was terminated, and the time to fatigue and the velocity at fatigue were recorded [3,5]. After all trials were completed, we euthanized fish via overdose of MS-222 in accordance with IACUC protocols and direction from the state of Utah specified in the collecting permit; then, we preserved all specimens in 70% ethanol.

2.4. Statistical Analysis
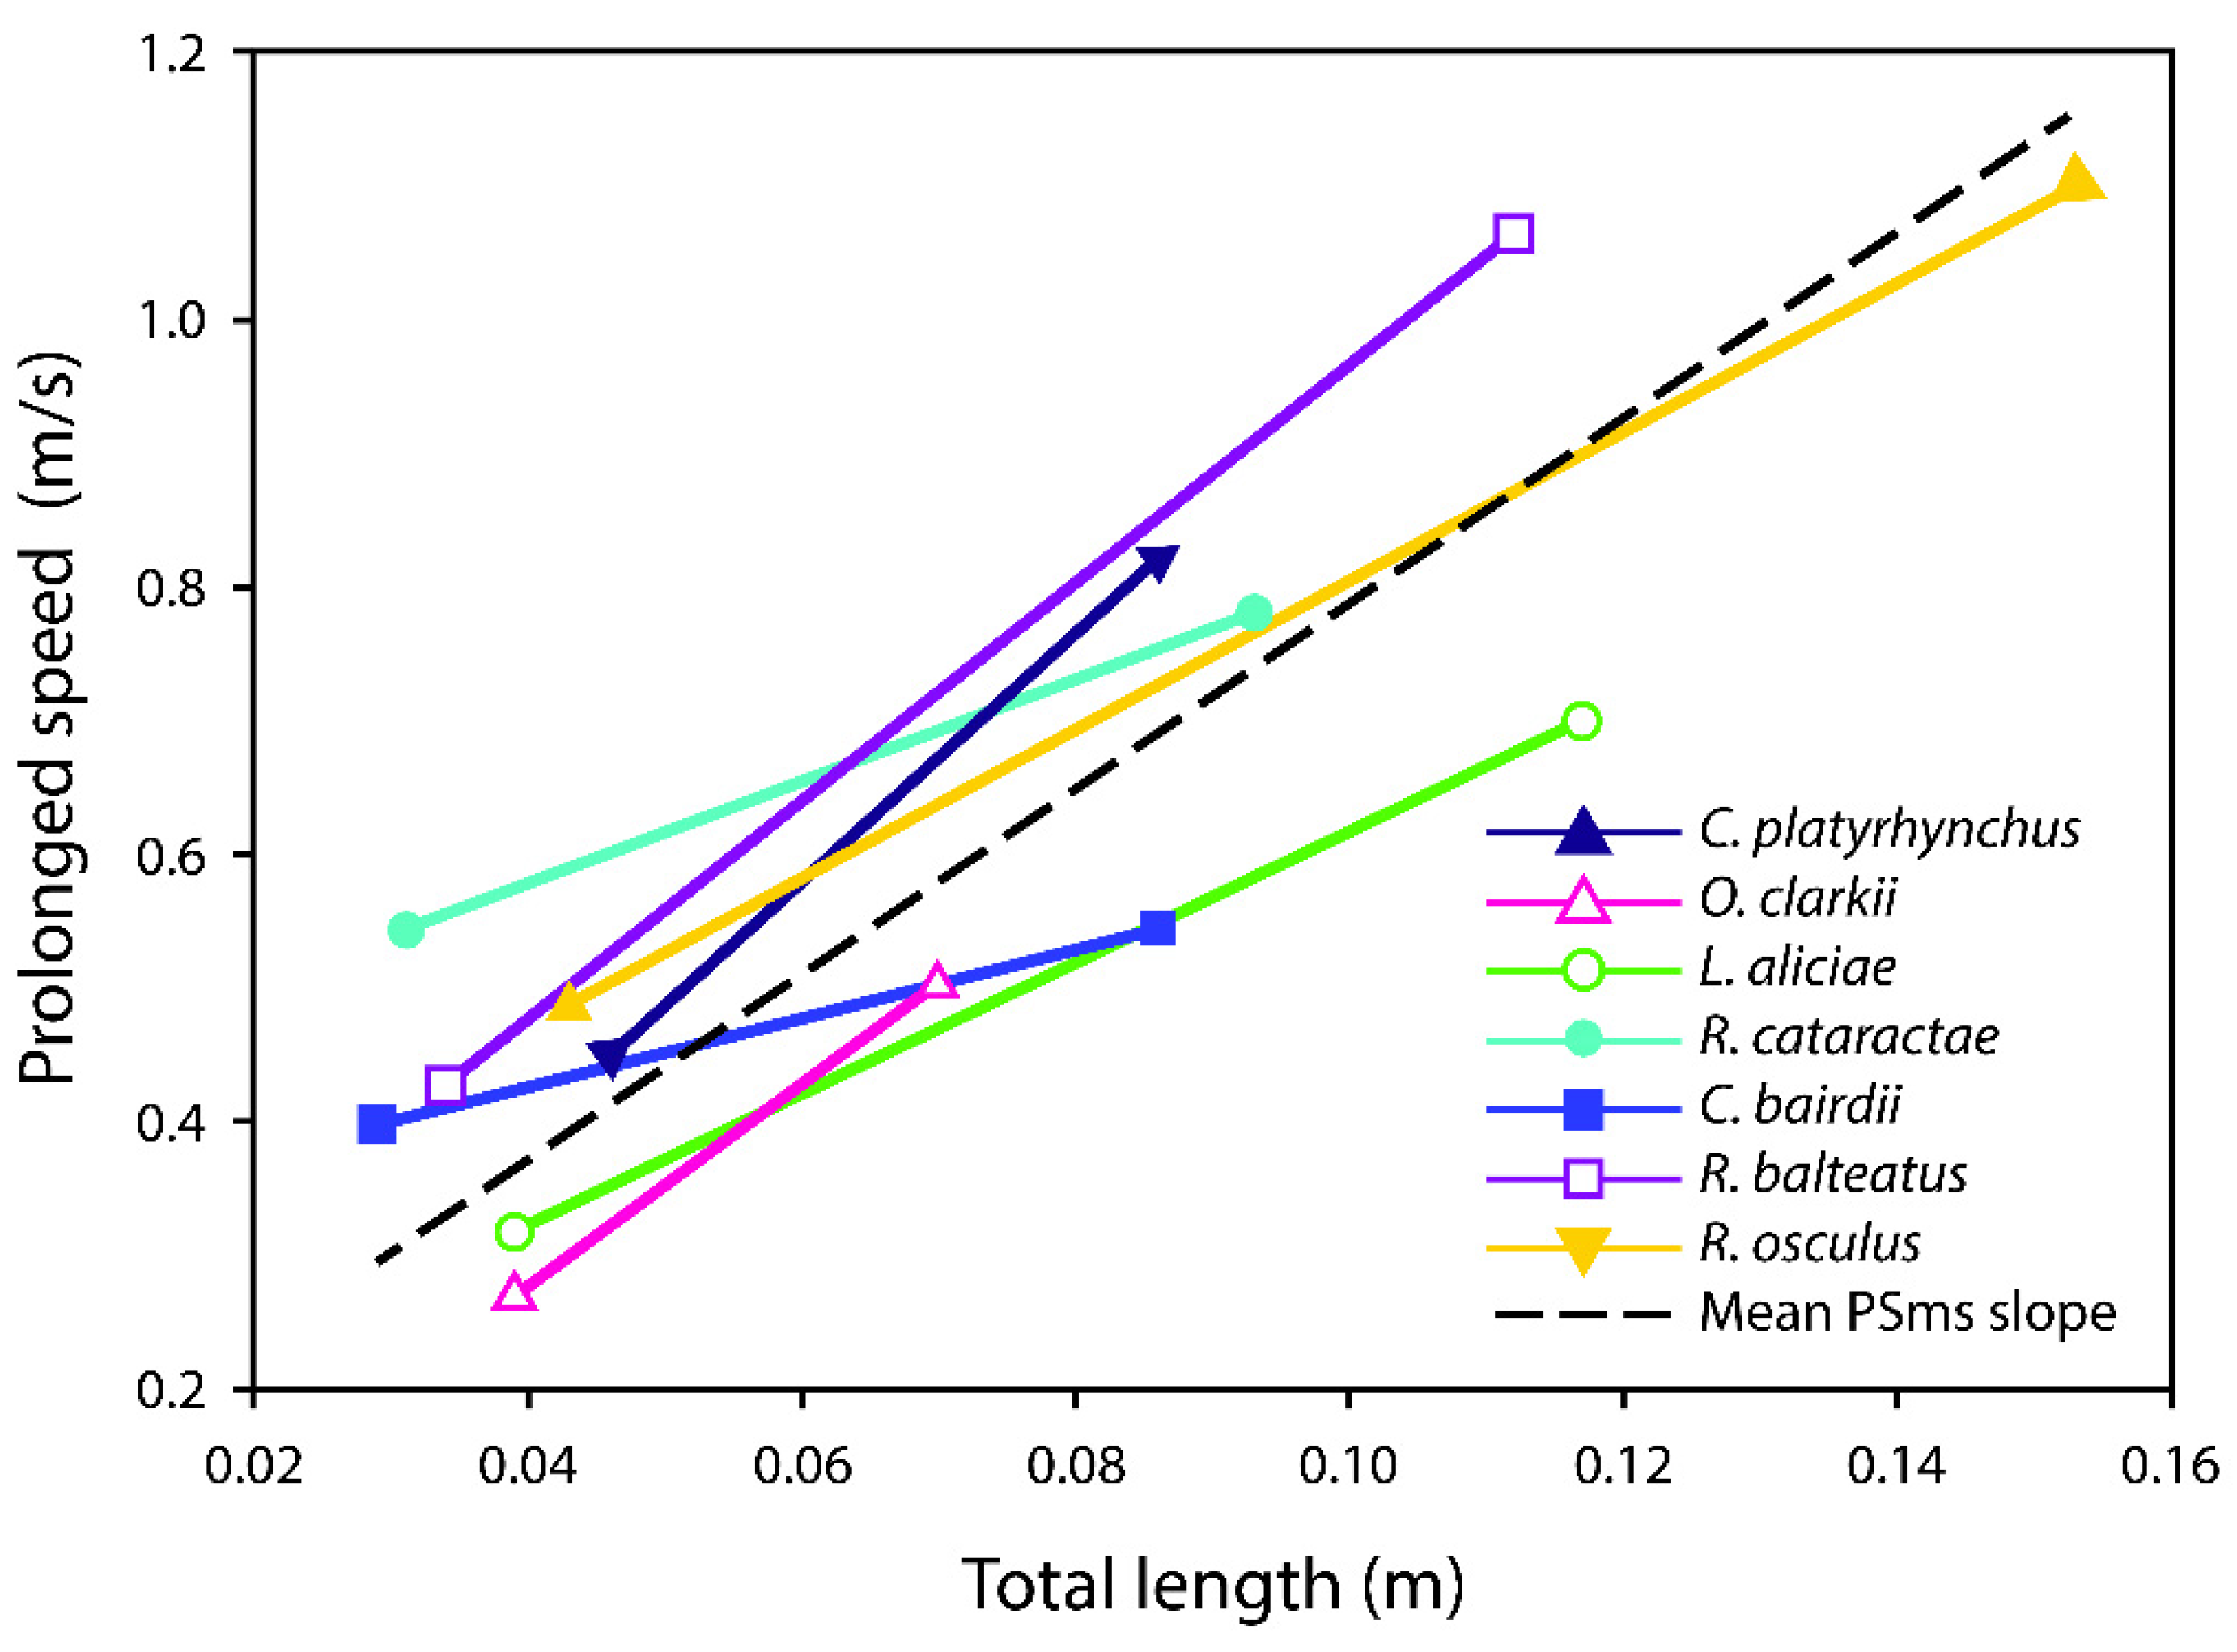
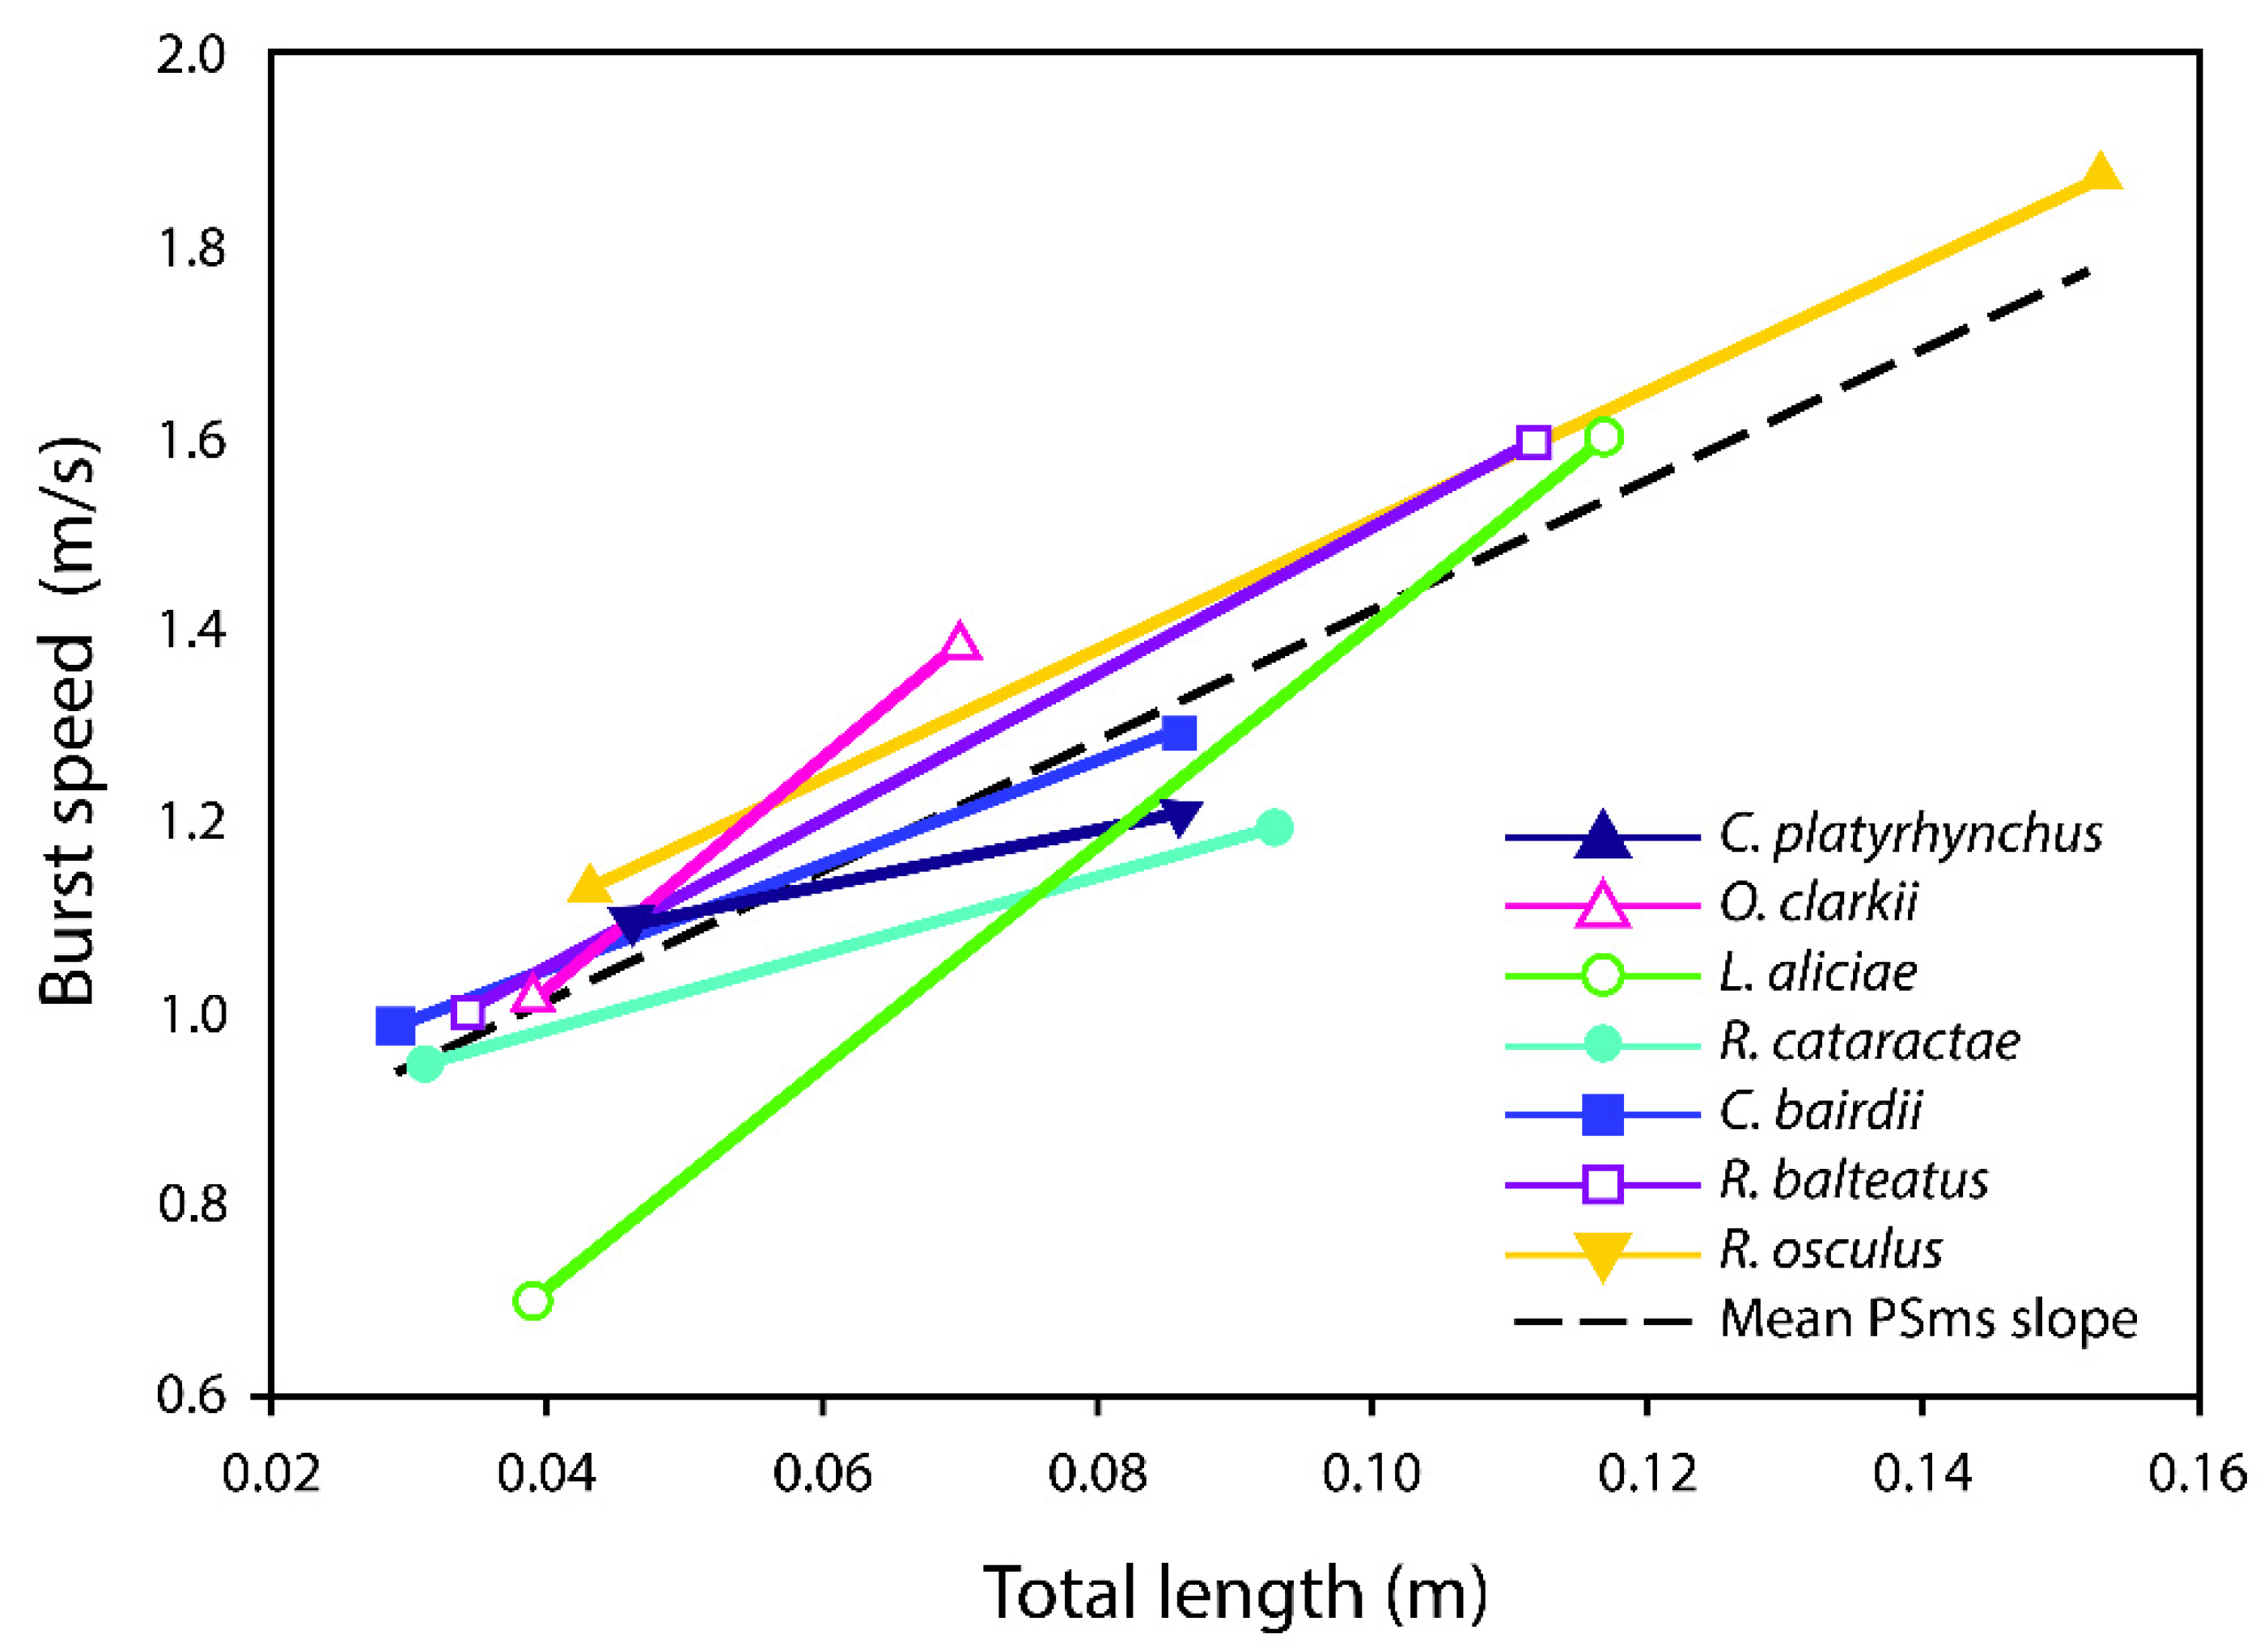
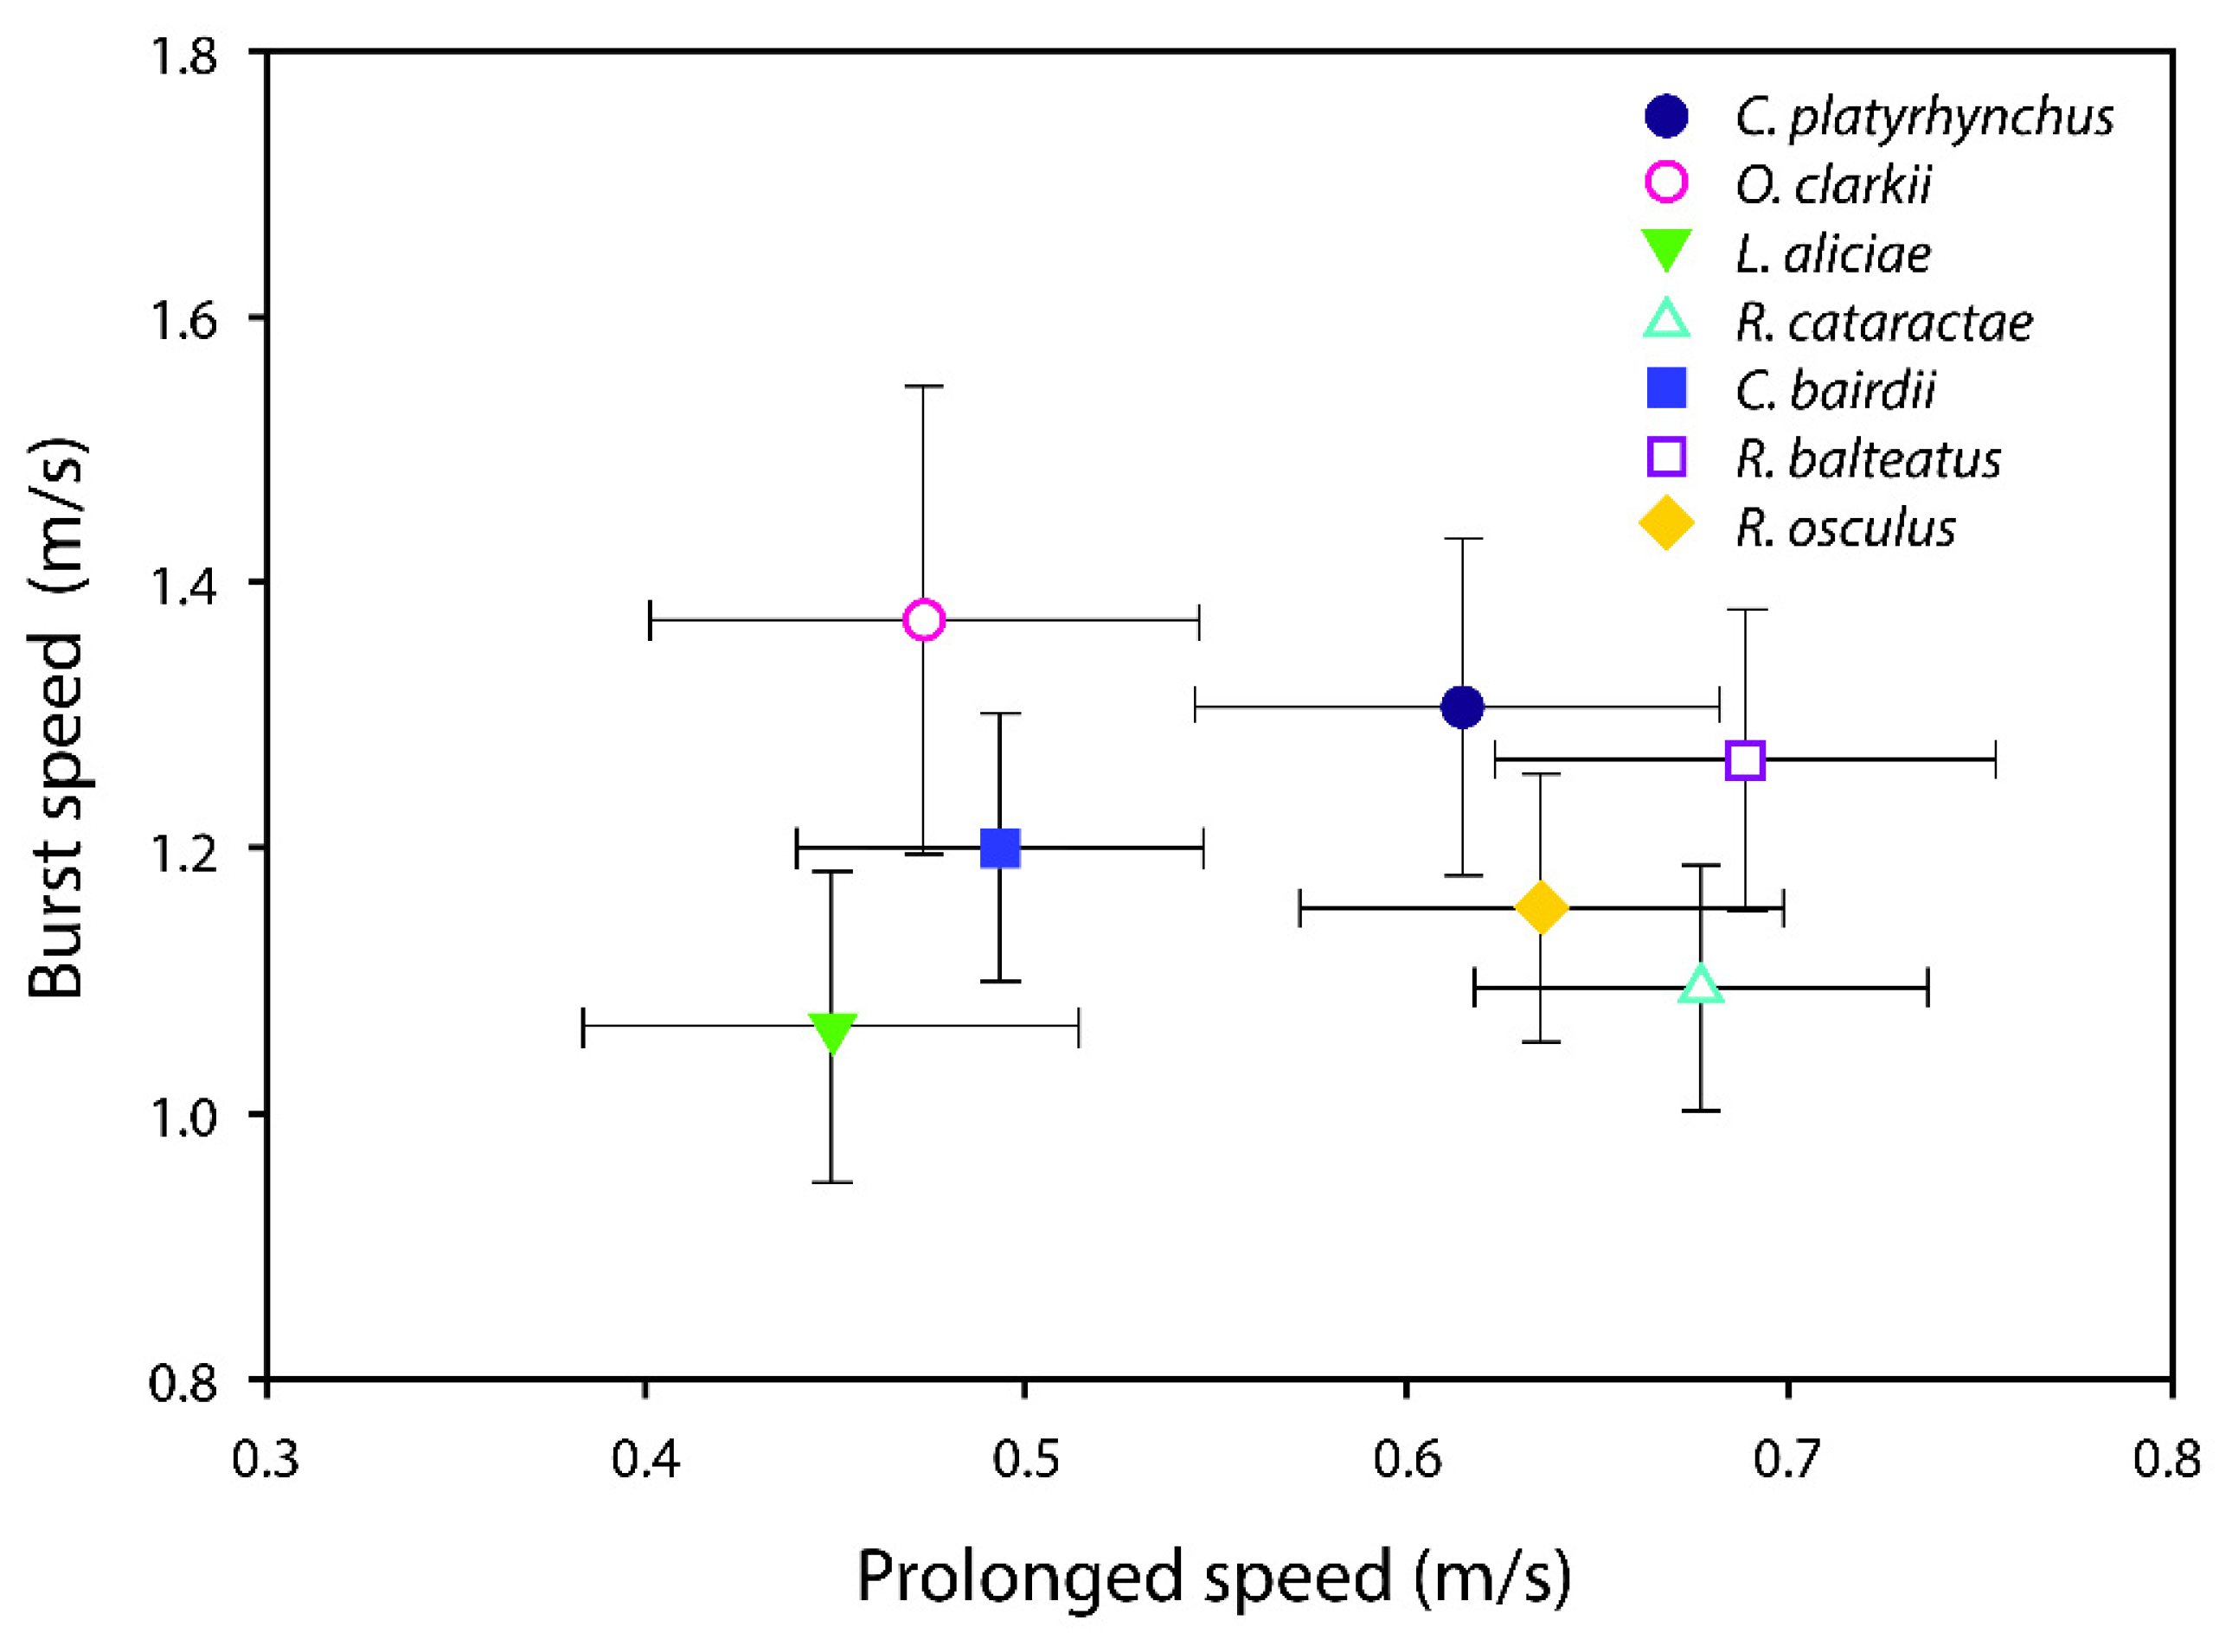
Simple linear regression of swim speed on total length (m) was used to characterize the change in swim speed with increasing body size for each species. We used analysis of covariance (ANCOVA; Proc GLM, SAS Enterprise Guide version 7.15 HF8, SAS Institute Inc., Cary, NC, USA) to test for differences in burst speed and prolonged speed among species while controlling for body size. Prolonged speed (m·s−1) and burst speed (m·s−1) were response variables. We used species as a categorical predictor variable and total length (in m) of the fish as a covariate. We also included the interaction between species and total length to test for heterogeneous slopes among species (Proc GLM, SAS Enterprise Guide version 7.15 HF8, SAS Institute Inc., Cary, NC, USA). By including total length as a covariate, the model tested for differences in mean swim speed among species at the overall mean total length among all species (mean total length = 0.071 m). The total length range of specimens tested overlapped this mean value for all species. Sample sizes varied among species and are recorded in Table 1.

3. Results

Prolonged speed varied substantially within species and did not differ significantly among species. Adjusted for size, the mean prolonged swim speed varied from 0.45 to 0.69 m·s−1 (Table 2). Analysis of covariance between prolonged swim speed and species, size, and the interaction between species and size showed only size to have a significant effect on prolonged swim speed (Table 3). Individually, five of the seven species exhibited a significant positive relationship between prolonged swim speed and total length. Only R. cataractae and C. bairdii exhibited non-significant increases in prolonged swim speed with increasing size (Table 3; Figure 3). When evaluated at a common size, four species exhibited prolonged swim speeds above the mean, and three exhibited prolonged swim speeds below the mean (Table 2). Above the mean, three of the four were benthic oriented species (e.g., R. osculus, C. platyrhynchus, R. cataractae), and one, R. balteatus, was a mid-water species. Below the mean, two of the three were mid-water species (e.g., L. aliciae, O. clarkii utah), and one, C. bairdii, was a benthic species (Figure 3).
Burst swim speed also differed substantially within each species, but it did not differ significantly among the seven species. When adjusted for size, mean burst speed varied from 1.07 to 1.37 m·s−1 (Table 4). Similar to prolonged speed, the interaction between species, total length, or species and total length together showed only total length to be a significant predictor in determining burst swim speed (Table 5). Individual slopes of burst swim speed and total length showed that five of the seven species exhibited significant positive relationships. Only R. cataractae and R. osculus exhibited non-significant increases in burst speed with increasing size (Table 5; Figure 4). When evaluated at a common size, two species, one benthic (e.g., C. platyrhynchus), and one mid-water (e.g., R. balteatus), exhibited average burst swim speeds above the overall mean. Of the remaining five species that exhibited lower burst swim speeds than the overall mean, three were benthic oriented species (e.g., R. osculus, C. bairdii, R. cataractae), and two were mid-water oriented species (e.g., O. clarkii utah, L. aliciae; Figure 4).
Species-specific burst and prolonged swim speed interaction is widely varied. Three species (e.g., C. bairdii, L. aliciae, O. clarkii utah) exhibited both burst and prolonged swim speeds below the overall mean, while two species (e.g., C. platyrhynchus, R. balteatus) exhibited both burst and prolonged swim speeds above the overall mean. Two species (e.g., R. osculus, R. cataractae) exhibited prolonged swim speeds above the overall mean but burst swim speeds below the overall mean, and no species exhibited comparatively high burst speeds but low prolonged speeds (Figure 5).

4. Discussion

Estimates of both burst and prolonged swimming performance are critical for determining effective passage structures and habitat management of fishes [42,43,44,45]. This study examined a naturally co-occurring group of seven stream fishes from the Great Basin of the western USA, characterizing swimming performance and determining the effectiveness of species and size as predictors of swim speed. Among the seven stream fishes tested, we found size to be the only significant factor to influence both prolonged and burst speed. This influence of size on swimming ability is well documented in multiple fish species [15,31,45,46].
Studies have shown that swim speeds measured under laboratory conditions may vary from those measured in the natural environment because of equipment differences and differences in conditioning of fish [47,48]. Thus, data from laboratory tests should not be viewed as exact values of swim speed but rather a baseline or estimate, which is useful for passage and waterway management considerations. Since we tested all species under the same laboratory conditions, the relative differences among species should provide a valid comparison among species.
The interaction between species or the interaction between species and total length together failed to have a significant effect on both prolonged and burst speed. Due to the variety of morphologies and habitat types present in this study, we expected species to have a more significant effect in predicting swim speeds. Previous studies have supported the idea of inherent trade-offs in swim speeds between different swimming modes [16,17,18,19]. Specific habitats may favor certain morphologies in which optimal body shapes for either strong burst speed or strong prolonged speed are mutually exclusive [23,24,25,26,27]. In our study, we expected benthic fishes, which experience less force from the current to exhibit higher burst speed and lower prolonged speed compared to mid-water fishes, which experience a greater force from the current and would exhibit higher prolonged speed but lower burst speed. This is in line with other studies that have examined the connection between morphology (and often by extension, habitat) and swimming speed [28,29,30,49]. However, most of these studies examined only one trait (either size and swimming performance, or morphology and swimming performance). This may suggest that while these trade-offs likely occur to some degree and that morphology and habitat influence swimming ability, size is the dominant predictor of both burst and prolonged swim speed. Our study was not designed to test for phylogenetic effects or specific shape effects on swim speeds. However, the fact that species and the species by body size interaction were not significant predictors in the models suggests that at least within this limited group of stream fishes, there is no evidence for a phylogenetic or shape effect. Such investigations would be a welcome addition as a second step in the investigation of fish swimming ability.
Another possibility for the non-significant species-specific influence we saw on swim speeds is alternative swimming modes. All four benthic species studied (e.g., C. bairdii, C. platyrhynchus, R. osculus, and R. cataractae) exhibited substrate bracing behaviors in response to high water velocities; other species did not make contact with the substrate while swimming. Substrate bracing behavior in C. bairdii was comprised of an absence of caudal fin movement and a lateral extension of pectoral fins at an angle to promote a net downward force to ‘anchor’ the fish to the bottom of the flume. Catostomus platyrhynchus exhibited a burst and hold strategy whereby individuals would alternate between a short burst of swimming followed by an oral gripping behavior on the bottom of the swimming chamber. Rhinichthys osculus and R. cataractae exhibited various arching behaviors. As a result of this behavior, the reported prolonged speed values for these species should instead be considered as critical holding velocities or slip speed velocities [50]. The remaining species exhibited direct swimming in the water column, and all values associated with these species should be considered as true measures of prolonged speed.
Bracing behavior appears to be a means of equalizing the ability to maintain position in moving water and is inconsistent with the first part of the ecomorphological hypothesis, which predicts that morphological variation would have a direct effect on performance. Benthic species are able to overcome what seems to be a disadvantageous morphology for prolonged swimming through unique bracing behaviors. Bracing behavior has many inherent benefits, including food capture, predator avoidance, and habitat selection while concurrently allowing fish to expend minimal energy in the process [51,52]. This behavior-mediated performance further illustrates the need to account for unique behavioral adaptations when measuring swim speeds or for passage applications.
Reliably predicting swimming performance has valuable management implications [42,43,44]. Swimming performance is an important variable in the design and implementation of in-stream barriers to movement such as culverts, weirs, and dams [53]. Fish that rely upon stream connectivity often become fragmented by these barriers because swimming performance was not properly accounted for in the design stages, and swim speeds are generally well below the water velocities created by these obstacles [54]. The results of our swimming performance tests highlight the significance of size as the primary predictor of swimming performance in stream fishes. Additionally, alternative swimming behaviors such as “bracing” should be considered when evaluating fish’s ability to cross in-stream barriers. As reported above, benthic species rely on a bracing behavior and interacting with the substrate to maintain position during high water velocities. Fish passage efforts will be greatly enhanced by designing for substrate that maximizes the holding ability in benthic fishes [55,56]. Furthermore, the success of fish passage may be increased by taking into account the threshold values of swimming performance reported in this study. Using the lower 95% confidence interval rather than the mean would take size into account by maximizing the success of smaller fishes. For some species, this would mean virtually no flow at all (Table 2 and Table 4). To deal with this, some recent studies have shown the ability of boundary layers of in-stream barriers to be successful in reducing flow for benthic fishes to cross successfully [55,56,57]. Although we did not find a significant effect of species in our analysis, these data should not be interpreted to suggest that such will be the case in other systems. Fish passage models that apply to streams that include the assemblage of fishes we tested in this study (or functionally and morphologically similar assemblages) can benefit from swim speed data from this study, but other studies in other locations with other species may reach different conclusions. Knowledge of swim speeds specific to the group of fishes in the local area will be important for the design of specific fish passage structures.

5. Conclusions

Fish passage models that have traditionally been established using salmonid-based estimates of swimming performance may greatly overestimate swimming capabilities of other native fishes. Effective fish passage must account for all fish species in a system, including those with only seasonal use or unique behaviors. Future studies on swimming performance and passage should seek to incorporate a wider range of species [57,58,59]. Fish passage models that allow for the passage of small-bodied fish will effectively allow movement in a stream for all species and size classes. This study provides baseline data for some understudied fish species for use in passage considerations or waterway management in the Great Basin of the western USA.

Author Contributions

Conceptualization, R.B.R., R.H.H. and M.C.B.; methodology, J.R.A., R.B.R., R.H.H. and M.C.B.; formal analysis, J.R.A. and M.C.B.; investigation, J.R.A., R.B.R., R.H.H. and M.C.B.; resources, R.B.R., R.H.H. and M.C.B.; data curation, M.C.B.; writing—original draft preparation, K.R.O. and J.R.A.; writing—review and editing, K.R.O., J.R.A., R.B.R., R.H.H. and M.C.B.; visualization, K.R.O., J.R.A. and M.C.B.; supervision, R.B.R., R.H.H. and M.C.B.; project administration, R.H.H. and M.C.B.; funding acquisition, R.H.H. All authors have read and agreed to the published version of the manuscript.

Funding

This research was funded by the Utah Department of Transportation, grant number UDOT 08-9117.

Institutional Review Board Statement

The study was conducted according to the guidelines of the Declaration of Helsinki under the direction of the Institutional Animal Care and Use Committee at Brigham Young University, protocol #07-0501 (Approved 8 May, 2007). Collections were made under Utah Division of Wildlife Resources collection permit #1COLL5950.

Informed Consent Statement

Not applicable.

Data Availability Statement

Data are available in Dryad DOI doi:10.5061/dryad.gxd2547n6, accessed 14 September 2021.

Acknowledgments

Many thanks to D. Maynes for use of his laboratory flume. We also thank A. Beavers, E. Billman, B. Hutchison, E. Mackelprang, J. McDonald and T. Tran for field and laboratory assistance. The views expressed herein do not necessarily represent the views of the Federal Energy Regulatory Commission of the United States.

Conflicts of Interest

The authors declare no conflict of interest. The funders had no role in the design of the study; in the collection, analyses, or interpretation of data; in the writing of the manuscript, or in the decision to publish the results.

References

  1. Meyers, P.J.; Belk, M.C. Shape variation in a benthic stream fish across flow regimes. Hydrobiologia 2014, 738, 147–154. [Google Scholar] [CrossRef]
  2. Barros, T.F.; Louvise, J.; Caramashi, E.P. Flow gradient drives morphological divergence in an Amazon pelagic stream fish. Hydrobiologia 2019, 833, 217–229. [Google Scholar] [CrossRef]
  3. Beamish, F.H. Swimming capacity. In Fish Physiology; Hoar, W.S., Randall, D.J., Eds.; Academic Press: New York, NY, USA; London, UK, 1978; Volume 7, pp. 101–187. [Google Scholar]
  4. Videler, J.J.; Wardle, C.S. Fish swimming stride by stride: Speed limits and endurance. Rev. Fish Biol. Fish. 1991, 1, 23–40. [Google Scholar] [CrossRef]
  5. Hammer, C. Fatigue and exercise tests with fish. Comp. Biochem. Physiol. Part A Phys. 1995, 112, 1–20. [Google Scholar] [CrossRef]
  6. Pakkasmaa, S.; Piironen, J. Water velocity shapes juvenile salmonids. Ecol. Evol. 2000, 14, 721–730. [Google Scholar] [CrossRef]
  7. Spoljaric, M.A.; Reimchen, T.E. Habitat-specific trends in ontogeny of body shape in stickleback from coastal archipelago: Potential for rapid shifts in colonizing populations. J. Morphol. 2011, 272, 590–597. [Google Scholar] [CrossRef]
  8. Rincón, P.; Bastir, M.; Grossman, G. Form and performance: Body shape and prey-capture success in four drift-feeding minnows. Oecologia 2007, 152, 345–355. [Google Scholar] [CrossRef] [PubMed]
  9. Taylor, E.B.; Mcphail, J.D. Burst swimming and size-related predation of newly emerged coho salmon Oncorhynchus kisutch. Trans. Am. Fish. Soc. 1985, 114, 546–551. [Google Scholar] [CrossRef]
  10. Walker, J.A.; Ghalambor, C.K.; Griset, O.L.; McKenney, D.; Reznick, D.N. Do faster starts increase the probability of evading predators? Funct. Ecol. 2005, 19, 751–897. [Google Scholar] [CrossRef]
  11. Videler, J.J. Fish Swimming; Chapman & Hall: London, UK, 1993. [Google Scholar]
  12. Kolok, A.S. Interindividual variation in the prolonged locomotor performance of ectothermic vertebrates: A comparison of fish and herpetofaunal methodologies and a brief review of the recent fish literature. Can. J. Fish. Aquat. Sci. 1999, 56, 700–710. [Google Scholar] [CrossRef]
  13. Reidy, S.P.; Kerr, S.R.; Nelson, J.A. Aerobic and anaerobic swimming performance of individual Atlantic cod. J. Exp. Biol. 2000, 203, 347–357. [Google Scholar] [CrossRef]
  14. Plaut, I. Critical swimming speed: Its ecological relevance. Comp. Biochem. Physiol. Part A Mol. Integr. Physiol. 2001, 131, 41–50. [Google Scholar] [CrossRef]
  15. Rubio-Gracio, F.; García-Berthou, E.; Guasch, H.; Zamora, L.; Vila-Gispert, A. Size-related effects and the influence of metabolic traits and morphology on swimming performance in fish. Curr. Zool. 2020, 66, 1–11. [Google Scholar] [CrossRef] [Green Version]
  16. Webb, P.W.; Skadsen, J.M. Strike tactics of Esox. Can. J. Zool. Rev. Can. Zool. 1980, 58, 1462–1469. [Google Scholar] [CrossRef]
  17. Webb, P.W. Body form, locomotion and foraging in aquatic vertebrates. Am. Zool. 1984, 24, 107–120. [Google Scholar] [CrossRef]
  18. Ojanguren, A.F.; Brana, F. Effects of size and morphology on swimming performance in juvenile brown trout (Salmo trutta L.). Ecol. Freshw. Fish 2003, 12, 241–246. [Google Scholar] [CrossRef]
  19. Wakeling, J.M. Fast start mechanics. In Fish Biomechanics: Fish Physiology; Shadwick, R.E., Lauder, G.V., Eds.; Academic Press: London, UK, 2007; pp. 333–368. [Google Scholar]
  20. Hynes, H.B. The Ecology of Running Water; University of Toronto Press: Toronto, ON, Canada, 1970. [Google Scholar]
  21. Webb, P.W. Fast-start resistance of trout. J. Exp. Biol. 1982, 96, 93–106. [Google Scholar] [CrossRef]
  22. Webb, P.W. Locomotor patterns in the evolution of actinopterygian fishes. Am. Zool. 1982, 22, 329–342. [Google Scholar] [CrossRef]
  23. Weihs, D. A hydrodynamical analysis of fish turning manoeuvres. Proc. R. Soc. Lond. 1972, 182, 59–72. [Google Scholar]
  24. Weihs, D. The mechanism of rapid starting of a slender fish. Biorheology 1973, 10, 343–350. [Google Scholar] [CrossRef] [PubMed]
  25. Webb, P.W. Effects of partial caudal-fin amputation on the kinematics and metabolic rate of underyearling sockeye salmon (Oncorhynchus nerka) at steady swimming speeds. J. Exp. Biol. 1973, 59, 565–582. [Google Scholar] [CrossRef]
  26. Lighthill, M.J. Mathematical Biofluid Dynamics; CBMS-NSF Regional Conference Series in Applied Mathematics; Society for Industrial and Applied Mathematics: Philadelphia, PA, USA, 1975. [Google Scholar]
  27. Webb, P.W. Effects of median-fin amputation on fast-start performance of rainbow trout (Salmo gairdneri). J. Exp. Biol. 1977, 68, 123–135. [Google Scholar] [CrossRef]
  28. Willis, S.C.; Winemiller, K.O.; Lopez-Fernandez, H. Habitat structural complexity and morphological diversity of fish assemblages in a Neotropical floodplain river. Oecologia 2005, 142, 284–295. [Google Scholar] [CrossRef] [PubMed]
  29. Brinsmead, J.; Fox, M.G. Morphological variation between lake- and stream-dwelling rock bass and pumpkinseed populations. J. Fish Biol. 2002, 61, 1619–1638. [Google Scholar] [CrossRef]
  30. Naspleda, J.; Vila-Gispert, A.; Fox, M.G.; Zamora, L.; Ruiz-Navarro, A. Morphological variation between non-native lake- and stream-dwelling pumpkinseed Lepomis gibbosus in the Iberian Peninsula. J. Fish Biol. 2012, 81, 1915–1935. [Google Scholar] [CrossRef]
  31. Prenosil, E.; Koupal, K.; Grauf, J.; Schoenebeck, C.; Hoback, W.W. Swimming and jumping ability of 10 Great Plains fish species. J. Freshw. Ecol. 2016, 31, 123–130. [Google Scholar] [CrossRef] [Green Version]
  32. Ohlberger, J.; Staaks, G.; Hölker, F. Swimming efficiency and the influence of morphology on swimming costs in fishes. J. Comp. Physiol. B Biochem. Syst. Environ. Physiol. 2006, 176, 17–25. [Google Scholar] [CrossRef]
  33. Mchenry, M.J.; Lauder, G.V. Ontogeny of form and function: Locomotor morphology and drag in zebrafish (Danio rerio). J. Morphol. 2006, 267, 1099–1109. [Google Scholar] [CrossRef]
  34. Roscoe, D.W.; Hinch, S.G. Effectiveness monitoring of fish passage facilities: Historical trends, geographic patterns and future directions. Fish Fish. 2010, 11, 12–33. [Google Scholar] [CrossRef]
  35. Lee, C.G.; Farrell, A.P.; Lotto, A.; MacNutt, M.J.; Hinch, S.G.; Healey, M.C. The effect of temperature on swimming performance and oxygen consumption in adult sockeye (Oncorhynchus nerka) and coho (O. kisutch) salmon stocks. J. Exp. Biol. 2003, 206, 3239–3251. [Google Scholar] [CrossRef] [PubMed] [Green Version]
  36. Elliott, J.M.; Elliott, J.A. Temperature requirements of Atlantic salmon Salmo salar, brown trout Salmo trutta and Arctic charr Salvenlinus aplinus: Predicting the effects of climate change. J. Fish Biol. 2010, 77, 1793–1817. [Google Scholar] [CrossRef]
  37. Brett, J.R. The respiratory metabolism and swimming performance of young sockeye salmon. J. Fish. Board Can. 1964, 21, 1183–1226. [Google Scholar] [CrossRef]
  38. Ward, D.L.; Schultz, A.A.; Matson, P.G. Differences in swimming ability and behaviour in response to high water velocities among native and nonnative fishes. Environ. Biol. Fishes 2003, 68, 87–92. [Google Scholar] [CrossRef]
  39. Underwood, Z.E.; Myrick, C.A.; Compton, R.I. Comparative swimming performance of five catostomus species and roundtail chub. N. Am. J. Fish. Manag. 2014, 34, 753–763. [Google Scholar] [CrossRef]
  40. Dockery, D.R.; McMahon, T.E.; Kappenman, K.M.; Blank, M. Evaluation of swimming performance for fish passage of longnose dace Rhinichthys cataractae using an experimental flume. J. Fish Biol. 2017, 90, 980–1000. [Google Scholar] [CrossRef]
  41. Sigler, W.F.; Sigler, J.W. Fishes of the Great Basin: A Natural History; University of Nevada Press: Reno, NV, USA, 1987. [Google Scholar]
  42. Peake, S.; Mckinley, R.S.; Scruton, D.A. Swimming performance of various freshwater Newfoundland salmonids relative to habitat selection and fishway design. J. Fish Biol. 1997, 51, 710–723. [Google Scholar] [CrossRef]
  43. Wolter, C.; Arlinghaus, R. Navigation impacts on freshwater fish assemblages: The ecological relevance of swimming performance. Rev. Fish Biol. Fish. 2003, 13, 63–89. [Google Scholar] [CrossRef]
  44. Kimball, M.E.; Boswell, K.M.; Rozas, L.P.; Berwaldt, E.K.; Richards, A.R. Swimming abilities of juvenile estuarine fishes: Implications for passage at water control structures. Wetl. Ecol. Manag. 2018, 26, 383–390. [Google Scholar] [CrossRef]
  45. Ficke, A.D.; Myrick, C.A.; Jud, N. The Swimming and Jumping Ability of Three Small Great Plains Fishes: Implications for Fishway Design. Trans. Am. Fish. 2011, 140, 1521–1531. [Google Scholar] [CrossRef]
  46. Kane, E.A.; Roeder, M.M.; Derue, M.L.; Ghalambor, C.K. Integration between swim speed and mouth size evolves repeatedly in Trinidadian guppies and aligns with suction-feeding fishes. J. Exp. Biol. 2019, 222, jeb190165. [Google Scholar] [CrossRef] [Green Version]
  47. Kern, P.; Cramp, R.L.; Gordos, M.A.; Watson, J.R.; Franklin, C.E. Measuring Ucrit and endurance: Equipment choice influences estimates of fish swimming performance. J. Fish Biol. 2018, 92, 237–247. [Google Scholar] [CrossRef]
  48. Silva, A.T.; Lucas, M.C.; Castro-Santo, T.; Katopodis, C.; Baumgartner, L.J.; Thiem, J.D.; Aarestrup, K.; Pompeu, P.S.; O’Brien, G.C.; Braun, D.C.; et al. The future of fish passage science, engineering, and practice. Fish Fish. 2018, 19, 340–362. [Google Scholar] [CrossRef] [Green Version]
  49. Langerhans, R.B. Predictability of phenotypic differentiation across flow regimes in fishes. Integr. Comp. Biol. 2008, 48, 699–701. [Google Scholar] [CrossRef] [PubMed] [Green Version]
  50. Rimmer, D.M.; Saunders, R.L.; Paim, U. Effects of temperature and season on the position holding performance of juvenile Atlantic salmon (Salmo salar). Can. J. Zool. Rev. Can. Zool. 1985, 63, 92–96. [Google Scholar] [CrossRef]
  51. Arnold, G.P.; Webb, P.W.; Holford, B.H. The role of the pectoral fins in station-holding of atlantic salmon parr. (Salmo salar). J. Exp. Biol. 1991, 156, 625–629. [Google Scholar] [CrossRef]
  52. Billman, E.J.; Pyron, M. Evolution of form and function: Morphology and swimming performance in North American minnows. J. Freshw. Ecol. 2005, 20, 221–232. [Google Scholar] [CrossRef]
  53. Warren, M.L.; Pardew, M.G. Road crossings as barriers to small-stream fish movement. Trans. Am. Fish. Soc. 1998, 127, 637–644. [Google Scholar] [CrossRef]
  54. Gibson, R.J.; Haedrich, R.L.; Wernerheim, C.M. Loss of fish habitat as a consequence of inappropriately constructed stream crossings. Fisheries 2005, 30, 10–17. [Google Scholar] [CrossRef]
  55. Johnson, K.; Wait, L.; Monk, S.; Rader, R.; Hotchkiss, R.; Belk, M. Effects of Substrate on Movement Patterns and Behavior of Stream Fish through Culverts: An Experimental Approach. Sustainability 2019, 11, 470. [Google Scholar] [CrossRef] [Green Version]
  56. Rodgers, E.M.; Heaslip, B.M.; Cramp, R.L.; Riches, M.; Gordos, M.A.; Franklin, C.E. Substrate roughening improves swimming performance in two small-bodied riverine fishes: Implications for culvert remediation and design. Conserv. Physiol. 2017, 5, 1–10. [Google Scholar] [CrossRef] [Green Version]
  57. Goodrich, H.R.; Watson, J.R.; Cramp, R.L.; Gordos, M.A.; Franklin, C.E. Making culverts great again. Efficacy of a common culvert remediation strategy across sympatric fish species. Ecol. Eng. 2018, 116, 143–153. [Google Scholar] [CrossRef]
  58. Bunt, C.M.; Castro-Santos, T.; Haro, A. Performance of fish passage structures at upstream barriers to migration. River Res. Appl. 2011, 28, 457–478. [Google Scholar] [CrossRef]
  59. Yan, G.J.; He, X.K.; Cao, Z.D.; Fu, S.J. An interspecific comparison between morphology and swimming performance in cyprinids. J. Evol. Biol. 2013, 26, 1802–1815. [Google Scholar] [CrossRef] [PubMed]
Figure 1. Three-dimensional representation of observational tank used to measure burst speed. VC, video camera; OA, observation arena; CC, confinement cylinder; MP, mock predator; HD, hinged doors; AR, aluminum runner.
Water 13 02570 g001
Figure 2. Representation of the swimming chamber used for prolonged swimming speed tests. FC, flow conditioner; CS, confinement section; US, upstream screen; OS, observation section; DS, downstream screen; R, reservoir; P, pump. Arrows indicate current directions.
Water 13 02570 g002
Figure 3. Ordinary least squares regression relationship between prolonged speed and total length in seven stream fishes common to the Great Basin of the western USA. Range of species-specific lines matches the range of total length of individuals tested. Prolonged speed measured in meters per second (m/s) and total length measured in meters (m).
Water 13 02570 g003
Figure 4. Ordinary least squares regression relationship between burst speed and total length in seven stream fishes common to the Great Basin Province of the western USA. Range of species-specific lines matches the range of total length of individuals tested. Burst speed measured in meters per second (m/s) and total length measured in meters (m).
Water 13 02570 g004
Figure 5. Least squares means of seven stream fish species found in the Great Basin Province of the western USA. Burst speed and prolonged speed measured in meters per second (m/s).
Water 13 02570 g005
Table 1. Summary of sample sizes and collection locations for species used in the study. N represents the number of fish. “Range” and “SE” are the range and standard error of the mean standard length of each fish species.
SpeciesNCollection LocationStandard Length (mm)Range (mm)SE
Oncorhynchus clarkii utah53Little Dell & Manning Meadows Hatcheries, UT, USA54.6739–701.26
Lepidomeda aliciae45Soldier Creek, UT, USA83.0039–1072.57
Rhinichthys cataractae56Soldier Creek, UT, USA65.1835–912.33
Cottus bairdii52Diamond Fork, UT, USA63.3029–861.56
Catostomus platyrhynchus44Soldier Creek, UT, USA93.9143–1504.82
Richardsonius balteatus30Fish Creek, UT, USA79.8034–1123.14
Rhinichthys osculus46Salina Creek, UT, USA69.9646–861.65
Table 2. Summary of prolonged swim speed data for seven species of stream fishes located in the Great Basin of the western USA. NProlonged is the number of prolonged swim speed tests for each species, and prolonged speed slope represents the slope of prolonged swim speed in meters per second (m·s−1) as total length in meters (m) increases.
SpeciesNProlongedMean Prolonged Speed (m/s)Confidence IntervalProlonged Speed SlopeConfidence Interval
Catostomus platyrhynchus150.610.54–0.695.573.11–8.04
Oncorhynchus clarkii utah420.470.40–0.557.555.59–9.50
Lepidomeda aliciae220.450.38–0.514.921.55–8.28
Rhinichthys cataractae150.680.62–0.743.84−2.34–10.01
Cottus bairdii250.490.44–0.552.59−2.65–7.83
Richardsonius balteatus190.690.62–0.758.195.33–11.06
Rhinichthys osculus200.630.57–0.709.324.15–14.49
Table 3. Analysis of covariance results comparing prolonged speed with individual species, total length, and their interaction as additional variables. The term df represents degrees of freedom. Sp × TL is the interaction of species and total length.
Source of VariationdfF Valuep Value
Species61.310.2536
Total length161.84<0.0001
Sp × TL61.440.2011
Table 4. Summary of burst swim speed data for seven species of stream fishes located in the Great Basin of the western USA. NBurst is number of burst swim speed tests for each species, and the burst speed slope represents the slope of burst swim speed in meters per second (m·s−1) as total length in meters (m) increases.
SpeciesNBurstMean Burst Speed (m/s)Confidence Interval (95%)Burst Speed SlopeConfidence Interval (95%)
Catostomus platyrhynchus251.311.18–1.446.742.55–10.94
Oncorhynchus clarki utah471.371.19–1.5511.753.87–19.58
Lepidomeda aliciae381.070.95–1.1812.275.95–18.59
Rhinichthys cataractae271.101.01–1.193.96−2.22–10.14
Cottus bairdii461.201.10–1.305.380.43–10.34
Richardsonius balteatus291.271.16–1.387.610.86–14.37
Rhinichthys osculus211.161.06–1.262.91−9.35–15.17
Table 5. Analysis of covariance results comparing burst speed with individual species, total length, or their interaction as additional variables. df represents degrees of freedom. Sp × TL is the analysis of species and total length together with burst swim speed.
Source of VariationdfF Valuep Value
Species60.950.4627
Total length127.91<0.001
Sp × TL60.950.4601
Publisher’s Note: MDPI stays neutral with regard to jurisdictional claims in published maps and institutional affiliations.

