Article

Health Risk and Geochemical Assessment of Trace Elements in Surface Sediment along the Hooghly (Ganges) River Estuary (India)

1
Department of Marine Science, University of Calcutta, 35 Ballygunge Circular Road, Calcutta 700019, India
2
Centro Servizi Metrologici e Tecnologici Avanzati (CeSMA), Complesso Universitario di Monte Sant’Angelo, Via Cinthia 21, 80126 Naples, Italy
3
Department of Chemistry and Biology “A. Zambelli”, University of Salerno, Via Giovanni Paolo II 132, 84084 Fisciano, Salerno 84084, Italy
4
Department of Biology, University of Naples Federico II, Via Cinthia ed. 7, 80126 Naples, Italy
5
Department of Chemical Sciences, University of Naples Federico II, Via Cinthia, 80126 Naples, Italy
*
Authors to whom correspondence should be addressed.
Water 2021, 13(2), 110; https://doi.org/10.3390/w13020110
Submission received: 7 December 2020 / Revised: 28 December 2020 / Accepted: 31 December 2020 / Published: 6 January 2021
(This article belongs to the Section Water Quality and Contamination)

Abstract

:
This study investigated sediment spatial and seasonal distribution of trace elements (TEs) (n = 16) and human health effects along the Hooghly River Estuary (India). The index of geo-accumulation (Igeo), enrichment factor (EF), hazard quotient (HQ), modified hazard quotient (mHQ) and toxic risk unit (TRI) were calculated to estimate sediment pollution level, while hazard index (HI) and lifetime cancer risk (LCR) were used to assess TEs enrichment vs. human health. The concentrations (µg/g dry weight) of TEs were: Cd (0.01–1.58), Cr (41.98–105.49), Cu (16.41–51.09), Ni (28.37–63.90), Fe (22075–47919), Mn (423–630), Co (11.43–23.11), Zn (48.82–105.81), V (63.92–138.92), Pb (25.01–43.27) and Ti (0.18–3.50); As (2.92–16.26), B (59.34–98.78), Si (11.52–98.78); Be (1.71–4.81), Ba (95.23–293.72). From Igeo and EF, Cd was the major contaminant, while Ni presented moderate/high contamination (HQ and TRI). Children were more exposed to carcinogenic and non-carcinogenic risks compared to adults. For non-carcinogenic substances, no significant risk was found to both children and adults (HIs < 1). The LCR for Cr (3.924 × 10⁻⁴ for children) and As (1.379 × 10⁻⁴ for children) was higher than the threshold limit value (TLV, 10−4 and 10−6) indicating significant carcinogenic risks to be managed.

1. Introduction

Urban areas, industry and agriculture can release great amounts of the so-called trace elements (TEs), resulting especially in the degradation of estuarine environments with implications to human health [1]. Several TEs such as Cu, Cr, Mn, Ni and Zn, are essential for normal human metabolism while overexposure to those elements will have detrimental effects to human health and cause chronic intoxication [2]. In contrast, As, Pb and Cd are not required for metabolic activities and even at very low levels will have toxic effects on human body [3]. TEs accumulated in the estuarine sediment might expose the human body through different routes, causing incalculable harm to human health. Due to their persistence, and potential toxicity, Cd, Cr, As, Pb, Cu, Zn, and Ni, have been listed as priority control pollutants by the United States Environmental Protection Agency (USEPA) and have derived more attention in many parts of the world [4]. Studies have shown that excessive human intake of TEs can cause neurological, cardiovascular, and chronic kidney diseases [5,6,7].
The Hooghly River Estuary (HRE) is a meso-macrotidal fluvial system characterized by a myriad of ecosystems providing services to millions of people such as perpetual water supply for agricultural, human and industrial use. This fluvial system is experiencing a huge morphometric change followed by bank erosion and is being endangered due to both natural and anthropogenic stresses which need immediate attention. The river flows through the industrial towns (Howrah and Haldia) and the densely populated metropolitan city of Kolkata (former Calcutta) before it drains into the Bay of Bengal at Gangasagar (India). The estuary draws a significant amount of agricultural waste from the adjacent localities and industrial and urban wastewater together account for 1153 million L/day (~13 m3/s) [8,9]. Due to industrial, commercial, and domestic land-use areas, the catchment of the HRE is highly urbanized and has become a receptor of a diverse source of contaminants from both point and non-point sources of pollution. Previous studies about TEs contamination along the HRE [10,11,12,13,14,15,16] were carried out, but an evaluation on human health risk is still missing. Therefore, it is important to assess the ecological and health risks of TEs in the region. Considering the gravity of the present scenario, the present study has been undertaken with the following objectives: (i) to investigate the concentration and spatial distribution pattern of 16 TEs (As, B, Ba, Be, Cd, Co, Cr, Cu, Fe, Mn, Ni, Pb, Si, Ti, V, and Zn), (ii) to assess the degree of sediment geochemical contamination and ecological risks and (iii) to determine the potential health risks of these TEs as cumulative carcinogenic and non-carcinogenic risks through multi-pathway exposures.

2. Materials and Methods

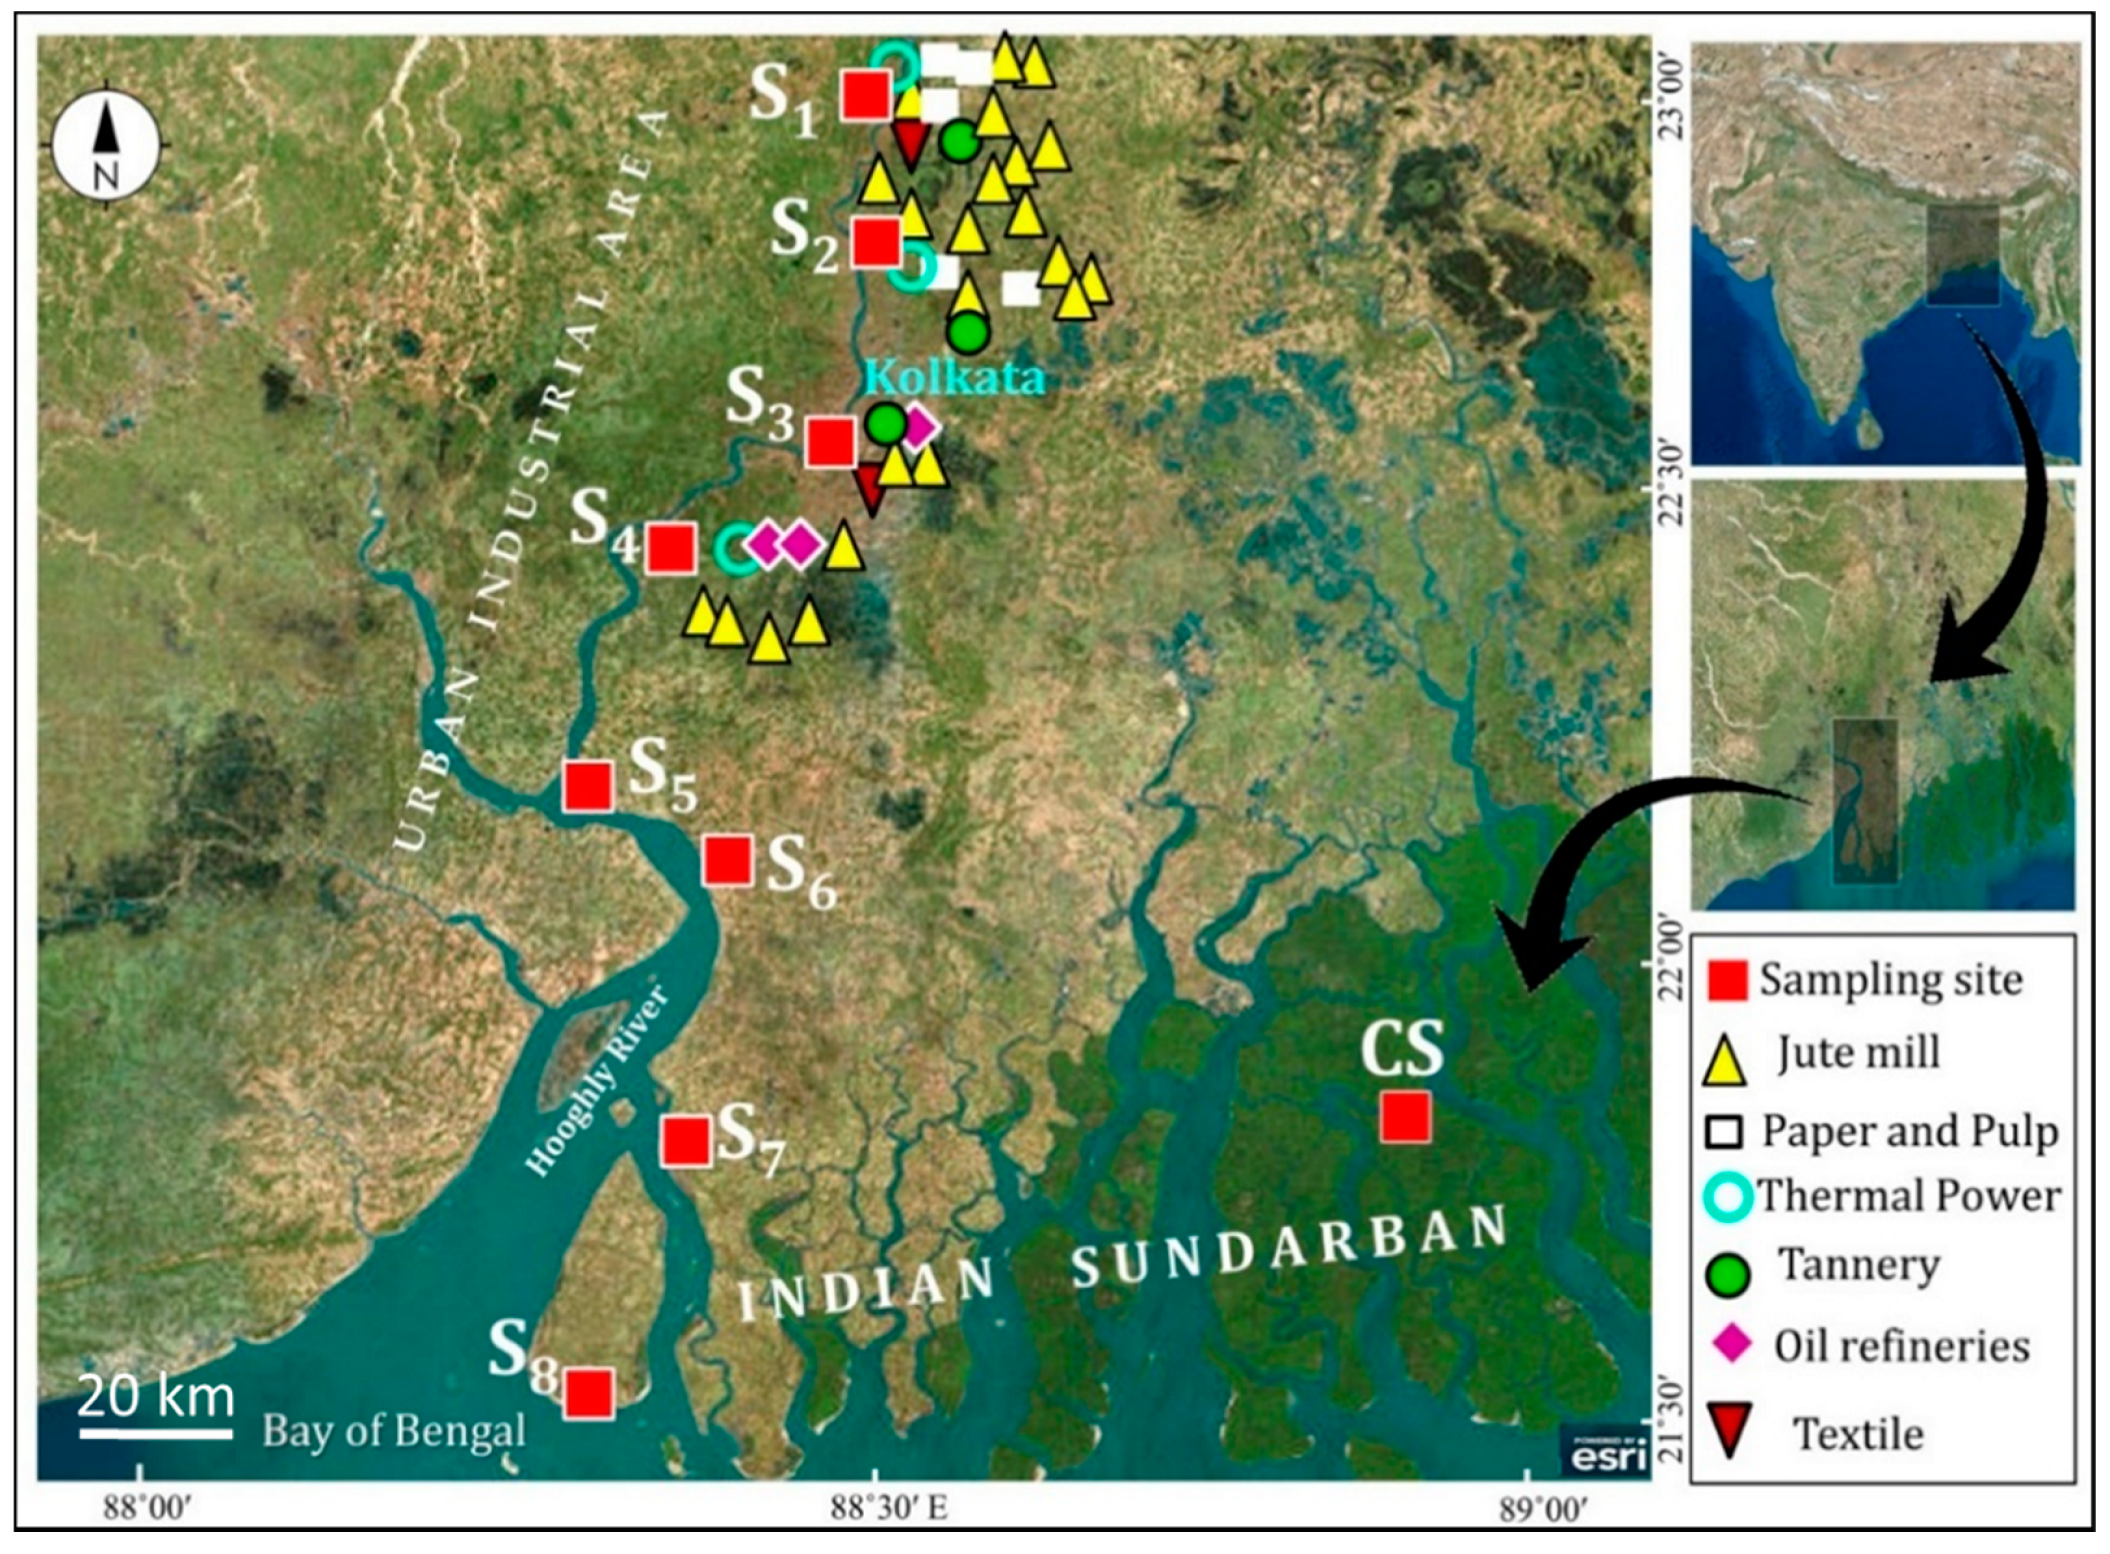
2.1. Study Area and Sampling Site

HRE (87°55′01” N to 88°48′04” N; 21°29′02” E to 22°09′00” E), the first deltaic offshoot of the major river Ganges, is a funnel-shaped estuary and covers a catchment area of 6 × 10⁴ km2 perpendicular to the Bay of Bengal, eastern part of India. The river flows in a north–south gradient and the elevation is not more than ~8 m above mean sea level. The tides are semi-diurnal in nature and have tidal amplitude of 3–6 m [13] with the duration of flood tide being approximately 3 h in a 12 h tidal cycle, setting up flood velocities in the range of 2–3 m/s, compared to ebb velocities of <1 m/s [17]. During monsoon, huge quantities of sediment are transported through the rivers and tributaries, a part is deposited in the indentation of terrain and riverbed, while the remaining part is flushed into the Bay of Bengal. In the dry season, sediment is re-oriented, and mainly deposited within the estuary or near the coast. A net accretion rate of about 50.0 million m3/y was observed during the last 175 y in the outer HRE [18]. Eight sampling sites (Tribeni (S1), Barrackpore (S2), Babughat (S3), Budge Budge (S4), Nurpur (S5), Diamond Harbour (S6), Lot 8 (S7), and Gangasagar (S8)), almost equidistant from each other, were selected along the north–south stretches of the HRE (covering ~175 km length) for systematic and rational coverage of the region (Figure 1). For getting a comparative uncontaminated site, a specimen was collected in the Ramsar site at Jyotirampur (CS), situated in the southern part of Indian Sundarban Mangrove Wetland (Bay of Bengal).

2.2. Sediment Collection and Pre-Treatment

Surface sediment (top 0–5 cm) samples were collected by a grab sampler, in triplicate, from the intertidal zone during ebb tide from 8 sampling sites along the HRE during three different seasons (pre-monsoon (April 2015), monsoon (July 2015) and post-monsoon (November 2015)) and from the sampling site Jyotirampur (CS) during monsoon 2014. Details about sediment collection and preservation are provided by Mondal et al. [19].

2.3. Physico-Chemical, and TEs Analyses of Sediment

Air and sediment temperature were recorded in the field by a Celsius thermometer (0–110 °C); pH was determined by an ORP meter (HI 98160, Hanna instrument, India). Sediments were characterised for organic carbon (Corg) and TEs. The method for for Corg determination was described in Sarkar et al. [13]. The grain size analyses were carried out according to Sarkar et al. [13]. Total carbon (TC), total nitrogen (TN), and carbonates (CaCO3) were determined according to APHA (2017) (APHA, 2017. Standard methods for the examination of water and wastewater. Vol. 2. 2017: American Public Health Association). Ultrapure HCl (33%) (Carlo Erba, Germany) and HNO3 (69%) (Fluka Trace Select), and ultra-pure deionised water (Elix10, Merck Millipore, Billarica, MA, USA) were used for the preparation of standard solutions and samples. All chemicals were of analytical grade. Standard calibration in acidic water (HNO3 1%) was prepared by using a multi-elements standard solution (CPA Chem, Bulgaria). Laboratory plasticware and glassware for analytical purposes were cleaned with HNO3 (2%) and rinsed with abundant deionized water before use. The accuracy of the applied analytical methods was checked on Certified Reference Materials BCR320R and BCR646 from European Commission—Joint Research Centre (EC-JRC). TEs concentrations were determined in triplicate by Inductive Coupled Plasma—Optic Emission Spectroscopy (ICP-OES) (Perkin Elmer—Optima 7000 DV). About 0.5 g of pre-treated sediment sample was digested twice in Teflon vessels using a microwave (Ethos, Milestone Microwave Laboratory System, USA) (3 min at 300 W, 3 min at 600 W, 5 min at 350 W and 10 min at 250 W), after 20 min of free reaction with a 1:3 mixture of HCl (33%) and HNO3 (69%). After this first digestion and cooling, 2 mL of HF (50%) was added and left to react for 20 min. A further digestion at the same previous conditions was carried out. At the end, 30 mL of H3BO3 were used to complex the free fluoride ions facilitating the dissolution of precipitated fluorides. Samples were filtered (Whatman no. 42) and transferred to 100 mL graduated flask. The same procedure was applied with certified materials and empty vessels for blanks.
Mineral characterization of sediment samples was determined by X-ray diffraction. All the samples were scanned from 5° to 70° 2θ on an X-ray diffractometer (Bruker D2 Phaser) using a Cu-Kα radiation source. Clay minerals were identified based on the three more-intense peak’s position in the 2θ interval 8°–35°.

2.4. Indices for Integrated Data Analysis

The geoaccumulation index (Igeo) and enrichment factor (EF) were used to assess the contamination of sediments by different TEs. The potential toxic risk to the estuarine ecosystem was evaluated calculating the hazard quotients ( H Q E ) of the chemical contaminants, while modified hazard quotient (mHQ) enabled the assessment of contamination by comparing element concentration in sediment with the synoptic adverse ecological effect distributions for slightly differing threshold levels (Threshold, Probable, and Severe Effect Levels—TEL, PEL and SEL, respectively) [20]. The determination of mHQ of TEs can elucidate the degree of risk of each TE to the aquatic environment and biota. Toxic risk index (TRI) was used to evaluate the toxicity of an ecosystem with respect to the TEL and PEL effects [21,22]. All these indices were detailed in Table S1.
Human health risk assessment (HHRA) was used to estimate the occurrence probability of non-carcinogenic and carcinogenic risks in humans exposed to TEs contaminated sediment [23]. Generally, (i) direct oral ingestion of particles; (ii) inhalation of TE particles through mouth and nose and (iii) dermal absorption of TEs particles on exposed skin, are the three major exposure pathways [24]. Specifically, the estimation of the health risks via ingestion, inhalation and dermal contact pathways on both adults and children can be predicted through the estimation of the chronic daily intake (CDI) (mg/kg·day) according to the following equations:
C D I i n g e s t = C s e d . × I n g R × E F × E D B W × A T × C F
C D I i n h a l e = C s e d .   × I n h R × E F × E D P E F × B W × A T
C D I d e r m a l = C s e d . × S A × A F s o i l × A B S × E F × E D B W × A T × C F
where Csed. is the concentration of TE in sediment sample (µg/g), IngR the ingestion rate of the soil (mg/day), EF the exposure frequency (days/year), ED the exposure duration (years), BW the mean body weight (kg), AT the averaging time (days), CF the conversion factor (kg/mg), InhR the inhalation rate (mg/cm2), PEF the particle emission factor (m3/kg), SA the surface area of the skin that is in contact with the soil (cm2), AFsoil the skin adherence factor for soil (mg/cm2), and ABS the dermal absorption factor (dimensionless). The exposure factors used in the estimation of CDI are presented in Table S2. According to the classification of International Agency for Research on Cancer [25], Cd, Cr, Pb and As are associated with the estimation of carcinogenic health risks as they can induce carcinogenesis [25], whilst, Cu, Ni, Fe, Mn, Co, Zn, Be, V, B and Ba were also estimated for their non-carcinogenic risk. The hazard index (HI) (Equation (4)) representing the cumulative non-carcinogenic risk is estimated by summing up all the hazard quotients (HQ) (Equation (5)) as follows:
H I = H Q E = H Q i n g + H Q i n h + H Q d e r m a l
where,
H Q E = C D I R f D
The reference dose (RfD) was referred to [26] for human risk assessment calculation. The values of RfD are different for each TE and is presented in Table S3. Based on the HI values, no significant risk of non-carcinogenic effects is assumed if the value is less than one (HI < 1). In the case if HI value exceeds one (HI > 1), there is a probability that non-carcinogenic risk effects may occur which tends to increase with the increment of HI value [26]. The health risk for carcinogenic elements expressed by the total lifetime cancer risk (LCR) was determined estimating the total value of cancer risk for each exposure pathways by using Equations (6) and (7). The carcinogenic slope factor (CSF; mg/kg·day) values for Cd, Cr, Pb and As are 6.3, 0.5, 0.0085 and 1.5 [26]. LCR value between 1 × 10⁻⁶ and 1 × 10⁻⁴ indicates acceptable or tolerable carcinogenic risk. If the value is higher than 1 × 10⁻⁴, it means the risk is unacceptable. LCR values lower than 1 × 10⁻⁶ indicate no significant health hazards.
C a n c e r   r i s k = C D I × C S F
C a n c e r   R i s k = L C R = C a n c e r   r i s k i n g + C a n c e r   r i s k i n h + C a n c e r   r i s k d e r m a l

3. Results

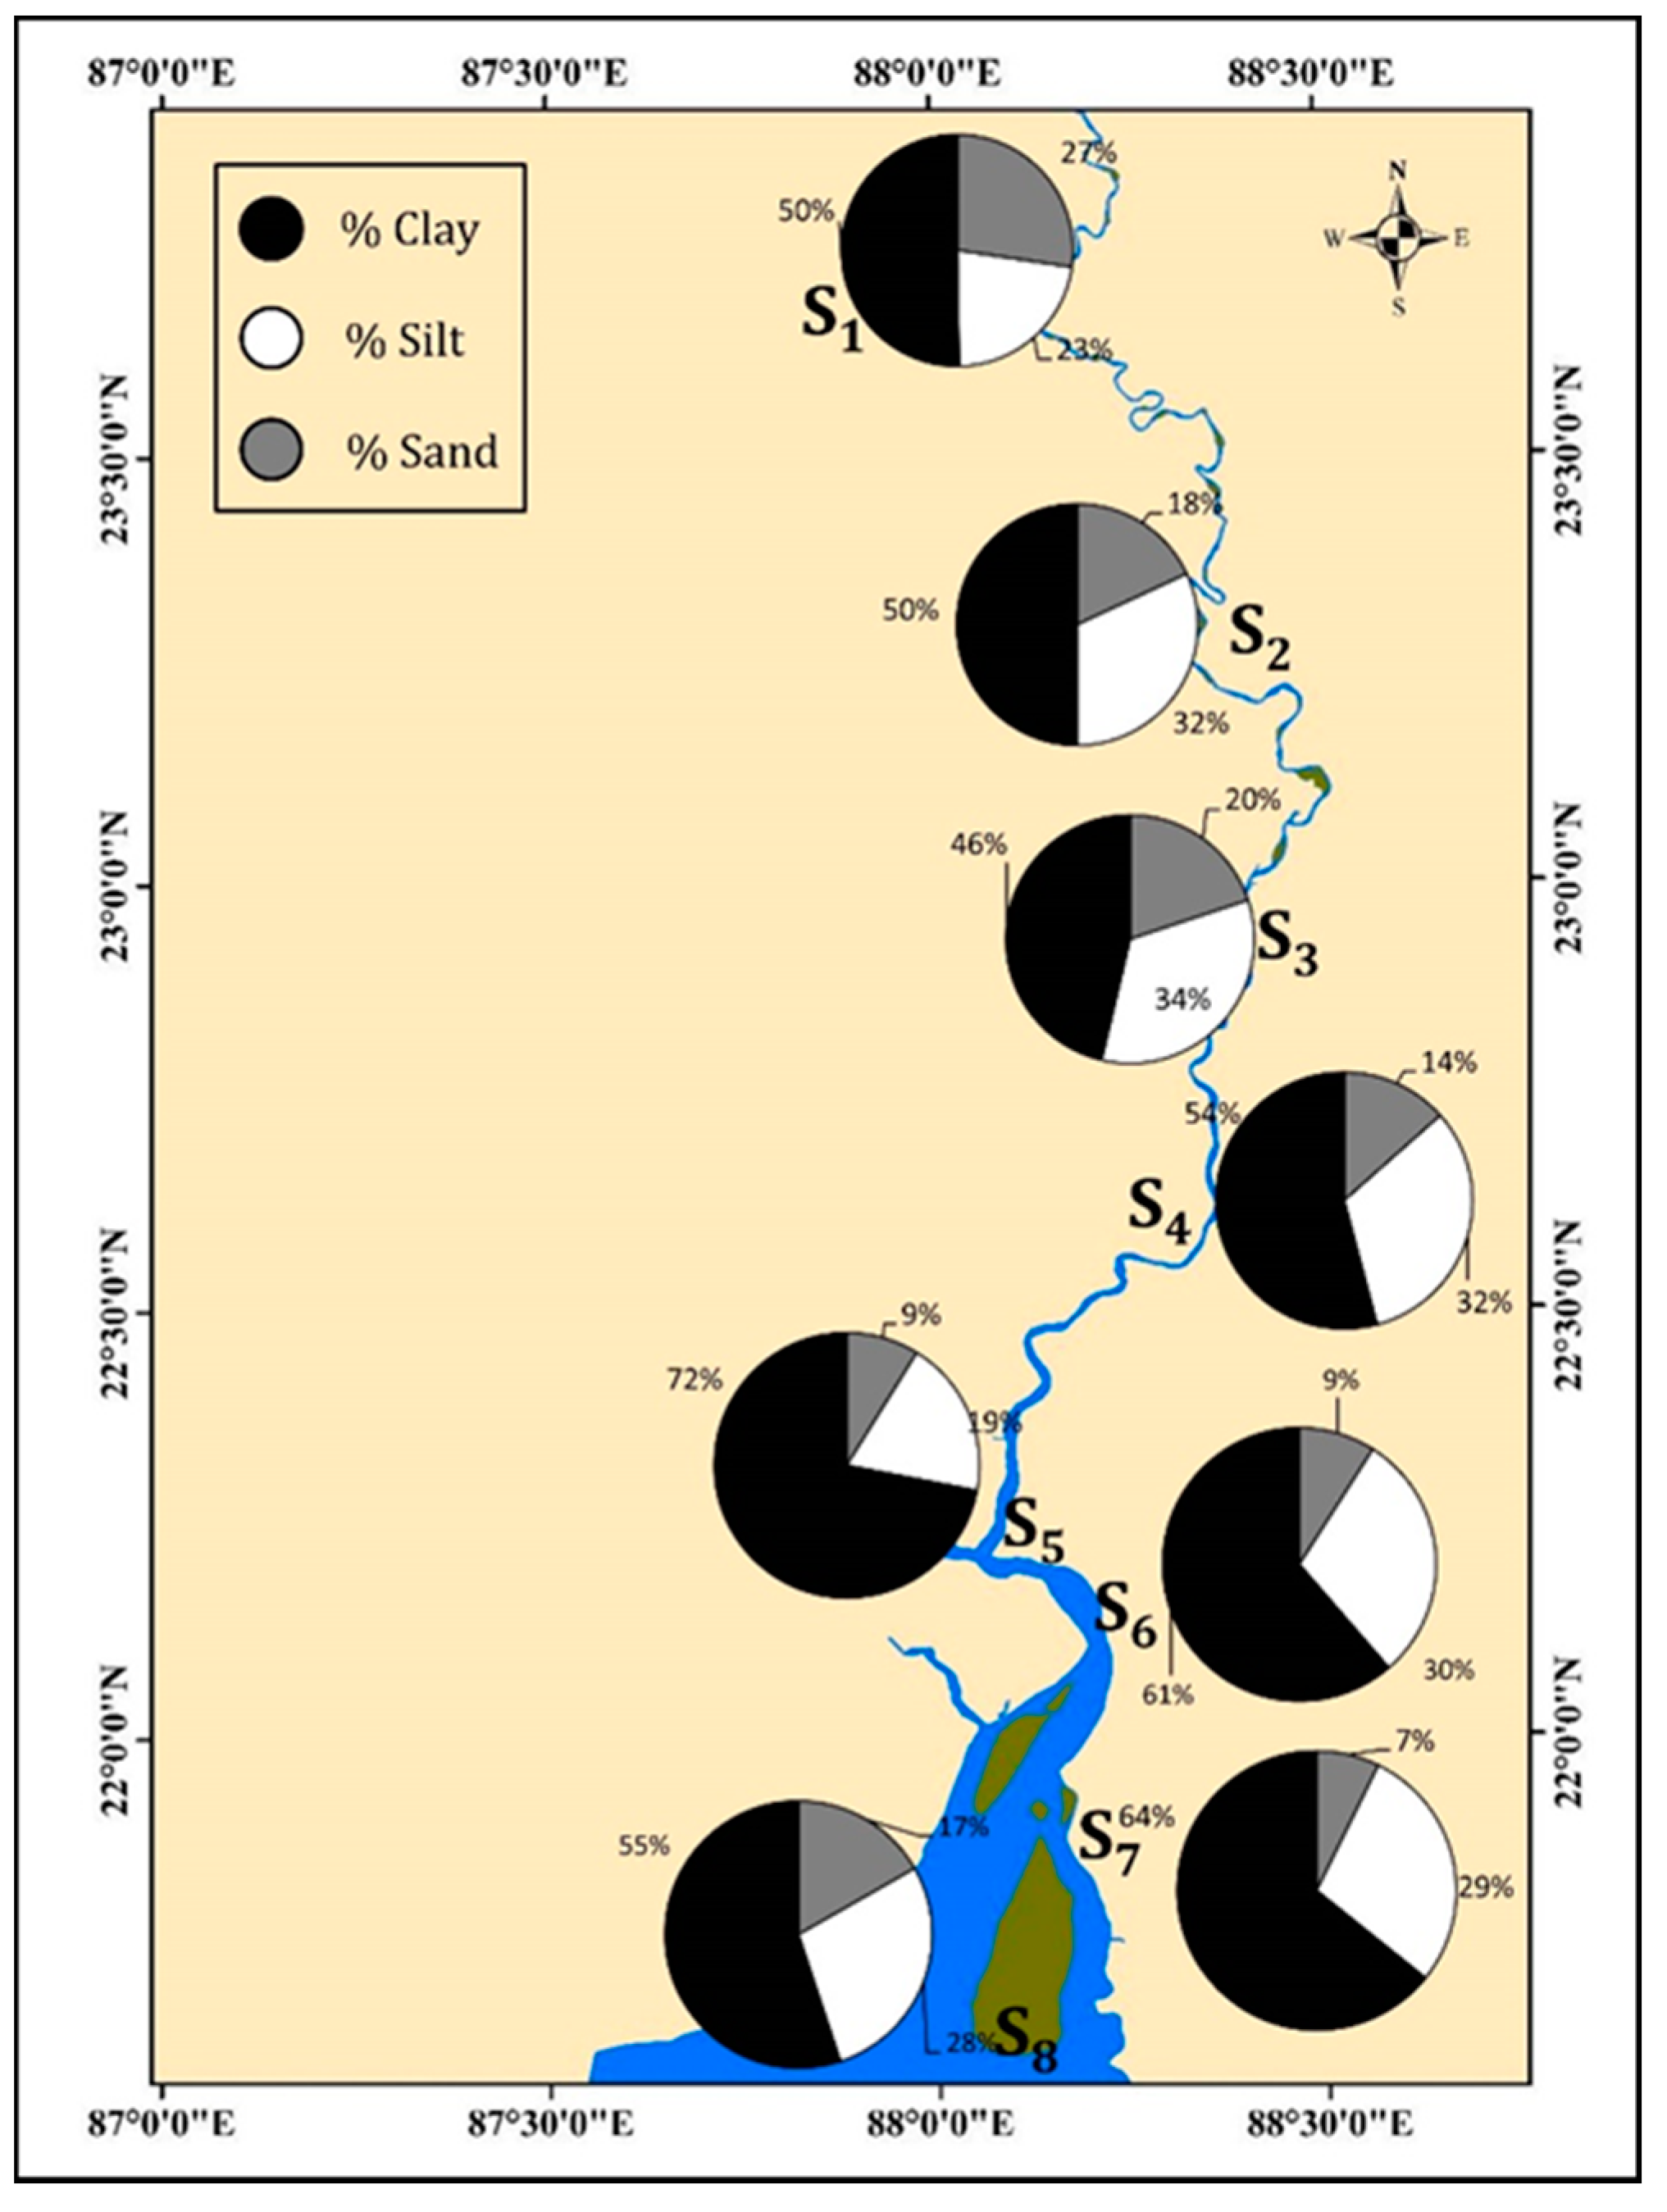
3.1. Sediment Geochemical Characteristics

The geochemical characteristics of sediment samples revealed overall homogenous physico-chemical properties as evidenced in Table 1. The pH values of the sediment varied from slightly acidic (6.85) at Barrackpore (S2; pre-monsoon) to basic at Nurpur (S5) (7.82) (monsoon). Organic carbon (Corg) content ranged from 0.15% at Diamond Harbour (S6; monsoon) to 0.59% at Gangasagar (S8; pre-monsoon), as a result of marine sedimentation and mixing processes at the sediment water interface, where the rate of delivery as well as rates of degradation by microbial-mediated processes can be high [12]. The prevalent low Corg content in intertidal sediments of HRE had been previously recorded and was related to the poor absorption capacity of organic compounds to negatively charged quartz grains [27]. The Corg values fluctuated among sediment samples with no regular distribution pattern. The CaCO3 contents ranged from 9.08% to 14.26% with the maximum value encountered at sampling site Nurpur (S5) during monsoon season.
The water content of samples ranged from 22.48% to 54.35% with a mean of 33 ± 7%. Sediments were a mixture of sand, silt and clay-size particles (Figure 2) and the textural composition varied from clayey very fine to clayey. The spatial variation in grain-size distribution reflected the changes in the hydraulic environment. The dominance of fine-fraction (clay + silt) suggested that lower-energy settings are prevalent in this estuarine system.
Mineralogical studies of sediment revealed that they are not only sensitive indicators of their environment, but also provide valuable insight into regional hydrodynamics, including patterns of sediment transport and deposition [28,29]. The clay minerals identified in sediment samples are quartz (Q), illite (I), chlorite (Ch), oligoclase (O) and rutile (R). The XRD plots showed that quartz has the strongest peak along with illite, chlorite, and oligoclase (Figure S1) similarly to the results from Rupnarayan river [30]. Rutile was exclusively identified in sediment during the pre-monsoon season at Barrackpore (S2), during monsoon (at Budge Budge (S4), Nurpur (S5), Diamond Harbour (S6), Lot 8 (S7) and Jyotirampur (CS)) and in sediment of Babughat (S3), Diamond Harbour (S6), Lot 8 (S7) and Gangasagar (S8) sampled during the post monsoon season. Minor differences in mineral composition were observed both in space and time.
The mean seasonal variation of total hydrogen (TH) content (%) exhibited the following decreasing trend: pre-monsoon (1.13 ± 0.34) > monsoon (1.03 ± 0.35) > post-monsoon (0.26 ± 0.06). According to Table 1, The total carbon (TC) ranged from 0.76% at Diamond Harbour (S6) to 1.57% at Gangasagar (S8) during pre-monsoon, 0.73% at Diamond Harbour (S6) to 1.54% at Barrackpore (S2) during monsoon and 0.47% at Lot 8 (S7) to 1.40% at Barrackpore (S2) during post-monsoon. Total Nitrogen (TN) as a chemical impact indicator of sediment organic enrichment [31] ranged from 0.08% at Jyotirampur (CS) to 0.71% at Gangasagar (S8) during pre-monsoon and did not show significant temporal and spatial differences. In HRE, the TC/TN ratios ranged between 1.24 at Lot 8 (S7) during monsoon to 7.65 at Nurpur (S5) during post-monsoon season, revealing that organic matter in this ecosystem is of estuarine origin and is primarily derived from sedimentation of dead phytoplankton. The sampling site Jyotirampur (CS) exhibited high TC/TN ratio (12.73) [32].

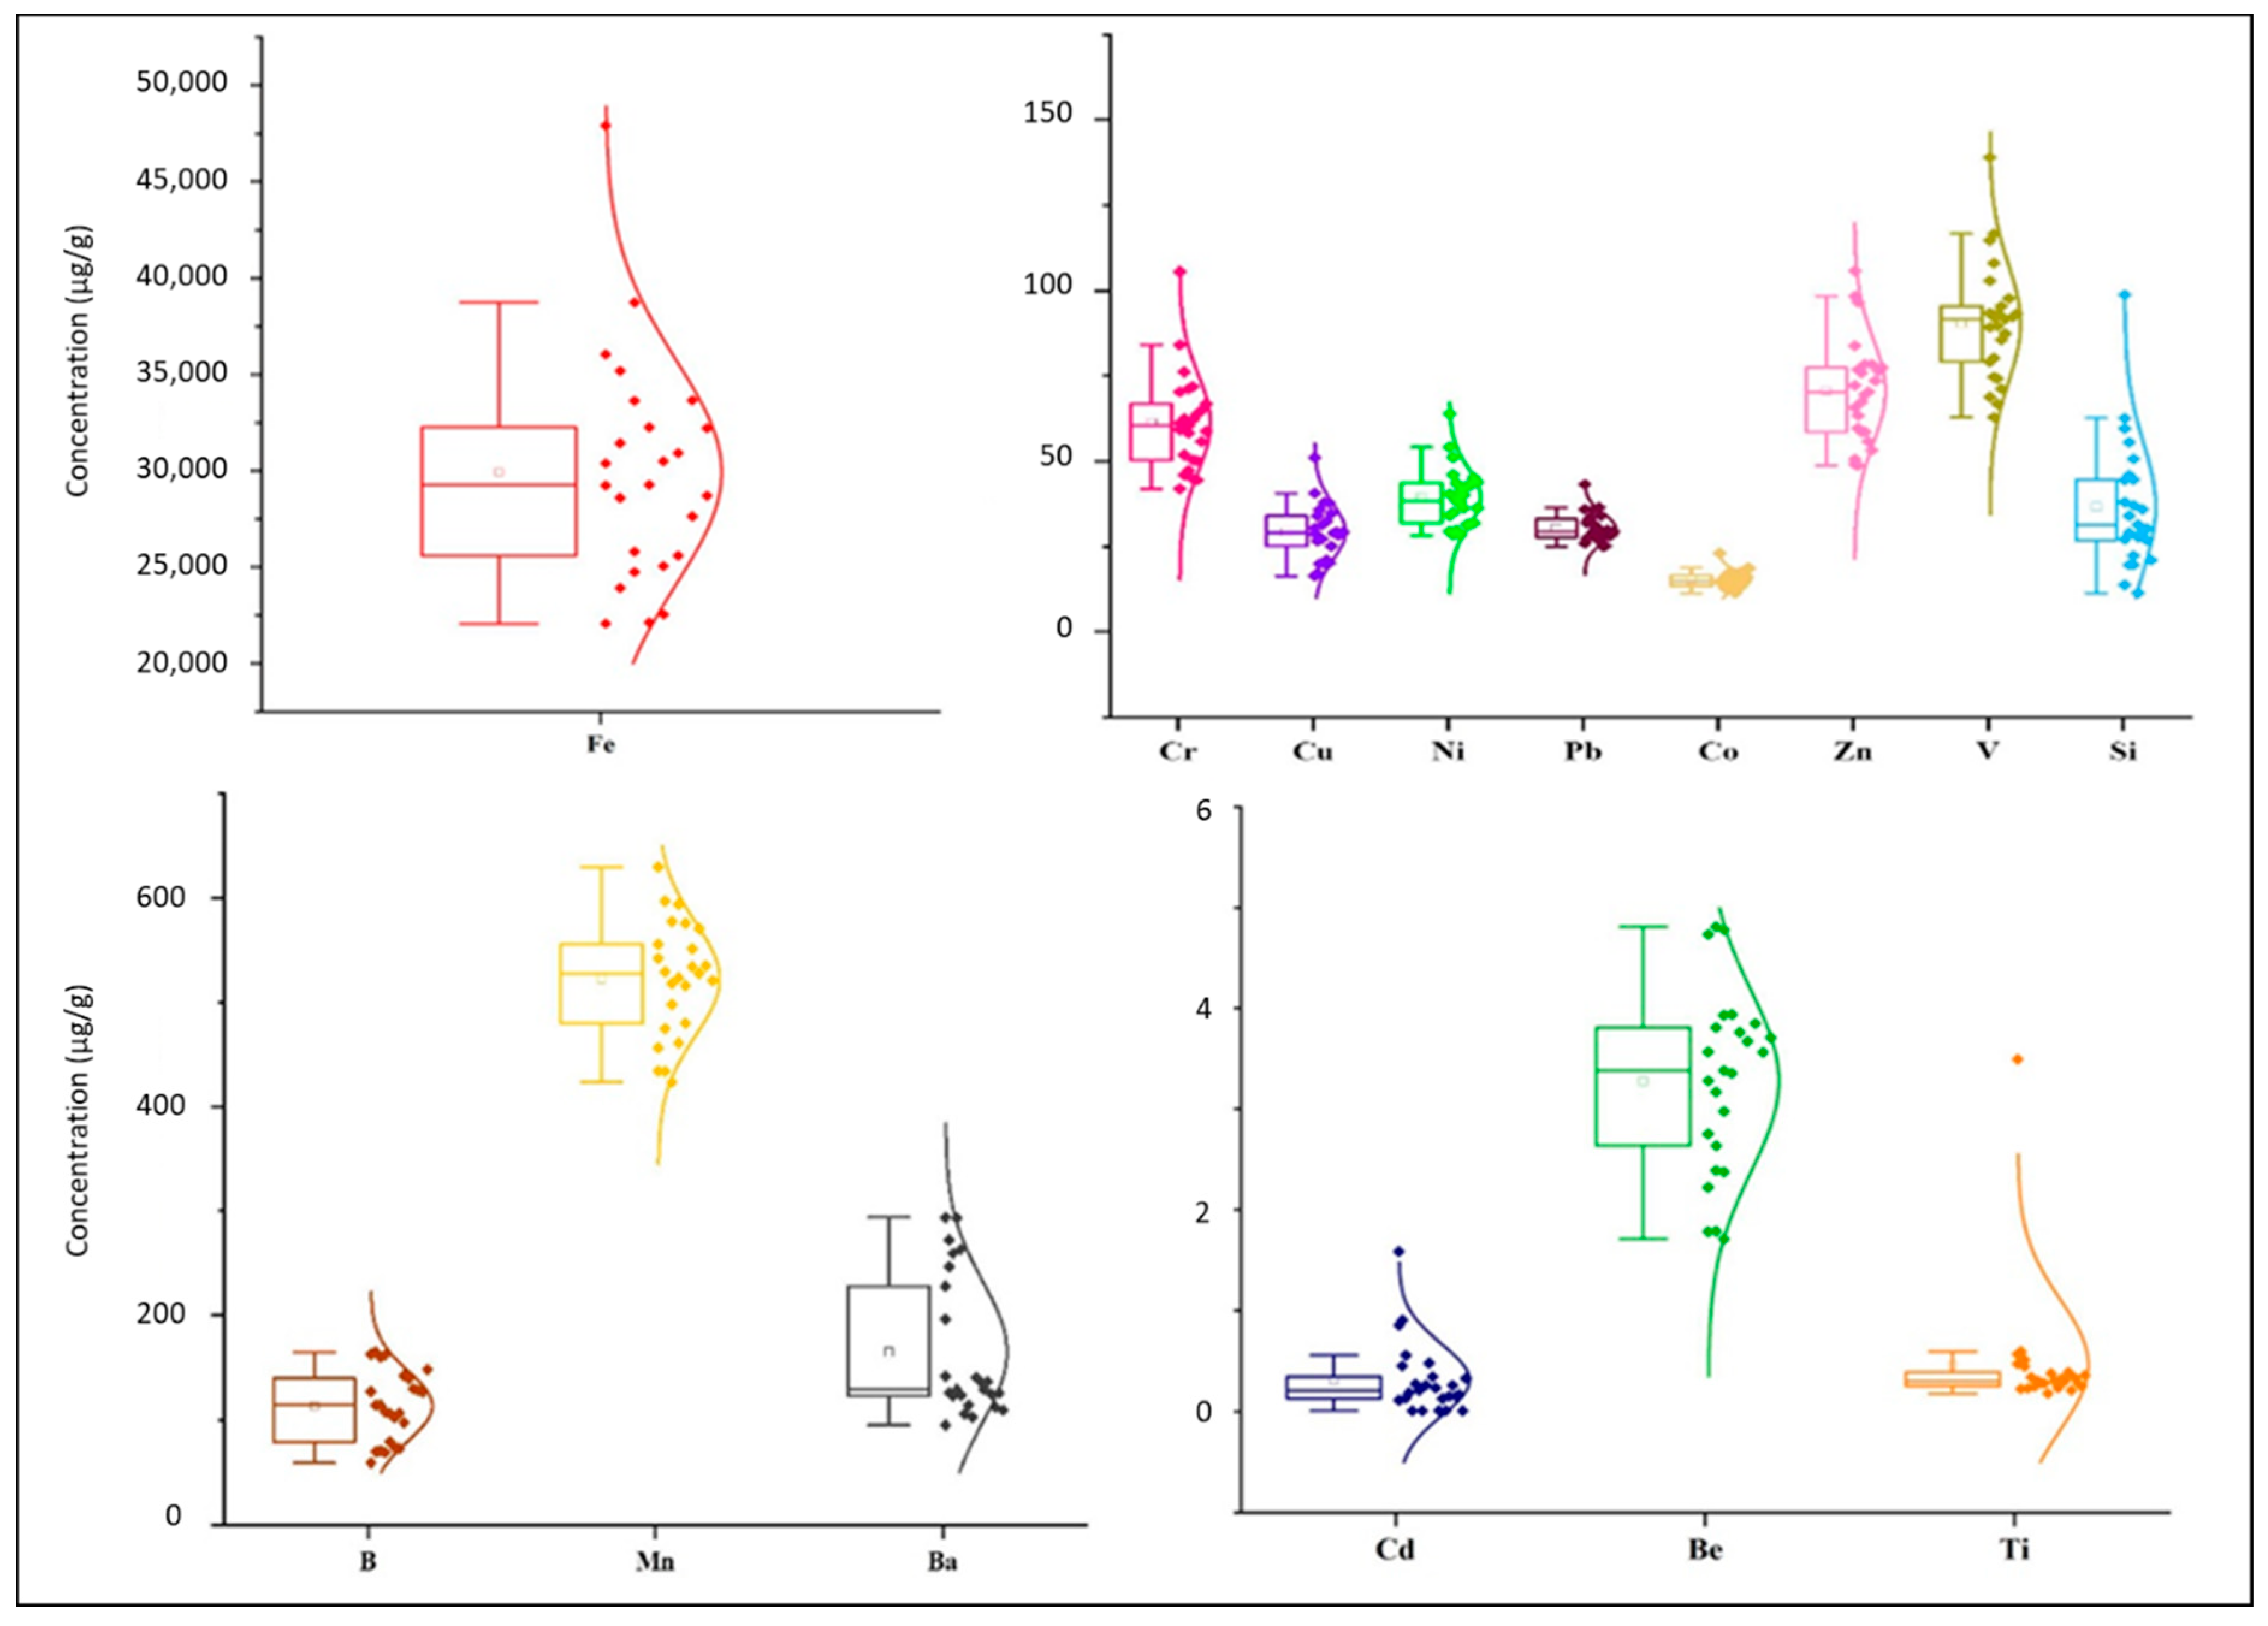
3.2. Spatial and Seasonal Distribution of Elements

The sediment TEs content (µg/g dry weight) (Figure 3) exhibited inconsistent distribution pattern with the following decreasing order: Fe (29929.82) > Mn(522.30) > Ba(165.40)> B (113.76) > V (90.42) > Zn (70.60) > Cr (61.22) > Si (36.71) > Ni (39.40) > Pb (30.54) > Cu (29.37) > Co (15.34) > As (7.17) > Be (3.28) > Ti (0.46) > Cd (0.32). The maximum concentration (µg/g dry weight) of Cr (105.49), Cu (51.09), Ni (63.90), Fe (47919), Co (23.11), Zn (105.81), and V (138.92) was encountered during south-west monsoon at Gangasagar (S8) characterized by severe tidal mixing and high vulnerability to natural catastrophic events (i.e., floods and cyclones). This sampling site also encounters severe stress due to annual congregation of >1 million pilgrims taking holy bath at the confluence of Hooghly River and Bay of Bengal (i.e., Gangasagar Festival (GSF)) disrupting the ecological balance at local scale, as noted by previous researchers [33,34]. Recently, Mondal et al. [14] observed sediment enrichment in Pb, Cr and Ni at Gangasagar (S8) also because in the area salt and freshwater are mixed together leading to greater levels of sedimentation [35]. There is no reflection of consistent distribution pattern of TEs which might be attributed to multiple factors, such as (i) differences in local hydrodynamics (tidal currents and wind energy), (ii) change in sediment textural properties and composition, and (iii) non-homogenous inputs from point and non-point sources of pollution.

3.3. Assessment of Sediment Contamination

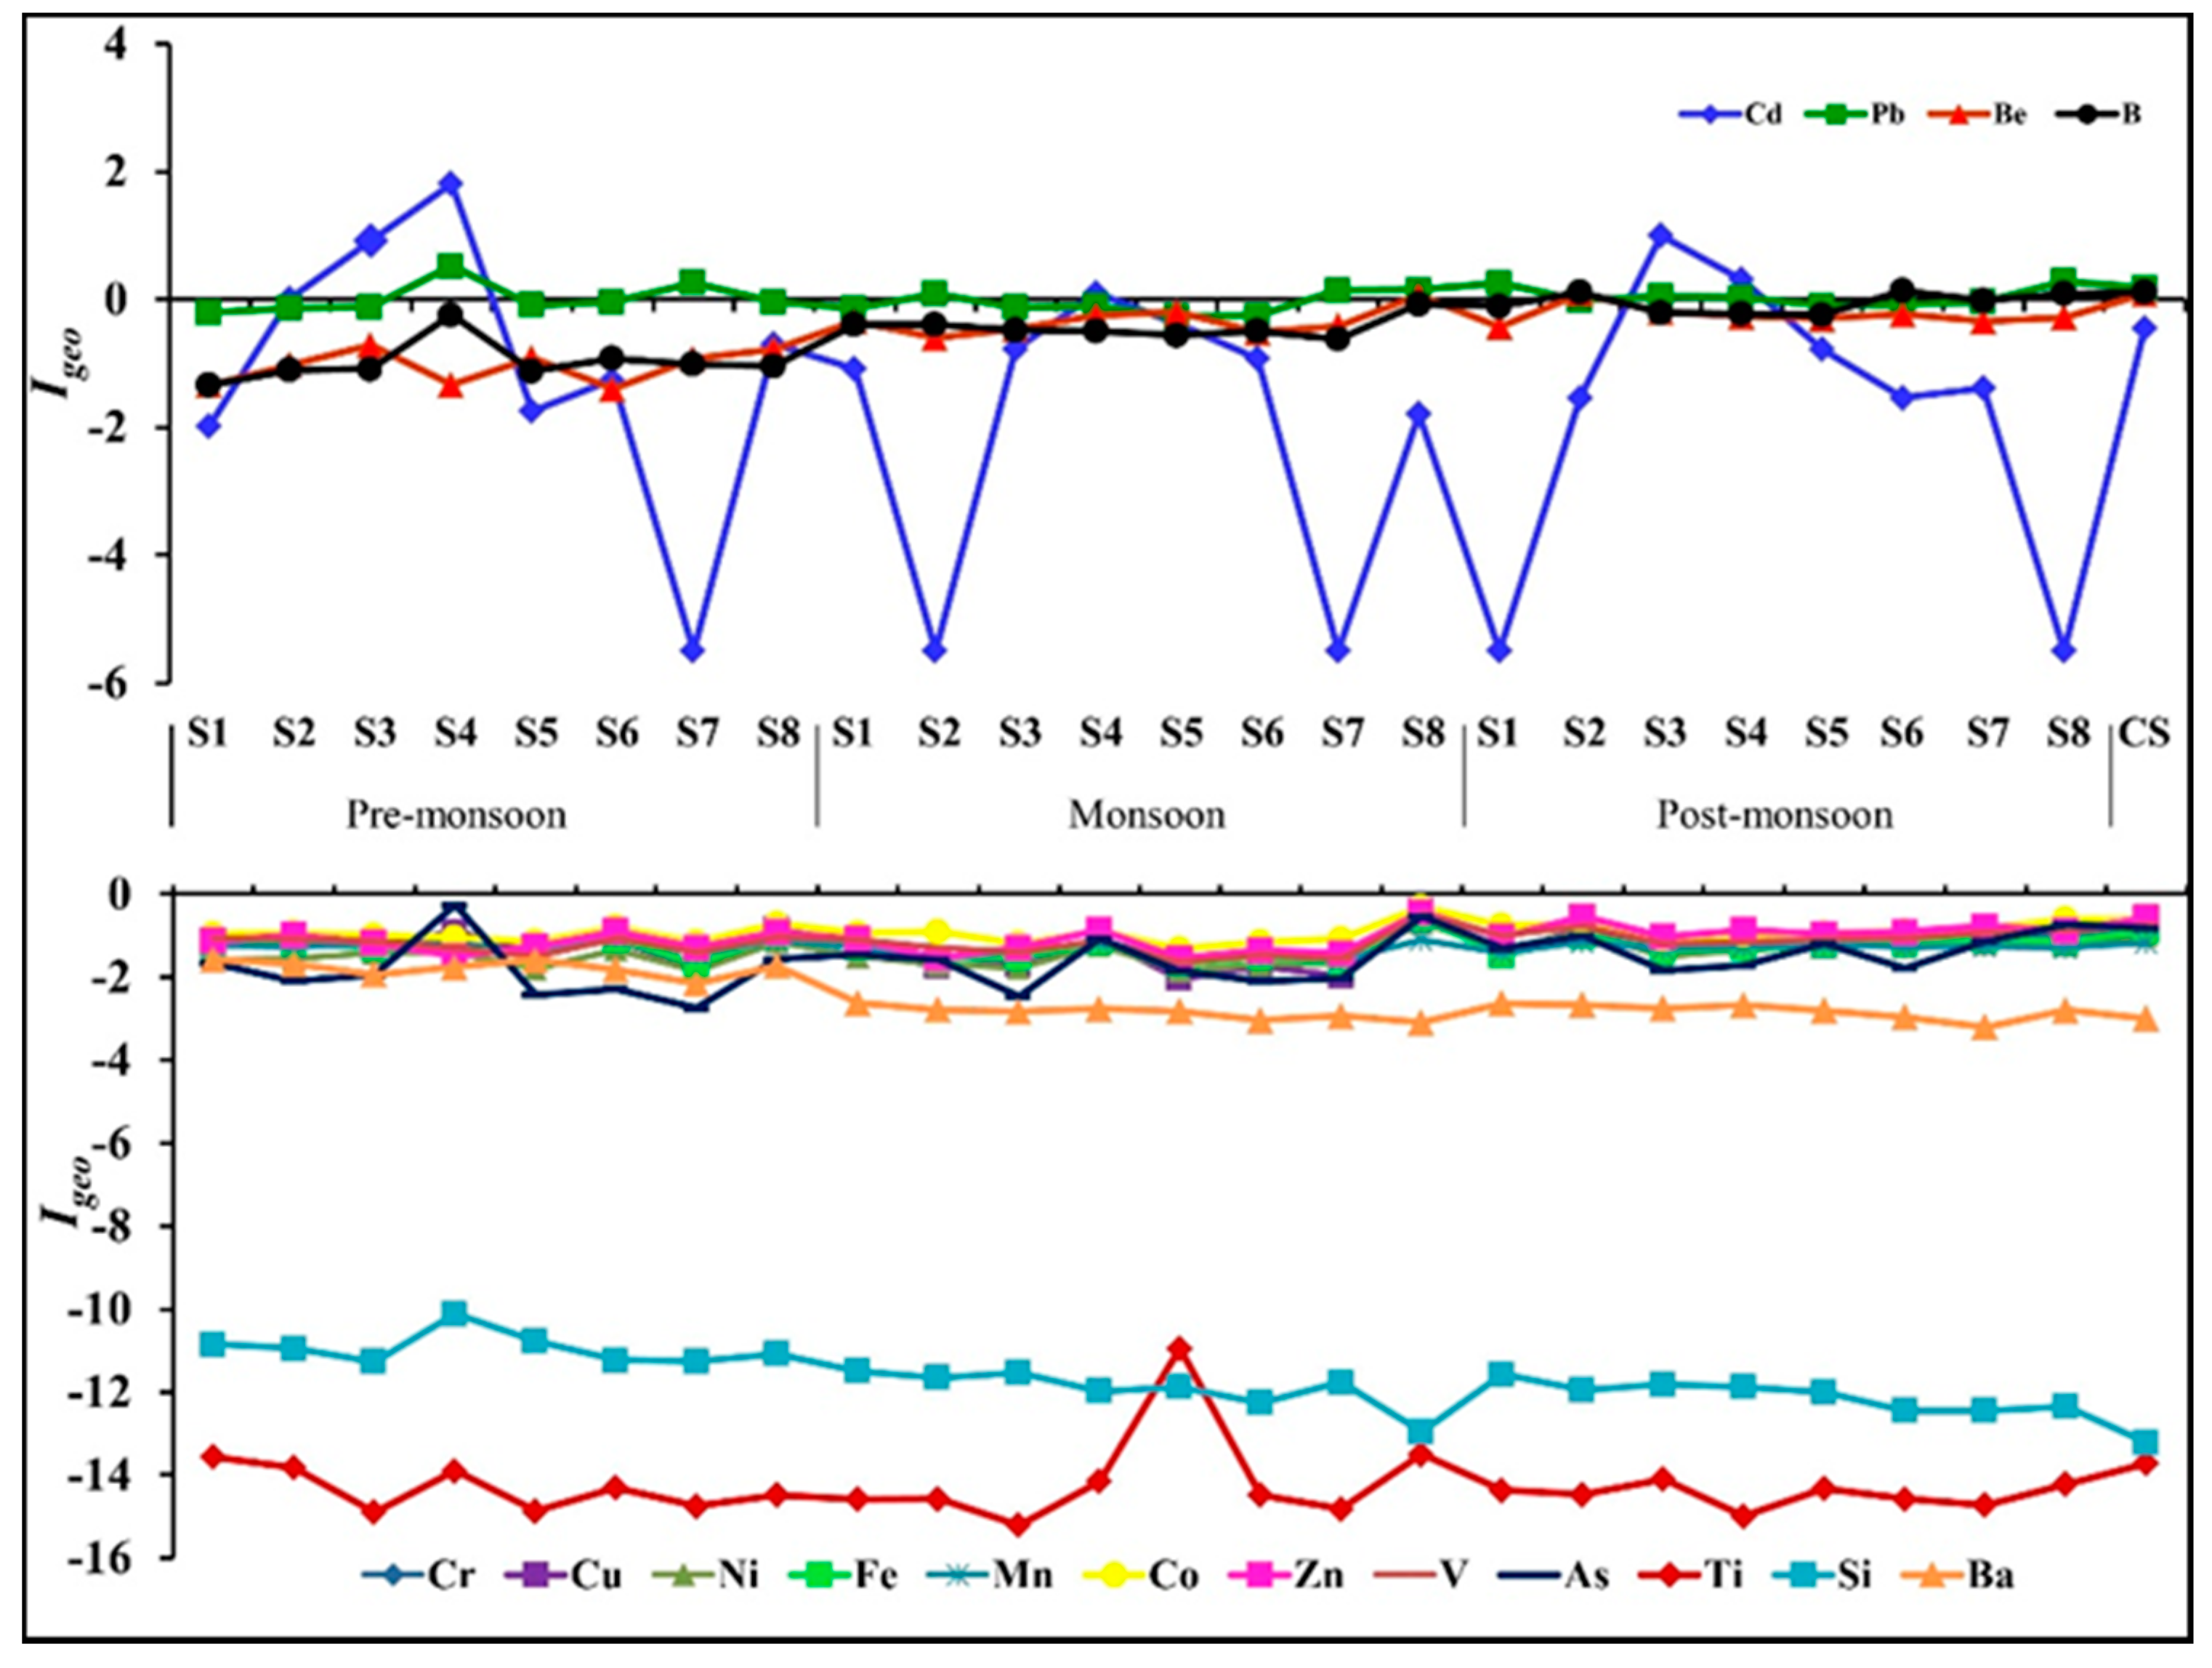
3.3.1. Index of Geoaccumulation (Igeo)

The Igeo was negative (Igeo < 0; Class 0) for all TEs (Cr, Cu, Ni, Fe, Mn, Co, Zn, V, As, Ti, Si and Ba) except for Cd, Pb, Be and B indicating practically unpolluted sediments (Figure 4). At sampling sites Budge Budge (S4) and Babughat (S3) during pre- and post-monsoon respectively, Cd exhibited Class 2 level of contamination (1 < Igeo < 2) while Barrackpore (S2); Babughat (S3) (pre-monsoon), Budge Budge (S4) (monsoon and post-monsoon) were “unpolluted to moderately polluted”. None of the Igeo values was greater than 2.0.The Igeo values of B were less than 0 (Igeo < 0) at all the sampling sites during pre-monsoon and monsoon season while moderate contaminations (0 < Igeo < 1) were recorded at sampling sites Diamond Harbour (S6), Lot 8(S7) and Gangasagar (S8) during post-monsoon. For Pb, Igeo values ranged from 0.53 at Budge Budge (S4) during pre-monsoon to −0.26 at Nurpur (S5) during monsoon season.

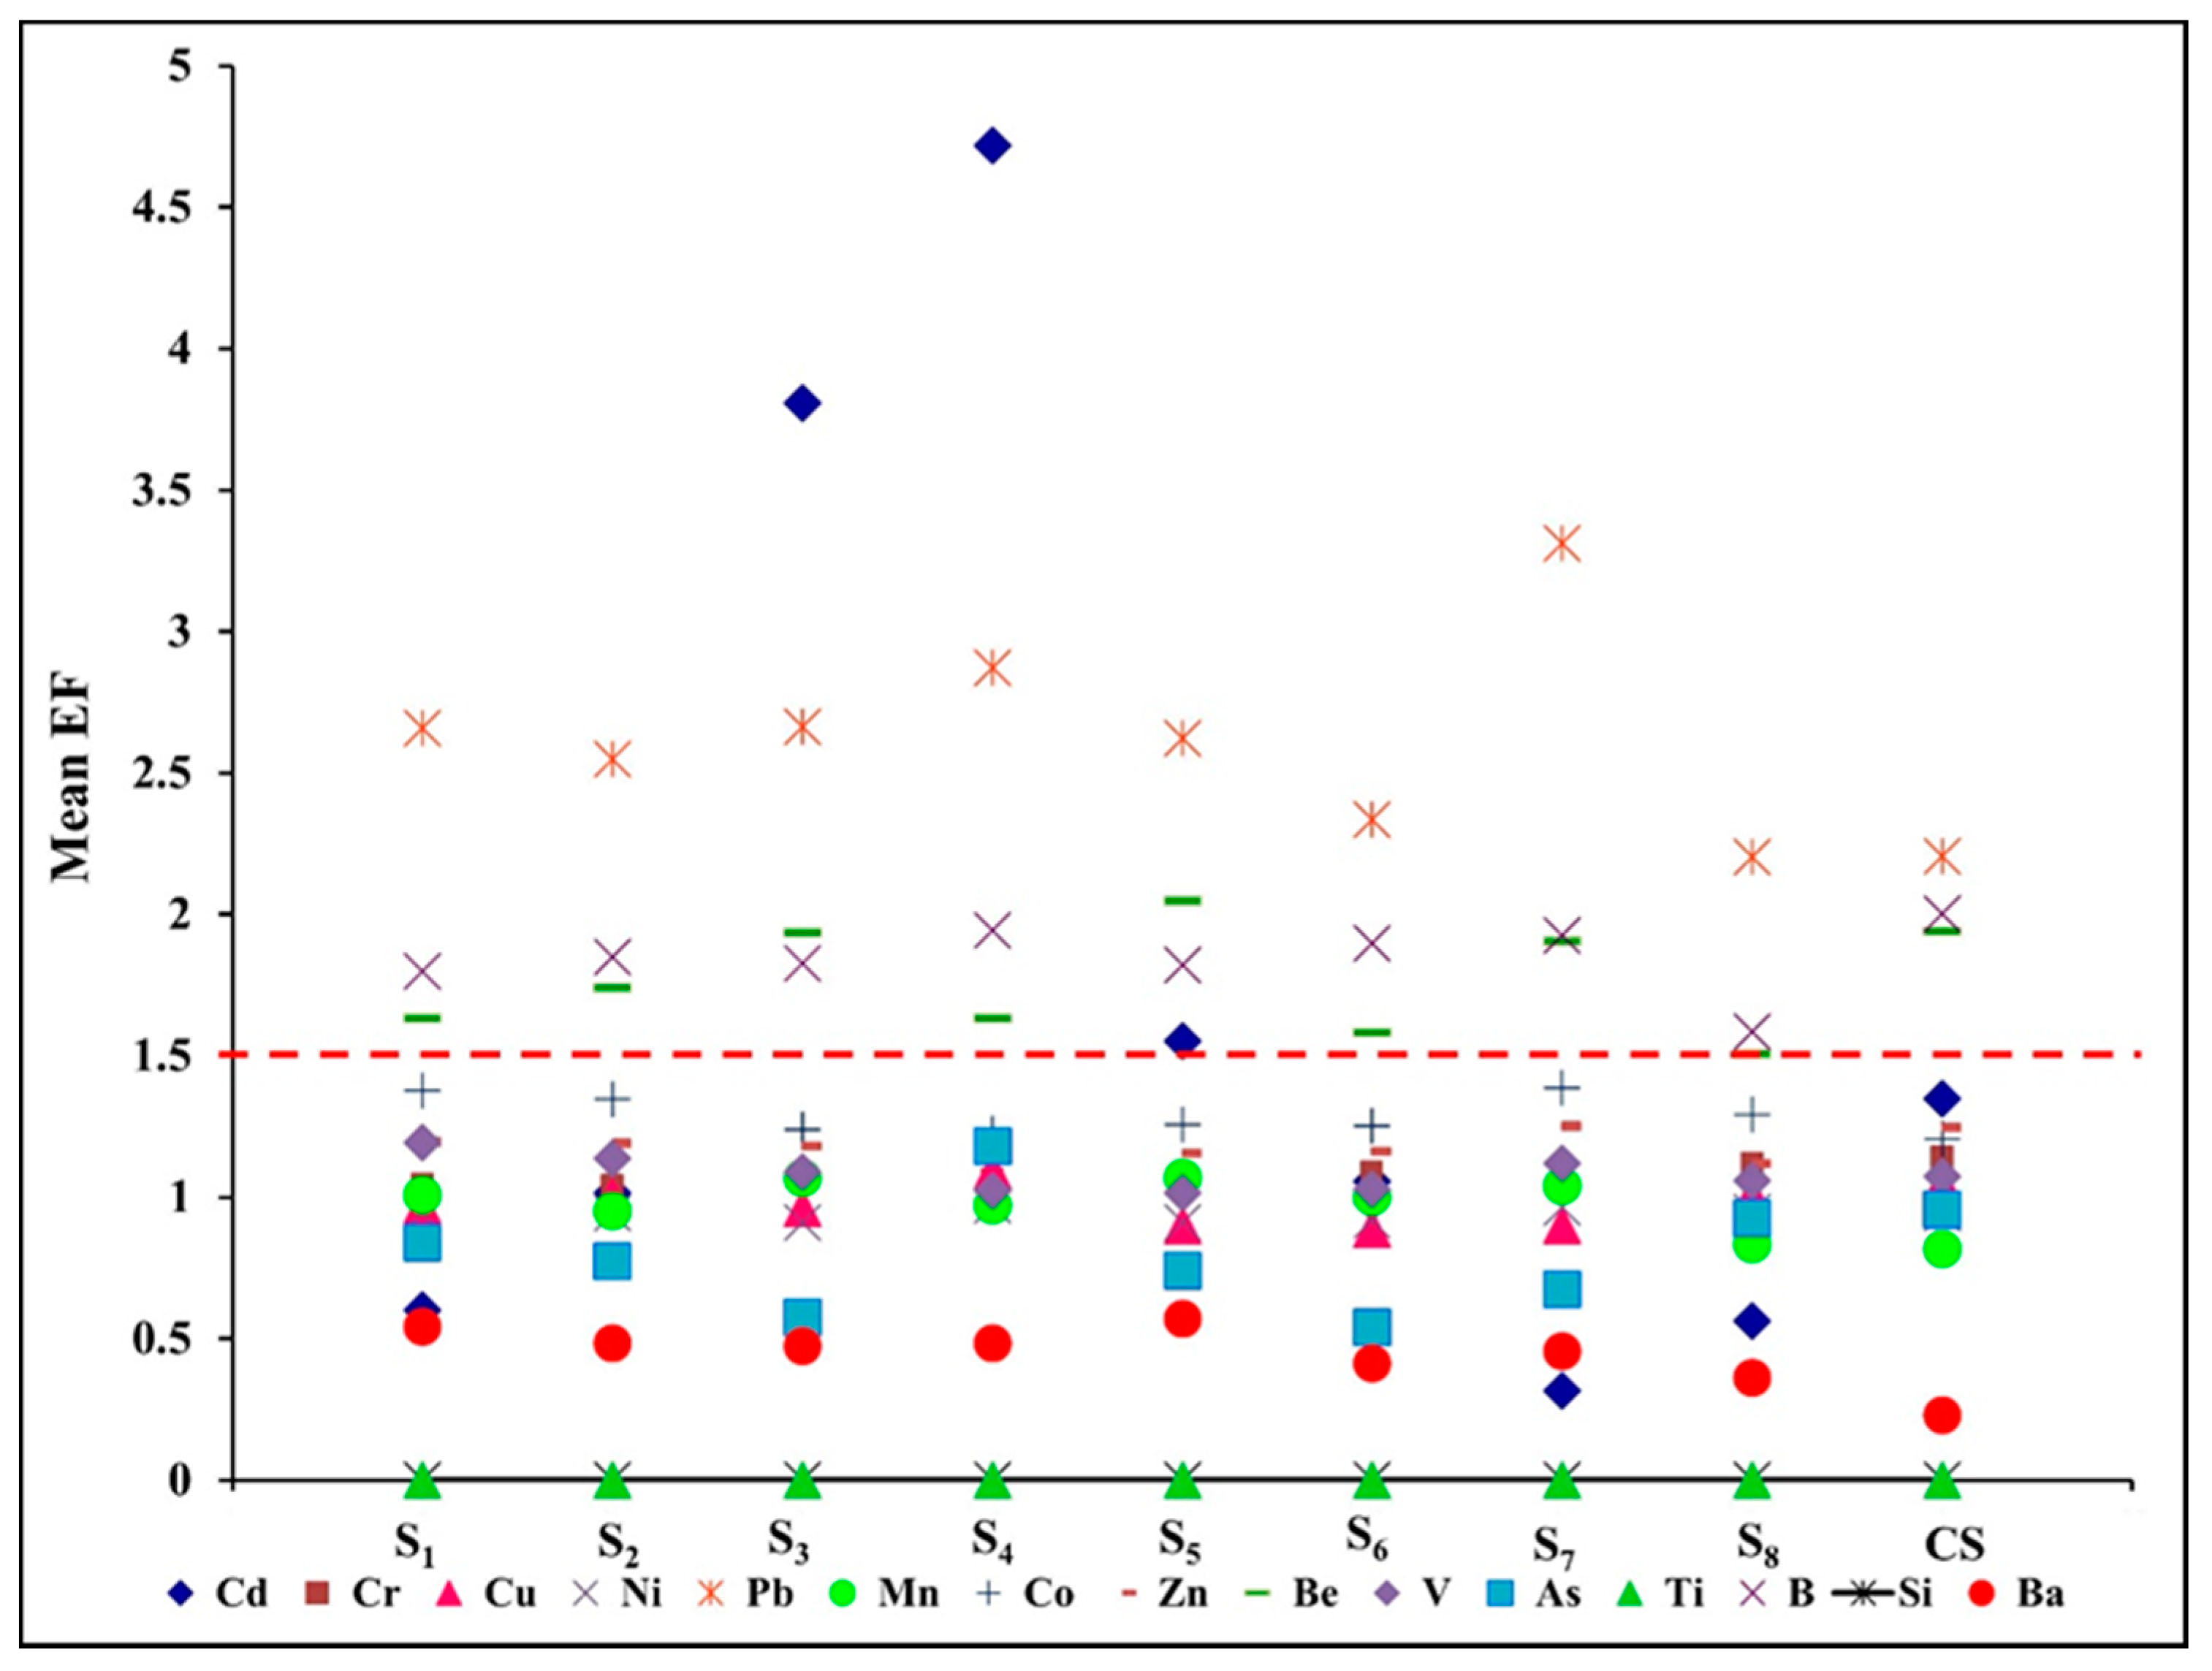
3.3.2. Enrichment Factor (EF)

The mean EF values of the TEs in the study area were the follows: Pb (2.63) > B (1.84) > Be (1.76) > Cd (1.69) > Co (1.30) > Zn (1.18) > V (1.08) > Cr (1.07) > Mn (0.99) > Cu (0.97) > Ni (0.94) > As (0.79) > Ba (0.46) > Si (0.001) > Ti (0.0002). As shown in Figure 5, the mean EF values for Cr, Cu, Ni, Mn, Zn, V, Ti, Si, and Ba at all sampling sites were < 1.5, suggesting that TEs were of primarily natural origin. EFs for Pb, Cd, Be, and B exceeded 1.5 indicating the presence of anthropogenic sources in the estuary. Site-specific and sharp inconsistent pattern of EF variations (EF > 1.5) are very much evident revealing the following trend: Pb (all sampling sites), Cd (pre-monsoon: Barrackpore (S2), Babughat (S3), Budge Budge (S4); monsoon: Babughat (S3), Budge Budge (S4), Nurpur (S5); post-monsoon: Babughat (S3), Budge Budge (S4)), Co (monsoon: Barrackpore (S2); post-monsoon: Tribeni (S1)), Be (pre-monsoon: Lot 8 (S7); monsoon: all the sampling sites; post-monsoon: all the sampling sites), As (pre-monsoon: Budge Budge (S4)), B (pre-monsoon: Budge Budge (S4), Lot 8 (S7); monsoon: all the sampling sites except Lot 8 (S7); post-monsoon: all the sampling sites). Igeo and EF values were many-fold higher exclusively for Cd compared to other TEs which was also worked out by previous researchers [12]. Pb, Ni, and Be are present also in the CS with EFs > 1.5 suggesting that they are widespread in the environment affecting also a potentially uncontaminated area (Figure 4, Figure 5 and Figure S2).

3.4. Potential Ecological Risks Associated with TEs

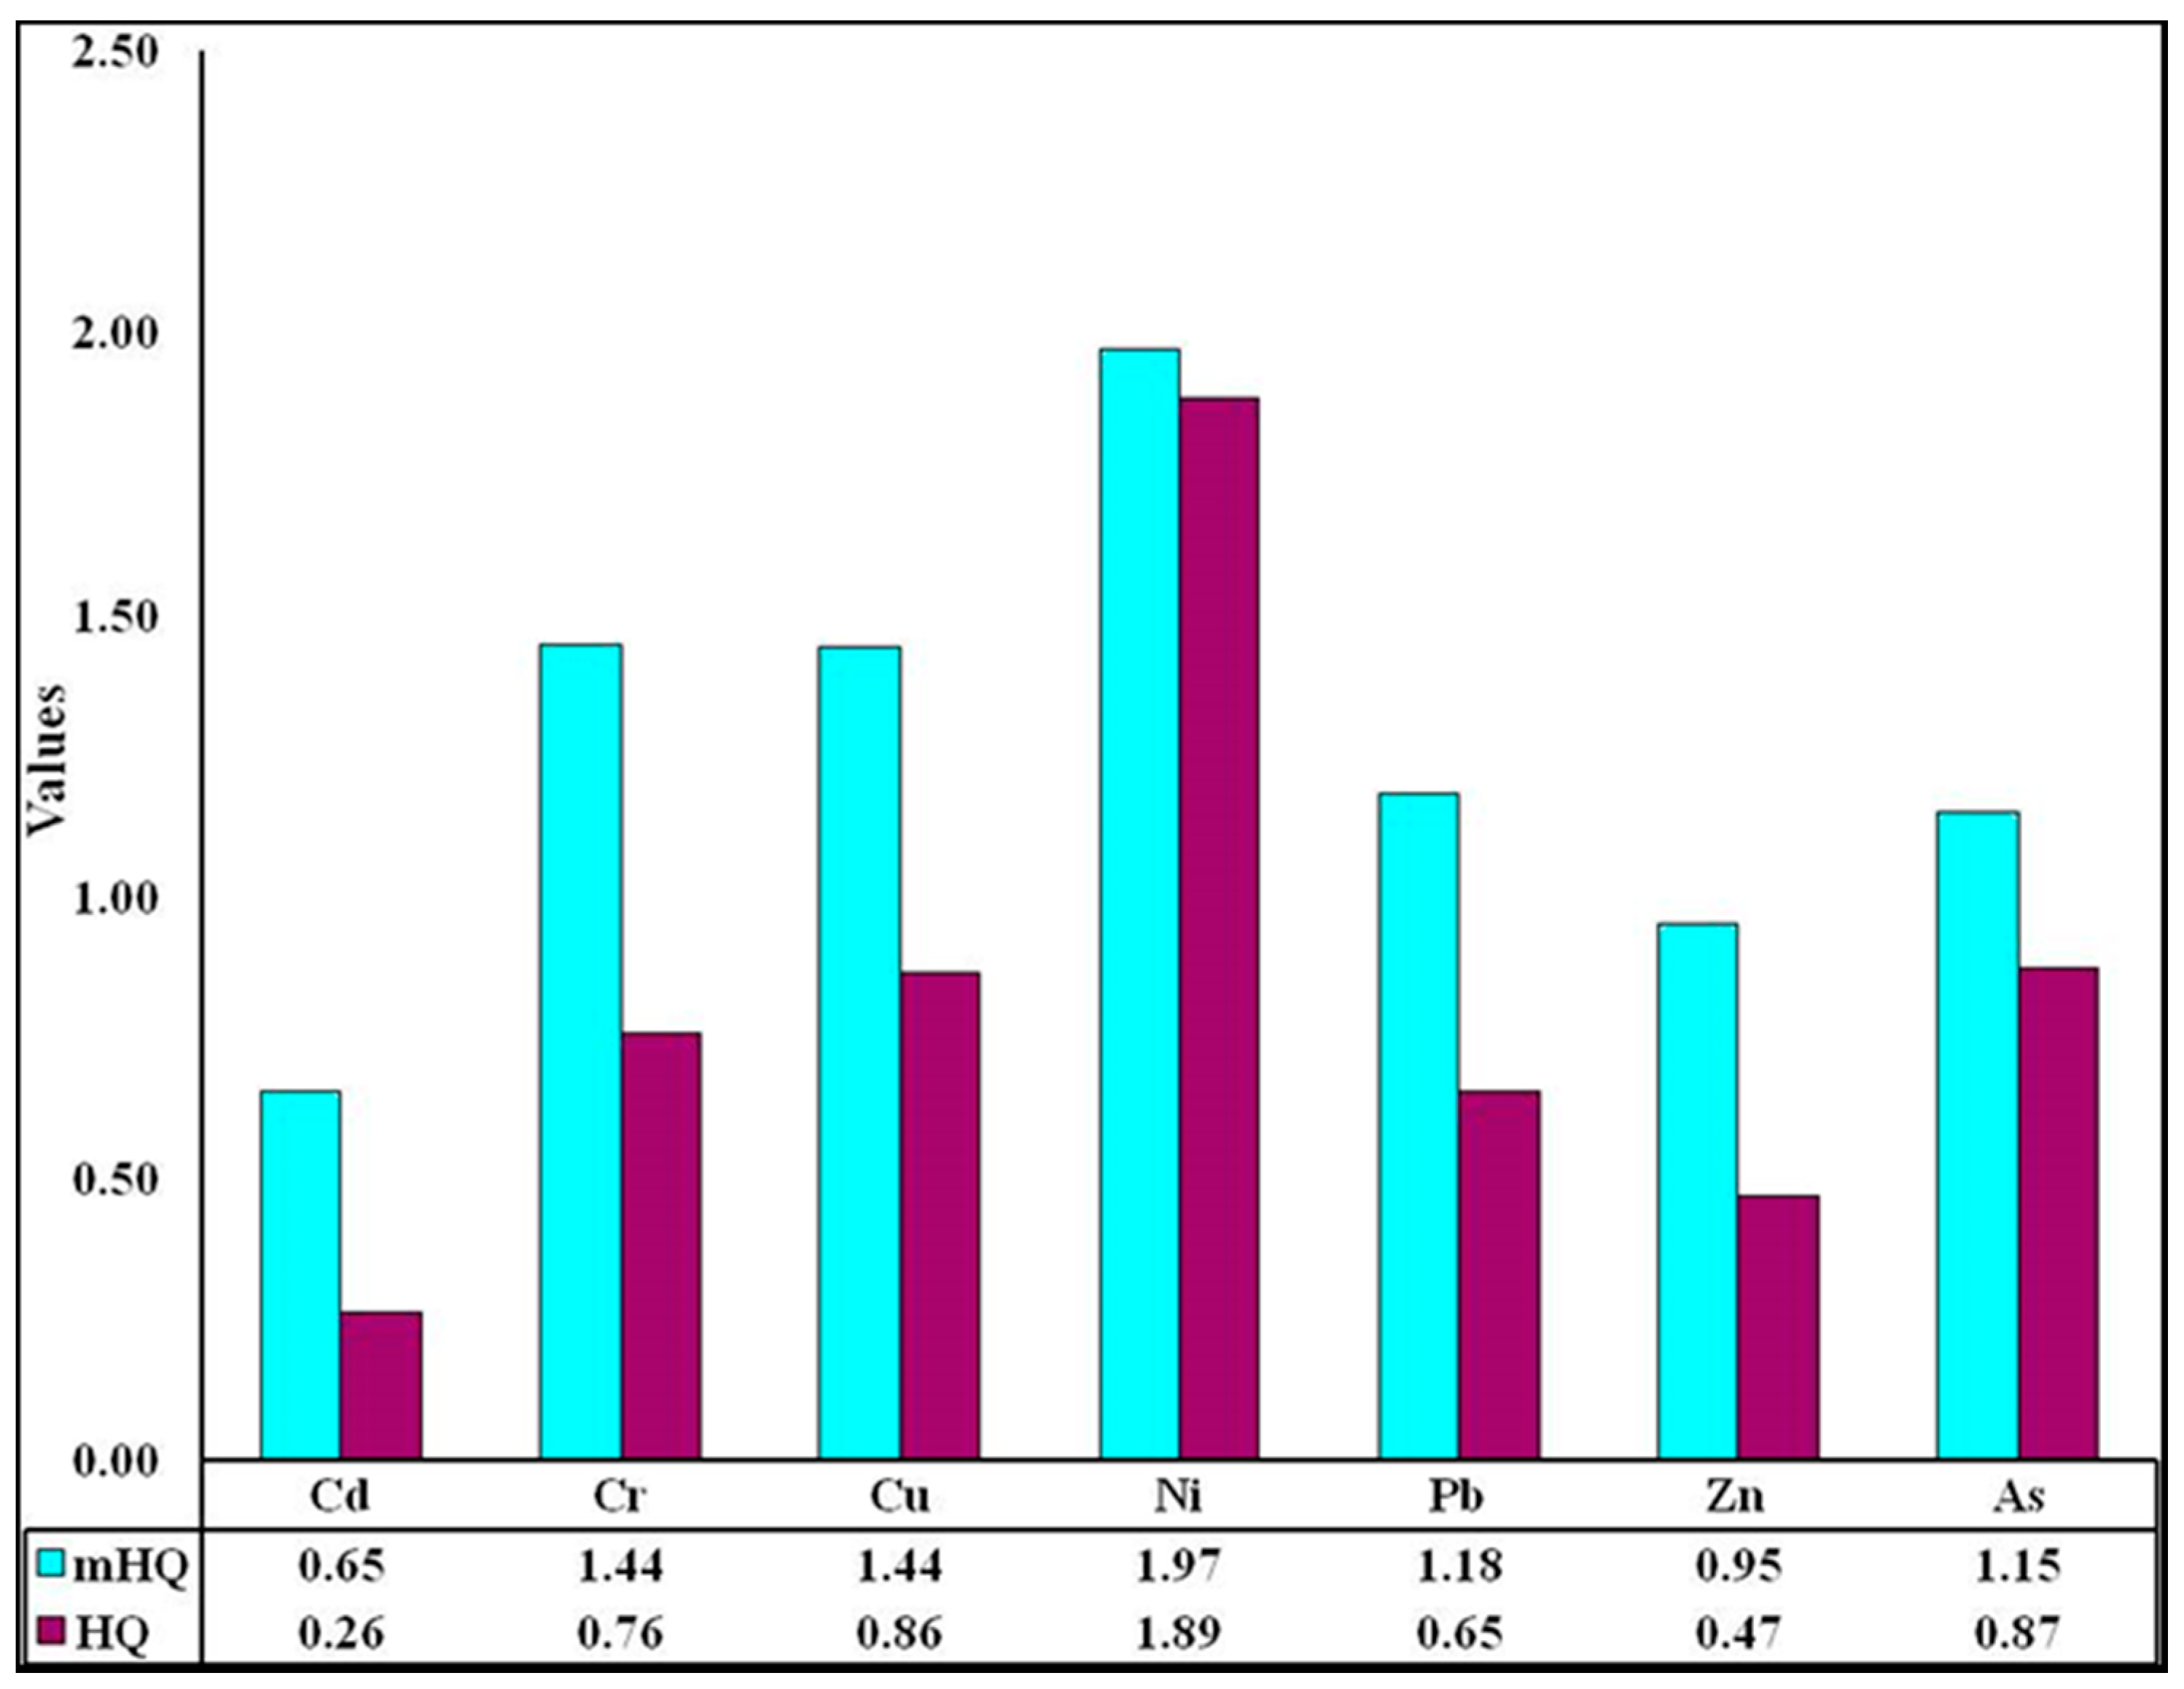
3.4.1. Hazard Quotient (HQ)

Results of the calculated hazard quotients for TEs (Cd, Cr, Cu, Ni, Pb, Zn, and As) are presented in Figure 6. The HQ values of Cr were in the range of 0.1 < HQ < 1 in all sampling sites (except for Jyotirampur (CS) and Gangasagar (S8) during monsoon), indicating that this element would pose potential hazards to the ecosystem (i.e., tannery activities are present in the study area, see Figure 1). HQ values for Ni, Cu (5 out of 9 sampling sites), and As (5 out of 9 sampling sites) were between 1 and 10 (1 < HQ < 10) indicating that Ni, Cu and As might pose a moderate hazard to the ecosystem. Cadmium exhibited no adverse effects (0.1 < HQ) at Lot 8 (S7) (pre-monsoon; monsoon); Barrackpore (S2) [monsoon], Tribeni (S1) and Gangasagar (S8) (post-monsoon), potential hazards (0.1 < HQ < 1) were encountered at all sampling sites while moderate hazard (1 < HQ < 10) was recorded exclusively at Budge Budge (S4) during pre-monsoon season.

3.4.2. Modified Hazard Quotient (mHQ)

The mHQs indicated that the severity of sediment-associated pollution of the seven TEs was in the following descending order: Ni > Cr > Cu > Pb > As > Zn > Cd (Figure 6). The values of mHQ for Cr, Cu and Pb ranged from 1.07–1.92, indicating “low to moderate severity”, while for Cd, Zn, and As it varied between 0.13 to 1.77 revealing “nil to moderate severity” of contamination on the sediment-dwelling organisms. Nickel posed “considerable severity” (2.0 < mHQ < 2.5) in the majority of sampling sites, while Gangasagar (S8) during monsoon revealed “high severity” (mHQ = 2.52).

3.4.3. Toxic Risk Index (TRI)

The mean TRI values followed a decreasing order: S8 (9.23) > S4 (8.50) > S2 (7.34) > S3 (6.87) > S1 (6.81) > S6 (6.77) > S7 (6.34) > S5 (6.24) (Figure S7), indicating low toxic risks (5 < TRI < 10) in all the sampling sites. The TRI values ranged from 5.31 at Lot 8 (S7; pre-monsoon) to 11.35 at Gangasagar (S8; monsoon), indicating moderate toxic risk at S8. The mean TRI values of individual TEs were: Ni (1.87) > Zn (1.71) > Cu (1.13) > Cr (0.87) > Pb (0.74) > As (0.71) > Cd (0.33) and the significant contribution of Ni to the total TRI values might be attributed to its low TEL values.

3.5. Human Health Risk

The chronic daily intake (CDI), hazard quotient (HQ) and cumulative hazard index (HI) for non-carcinogenic risk of TEs from three exposure pathways (i.e., ingestion, inhalation, and dermal contact) on adults and children are presented in Table 2. About adult CDIa, the non-carcinogenic risk value reached the maximum value of 4.321 × 10⁻⁷ mg/kg·day through the ingestion pathway, in contrast only 3.177 × 10⁻¹⁰ mg/kg·day through the inhalation one. Meanwhile, maximum CDI values for children through both ingestion and inhalation pathway were recorded as 4.033 × 10⁻⁶ mg/kg·day and 2.965 × 10⁻⁹ mg/kg·day, respectively. This difference suggests that children were at higher risk of non-carcinogenic exposure than adults.
The HI values for the studied TEs were below 1 (HI < 1) indicating that there is no significant non-carcinogenic risk to the people inhabiting the studied coastal region. About the non-carcinogenic risk, the HI values were higher among children compared to adults (Table 2). The HI values ranged between 3.017 × 10⁻³ to 5.482 × 10⁻¹ for children, and between 3.239 × 10⁻⁴ to 5.885 × 10⁻² for adults. Irrespective of adults or children, the HI values of TEs exhibited the following descending order: Fe> As > Cr > V > Pb > Mn > Ni > Be > Ba > Cu > Co > B > Cd > Zn. However, the values of HI for Cr, Pb, Fe, V, and As were greater than 0.1 for children, indicating the need to protect their health. Cr is required, in very small quantity, for normal functioning of human body, while excessive concentrations might be toxic causing damage to liver and kidneys [36].
Among the four TEs analyzed, the carcinogenic risks for Cr and As were the most relevant with LCR values ranging between 1 × 10⁻⁶ and 1 × 10⁻⁴ for both adults and children, indicating acceptable or tolerable carcinogenic risk (Table S4). The LCR values of Cr and As for children were 3.924 × 10⁻⁴ and 1.379 × 10⁻⁴, respectively meaning that 4 per 10,000 adults and 1 per 10,000 children can be at risk for cancer caused by Cr and As. The LCR value of Cd for children was 2.548 × 10⁻⁵ revealing significant carcinogenic risk. In adults, Cd and Pb exhibited no significant health hazards with their LCR values lower than 1 × 10⁶ while in children the LCR value for Pb (3.328 × 10⁶) was very close to the acceptable carcinogenic risk. Although non-significant non-carcinogenic risks were posed to human, attention should be given to the carcinogenic risk posed by Cr and As to adults and Cr, As and Cd to children. According to [37], Cr can accumulate in considerable amounts in tissues before pathological changes result, and gastrointestinal effects could occur in humans. Excessive build-up of Cr in human bodies may trigger lung cancer and stomach cancer. Arsenic can be harmful to the skin, respiratory and cardiovascular systems [38], while Cd and Pb can impact the nervous system and lead to renal failure [39,40,41]. Cd is a biologically non-essential and toxic heavy metal with carcinogenic, mutagenic, and endocrine disrupting potentialities. Chronic exposure to As and Cd can lead to adverse effects to an individual such as kidney dysfunction, dermal lesion, skin cancer, and hypertension [42,43].
In the study region, the ingestion of sediment was recognized as the principal exposure pathway for TEs to children and adults, followed by inhalation pathway and dermal contact, respectively. The contribution of risks through ingestion to HI and LCR was 99.5% for both adults and children. The study revealed that, regardless of carcinogenic or non-carcinogenic risk, children are at higher risk than adults as already confirmed by other authors [1,43,44,45]. The high susceptibility of children might be linked to their behavioral and physiological characteristics, such as, hand-to-mouth activity, the behavior of mouthing non-food objects, repetitive hand/finger sucking during outdoor activities through which soil/dust can be readily ingested [46,47] and higher respiration rates per unit body weight [48].

4. Conclusions

This study highlighted TEs sediment contamination and the relative associated risks using chemical pollution indices along the Hooghly (Ganges) River Estuary, India. The most remarkable contamination levels were detected for Cd, followed by Pb. The remaining TEs were classified in the lowest contamination level according to Igeo, whereas EF detected some contamination of Co, Be, As and B. This study provided for the first time the opportunity to enhance our knowledge about the synergistic impact of TEs on human health supporting the prioritization of substances to be reduced/removed with specific environmental remediation programs. Future studies will specifically investigate the food chain uptake of contaminants, their final fate and related human health implications along the HRE.

Supplementary Materials

The following are available online at https://www.mdpi.com/2073-4441/13/2/110/s1, Figure S1. Normalized X-ray diffraction patterns of sediment samples from S1 (a), S2 (b), S3 (c), S4 (d), S5 (e), S6 (f), S7 (g), and S8 (h) sites over seasons (pre monsoon, monsoon and post monsoon) along with the control site (i) during the monsoon season. Figure S2. Toxic Risk Index (TRI) values based on the total concentration of trace elements at different sampling sites. Table S1. Formulae and descriptions of sediment contamination and risk indices. Table S2. Exposure factors used in chronic daily intake (CDI) estimation for non-carcinogenic risk. Table S3. The reference dose (RfD) values of trace elements. Table S4. Carcinogenic risk (Lifetime Cancer Risks) for different exposure pathways for (a) adults and (b) children.

Author Contributions

Conceptualization, P.M., G.L. (Giusy Lofrano), G.L. (Giovanni Libralato) and S.K.S.; methodology, P.M. and G.L. (Giovanni Libralato); validation, P.M., G.L. (Giovanni Libralato), M.G. and M.C.; formal analysis, G.L. (Giusy Lofrano), M.C. and M.T.; investigation, P.M. and S.K.S.; data curation, P.M., G.L. (Giusy Lofrano), M.G. and M.C.; writing—original draft preparation, P.M., G.L. (Giusy Lofrano), M.G. and M.C.; writing—review and editing, G.L. (Giusy Lofrano), G.L. (Giovanni Libralato) and S.K.S.; supervision, G.L. (Giovanni Libralato) and S.K.S. All authors have read and agreed to the published version of the manuscript.

Funding

The research work was financially supported by the Department of Science and Technology (DST), New Delhi, India [sanction no.: DST/INSPIRE Fellowship/2014/IF140943] in a research project titled “Distribution and possible sources of trace metals in sediments along the Hugli Estuary and Sundarban Mangrove Wetland, India and their ecotoxicological significance”.

Institutional Review Board Statement

Not applicable.

Informed Consent Statement

Not applicable.

Data Availability Statement

The data presented in this study are available in both the article and the relative supplementary material.

Acknowledgments

The first author Priyanka Mondal is grateful to the DST for awarding her a research fellowship under “Innovation in Science Pursuit for Inspired Research (INSPIRE)” programme.

Conflicts of Interest

The authors declare no conflict of interest. The funders had no role in the design of the study; in the collection, analyses, or interpretation of data; in the writing of the manuscript, or in the decision to publish the results.

References

  1. Adimalla, N.; Chen, J.; Qian, H. Spatial characteristics of heavy metal contamination and potential human health risk assessment of urban soils: A case study from an urban region of South India. Ecotoxicol. Environ. Saf. 2020, 194, 110406. [Google Scholar] [CrossRef] [PubMed]
  2. Zhang, G.; Bai, J.; Xiao, R.; Zhao, Q.; Jia, J.; Cui, B.; Liu, X. Heavy metal fractions and ecological risk assessment in sediments from urban, rural and reclamation-affected rivers of the Pearl River Estuary, China. Chemosphere 2017, 184, 278–288. [Google Scholar] [CrossRef] [PubMed]
  3. USEPA. Integrated Risk Information System (IRIS). In National Center for Environmental Assessment; EPA: Washington, DC, USA, 1999. [Google Scholar]
  4. Adimalla, N.; Wang, H. Distribution, contamination, and health risk assessment of heavy metals in surface soils from northern Telangana, India. Arab. J. Geosci. 2018, 11, 684. [Google Scholar] [CrossRef]
  5. Alissa, E.M.; Ferns, G.A. Heavy metal poisoning and cardiovascular disease. J. Toxicol. 2011, 2011, 870125. [Google Scholar] [CrossRef]
  6. Kim, N.H.; Kim, N.H.; Hyun, Y.Y.; Lee, K.B.; Chang, Y.; Ryu, S.; Oh, K.H.; Ahn, C. Erratum: Environmental heavy metal exposure and chronic kidney disease in the general population. J. Korean Med. Sci. 2015, 30, 272–277. [Google Scholar] [CrossRef] [Green Version]
  7. Tian, S.; Wang, S.; Bai, X.; Zhou, D.; Luo, G.; Yang, Y.; Hu, Z.; Li, C.; Deng, Y.; Lu, Q. Ecological security and health risk assessment of soil heavy metals on a village-level scale, based on different land use types. Environ. Geochem. Health 2020, 42, 3393–3413. [Google Scholar] [CrossRef]
  8. Sadhuram, Y.; Sarma, V.V.; Murthy, T.V.R.; Rao, P.B. Seasonal variability of physico-chemical characteristics of the Haldia channel of Hooghly estuary, India. J. Earth Syst. Sci. 2005, 114, 37–49. [Google Scholar] [CrossRef]
  9. Samanta, S.; Dalai, T.K. Massive production of heavy metals in the Ganga (Hooghly) River estuary, India: Global importance of solute-particle interaction and enhanced metal fluxes to the oceans. Geochim. Et Cosmochim. Acta 2018, 228, 243–258. [Google Scholar] [CrossRef]
  10. Alam, M.; Gomes, A.; Sarkar, S.K.; Shuvaeva, O.V.; Vishnevetskaya, N.S.; Gustaytis, M.A.; Bhattacharya, B.D.; Godhantaraman, N. Trace metal bioaccumulation by soft-bottom polychaetes (Annelida) of Sundarban Mangrove Wetland, India and their potential use as contamination indicator. Bull. Environ. Contam. Toxicol. 2010, 85, 492–496. [Google Scholar] [CrossRef]
  11. Chatterjee, M.; Sklenars, L.; Chenery, S.; Watts, M.J.; Marriott, A.; Rakshit, D.; Sarkar, S.K. Assessment of total mercury (HgT) in sediments and biota of Indian Sundarban wetland and adjacent coastal regions. Environ. Nat. Resour. Res. 2014, 4, 50–64. [Google Scholar] [CrossRef] [Green Version]
  12. Antizar-Ladislao, B.; Mondal, P.; Mitra, S.; Sarkar, S.K. Assessment of trace metal contamination level and toxicity in sediments from coastal regions of West Bengal, eastern part of India. Mar. Pollut. Bull. 2015, 101, 886–894. [Google Scholar] [CrossRef] [PubMed]
  13. Sarkar, S.K.; Priyanka, M.; Jayanta Kumar, B.; Eilhann, K.E.; Yong Sik, O.; Jörg, R. Trace elements in surface sediments of the Hooghly (Ganges) estuary: Distribution and contamination risk assessment. Environ. Geochem. Health 2017, 39, 1245–1258. [Google Scholar] [CrossRef] [PubMed]
  14. Mondal, P.; de Alcântara Mendes, R.; Jonathan, M.P.; Biswas, J.K.; Murugan, K.; Sarkar, S.K. Seasonal assessment of trace element contamination in intertidal sediments of the meso-macrotidal Hooghly (Ganges) River Estuary with a note on mercury speciation. Mar. Pollut. Bull. 2018, 127, 117–130. [Google Scholar] [CrossRef] [PubMed]
  15. Mondal, P.; Reichelt-Brushett, A.J.; Jonathan, M.P.; Sujitha, S.B.; Sarkar, S.K. Pollution evaluation of total and acid-leachable trace elements in surface sediments of hooghly river estuary and sundarban mangrove wetland (India). Environ. Sci. Pollut. Res. 2018, 25, 5681–5699. [Google Scholar] [CrossRef] [PubMed]
  16. Mitra, S.; Sudarshan, M.; Jonathan, M.P.; Sarkar, S.K.; Sandeep, T. Spatial and seasonal distribution of multi-elements in suspended particulate matter (SPM) in tidally dominated Hooghly river estuary and their ecotoxicological relevance. Environ. Sci. Pollut. Res. 2020, 27, 12658–12672. [Google Scholar] [CrossRef]
  17. Sanyal, T.; Chatterjee, A. The Hugli estuary: A profile, in Port of Calcutta: 125 Years Commemorative Volume; Chakraborty, S.C., Ed.; Calcutta Port Trust: Calcutta, India, 1995; pp. 45–54.
  18. Das, M.K. Estuarine Dynamics, Processes and Sediment Transport: A Case Study from the Hooghly Estuary of the Ganges Delta. Ph.D. Thesis, Indian Institute of Technology Kharagpur, Kharagpur, West Bengal, India, 2015. [Google Scholar]
  19. Mondal, P.; Schintu, M.; Marras, B.; Bettoschi, A.; Marrucci, A.; Sarkar, S.K.; Chowdhury, R.; Jonathan, M.P.; Biswas, J.K. Geochemical fractionation and risk assessment of trace elements in sediments from tide-dominated Hooghly (Ganges) River Estuary, India. Chem. Geol. 2020, 532, 119373. [Google Scholar] [CrossRef]
  20. MacDonald, D.D.; CIngersoll, G.; Berger, T. Development and evaluation of consensus-based sediment quality guidelines for freshwater ecosystems. Arch. Environ. Contam. Toxicol. 2000, 39, 20–31. [Google Scholar] [CrossRef]
  21. Zhang, G.; Bai, J.; Zhao, Q.; Lu, Q.; Jia, J.; Wen, X. Heavy metals in wetland soils along a wetland-forming chronosequence in the Yellow River Delta of China: Levels, sources and toxic risks. Ecol. Indic. 2016, 69, 331–339. [Google Scholar] [CrossRef] [Green Version]
  22. Jafarabadi, A.R.; Bakhtiyari, A.R.; Toosi, A.S.; Jadot, C. Spatial distribution, ecological and health risk assessment of heavy metals in marine surface sediments and coastal seawaters of fringing coral reefs of the Persian Gulf, Iran. Chemosphere 2017, 185, 1090–1111. [Google Scholar] [CrossRef]
  23. Kusin, F.M.; Mohd Azani, N.N.; Hasan, S.N.M.S.; Sulong, N.A. Distribution of heavy metals and metalloid in surface sediments of heavily-mined area for bauxite ore in Pengerang, Malaysia and associated risk assessment. Catena 2018, 165, 454–464. [Google Scholar] [CrossRef]
  24. Luo, X.-S.; Ding, J.; Xu, B.; Wang, Y.J.; Li, H.-B.; Yu, S. Incorporating bioaccessibility into human health risk assessments of heavy metals in urban park soils. Sci. Total Environ. 2012, 424, 88–96. [Google Scholar] [CrossRef] [PubMed]
  25. IARC. A Review of Human Carcinogens: Personal Habits and Indoor Combustions; World Health Organization: Lyon, France, 2012; Volume 100. [Google Scholar]
  26. IRIS. Program Database. 2020. Available online: https://cfpub.epa.gov/ncea/iris/search/index.cfm (accessed on 18 September 2020).
  27. Sarkar, S.K.; Frančišković-Bilinski, S.; Bhattacharya, A.; Saha, M.; Bilinski, H. Levels of elements in the surficial estuarine sediments of the Hugli River, northeast India and their environmental implications. Environ. Int. 2004, 30, 1089–1098. [Google Scholar] [CrossRef] [PubMed]
  28. Chen, Y.-M.; Gao, J.; Yuan, Y.-Q.; Ma, J.; Yu, S. Relationship between heavy metal contents and clay mineral properties in surface sediments: Implications for metal pollution assessment. Cont. Shelf Res. 2016, 124, 125–133. [Google Scholar] [CrossRef]
  29. Preda, M.; Cox, M.E. Chemical and mineralogical composition of marine sediments, and relation to their source and transport, Gulf of Carpentaria, Northern Australia. J. Mar. Syst. 2005, 53, 169–186. [Google Scholar] [CrossRef]
  30. Maity, S.K.; Maiti, R. Understanding the sediment sources from mineral composition at the lower reach of Rupnarayan River, West Bengal, India–XRD-based analysis. GeoResJ 2016, 9, 91–103. [Google Scholar] [CrossRef]
  31. Aguado-Giménez, F.; Marín, A.; Montoya, S.; Marín-Guirao, L.; Piedecausa, A.; García-García, B. Comparison between some procedures for monitoring offshore cage culture in western Mediterranean Sea: Sampling methods and impact indicators in soft substrata. Aquaculture 2007, 271, 357–370. [Google Scholar]
  32. Avramidis, P.; Nikolaou, K.; Bekiari, V. Total organic carbon and total nitrogen in sediments and soils: A comparison of the wet oxidation–titration method with the combustion-infrared method. Agric. Agric. Sci. Procedia. 2015, 4, 425–430. [Google Scholar] [CrossRef] [Green Version]
  33. Naha Biswas, S.; Ranjit, N.G.; Bhaskar, K.S.; Bhattacharya, B.D.; Sarkar, S.K.; Satpathy, K.K. Bloom of Hemidiscus hardmannianus (Bacillariophyceae) and its impact on water quality and plankton community structure in a mangrove wetland. Clean Soil Air Water 2013, 41, 333–339. [Google Scholar] [CrossRef]
  34. Rakshit, D.; Sarkar, S.K.; Bhattacharya, B.D.; Jonathan, M.P.; Biswas, J.K.; Mondal, P.; Mitra, S. Human-induced ecological changes in western part of Indian Sundarban megadelta: A threat to ecosystem stability. Mar. Pollut. Bull. 2015, 99, 186–194. [Google Scholar] [CrossRef]
  35. Chatterjee, M.; Silva Filho, E.V.; Sarkar, S.K.; Sella, S.M.; Bhattacharya, A.; Satpathy, K.K.; Prasad, M.V.R.; Chakraborty, S.; Bhattacharya, B.D. Distribution and possible source of trace elements in the sediment cores of a tropical macrotidal estuary and their ecotoxicological significance. Environ. Int. 2007, 33, 346–356. [Google Scholar] [CrossRef]
  36. Knight, C.; Kaiser, J.; Lalor, G.C.; Robotham, H.; Witter, J.V. Heavy metals in surface water and stream sediments in Jamaica. Environ. Geochem. Health 1997, 19, 63–66. [Google Scholar] [CrossRef]
  37. Rahman, M.S.; Khan, M.D.H.; Jolly, Y.N.; Kabir, J.; Akter, S.; Salam, A. Assessing risk to human health for heavy metal contamination through street dust in the Southeast Asian Megacity: Dhaka, Bangladesh. Sci. Total Environ. 2019, 660, 1610–1622. [Google Scholar] [CrossRef] [PubMed]
  38. IARC. IARC monographs on the evaluation of carcinogenic risks to humans. Some Ind. Chem. 1994, 60, 389–433. [Google Scholar]
  39. Bandara, J.; Senevirathna, D.M.; Dasanayake, D.M.; Herath, V.; Bandara, J.M.; Abeysekara, T.; Rajapaksha, K.H. Chronic renal failure among farm families in cascade irrigation systems in Sri Lanka associated with elevated dietary cadmium levels in rice and freshwater fish (Tilapia). Environ. Geochem. Health 2008, 30, 465–478. [Google Scholar] [CrossRef]
  40. Yang, Q.; Shu, W.S.; Qiu, J.W.; Wang, H.B.; Lan, C.Y. Lead in paddy soils and rice plants and its potential health risk around Lechang Lead/Zinc Mine, Guangdong, China. Environ. Int. 2004, 30, 883–889. [Google Scholar] [CrossRef] [PubMed]
  41. Mao, C.; Song, Y.; Chen, L.; Ji, J.; Li, J.; Yuan, X.; Yang, Z.; Ayoko, G.A.; Frost, R.L.; Theiss, F. Human health risks of heavy metals in paddy rice based on transfer characteristics of heavy metals from soil to rice. Catena 2019, 175, 339–348. [Google Scholar] [CrossRef]
  42. Zhuang, P.; Zou, B.; Li, N.Y.; Li, Z.A. Heavy metal contamination in soils and food crops around Dabaoshan mine in Guangdong, China: Implication for human health. Environ. Geochem. Health 2009, 31, 707–715. [Google Scholar] [CrossRef] [PubMed]
  43. Diami, S.M.; Kusin, F.M.; Madzin, Z. Potential ecological and human health risks of heavy metals in surface soils associated with iron ore mining in Pahang, Malaysia. Environ. Sci. Pollut. Res. 2016, 23, 21086–21097. [Google Scholar] [CrossRef]
  44. Karim, Z.; Qureshi, B.A. Health risk assessment of heavy metals in urban soil of Karachi, Pakistan. Hum. Ecol. Risk Assess. Int. J. 2014, 20, 658–667. [Google Scholar] [CrossRef]
  45. Pan, L.; Wang, Y.; Ma, J.; Hu, Y.; Su, B.; Fang, G.; Wang, L.; Xiang, B. A review of heavy metal pollution levels and health risk assessment of urban soils in Chinese cities. Environ. Sci. Pollut. Res. 2018, 25, 1055–1069. [Google Scholar] [CrossRef]
  46. Mielke, H.W.; Gonzales, C.R.; Smith, M.K.; Mielke, P.W. The urban environment and children’s health: Soils as an integrator of lead, zinc, and cadmium in New Orleans, Louisiana, USA. Environ. Res. 1999, 81, 117–129. [Google Scholar] [CrossRef] [PubMed]
  47. Meza-Figueroa, D.; de la O-Villanueva, M.; de la Parra, M.L. Heavy metal distribution in dust from elementary schools in Hermosillo, Sonora, México. Atmos. Environ. 2007, 41, 276–288. [Google Scholar] [CrossRef]
  48. Jiang, Y.; Chao, S.; Liu, J.; Yang, Y.; Chen, Y.; Zhang, A. Hongbin Cao Source apportionment and health risk assessment of heavy metals in soil for a township in Jiangsu Province, China. Chemosphere 2017, 168, 1658–1668. [Google Scholar] [CrossRef] [PubMed]
Figure 1. Map showing the location of 8 sampling sites (S1–S8) along the Hooghly (Ganges) River Estuary along with the control site (CS) situated in the core area of Indian Sundarban mangrove wetland.
Water 13 00110 g001
Figure 2. Spatial distribution of grain-size fractions along the Hooghly (Ganges) River Estuary.
Water 13 00110 g002
Figure 3. Box and half-violin plot exhibiting concentrations of trace elements. The central bar in the box displays the median value; the end of the whiskers represents the minimum and maximum values. The start and end of the boxes include half the data points between the median and extreme of range.
Water 13 00110 g003
Figure 4. Geoaccumulation index (Igeo) of individual trace elements from sampling sites along Hooghly River Estuary (HRE).
Water 13 00110 g004
Figure 5. Enrichment factor (EF) of trace elements present in surface sediments.
Water 13 00110 g005
Figure 6. Potential ecological risks: Hazard Quotients (HQ) and modified Hazard Quotients (mHQ) associated with TEs.
Water 13 00110 g006
Table 1. Descriptive statistics of the sediment geochemical characteristics.
ParametersStatistical Distribution
MaximumMinimumMeanSDMedianCV (%)
pH7.826.857.440.297.453.90
Corg (%)0.590.150.400.110.3927.66
CaCO3 (%) 14.269.0811.041.1810.7410.72
Sand (%)27714.589.9212.1568.07
Silt (%)342329.4411.3227.5038.46
Clay (%)725055.9711.9354.1321.31
TC (%)1.570.470.960.270.9027.76
TN (%)0.710.080.340.190.3056.74
C:N12.731.243.982.752.7669.24
Table 2. Chronic daily intake (CDI) (in mg/kg·day), hazard quotient (HQ) and cumulative hazard index (HI) for non-carcinogenic risk in (a) adults and (b) children.
(a) Adults
Trace ElementsCDI ingCDI inhCDI DermalHQ ingHQ inhHQ DermalHI
Cd4.321 × 10−73.177 × 10−101.724 × 10−94.321 × 10−43.177 × 10−71.724 × 10−64.341 × 10⁻⁴
Cr8.386 × 10−56.166 × 10−83.346 × 10−72.795 × 10−22.055 × 10−51.115 × 10−42.809 × 10−2
Cu4.024 × 10−52.959 × 10−81.605 × 10−71.085 × 10−37.974 × 10−74.327 × 10−61.090 × 10−3
Ni5.397 × 10−53.969 × 10−82.153 × 10−72.699 × 10−31.984 × 10−61.077 × 10−52.711 × 10−3
Pb4.183 × 10−53.076 × 10−81.669 × 10−71.195 × 10−28.789 × 10−64.769 × 10−51.201 × 10−2
Fe4.100 × 10−23.015 × 10−51.636 × 10−45.857 × 10−24.307 × 10−52.337 × 10−45.885 × 10−2
Mn7.155 × 10−45.261 × 10−72.855 × 10−65.111 × 10−33.758 × 10−62.039 × 10−55.135 × 10−3
Co2.101 × 10−51.545 × 10−88.384 × 10−81.051 × 10−37.725 × 10−74.192 × 10−61.056 × 10−3
Zn9.671 × 10−57.111 × 10−83.859 × 10−73.224 × 10−42.370 × 10−71.286 × 10−63.239 × 10−4
Be4.489 × 10−63.301 × 10−91.791 × 10−82.244 × 10−31.650 × 10−68.955 × 10−62.255 × 10−3
V1.239 × 10−49.108 × 10−84.942 × 10−71.376 × 10−21.012 × 10−55.492 × 10−51.383 × 10−2
As9.826 × 10−67.225 × 10−93.920 × 10−83.275 × 10−22.408 × 10−51.307 × 10−43.291 × 10−2
B1.558 × 10−41.146 × 10−76.218 × 10−77.792 × 10−45.729 × 10−73.109 × 10−67.829 × 10−4
Ba4.720 × 10−31.666 × 10−79.040 × 10−71.133 × 10−38.330 × 10−74.520 × 10−61.138 × 10−3
(b) Children
Trace ElementsCDI ingCDI inhCDI DermalHQ ingHQ inhHQ DermalHI
Cd4.033 × 10−62.965 × 10−98.046 × 10−94.033 × 10−32.965 × 10−68.046 × 10−64.044 × 10−3
Cr7.827 × 10−45.755 × 10−71.562 × 10−62.609 × 10−11.918 × 10−45.205 × 10−42.616 × 10−1
Cu3.755 × 10−42.761 × 10−77.492 × 10−71.012 × 10−27.443 × 10−62.019 × 10−51.015 × 10−2
Ni5.037 × 10−43.704 × 10−71.005 × 10−62.519 × 10−21.852 × 10−55.025 × 10−52.526 × 10−2
Pb3.905 × 10−42.871 × 10−77.790 × 10−71.116 × 10−18.203 × 10−52.226 × 10−41.119 × 10−1
Fe3.827 × 10−12.814 × 10−47.634 × 10−45.467 × 10−14.020 × 10−41.091 × 10−35.482 × 10−1
Mn6.678 × 10−34.910 × 10−61.332 × 10−54.770 × 10−23.507 × 10−59.516 × 10−54.783 × 10−2
Co1.961 × 10−41.442 × 10−73.912 × 10−79.805 × 10−37.210 × 10−61.956 × 10−59.832 × 10−3
Zn9.026 × 10−46.637 × 10−71.801 × 10−63.009 × 10−32.212 × 10−66.002 × 10−63.017 × 10−3
Be4.190 × 10−53.081 × 10−88.358 × 10−82.095 × 10−21.540 × 10−54.179 × 10−52.101 × 10−2
V1.156 × 10−38.501 × 10−72.306 × 10−61.285 × 10−19.445 × 10−52.563 × 10−41.288 × 10−1
As9.171 × 10−56.743 × 10−81.830 × 10−73.057 × 10−12.248 × 10−46.098 × 10−43.065 × 10−1
B1.454 × 10−31.069 × 10−62.902 × 10−67.272 × 10−35.347 × 10−61.451 × 10−57.292 × 10−3
Ba2.115 × 10−31.555 × 10−64.219 × 10−61.057 × 10−27.775 × 10−62.109 × 10−51.060 × 10−2
Publisher’s Note: MDPI stays neutral with regard to jurisdictional claims in published maps and institutional affiliations.

