Valuation of Drought Information: Understanding the Value of the US Drought Monitor in Land Management


1
National Drought Mitigation Center, University of Nebraska-Lincoln, Lincoln, NE 68583-0988, U.S.
2
The Cadmus Group, LLC, 1620 Broadway, Suite G Santa Monica, CA 90404, U.S.
*
Author to whom correspondence should be addressed.
Water 2021, 13(2), 112; https://doi.org/10.3390/w13020112
Submission received: 3 December 2020
/
Revised: 24 December 2020
/
Accepted: 25 December 2020
/
Published: 6 January 2021
(This article belongs to the Section Hydrology)
Abstract
:Droughts affect recreation and tourism, grazing, forests, and timber, and can have important indirect effects for the ecosystems and species that rely on water. Despite its importance, the effect of drought in the land management sector is less understood than in other water-intensive sectors, such as agriculture and public water supplies. This study presents the first-ever estimates of the economic valuation of the information provided by the U.S. Drought Monitor using the avoided cost method. These estimates are based on the time and labor saved by using the U.S. Drought Monitor rather than compiling drought-related information from other sources, or using other sources for tracking/monitoring droughts, communicating drought conditions, and dealing with drought-related issues. The results reflect rational behavior—the more time needed to compile or collect drought information provided by the U.S. Drought Monitor, the higher the dollar value in avoided cost. This dollar amount also varies by institution and organization, which indicates respondents from different organizations value the information from the U.S. Drought Monitor differently. For example, compared to the state offices, the field offices in the Bureau of Land Management value more of the information provided by the U.S. Drought Monitor. These estimates can be used to estimate the societal benefits and help policy makers evaluate the U.S. Drought Monitor in different sectors.
1. Introduction
Timely and accurate climatic and meteorological information is critical for people’s decision making [1,2]. This information is used in private markets and to support a wide range of public policy decisions, including land management, crop and livestock planning, disaster preparation, and relief, and public health. Global climate change is likely increasing the severity and frequency of droughts [3]. In response, the demand for drought-related information will likely increase to better inform decision making. Therefore, it is important to understand the value of this drought-related information and how it can change both public and private decisions. Governments often provide information about droughts, typically for free because of the public good nature of the information: the information can be shared with many users at virtually the same cost as providing it to one. Because the information is not bought and sold in markets, the public sector providers of this information may not know the potential return on the taxpayers’ investment in producing this information. Finding a way to assign a value to the information, in the absence of a price, would help decision-makers decide whether to continue to allocate resources to providing weather and climate information.
As described in our companion paper [4], a considerable body of literature exists that describes ways to assign values to climatic and meteorological data in general, and drought-related information in particular. Studies have used many methods to measure the benefit of climatic and meteorological information, including avoided cost and benefit transfer, contingent valuation and choice experiments. To extend the analysis, this paper provides direct qualitative and quantitative measures of the value of the drought-related information provided by the U.S. Drought Monitor (USDM) for a narrow set of consumers in the Bureau of Land Management (BLM). We chose BLM for this analysis because timely information about drought is important for its operations. Droughts affect recreation and tourism, grazing, forest and timber, and can have important indirect effects for the ecosystems and species that rely on water [5,6,7]. Despite its importance, the effect of drought is less direct and perhaps less understood than in other water-intensive sectors, like public water supplies. Several studies have examined how farmers and households use climatic and meteorological information [8,9,10,11,12,13,14,15,16], but less attention has been focused on land management [17].
Through a survey of BLM staff and in-depth interviews, we collected information about how the USDM is to track and monitor droughts, communicate drought conditions, and deal with drought-related issues. We asked the survey respondents to estimate the time they spent tracking or monitoring drought, with and without the USDM, and the hourly wage rate of the people who track and monitor drought. Using this information, we present the first-ever estimate of the economic value of the information provided by the USDM.
2. Background
The National Drought Mitigation Center (NDMC) hosts and maintains the USDM, a weekly map of drought conditions throughout the United States, showing which parts of the United States are experiencing various degrees of drought. Since its inception in 1999, the USDM has been used by companies, commodity brokers, congressional committees, media, farm programs, and federal, state, and local government agencies, to track the status of droughts [18]. The U.S. Farm Bill has used the USDM as a trigger for various farm and ranch programs in the U.S. to the tune of nearly $7 billion in relief since 2012 alone. Despite the wide use of the USDM, only a few studies evaluate how the information it provides affects the economy [19,20]. None has focused on the value of the information provided by the USDM despite its importance.
Timely and accurate Drought-related information is critical for BLM. First, droughts affect recreation and tourism. The public lands managed by the BLM offer more recreational opportunities than lands managed by any other federal agency, with more than 99% available for recreation with no fee. In 2016, BLM lands received more than 64.6 million recreation-related visits [21]. Second, it affects grazing. In 2016, the BLM permitted 12 million animal unit months (AUMs) for ranchers who graze their livestock, mostly cattle and sheep, on public lands. While the number of AUMs sold each year remains relatively steady, annual variations in use occur because of factors such as drought, wildfire, as well as market conditions and restoration projects [21]. The droughts in 2002 and 2012 contributed to substantial losses in grazing fees [22]. Third, it affects forest and timber. Forest ecosystems provide numerous ecological, economic and aesthetic benefits across many spatial scales [23]. One-fourth of the 245 million acres of lands managed by the BLM are forest ecosystems, spread across 13 western states, including Alaska [21]. Forests are very vulnerable to drought and temperature extremes.
3. Data and Methods
Several methods and tools have been explored to value the benefits of climatic and meteorological information. The direct market approach uses market prices and quantities to estimate the use of the information or services, such as crop or livestock revenues [24]. A commonly used indirect method of measuring non-market services is the value of avoided costs [4]. The costs that people avoid by using the climatic and meteorological information are a proxy for the value of the information provided. Contingent valuation studies and choice experiments are two approaches for measuring stated preferences, a method that has been used to estimate the value of public goods or services [4]. State preference methods were not applicable for measuring the value to BLM because the survey respondents were not able to put a dollar value on the information, due to both to their role as agents of the federal government and budget constraints facing their bureau.
Surveys are one of the most common and important methods for eliciting information directly from a group of respondents [16]. To begin to develop estimates of measures of the value of the USDM based on how it is used in decision-making, we conducted one-on-one pilot interviews. Interview subjects were from the Bureau of Land Management, and, as a test of the interview protocol, the Central Nebraska Public Power and Irrigation District. These interviews provided information about how the USDM is used and initial assessments of how to measure the value of the USDM to its users. Following state-of-art methods [25], we developed a survey questionnaire targeted to specific USDM users within the Bureau of Land Management, who manage public lands primarily in the more-arid western states. The survey included questions about whether the USDM is used, how it is used, qualitative measures of its value, and questions about its potential monetary value. It was approved by the Institutional Review Board (IRB, project number: 15924). The survey was launched in the fall of 2018. The questionnaire was distributed via a program officer at BLM, who first introduced the survey on one of the regular BLM Resources and Minerals Committee phone calls and then distributed it along with post-call materials to about 330 field-level and state office deputy-level managers. They were invited to complete the survey via an email containing a unique link to the survey. Each person was allowed to complete the survey only once. We conducted the survey and collected the data through Quatrics, a user-friendly online survey software tool. We received 43 responses to the BLM survey with an effective 11 percent response rate (35 people have completed the survey). The response rate is satisfactory considering the goal of the survey is not a high response rate, but the representation of the population of interest and low non-response bias [26]. Low email surveys response rates are not unusual due to factors such as pre-notifications, incentives, personalization and reminders [27]. Different from most previous surveys investigating the general public, random sampling is not appropriate because our research focus on the USDM users among BLM employees. Additionally, the geographic locations of our survey responses represented all the BLM’s western state offices. According to our personal contacts, one or a few people per state, district, or field office would be primarily responsible for monitoring drought on normal basis, and larger numbers of BLM staff becoming involved in use of the drought monitor during drought years such as 2002 and 2018. Emails invitations were sent out in early November of 2018 and three reminders followed in every three weeks. These users themselves volunteer to take part in the research. We feel that our survey procedure has successfully researched out to the representative USDM users at BLM in field offices and the non-response rate is low. The questionnaire is shown in Supplementary Material.
Among 35 people who completed survey, most of the respondents reported that their agency tracks or monitors the location or severity of drought. Although drought information is important for BLM’s decision making, we could not assume that everyone at BLM accesses or uses drought information. Some of our survey respondents are not familiar with drought tracking and monitoring tasks. Some are supervising staff to do drought tracking or monitoring work while others are responsible for drought tracking and monitoring tasks themselves. Therefore, we added multiple filters throughout the survey questionnaire so the respondents irrelevant to the questions were filtered out gradually. For example, if the respondents’ agency does not address any issues affected by drought, or they do not deal with drought issues, or they are not responsible for drought related tasks, they are redirected to the end of the survey for referral to relevant people, including name, position, and email.
4. Survey Results
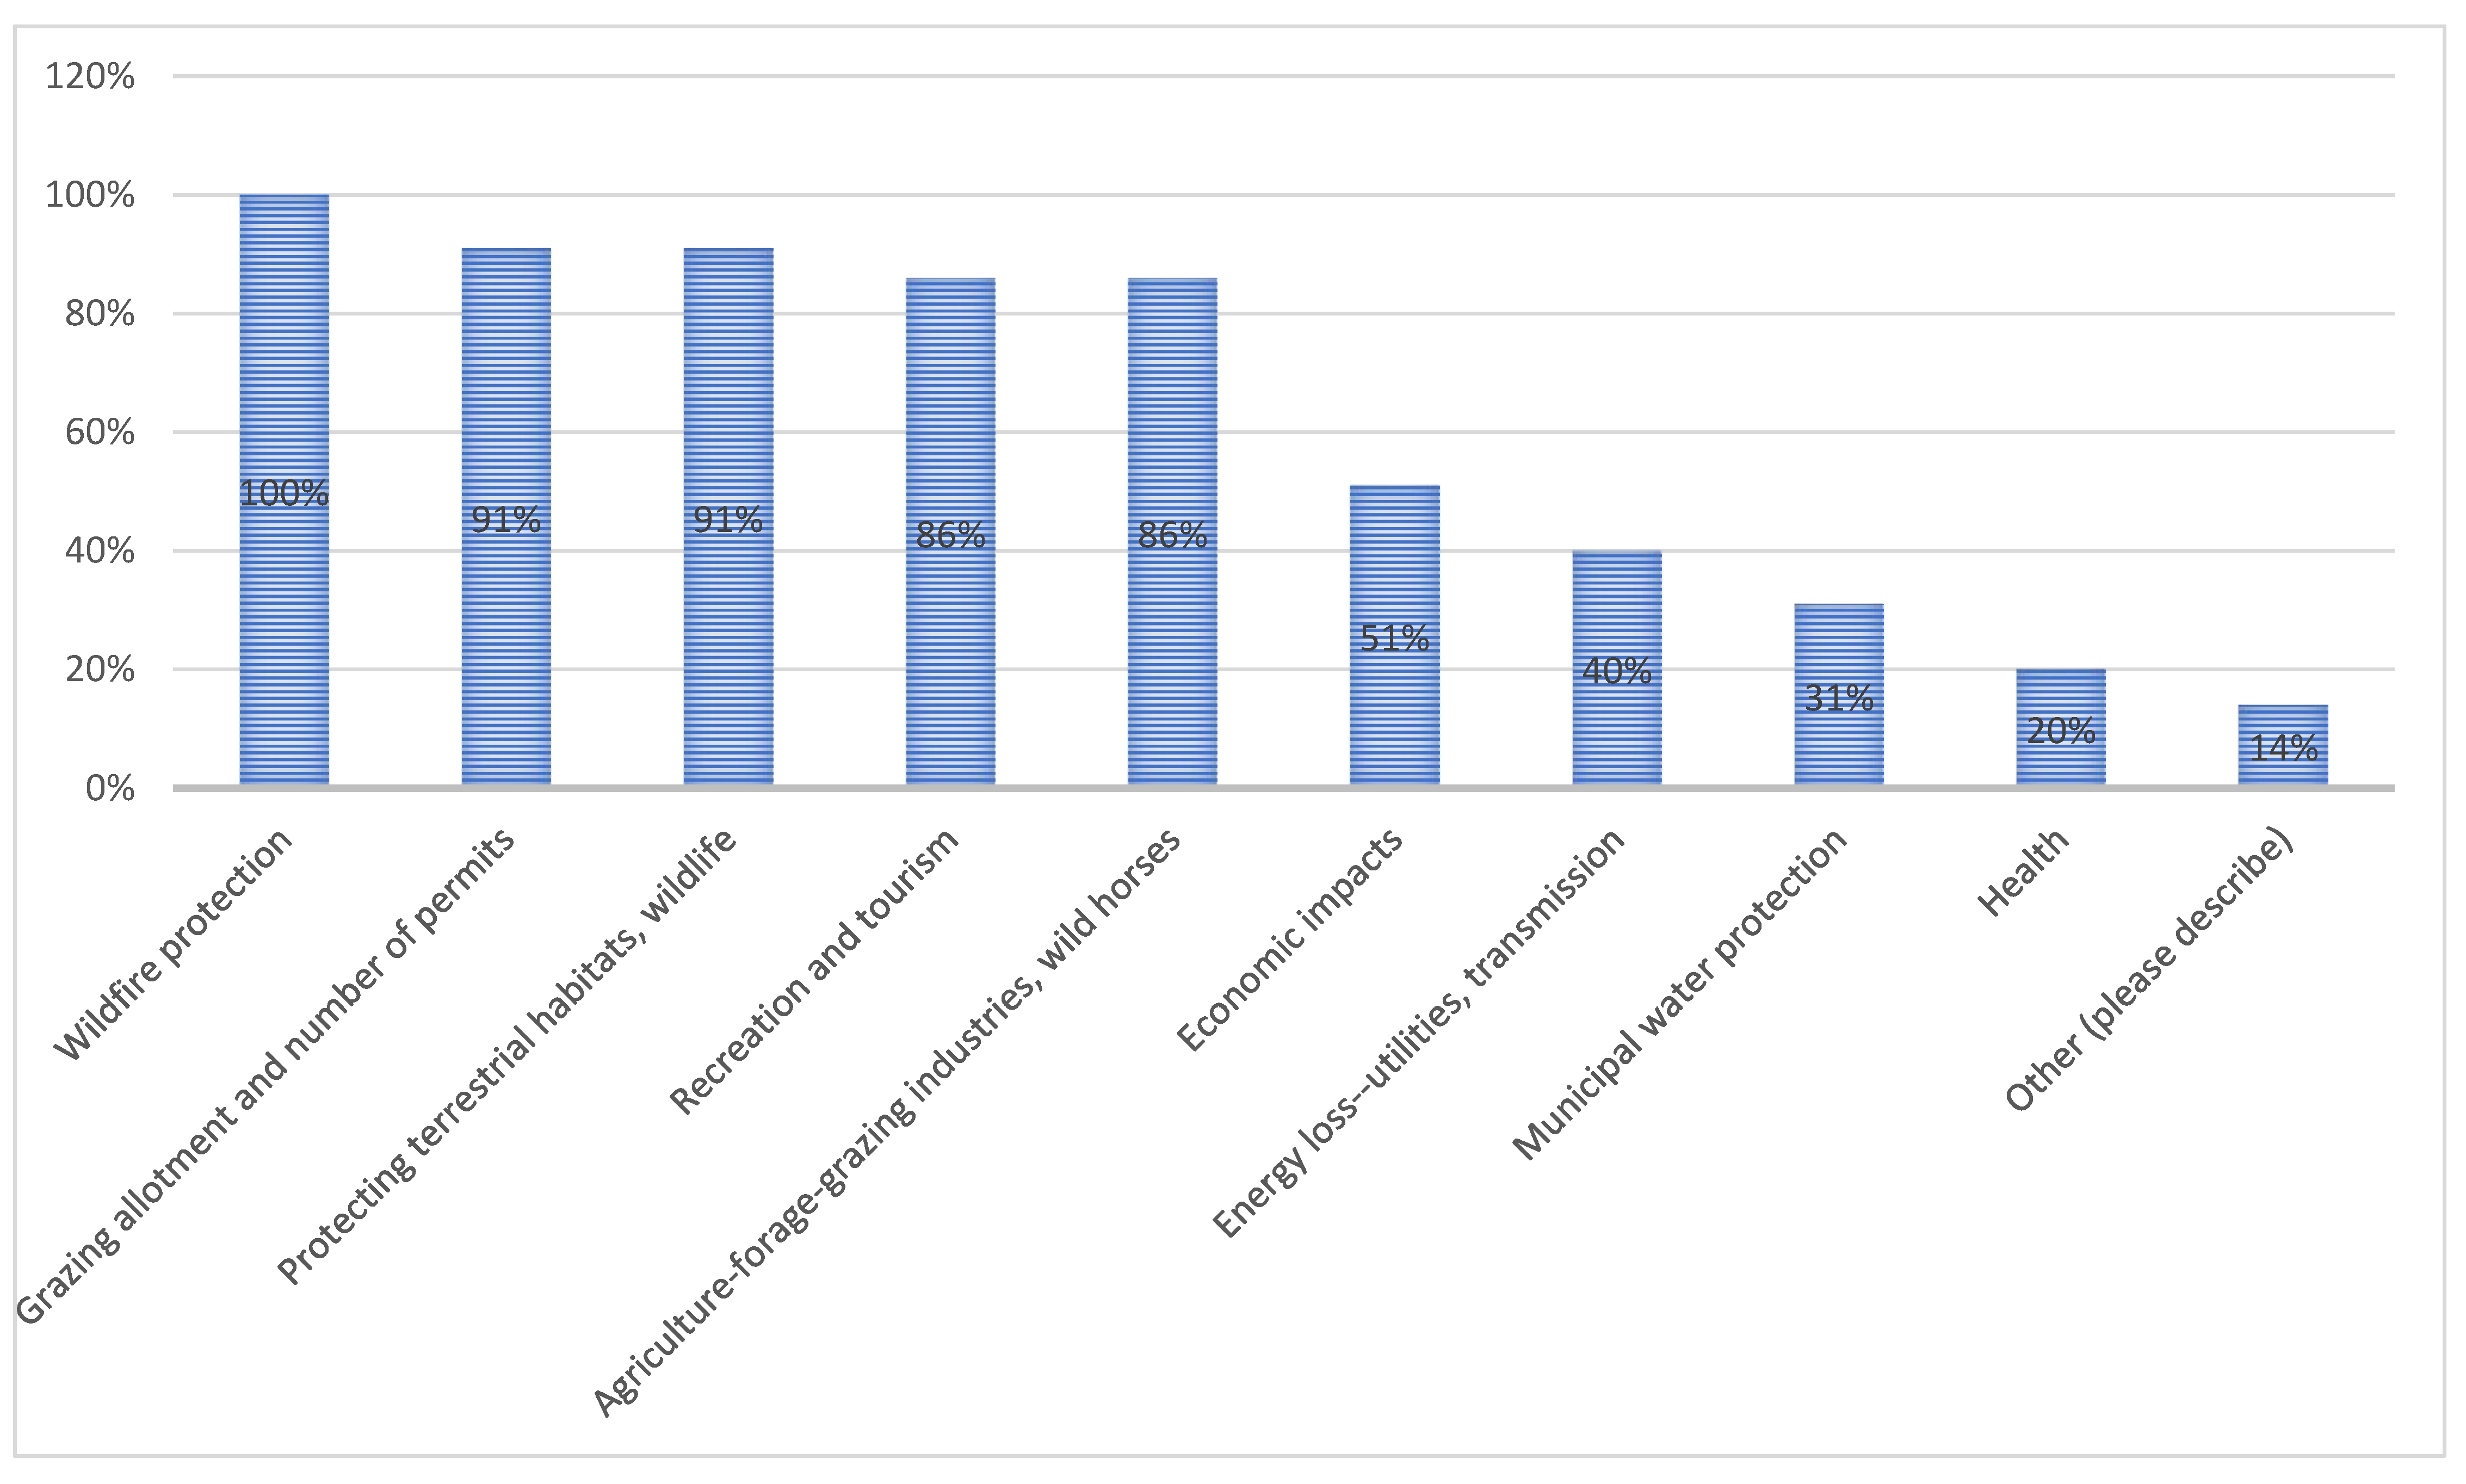
The survey respondents represent different level BLM offices that track and monitor drought well, including 14% from national office, 26% from state offices, and 60% from district/field offices. More specifically, six of the twelve BLM administrative state offices were represented in this survey (i.e., Alaska, California, Colorado, Idaho, Montana-Dakotas, and New Mexico), and 17 district/field offices out of 63 were represented in Arizona/Utah, California, Nevada, New Mexico, Oregon, Utah, Washington, and Wyoming. District/field office regions represented in the survey range from 2500 to over 5 million people served. Administrative state regions represented range from 100,000 to over 5 million people. According to respondents, the most common BLM-related issues that are potentially affected by drought or lack of precipitation include wildfire protection, grazing allotment and number of permits, protecting terrestrial habitats, wildlife, recreation and tourism (such as rafting, kayaks, fishing, aquatic habitats, and hiking), and agriculture-forage-grazing industries and wild horses, as shown in Figure 1. All of the respondents said they work in a role or position that related to the drought issues that they checked. The majority of the survey respondents have a primary disciplinary background of environmental science, GIS, biological science, natural resources science, ecology, or forestry. More than 80% of the survey respondents have more than 11 years’ experience.
4.1. Drought Monitoring and Tracking
About 90% of respondents reported that their agency tracks or monitors the location or severity of drought. Half of them were not responsible for monitoring drought and thus were excluded from further analysis. Of the 20 remaining individuals who continued the survey, about half were themselves responsible for drought monitoring, and the other half supervised staff who were responsible for drought monitoring. These individuals held a range of positions including field management, state leadership, research staff, and program leadership. Because four of the five respondents who worked at the national level said that they were not at all responsible for monitoring drought, only one national-level respondent was included in the subsequent analysis. The majority of respondents representing all level office (national, state, and district/field) said they monitor drought for risk communication with the public, such as sending out newsletters or warnings to the public on fire risks and conditions, to support decisions or actions to respond to drought conditions, for internal communications, and to support research. One district/field office respondent wrote in that his/her agency tracks or monitors drought for land use planning under the National Environmental Policy Act.
Understanding where, when and how often people get drought information is critical to improve the drought information products. However, the literature is limited on the sources of drought information. To access respondents’ sources, we asked them to indicate which sources they obtain drought information, and how often they obtain drought information from seven potential sources. The seven sources of information are the USDM, numeric indices (e.g., Palmer Drought Severity Index, Standardized Precipitation Index, and Standardized Precipitation Evapotranspiration Index), and data on snowpack were the most commonly used sources of information used to monitor drought. We also allowed the respondent to identity the sources of information if it was not listed in the potential sources. Our results show that the USDM is the most popular sources of information at national, state, and district and field offices, followed by numeric indices such as Palmer Drought Severity Index, Standardized Precipitation Index, and Standardized Precipitation Evapotranspiration Index. Evaporative Demand Drought Index provides another importance sources of information for all level BLM offices. Other sources identified by respondents are the Climate Engine, field data collected by staff, the Great Basin Geographic Area Coordination Center (GBCC) Predictive Services, Fire Remote Automated Weather Stations (RAWS), Parameter Elevation Regression on Independent Slopes Model (PRISM), NOAA, and Western Water Assessment. We believe that the diversity of sources can provide a more efficient solution on tracking and monitoring drought based on individuals’ needs.
Additionally, we solicited responses on how often they seek information to track or monitor drought. Due to the unique characteristics of drought such as developing slowly, quietly, and lacking highly visible and structural impacts, we chose the “only when there is drought” as a conservative, lower-bound [28]. Our survey results show that more than half sought information at least a couple of times per month, year-round. Others seek the information only during critical seasons or only when there is drought. State and district/field office representatives were fairly similar in their answers, while the one national office representative said they monitored at least once a week, year-round.
Compared to seeking information tracking or monitoring drought from all sources, respondents show similar behavior when consulting the U.S. Drought Monitor. For example, about 80% of the respondents reported that they consult the U.S. Drought Monitor every month or more often. Of those who said they consult the U.S. Drought Monitor only during critical seasons, spring and summer were indicated as critical more frequently than fall and winter. Notably, all of those who said they consult the U.S. Drought Monitor only when there is drought worked in district/field offices. Of those who only consult the U.S. Drought Monitor during drought, they ranged from once-a-week usage during drought to a-couple-of-times-per-year usage during drought, displaying wide variance in dependence upon the tool.
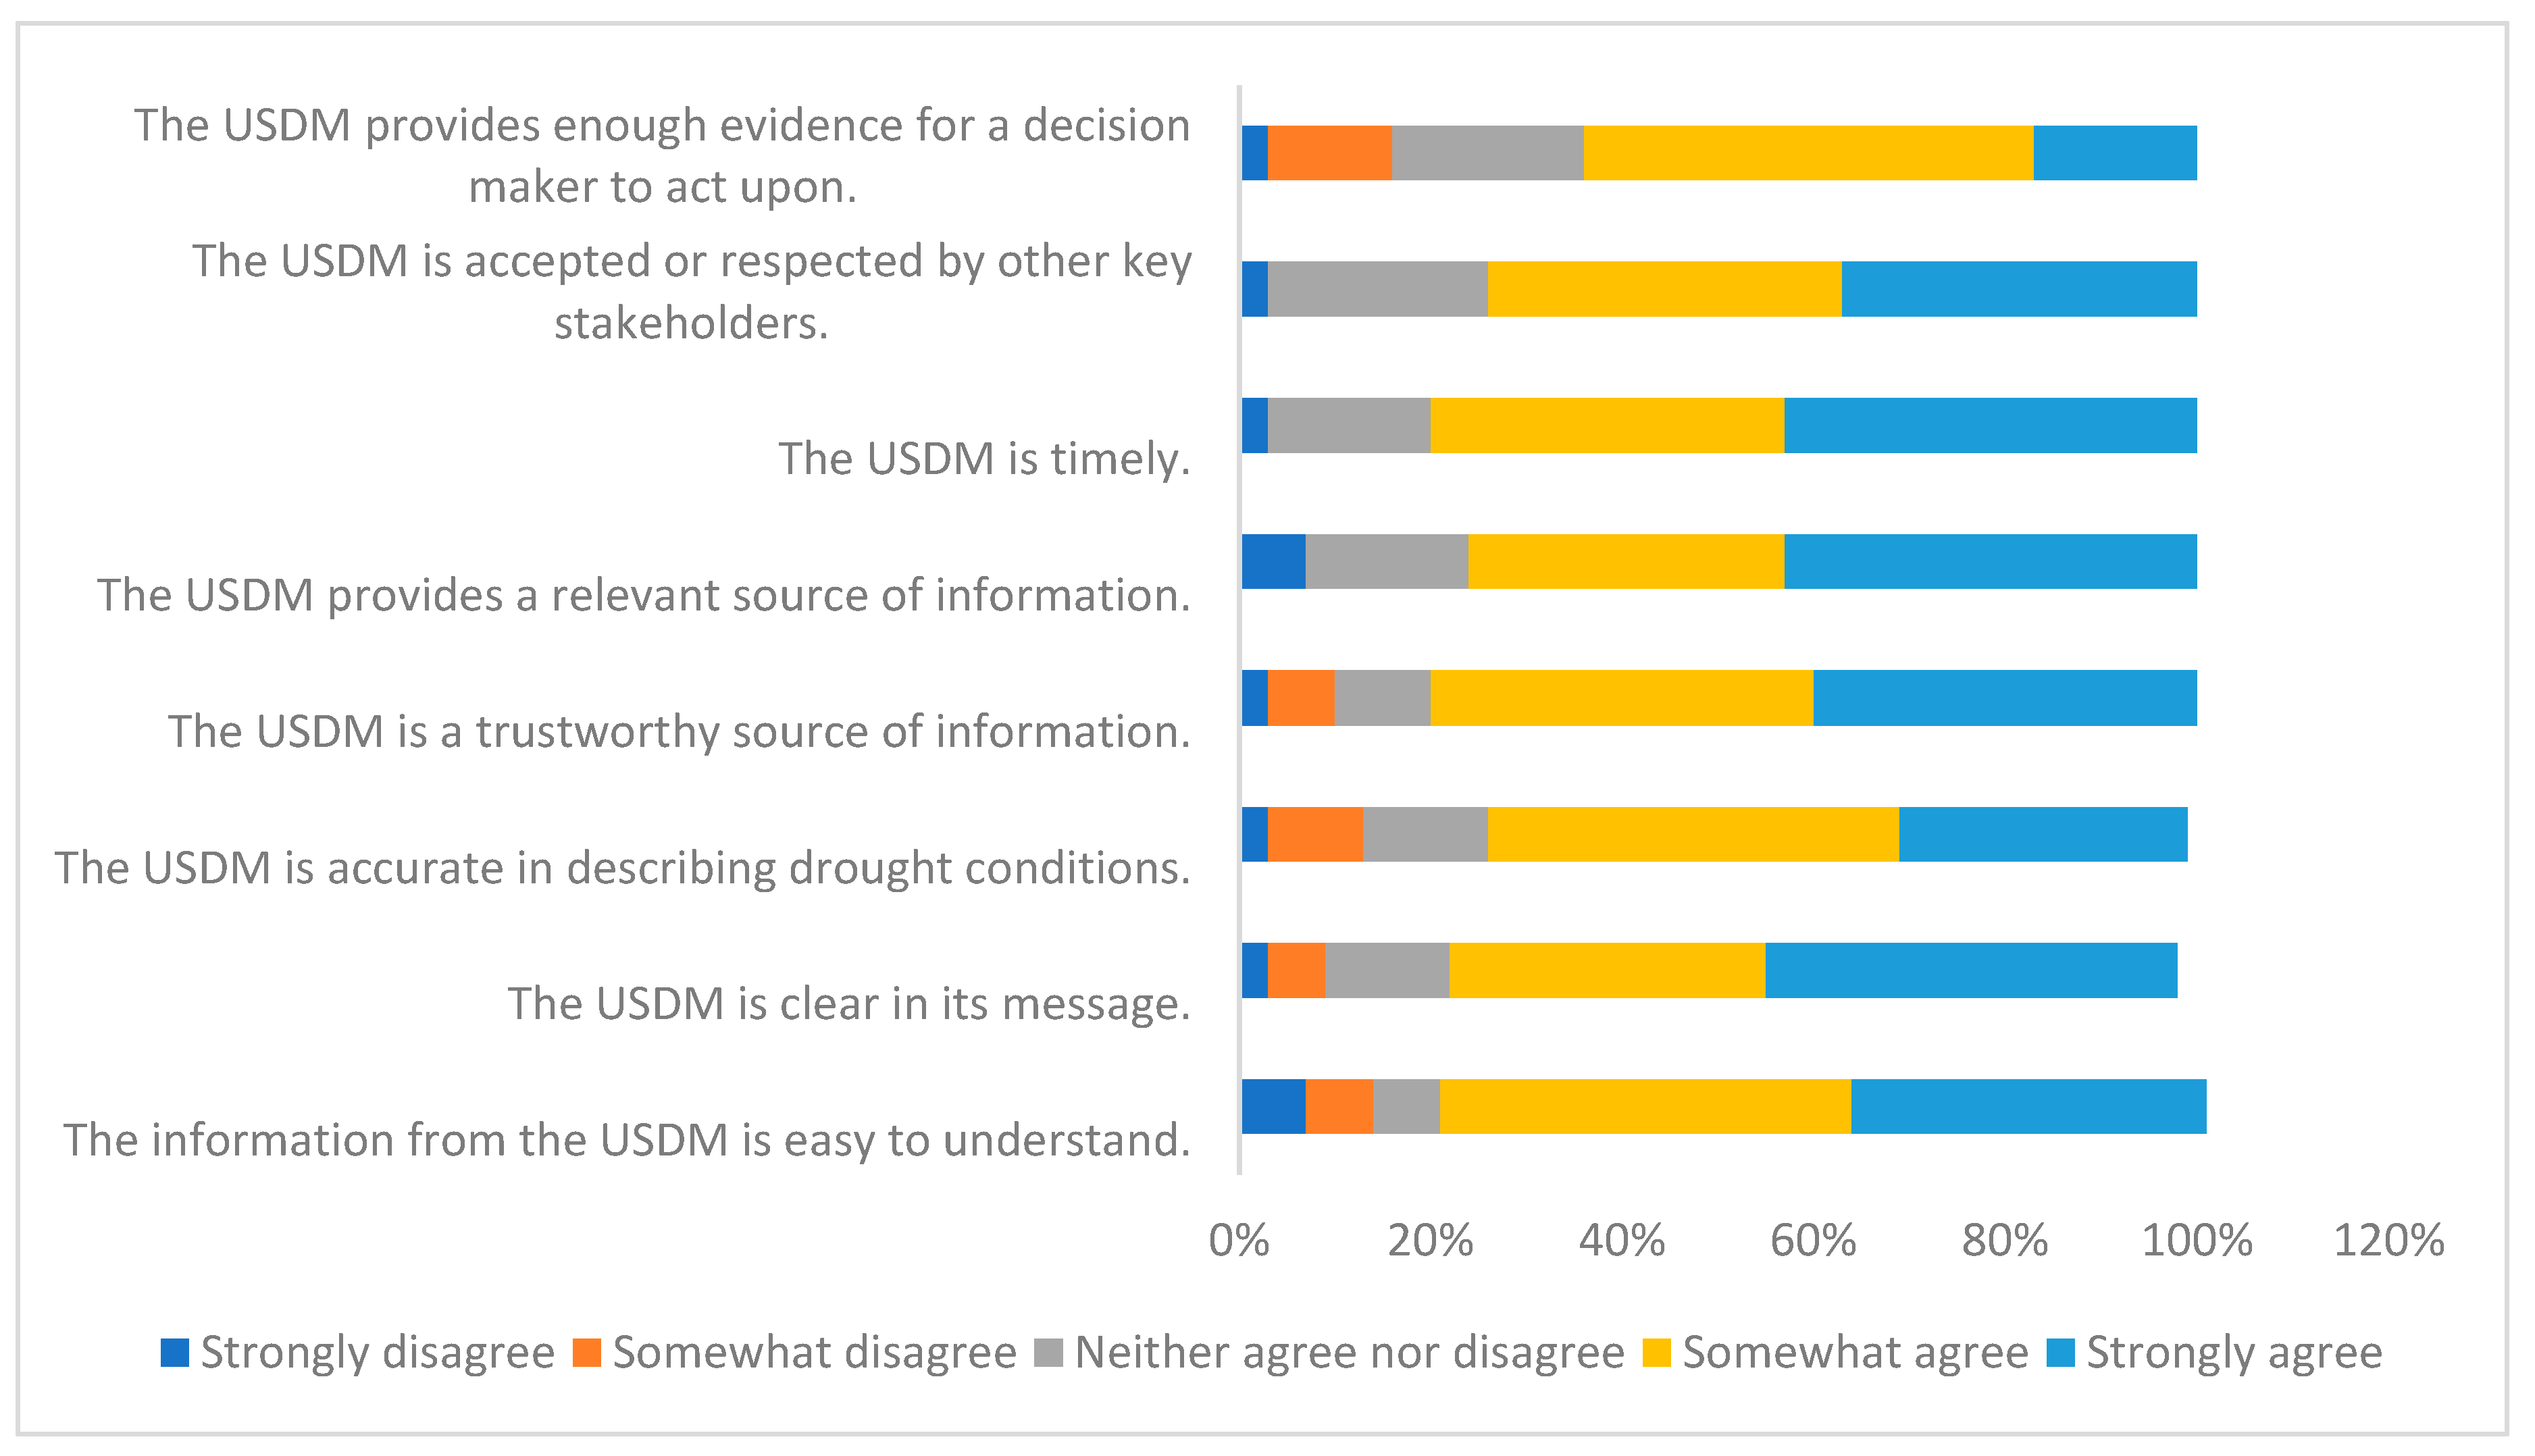
We use Likert scale to understand users’ views and experience with the USDM and the results are shown in Figure 2. Results show that the majority of survey respondents have positive experience and confidence with the USDM. They strongly or somewhat agree on its informativeness, acceptance, timeliness, relevance, trust-worthiness, accuracy, and clarity. There are few negative experience with the USDM, which may due to various reasons such as scale, purposes of tracking or monitoring drought. A follow-up survey may identify these concerns and help improve the USDM. When we asked about the information provided by the U.S. Drought Monitor compared to other sources of drought monitoring information, 93% of the respondents agreed on “the U.S. Drought Monitor provides useful information that I do not get from other sources,” while only one person suggested “the U.S. Drought Monitor provides the same information that I get from other sources.” None of the respondents said that the U.S. Drought Monitor provides less useful information than they get from other sources. The most popular features of the USDM among our respondents are the current and/or archived maps (93%), the text of the drought summary (86%), the links to other tools representing current conditions and outlooks (64%), and the spreadsheets, data, and/or shapefiles (36%). Similar to other climatic and meteorological services, users’ experience and attitude may serve as a baseline for the improvement of products [16]. Due to the fact that familiarity, frequency of using the product, as well as the specific tasks of using the USDM may change over time, it is useful to conduct additional surveys and compare the experience on the USDM with the baseline survey. Despite the caveat, the experience and attitude can also relate to respondents’ value of the USDM.
4.2. Valuation of the US Drought Monitor
After surveying our targeted USDM users at the Bureau of Land Management, we understand whether the USDM is used, how it is used. We further explored qualitative measures of its value, and its potential monetary value since understanding the economic value of the USDM is critical for policy analysis and for decisions on improving the drought monitoring and tracking product. Due to the fact that the USDM is not traded on the market, the value is not reflected in people’s purchase behaviors. It is important to note that there is no standard approach, and the valuation of information may vary by sector. For example, many researchers investigate households’ value of different weather forecasting or meteorological services by asking their willingness to pay for the product [16]. In our particular case, we focus on the value of federal employees within BLM and the avoided cost method works best for our research.
To understand the direct costs associated with drought tracking, we are interested to know current status spending on drought tracking and monitoring. First, we asked respondents whether their agencies pay for climate or drought information. If they answered “Yes”, we followed up with an additional question on how much their agencies spend for the information in an average year. Thus, 11 of the 14 people that regularly use the U.S. Drought Monitor reported that their agencies do not pay for drought information. Among those three whose agencies pay for climate or drought information, all indicated that their agencies spend $3000 or above for this information in an average year. Second, we asked respondents the number of hours per week on average they spend gathering drought-related information currently. Ten people (four state, six district/field) reported that they spend less than one hour per week gathering drought-related information; three respondents (one national, two state) reported that they spend between one and two hours per week; and one respondent (district/field) reported spending three to five hours per week gathering drought-related information.
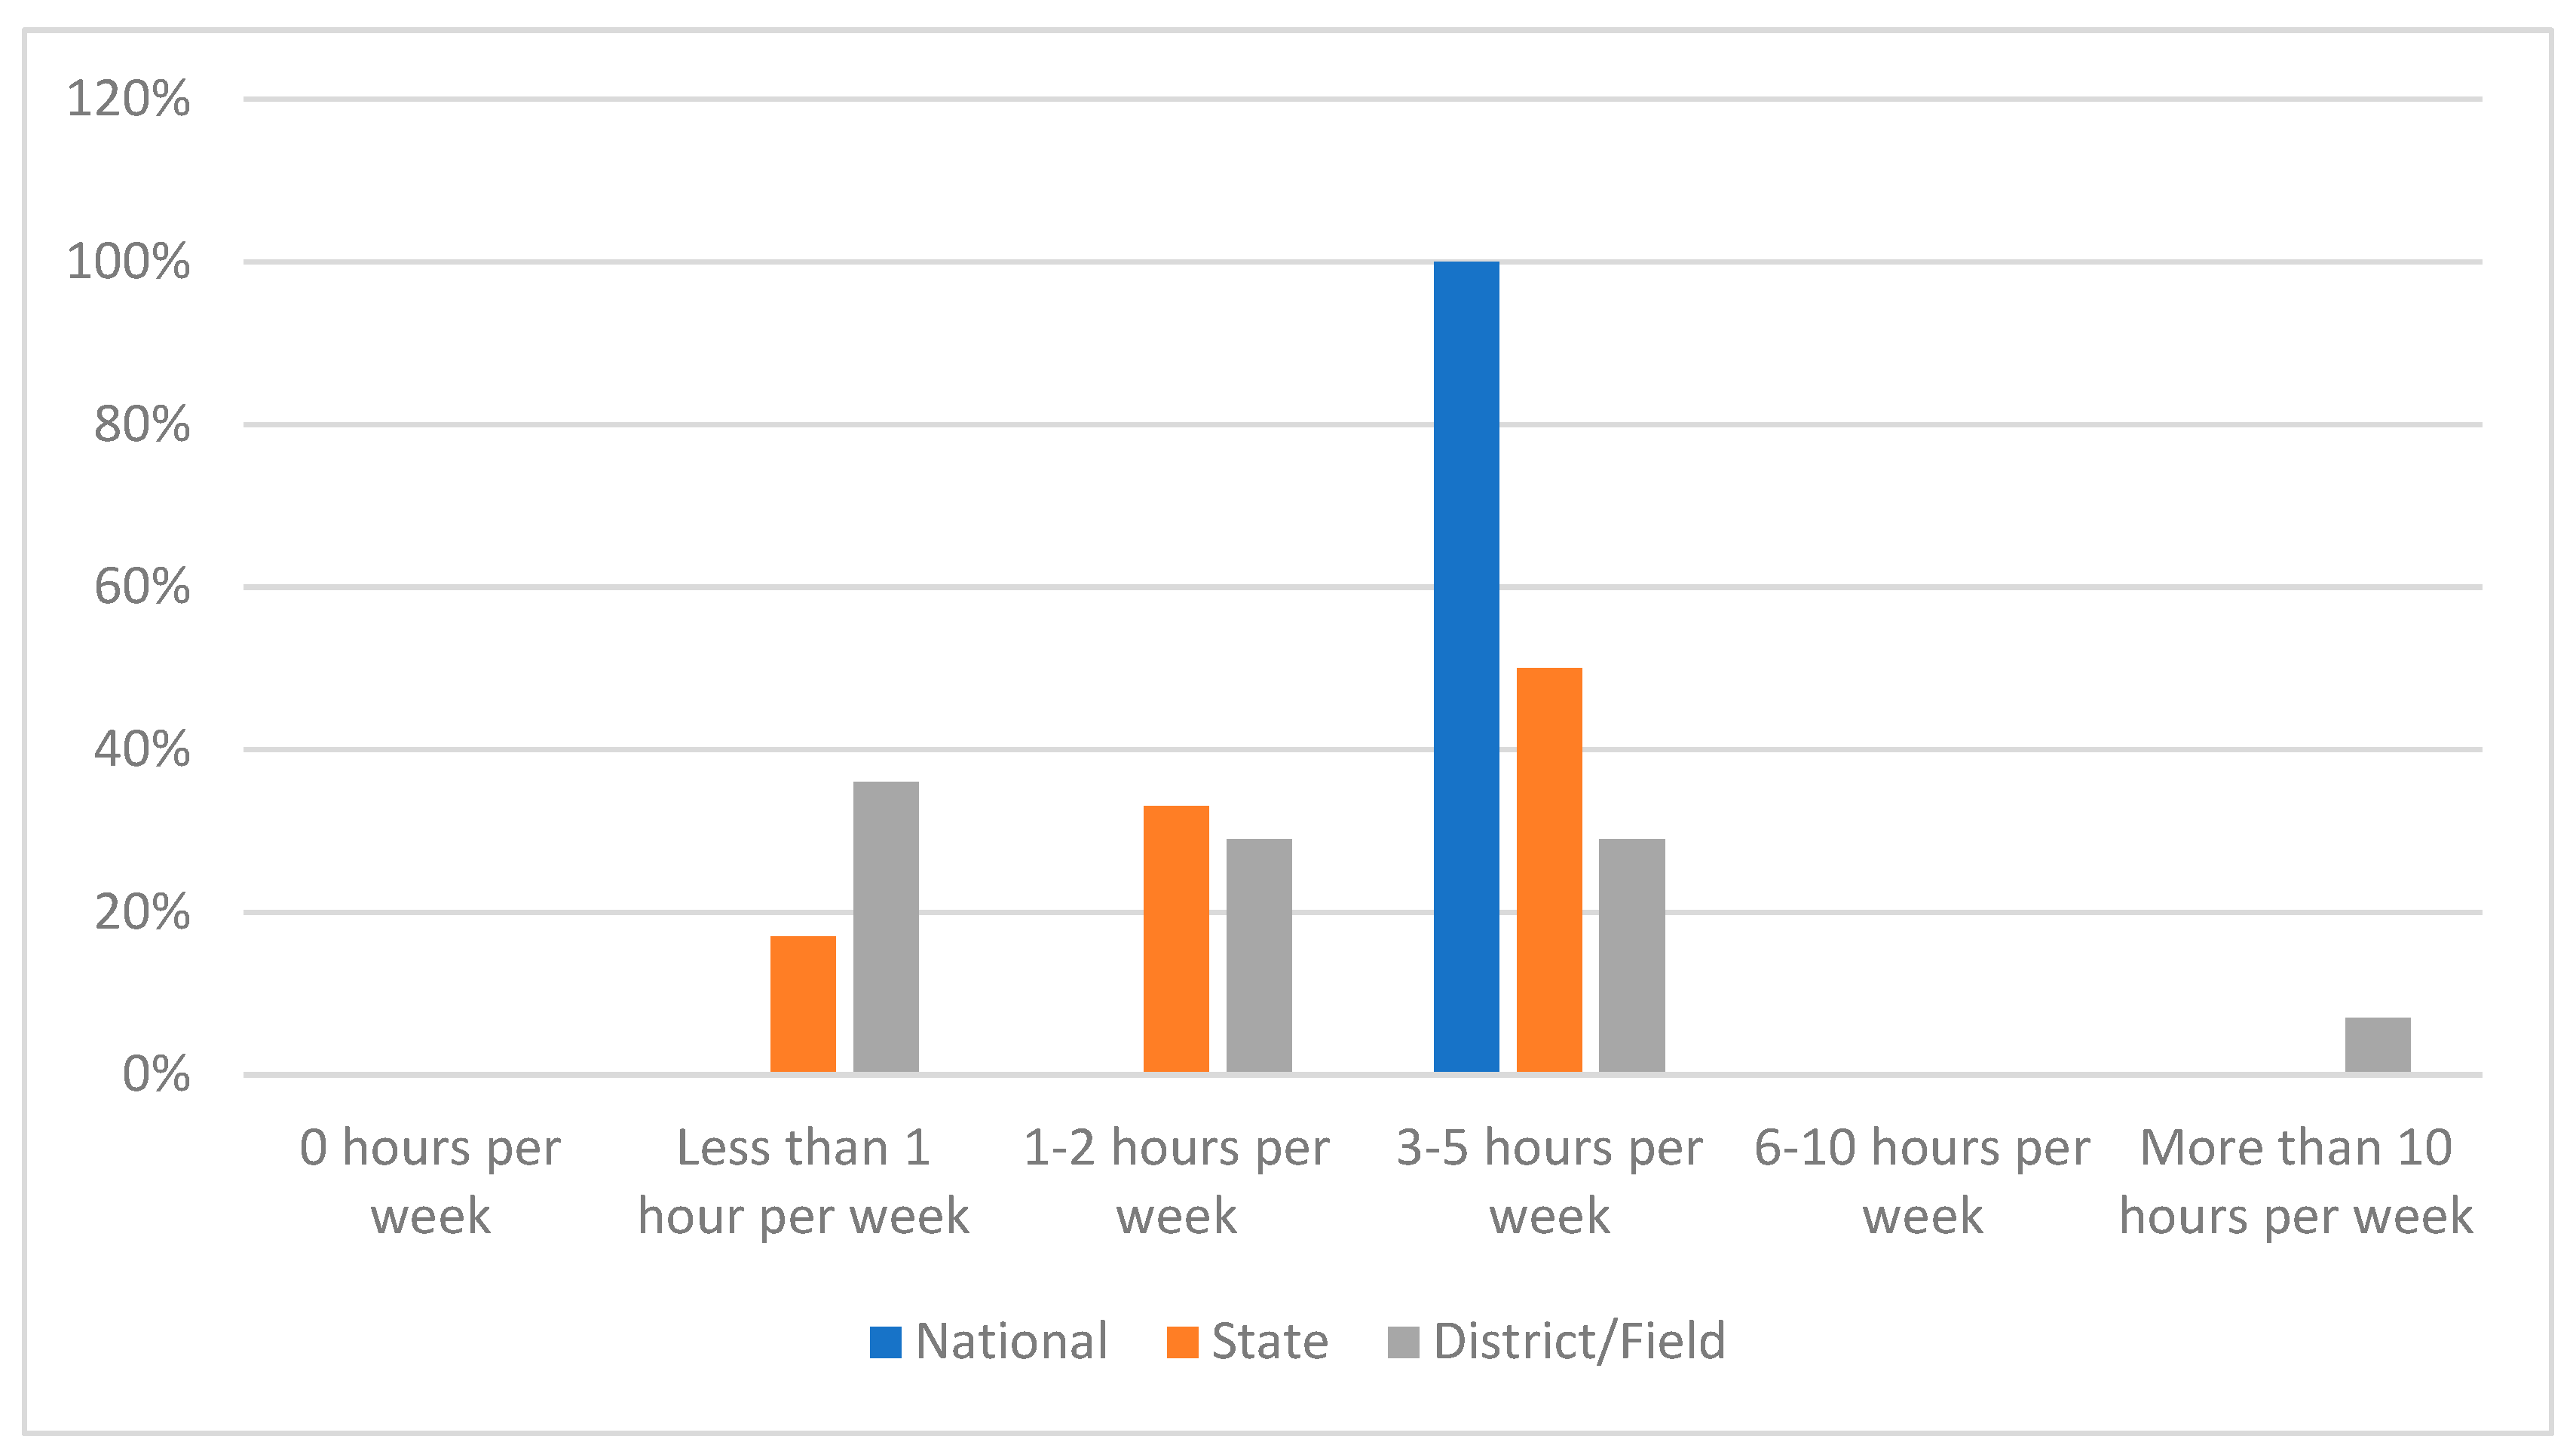
Using the respondents’ current expenditures on drought related information as baseline, we further elicited the hours per week spent gathering and analyzing or mapping drought-related information if the U.S. Drought Monitor were not available. Our hypothesis is that the hours per week spent gathering and analyzing or mapping drought-related information would increase. Among the 10 respondents who stated that they currently spend less than one hour per week or no time gathering drought-related information, five of them would spend more than one hour per week gathering this information if the U.S. Drought Monitor were not available (see Figure A1). Respondents from state offices were likely to increase the time spent per week from 1 h to 2.5 h per person, with an average increase of 1.75 h without the U.S. Drought Monitor. Four respondents from district/field office indicated that they would increase amount of time they spend tracking drought by 1 to 2 h, four said they would increase 3 to 5 h, and one indicated greater 5 h per week. District/field office respondents were likely to increase the time spent per week tracking drought by a minimum of 1.3 h to a maximum of 5.3 h per person, with an average increase of 3.3 h per week without the U.S. Drought Monitor. The respondent from the national office was likely to increase the time spent per week tracking drought by a minimum of 1 h to a maximum of 4 h if the US. Drought Monitor were not available.
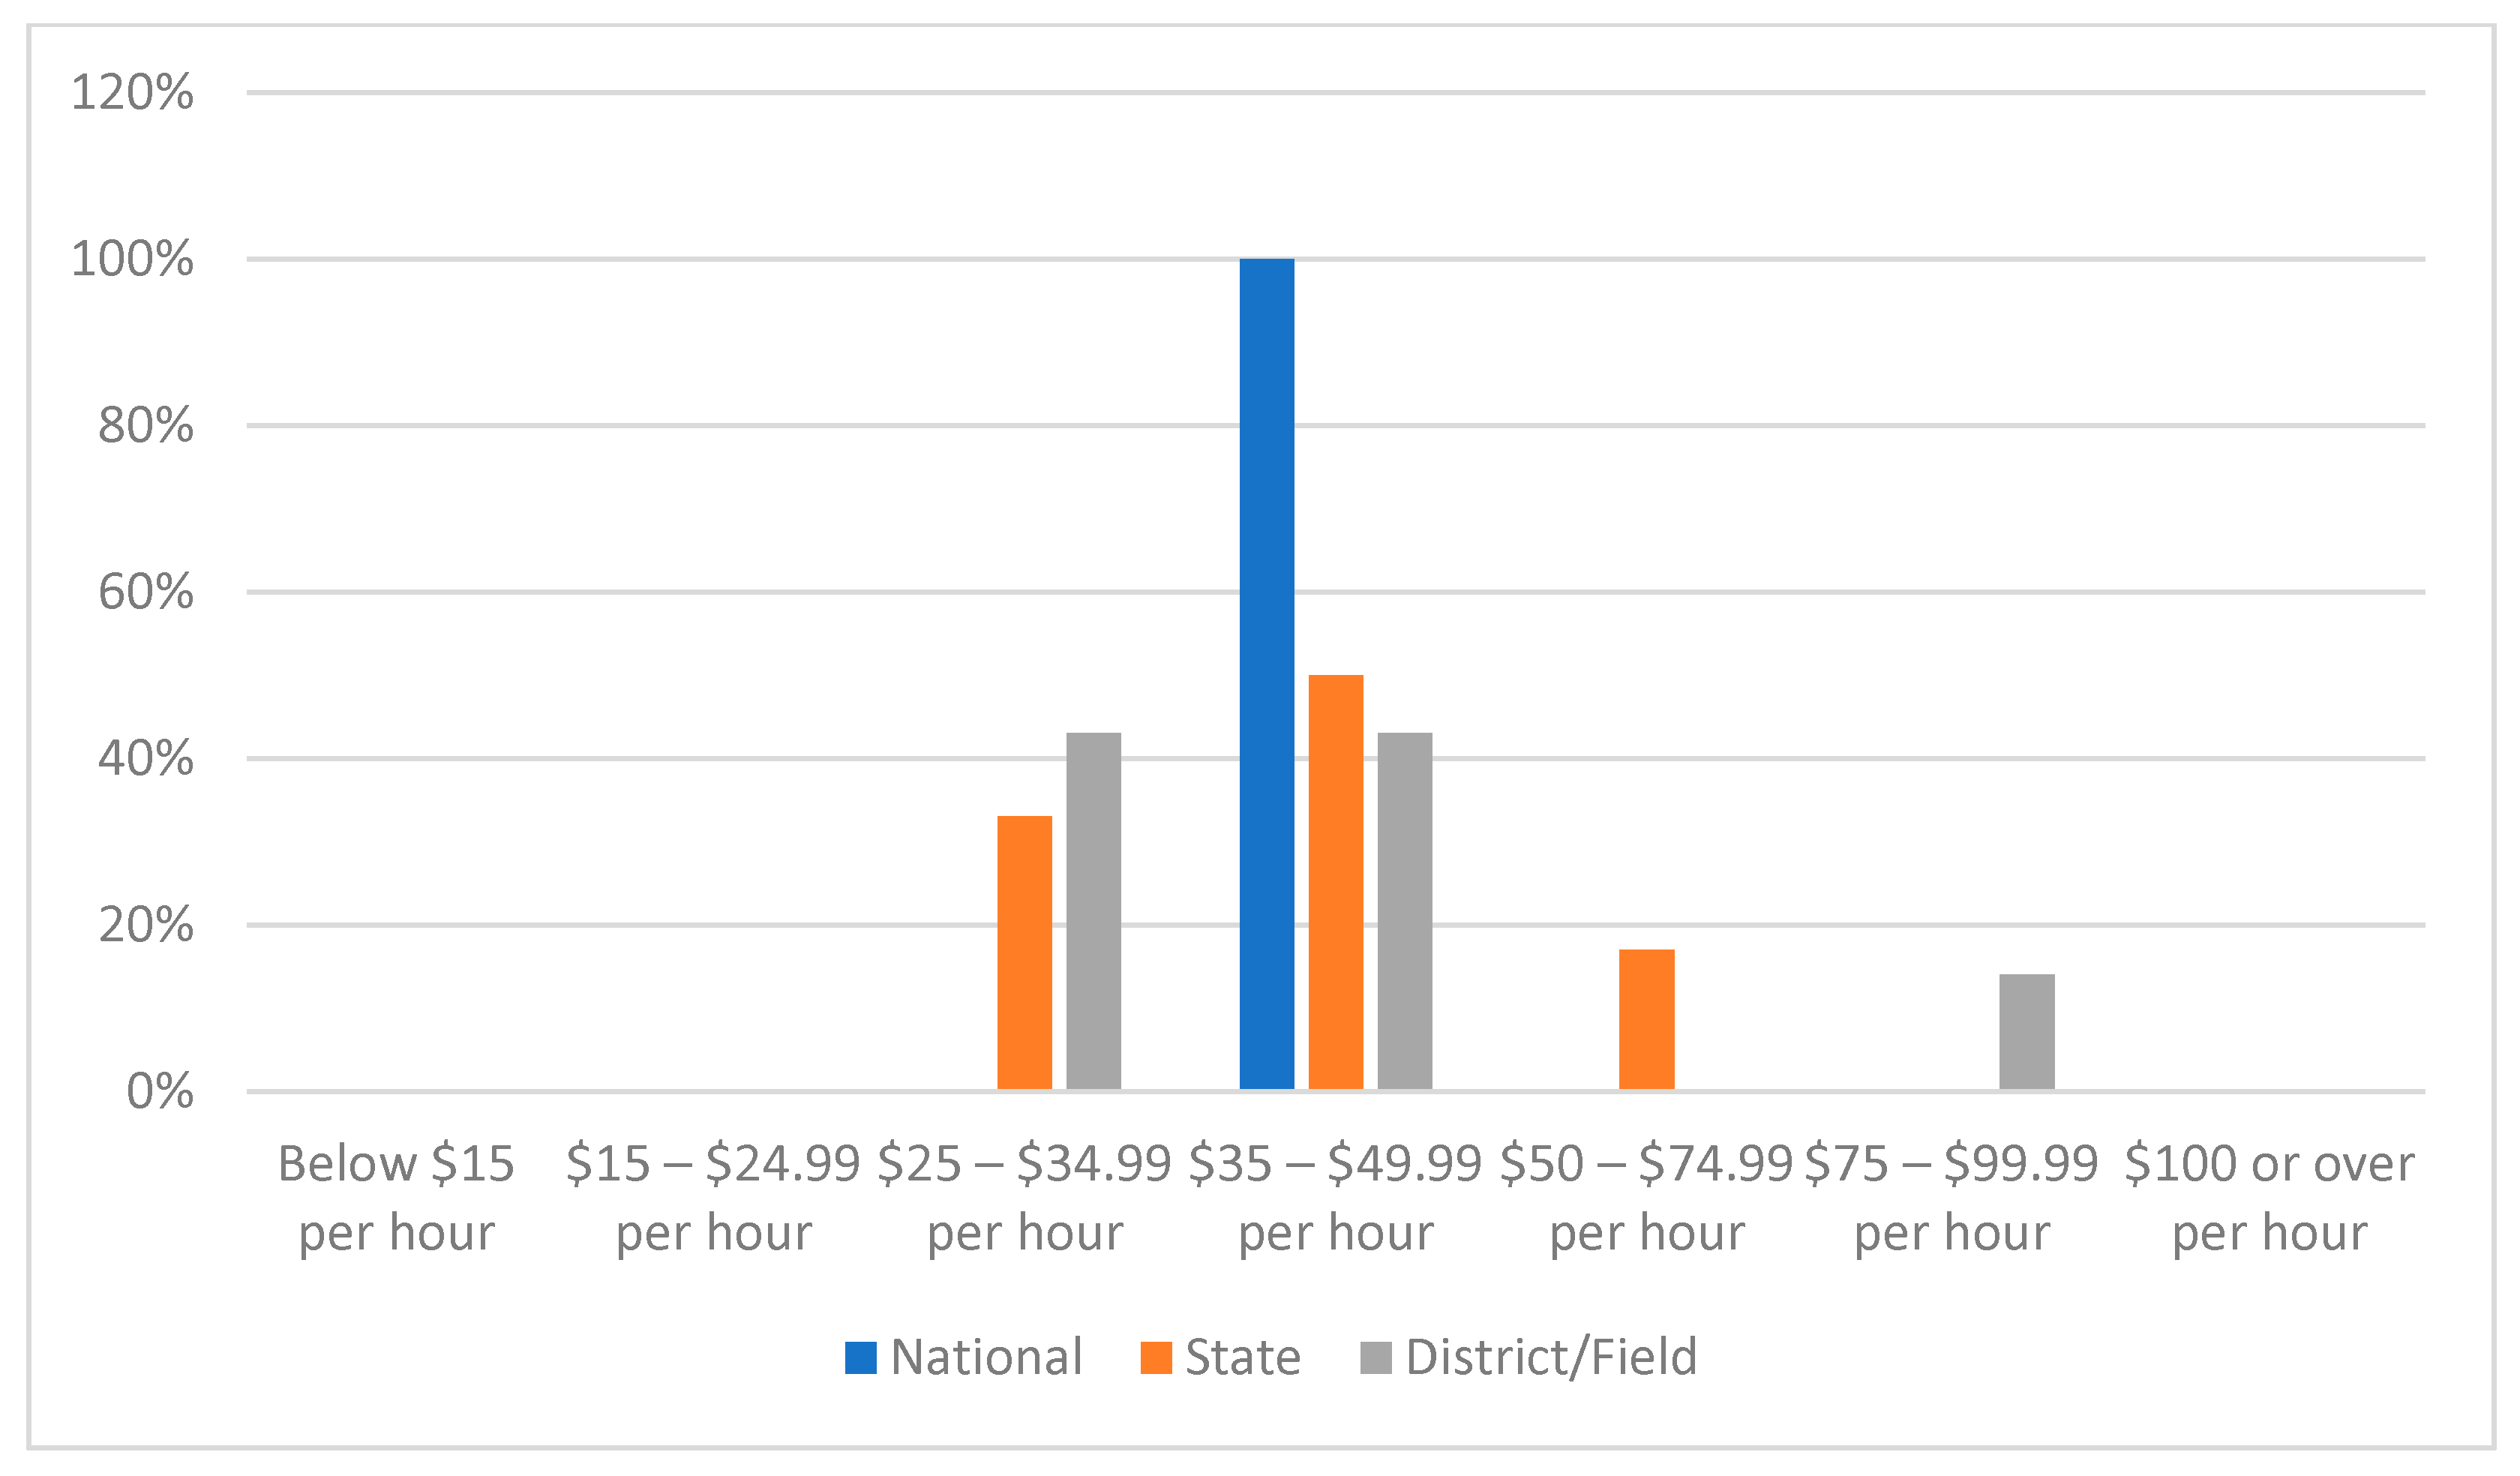
In order to estimate the labor costs avoided gathering drought-related information due to the USDM, we further elicited respondents’ the hourly wage information (Figure A2). The hourly wage for the individuals who access or work with the U.S. Drought Monitor varies from $25 to $100. Based on the limited observations, the weighted average wage rate for state employees who are doing drought-related work is $42, with a lower bound of $25 and an upper bound of $75. The weighted average wage rate for district/field employees who are using the U.S. Drought Monitor is $43, with a lower bound of $25 and an upper bound of $100. Multiplied by the increased hours of labor needed if the U.S. Drought Monitor were not available, the increased cost of labor for a state office employee who is doing drought-related work ranged from $25 to $187.5 per week, with an average of $73.5. For a district/field office employee who is doing drought-related work, the increase ranged from $18 to $530 per week, with an average of $220. For the respondent from national office who is doing drought-related work, the increased cost ranged from $35 to $200 per week, with an average of $106.
After communicating multiple BLM contacts, we made the following assumptions about the number of people per office tracking drought [29,30]. For a district/field office that has less than 10 people, there is only one person tracking or monitoring drought. For district/field offices that have more than 10 people and all the state offices, there are between two and 10 people tracking or monitoring drought. The number of employees at all 63 district/field offices who track or monitor drought is between 124 and 612, with an average of 368. We estimate that the total cost of labor saved for all 12 state offices is between $31,200 and $1,560,000 per year, with an average of $275,184 per year. The total cost of labor saved for all district/field offices is between $111,600 and $16,218,000 per year, with an average of $4,048,000 per year. The ranges are large because of the uncertainty regarding the number of people tracking drought in each office. Since we have very limited observation from the national, we did not estimate the total cost of labor saved at national offices.
Respondents indicated that there would be other costs if the USDM were not available. These costs include items such as purchasing software and hardware, and other maintenance costs (such as purchasing printing supplies, computers, and printers, and network maintenance/repair costs). Some respondents mentioned additional labor costs including collecting data and data quality control and improvement, costs associated with land management decisions, and additional costs such as expanding the current range of products. Based on our survey responses, the potential other costs saved by using the U.S. Drought Monitor varies from $50 or less to $3000 or more in state offices per year. In district and field offices, the potential other costs saved by using U.S. Drought Monitor varies from $600 to $3000 or more per year. The potential other costs for the 12 state offices ranges from to $600 to $28,000 and the potential other costs for 63 district/field offices $7200 to $189,000 per year.
5. Summary
Because of the public nature of climatic and meteorological information, market prices do not exist most of the time. We used the avoided cost method to value the information provided by the U.S. Drought Monitor to the BLM. The avoided cost approach is an indirect approach to estimate the potential costs avoided by using the U.S. Drought Monitor. Compared to other valuation approaches such as stated preference, the avoided cost is less data- and resource-intensive. The avoided cost method can provide a rough indicator of economic value with less time and a smaller budget. Researchers have used the avoided cost method to estimate disasters and damages avoided or reduced in agriculture, transportation, health, power generation, and recreation due to timely and accurate climatic and meteorological information [9,17,31,32]. It is important to note that we only estimate a portion of the full range of costs avoided in BLM by using drought information provided by the U.S. Drought Monitor. Due to data availability and complexity of ecosystem goods and services, we do not include the cost of relocating resources to control wildfires, the avoided environmental damages through preventing wildfires, and avoiding overgrazing by using drought information provided by the U.S. Drought Monitor. The avoided cost in land management is one small portion of value provided by the U.S. Drought Monitor. Other values provided by the U.S. Drought Monitor include potential savings for the disaster relief program in agriculture, sickness cases prevented and lives saved in the public health sector. Hence, the results likely to understate the full range of value provided by the U.S. Drought Monitor. Based on the limited observations from staff and field managers at national, state, and district/field offices in the BLM, we estimate the annual avoided cost of labor per person who tracks or monitors drought, and then estimate the total cost of labor saved for all state offices and district/field offices. While the sample size was small, respondents represented a range of BLM offices, including national offices (including headquarters and predictive services) as well as state offices and district/field offices. About 60 percent of BLM administrative state offices and 30 percent BLM district/field offices were represented in the survey. The avoided cost of labor per year for all BLM state offices and district/field offices alone varies from $0.14 million to $17.78 million with an average of $4.33 million. Compared to the total avoided cost of labor, the other associated costs, such as purchasing software and hardware, additional labor costs, costs associated with land management decisions, avoided by using the U.S. Drought Monitor are trivial. It means that the total avoided cost per year for all BLM state offices and district/field offices alone varies from $0.2 million to $18 million.
Although this study provides preliminary evidence of the values of the information provided by the U.S. Drought Monitor in land management, several caveats must be kept in mind. First, we do not account for all avoided costs using the U.S. Drought Monitor in land management. For example, our estimates exclude the cost of relocating resources to control wildfires and the potential savings from preventing wildfires, the savings from avoiding overgrazing, and related environmental damage by using drought information provided by the U.S. Drought Monitor. Second, our sample size is relatively small and we have limited observations for some of the key questions in our survey.
Despite all the caveats, our approach approximates the partial avoided cost from using the U.S. Drought Monitor. Future studies could take a more general approach to exploring the indirect avoided cost or a more rigorous approach to examine the willingness to pay for the information provided by the U.S. Drought Monitor. Accurate number of BLM staff tracking drought information would help to improve the value of the U.S. Drought Monitor to the BLM. Additional information about how drought data are used and the economic losses avoided by timely information about drought in national, state, local/district offices can be helpful to improve the estimates of value by the U.S. Drought Monitor. Case studies that evaluate the BLM’s management of grazing land, its use of drought information as part of their land management, and ranchers’ use of the information, could help to develop estimates of the potential role and value of the Drought Monitor. A proactive approach to drought mitigation plans can potentially avoid or reduce costs related to wildfire control, overgrazing, and other environmental damage.
Supplementary Materials
The following are available online at https://www.mdpi.com/2073-4441/13/2/112/s1.
Author Contributions
T.L., R.K., T.H., and K.H.S. designed the survey questionnaire; T.L., R.K., and K.H.S. wrote the paper; R.K., T.H., and M.S. provided comments and suggestions on the paper. All authors have read and agreed to the published version of the manuscript.
Funding
This research was funded by the National Oceanic and Atmospheric Administration’s Sectoral Applications Research Program and by the National Integrated Drought Information System, through award number NA19OAR4310402.
Acknowledgments
We thank Deborah Wood for her excellent professional editing.
Conflicts of Interest
The authors declare no conflict of interest.
Appendix A
Figure A1.
Average number of hours per week spent gathering and analyzing or mapping drought related if USDM were not available.
Figure A1.
Average number of hours per week spent gathering and analyzing or mapping drought related if USDM were not available.

Figure A2.
Hourly wage of the individual(s) who access or work with the USDM map and/or data.

References
- Morss, R.E.; Demuth, J.L.; Lazo, J.K.; Dickinson, K.; Lazrus, H.; Morrow, B.H. Understanding Public Hurricane Evacuation Decisions and Responses to Forecast and Warning Messages. Weather Forecast. 2016, 31, 395–417. [Google Scholar] [CrossRef]
- Falloon, P.; Soares, M.B.; Manzanas, R.; San-Martin, D.; Liggins, F.; Taylor, I.; Kahana, R.; Wilding, J.; Jones, C.; Comer, R.; et al. The land management tool: Developing a climate service in Southwest UK. Clim. Serv. 2018, 9, 86–100. [Google Scholar] [CrossRef]
- Wilhite, D.A.; Sivakumar, M.V.; Pulwarty, R. Managing drought risk in a changing climate: The role of national drought policy. Weather Clim. Extrem. 2014, 3, 4–13. [Google Scholar] [CrossRef] [Green Version]
- Liu, T.; Smith, K.H.; Krop, R.; Haigh, T.; Svoboda, M. Critical Analysis of the Value of Drought Information and Impacts on Land Management and Public Health. Water 2020, 12, 1064. [Google Scholar] [CrossRef] [Green Version]
- Chang, H.; Bonnette, M.R. Climate change and water-related ecosystem services: Impacts of drought in California, USA. Ecosyst. Health Sustain. 2016, 2, e01254. [Google Scholar] [CrossRef]
- Covich, A.P. Emerging climate change impacts on freshwater resources. In Perspective on Transformed Watersheds, RFF Report; Resources for the Future: Washington, DC, USA, 2009. [Google Scholar]
- Rosegrant, M.W. Water Resources in the Twenty-First Century: Challenges and Implications for Action; Intl Food Policy Res Inst: Washington, DC, USA, 1997; Volume 20. [Google Scholar]
- Kenkel, P.L.; Norris, P.E. Agricultural producers’ willingness to pay for real-time mesoscale weather information. J. Agric. Resour. Econ. 1995, 20, 356–372. [Google Scholar]
- Sharda, V.; Srivastava, P. Value of ENSO-forecasted drought information for the management of water resources of small to mid-size communities. Trans. ASABE 2016, 59, 1733–1744. [Google Scholar]
- Nguyen, T.C.; Robinson, J. Analysing motives behind willingness to pay for improving early warning services for tropical cyclones in Vietnam. Meteorol. Appl. 2015, 22, 187–197. [Google Scholar] [CrossRef]
- Bernknopf, R.; Brookshire, D.; Kuwayama, Y.; Macauley, M.; Rodell, M.; Thompson, A.; Vail, P.; Zaitchik, B. The value of remotely sensed information: The case of a GRACE-enhanced drought severity index. Weather Clim. Soc. 2018, 10, 187–203. [Google Scholar] [CrossRef]
- Frei, T. Economic and social benefits of meteorology and climatology in Switzerland. Meteorol. Appl. J. Forecast. Pract. Appl. Train. Tech. Model. 2010, 17, 39–44. [Google Scholar] [CrossRef]
- Anaman, K.A.; Lellyett, S.C. Contingent valuation study of the public weather service in the Sydney metropolitan area. Econ. Pap. J. Appl. Econ. Policy 1996, 15, 64–77. [Google Scholar] [CrossRef]
- Rollins, K.S.; Shaykewich, J. Using willingness-to-pay to assess the economic value of weather forecasts for multiple commercial sectors. Meteorol. Appl. J. Forecast. Pract. Appl. Train. Tech. Model. 2003, 10, 31–38. [Google Scholar] [CrossRef] [Green Version]
- Park, S.-Y.; Lim, S.-Y.; Yoo, S.-H. The economic value of the national meteorological service in the Korean household sector: A contingent valuation study. Sustainability 2016, 8, 834. [Google Scholar] [CrossRef] [Green Version]
- Lazo, J.K.; Morss, R.E.; Demuth, J.L. 300 billion served: Sources, perceptions, uses, and values of weather forecasts. Bull. Am. Meteorol. Soc. 2009, 90, 785–798. [Google Scholar] [CrossRef] [Green Version]
- Ebi, K.L.; Teisberg, T.J.; Kalkstein, L.S.; Robinson, L.; Weiher, R.F. Heat watch/warning systems save lives: Estimated costs and benefits for Philadelphia 1995–1998. Bull. Am. Meteorol. Soc. 2004, 85, 1067–1074. [Google Scholar] [CrossRef] [Green Version]
- Svoboda, M.; LeComte, D.; Hayes, M.; Heim, R.; Gleason, K.; Angel, J.; Rippey, B.; Tinker, R.; Palecki, M.; Stooksbury, D. The drought monitor. Bull. Am. Meteorol. Soc. 2002, 83, 1181–1190. [Google Scholar] [CrossRef] [Green Version]
- Berman, J.D.; Ebisu, K.; Peng, R.D.; Dominici, F.; Bell, M.L. Drought and the risk of hospital admissions and mortality in older adults in western USA from 2000 to 2013: A retrospective study. Lancet Planet. Health 2017, 1, e17–e25. [Google Scholar] [CrossRef]
- Kuwayama, Y.; Thompson, A.; Bernknopf, R.; Zaitchik, B.; Vail, P. Estimating the impact of drought on agriculture using the US Drought Monitor. Am. J. Agric. Econ. 2019, 101, 193–210. [Google Scholar] [CrossRef]
- BLM. Public Land Statistics. 2017. Available online: https://www.blm.gov/sites/blm.gov/.filesPublicLandStatistics2017.pdf (accessed on 1 May 2019).
- Congressional Research Service. Grazing Fees: Overview and Issues. 2016. Available online: https://www.everycrsreport.com/files/20160929_RS21232_b52e04ea00b91486680436e52e5795fea1044398.pdf (accessed on 1 May 2018).
- Anderegg, W.R.; Kane, J.M.; Anderegg, L.D. Consequences of widespread tree mortality triggered by drought and temperature stress. Nat. Clim. Chang. 2013, 3, 30–36. [Google Scholar] [CrossRef]
- Logar, I.; van den Bergh, J.C. Methods to assess costs of drought damages and policies for drought mitigation and adaptation: Review and recommendations. Water Resour. Manag. 2013, 27, 1707–1720. [Google Scholar] [CrossRef]
- Presser, S.; Rothgeb, J.M.; Couper, M.P.; Lessler, J.T.; Martin, E.; Martin, J.; Singer, E. Methods for testing and evaluating survey questionnaires. Public Opin. Q. 2004, 68, 109–130. [Google Scholar] [CrossRef] [Green Version]
- Dillman, D.A.; Tortora, R.D.; Bowker, D. Principles for constructing web surveys. In Proceedings of the Joint Meetings of the American Statistical Association, Storrs, CT, USA, 9–13 August 1998; Volume 64, pp. 1–16. [Google Scholar]
- Tuten, T.L.; Urban, D.J.; Bosnjak, M. Internet surveys and data quality: A review. Online Soc. Sci. 2002, 1, 7–26. [Google Scholar]
- Ding, Y.; Hayes, M.J.; Widhalm, M. Measuring economic impacts of drought: A review and discussion. Disaster Prev. Manag. Int. J. 2011, 20, 434–446. [Google Scholar] [CrossRef] [Green Version]
- Davis, S.; Senior Soil Scientist, Denver Federal Center BLM, Denver, CO, USA. Regarding the Number of Staff Working with Drought and Climate Monitoring. Personal communication, 2019. [Google Scholar]
- Rademacher, J.; Supervisory NRS, Vale District/ Baker Resource Area, Baker City, OR, USA. Regarding the Number of Staff Working with Drought and Climate Monitoring. Personal communication, 2019. [Google Scholar]
- Kite-Powell, H.L. Estimating Economic Benefits from NOAA PORTS®Installations: A Value of Information Approach; NOAA: Silver Spring, MD, USA, 2005; Volume 32. [Google Scholar]
- Von Gruenigen, S.; Willemse, S.; Frei, T. Economic value of meteorological services to Switzerland’s airlines: The case of TAF at Zurich Airport. Weather Clim. Soc. 2014, 6, 264–272. [Google Scholar] [CrossRef]
Figure 1.
Drought related issues that respondents’ offices deal with.

Figure 2.
Responses on the quality of information provided by the USDM (n = 13).

Publisher’s Note: MDPI stays neutral with regard to jurisdictional claims in published maps and institutional affiliations. |
© 2021 by the authors. Licensee MDPI, Basel, Switzerland. This article is an open access article distributed under the terms and conditions of the Creative Commons Attribution (CC BY) license (http://creativecommons.org/licenses/by/4.0/).
Share and Cite
MDPI and ACS Style
Liu, T.; Krop, R.; Haigh, T.; Smith, K.H.; Svoboda, M. Valuation of Drought Information: Understanding the Value of the US Drought Monitor in Land Management. Water 2021, 13, 112. https://doi.org/10.3390/w13020112
AMA Style
Liu T, Krop R, Haigh T, Smith KH, Svoboda M. Valuation of Drought Information: Understanding the Value of the US Drought Monitor in Land Management. Water. 2021; 13(2):112. https://doi.org/10.3390/w13020112
Chicago/Turabian StyleLiu, Tingting, Richard Krop, Tonya Haigh, Kelly Helm Smith, and Mark Svoboda. 2021. "Valuation of Drought Information: Understanding the Value of the US Drought Monitor in Land Management" Water 13, no. 2: 112. https://doi.org/10.3390/w13020112
Note that from the first issue of 2016, this journal uses article numbers instead of page numbers. See further details here.