Article

Integrated Low-Cost Approach for Measuring the State of Conservation of Agricultural Terraces in Tuscany, Italy

1
Dipartimento di Scienze e Tecnologie Agrarie, Alimentari Ambientali e Forestali, Università degli Studi di Firenze, 50121 Firenze, Italy
2
CNR-IBE—Consiglio Nazionale della Ricerca, Istituto di BioEconomia, 50019 Florence, Italy
3
Bluebiloba Startup Innovativa SRL, 50126 Florence, Italy
4
LaMMA Consortium, 50019 Florence, Italy
5
Laboratorio Congiunto ForTech, 50145 Florence, Italy
*
Authors to whom correspondence should be addressed.
Water 2021, 13(2), 113; https://doi.org/10.3390/w13020113
Submission received: 18 November 2020 / Revised: 24 December 2020 / Accepted: 29 December 2020 / Published: 6 January 2021
(This article belongs to the Special Issue Terraced Landscapes and Hydrological-Geological Hazards)

Abstract

:
Agricultural terraces are an important element of the Italian landscape. However, abandonment of agricultural areas and increase in the frequency of destructive rainfall events has made it mandatory to increase conservation efforts of terraces to reduce hydrological risks. This requires the development of new approaches capable of identifying and mapping failed or prone-to-fail terraces over large areas. The present work focuses on the development of a more cost-effective alternative, to help public administrators and private land owners to identify fragile areas that may be subject to failure due to the abandonment of terracing systems. We developed a simple field protocol to acquire quantitative measurements of the degree of damage—dry stone wall deformation—and establish a damage classification system. This new methodology is tested at two different sites in Tuscany, central Italy. The processing is based on existing DTMs derived from Airborne Laser Scanner (ALS) data and open source software. The main GIS modules adopted are flow accumulation and water discharge, processed with GRASS GIS. Results show that the damage degree and terrace wall deformation are correlated with flow accumulation even if other factors other than those analyzed can contribute to influence the instability of dry stone walls. These tools are useful for local land management and conservation efforts.

1. Introduction

The difficult morphology of mountainous and hilly areas often hindered land cultivation and forced local communities to re-shape the land in a way that would facilitate its agricultural use [1,2]. Historically, the creation of terraces has been considered the most efficient way to allow agriculture and forestry in mountainous and hilly regions all over the world [3,4]. Terraces have allowed for the cultivation of a wider variety of crops, thereby increasing not only the productive areas, but also the quality of landscapes [2,3,5]. As a result, terraces are now a ubiquitous feature in many mountainous regions all over the world [3,5,6,7,8,9,10] and have been recognized as a distinct element of a region’s cultural identity and heritage because they form important landscape elements and characterize a territory due to their particular design [3,5,11,12]. Even within the same country and if the intent was to cultivate the same crop, it is often possible to find terraces that are designed in very different manners, e.g., different height, using different types and sizes of stones, and with different arrangements for water regulation [1,3,13,14,15]. In Tuscany, the terraced vineyards and olive groves are a cultural landmark that is recognized by locals and foreign visitors alike [1,3,16]. These terraces in Tuscany were built using local stones to an average height of 1.43m +/− 0.54 (one standard deviation) with a total range from 0.5 and 3.31 m [17].
In the past, terracing systems not only increased the amount of arable land, but also contributed to help stabilize the slopes by preventing erosion due to surface flow. Furthermore, they help to control the drainage of rainwater, maintain soil moisture, and increase overall water retention [2,11]. The state of conservation of a dry-stone wall depends on its ability to maintain its hydrological functionality over time and preserve the morphology of the terraced slope by protecting the almost vertical earth walls [18]. In Italy, these mountainous agricultural areas were increasingly abandoned, starting in the 1940s, which caused a deterioration in the state of conservation of many terracing systems [1,3,19], in turn resulting in hydrological problems due to uncontrolled runoff [1,2,14,19,20,21,22,23,24], and increasing soil erosion and nutrient loss [23,24,25,26]. Abandoned terraces will cease to perform their hydrological function once the drainage capacity of stone wall becomes lower than the influx of water, e.g., during severe rainfall events [1,2,14,19,20,21,22].
In Italy, the magnitude and frequency of severe rainfall events has increased over the past years, mostly caused by climate changes [27,28,29]. As a result, the conservation of terracing systems toreduce hydrological risk should be mandatory [4,8,10,14,30]. With severe weather events increasing, similar projects of terraces restoration (and their efficiency in hydraulic control) are being conducted in many parts of the world [3,31]. The justification for these projects is usually twofold: (i) to preserve historical agriculture systems, and (ii) to control water runoff and reduce erosion [32,33]. One major challenge for these restoration activities is the accurate large scale mapping and identification of terraces and their level of stability/damage. New approaches and instruments need to be developed in order to efficiently investigate the status of terraces and reliably identify areas where these systems are compromised, or where intense meteorological events could lead to severe damages [1,8,14,30].
Several studies have demonstrated that remote sensing (RS) data can be useful to map terrace stability [34,35,36,37,38]. More specifically, active remote sensing data acquired with a Terrestrial Laser Scanner (TLS) can yield high resolution topography models such as digital terrain models (DTMs) that are effective for monitoring the capabilities of terracing systems in hydraulic regulation [34,36,39]. These high resolution DTMs have been shown to provide useful topographic layers for mapping the main surface processes such as water regulation in terraced systems [35,39,40,41,42,43]. For example, Preti et al. [44] demonstrated that a high resolution DTM derived by TLS was useful to monitor and estimate erosive processes and surface runoff. However, all these studies analyzed differences in micromorphology [41,45,46,47,48], which is very useful for understanding the degradation mechanisms and remediation techniques in specific contexts, but unsuitable for monitoring large areas. Moreover, the costs of TLS instrumentation and data acquisition are often beyond the financial means of many local terracing restoration programs. For that reason, it should be mandatory, to developed new monitoring systems of terracing using less expensive DTM to derive information on the potentially damaged sites over large areas. In this study, we exclusively use open access data and software to develop a low cost approach for use by public administrations and private land owners to identify potential high risk areas. A BlackBox approach was used to provide simple tools for rough damaged sites identification.
The aims of the present work can be summarized as follows:
  • proposition of a methodology for assessing the state of conservation of dry-wall terraces across large agricultural areas in Tuscany;
  • identify the morphological factors most correlated (and easily implemented by a public administrators) to the instability of dry stone walls.
  • The novelty of this work concerns the application of the methodology based on openacces data, useful to improve territorial planning by public bodies. By acquiring indicators related to the conservation state of terraced systems, there can be developed a rough classification for territories in the thousands of km2.

2. Materials and Methods
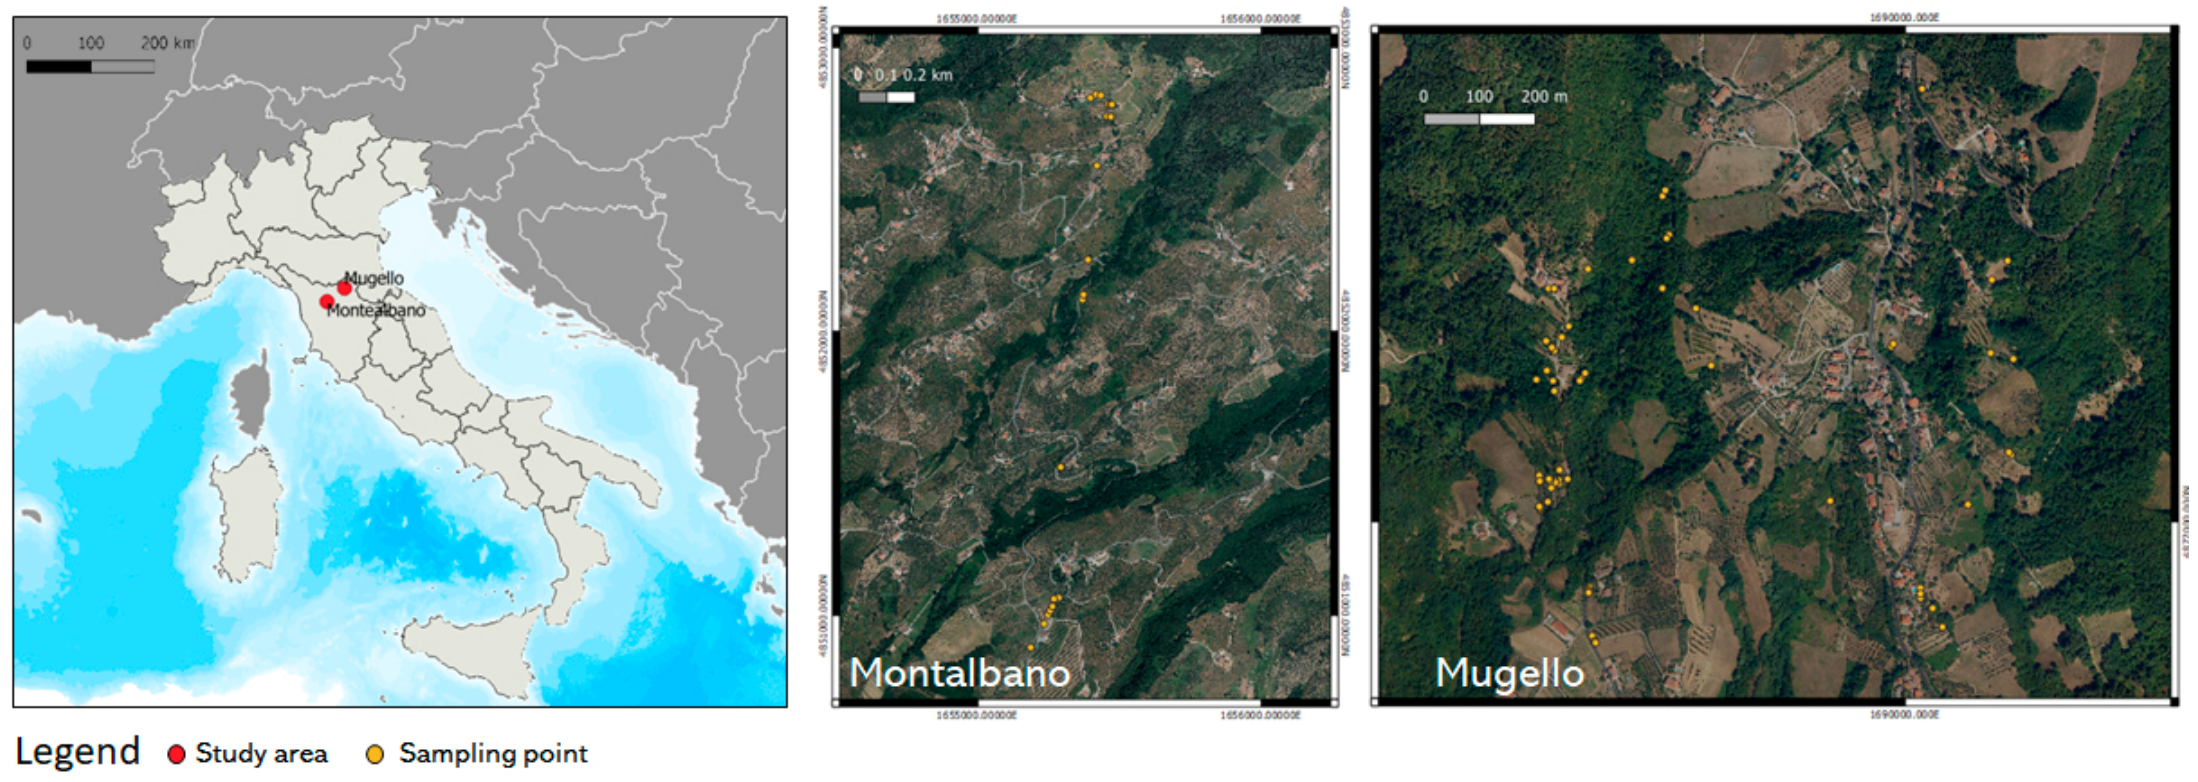
2.1. Study Areas

This research is focused on dry-stone walls used for terraced hills and mountains agriculture lands in Tuscany. The terraces included in our study were chosen using pre-existing 1 × 1 m Regional LiDAR DTMs.
Using regional maps of existing dry-stone walls and LiDAR maps of the Tuscany region, we decided to focus on two areas that were chosen based on their accessibility and distance from our research center: Mugello (Ponzalla, Scaperia e San Piero, Florence–Centroid: 44.021689, 11.367784) and Montalbano (Tigliano, Vinci, Florence–Centroid: 43.804681, 10.930273) (Figure 1).
The Montalbano area has 40 hectares and 223 dry-stone wall linear elements with an equivalent density of 220 m/ha. Out of the total of 223 linear elements, 23 were randomly chosen for inclusion in our survey. The Mugello area covers about 70 hectares with 192 linear elements (45 m/ha). However, only 110 out of 192 elements were accessible as the remaining number were on private land enclosed by fences. Both study areas have a comparable mean slopes: 18.11° in Montalbano and 18.76° in Mugello. Linear elements length were measured on regional technical charts containing dry-stone wall locations. Wall density and slope were than calculated using DTMs.

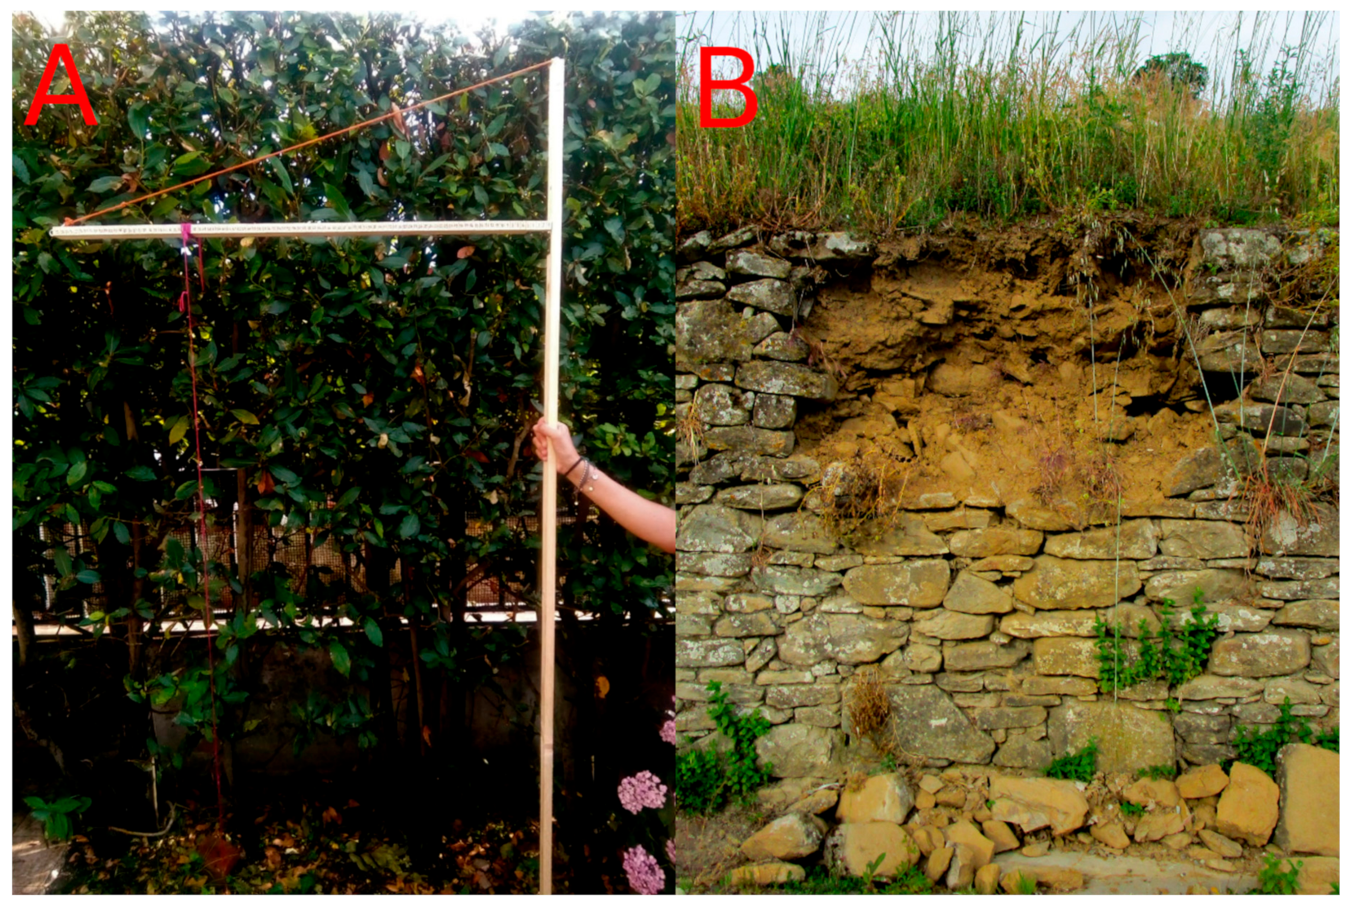
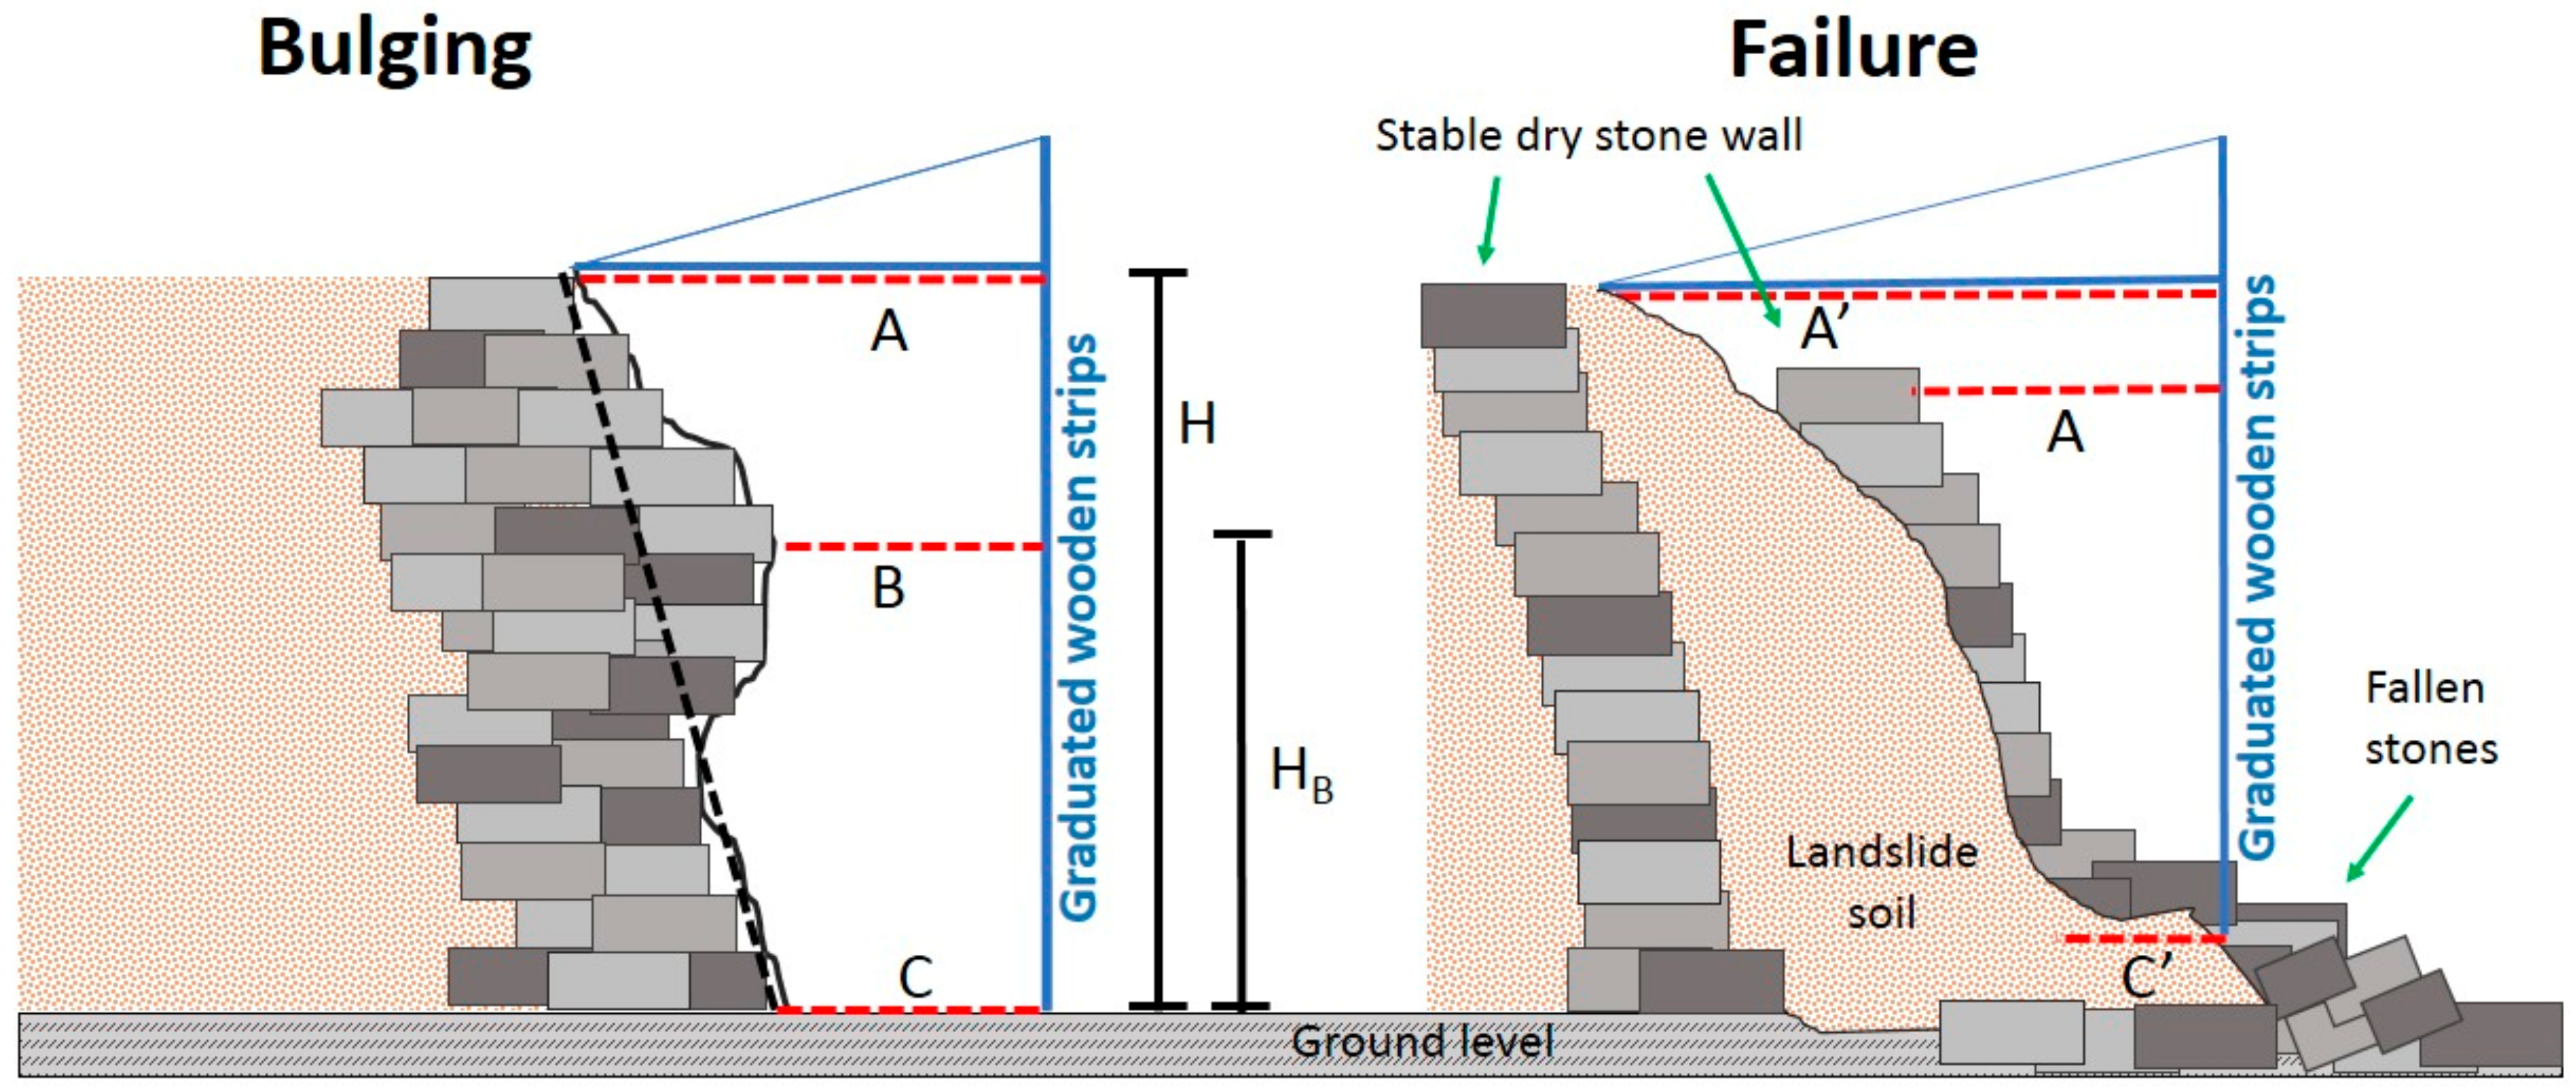
2.2. Field Surveys and Damage Classification Scale System

The surveys were carried out using two approaches: (i) subjective field classification of conservation status using a specifically designed classification scheme (see below), and (ii) objective measurements of dry-stone wall deformation. The classification and deformation measurements were acquired using a smartphone equipped with the “Geopaparazzi” app [49], which allows the user to take georeferenced photographs with accompanying text notes that can be easily imported into GIS software. In the Mugello area both methods were used in parallel, while in Montalbano we only used the subjective classification.
Specifically for this study, we developed a damage classification scale (Table 1, Appendix A) that allows us to quantify the damage class based on subjective observations. To remove possible observation bias in the field, four experts independently validated the field assessment by means of the acquired geo-referenced photos.
To accompany our subjective damage scale assessment with a more quantitative measure of the damage, we also determined the amount of deformation using purpose-built instruments that are easy to replicate (Figure 2A). The surveys were carried out in a subsample of wall locations for each damage class only in the Mugello area.
The purpose-built instrument (Figure 2A) measures the orthogonal distance between the deformed portion and the original wall (Figure 3).
The deformations due to bulging (Db) and failure (Df) can be calculated using the following equations (see Figure 3):
D b = ( A s H H B B H
where
s = A C H
and
D f = A C H
In the Mugello area, a total of 110 sampling points were acquired for subjective damage classification. In addition, we acquired 37 objective deformation measures. In Montalbano, a total of 23 sampling points were acquired for damage classification.
No other measurements (granulometry, hydraulic conductivity, ecc.) were performed to avoid spatial variability in large area analysis that would involve large time consuming and high costs.

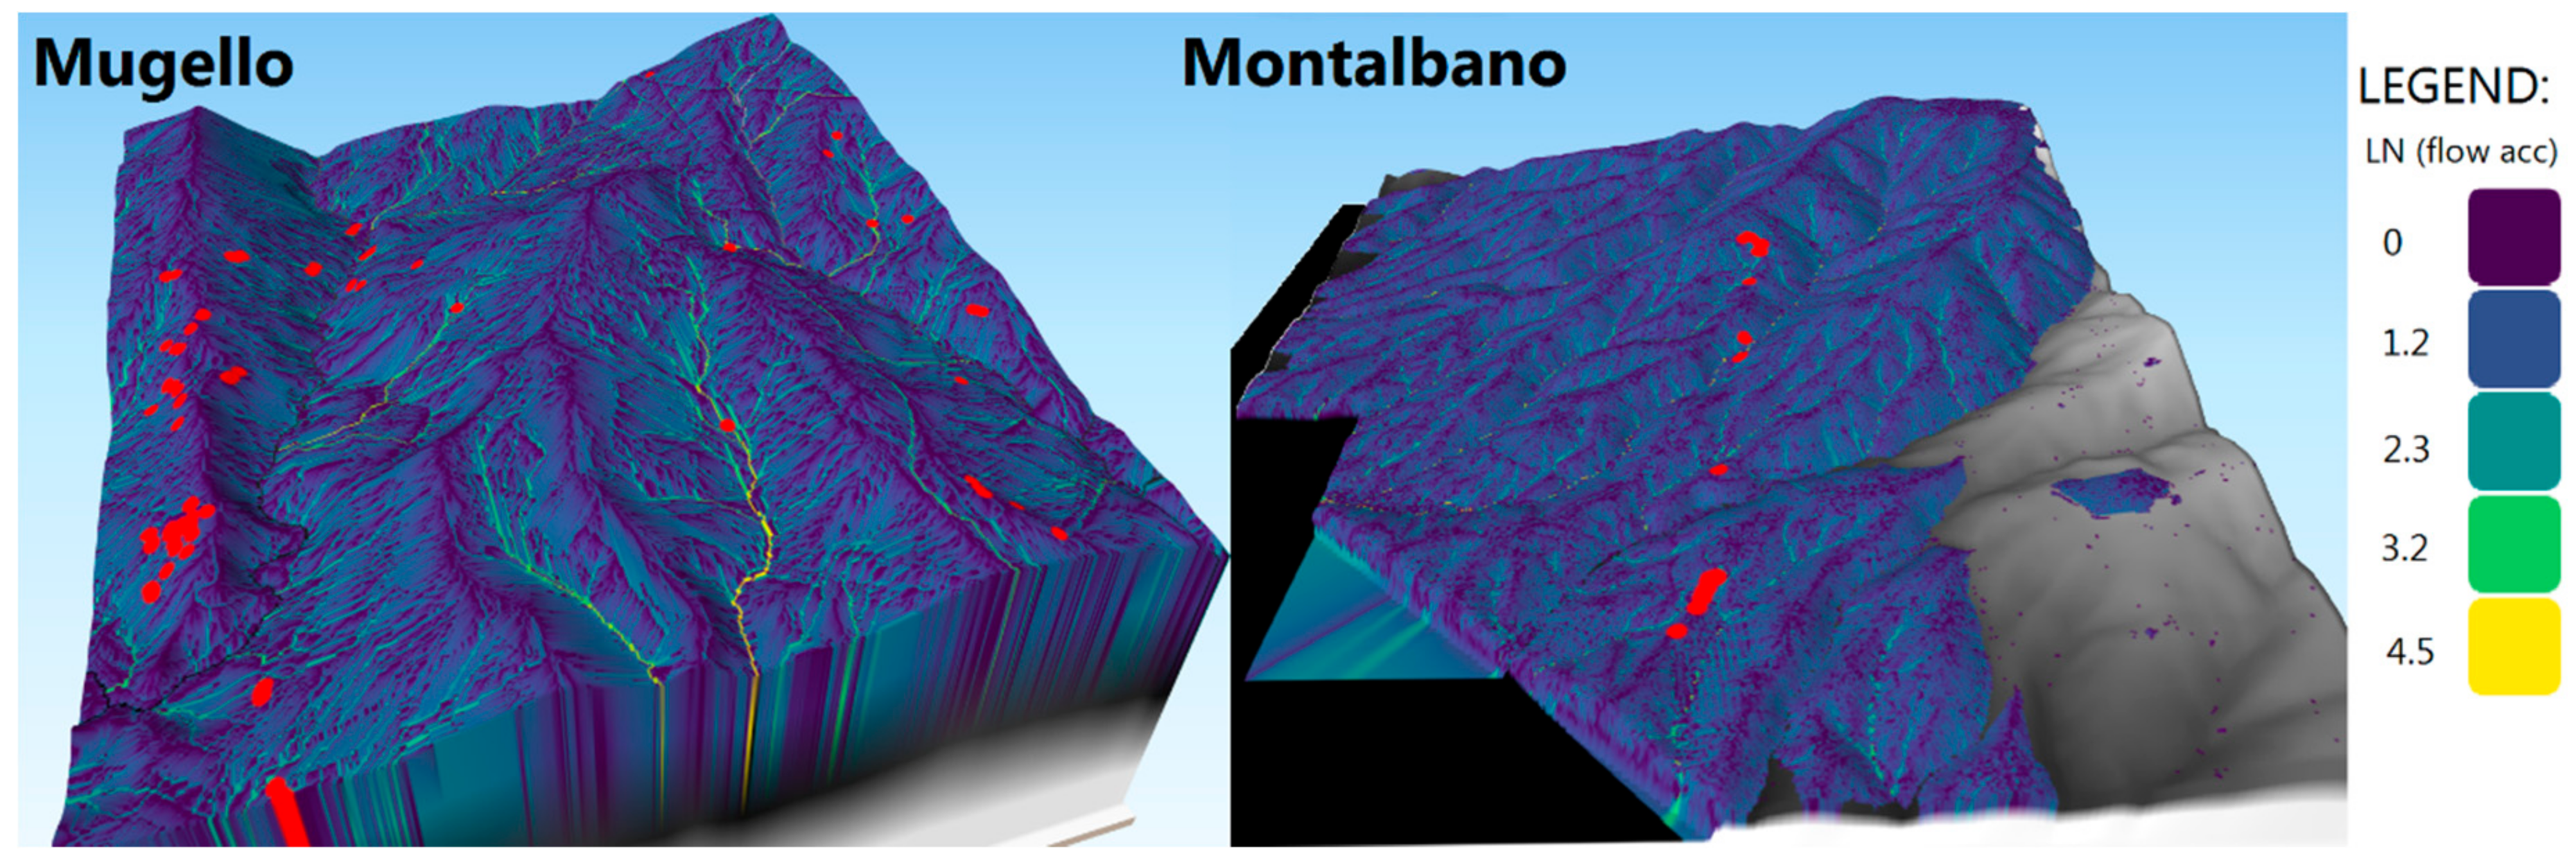
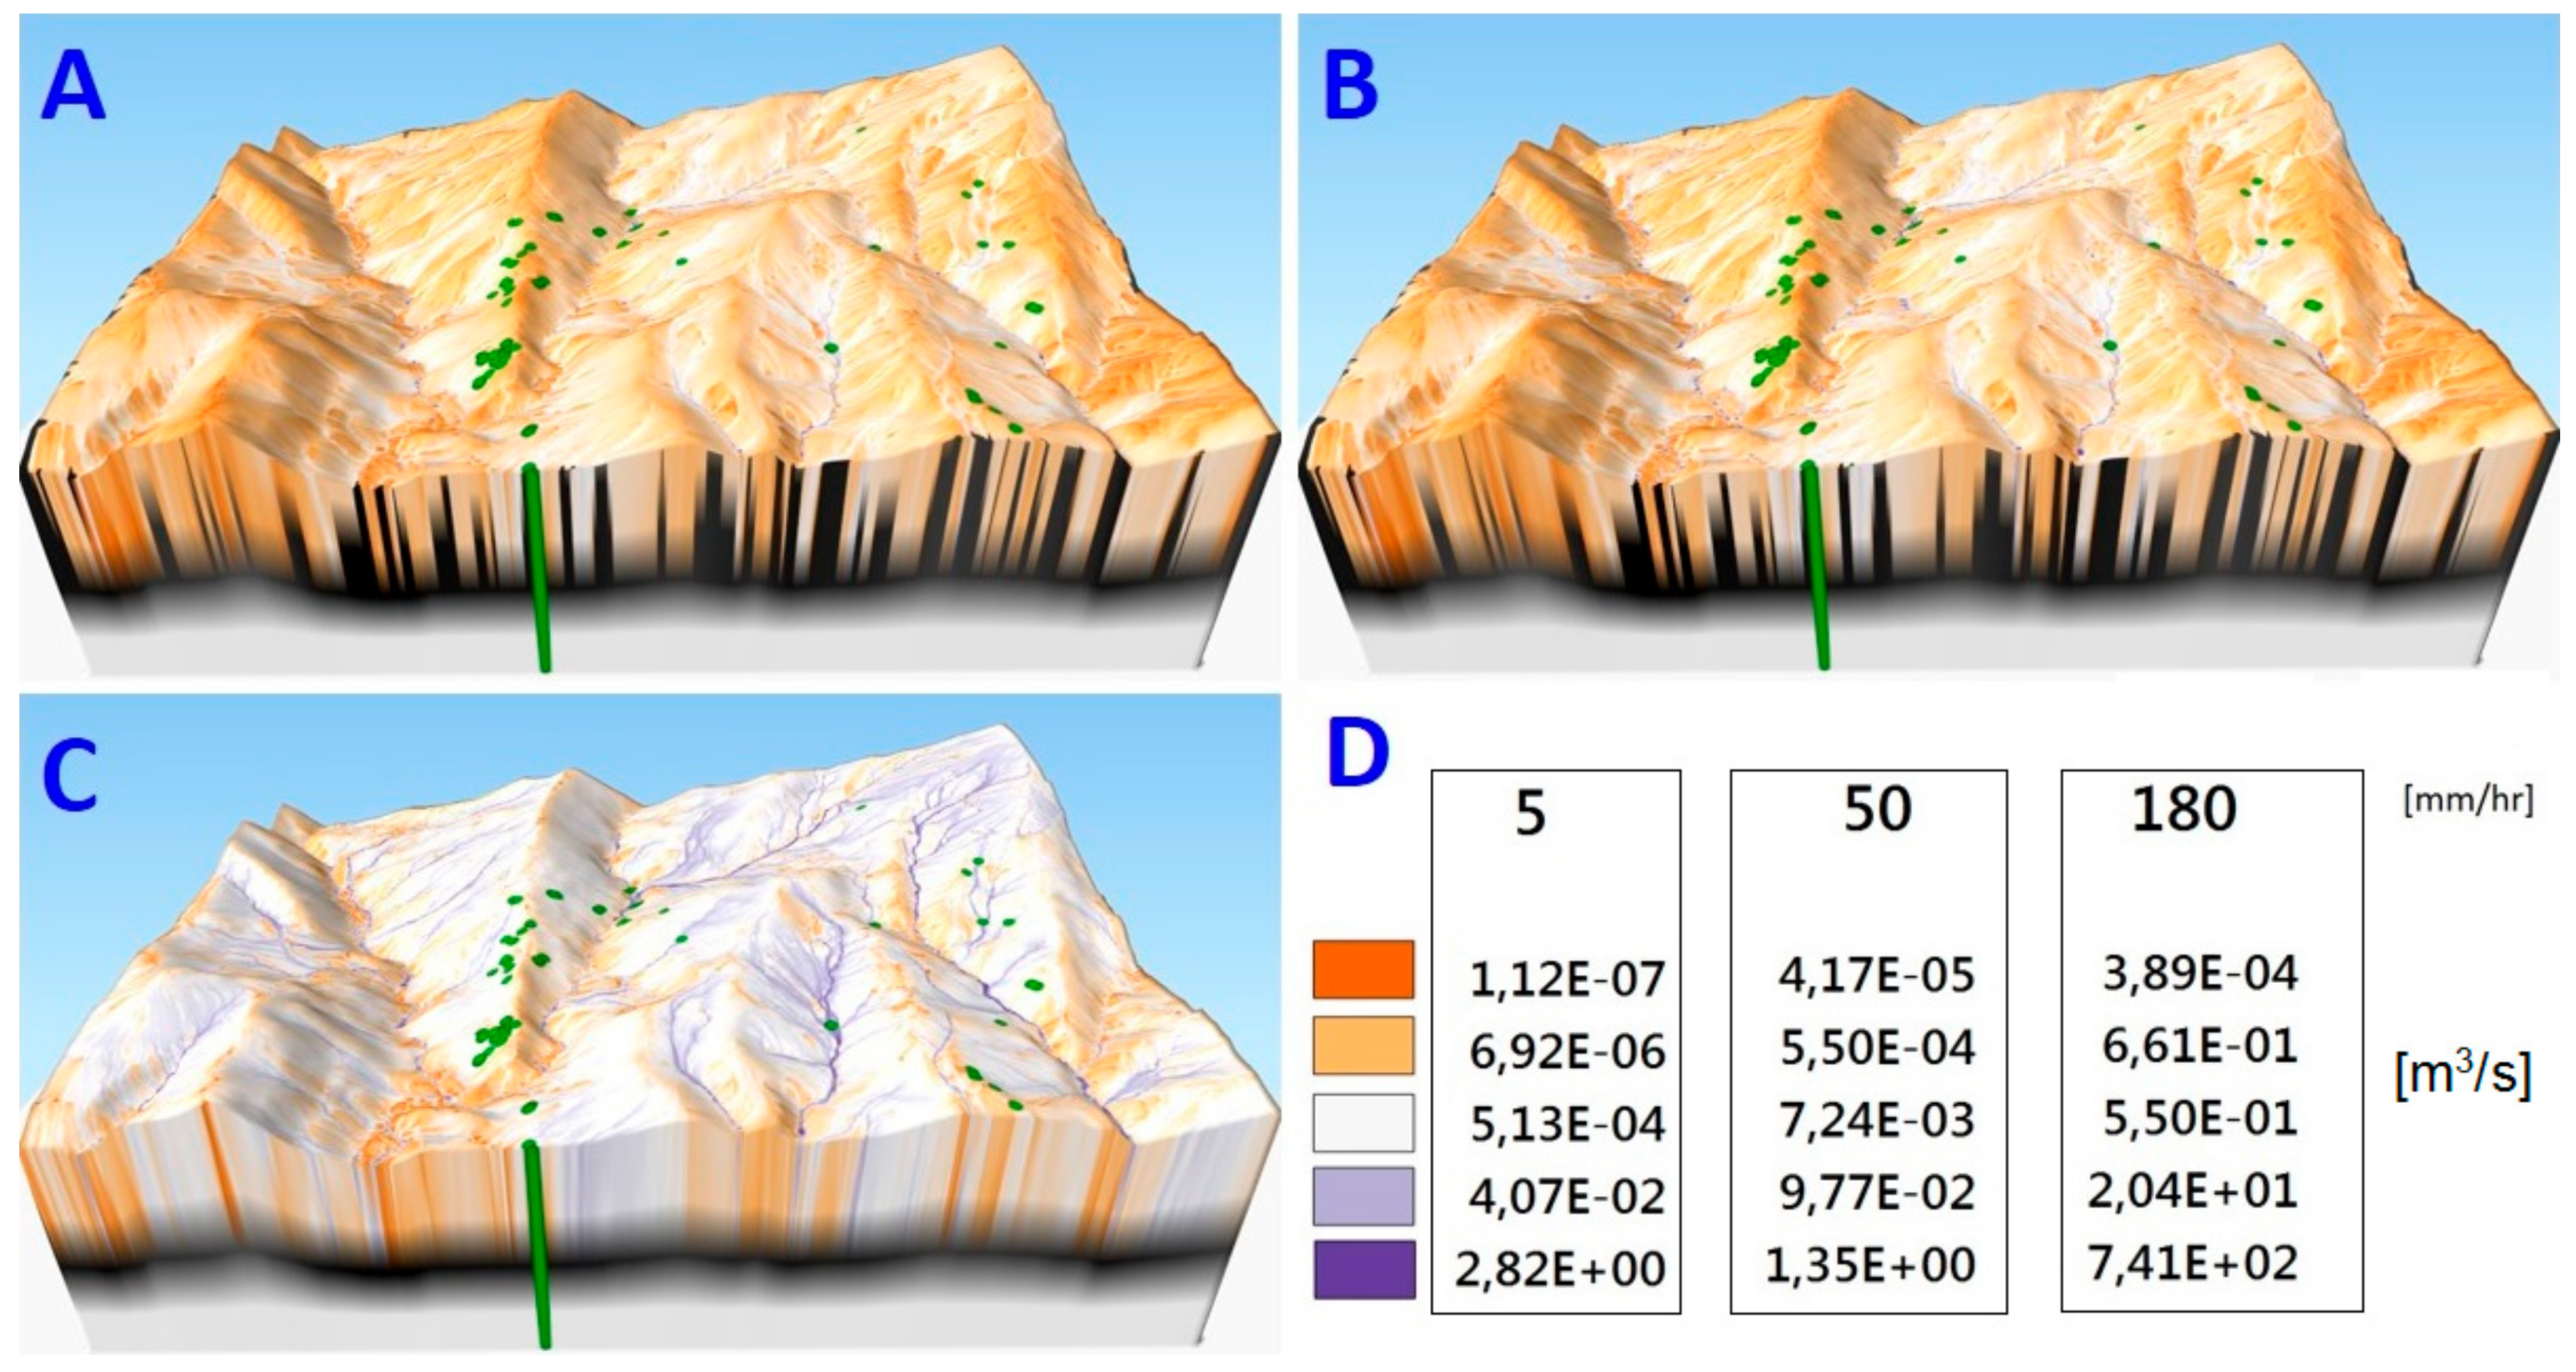
2.3. LiDAR DTM Data: Flow Accumulation and Water Discharge Map

For the two study areas, the available raster grid DTMs can be directly downloaded form the Tuscany Regional Cartographic Portal at: https://www.regione.toscana.it/-/geoscopio. The DTMs were derived from LiDAR survey (airborne laser scanner–ALS) in 2008 with a resolution of 1 m × 1 m. The high sampling density provides reliable estimates in relation to the DTM processing techniques and any estimation errors [50]. The raster DTMs were processed to obtain two raster grids, useful to model water movement on the slopes; namely, flow accumulation and water discharge.
DTM processing was carried out in a GIS environment, using the QGIS and GRASS GIS software and GDAL libraries. The DTM was pre-processed “filling” morphological depressions by using the r.fill.dir algorithm, and was then used to generate two maps: (i) a depression-less elevation map and (ii) a flow direction map [51]. By using the r.watershed algorithm, the (i) and (ii) maps were used to calculate the flow accumulation map [52]. For a better data analysis, we transform the flow accumulation using a logarithm scale (Figure 4), considering its exponential progression.
The water discharge map (Figure 5)—obtained from a model designed for spatially variable terrain, soil, cover, and rainfall excess to simulate overland flow [53]—was obtained with r.sim.water using a runoff coefficient map (at catchment scale) based on soil type, soil cover and use, and the average hillside slope (Table 2) and a Manning’s n value set to 0.05. With regard to the precipitation (used as input to calculate the water discharge map), three simulations were made with three different precipitation scenarios: 5, 50, and 180 mm/h (with respective return periods of <2 y, 50 y, and >500 y).

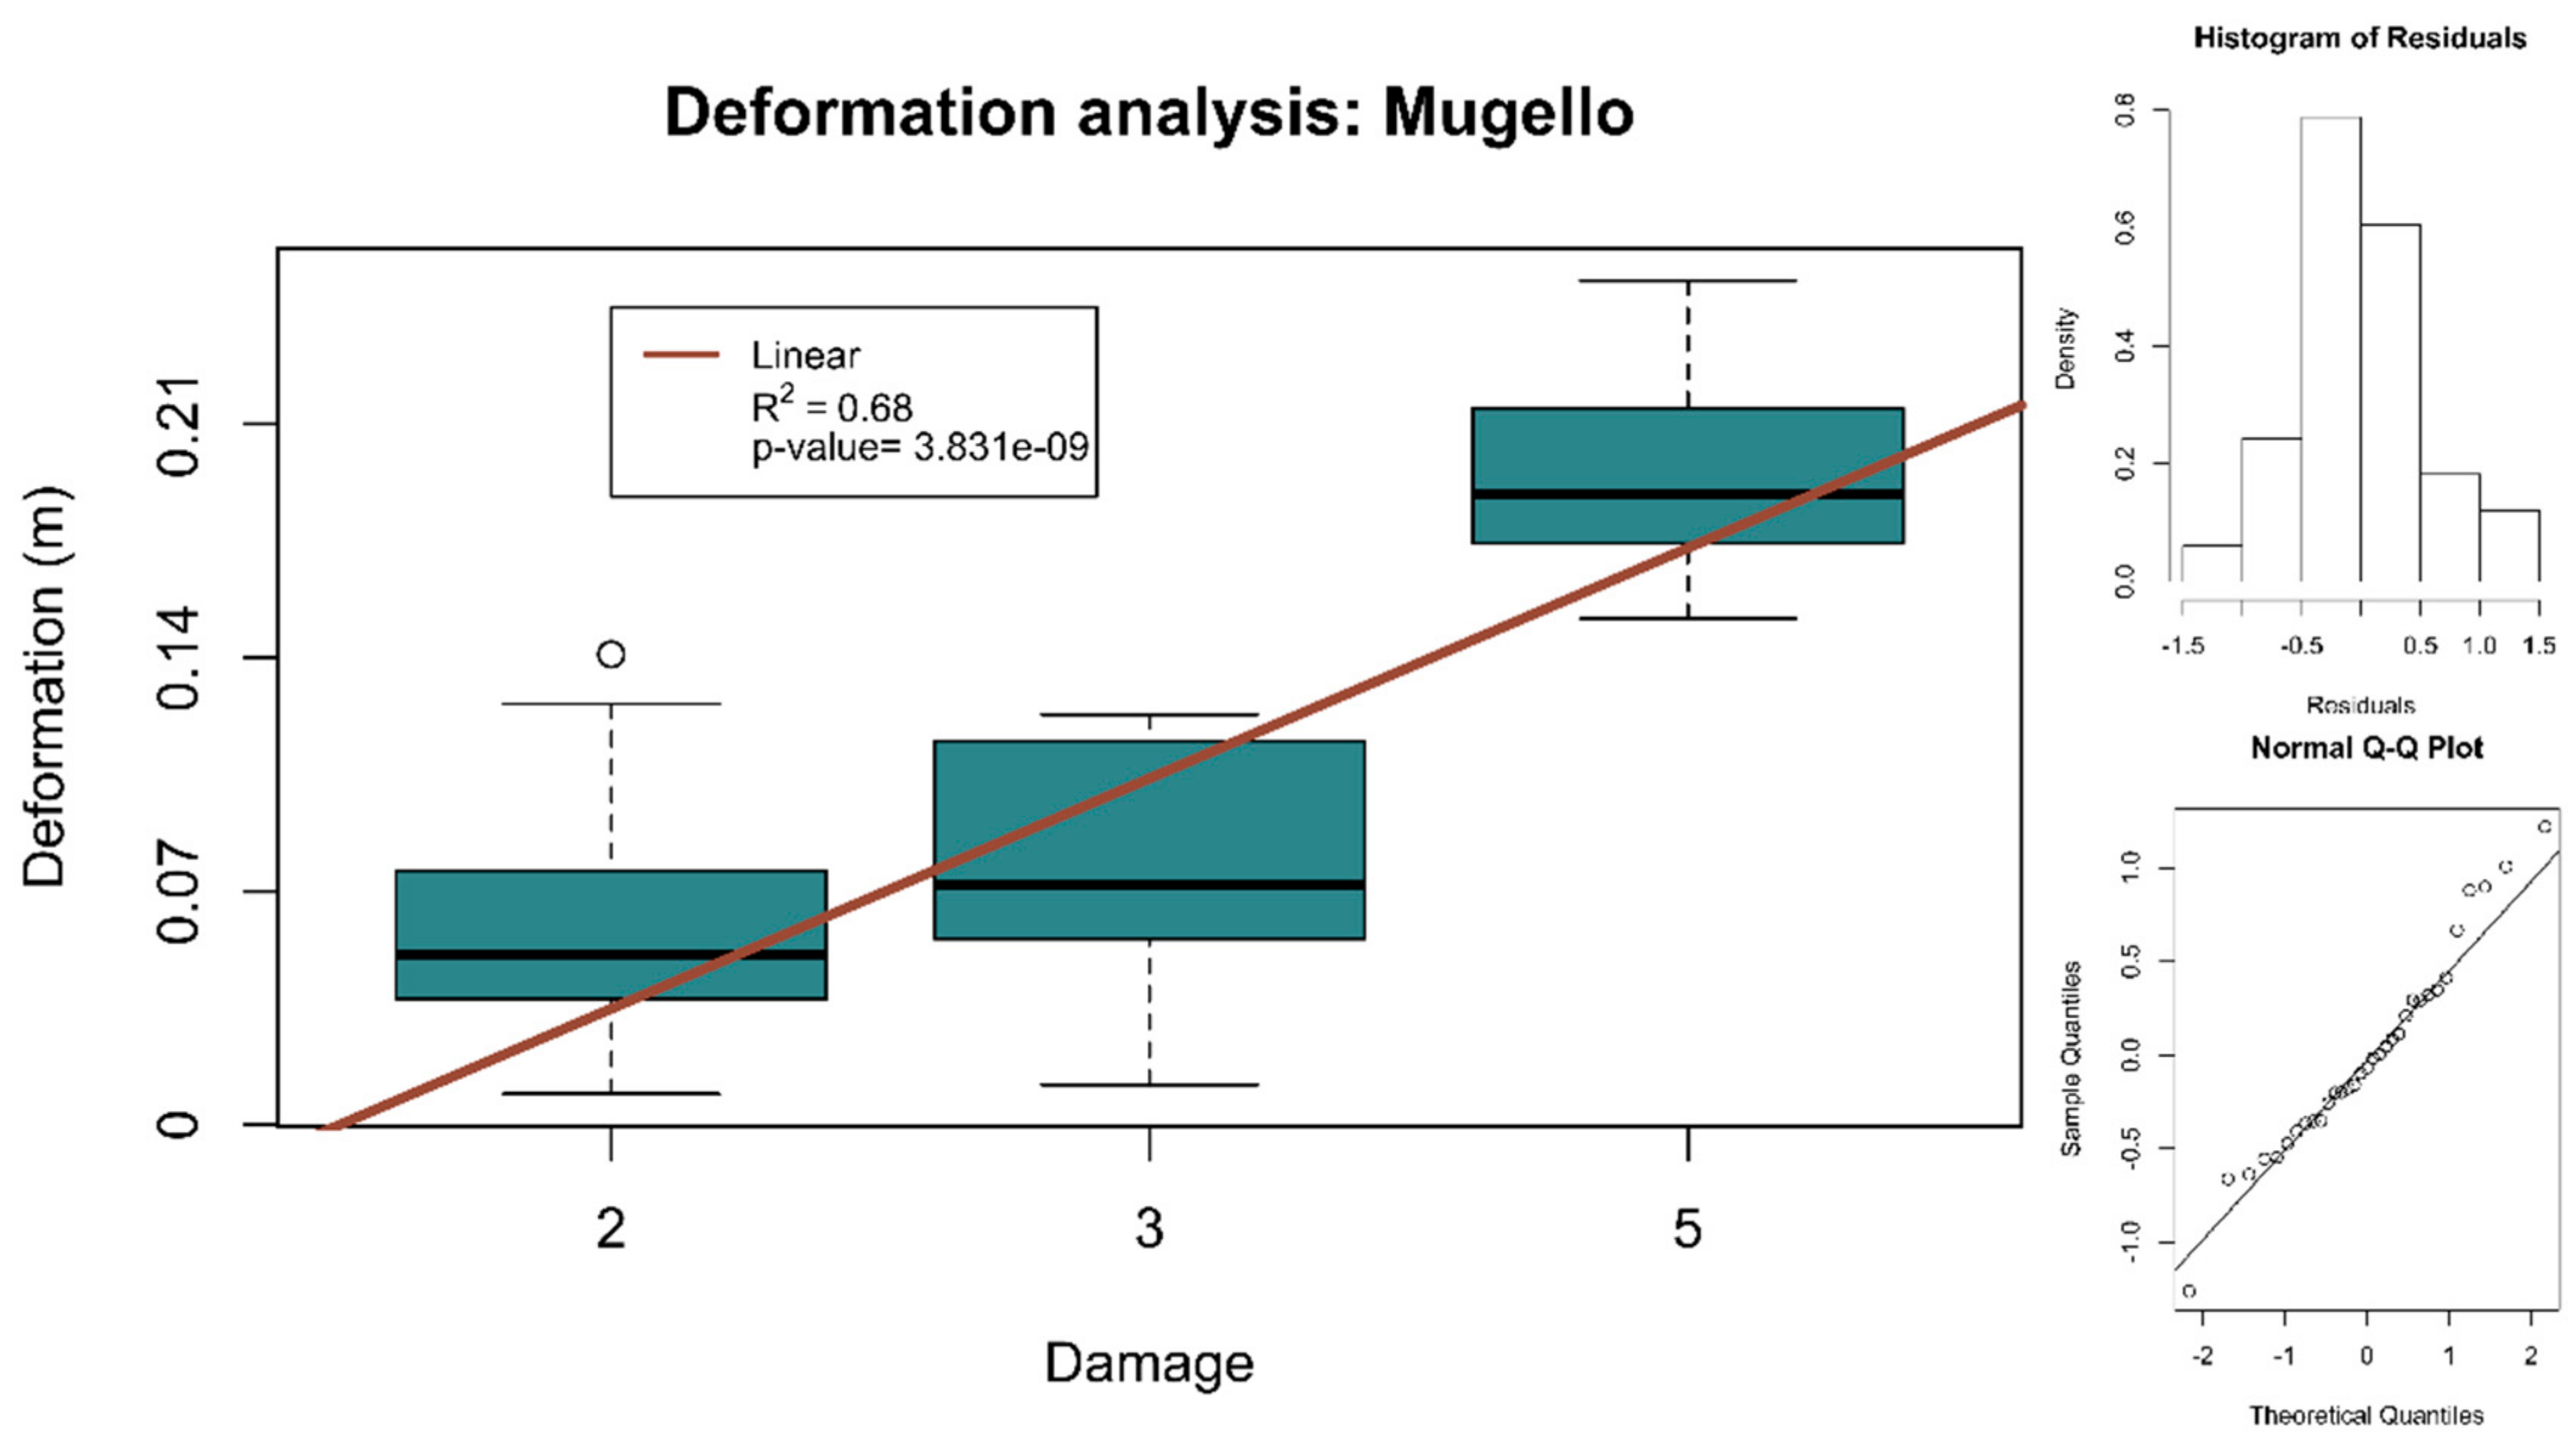
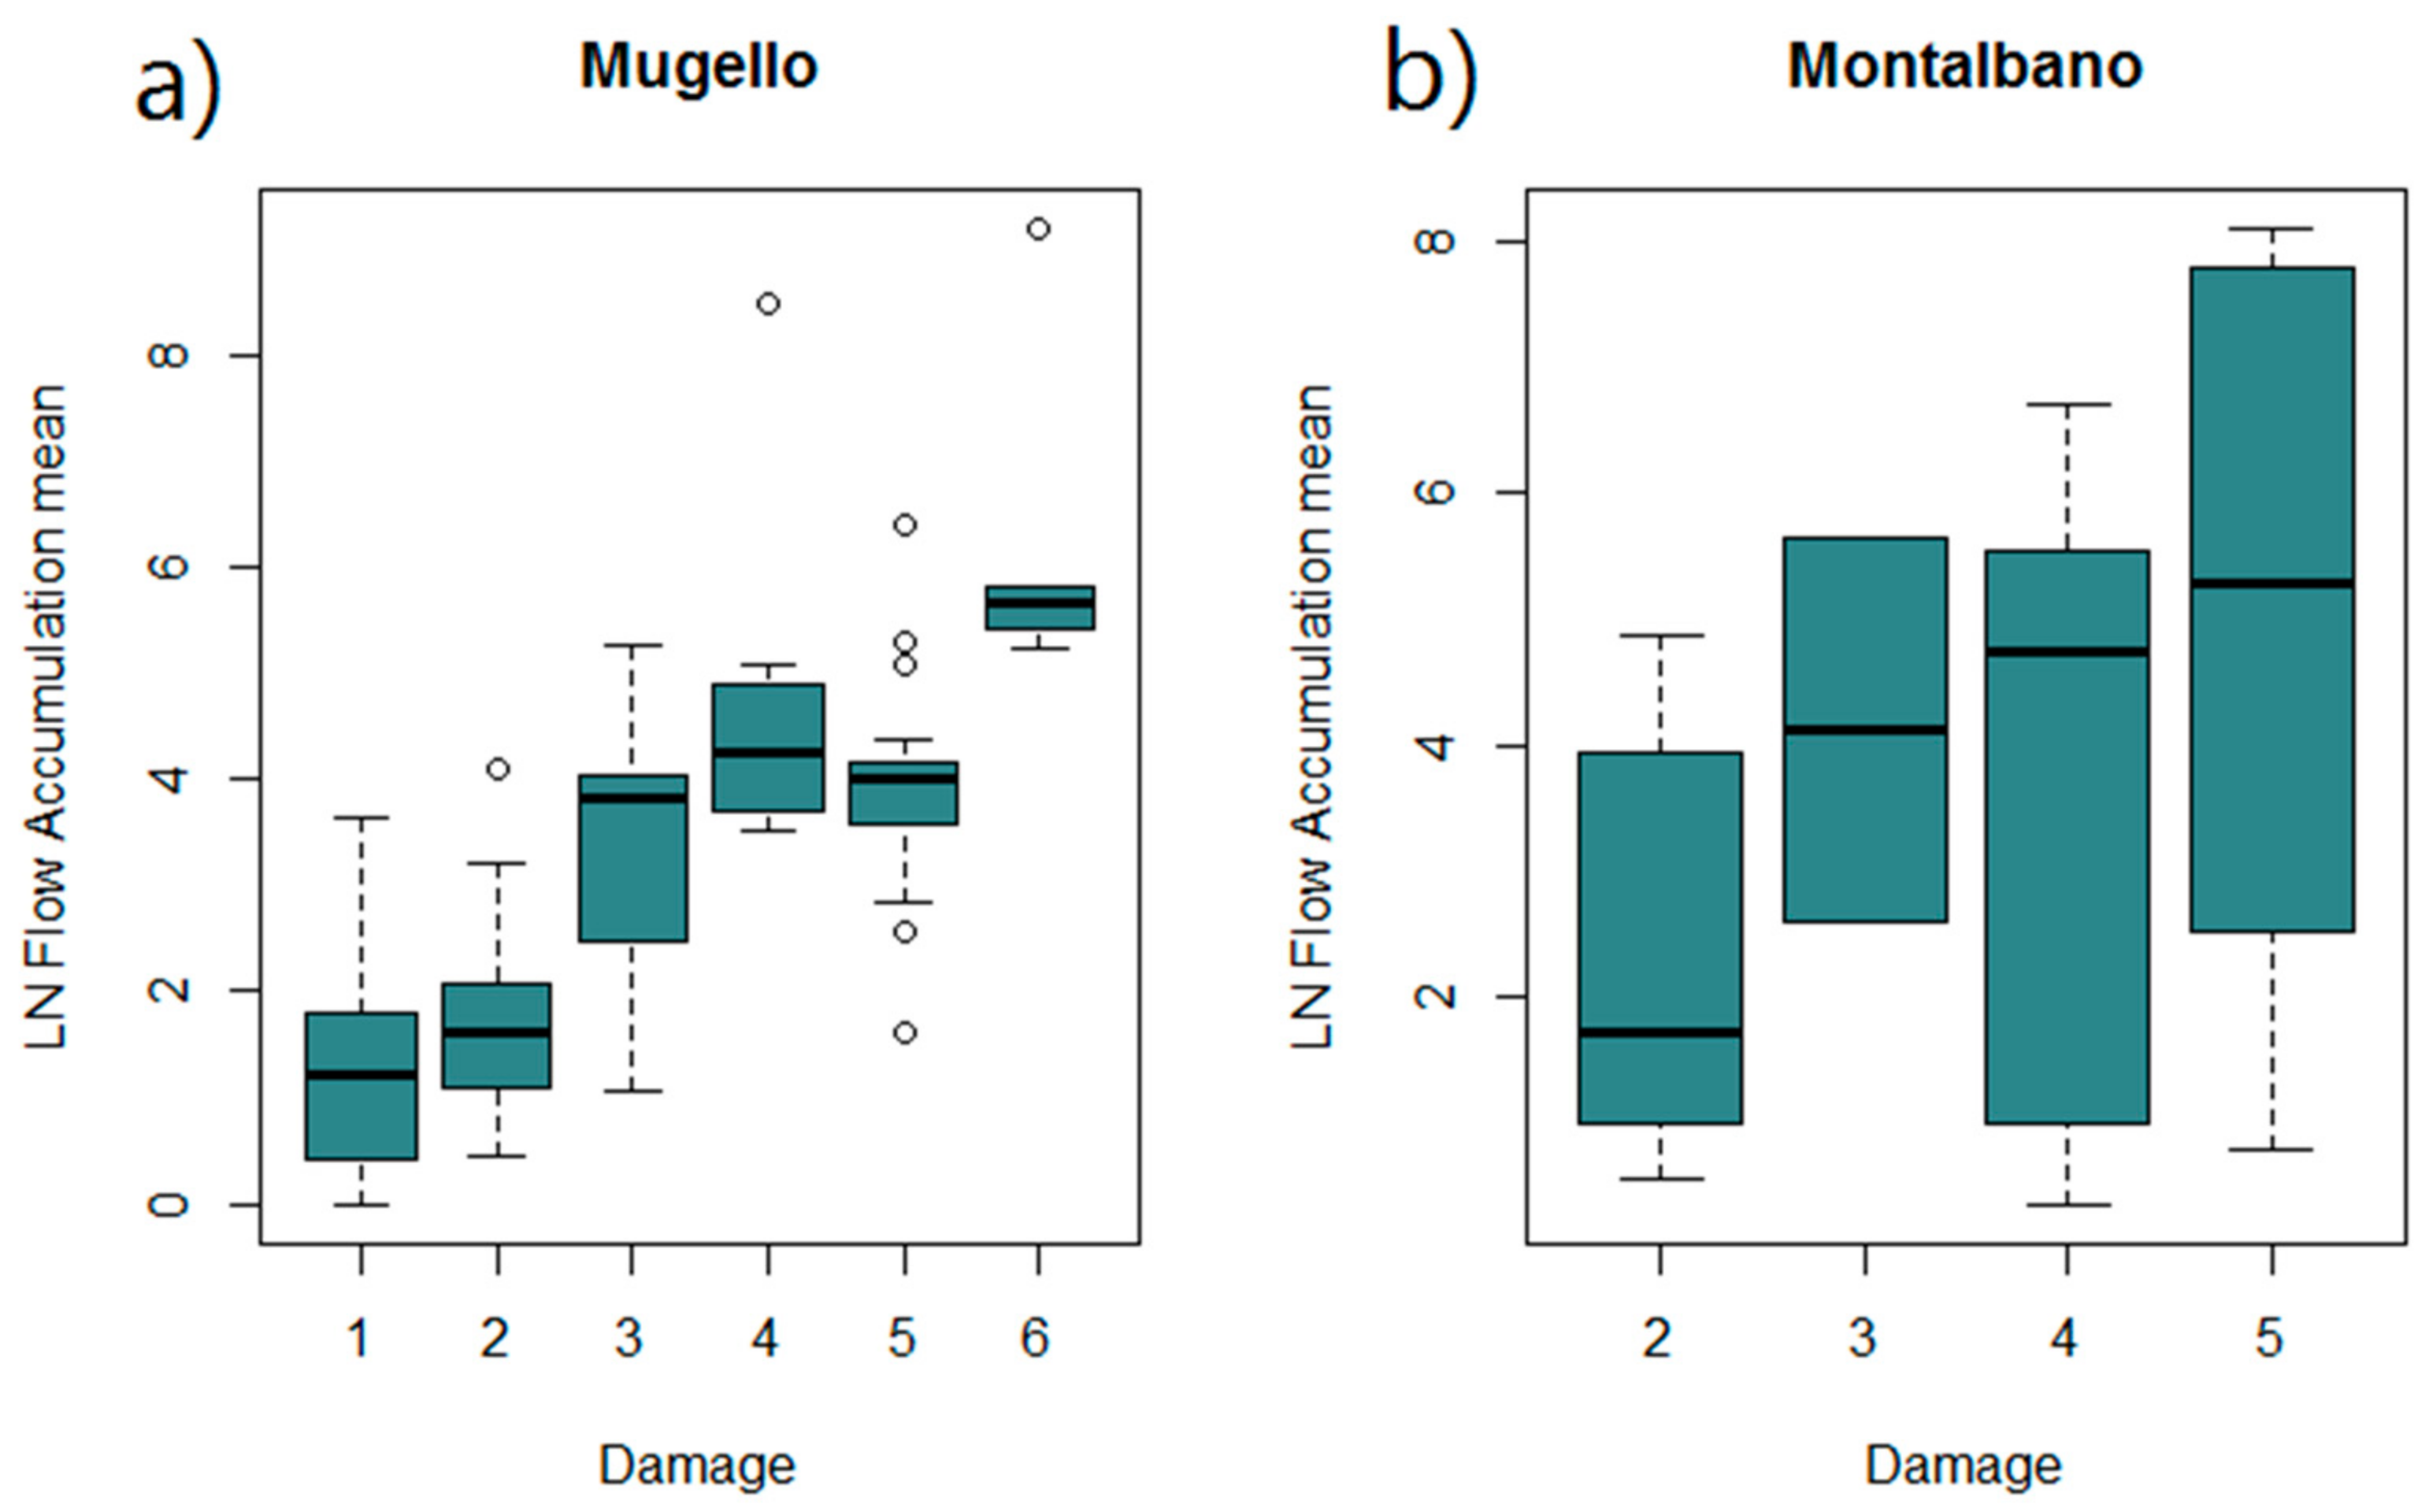
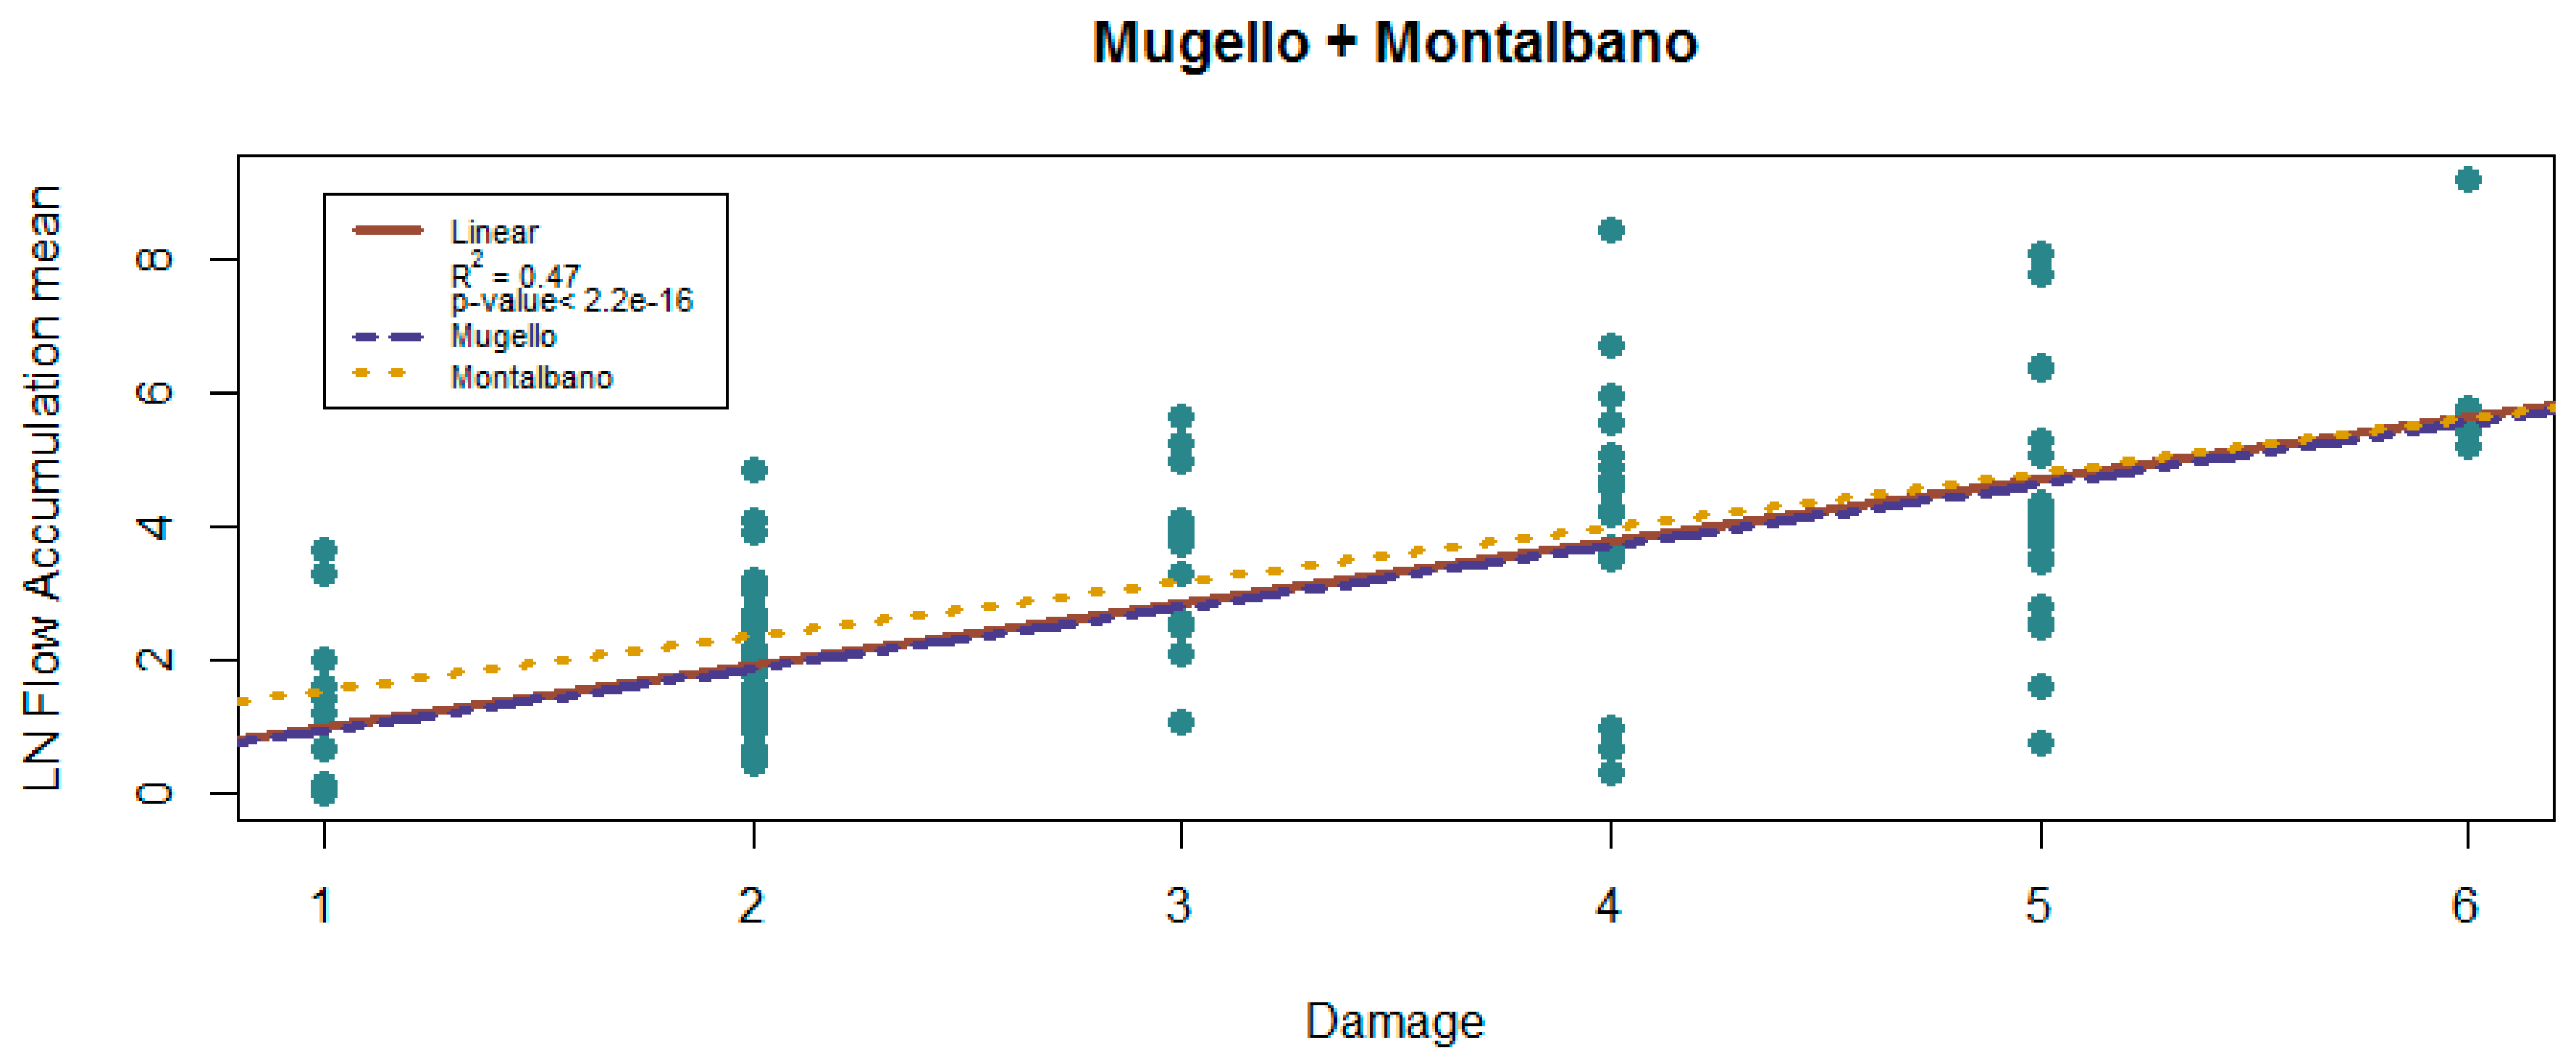
2.4. Comparing Field Data and Simulation Data

To validate the classification schemes introduced above, we first compared the measured deformations using our purpose-built instrument (Figure 2A) to the subjective damage scales (Table 1) assigned to the different dry walls for the Mugello area.
In a second comparison, damage classes and measured deformations were related with the calculated values for flow accumulation and water discharge derived from the maps to point out whether the damage classes were correlated with these parameters.
The correlation and significance analyses were performed using R software. For each sampling point acquired in the field we estimated the flow accumulation and water discharge values from our model and the GPS coordinates of the field site as acquired with the Geopaparazzi app. The accuracy of the geolocation depends on the smartphone’s GNSS antenna and was estimated as approximately 5 m. We further improved this accuracy by using the photographs obtained in the field and comparing them to 20-cm resolution ortophotos (Tuscany Regional Cartographic Portal). More specifically, we drew circles of 0.5 m radii around each survey point and extracted the average logarithmic flow accumulation and water discharge from within these circles (using the “zonal statistics” QGIS tool).

3. Results

A comparison of the in-situ deformation measurements and subjective damage assessments of the dry-stone walls in the Mugello area (n = 37) yields a good correlation between both parameters (Figure 6).
The damage class was then compared with the average flow accumulation values, as mentioned, both individually for the Mugello (Figure 7a) and Montalbano areas (Figure 7b) and for the combined dataset (Figure 8).
In both study areas we found a statistically significant correlation between the damage classes and the flow accumulation values (Mugello R2 = 0.57, p < 0.001; Montalbano R2 = 0.14, p < 0.01). In Mugello, the statistical significance of the correlation was higher than in Montalbano because of the higher variability in the Montalbano flow accumulation data (Montalbano = 19% Mugello, in sample points terms). If we plot the median flow accumulation against the damage class, the correlation is even higher (R2 = 0.88, p < 0.005, Figure 9).
We also found a statistically significant, albeit lower correlation between the measured deformation and the average flow accumulation (R2 = 0.38, p < 0.001, Figure 10).
We also tested for a possible correlation between the water discharge (the water volume that flows through the slopes per unit time) and the average flow accumulation for three different precipitation intensities (Figure 11). The correlation between flow accumulation and water discharge increases as the precipitation intensity is increased from 5 mm/h to 50 mm/h, then decreases again as the intensity is further increased to 180 mm/h.
To further investigate the effect of different rainfall intensities on water discharge, we extracted the water discharge from 200 randomly selected locations in our model domain for the three rainfall intensities. The random points were obtained using a QGIS tool, contained in the GDAL library. The water discharge value increases with rainfall intensity, increasing from 5 mm/h to 50 mm/h, and showing a good (perfect) correlation (Figure 12). As the rainfall intensity increases further to 180 mm/h is always increasing, but not well correlated (Figure 12).
We also compared the water discharge volume to the dry wall damage class and deformation at all sites. Walls that exhibit more severe damage (both on the subjective damage classification system and the quantitative deformation measurements) also have increased water discharge rates (Figure 13 and Figure 14, Table 4). This result has a lower statistical significance, however, compared to the results relating to flow accumulation.

4. Discussion

The lack of maintenance of terraces leads to a progressive loss of their functionality, which over time leads to damage to the dry-stone wall, mainly caused by uncontrolled water runoff. The concentration of runoff water at the dry-stone wall, both superficial and hypodermic, can cause its collapse as the water accumulates between the backfill and the stones, thus increasing hydrostatic pressure and causing deformation of the wall [55,56]. It has been shown that wall instabilities are more common in areas of convergence with probable water accumulation (no hydrological-hydraulic measure or simulation have been provided), especially where drains are not maintained due to abandonment of the land [3,56].
In the present study, we developed a descriptive, efficient damage scale classification scheme that can be used easily in the field. We could show that this subjective classification scheme was consistent with more objective deformation measurements to assess wall damage. Moreover, we designed a very simple and thus easy-to-replicate instrument consisting of graduated wooden rods and a plumb line to acquire objective measurements of deformation.
We could also show that a simple hydrological spatial analysis to predict areas of flow accumulation from available LiDAR DTMs can serve to identify runoff concentration pathways, one of the main causes of damage in terraced systems [56]. In fact, we observed a high correlation between both damage classes and deformation measures with flow accumulation in two different study areas in Northern Tuscany. The amount of flow accumulation in a particular area was well correlated with the severity of wall damage.
As there are no comparable studies available for our two study areas, we applied the method to previous observations from the Carmignano and Lamole regions (also in Tuscany, Northern Italy) where past studies have produced images and geographic locations of terracing systems and supporting wall structures [17,36,55]. By applying our methodology to these areas we could show that the observations from these two areas come to lie perfectly on the regression line between the median flow accumulation and the damage scale classes (Figure 9).
In the literature there are only few studies on the relationships between the state of dry-stone wall maintenance and surface runoff and most of these existing studies typically employed very high resolution DTMs obtained by TLS [36,44,57]. One of these studies used a <1 m resolution DTM to show that the presence of concentrated surface runoff, at the scale of a terraced system, has a significant impact on dry-stone wall deformation [44]. Subsequently, Tarolli et al. [36] demonstrated that high resolution DTMs are a useful tool for the evaluation of surface erosion processes. The authors provide a detailed comparative statistical analysis between the DTMs obtained from ALS and TLS. However, TLS is optimized for the analysis of single slopes or areas of a limited size (e.g., 3–4 hectares), while our methodology can be applied to cover large areas as it uses Regional ALS DTMs.
Our findings are in line with observations by Preti et al. [55,56] in that increasing accumulations of water behind a wall (high values of flow accumulation) lead to increasing levels of damage severity. However, while flow accumulation only provides information about where water tends to concentrate, to understand the real water concentration, other factors need to be considered as well, including (i) precipitation at the event scale, (ii) infiltration, and (iii) vegetation cover [58]. All these factors play an important role with regard to the amount of water that reaches a dry-stone wall. For this reason, we examined the water discharge, i.e., the water volume that flows down a slope per unit time [59]. Our results showed a direct correlation between water discharge and the amount of wall deformation in an area (Figure 14). More specifically, we found a correlation between the quantity of water that reaches a dry-stone wall and the severity of wall damage, albeit with a statistical significance that was lower compared to the correlation with flow accumulation (Figure 10). In comparison, the correlation between the subjective damage scale and water discharge was less statistically significant than for deformation. This difference could be due to the factor of time, a parameter that was not explicitly considered in this study. The amount of dry-stone wall deformation is closely linked to hydrostatic pressure. Parameters such as flow accumulation and water discharge only describe how much water reaches a particular dry-stone wall and where it preferably concentrates, but it does not provide any information about the exposure time. Figure 11 explains the relationship between the flow accumulation and the water discharge. While the relation keeps well connected between rains of 5 mm/h and 50 mm/h, the relation is lost for the simulation of very intense rain (180 mm/h), regardless of the significance of the regression. This is also evident from Figure 12, where we compare the water discharge values for different rainfall. In fact, this leads us to consider the influence of the time factor. It is possible that a single high-intensity event [53,60] can cause the same amount of damage as several low-intensity events spread over several years. The state of conservation of a wall is always the result of a series of events. Another factor to take into account is the amount of maintenance invested by the land owner the amount of damage is likely to increase once maintenance has been poor for an extended period of time. The slightly higher correlation between deformation and water discharge (Figure 14 and Table 4), compared to damage scale and water discharge (Figure 13 and Table 4), could be attributed to the fact that greater quantities of water reaching a wall tend to cause greater deformations than smaller quantities reaching a wall over a longer period of time. We found that neither flow accumulation nor water discharge were proportional to rainfall intensity, but depended on the morphological characteristics of the slope (Figure 11, Table 3). For particularly intense precipitation events (180 mm/h), surface runoff becomes unrelated with flow accumulation because the watershed’s tailwater increases, and so therefore the runoff overflows.
While flow accumulation is directly related to the surface morphology, it is also affected by hypodermic flows (shallow subsurface flows), particularly in cultivated soil. Tillage often creates a compact impermeable layer [61] and a surface soil layer with very high infiltration coefficients [56]. The runoff in the subsurface layer (originating from tillage) has similar characteristics to the surface layer (characterized by flow accumulation). Low intensity rains cause little damage to dry-stone walls as the water discharge is low and water can infiltrate into the ground. This explains the low correlation between wall damage and simulated water discharge for the 5 mm/h rainfall scenario (Table 4). By increasing rainfall intensity to 50 mm/h, this correlation increased (Table 4) as the water followed the preferential pathways in the ground and reached the dry-stone wall faster. With very intense rains (180 mm/h), those flow velocities exceed the infiltration rate by far (even in preferential pathways), and the water tends to simply overflow the wall, creating a more generalized instability compared to phenomena that cause bulging or a full collapse.
Damage to dry-stone walls can also be caused by other factors not related to water regulation or extreme events such as the passage of wild animals, deep landslides, or human activities. These factors were not included in our analyses.

5. Conclusions

By examining a possible relationship between the damage of dry-stone walls and water flow accumulation, we could establish a methodology based on remote sensing techniques that is capable of identifying potentially damaged sites interraced systems across large areas. This is particularly useful for planning and conservation efforts.
In the present work a counter-test (verification of damages on dry stone walls in areas with high FW and WD values) was not carried out; this would make the prediction of unstable areas effective using the available data (DTM). While the first step of the present research was the definition of an effective survey system (intuitive and fast), the following will be the implementation of other data bases (however open data) to reduce the dispersion observed in the correlation tests shown in this work and therefore make the preventive action of the public decision-maker effective.
In previous works [36], it was observed that everywhere flow accumulation is greater, dry stone walls presented stability problems, while in this paper we have shown that where there is damage, flow accumulation is high.
In the presence of a homogeneous compact layer due to tillage that follows the surface morphology, flow accumulation can be indicative of shallow subsurface flow (hypodermic flow), too. During precipitation events, this would allow water to accumulate on the upslope face of a wall. Otherwise, the water discharge model does not take into account the shallow subsurface flow and preferential flow pathways. When runoff is high overflows up the wall (180 mm/h simulation), probably keeping only the surface process. While this is useful to test the functionality of ditches, it does not allow the analysis of flow concentrations on the upslope face of a wall, the most destabilizing component for these types of structures.
The developed methodology is useful for a conservation analysis of the terraced systems in relation to the hydraulic functionality. Decision makers can take advantage of open access data (DTMs) where available, and obtain a basic classification of the territory for planning, monitoring, and restoration purposes.
The proposed methodology is a first step towards a more comprehensive spatial planning tool. Based on our results and the developed methodology, it should be possible to develop a damage classification system that also includes the geology, lithology, and morphology of the slope. A further development may support the design of arrangement interventions to regulate surface outflows.

Author Contributions

Conceptualization, Y.G., F.P. and F.G.; methodology, Y.G., F.P. and F.G.; validation, M.C. and E.N., formal analysis, Y.G. and F.G.; data curation, M.C.; writing—original draft preparation, Y.G. and M.C.; writing—review and editing, F.G., A.D. and Y.G.; supervision, F.P. All authors have read and agreed to the published version of the manuscript.

Funding

The present research does not receive external fundings.

Institutional Review Board Statement

The study was conducted according to the guidelines of the Declaration of Helsinki.

Informed Consent Statement

Not applicable.

Data Availability Statement

The data presented in this study are available on request from the corresponding author.

Acknowledgments

We wish to thank the “Associazione Bio-distretto del Montalbano” and “Fattoria di Lamole di Paolo Socci” for given us the input to design the present study and for the work that they daily do to preserve the terraces in the context of the project “Ricostruiamo la campagna giardino”.

Conflicts of Interest

The authors declare no conflict of interest.

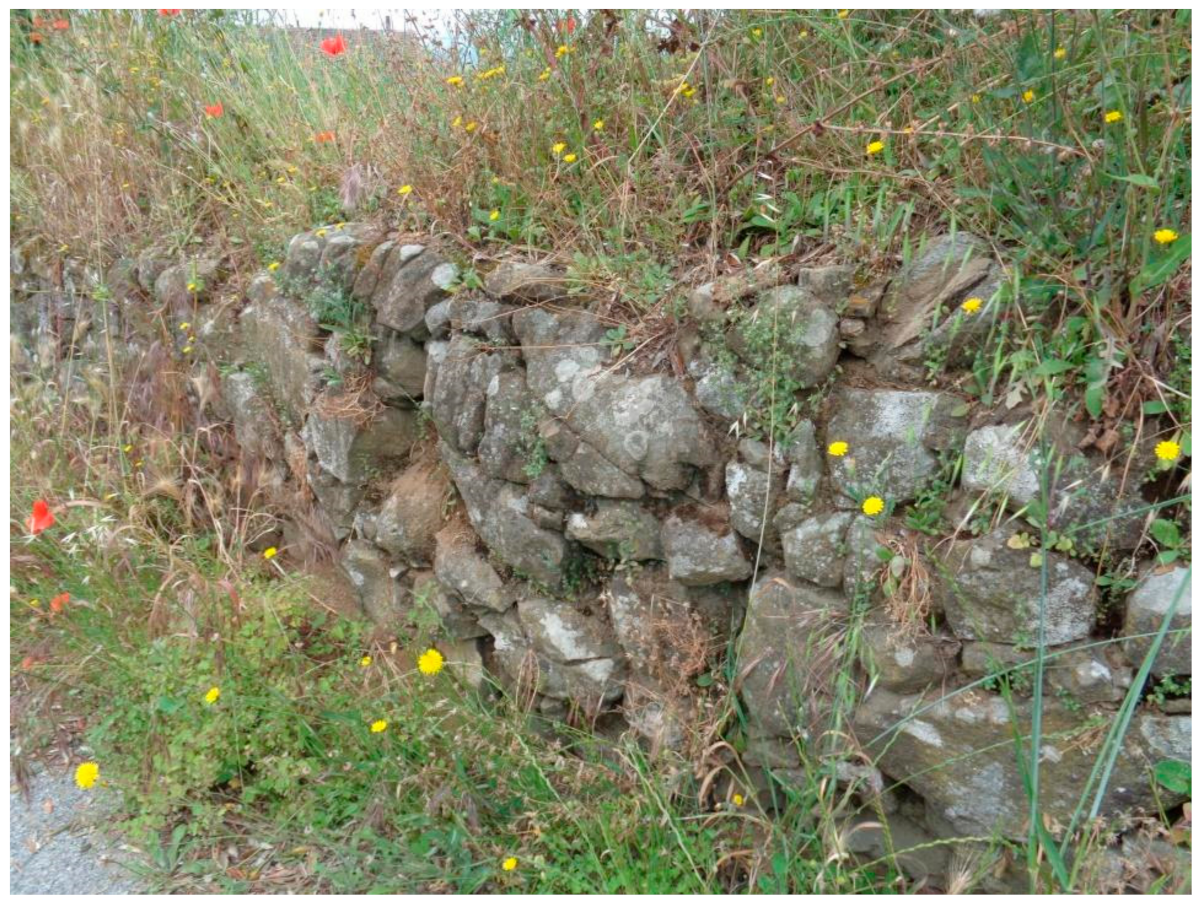
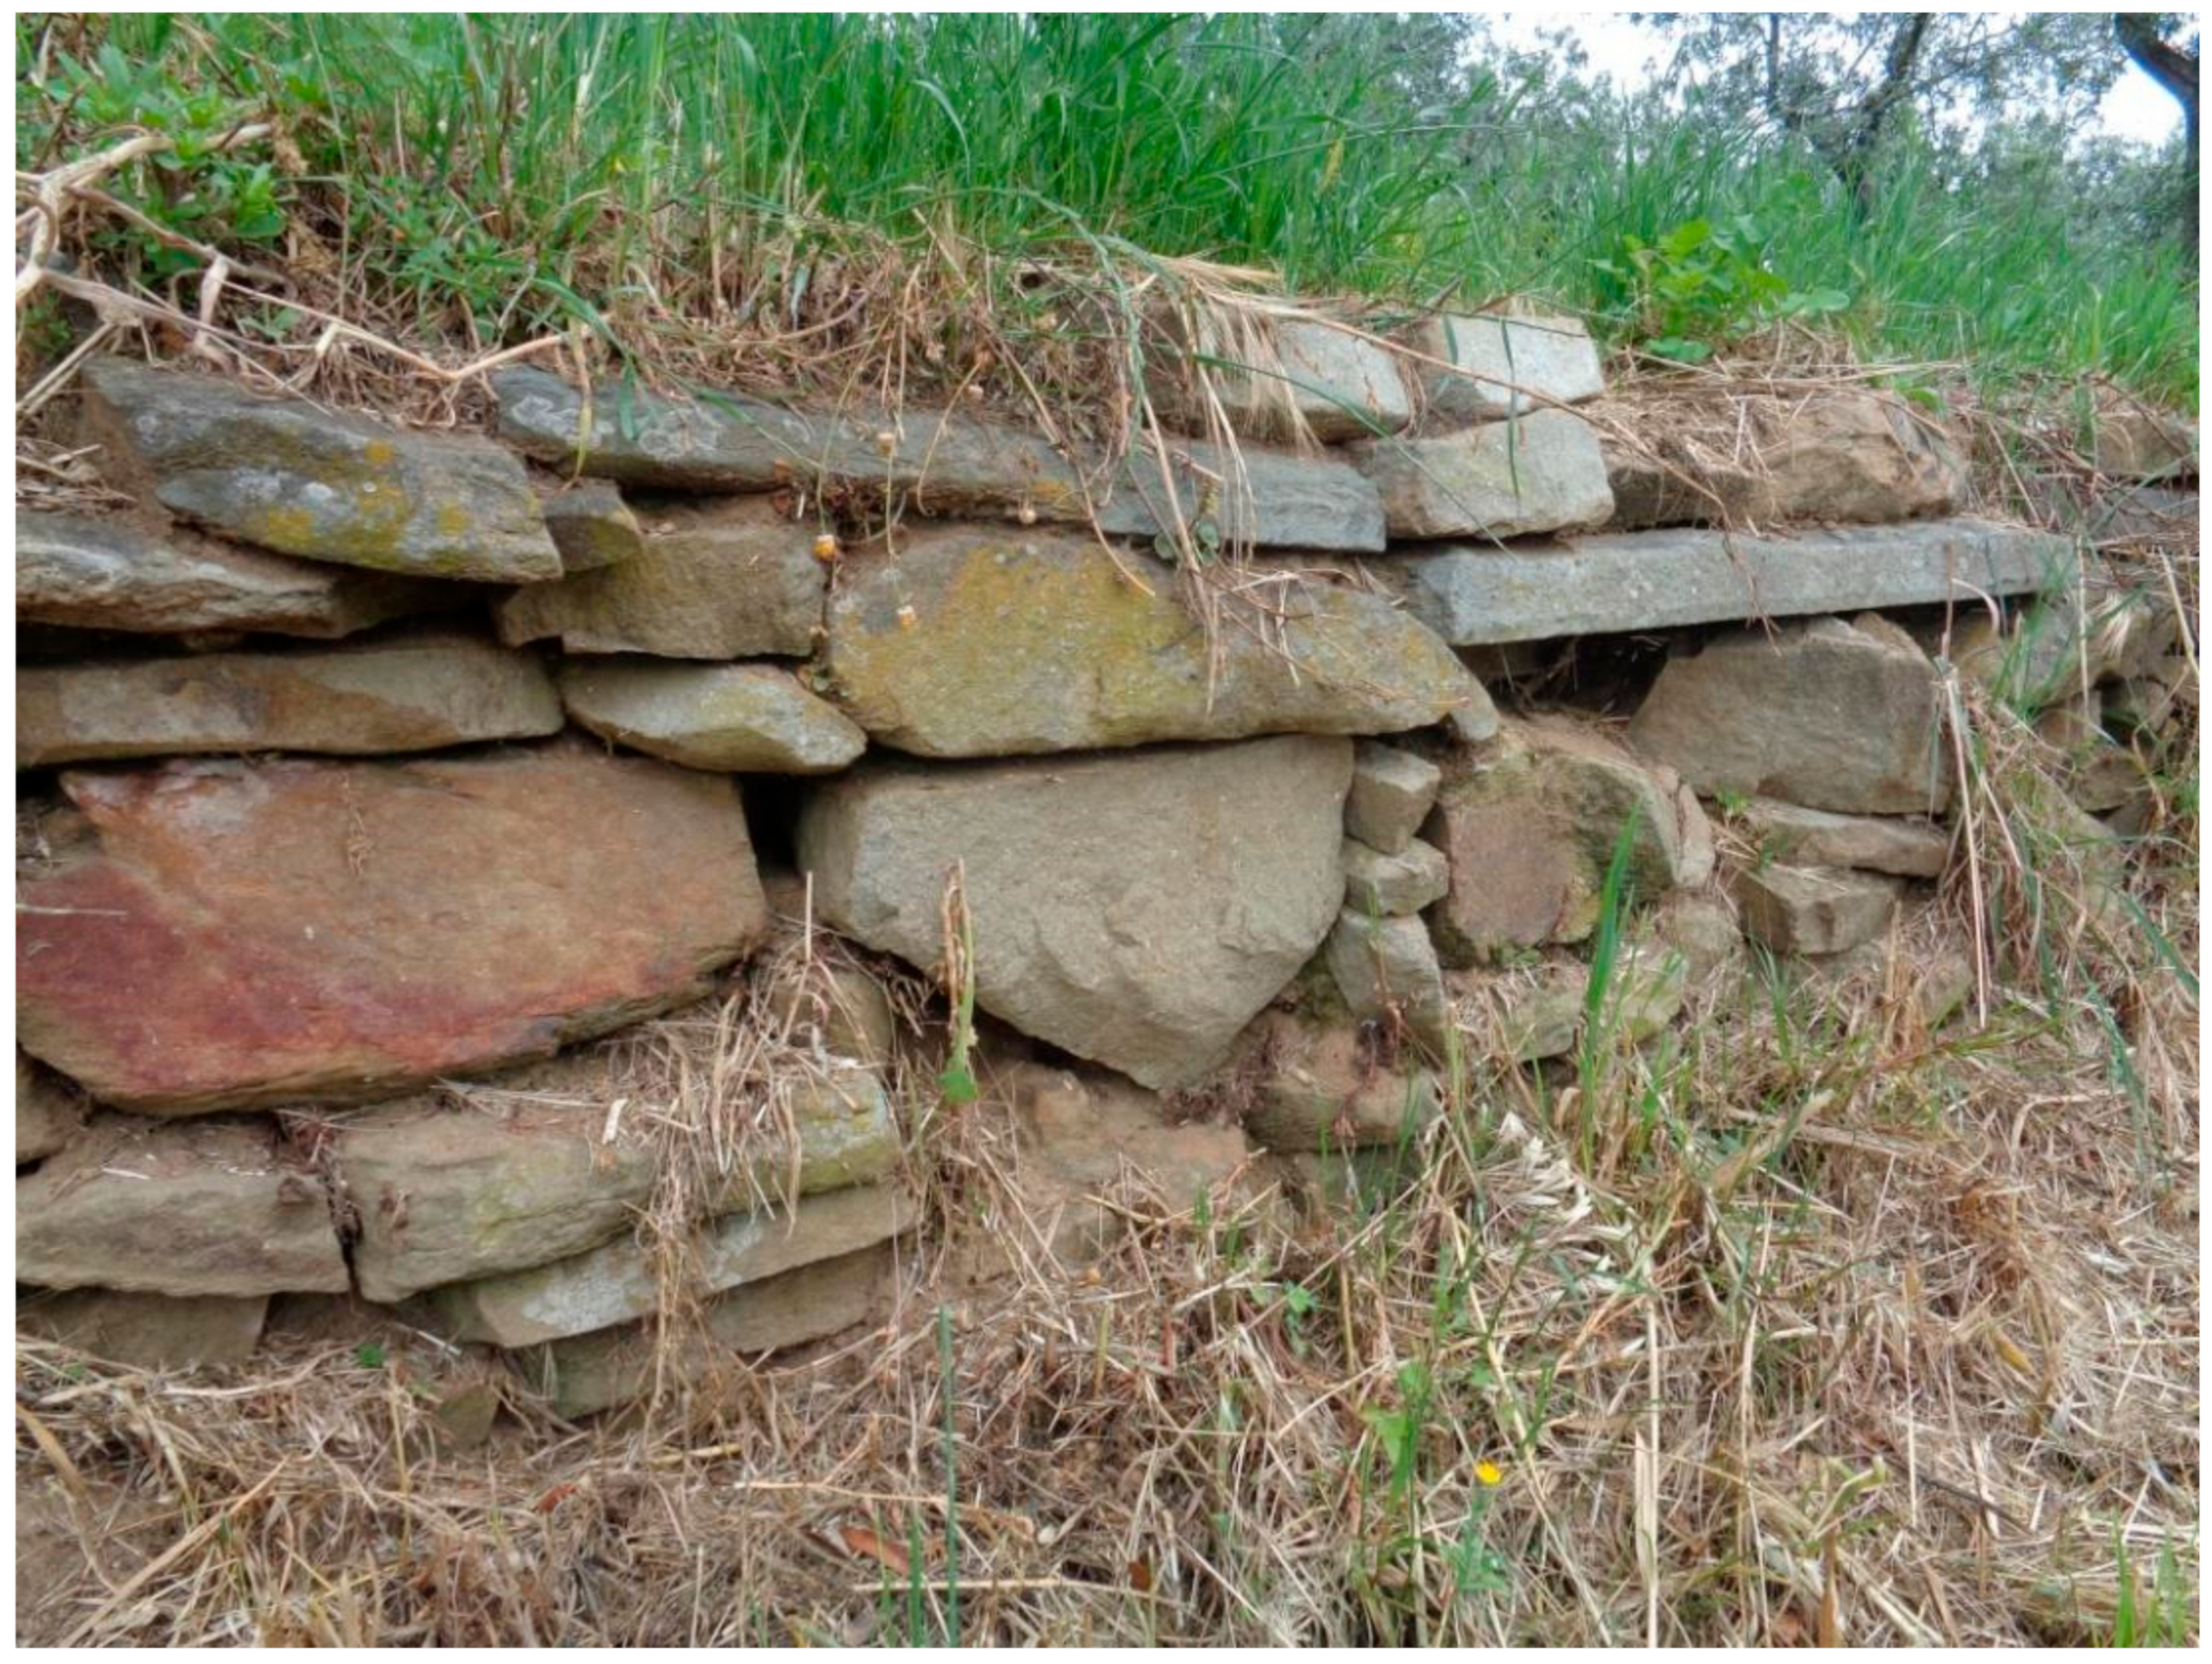
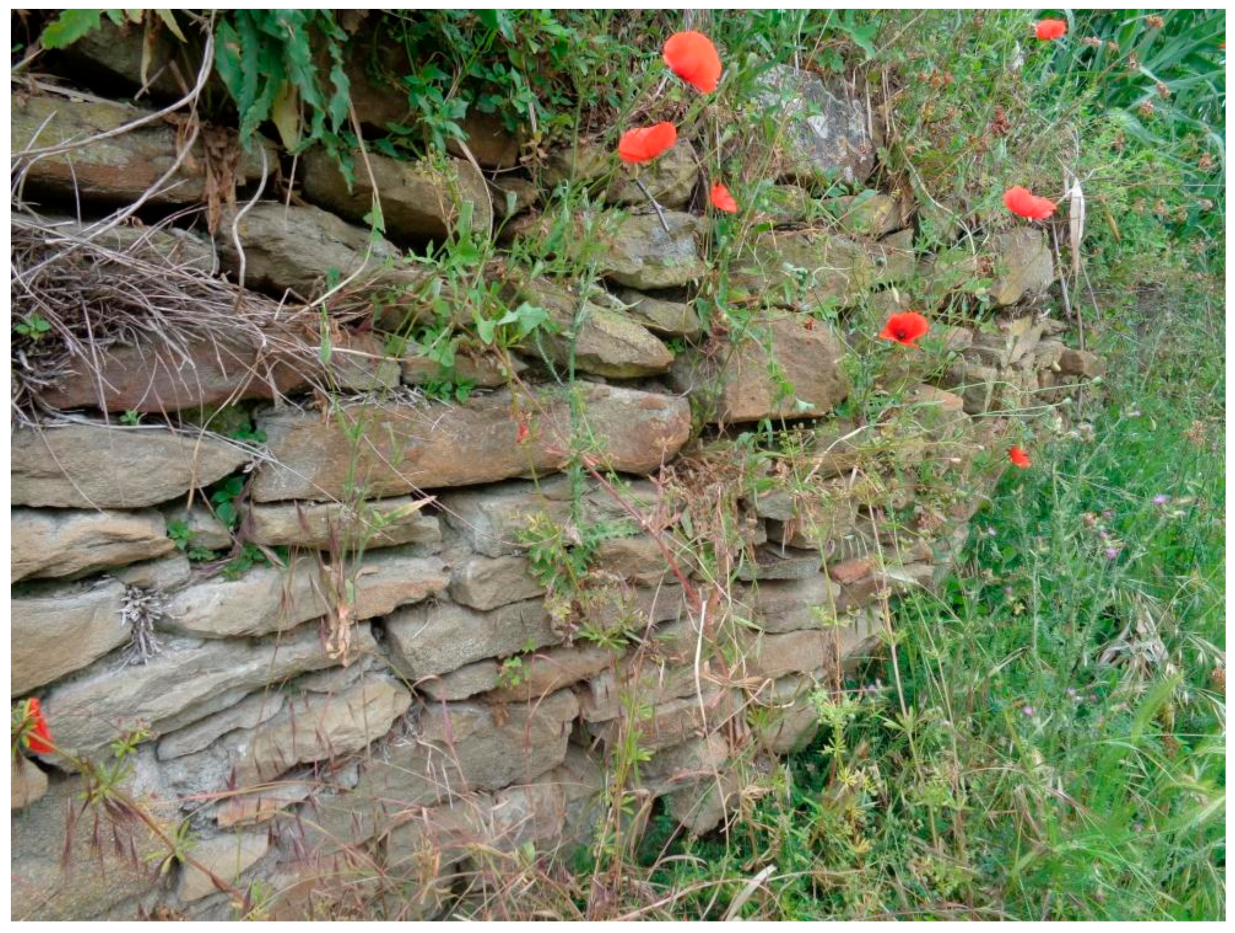
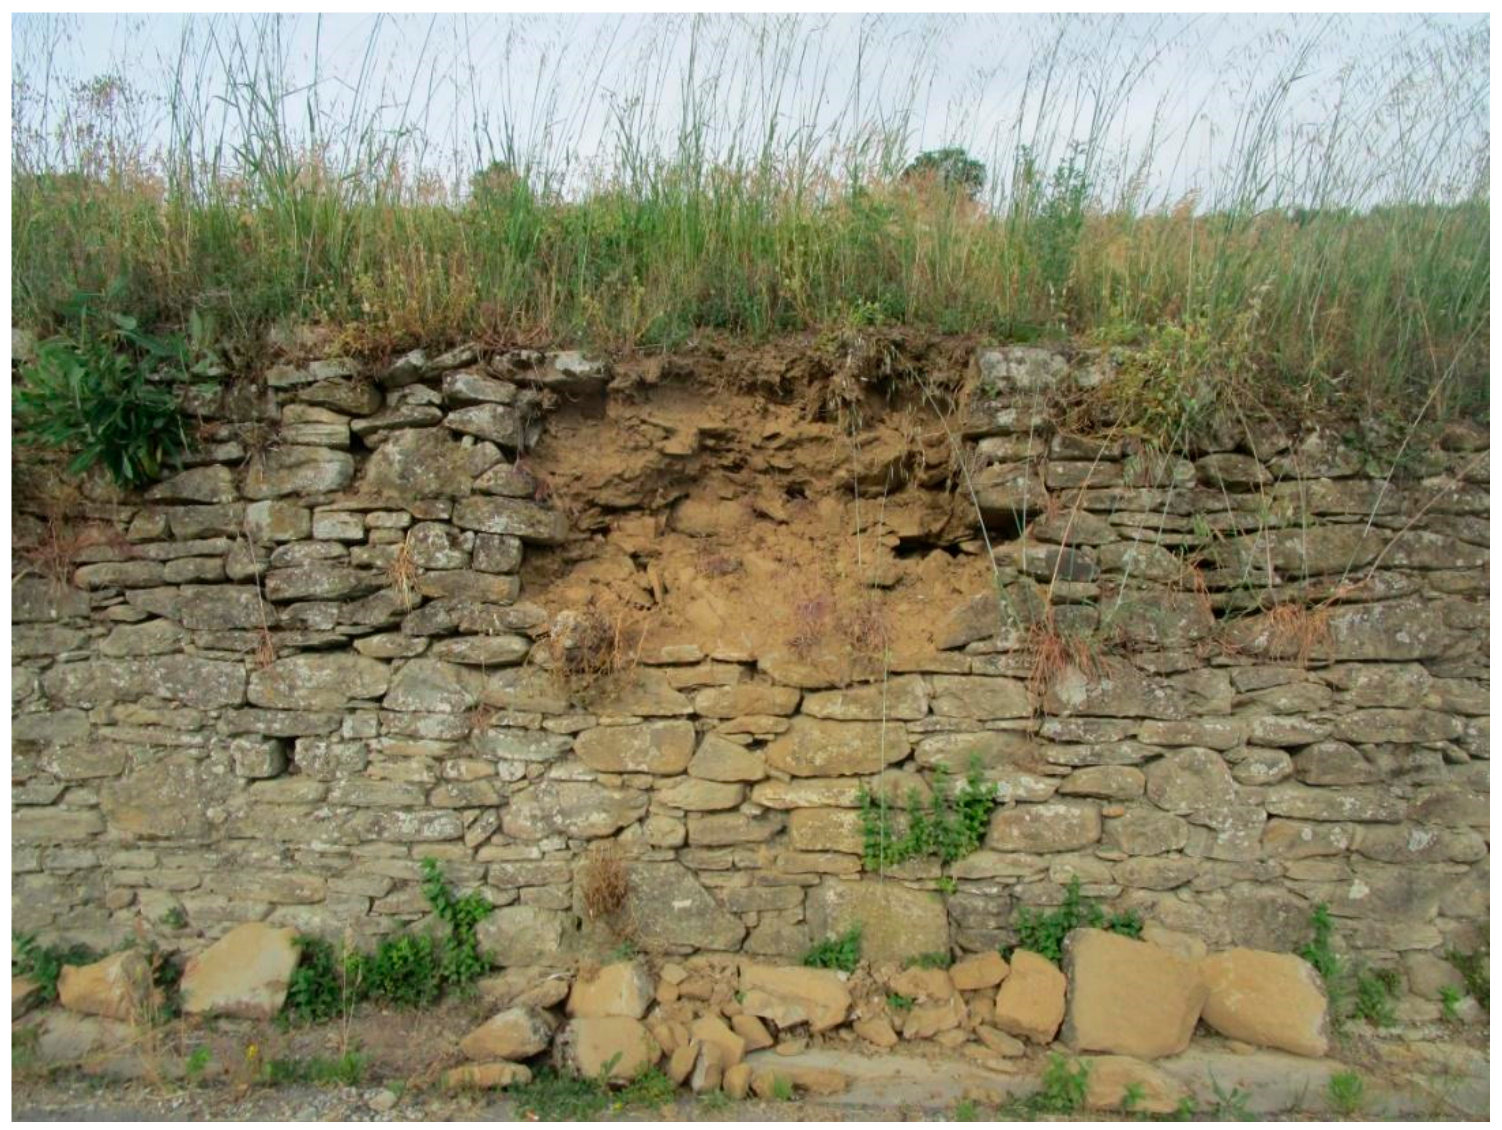
Appendix A. Damage Classes References Photos

Figure A1. Damage class 1—Regular.
Water 13 00113 g0a1
Figure A2. Damage class 2—Bulging in central and upper portion.
Water 13 00113 g0a2
Figure A3. Damage class 3—Bulging in downside.
Water 13 00113 g0a3
Figure A4. Damage class 4—Whole wall bulging, translation.
Water 13 00113 g0a4
Figure A5. Damage class 5—Failure.
Water 13 00113 g0a5
Figure A6. Damage class 6—Dry-stone wall missing.
Water 13 00113 g0a6

References

  1. Tarolli, P.; Preti, F.; Romano, N. Terraced landscapes: From an old best practice to a potential hazard for soil degradation due to land abandonment. Anthropocene 2014, 6, 10–25. [Google Scholar] [CrossRef]
  2. Arnáez-Vadillo, J.; Lana-Renault, N.; Lasanta, T.; Ruiz-Flaño, P.; Castroviejo, J. Effects of farming terraces on hydrological and geomorphological processes. A review. Catena 2015, 128, 122–134. [Google Scholar] [CrossRef] [Green Version]
  3. Agnoletti, M.; Conti, L.; Frezza, L.; Santoro, A. Territorial Analysis of the Agricultural Terraced Landscapes of Tuscany (Italy): Preliminary Results. Sustainability 2015, 7, 4564–4581. [Google Scholar] [CrossRef] [Green Version]
  4. Paliaga, G.; Luino, F.; Turconi, L.; De Graff, J.V.; Faccini, F. Terraced Landscapes on Portofino Promontory (Italy): Identification, Geo-Hydrological Hazard and Management. Water 2020, 12, 435. [Google Scholar] [CrossRef] [Green Version]
  5. Kiesow, S.; Bork, H.-R. Agricultural terraces as a proxy to landscape history on Madeira island, Portugal. Ler História 2017, 71, 127–152. [Google Scholar] [CrossRef]
  6. Marcu, A.; Viespe, C. Laser-grown ZnO nanowires for room-temperature SAW-sensor applications. Sens. Actuators B Chem. 2015, 208, 1–6. [Google Scholar] [CrossRef]
  7. Tarolli, P. Agricultural Terraces Special Issue Preface. Land Degrad. Dev. 2018, 29, 3544–3548. [Google Scholar] [CrossRef]
  8. Soriano, M.A.; Herath, S. Climate change and traditional upland paddy farming: A Philippine case study. Paddy Water Environ. 2019, 18, 317–330. [Google Scholar] [CrossRef]
  9. Fukamachi, K. Sustainability of terraced paddy fields in traditional satoyama landscapes of Japan. J. Environ. Manag. 2017, 202, 543–549. [Google Scholar] [CrossRef]
  10. Branch, N.P.; Kemp, R.A.; Silva, B.; Meddens, F.M.; Williams, A.; Kendall, A.; Pomacanchari, C.V. Testing the sustainability and sensitivity to climatic change of terrace agricultural systems in the Peruvian Andes: A pilot study. J. Archaeol. Sci. 2007, 34, 1–9. [Google Scholar] [CrossRef]
  11. Gao, X.; Roder, G.; Jiao, Y.-M.; Ding, Y.; Liu, Z.; Tarolli, P. Farmers’ landslide risk perceptions and willingness for restoration and conservation of world heritage site of Honghe Hani Rice Terraces, China. Landslides 2020, 17, 1915–1924. [Google Scholar] [CrossRef] [Green Version]
  12. Di Fazio, S.; Modica, G. Historic Rural Landscapes: Sustainable Planning Strategies and Action Criteria. The Italian Experience in the Global and European Context. Sustainability 2018, 10, 3834. [Google Scholar] [CrossRef] [Green Version]
  13. Ferrarese, F.; Pappalardo, S.E.; Cosner, A.; Brugnaro, S.; Alum, K.; Pozzo, A.D.; De Marchi, M. Mapping Agricultural Terraces in Italy. Methodologies Applied in the MAPTER Project. Environ. Hist. Mak. 2018, 179–194. [Google Scholar] [CrossRef]
  14. Savo, V.; Caneva, G.; McClatchey, W.; Reedy, D.; Salvati, L. Combining Environmental Factors and Agriculturalists’ Observations of Environmental Changes in the Traditional Terrace System of the Amalfi Coast (Southern Italy). AMBIO 2013, 43, 297–310. [Google Scholar] [CrossRef] [Green Version]
  15. Camera, C.; Apuani, T.; Masetti, M. A coupled distributed hydrological-stability analysis on a terraced slope of Valtellina (northern Italy). Hydrol. Earth Syst. Sci. Discuss. 2013, 10, 2287–2322. [Google Scholar] [CrossRef] [Green Version]
  16. Santoro, A.; Venturi, M.; Agnoletti, M. Agricultural Heritage Systems and Landscape Perception among Tourists. The Case of Lamole, Chianti (Italy). Sustainability 2020, 12, 3509. [Google Scholar] [CrossRef]
  17. Preti, F. Il Territorio Terrazzato: Punti Di Forza e Criticità. In Proceedings of the Il Futuro dei Terrazzamenti Sul Territorio del Montalbano tra Criticità e Sviluppo, Tuscany, Italy, 22 February 2020. [Google Scholar]
  18. Agnoletti, M.; Errico, A.; Santoro, A.; Dani, A.; Preti, F. Terraced Landscapes and Hydrogeological Risk. Effects of Land Abandonment in Cinque Terre (Italy) during Severe Rainfall Events. Sustainability 2019, 11, 235. [Google Scholar] [CrossRef] [Green Version]
  19. Dorren, L.; Rey, F. A review of the effect of terracing on erosion. Soil Conserv. Prot. Eur. 2004, 97–108. [Google Scholar]
  20. Arnáez, J.; Lasanta, T.; Errea, M.P.; Ortigosa, L. Land abandonment, landscape evolution, and soil erosion in a Spanish Mediterranean mountain region: The case of Camero Viejo. Land Degrad. Dev. 2011, 22, 537–550. [Google Scholar] [CrossRef]
  21. Raso, E.; Cevasco, A.; Di Martire, D.; Pepe, G.; Scarpellini, P.; Calcaterra, D.; Firpo, M. Landslide-inventory of the Cinque Terre National Park (Italy) and quantitative interaction with the trail network. J. Maps 2019, 15, 818–830. [Google Scholar] [CrossRef] [Green Version]
  22. Lasanta, T.; Ruiz-Flaño, P.; Lana-Renault, N.; Arnáez, J. Agricultural terraces in the Spanish mountains: An abandoned landscape and a potential resource. Bol. Asoc. Geógr. Esp. 2013, 63, 487–491. [Google Scholar]
  23. Dunjó, G.; Pardini, G.; Gispert, M. Land use change effects on abandoned terraced soils in a Mediterranean catchment, NE Spain. Catena 2003, 52, 23–37. [Google Scholar] [CrossRef]
  24. Rodrigo-Comino, J.; Martínez-Hernández, C.; Iserloh, T.; Cerdà, A. Contrasted Impact of Land Abandonment on Soil Erosion in Mediterranean Agriculture Fields. Pedosphere 2018, 28, 617–631. [Google Scholar] [CrossRef] [Green Version]
  25. Brown, A.; Walsh, K. Societal stability and environmental change: Examining the archaeology-soil erosion paradox. Geoarchaeology 2016, 32, 23–35. [Google Scholar] [CrossRef]
  26. Lesschen, J.P.; Cammeraat, L.H.; Nieman, T. Erosion and terrace failure due to agricultural land abandonment in a semi-arid environment. Earth Surf. Process. Landf. 2008, 33, 1574–1584. [Google Scholar] [CrossRef]
  27. Papalexiou, S.M.; Montanari, A. Global and Regional Increase of Precipitation Extremes under Global Warming. Water Resour. Res. 2019, 55, 4901–4914. [Google Scholar] [CrossRef]
  28. Bartolini, G.; Grifoni, D.; Magno, R.; Torrigiani, T.; Gozzini, B. Changes in temporal distribution of precipitation in a Mediterranean area (Tuscany, Italy) 1955–2013. Int. J. Clim. 2018, 38, 1366–1374. [Google Scholar] [CrossRef]
  29. Bartolini, G.; Grifoni, D.; Torrigiani, T.; Vallorani, R.; Meneguzzo, F.; Gozzini, B. Precipitation changes from two long-term hourly datasets in Tuscany, Italy. Int. J. Clim. 2014, 34, 3977–3985. [Google Scholar] [CrossRef]
  30. Dehn, M.; Bürger, G.; Buma, J.; Gasparetto, P. Impact of climate change on slope stability using expanded downscaling. Eng. Geol. 2000, 55, 193–204. [Google Scholar] [CrossRef]
  31. LaFevor, M.C. Restoration of degraded agricultural terraces: Rebuilding landscape structure and process. J. Environ. Manag. 2014, 138, 32–42. [Google Scholar] [CrossRef]
  32. Chaplot, V.; Brown, J.; Dlamini, P.; Eustice, T.; Janeau, J.-L.; Jewitt, G.; Lorentz, S.; Martin, L.; Nontokozo-Mchunu, C.; Oakes, E.; et al. Rainfall simulation to identify the storm-scale mechanisms of gully bank retreat. Agric. Water Manag. 2011, 98, 1704–1710. [Google Scholar] [CrossRef] [Green Version]
  33. Chaplot, V. Impact of terrain attributes, parent material and soil types on gully erosion. Geomorphology 2013, 186, 1–11. [Google Scholar] [CrossRef]
  34. Cucchiaro, S.; Fallu, D.J.; Zhang, H.; Walsh, K.; Van Oost, K.; Brown, A.G.; Tarolli, P. Multiplatform-SfM and TLS Data Fusion for Monitoring Agricultural Terraces in Complex Topographic and Landcover Conditions. Remote Sens. 2020, 12, 1946. [Google Scholar] [CrossRef]
  35. Passalacqua, P.; Tarolli, P.; Georgiou, E.F. Testing space-scale methodologies for automatic geomorphic feature extraction from lidar in a complex mountainous landscape. Water Resour. Res. 2010, 46, 1–17. [Google Scholar] [CrossRef] [Green Version]
  36. Tarolli, P.; Sofia, G.; Calligaro, S.; Prosdocimi, M.; Preti, F.; Fontana, G.D. Vineyards in Terraced Landscapes: New Opportunities from Lidar Data. Land Degrad. Dev. 2015, 26, 92–102. [Google Scholar] [CrossRef]
  37. Pijl, A.; Tosoni, M.; Roder, G.; Sofia, G.; Tarolli, P. Design of Terrace Drainage Networks Using UAV-Based High-Resolution Topographic Data. Water 2019, 11, 814. [Google Scholar] [CrossRef] [Green Version]
  38. Spanò, A.; Sammartano, G.; Tunin, F.C.; Cerise, S.; Possi, G. GIS-based detection of terraced landscape heritage: Comparative tests using regional DEMs and UAV data. Appl. Geomat. 2018, 10, 77–97. [Google Scholar] [CrossRef] [Green Version]
  39. Tarolli, P.; Fontana, G.D. Hillslope-to-valley transition morphology: New opportunities from high resolution DTMs. Geomorphology 2009, 113, 47–56. [Google Scholar] [CrossRef]
  40. Sofia, G.; Tarolli, P.; Cazorzi, F.; Fontana, G.D. An objective approach for feature extraction: Distribution analysis and statistical descriptors for scale choice and channel network identification. Hydrol. Earth Syst. Sci. 2011, 15, 1387–1402. [Google Scholar] [CrossRef] [Green Version]
  41. Tarolli, P.; Sofia, G.; Fontana, G.D. Geomorphic features extraction from high-resolution topography: Landslide crowns and bank erosion. Nat. Hazards 2012, 61, 65–83. [Google Scholar] [CrossRef]
  42. Sofia, G.; Pirotti, F.; Tarolli, P. Variations in multiscale curvature distribution and signatures of LiDAR DTM errors. Earth Surf. Process. Landf. 2013, 38, 1116–1134. [Google Scholar] [CrossRef]
  43. Sofia, G.; Fontana, G.D.; Tarolli, P. High-resolution topography and anthropogenic feature extraction: Testing geomorphometric parameters in floodplains. Hydrol. Process. 2013, 28, 2046–2061. [Google Scholar] [CrossRef]
  44. Preti, F.; Tarolli, P.; Dani, A.; Calligaro, S.; Prosdocimi, M. LiDAR derived high resolution topography: The next challenge for the analysis of terraces stability and vineyard soil erosion. J. Agric. Eng. 2013, 44, 44. [Google Scholar] [CrossRef]
  45. Lin, C.-W.; Tseng, C.-M.; Tseng, Y.-H.; Fei, L.-Y.; Hsieh, Y.-C.; Tarolli, P. Recognition of large scale deep-seated landslides in forest areas of Taiwan using high resolution topography. J. Asian Earth Sci. 2013, 62, 389–400. [Google Scholar] [CrossRef]
  46. Tucci, G.; Parisi, E.I.; Castelli, G.; Errico, A.; Corongiu, M.; Sona, G.; Viviani, E.; Bresci, E.; Preti, F. Multi-Sensor UAV Application for Thermal Analysis on a Dry-Stone Terraced Vineyard in Rural Tuscany Landscape. ISPRS Int. J. Geo-Inf. 2019, 8, 87. [Google Scholar] [CrossRef] [Green Version]
  47. Forzieri, G.; Guarnieri, L.; Vivoni, E.R.; Castelli, F.; Preti, F. Spectral-ALS data fusion for different roughness parameterizations of forested floodplains. River Res. Appl. 2011, 27, 826–840. [Google Scholar] [CrossRef]
  48. Forzieri, G.; Castelli, F.; Preti, F. Advances in remote sensing of hydraulic roughness. Int. J. Remote Sens. 2011, 33, 630–654. [Google Scholar] [CrossRef]
  49. Franceschi, S.; Antonello, A.; Floreancig, V.; Gianelle, D.; Comiti, F.; Tonon, G. Identifying treetops from aerial laser scanning data with particle swarming optimization. Eur. J. Remote Sens. 2018, 51, 945–964. [Google Scholar] [CrossRef] [Green Version]
  50. Chaplot, V.; Darboux, F.; Bourennane, H.; Leguédois, S.; Silvera, N.; Phachomphon, K. Accuracy of interpolation techniques for the derivation of digital elevation models in relation to landform types and data density. Geomorphology 2006, 77, 126–141. [Google Scholar] [CrossRef]
  51. Jenkins, D.G.; McCauley, L.A. GIS, SINKS, FILL, and disappearing wetlands: Unintended consequences in algorithm development and use. In Proceedings of the ACM Symposium on Applied Computing, Dijon, France, 23–27 April 2006; Volume 1, pp. 277–282. [Google Scholar]
  52. Kinner, D.; Mitasova, H.; Harmon, R.S.; Toma, L.; Stallard, R.; Russell, S. GIS-based Stream Network Analysis for The Chagres River Basin, Republic of Panama. In B. Chapter Rio Chagres A Multidiscip. Profile a Trop, Watershed; Springer: Berlin/Heidelberg, Germany, 2005; pp. 83–95. [Google Scholar]
  53. Hofierka, J.; Knutová, M. Simulating spatial aspects of a flash flood using the Monte Carlo method and GRASS GIS: A case study of the Malá Svinka Basin (Slovakia). Open Geosci. 2015, 7, 118–125. [Google Scholar] [CrossRef]
  54. Benini, G. Sistemazioni Idraulico-Forestali; UTET: Turin, Italy, 1990; p. 283. [Google Scholar]
  55. Preti, F.; Errico, A.; Caruso, M.; Dani, A.; Guastini, E. Dry-stone wall terrace monitoring and modelling. Land Degrad. Dev. 2018, 29, 1806–1818. [Google Scholar] [CrossRef]
  56. Preti, F.; Guastini, E.; Penna, D.; Dani, A.; Cassiani, G.; Boaga, J.; Deiana, R.; Romano, N.; Nasta, P.; Palladino, M.; et al. Conceptualization of Water Flow Pathways in Agricultural Terraced Landscapes. Land Degrad. Dev. 2018, 29, 651–662. [Google Scholar] [CrossRef]
  57. Errico, A.; Castelli, G.; Penna, D.; Preti, F. Terracing: From Agriculture to Multiple Ecosystem Services. In Oxford Research Encyclopedia of Environmental Science; Oxford University Press: Oxford, UK, 2019. [Google Scholar]
  58. Lazo, P.; Giovanny, M.M.; McDonnell, J.J.; Crespo, P. The role of vegetation, soils, and precipitation on water storage and hydrological services in Andean Páramo catchments. J. Hydrol. 2019, 572, 805–819. [Google Scholar] [CrossRef]
  59. Penna, D.; Van Meerveld, I.; Zuecco, G.; Fontana, G.D.; Borga, M. Hydrological response of an Alpine catchment to rainfall and snowmelt events. J. Hydrol. 2016, 537, 382–397. [Google Scholar] [CrossRef]
  60. Camera, C.; Apuani, T.; Masetti, M. Mechanisms of failure on terraced slopes: The Valtellina case (Northern Italy). Landslides 2012, 11, 43–54. [Google Scholar] [CrossRef]
  61. Mentges, M.I.; Reichert, J.M.; Rodrigues, M.F.; Awe, G.O.; Mentges, L.R. Capacity and intensity soil aeration properties affected by granulometry, moisture, and structure in no-tillage soils. Geoderma 2016, 263, 47–59. [Google Scholar] [CrossRef]
Figure 1. Location of the study area.
Water 13 00113 g001
Figure 2. (A) Purpose-built instrument to measure deformation consisting of two graduated wooden strips and a plumb line to carry out horizontal measurements and allow the correct positioning of the instrument. (B) Example of dry-stone wall failure (Mugello area), damage scale 5.
Water 13 00113 g002
Figure 3. Measuring the amount of deformation for two examples of damage types.
Water 13 00113 g003
Figure 4. 3D representation of the flow accumulation map of the two study areas (Scale: Mugello 1:10,000; Montalbano 1:25,000). The survey points are shown in red. The color coding shows the amount of overland flow that traverses each cell (1 × 1 m).
Water 13 00113 g004
Figure 5. Water discharge maps for simulations with precipitation values of (A) 5 mm/h, (B) 50 mm/h, and (C) 180 mm/h. (D) Legend of the water discharge for each simulation. Values in scientific notation for high variability. Map Scale 1:10,000.
Water 13 00113 g005
Figure 6. Relationship between the subjective damage scale (Table 1) and the in situ deformation measurements (Df or Db) of the dry-stone walls in the Mugello region. The graphs on the right show the histogram and Q-Q plot of the residuals of the regression model—Boxplot: Box = 1.5 × IQR, Q1, Q2, Q3; Whiskers = Min and Max.
Water 13 00113 g006
Figure 7. Box plot of the relationship between the subjective damage class and the flow accumulation values (logarithmic scale)—Boxplot: Box = 1.5 × IQR, Q1, Q2, Q3; Whiskers = Min and Max. (a): Mugello case, (b): Montalbano case.
Water 13 00113 g007
Figure 8. Scatter plot of the damage classes and flow accumulations from both areas.
Water 13 00113 g008
Figure 9. Box plot of the combined dataset and the addition of two values obtained from the Lamole and Carmignano regions (Tuscany, central Italy) [17]. The ordinate now shows the median of the flow accumulation. The graphs on the right show the histogram and Q-Q-plot of the residuals of the regression model—Boxplot: Box = 1.5 × IQR, Q1, Q2, Q3; Whiskers = Min and Max.
Water 13 00113 g009
Figure 10. Scatter plot of the wall deformation (Df or Db) vs. logarithmic flow accumulation values.
Water 13 00113 g010
Figure 11. Scatter plots and linear regression for water discharge versus flow accumulation for three precipitation intensities. See Table 3 for the correlation coefficients. While in 5–50 mm/h simulation water discharge has similar increase of intensity (10 times), in 50–180 mm/h comparison, water discharge shows a reduction of dispersion.
Water 13 00113 g011
Figure 12. Relation between water discharge values for different precipitation intensities.
Water 13 00113 g012
Figure 13. Box plots comparing water discharge and wall damage (using the subjective damage classification scale) for the three precipitation scenarios—Boxplot: Box = 1.5 × IQR, Q1, Q2, Q3; Whiskers = Min and Max.
Water 13 00113 g013
Figure 14. Comparing water discharge rates and dry wall deformations (Df or Db) for the three precipitation scenarios.
Water 13 00113 g014
Table 1. Damage type classification developed for this study (cf., Figure 2B and Figure 3).
Damage TypeDamage Scale
Regular (Undamaged)1
Bulging in central and upper portion2
Bulging in lower portion3
Whole wall bulging, translation4
Failure5
Dry-stone wall missing6
Table 2. Runoff coefficients adopted for the water discharge analyses [54].
Land UseSlopeSoil Type
LightMediumHeavy
Forest<10%0.130.180.25
>10% 0.160.210.36
Pasture<10%0.160.160.22
>10% 0.220.420.62
Agriculture<10%0.400.600.70
>10% 0.520.720.82
Table 3. Results of the statistical regression analysis of water discharge versus flow accumulation (Figure 11).
Rainfall Intensity5 mm/h50 mm/h180 mm/h
Residual standard error0.0190.0080.185
R20.130.160.07
p0.0590.0070.003
Table 4. Statistical analysis of the relationships between the damage scale, the deformation with the water discharge.
5mm/h50 mm/h180 mm/h
Damage scale vs. Water discharge
R20.0180.0220.087
p0.15470.12260.001
Deformation vs. Water discharge
R20.130.130.18
p0.0290.0290.01
Publisher’s Note: MDPI stays neutral with regard to jurisdictional claims in published maps and institutional affiliations.

