Article

Fish Response to Multiple Anthropogenic Stressors in Mediterranean Coastal Lagoons: A Comparative Study of the Role of Different Management Strategies

1
Institute of Polar Sciences, ISP-CNR, 30172 Venice-Mestre, Italy
2
Centro di ricerca “Zootecnia e Acquacoltura”-Consiglio per la Ricerca in Agricoltura e l′Analisi dell′Economia Agraria (CREA), Monterotondo, 00015 Rome, Italy
3
Dipartimento di Scienze Ambientali, Informatica e Statistica (DAIS)–Università Ca’ Foscari di Venezia, 30172 Venice-Mestre, Italy
4
Dipartimento di Biologia–Università degli Studi di Roma “Tor Vergata”, 00133 Rome, Italy
*
Author to whom correspondence should be addressed.
Water 2021, 13(2), 130; https://doi.org/10.3390/w13020130
Submission received: 30 November 2020 / Revised: 26 December 2020 / Accepted: 5 January 2021 / Published: 8 January 2021

Abstract

:
Transitional waters are among the most productive ecosystems of the world and their biotic communities show high diversity and complex mechanisms of self-regulation that provide valuable ecosystem services and societal goods and benefits. In this work a comparison of the fish assemblages of three non-tidal Mediterranean coastal lagoons is carried out in order to evaluate the impacts of alternative management strategies. The anthropogenic pressures acting on the lagoons were quantified by means of categorical indicators, while the characteristics of the fish assemblages were summarized in multi-metric indices (MMIs). Two MMIs were developed using data collected with a beach seine net and with fyke nets, following an empirical approach that selects, from a pool of 73 metrics, the combination that maximizes the MMI/pressure relationship. The two MMIs include four metrics each, most of which are based on feeding mode functional guilds and habitat use functional guilds, and they are sensitive to anthropogenic pressures. The human activities directly or indirectly affecting water quality are the ones that most influence the fish assemblage, while the presence of artisanal fisheries, a typical and relevant resource use in these lagoons, seems to play a beneficial role. Lagoon fisheries management relies on the maintenance of infrastructures that guarantee the hydraulic functioning of the lagoon, thus ensuring exchanges with the adjacent coastal sea, and therefore indirectly contributing to the habitat quality.

1. Introduction

Transitional waters are among the most productive ecosystems of the world. Their biotic communities show high diversity and complex mechanisms of self-regulation [1]. Hence, they provide valuable ecosystem services and societal goods and benefits [2] to human livelihood [3,4,5].
Coastal, estuarine, and lagoon environments are increasingly threatened by impacts due to anthropogenic pressures at the local scale, such as industrialization, urbanization, agriculture, and aquaculture expansion [3], and at the global scale, such as climate change and the invasion by exotic species or non-indigenous species [4]. These impacts often overlap, with cumulative effects [6,7] that will worsen in the future, and that lead to noticeable changes in the structure and functioning of coastal lagoon ecosystems.
Successful and sustainable management of transitional habitats is based on an in-depth knowledge of these ecosystems, taking into account their environmental characteristics, their variability and complexity, and the connectivity degree between lagoon and sea [3]. In this perspective, the assessment of the lagoon environmental quality is a crucial step to detect changes and to identify and implement proper management strategies [3].
To this end, the Water Framework Directive (WFD) [8], which is the EU reference framework ensuring the protection of European waters, also includes fish assemblages among the different other biological quality elements, hydro-morphological and physico-chemical water quality parameters for assessing the Ecological Quality Status of transitional waters. One common approach for monitoring biological quality elements relies on the use of multi-metric indices (MMIs) [9,10]. MMIs are tools commonly used to summarize data and to evaluate the “integrity” of an ecosystem, integrating information at different levels of organization [11,12]. Their popularity is related to the fact that they usually show a higher sensitivity to human impacts than single metric indices [13,14]. They can be applied in very complex systems, being useful even if the underlying causal process is poorly known [15]. The recent boost due to the implementation of the Water Framework Directive helped to bring attention to these tools, but there is still a limited number of applications for fish fauna in transitional waters, in particular with only few examples available for coastal lagoons [10]. In order to analyze the sensitivity to human impacts, quantitative assessments of the anthropogenic pressures acting on transitional ecosystems have been carried out [16,17,18,19,20,21,22,23,24,25]. Different methodologies for the assessment of the ecological status of transitional waters have been developed for the Atlantic region [25,26], but most methods that have been proposed for the Mediterranean were not focused on small coastal lakes [20,27,28].
Knowledge of fish assemblages and of the overall functioning of transitional ecosystems is variable among lagoon and estuary ecosystems across Europe. Most studies focus on macro-tidal ecosystems on the Atlantic and the North Sea coasts, while only a few studies have been performed on Mediterranean coastal lagoons [4,9,10,29,30]. As most of them deal with large ecosystems, little information is available on small lagoons with reduced tide influence, which are the main typology represented in the Mediterranean region [31].
This work focuses on a comparative assessment of the fish assemblages of three coastal lagoons located along the Tyrrhenian coast of central Italy, the Circeo coastal lagoons included in the Circeo National Park. A detailed evaluation of anthropogenic pressures affecting the three lagoons was carried out and multi-metric fish-based indices were developed to link fish assemblages with indicators of anthropogenic pressures, and reveal changes related to both human activities and management actions. The lagoons analyzed in this study share a common geological origin, general geographic setting, and environmental background, but differ in management options, although since 1975 all are included in the National Park. Fogliano and Caprolace are state-owned and directly managed by the Park Authority, which first limited and then, in 2007, definitively banned the traditional small-scale fisheries. Today the Park focuses on species and habitats conservation, education, and research. Conversely, Sabaudia is privately owned and has been rented since 2007 to local entrepreneurs that have exclusive exploitation rights, targeting both fishery and aquaculture activities. For these reasons, the Circeo coastal lagoons offer an interesting opportunity to evaluate the relative roles of lagoon management strategies and anthropogenic pressures on fish assemblages and fisheries.
Against this background, the aim of the present study is to address the crucial issue of relationship between the fish assemblage structure and lagoon management strategies. Specific objectives of this study are: (i) to test possible effects of pressures and management changes on fish assemblages over time, comparing the fish assemblages of Fogliano and Caprolace lagoons during three years to changes in anthropogenic pressures and impacts; (ii) to compare the role of lagoon features and management strategies in shaping fish assemblages in Fogliano, Caprolace, and Sabaudia.

2. Materials and Methods

2.1. Study Sites

The study was carried out in three lagoons located on the western coast of central Italy within the Circeo National Park (CNP): Fogliano, Caprolace, and Sabaudia. They are non-tidal (<50 cm), euhaline lagoons (average 30 psu) within the Mediterranean ecoregion following the classification of transitional waters under the WFD [8].
Fogliano and Caprolace have two tidal inlets each, but they are connected to the sea through only one main active tidal channel (Figure 1 and Table 1) equipped with a hydraulic weir for water exchange control. The two lagoons share some features, such as the orientation parallel to the coast and the regular shape due to banks consolidation carried out in the late 1920s within the reclamation of the whole area. After reclamation, freshwater inputs reduced due to the increased demand for irrigation. In the 1980s, all tributaries were closed as carriers of nutrient-rich waters from the surrounding fields run-off. Therefore, today the lagoons do not have superficial freshwater tributaries.
Sabaudia has an irregular shape with a central, elongated part and five branches whose contour originates from the surrounding landscape. Freshwater inputs are provided by three superficial tributaries. The lagoon is connected to the sea by two tidal inlets located in the southern and northern part of the basin (Figure 1 and Table 1).
The surrounding area is characterized by intensive agriculture and livestock, which results in pollution of water bodies mostly by superficial run-off. From 2010 to 2014, the CNP area underwent an environmental restoration program to reduce the impact of agricultural pollution by creating ecotone strips and constructed wetlands [32].

2.2. Data Collection

2.2.1. Fish Data

For the purpose of this study, fish assemblage data obtained from previous studies carried out in Fogliano and Caprolace in 2006 and 2007 [33] were combined with an ad hoc data collection campaign carried out in 2012 (Table 2).
In both lagoons, sampling was originally performed year round at four stations (Stations 1–4, Figure 1) with a seine net in 2006 and 2007, whereas additional sampling activity was carried out by fyke netting in 2006. In each lagoon, Station 2 is more confined, Station 4 is the most influenced by tidal exchange, and the other two stations possess intermediate characteristics (Figure 1). The location of the sampling stations was chosen by dividing the lagoons into sectors with approximately the same surface (Figure 1), taking into account the morphological features of the water basins and the position of the tidal channels. In 2012, sampling occurred in spring, summer, and autumn at all sampling sites (1–4, Figure 1), similar to the design of the previous campaigns (2006 and 2007) in Fogliano and Caprolace, and in four sampling sites identified following the same scheme in Sabaudia. Sampling was always carried out during daylight hours with the seine net (SeN) (a small beach seine net, 10.0 m long with a 2.0 m central bag and 1.5 mm mesh size), while fyke nets (FyNs) (cone-shaped, unbaited traps, 2.70 m long, six chambers, 40.0 cm mouth diameter, 2.50 m wings, and 2.0 cm mesh size) were installed at dusk, and fish collected on the following morning. Fish were sacrificed and transported in ice boxes to the laboratory, sorted and identified at the species level, counted and weighted (±0.1 g). All fish species were assigned to feeding mode functional guilds (FMFGs) [30] and habitat use functional guilds (HUFGs) [35], using the classification given in Catalano et al. [28] and in Zucchetta et al. [22]. Species abundance and biomass density were calculated as the number of individuals and weight (g) per 150 m2 sampling area per day for seine net, and the number of individuals and weight (g) per gear per night after the setting for fyke net.

2.2.2. Anthropogenic Pressures

A detailed quantification of the anthropogenic pressures was carried out for each water body based on the approach by Aubry and Elliott [36]. The sectors identified for designing field campaigns were considered also for the quantification of the anthropogenic pressures (see Section 2.2.1. Fish data). A specific set of indicators of pressures/impacts relevant to the water bodies typology considered in this study were ranked on a scale between 0 (no pressure) and 9 (very high pressure) (Table 3 and Table S1).
The approach was similar to the one previously used for European estuaries [13,25,37], as well as for other Mediterranean lagoons [21,22,23]. The 12 pressure indicators were grouped into three categories (see Table 3 for the full description of pressure indicators and Table S1 in Supplementary Material for the detailed evaluation scheme). The scores of the pressure indicators contributed as the arithmetic mean to the assessment of values for three Category Pressure Indices (CPIs): (i) changes in morphology and hydrology (Morphology), (ii) landscape and use of resource (Use), and (iii) water quality (Quality). CPI scores concurred in turn with the calculation of a final Pressure Index, as the arithmetic mean of the three pressure categories. Some pressures were considered as time-invariant (exchange, banks, inlet, surface freshwater tributaries (FW supply), and landscape), while others were assessed seasonally or annually within the study period (dissolved oxygen (DO), chlorophyll (Chl-a), dissolved inorganic nitrogen (DIN), and reactive phosphorus (RP); aquaculture, fishery and barrier, respectively). Because of unavailability of data or addressing the morphological features of the water basins as a whole, some pressures (exchange, inlet, fishery, fixed barrier, and all the quality indicators) were evaluated at the spatial level of the “whole lagoon” instead of the level of “sector.” Fish data were related to the values of pressure indices of the season/year of sampling and of the sector in which the sampling station was located.

2.2.3. Multi-Metric Index Development

The multi-metric index (MMI) development followed the procedure presented in Zucchetta et al. [22], i.e., a multi-step process to derive empirical MMIs (based on the correlative approach) from a set of candidate metrics (73 metrics; Table S2). These metrics, representing different aspects of fish assemblages, including abundance, biomass, taxonomic diversity, and functional structure [9], were calculated separately, starting from the two data sets created upon the fish assemblages described by the two fishing gear types. The procedure of developing MMIs was carried out independently using the two data sets, leading to two different indices. The procedure mimics algorithmically the most common steps approached in the development of fish-based MMIs [9]. These steps are: (i) metric pre-selection—the metrics are short-listed from the original candidates, considering several features such as their ecological interpretability or their numerical properties (collinearity, redundancy, etc.); (ii) metric pre-treatment—an evaluation is carried out of the opportunity to numerically transform the data; (iii) determination of reference conditions and computation of Ecological Quality Ratios—a reference condition system has to be defined based on theoretical assumptions, availability of historical data representing pristine conditions, or modeling approaches; (iv) indicator selection and combination in a multi-metric index—aggregation rules should be specified by either considering the maximization of the pressure/index relationship or taking into account the ecological interpretability of the index [22].
Taking into account the aim of this work and after an exploration of several alternative strategies, as suggested in Zucchetta et al. [22], the following strategy was adopted for developing the MMIs: (i) all candidate metrics were retained, excluding only zero-inflated variables (number of zeros exceeding 50% of all observations) and redundant variables (showing a Pearson correlation index higher than 0.95 with another candidate metrics); (ii) metrics showing skewed distribution were log-transformed; (iii) quantile regressions [42] were used to estimate the pressure/metrics relationship and to infer the reference condition. This was done by extrapolating the expected values for τ 0.9 (i.e., 90th quantile) at a null pressure level (i.e., in no pressure condition with reference to that particular metric), following the approach presented in Zucchetta et al. [22] for taking into account the season and habitat-specific effect. After the estimation of reference conditions, the metrics were expressed as standardized variables, dividing the computed values by the estimated reference conditions; (iv) metrics retained after the previous steps were combined in an MMI by averaging their values, exploring the possible combinations, to select the one that maximized the strength of the correlation between the MMI and the Pressure Index [15].

2.3. Data Analysis

Generalized linear models (GLMs) for anthropogenic pressure categories, seine net-based MMI (SeN-MMI) and fyke net-based MMI (FyN-MMI), and for the metrics included in the MMIs were fitted to explore differences among lagoons and among years. The comparison between lagoons over time (i.e., Fogliano and Caprolace for the years 2006, 2007, 2012) was performed for each response variable considering a two-way interaction between the factors (years and lagoon). In contrast, a single factor (lagoons) was considered for the comparison among Fogliano, Caprolace, and Sabaudia in 2012. For each response variable, the most suitable model family was selected, graphically checking the assumptions, considering the distribution of the residuals and the mean–variance relationship. When significant differences were encountered, a post hoc Bonferroni–Holm test was applied to evaluate the interaction between factors.
Pearson correlations were used to explore the associations between pressures and MMIs, considering all the pressure indicators and the category indices and both the MMIs and the metrics selected in the MMIs. All statistical analyses were performed in R (R Core Team, 2020), using the libraries DHARMa [43] for checking the residuals and lsmeans for post hoc comparison [44].

3. Results

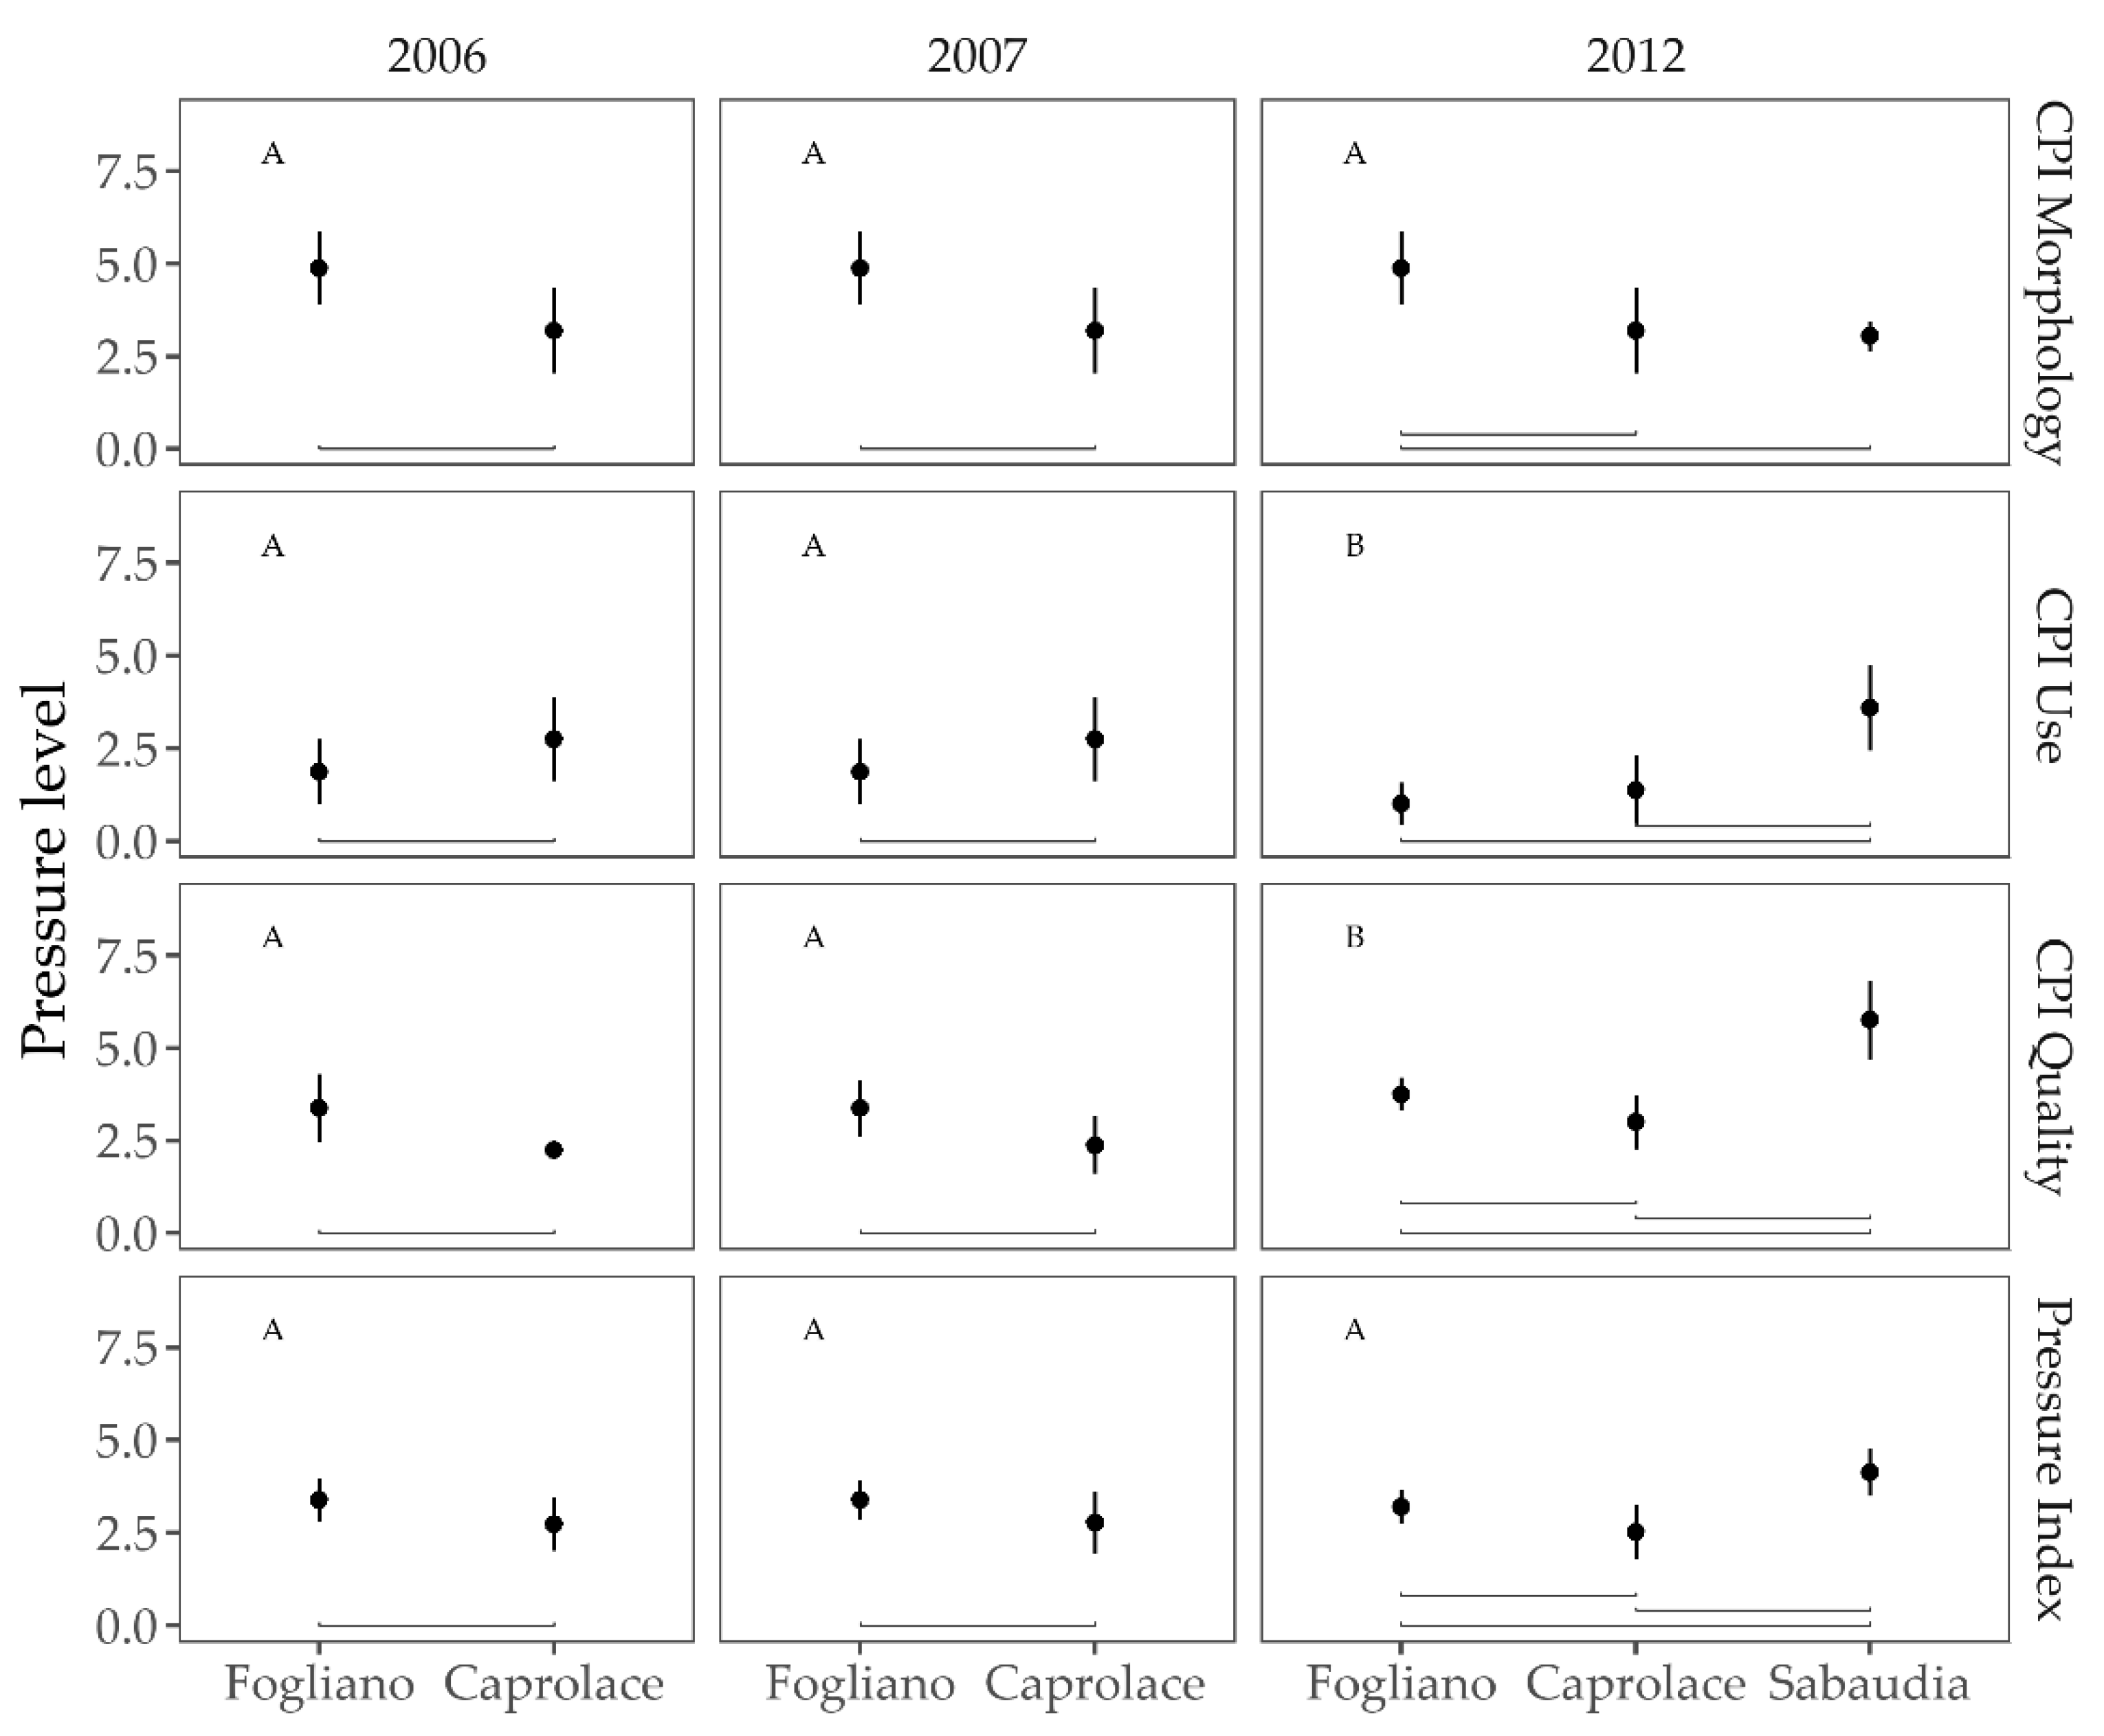
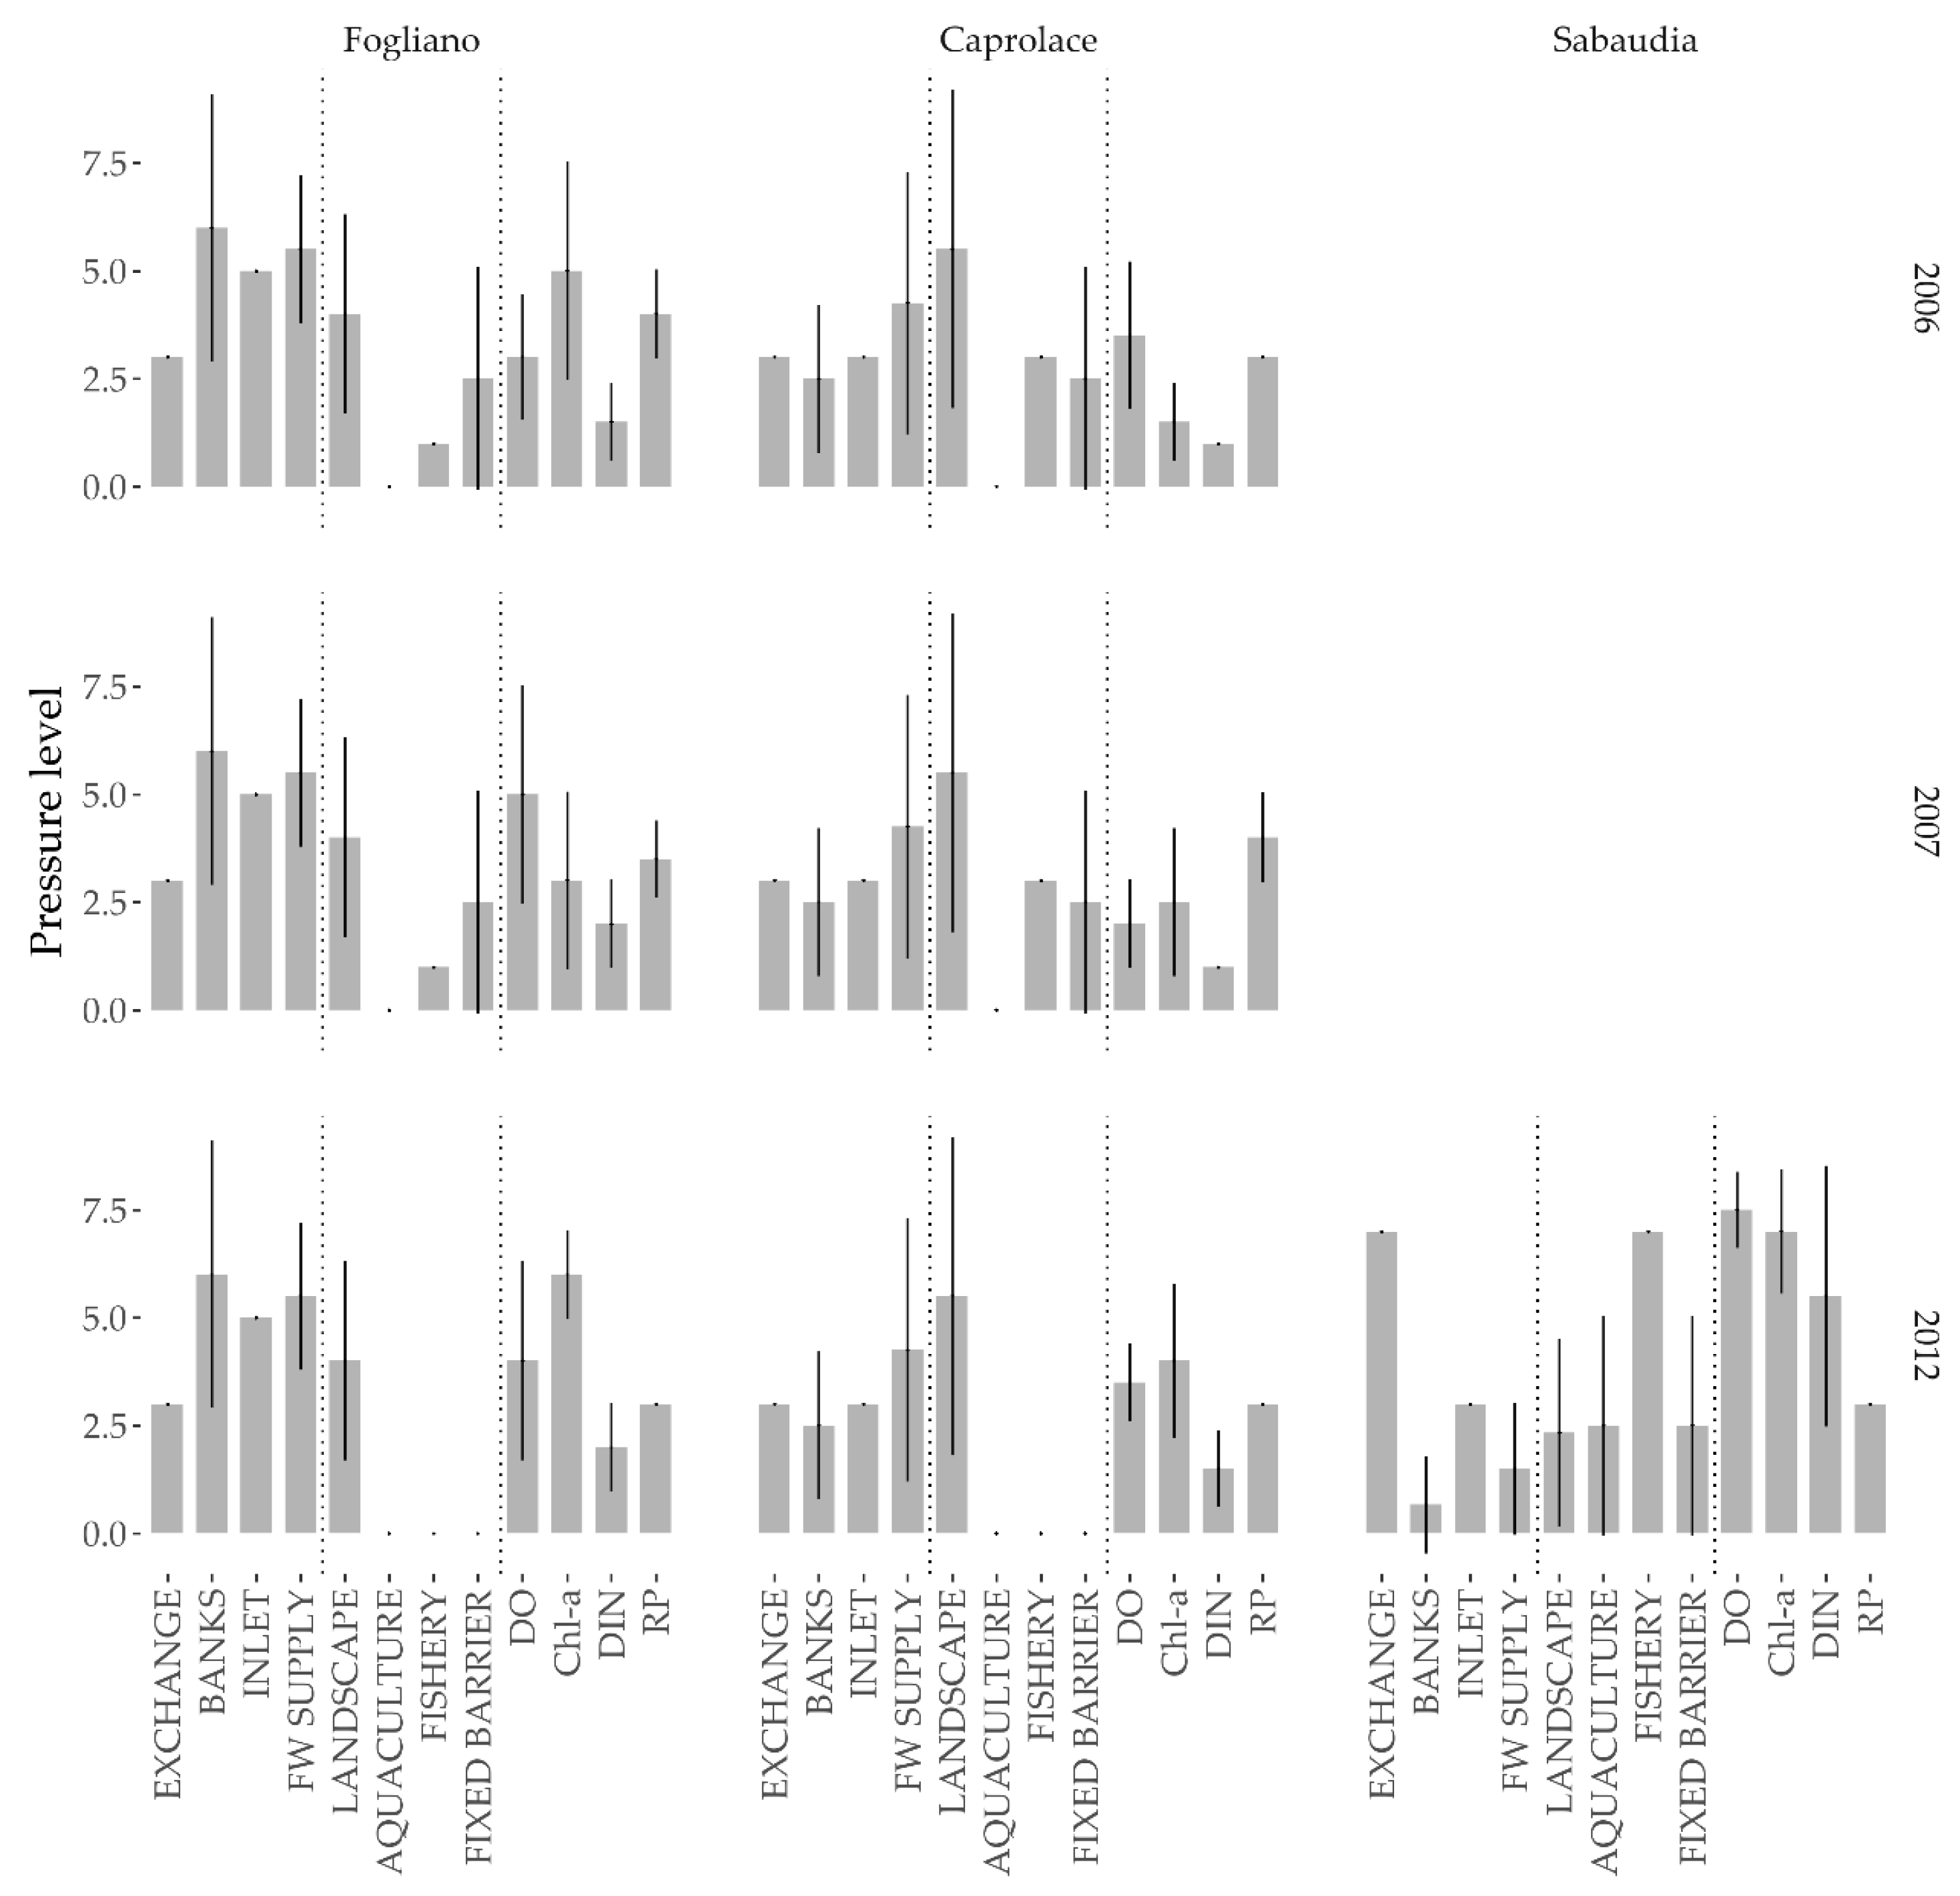
3.1. Anthropogenic Pressures

At the basin scale, the comparison over time of the anthropogenic pressures acting on Fogliano and Caprolace showed differences between lagoons (F = 0.99; p = 0.38). No changes over time in morphological pressures were observed, while the Pressure Index differed between the two lagoons but with no relevant changes over time (F = 23.50, p < 0.001) with higher pressure levels in Fogliano than in Caprolace in the three years (Figure 2).
Concerning the morphological pressures (CPI Morphology), Fogliano presented the highest values (F = 59.54, p < 0.001) because strongly affected by its hydro-morphological features, in particular, related to the noticeable modification of natural banks, the absence of direct freshwater inputs, and a low efficiency of the tidal inlets (Figure 3). In contrast, in reference to the Use category pressure (CPI Use), lower values were observed for 2012 (F = 15.53, p < 0.001) that can be ascribed to the changes in the use of resources. Specifically, even if the fishery pressure levels were low before 2012, fishery was banned in 2007, and the Park Authority dismantled the fish barrier. Indeed, in 2012, these resource use indicators had no influence, and the pressure resulting from landscape use was the only one weighing on the final CPI value. Indeed, agriculture and animal husbandry are widespread in the area surrounding the lagoons, especially nearby Caprolace (Figure 3).
For the pressures related to Quality (CPI Quality), differences between lagoons resulted significant (F = 46.95, p < 0.001). Moreover, an increase of the impact/pressures in 2012 was observed in both lagoons (F = 6.48, p < 0.01), with a poorer condition due to the low oxygen content (higher pressure in the plot) and high chlorophyll concentration (Figure 3).
Comparing all three lagoons, which was possible for the year 2012 (Figure 2), Sabaudia showed morphological pressure similar to the one for Caprolace (post hoc Bonferroni–Holm test: p = 0.597), and lower than the one observed for Fogliano (FOG-SAB, p < 0.001). Pressure/impact levels for Use were higher in Sabaudia than in the other lagoons (CAP-SAB, p < 0.001; FOG-SAB, p < 0.001), and the same applied to Quality (FOG-SAB, p < 0.001; CAP-SAB, p < 0.001). Hence, Sabaudia was the lagoon showing the higher overall pressure level (p < 0.001).
In detail, at Fogliano and Caprolace, the indicators relative to the Use of resources had no relevance, fisheries being forbidden (Figure 2), in contrast to Sabaudia where fishery and aquaculture activities have a role in driving the score of the Use category Pressure Index.
As far as CPI Quality pressures are concerned, evaluated on annual average values recorded at the surface waters, the highest CPI Quality values, i.e., the worst conditions, were recorded in Sabaudia (driven above all by oxygen indicators, nitrogen, and chlorophyll), definitely different from the other two lagoons. The lowest value was found at Caprolace, and intermediate in Fogliano (Figure 3).

3.2. Fish Assemblages of the Circeo Coastal Lagoons

3.2.1. Composition of Fish Assemblage

Based on the results of sampling campaigns, the same species list resulted in the three lagoons along the three years of study (Table 4 and Table 5). In terms of fish species composition based on functional categories (HUFG), the abundances of resident species and migratory marine prevailed in all the three lagoons, both for the comparison carried out with the seine net and the one based on fyke nets. These varied between 94, 88, and 98% and between 6, 11, and 2% (Fogliano, Caprolace, and Sabaudia, respectively, for each functional category taken in consideration) for the samplings by seine net (Table 4). For fyke net samplings (Table 5), in Fogliano 74% of the catch consisted of residents, 16% of marine migrants, and 10% was represented by catadromous species (Anguilla anguilla). In Caprolace, 89% was resident, 6% was marine migrant, 4% was the catadromous A. anguilla, and 1% was represented by marine stragglers. Sabaudia lagoon samples consisted of 98% of resident species, and 2% of marine and straggler migrant species.
Fish assemblage compositions tended to be similar, but with different structures (abundance and biomass; Table 4 and Table 5). In Fogliano, seine net sampling showed that the Cyprinodontidae family (Aphanius fasciatus) represented 46% of the total number of individuals, followed by Atherinidae (23%, Atherina boyeri), Gobiidae (13%, Knipowitschia panizzae and Gobius niger), Mugilidae (8%, of Chelon saliens, C. aurata and C. ramada), Syngnatidae (6%, Syngnatus abaster), and Sparidae (4%, Diplodus spp., and Sparus aurata) (Table 4). In samplings by fyke net, the dominant families were Atherinidae, Cyprinodontidae, Sparidae, and Anguillidae, which amounted, respectively, to 46%, 25%, 11%, and 10% of the catches (Table 5). Similarly, at Caprolace, Cyprinodontidae and Atherinidae families were the dominant taxa, with abundance percentages ranging between 41–44% (seine net) and 52–35% (fyke net), respectively (Table 4 and Table 5), followed by the family Anguillidae (6%). In Sabaudia, irrespective of the fishing gear, more than 90% of the catch belonged to the species A. boyeri (Table 4 and Table 5).

3.2.2. Multi-Metric Indices

The metric combination procedure led to a final selection of four metrics for each fishing gear (Table 6). The seine-net-based MMI (SeN-MMI) included the following metrics: number of resident species (S_RS), Margalef index evaluated on the dominant species (D_domN); abundance density of detritivorous (d_N_DV), and biomass density of resident species (d_B_RS). The fyke-net-based MMI (FyN-MMI) included the Margalef index evaluated on the abundance of estuarine resident species (D_RS(N)), the biomass density of benthivorous species (d_B_Bv), the mean individual weight of hyperbenthivorous/zooplanktivorous/piscivorous species (B/N_HZP), and the Margalef index evaluated on the abundance of benthivorous species (D_Bv(N)). The two MMIs showed a positive correlation one with another (r = 0.261, p = 0.03), while the level of multicollinearity among the metrics was generally low, with only two correlations in the SeN-MMI (D_domN with d_B_RS and S_RS), and two couples of metrics correlated in the FyN-MMI (D_RS(N) and (D_Bv(N) and d_B_Bv with B/N_HZP) (Table S2). Moreover, the two MMIs showed a weak positive correlation one with another. The metrics of the SeN-MMI were not correlated with the ones of the FyN-MMI, with the only exception to the positive correlation between the number of resident species observed with the seine net and the Margalef diversity evaluated on the abundance of benthivorous species caught by fyke nets (Table S2).

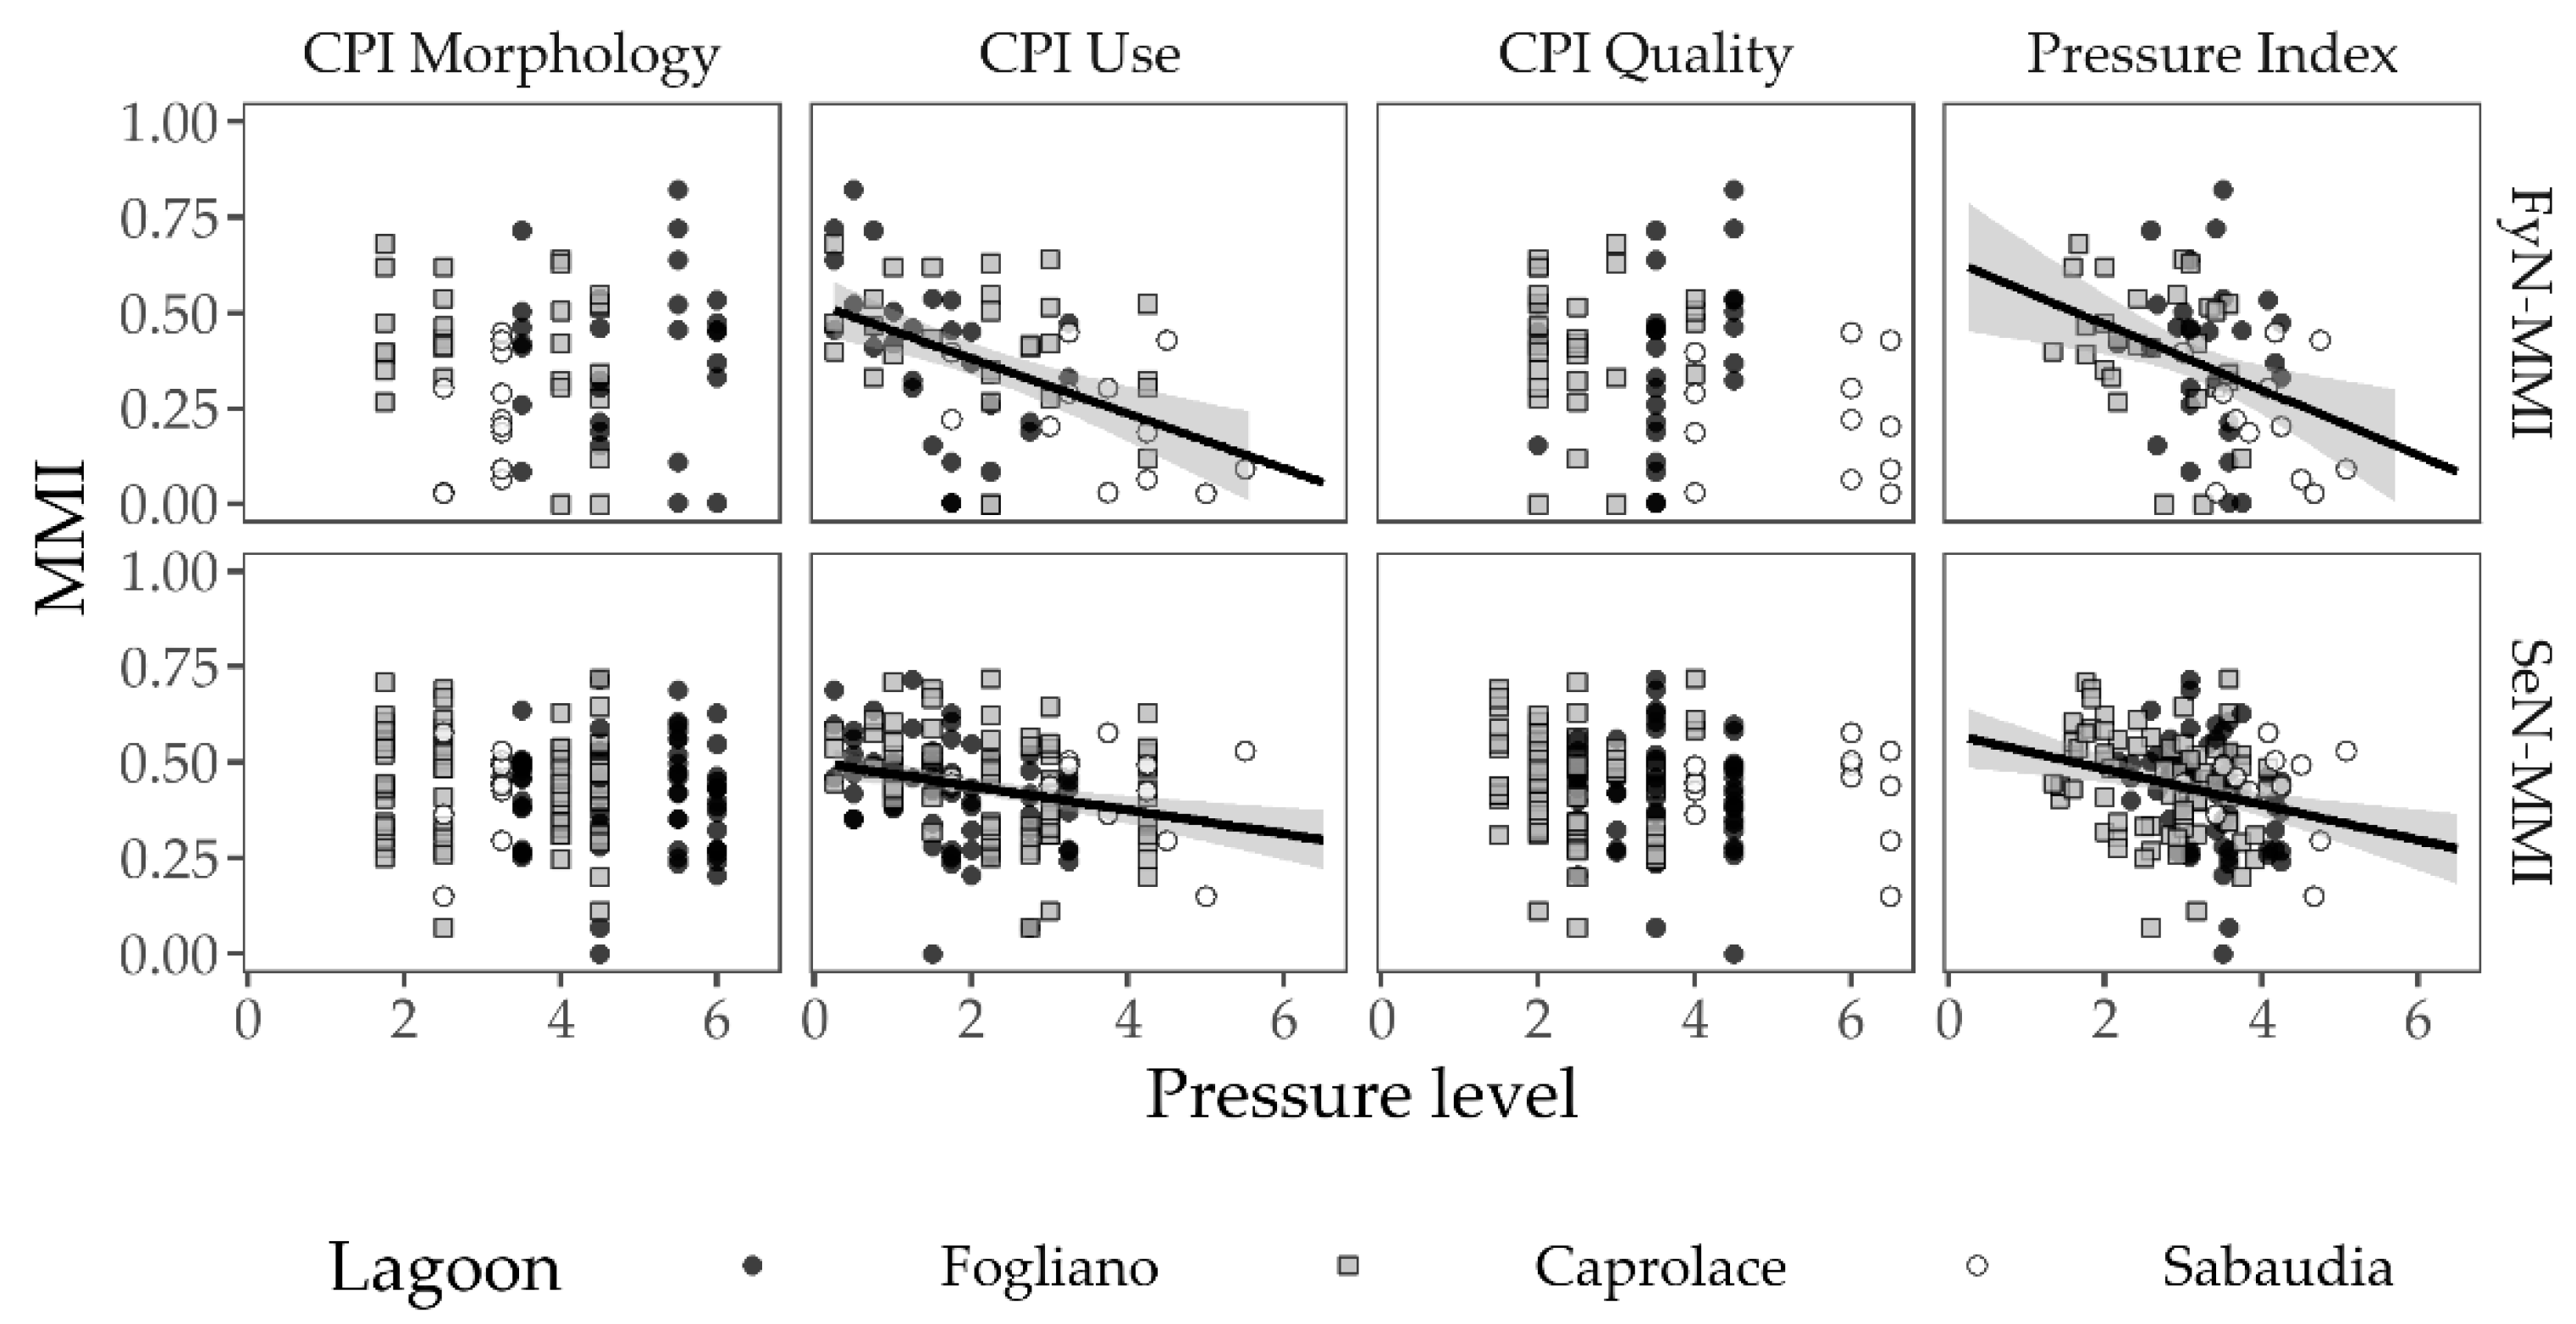
3.2.3. Responses to the Anthropogenic Pressures

The SeN-MMI did not show any correlation with the morphological variables both for the CPI Morphology nor for the single indicators belonging to the category (Table 6). Also, the FyN-MMI did not show any significant response for this category, but was negatively correlated with a single pressure within this category, i.e., the exchange indicator (r = −0.35; p < 0.01). Nevertheless, all the morphological pressures considered in the study result were correlated with at least one metric composing the MMIs.
Figure 4 shows the distribution of both the MMI values against the pressure levels. SeN-MMI and FyN-MMI showed a slightly different but very weak relationship with CPI Morphology (Table 6), strongly affected by the high variability of the response, in particular in some of the lagoons (e.g., Fogliano, spreading from 0 to 0.77 at the same level of CPI Morphology).
Both MMIs were negatively correlated with the CPI Use and some pressure indicators (Table 6 and Figure 4). SeN-MMI showed significant correlation with Barrier (r = −0.33; p> 0.001), whereas the FyN-MMI resulted in correlation with Aquaculture (r = −0.33; p > 0.01), Fishery (r = −0.32; p > 0.01), and Barrier (r = −0.38; p> 0.01). Moreover, every indicator belonging to the CPI Use was correlated with at least one of the metrics composing the MMIs. In detail, concerning the SeN-MMI, the number of resident species and the abundance of the detritivorous species resulted as negatively influenced by Aquaculture and Fishery, while the biomass of the resident species was correlated with Barrier. As far as the FyN-MMI metrics are concerned, the biomass density of benthivorous species and the mean individual weight of hyperbenthivorous/zooplanktivorous/piscivorous species both showed significant correlations with Fishery and Barrier. Concerning the CPI Use (Figure 4), the MMI values of Fogliano and Caprolace were associated with the highest MMI values and the lowest pressure levels. In contrast, the MMI data of Sabaudia were associated with higher Use pressure, resulting in lower MMI values.
SeN-MMI and FyN-MMI did not show any significant correlation with most of the individual Quality indicators, nor for the CPI Quality as a whole, an exception being DO (r = −0.181 p < 0.05; r = −0.248 p < 0.05, for SeN-MMI and FyN-MMI, respectively) and RP (r = −0.271 p < 0.001, SeN-MMI).
Besides, as far as the CPI Quality was concerned, it was observed that both MMIs were associated for Caprolace with the lowest pressure levels and for Fogliano with intermediate values. The MMI values for Sabaudia were associated with the highest pressure level, resulting in lower MMI values.
Significant correlations were found between both fish-based multi-metric indices (SeN-MMI and FyN-MMI) and the anthropogenic Pressure Index (SeN-MMI: r = −0.27; p < 0.001; FyN-MMI: r = −0.35; p < 0.01) (Table 6).

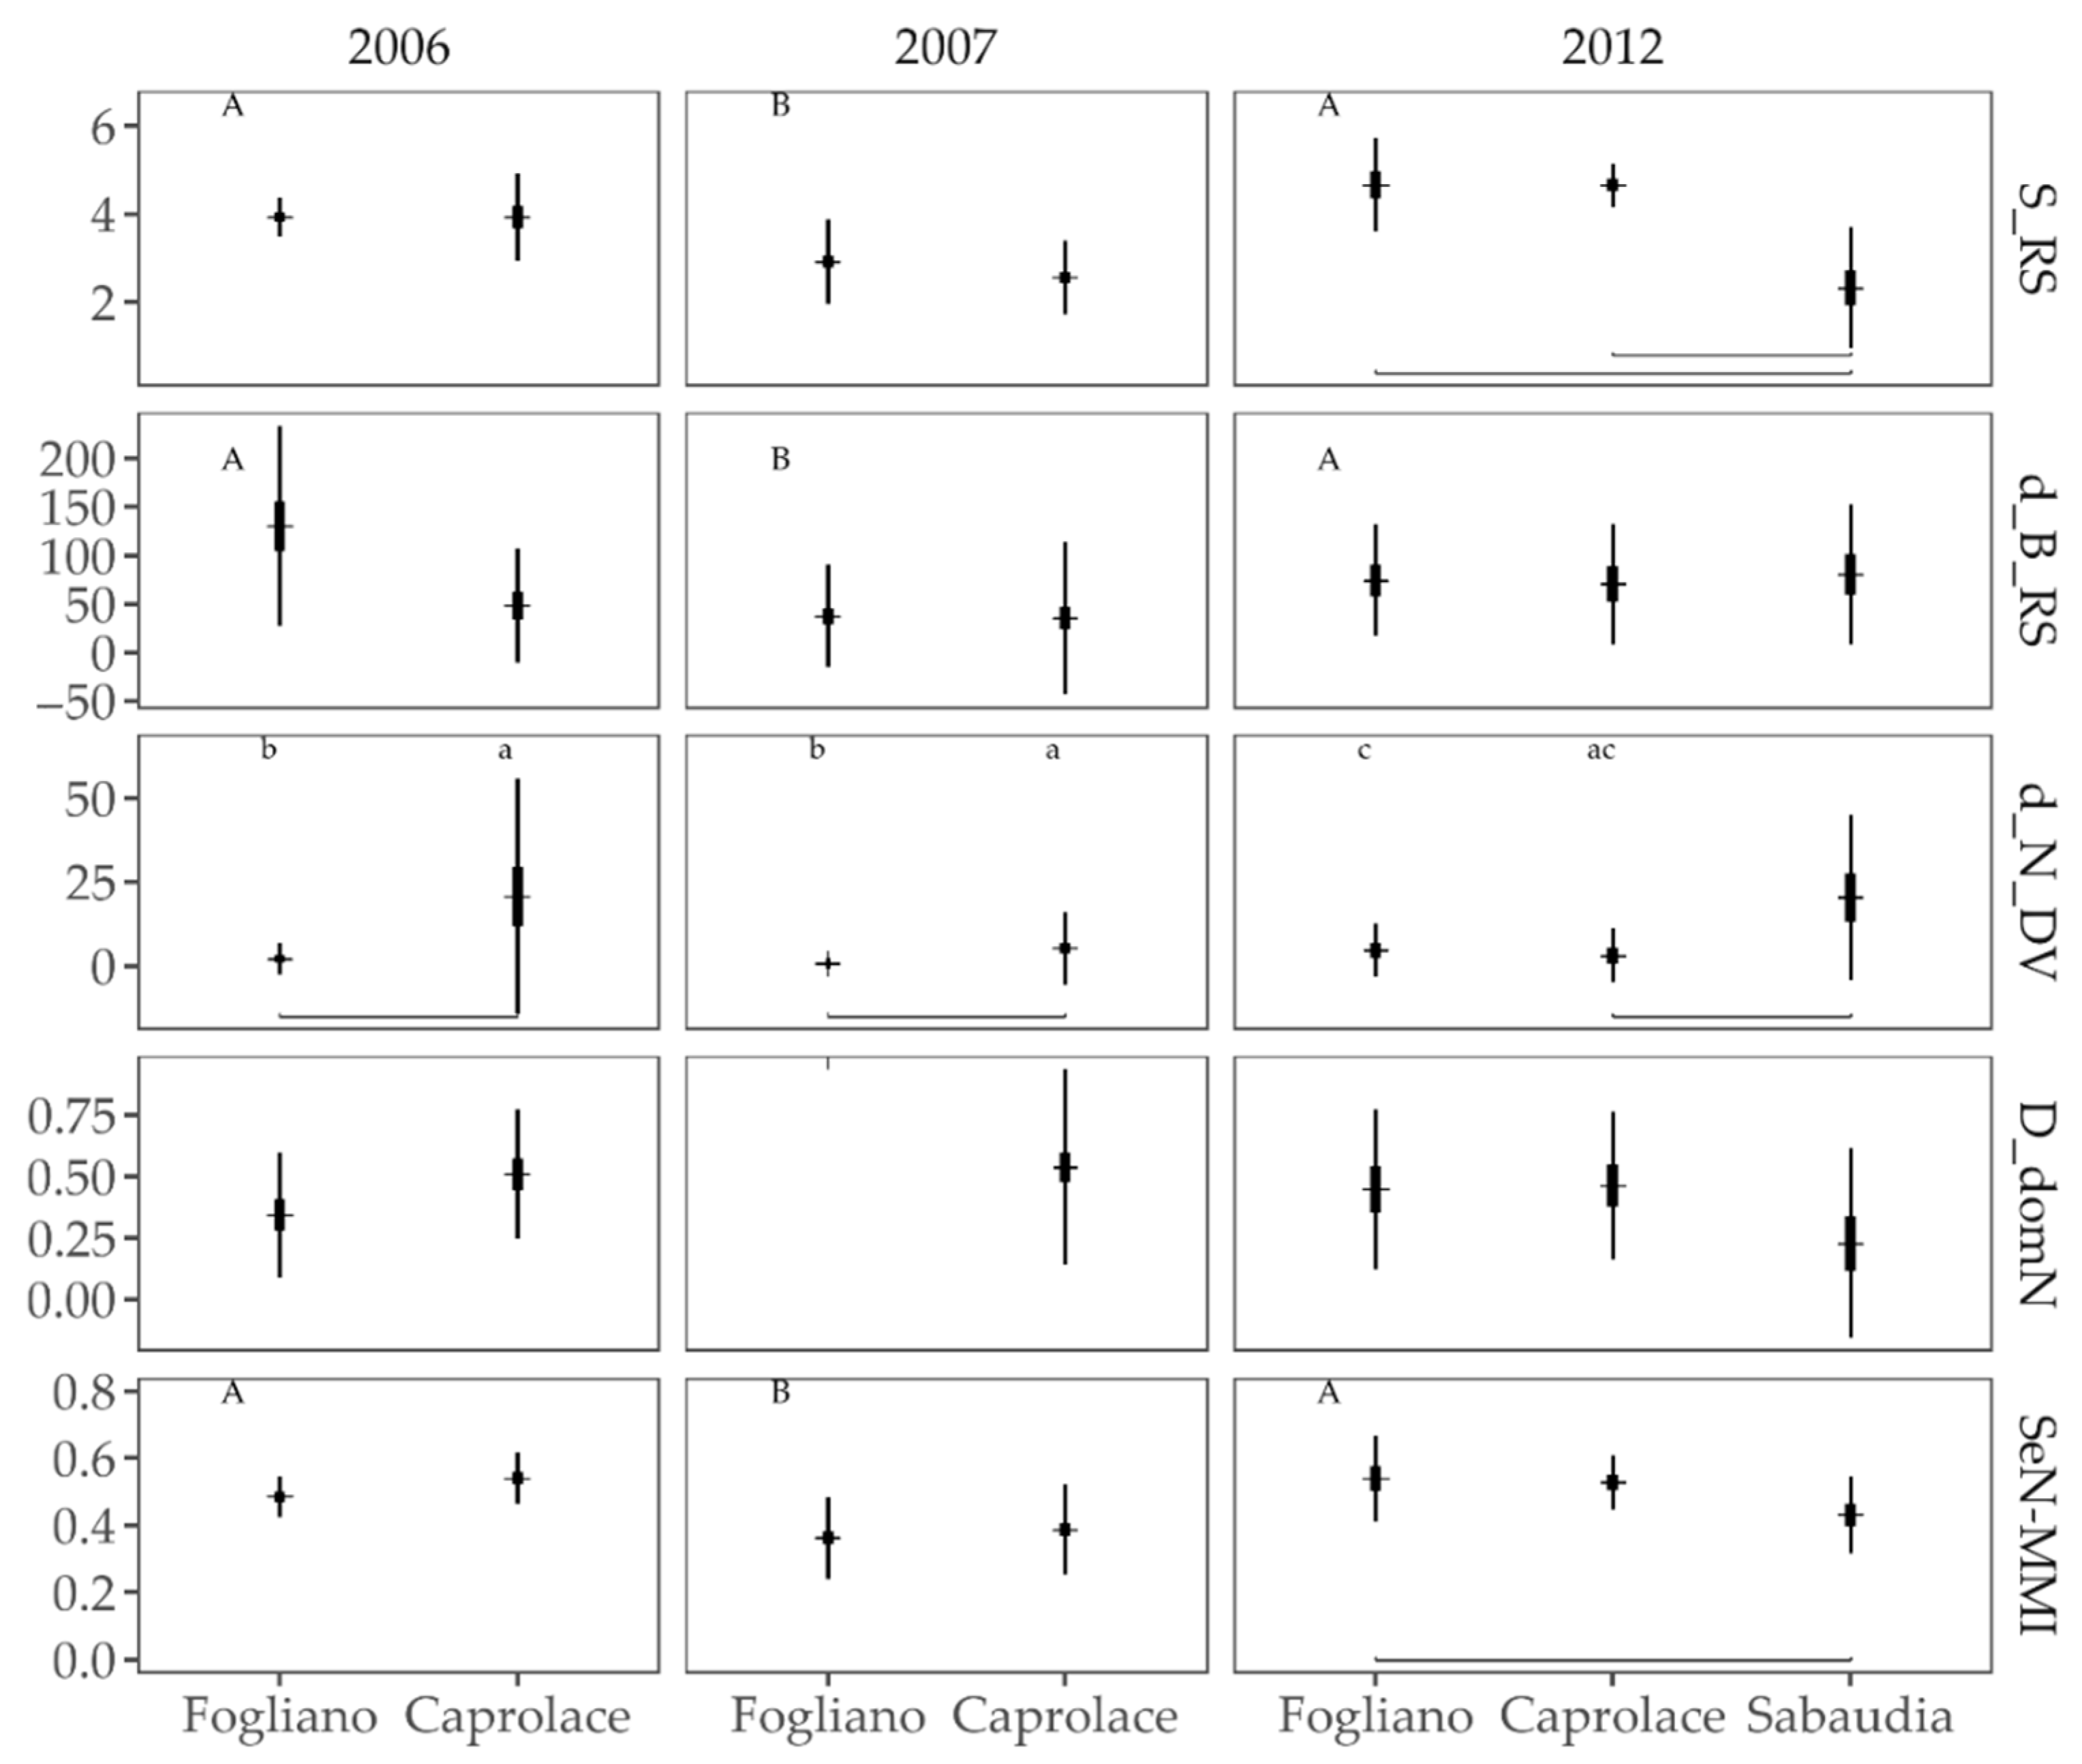
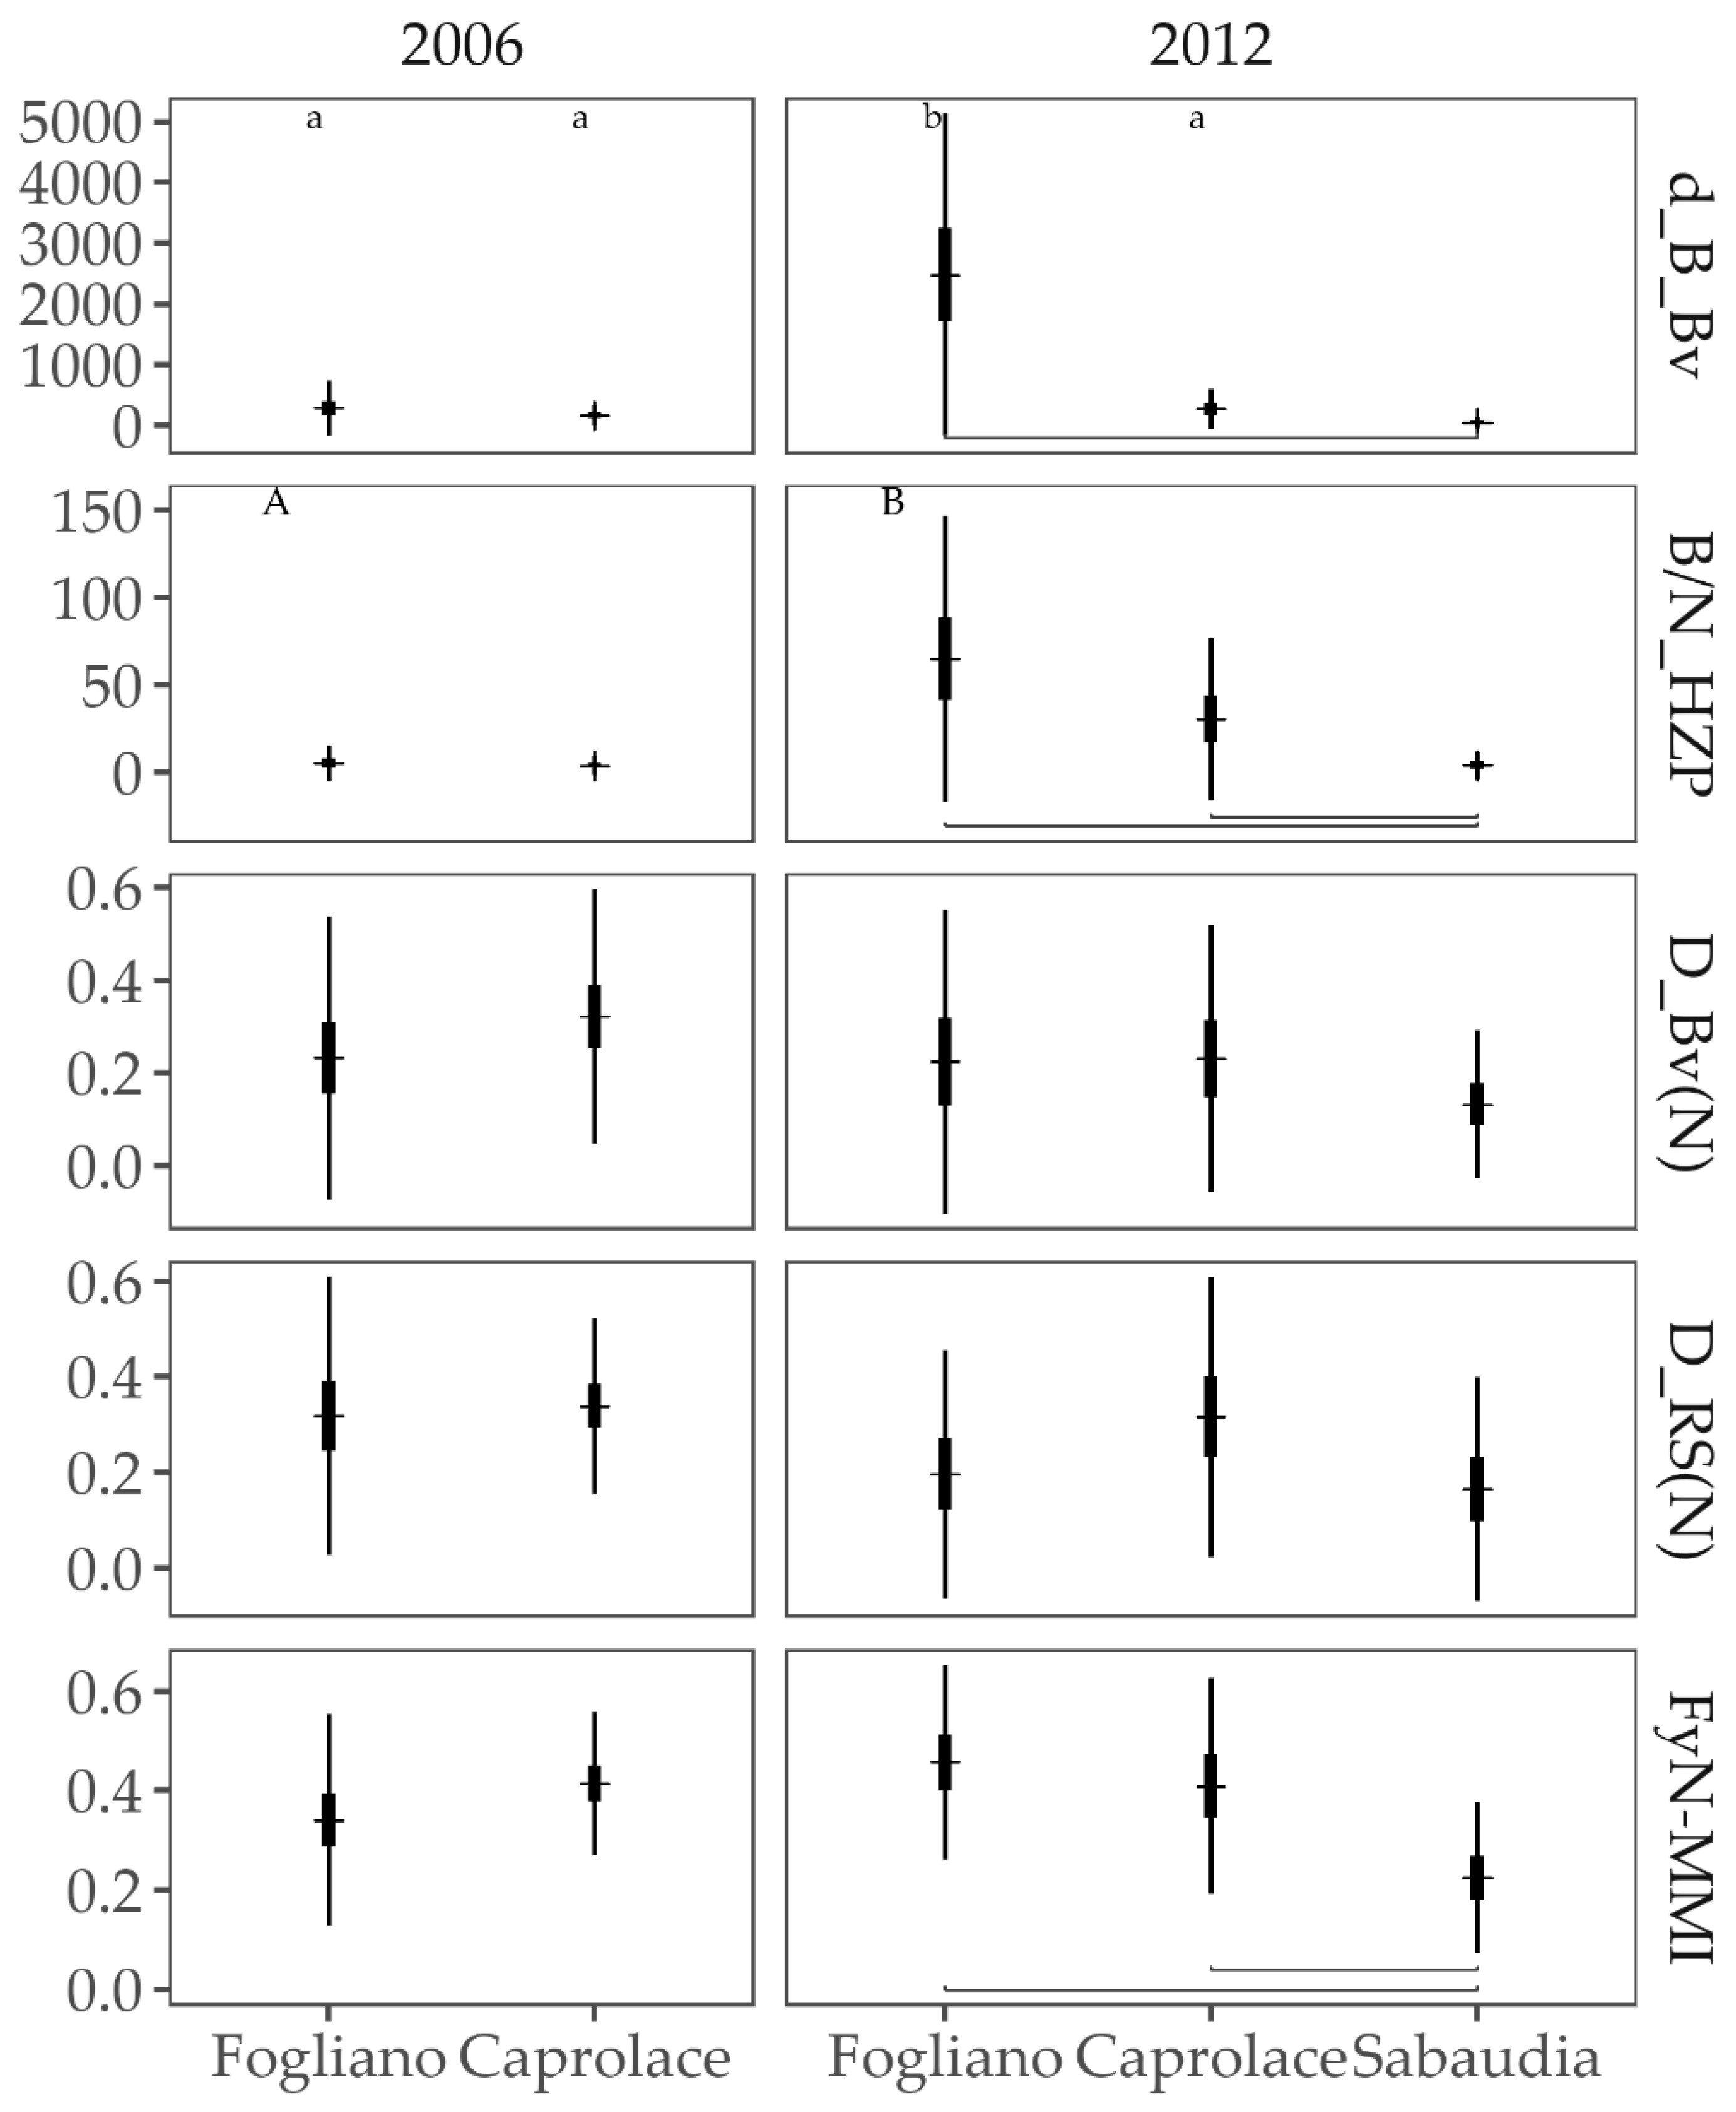
3.2.4. Comparison of Fish Assemblages among Lagoons and Years

The comparison of SeN-MMI for Fogliano and Caprolace (Figure 5) showed that, at the whole basin scale for the period 2006, 2007 and 2012, in general there were no differences between the two the lagoons (p = 0.185), except for the density of detritivorous, higher in Caprolace in both 2006 and 2007, (post hoc Bonferroni–Holm test: p = 0.001). In contrast, there were differences among years: the MMI was lower in 2007 than in 2006 and 2012 (p < 0.001). This was mostly because in 2007 both the number of species and the biomass density for the guild of the estuarine resident were lower than in 2006 (post hoc Bonferroni–Holm test: p = 0.002; p = 0.008, respectively) and then in 2012 (post hoc Bonferroni–Holm test: p < 0.001; p = 0.033, respectively) (Figure 5).
In 2012, the value of the SeN-MMI was lower in Sabaudia (p = 0.049), mostly because of the low number of resident species (2.333 ± 0.396 SE, on average), lower than in Fogliano and Caprolace (pairwise test: FOG-SAB, p = 0.008; CAP-SAB, p = 0.008) and this despite a high density of detritivorous (CAP-SAB, p = 0.036).
The FyN-MMI did not present relevant differences between Fogliano and Caprolace (p > 0.05) or when comparing 2006 and 2012 (p > 0.05) (Figure 6). Additionally, the four metrics included in the MMI (Figure 6) did not show any difference except for the biomass density of benthivorous higher in Fogliano than in Caprolace in 2012 (post hoc Bonferroni–Holm test: p = 0.003). In 2012, Sabaudia presented the lower values of MMI, influenced by the lower biomass density of benthivorous and the lower mean individual weight of hyperbenthivorous/zooplanktivorous/piscivorous (pairwise test: FOG-SAB, p = 0.002; CAP-SAB, p = 0.004; and FOG -SAB p = 0.0001) (Figure 6).

4. Discussion

This study highlighted the effects of alternative management strategies in three non-tidal coastal lagoons, the most typical transitional water body type of the Mediterranean ecoregion. This was achieved by comparing the structure of fish assemblages, synthetized in multi-metric indices (MMIs), against a wide range of anthropogenic pressures acting on the lagoons under study. The outcomes allow for considerations related on one hand to the suitability of the methodological approach for the evaluation of small coastal lagoon quality status and on the other hand to some general aspects of the effects of management frameworks on the fish assemblage.
The two multi-metric indices (MMIs) used in this study, abridging the characteristics of the fish assemblages of the three lagoons, show a number of relationships with anthropogenic pressures. Albeit these tools have already been suggested as being more effective than other approaches for integrating biological information and highlighting the impacts of anthropogenic activities [11,12,13,14], examples of their application to show the responsiveness of MMIs to human pressures represent an important contribution to the development of this field [45], in particular, for coastal lagoons [10].
The procedure adopted for developing the MMIs presented in this study is driven by the relationship between the biological response of fish and the human impact [15,22,46,47]. This led to the identification of the assemblage characteristics that are most likely to explain the effects of such impact, through the selection of the set of metrics that maximizes the response (i.e., the correlation) to human species, benthivorous species, and hyperbenthivorous/zooplanktivorous/piscivorous species. Some functional guilds play a particular role in describing the characteristics of the fish assemblage. As an example, the benthivorous feeding mode guild enters the indices both as biomass density and Margalef diversity (fyke-net-based MMI). In contrast, metrics related to the estuarine resident guild are included both in the seine net MMI (number of resident species and biomass density) and in the fyke net MMI (Margalef diversity). Even if the correlation among metrics included in the same MMI is not necessarily an issue, and indeed correlated variables can contribute to strengthening MMI–human pressure relationship [15], in our case the level of multicollinearity among the metrics is low (Table S3), and the indices and the metrics respond to different human impacts, as no indicator (metric or MMI) is correlated to the same anthropogenic pressures. The two MMIs do not differ only because they contain different metrics, but also because the two sampling methods upon which they are built describe different aspects of the fish assemblage. Beach seine net is considered very effective for collecting samples in shallow habitats, being particularly suitable for targeting benthic-demersal species [48]. On the other side, fyke nets more easily intercept pelagic and motile species. Moreover, fyke nets target larger specimens than the seine net. As they target and catch fish actively moving, they integrate over larger areas in comparison to a specific sampling site [48], and therefore they represent the fish assemblage of the water body as a whole. Indeed, the comparison among the different lagoons in different periods presented in this study was carried out at the whole basin level, that is the most suitable scale of application—in particular for the type of MMIs developed in this work [22,49]. The evaluation of the effects of anthropogenic impacts, and of changing management strategies eventually, should be carried out using a multiple sampling design, considering more than one gear type, as carried out in this study. Indeed, the information produced by the two sampling methods shows different responses to anthropogenic impacts, and tends to complement one with the other. For instance, fyke nets are less site-specific and better represent the response of the whole basin. In contrast, the seine net seems to be more suitable in catching impacts at a more detailed spatial scale.
On the whole, the metrics included in the two MMIs were selected for maximizing the correlation with the overall environmental state of the lagoons, summarized by the final Pressure Index (15), but not all the pressure indicators are negatively related to the MMIs or the selected metrics. As an example, pressures related to morphological features were reported as being among the most relevant sources of human impact to fish assemblages in other types of Mediterranean lagoons, namely, large microtidal water bodies [21,22,23]. However, in these large tidal lagoons the main morphological degradations are related mostly to drowning (the combined effect of eustatism and subsidence) and erosion with a tendency to the deepening of the lagoon and the progressive shift into a marine embayment [50,51,52,53,54]. The lagoons considered in this study—small shallow coastal lakes, non-tidal, and mainly influenced by wind forcing that are the typology most frequently encountered in the Mediterranean basin [31]—are affected by other hydro-morphological issues. Indeed, the morphology of the inlets is in most cases artificially modified, and hence the functionality of tidal channels depends upon the maintenance and dredging in order to contrast its silting up, which often leads also to a reduced water exchange, resulting in a high renewal time especially in the inner part of the lagoons [55]. However, in these lagoons the issue of maintaining sea–lagoon connectivity is often neglected, as the management efforts are mostly addressed at the reduction of the load of pollutants and nutrients from inland (Consorzio di Bonifica, personal communication, 2013) [40].
As far as it was possible within this study (only Fogliano and Caprolace were compared across years), the pressure/impact evaluation adopted was suitable to identify some temporal dynamics of human pressures, such as the change in the use of the resources (due to the complete ban of the fishery) and the worsening of the water quality indicators observed in 2012. It is interesting to note that these two changes are probably not unrelated. Lagoon management aimed at sustaining fisheries also influences the lagoon hydrological setting, and, hence, water quality of the lagoons [31,56,57]. Indeed, the management changes, i.e., the closure of the fishery and the concurrent dismantling of the fish barrier, had also some indirect effects. Lacking the need to ensure the flow of marine waters to trigger winter escapement of spawning marine migrants, the control and maintenance of the gates and sluices in the tidal channel, which ensures exchanges with the sea and the circulation of the water flows (Consorzio di Bonifica, personal communication, 2013) [40] has been failing, with consequences to the overall water quality as evidenced by specific indicators. In Sabaudia, due to a private ownership, resource exploitation is still ongoing, including both fishery and aquaculture. This accounts for the differences among the three lagoons, with the final Pressure Index higher in Sabaudia and lower in Fogliano and Caprolace. In Sabaudia, despite the moderate pressures relative to morphology and hydrology, the levels of anthropogenic pressures acting on the water quality are higher than in the other two lagoons. It has been pointed out for the Venice lagoon that the exploitation of living resources (e.g., industrial fishery and aquaculture) can impact the environmental quality, the fish assemblages, and the whole lagoon ecosystem [21,58]. However, studies carried out in large tidal lagoons evidenced for artisanal fisheries only a minor role in impacting fish assemblages in terms of structure, composition, or size of the species, probably being such a small-scale fishery operating at sustainable levels for local stocks of target species [21,23,58]. In small non-tidal lagoons such as the ones considered in this study, the role of fisheries, even if artisanal and small scale, as a pressure might be relevant, and even more the role of aquaculture [31,56]. Both activities led to severe impacts in Sabaudia, resulting in relevant changes in the fish assemblage. Aquaculture in Sabaudia targets mussel fattening, an activity that, as several studies have underlined, has important impacts contributing to the local nutrient enrichment eventually causing hypoxic conditions [1,59]. This particularly threatens the ecosystem functioning in low dispersal capacity systems [60] and reduces hydrodynamism [61,62,63,64]. It must be borne in mind that the Sabaudia lagoon has peculiar geomorphological features, with a complex perimeter in relation to the relatively small surface, high depth, and reduced water exchange, all jointly contributing to the presence of intense physical and chemical gradients, features that account also for the highly productive conditions of the lagoon ecosystem [56,57].
The change of resource use, which resulted in the ban of all fisheries, in Fogliano and Caprolace, on the other hand, did not significantly benefit the fish assemblages, but some effects are anyway evident and coincident with a higher pressure of indicators related to environmental quality. This can be traced back to a role of fisheries in driving a series of management actions that enhance the structural and hydrological functioning of the lagoons, that also entail the maintenance of exchanges with the sea by the tidal channels [31]. The guaranteeing of the tidal channels’ efficiency represents a crucial factor in ensuring the correct functionality of coastal lagoons, both hydrological (water renewal) and biological (fish recruitment) [31,65,66,67,68]. The present management framework of the two lagoons by the Park Authority, which has shifted toward focusing on habitat and resources conservation, does not addresses directly the solving of some structural problems of the lagoons. In Fogliano and Caprolace, despite some efforts undertaken [32], problems related to phytoplankton blooms, macrophytes excessive growth, dystrophic crises, and anoxia were not solved and are still present, especially affecting Fogliano in summer [69]. The frequent silting up of tidal inlets, addressed only by occasional interventions such as dredging by the Park Authority, amplifies and adds to the effects of high temperatures, low rainfall, and nutrient-rich surface run-off waters experienced by those lagoons [69,70].
In Mediterranean lagoons, the links between ecosystem functioning and resources exploitation are very strong, have a long tradition, and are often affected by man-made environmental management [31]. Fishing is an element of pressure on lagoon ecosystems, but, depending on the environmental and structural features of lagoons and the overall framework of anthropogenic management and their resulting quality status, it can also be considered an activity that, within sustainable models of exploitation, contributes to the ecosystem functioning and efficiency. Because of the dynamics by which they originate and their geographical location, lagoons are “ephemeral” systems, which over time tend to disappear [71]. Traditional management models in the Mediterranean region testify that the lifetime of a coastal lagoon and its quality maintenance can be closely linked to the nature of management interventions [31,71]. This specifically applies to small non-tidal lagoons, where fisheries still represent one of the main activities, with social, economic, and cultural relevance.
Outcomes of the present study can provide support to management choices in Mediterranean lagoon environments, even within management frameworks such as the one actually in place in the Circeo National Park, committed to the protection of biodiversity. Permitting some exploitation activities, albeit regulated within strict conservation frameworks, can contribute, through the maintenance of the lagoon ecological functioning and ensuring its overall quality status, to the overall habitat and species conservation.

Supplementary Materials

The following are available online at https://www.mdpi.com/2073-4441/13/2/130/s1. Table S1. Anthropogenic pressure indicators and impact score used for the Pressure Index. Table S2. List of metrics with description and categories for the pre-selection criteria. Table S3. Correlations between the two fish-based multi-metric indices (SeN-MMI and FyN-MMI) and level of multicollinearity among the metrics.

Author Contributions

Conceptualization, M.Z. and C.L.; Methodology, M.Z. and C.L.; Formal Analysis, M.Z.; Writing—Original Draft Preparation, M.Z. and C.L.; Writing—Review and Editing, F.C., M.Z., C.L., E.C. and P.F.; Supervision, E.C. and P.F.; Funding Acquisition, E.C. and P.F. All authors have read and agreed to the published version of the manuscript.

Funding

This research was partially funded by the Italian Ministry of Universities and Research (PRIN grants 2009 W2395).

Institutional Review Board Statement

Ethics approval was not required for this study.

Informed Consent Statement

Not applicable.

Data Availability Statement

Data is contained within the article and its supplementary material.

Acknowledgments

The authors thank the Circeo National Park, the Ufficio Territoriale Carabinieri per la Biodiversità di Fogliano (UTCB), and the Scalfati family, owners of the Sabaudia lagoon, for their willingness to allow field activities and data gathering within this research. The authors acknowledge the Regional Administrative Offices of Environment (ARPAs) for sharing data and final reports related to the monitoring foreseen under the MD 260/2010 and Lgs.D 172/2015. The authors also acknowledge the support of Massimo Cecchetti and Andrea Fusari during fish samplings.

Conflicts of Interest

The authors declare no conflict of interest.

References

  1. Pérez-Ruzafa, A.; Pérez-Ruzafa, I.M.; Newton, A.; Marcos, C. Coastal Lagoons: Environmental Variability, Ecosystem Complexity, and Goods and Services Uniformity. In Coasts and Estuaries; Elsevier: Amsterdam, The Netherlands, 2019; pp. 253–276. [Google Scholar]
  2. Costanza, R.; D’Arge, R.; de Groot, R.; Farber, S.; Grasso, M.; Hannon, B.; Limburg, K.; Naeem, S.; O’Neill, R.V.; Paruelo, J.; et al. The value of the world’s ecosystem services and natural capital. Nature 1997, 387, 253–260. [Google Scholar] [CrossRef]
  3. Elliott, M.; Day, J.W.; Ramachandran, R.; Wolanski, E. A synthesis: What is the future for coasts, estuaries, deltas and other transitional habitats in 2050 and beyond? In Coasts and Estuaries; Elsevier: Amsterdam, The Netherlands, 2019; pp. 1–28. [Google Scholar]
  4. Newton, A.; Icely, J.; Cristina, S.; Brito, A.; Cardoso, A.C.; Colijn, F.; Riva, S.D.; Gertz, F.; Hansen, J.W.; Holmer, M.; et al. An overview of ecological status, vulnerability and future perspectives of European large shallow, semi-enclosed coastal systems, lagoons and transitional waters. Estuar. Coast. Shelf Sci. 2014, 140, 95–122. [Google Scholar] [CrossRef]
  5. Newton, A.; Brito, A.C.; Icely, J.D.; Derolez, V.; Clara, I.; Angus, S.; Schernewski, G.; Inácio, M.; Lillebø, A.I.; Sousa, A.I.; et al. Assessing, quantifying and valuing the ecosystem services of coastal lagoons. J. Nat. Conserv. 2018, 44, 50–65. [Google Scholar] [CrossRef]
  6. Vasconcelos, R.P.; Batista, M.I.; Henriques, S. Current limitations of global conservation to protect higher vulnerability and lower resilience fish species. Sci. Rep. 2017, 7, 7702. [Google Scholar] [CrossRef] [PubMed] [Green Version]
  7. Teichert, N.; Lepage, M.; Lobry, J. Beyond classic ecological assessment: The use of functional indices to indicate fish Assemblages sensitivity to human disturbance in estuaries. Sci. Total Environ. 2018, 639, 465–475. [Google Scholar] [CrossRef] [PubMed]
  8. EU Water Framework Directive. Directive of the European Parliament and of the Council 2000/60/EC Establishing a Framework for Community Action in the Field of Water Policy. Off. J. Eur. Communities 2000, 327, 1–73. [Google Scholar]
  9. Pérez-Domínguez, R.; Maci, S.; Courrat, A.; Lepage, M.; Borja, A.; Uriarte, A.; Neto, J.M.; Cabral, H.; Raykov, V.S.; Franco, A.; et al. Current developments on fish-based indices to assess ecological-quality status of estuaries and lagoons. Ecol. Indic. 2012, 23, 34–45. [Google Scholar] [CrossRef]
  10. Souza, G.B.G.; Vianna, M. Fish-based indices for assessing ecological quality and biotic integrity in transitional waters: A systematic review. Ecol. Indic. 2020, 109, 105665. [Google Scholar] [CrossRef]
  11. Karr, J.R. Assessment of Biotic Integrity Using Fish Communities. Fish. Mag. 1981, 6, 21–27. [Google Scholar] [CrossRef]
  12. Karr, J.R.; Fausch, K.D.; Angermeier, P.L.; Yant, P.R.; Schlosser, I.J. Assessing biological integrity in running waters: A method and its rationale. Ill. Nat. Hist. Surv. Spec. Publ. 1986, 5, 1–28. [Google Scholar]
  13. Cabral, H.N.; Fonseca, V.F.; Gamito, R.; Gonçalves, C.I.; Costa, J.L.; Erzini, K.; Gonçalves, J.; Martins, J.; Leite, L.; Andrade, J.P.; et al. Ecological quality assessment of transitional waters based on fish assemblages in Portuguese estuaries: The Estuarine Fish Assessment Index (EFAI). Ecol. Indic. 2012, 19, 144–153. [Google Scholar] [CrossRef]
  14. Martinho, F.; Nyitrai, D.; Crespo, D.; Pardal, M.A. Efficacy of single and multi-metric fish-based indices in tracking anthropogenic pressures in estuaries: An 8-year case study. Mar. Pollut. Bull. 2015, 101, 153–162. [Google Scholar] [CrossRef] [PubMed]
  15. Schoolmaster, D.R.; Grace, J.B.; Schweiger, E.W. A general theory of multimetric indices and their properties. Methods Ecol. Evol. 2012, 3, 773–781. [Google Scholar] [CrossRef]
  16. Delpech, C.; Courrat, A.; Pasquaud, S.; Lobry, J.; Le Pape, O.; Nicolas, D.; Boët, P.; Girardin, M.; Lepage, M. Development of a fish-based index to assess the ecological quality of transitional waters: The case of French estuaries. Mar. Pollut. Bull. 2010, 60, 908–918. [Google Scholar] [CrossRef] [PubMed] [Green Version]
  17. Fonseca, V.F.; Vasconcelos, R.P.; Gamito, R.; Pasquaud, S.; Gonçalves, C.I.; Costa, J.L.; Costa, M.J.; Cabral, H.N. Fish community-based measures of estuarine ecological quality and pressure–impact relationships. Estuar. Coast. Shelf Sci. 2013, 134, 128–137. [Google Scholar] [CrossRef]
  18. Capoccioni, F.; Leone, C.; Belpaire, C.; Malarvannan, G.; Poma, G.; De Matteis, G.; Tancioni, L.; Contò, M.; Failla, S.; Covaci, A.; et al. Quality assessment of escaping silver eel (Anguilla anguilla L.) to support management and conservation strategies in Mediterranean coastal lagoons. Environ. Monit. Assess. 2020, 192, 570. [Google Scholar] [CrossRef]
  19. Leone, C.; Capoccioni, F.; Belpaire, C.; Malarvannan, G.; Poma, G.; Covaci, A.; Tancioni, L.; Contò, M.; Ciccotti, E. Evaluation of environmental quality of Mediterranean coastal lagoons using persistent organic pollutants and metals in thick-lipped grey mullet. Water 2020, 12, 3450. [Google Scholar] [CrossRef]
  20. Franco, A.; Torricelli, P.; Franzoi, P. A habitat-specific fish-based approach to assess the ecological status of Mediterranean coastal lagoons. Mar. Pollut. Bull. 2009, 58, 1704–1717. [Google Scholar] [CrossRef]
  21. Zucchetta, M.; Scapin, L.; Cavraro, F.; Pranovi, F.; Franco, A.; Franzoi, P. Can the Effects of Anthropogenic Pressures and Environmental Variability on Nekton Fauna Be Detected in Fishery Data? Insights from the Monitoring of the Artisanal Fishery Within the Venice Lagoon. Estuaries Coasts 2016, 39, 1164–1182. [Google Scholar] [CrossRef]
  22. Zucchetta, M.; Scapin, L.; Franco, A.; Franzoi, P. Uncertainty in developing fish based multi-metric indices. Ecol. Indic. 2020, 108, 105768. [Google Scholar] [CrossRef]
  23. Cavraro, F.; Bettoso, N.; Zucchetta, M.; D’Aietti, A.; Faresi, L.; Franzoi, P. Body condition in fish as a tool to detect the effects of anthropogenic pressures in transitional waters. Aquat. Ecol. 2019, 53, 21–35. [Google Scholar] [CrossRef]
  24. Uriarte, A.; Borja, A. Assessing fish quality status in transitional waters, within the European Water Framework Directive: Setting boundary classes and responding to anthropogenic pressures. Estuar. Coast. Shelf Sci. 2009, 82, 214–224. [Google Scholar] [CrossRef]
  25. Lepage, M.; Harrison, T.; Breine, J.; Cabral, H.; Coates, S.; Galván, C.; García, P.; Jager, Z.; Kelly, F.; Mosch, E.C.; et al. An approach to intercalibrate ecological classification tools using fish in transitional water of the North East Atlantic. Ecol. Indic. 2016, 67, 318–327. [Google Scholar] [CrossRef]
  26. Poikane, S.; Zampoukas, N.; Borja, A.; Davies, S.P.; van de Bund, W.; Birk, S. Intercalibration of aquatic ecological assessment methods in the European Union: Lessons learned and way forward. Environ. Sci. Policy 2014, 44, 237–246. [Google Scholar] [CrossRef]
  27. Scapin, L.; Zucchetta, M.; Facca, C.; Sfriso, A.; Franzoi, P. Using fish assemblage to identify success criteria for seagrass habitat restoration. Web Ecol. 2016, 16, 33–36. [Google Scholar] [CrossRef] [Green Version]
  28. Catalano, B.; Penna, M.; Riccato, F.; Fiorin, R.; Franceschini, G.; Antonini, C.; Zucchetta, M.; Cicero, A.M.; Franzoi, P. Manuale per la Classificazione dell’Elemento di Qualità Biologica “Fauna Ittica” Nelle Lagune Costiere Italiane; Applicazione Dell’indice Nazional HFBI (Habitat Fish Bio-Indicator) ai Sensi del D. Lgs 152/2006; ISPRA: Roma, Italy, 2006. [Google Scholar]
  29. Franco, A.; Franzoi, P.; Malavasi, S.; Riccato, F.; Torricelli, P. Fish assemblages in different shallow water habitats of the Venice Lagoon. In Marine Biodiversity; Springer: Dordrecht, The Netherlands, 2006; pp. 159–174. [Google Scholar]
  30. Franco, A.; Franzoi, P.; Torricelli, P. Structure and functioning of Mediterranean lagoon fish assemblages: A key for the identification of water body types. Estuar. Coast. Shelf Sci. 2008, 79, 549–558. [Google Scholar] [CrossRef]
  31. Cataudella, S.; Crosetti, D.; Ciccotti, E.; Massa, F. Sustainable management in Mediterranean coastal lagoons: Interactions among capture fisheries, aquaculture and environment. In Mediterranean Coastal Lagoons: Sustainable Management and Interactions Among Aquaculture, Capture Fisheries and Environment; Cataudella, S., Crosetti, D., Massa, F., Eds.; FAO: Rome, Italy, 2015; pp. 7–49. [Google Scholar]
  32. Available online: http://www.rewetland.eu/life/news/150423_final_report_ITA.pdf (accessed on 17 August 2020).
  33. Manzo, C. Fish Assemblages in Three Mediterranean Coastal Lagoons: Structure, Functioning and Spatial-Temporal Dynamics. Ph.D. Thesis, University of Rome “Tor Vergata”, Rome, Italy, 2010. [Google Scholar]
  34. Leone, C. Fish Assemblages as Sensitive Tools in Describing Ecological Change in Coastal Lagoons, with Focus on the Role of European Eel (Anguilla anguilla L.) as a Qualifying Species in These Environments. Ph.D. Thesis, University of Rome “Tor Vergata”, Rome, Italy, 2014. [Google Scholar]
  35. Potter, I.C.; Tweedley, J.R.; Elliott, M.; Whitfield, A.K. The ways in which fish use estuaries: A refinement and expansion of the guild approach. Fish Fish. 2015, 16, 230–239. [Google Scholar] [CrossRef] [Green Version]
  36. Aubry, A.; Elliott, M. The use of environmental integrative indicators to assess seabed disturbance in estuaries and coasts: Application to the Humber Estuary, UK. Mar. Pollut. Bull. 2006, 53, 175–185. [Google Scholar] [CrossRef]
  37. Harrison, T.D.; Whitfield, A.K. A multi-metric fish index to assess the environmental condition of estuaries. J. Fish Biol. 2004, 65, 683–710. [Google Scholar] [CrossRef]
  38. Kjerfve, B. Chapter 1 Coastal Lagoons. In Elsevier Oceanography Series; Elsevier: Amsterdam, The Netherlands, 1994; pp. 1–8. [Google Scholar]
  39. Ferrarin, C.; Zaggia, L.; Paschini, E.; Scirocco, T.; Lorenzetti, G.; Bajo, M.; Penna, P.; Francavilla, M.; D’Adamo, R.; Guerzoni, S. Hydrological Regime and Renewal Capacity of the Micro-tidal Lesina Lagoon, Italy. Estuaries Coasts 2014, 37, 79–93. [Google Scholar] [CrossRef]
  40. Bono, P.; Ghiozzi, E.; Malatesta, A.; Zarlenga, F. Seminario Informativo Sui Risultati Del Progetto “Laghi Costieri”; Edizione Università Degli Studi “La Sapienza” Di Roma-Provincia Di Latina: Terracina, Italy, 1985. [Google Scholar]
  41. Gardi, C.; Bosco, C.; Rusco, E.; Montanerella, L. An analysis of the Land Use Sustainability Index (LUSI) at territorial scale based on Corine Land Cover. Manag. Environ. Qual. 2010, 21, 680–694. [Google Scholar] [CrossRef]
  42. Cade, B.S.; Noon, B.R. A gentle introduction to quantile regression for ecologists. Front. Ecol. Environ. 2003, 1, 412–420. [Google Scholar] [CrossRef]
  43. Florian Hartig (DHARMa: Residual Diagnostics for Hierarchical (Multi-Level Mixed) Regression Models. R Package Version 0.3.3.0. 2020. Available online: https://CRAN.project.org/package=DHARM (accessed on 15 October 2020).
  44. Lenth, R.V. Least-Squares Means: The R Package lsmeans. J. Stat. Softw. Found. Open Access Stat. 2016, 69. [Google Scholar] [CrossRef] [Green Version]
  45. Schoolmaster, D.R.; Grace, J.B.; Schweiger, E.W.; Guntenspergen, G.R.; Mitchell, B.R.; Miller, K.M.; Little, A.M. An algorithmic and information-theoretic approach to multimetric index construction. Ecol. Indic. 2013, 26, 14–23. [Google Scholar] [CrossRef] [Green Version]
  46. Borja, Á.; Franco, J.; Valencia, V.; Bald, J.; Muxika, I.; Jesús Belzunce, M.; Solaun, O. Implementation of the European water framework directive from the Basque country (northern Spain): A methodological approach. Mar. Pollut. Bull. 2004, 48, 209–218. [Google Scholar] [CrossRef]
  47. Schoolmaster, D.R.; Grace, J.B.; Schweiger, E.W.; Mitchell, B.R.; Guntenspergen, G.R. A causal examination of the effects of confounding factors on multimetric indices. Ecol. Indic. 2013, 29, 411–419. [Google Scholar] [CrossRef] [Green Version]
  48. Breine, J.J.; Maes, J.; Quataert, P.; Van den Bergh, E.; Simoens, I.; Van Thuyne, G.; Belpaire, C. A fish-based assessment tool for the ecological quality of the brackish Schelde estuary in Flanders (Belgium). Hydrobiologia 2007, 575, 141–159. [Google Scholar] [CrossRef]
  49. Franco, A.; Pérez-Ruzafa, A.; Drouineau, H.; Franzoi, P.; Koutrakis, E.T.; Lepage, M.; Verdiell-Cubedo, D.; Bouchoucha, M.; López-Capel, A.; Riccato, F.; et al. Assessment of fish assemblages in coastal lagoon habitats: Effect of sampling method. Estuar. Coast. Shelf Sci. 2012, 112, 115–125. [Google Scholar] [CrossRef]
  50. Birk, S.; Bonne, W.; Borja, A.; Brucet, S.; Courrat, A.; Poikane, S.; Solimini, A.; van de Bund, W.; Zampoukas, N.; Hering, D. Three hundred ways to assess Europe’s surface waters: An almost complete overview of biological methods to implement the Water Framework Directive. Ecol. Indic. 2012, 18, 31–41. [Google Scholar] [CrossRef]
  51. Fontolan, G.; Pillon, S.; Bezzi, A.; Villalta, R.; Lipizer, M.; Triches, A.; D’Aietti, A. Human impact and the historical transformation of saltmarshes in the Marano and Grado Lagoon, northern Adriatic Sea. Estuar. Coast. Shelf Sci. 2012, 113, 41–56. [Google Scholar] [CrossRef]
  52. Ferrarin, C.; Umgiesser, G.; Roland, A.; Bajo, M.; De Pascalis, F.; Ghezzo, M.; Scroccaro, I. Sediment dynamics and budget in a microtidal lagoon—A numerical investigation. Mar. Geol. 2016, 381, 163–174. [Google Scholar] [CrossRef]
  53. Molinaroli, E.; Guerzoni, S.; Sarretta, A.; Masiol, M.; Pistolato, M. Thirty-year changes (1970 to 2000) in bathymetry and sediment texture recorded in the Lagoon of Venice sub-basins, Italy. Mar. Geol. 2009, 258, 115–125. [Google Scholar] [CrossRef] [Green Version]
  54. Sarretta, A.; Pillon, S.; Molinaroli, E.; Guerzoni, S.; Fontolan, G. Sediment budget in the Lagoon of Venice, Italy. Cont. Shelf Res. 2010, 30, 934–949. [Google Scholar] [CrossRef] [Green Version]
  55. Umgiesser, G.; Ferrarin, C.; Cucco, A.; De Pascalis, F.; Bellafiore, D.; Ghezzo, M.; Bajo, M. Comparative hydrodynamics of 10 Mediterranean lagoons by means of numerical modeling. J. Geophys. Res. Ocean. 2014, 119, 2212–2226. [Google Scholar] [CrossRef]
  56. Pérez-Ruzafa, A.; Marcos, C. Fisheries in coastal lagoons: An assumed but poorly researched aspect of the ecology and functioning of coastal lagoons. Estuar. Coast. Shelf Sci. 2012, 110, 15–31. [Google Scholar] [CrossRef]
  57. Marcos, C.; Torres, I.; López-Capel, A.; Pérez-Ruzafa, A. Long term evolution of fisheries in a coastal lagoon related to changes in lagoon ecology and human pressures. Rev. Fish. Biol. Fish. 2015, 25, 689–713. [Google Scholar] [CrossRef]
  58. Pranovi, F.; Link, J.S. Ecosystem exploitation and trophodynamic indicators: A comparison between the Northern Adriatic Sea and Southern New England. Prog. Oceanogr. 2009, 81, 149–164. [Google Scholar] [CrossRef] [Green Version]
  59. Elliott, M.; Whitfield, A.K.; Potter, I.C.; Blaber, S.J.M.; Cyrus, D.P.; Nordlie, F.G.; Harrison, T.D. The guild approach to categorizing estuarine fish assemblages: A global review. Fish. Fish. 2007, 8, 241–268. [Google Scholar] [CrossRef]
  60. Pérez-Ruzafa, A.; Fernández, A.I.; Marcos, C.; Gilabert, J.; Quispe, J.I.; García-Charton, J.A. Spatial and temporal variations of hydrological conditions, nutrients and chlorophyll a in a Mediterranean coastal lagoon (Mar Menor, Spain). Hydrobiologia 2005, 550, 11–27. [Google Scholar] [CrossRef]
  61. Cranford, P.J.; Hargrave, B.T.; Doucette, L.I. Benthic organic enrichment from suspended mussel (Mytilus edulis) culture in Prince Edward Island, Canada. Aquaculture 2009, 292, 189–196. [Google Scholar] [CrossRef]
  62. Hartstein, N.D.; Stevens, C.L. Deposition beneath long-line mussel farms. Aquac. Eng. 2005, 33, 192–213. [Google Scholar] [CrossRef]
  63. Gallardi, D. Effects of Bivalve Aquaculture on the Environment and Their Possible Mitigation: A Review. Fish. Aquac. J. 2014, 5. [Google Scholar] [CrossRef] [Green Version]
  64. Newell, R.I. Ecosystem influences of natural and cultivated populations of suspension-feeding bivalve molluscs: A review. J. Shellfish Res. 2004, 23, 51–61. [Google Scholar]
  65. Ardizzone, G.D.; Cataudella, S.; Rossi, R. Management of Coastal Lagoon Fisheries and Aquaculture in Italy; FAO Fisher.; FAO: Rome, Italy, 1988. [Google Scholar]
  66. Pérez-Ruzafa, A.; Mompeán, M.C.; Marcos, C. Hydrographic, geomorphologic and fish assemblage relationships in coastal lagoons. In Lagoons and Coastal Wetlands in the Global Change Context: Impacts and Management Issues; Springer: Dordrecht, The Netherlands, 2007; pp. 107–125. [Google Scholar]
  67. Pérez-Ruzafa, A.; De Pascalis, F.; Ghezzo, M.; Quispe-Becerra, J.I.; Hernández-García, R.; Muñoz, I.; Vergara, C.; Pérez-Ruzafa, I.M.; Umgiesser, G.; Marcos, C. Connectivity between coastal lagoons and sea: Asymmetrical effects on assemblages’ and populations’ structure. Estuar. Coast. Shelf Sci. 2019, 216, 171–186. [Google Scholar] [CrossRef]
  68. García-Oliva, M.; Pérez-Ruzafa, Á.; Umgiesser, G.; McKiver, W.; Ghezzo, M.; De Pascalis, F.; Marcos, C. Assessing the Hydrodynamic Response of the Mar Menor Lagoon to Dredging Inlets Interventions through Numerical Modelling. Water 2018, 10, 959. [Google Scholar] [CrossRef] [Green Version]
  69. Agenzia Regionale per la Protezione Ambientale (ARPA) della Regione Lazio. Available online: http://www.arpalazio.gov.it/ambiente/acqua/dati.htm# (accessed on 6 July 2020).
  70. LegAmbiente Lazio. Available online: https://www.legambientelazio.it/goletta-dei-laghi-2018-presenta-i-risultati-nel-lazio/ (accessed on 6 July 2020).
  71. De Wit, R.; Mostajir, B.; Troussellier, M.; Do Chi, T. Environmental Management and Sustainable Use of Coastal Lagoons Ecosystems. In Lagoons: Biology Management and Environmental Impact Series; Nova Publishers: Hauppauge, NY, USA, 2011; pp. 333–350. [Google Scholar]
Figure 1. Maps of the three coastal lagoons: Fogliano (a), Caprolace (b), and Sabaudia (c) within the Circeo National Park (black dot in the map of Italy); (d) including the sampling stations (1–4). Dotted lines represent the quadrants.
Water 13 00130 g001
Figure 2. Comparison among lagoons (x axis) and years (columns of plots) for the Pressure categories (rows of plots), represented as average ± SD. Significant (p < 0.05) differences among years (considered only for Fogliano and Caprolace) are reported with the capital letters in the upper left of each plot. Significant (p < 0.05) pairwise differences among lagoons (for 2012 Sabaudia is included) emerging from the post hoc comparisons are highlighted with gray lines at the bottom of each plot.
Water 13 00130 g002
Figure 3. Scores of anthropogenic pressure indicators for the Circeo coastal lagoons for each year of study. Scores range between 0 (no pressure) and 9 (high pressure). Bar plots represent: Water renewal time (EXCHANGE), Percentage of natural banks (BANKS), Status and efficiency of tidal inlets (INLET), Surface freshwater tributaries (FW SUPPLY), Percentage of anthropogenically affected land (LANDSCAPE), Mussel farming (AQUACULTURE), Fyke net density (FISHERY), Closed months per year by fishing barriers (FIXED BARRIER), Dissolved oxygen (DO), Chlorophyll-a (Chl-a), Dissolved Inorganic Nitrogen (DIN) and Reactive Phosphorus (RP).
Water 13 00130 g003
Figure 4. The SeN-MMI and the FyN-MMI versus the CPIs Morphology, Use, and Quality, and the final Pressure Index.
Water 13 00130 g004
Figure 5. Comparison among lagoons (x axis) and years (columns of plots) for the SeN-MMI and the included metrics (S_RS = number of resident species; D_domN = Margalef index evaluated on the dominant species; d_N_DV = abundance density of detritivours; d_B_RS = biomass density of resident species), represented as average (horizontal thin line), standard error (thick vertical error line), and standard deviation (thin vertical error bar). Significant (p < 0.05) differences among years (considered only for Fogliano and Caprolace) are reported with the capital letters in the upper left of each plot. Significant (p < 0.05) pairwise differences among lagoons (for 2012, Sabaudia is also included) emerging from the post hoc comparisons are highlighted with gray lines at the bottom of each plot. In case of significant interaction (p < 0.05) among time and lagoons, the groups highlighted from the post hoc comparison are reported using lower case symbols above reported in the plots. For the units of the metrics see Table S2.
Water 13 00130 g005
Figure 6. Comparison among lagoons (x axis) and years (columns of plots) for the FyN-MMI and the included metrics (D_RS(N)= Margalef index evaluated on the abundance of estuarine resident species; d_B_Bv= biomass density of benthivorous species; B/N_HZP = mean individual weight of hyperbenthivorous/zooplanktivorous/piscivorous species; D_Bv(N)), Margalef index evaluated on the abundance of benthivorous species) represented as average (horizontal thin line), standard error (thick vertical error line), and standard deviation (thin vertical error bar). Significant (p < 0.05) differences among years (considered only for Fogliano and Caprolace) are reported with the capital letters in the upper left of each plot. Significant (p < 0.05) pairwise differences among lagoons (for 2012, Sabaudia is also included) emerging from the post hoc comparisons are highlighted with gray lines at the bottom of each plot. In case of significant interaction (p < 0.05) among time and lagoons, the groups highlighted from the post hoc comparison are reported using lower case symbols above reported in the plots. For the units of the metrics see Table S2.
Water 13 00130 g006
Table 1. Main geomorphological and hydrographic features of the coastal lagoons of the Circeo National Park (Fogliano, Caprolace, and Sabaudia).
FoglianoCaprolaceSabaudia
Latitude41°24’41°21′41°16′
Longitude12°54′12°58′13°02′
Perimeter (km)11.28.420.1
Surface (ha)404226400
Max depth (m)2.02.910.0
Mean depth (m)0.91.34.5
Volume (m3)3,616,0002,923,78314,000,000
Inlet (n)222
Tributary (n)003
Tidal range (m)0.230.210.20
Water exchange rate (days)6090300
Average water temperature (°C)20.319.423.5
Average salinity (PSU)40.639.128.9
Table 2. Fish assemblages data matrix: the data set obtained by experimental fish samplings used in this study covered three years (2006, 2007, 2012). Gear type (SeN: seine net; FyN: fyke net), sampling years and relevant data sources are showed for each of the three coastal lagoons: Fogliano (FOG), Caprolace (CAP), and Sabaudia (SAB).
YearGearSeasonFOGCAPSABData Source
2006SeNWIN-SPR-SUM-AUT**-[33]
FyNWIN-SPR-SUM-AUT**-
2007SeNWIN-SPR-SUM-AUT**-[33]
FyN----
2012SeNSPR-SUM-AUT***[34];
present study
FyNSPR-SUM-AUT***
Table 3. Pressure categories and relative indicators used in this study to quantify the pressures index. Periodicity and dimension of the evaluation are reported as well as data sources. CPI: Category Pressure Index.
Pressure CategoryIndicatorPeriodicity of EvaluationDimension of EvaluationReferenceSource of Data
CPI MorphologyEXCHANGE—Geomorphic types according to mean water renewal timeFixed in timeWhole lagoon[4,38,39][40]
BANKS—Percentage of natural banksFixed in timeSectorsModified after [25]; [23]Field observations; GIS instruments
INLET—Status and efficiencyFixed in timeWhole lagoonExpert judgmentField observations; [40]; Consorzio Bonifica, personal communication, 2013
FW SUPPLY—Surface freshwater tributariesFixed in timeSectorsExpert judgmentPresent study;
Consorzio Bonifica, personal communication, 2013
CPI UseLANDSCAPE—Percentage of anthropogenically
affected land
Fixed in timeSectors[41]Present study; Corine Land Cover
AQUACULTURE—Mussel farmingAnnualSectorsExpert judgmentPresent study
FISHERY—Fyke net densityAnnualWhole lagoonModified after [22,23]Present study; National Fisheries Data Collection (2007–2012)
FIXED BARRIER—Closed months per yearAnnualWhole lagoonExpert judgmentPresent study; National Fisheries Data Collection (2007–2012)
CPI QualityDO—Dissolved OxygenSeasonalWhole lagoonLegislative Decree (L.D.) no. 152/06 [24]Agenzia Regionale Protezione Ambientale (ARPA) Lazio data set (2005–2012)
Chl-a—ChlorophyllSeasonalWhole lagoonL.D. no. 152/06ARPA Lazio data set (2005–2012)
DIN—Dissolved Inorganic NitrogenSeasonalWhole lagoonL.D. no. 152/06ARPA Lazio data set (2005–2012)
RP—Reactive PhosphorusSeasonalWhole lagoonL.D. no. 152/06ARPA Lazio data set (2005–2012)
Table 4. Annual sampling campaigns (2006, 2007 and 2012) in the coastal lagoons of the Circeo National Park, Fogliano (FOG), Caprolace (CAP), and Sabaudia (SAB) by seine net (SeN): relative percentage (%) of fish abundance (n. ind/150 m2) and biomass (g/150 m2) (-/- = abundance/biomass) of different fish species, which represent 90% of the data matrix are shown. Tick symbol (✓) represents fish species present in each lagoon. For each species, the ecological guilds, relative to the primary habitat use and the feeding guilds, are shown. Codes are abbreviated as follows: HUFG (Habitat Use Functional Guild): (C) Catadromous, (RS) Resident species, (F) Freshwater species, (MM) Marine migrant, (MS) Marine straggler. FMFG (Feeding Mode Functional Guild): (Bmi) Microbenthivores, (BMa) Macrobenthivores, (HZ) Hyperbenthivores/zooplanktivores, (HP) Hyperbenthivores/piscivores, (OV) Omnivore, (DV) Detritivores, (PL) Planktivores.
SpeciesHUFGFMFG200620072012
FOGCAPFOGCAPFOGCAPSAB
Anguilla anguillaCBMa,HP -/7-/5
Gambusia affinis *FOV
Aphanius fasciatusRSOV22/2011/562/4322/1346/4541/41
Atherina boyeriRSHZ66/7424/326/2630/3023/3244/4889/57
Gobius cobitisRSBmi,BMa,HZ
Gobius nigerRSBmi,BMa,HZ-/6
Knipowitschia panizzaeRSBmi,HZ4/ 12/3
Nerophis ophidionRSBmi,HZ
Salaria pavoRSBmi,OV
Syngnathus abasterRSBmi,HZ14/76/-6/-7/-
Aphia minutaMMPL
Chelon labrosusMMOV,DV
Dicentrarchus labraxMMHZ,HP4/-
Diplodus annularisMMBmi,BMa,HZ4/-
Diplodus puntazzoMMOV
Diplodus sargusMMOV
Diplodus vulgarisMMBmi,BMa,HZ
Engraulis encrasicolusMMPL
Liza aurataMMOV,DV6/223/--/4 7/33
Liza ramadaMMOV,DV23/1713/4 -/3
Liza saliensMMOV,DV4/4-/1917/263/--/3
Mugil cephalusMMOV,DV 3/-
Solea soleaMMBmi,BMa
Sparus aurataMMBmi,BMa,HZ
Apogon imberbisMS
Belone beloneMSHP
Dentex dentexMS
Epinephelus marginatusMS
Hippocampus guttulatusMSBmi,HZ
Lithognathus mormyrusMSBmi,BMa,HZ
Mullus barbatusMSBmi,BMa
Mullus surmuletusMS
Pagellus acarnaeMSBmi,BMa
Parablennius sanguinolentusMSHV
Sardina pilchardusMSPL -/7
Sarpa salpaMSBmi,HV
Sciaena umbraMSHP
Scorpaena porcusMSBMa,HP
Serranus cabrillaMSBMa,HP
Spicara maenaMSHZ
Symphodus tincaMSBmi,BMa -/12
Trachinotus ovatusMSBmi,BMa
* Non-native species.
Table 5. Annual sampling campaigns (2006 and 2012) in the coastal lagoons of the Circeo National Park, Fogliano (FOG), Caprolace (CAP) and Sabaudia (SAB) by fyke net (FyN): relative percentage (%) of fish abundance (n. ind/gear) and biomass (g/gear) (-/- = abundance/biomass) of different fish species which represent 90% of the data matrix are shown. Tick symbol (✓) represents fish species present in each lagoon. For each species, the ecological guilds, relative to the primary habitat use and the feeding guilds, are shown. Codes are abbreviated as follows: HUFG (Habitat Use Functional Guild): (C) Catadromous, (RS) Resident species, (F) Freshwater species, (MM) Marine migrant, (MS) Marine straggler. FMFG (Feeding Mode Functional Guild): (Bmi) Microbenthivores, (BMa) Macrobenthivores, (HZ) Hyperbenthivores/zooplanktivores, (HP) Hyperbenthivores/piscivores, (OV) Omnivore, (DV) Detritivores, (PL) Planktivores.
SpeciesHUFGFMFG20062012
FOGCAPFOGCAPSAB
Anguilla anguillaCBMa,HP/43/4610/816/85/7
Gambusia affinis *FOV
Aphanius fasciatusRSOV28/2512/25/52/6
Atherina boyeriRSHZ70/3078/3646/35/97/72
Gobius cobitisRSBmi,BMa,HZ
Gobius nigerRSBmi,BMa,HZ/8
Knipowitschia panizzaeRSBmi,HZ
Nerophis ophidionRSBmi,HZ
Salaria pavoRSBmi,OV
Syngnathus abasterRSBmi,HZ
Aphia minutaMMPL
Chelon labrosusMMOV,DV
Dicentrarchus labraxMMHZ,HP
Diplodus annularisMMBmi,BMa,HZ11/13/5
Diplodus puntazzoMMOV
Diplodus sargusMMOV
Diplodus vulgarisMMBmi,BMa,HZ
Engraulis encrasicolusMMPL
Liza aurataMMOV,DV
Liza ramadaMMOV,DV
Liza saliensMMOV,DV
Mugil cephalusMMOV,DV
Solea soleaMMBmi,BMa
Sparus aurataMMBmi,BMa,HZ
Apogon imberbisMS
Belone beloneMSHP
Dentex dentexMS
Epinephelus marginatusMS
Hippocampus guttulatusMSBmi,HZ
Lithognathus mormyrusMSBmi,BMa,HZ
Mullus barbatusMSBmi,BMa
Mullus surmuletusMS
Pagellus acarnaeMSBmi,BMa
Sardina pilchardusMSPL
Sarpa salpaMSBmi,HV
Sciaena umbraMSHP /3
Scorpaena porcusMSBMa,HP /5
Serranus cabrillaMSBMa,HP
Spicara maenaMSHZ
Symphodus tincaMSBmi,BMa
Trachinotus ovatusMSBmi,BMa
* Non-native species.
Table 6. Correlations between fish-based multi-metric indices (SeN-MMI and FyN-MMI) and the final Pressure Index (PI) detailing the three pressure categories (CPI), and each pressure indicator within the categories. Significant negative correlation values between MMIs, metrics and anthropogenic pressures are marked by a single (p < 0.05), double (p < 0.01) or triple (p < 0.001) asterisk. SeN-MMI metrics: Number of resident species (S_RS); Margalef index evaluated on the dominant species (D_domN); abundance density of detritivorous (d_N_DV); biomass density of resident species (d_B_RS). FyN-MMI metrics: Margalef index evaluated on the abundance of estuarine resident species (D_RS(N)); biomass density of benthivorous species (d_B_Bv); mean individual weight of hyperbenthivorous/zooplanktivorous/piscivorous species (B/N_HZP); Margalef index evaluated on the abundance of benthivorous species (D_Bv(N)).
Pressures SeN-MMIFyN-MMI
SeN-MMIFyN-MMIS_RSD_domNd_N_DVd_B_RSD_RS(N)d_B_BvB/N_HZPD_Bv(N)
Exchange−0.000−0.345 **−0.224 **−0.183 *0.258 **0.094−0.199−0.182−0.163−0.171
Banks−0.0670.1640.1410.050−0.224 **−0.0730.0400.362 **0.1980.231
Inlet−0.0890.0870.146−0.066−0.263 ***0.100−0.0260.373 **0.209−0.016
FW supply−0.1140.0000.0360.033−0.176 *−0.060−0.0590.1340.1400.039
CPI Morphology−0.1120.0130.082−0.005−0.214 **−0.034−0.0710.305 *0.1840.105
Aquaculture−0.011−0.323 **−0.192 *−0.1430.216 **0.107−0.1800.153−0.131−0.175
Fishery−0.077−0.318 **−412 ***−0.0720.325 ***−0.034−0.124−0.303 *−0.304 *−0.093
Barrier−0.326 ***−0.375 **-0.236 **0.111−0.069−0.316 ***−0.167−0.244 *−0.252 *−0.211
Landscape−0.117−0.105−0.050−0.032−0.082−0.100−0.114−0.0840.101−0.085
CPI Use−0.277 ***−0.482 ***−361 ***−0.0270.090−0.215 **−0.257 *−0.350 **−0.239 *−0.243 *
DO−0.181 *−0.248 *−0.103−0.184 *−0.024−0.086−0.227−0.001−0.040−0.092
Chl-a0.059−0.0200.040−0.1250.0350.147−0.0430.1640.144−0.147
DIN−0.076−0.236−0.239 **−0.175 *0.263 ***−0.006−0.218−0.0170.086−0.268 *
RP−0.271 ***0.006−0.1430.096−0.145−0.164 *0.174−0.066−0.1130.026
CPI Quality−0.133−0.188−0.126−0.190 *0.054−0.001−0.1630.0660.068−0.193
Pressure Index−0.270 ***−0.354 **−0.200 *−0.110−0.049−0.129−0.264 *0.0070.005−0.179
Publisher’s Note: MDPI stays neutral with regard to jurisdictional claims in published maps and institutional affiliations.

