Vegetation Survival in Green Roofs without Irrigation


Dipartimento di Ingegneria Civile e Ambientale, Politecnico di Milano, Milano 20133, Italy
*
Author to whom correspondence should be addressed.
Water 2021, 13(2), 136; https://doi.org/10.3390/w13020136
Submission received: 3 November 2020
/
Revised: 22 December 2020
/
Accepted: 5 January 2021
/
Published: 8 January 2021
(This article belongs to the Special Issue Innovative, Smart and Sustainable Solutions for Urban Stormwater Management)
Abstract
:The implementation of green roofs as sustainable urban drainage systems provides benefits for stormwater control and the environment and is more and more encouraged. A model for the estimation of the probability of vegetation survival without irrigation is proposed. The model, developed through a probabilistic analytical derivation procedure, can also consider the effects of chained rainfall events, without the need of continuous simulation of hydrological processes. The model equations can be useful in the design of green roofs, allowing to determine the growing medium thickness in terms of an assumed risk of vegetation withering in dry periods. The proposed model is also able to identify the optimal thickness of the growing medium, over which the survival performances can be increased only with irrigation. Model performances were tested by the application to two case studies in Italy. Comparison between the probabilities and the cumulative frequencies from a continuous simulation of water content in the growing medium shows a good agreement and provide a first confirmation of reliability.
1. Introduction
The use of Sustainable Urban Drainage Systems (SUDS) delivers several benefits: the relief of loads in the sewer networks, the increase of efficiency of wastewater treatment plants, the reduction of polluted waters discharged into the environment, and the growth of biodiversity in urban areas.
In highly urbanized cities, characterized by a large number of impervious areas that strongly reduce soil infiltration, with a consequent rise of the flooding risk, green roofs can be an effective countermeasure since they are largely widespread and do not require additional space with respect to the building footprint [1]. Their implementation also entails significant environmental and economic benefits, besides stormwater management and the improvement of quality of receiving water bodies, such as energy savings, the reduction of heat island effects, the support, and the enhancement of biodiversity. Focusing on stormwater management, green roofs allow: the reduction, through evapotranspiration, of runoff volumes; the time delay of runoff that starts after soil saturation; the reduction of runoff peak rates, thanks to the temporary storage of infiltrated water in the substrate and in the drainage layer; the improvement of stormwater quality through percolation into the soil. The first green roofs were installed in Germany in the 1970s [2] and since then they spread in many countries, in some cases also due to national or regional programs to encourage or even impose their realization. Green roofs have been deeply studied to analyze their performance under different climate and design conditions [3,4,5,6,7], often with reference to a specific place [8,9,10] on small spatial and time scale [11,12] while on a large scale there are few studies that demonstrate their hydrological benefits [13,14]. The focus of most of these studies is mainly on the retention capacity of green roofs in relation to rainfall depth, antecedent dry period [15,16], and evapotranspiration [17].
The aim of this paper is to develop a probabilistic model for the analysis of green roof water content evolution due to a series of rainfall events. Particularly, the green roof performance in terms of vegetation survival without irrigation has been investigated to achieve an operational procedure that may be useful for designers. The analytical semi-probabilistic approach, used in this study, was first proposed in the present form by Reference [18] and applied by others also to SUDS and Rainwater Harvesting Systems [19,20], infiltration trenches [21], permeable pavements [22], bioretention systems [23], green roofs [24,25,26,27], and stormwater detention facilities [28,29,30,31,32,33]. Generally, these studies consider a couple of rainfall events at a time, neglecting, or only partially considering the possibility of pre-filling from previous events.
Becciu and Raimondi observed that for low outflow rates, pre-filling is generally due to more than one previous rainfall, and to fill this lack, neglected in previous studies in literature, they developed a procedure to consider a chain of three events [28]. For green roofs, where the outflow rate is characterized by evapotranspiration from soil and vegetation, this issue becomes particularly relevant. In this paper, a chain of N consecutive rainfall events has been considered in the modeling. This aspect represents a significant improvement of the analytical probabilistic approach since it allows to consider the possibility of having a reduction of water storage capacity, due to chain effect of successive rainfall events, especially with low outflow rates.
Considering this chain effect, probabilistic estimation of both runoff from the green roof and vegetation survival without irrigation during dry period is more accurate. The first issue, about runoff estimation, was discussed by the Authors in another paper [27]. Results presented in this paper are focused on the second issue and can be considered complementary. The proposed approach, based on the estimation of vegetation survival probability in dry periods without irrigation, allows to define the proper thickness of growing medium as a function of potential evapotranspiration and of parameters of the rainfall stochastic process. This depth can be used together with the minimum depth for runoff reduction in design procedures. The resulting equations have been validated by their application to two case studies of experimental green roofs located at Politecnico di Milano and the University of Calabria, Italy.
Green Roof Hydrology
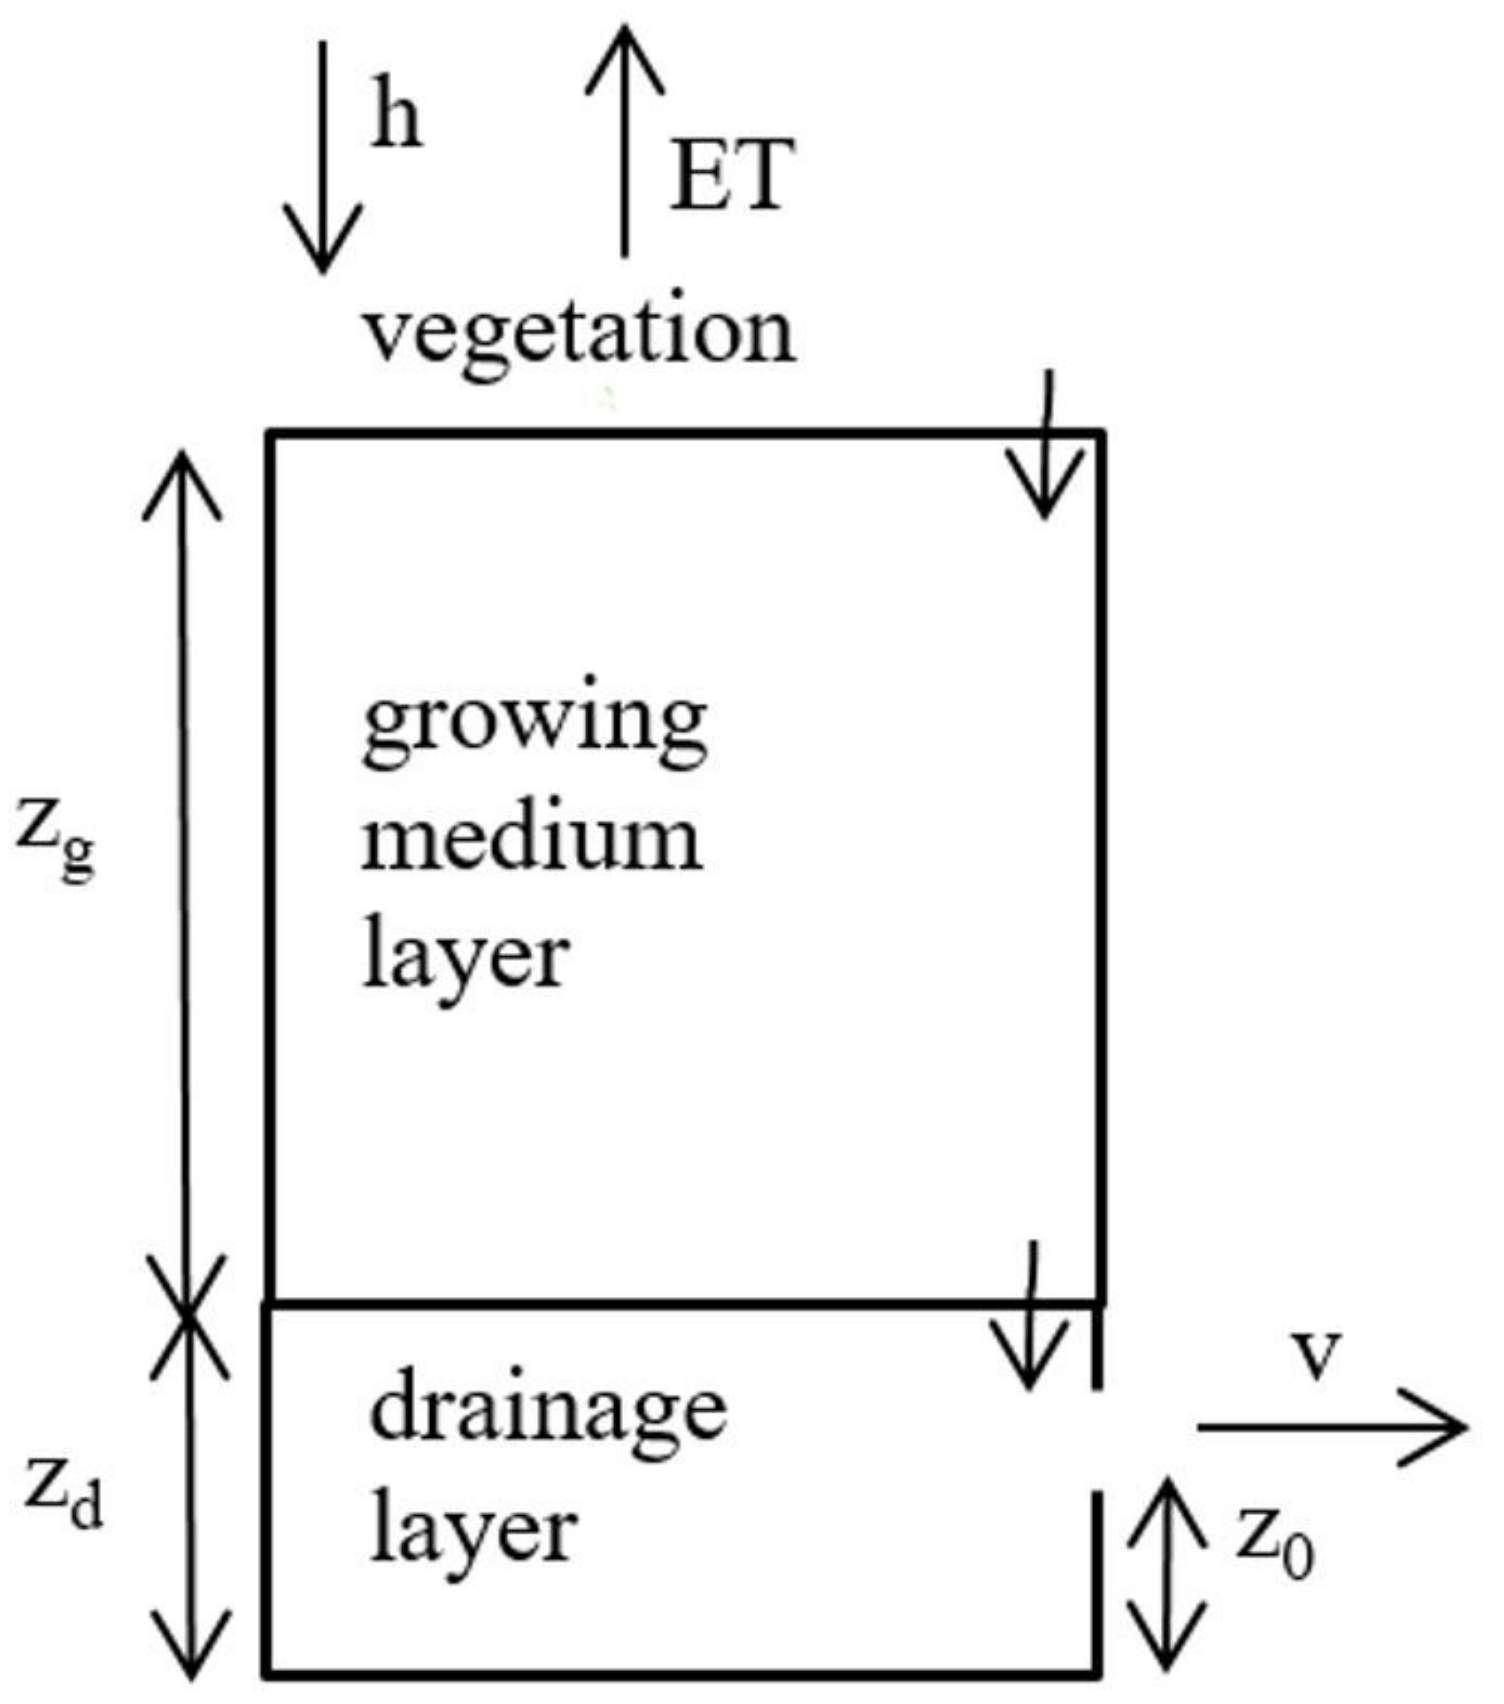
Green roofs are engineered multi-layered structures, with a vegetated upper surface, working in very shallow systems without connection to the natural ground. Typical layers in green roofs are: vegetation; growing medium, a blend of mineral material enriched with organic material where water is retained and in which vegetation is anchored; filter fabric; drainage layer, generally constituted of plastic profiled trays, in which water is stored, for plants sustainment during dry periods and for runoff and outflow peak attenuation; root resistant membrane. Water content in a green roof varies according to rainfall, evapotranspiration, runoff, and outflow. Figure 1 shows the conceptual reference scheme considered here for the green roof modeling.
Rainfall is first intercepted by vegetation and then infiltrated into the growing medium, where it is retained, used by roots, and released back into the atmosphere through evapotranspiration. The excess is stored in the underlying drainage layer, equipped with an overflow. The interception by vegetation generally is of few millimeters and is neglected in this study. Volumes in Figure 1 must be intended as specific for the unit area.
Green roofs design includes the definition of the thickness of each layer and the choice of vegetation, according to rooting depth, drought resistance, time to reseed, aesthetics, ability to withstand temporary soil waterlogging, and need for maintenance. Drainage layer is usually made with pre-cast standard elements to achieve a storage capacity generally variable between 5 and 10 cm. The focus in this paper is on growing medium and on its retention capacity, with the aim of defining a proper thickness in terms of probability of vegetation survival without irrigation.
2. Material and Methods
To evaluate the probability of vegetation survival without irrigation, the water content at the end of dry period between consecutive events, representing the condition of minimum water content into growing medium, has been estimated. Extended rainless periods, especially occurring during the hot season, can result in the soil moisture falling to its ‘wilting point’, with the subsequent withering of vegetation. After this, transpiration is nullified, but the progressive soil desiccation, due to evaporation, on the other side, is initially positive in terms of increased capacity to buffer runoff.
Evapotranspiration, which is the amount of water released to the atmosphere from plants transpiration and soil evaporation, can be estimated by the following equation:
where ETp is the potential evapotranspiration, which is the maximum value of ET, reached when the vegetation water demand is completely fulfilled. Water content into the growing medium at the beginning of a rainfall event hge can be expressed as a volume per unit surface area, which is as a “water” depth. It varies between zero (completely dry) and a maximum value (at saturation), which can be expressed by the product ϕf·zg ϕf is the growing medium moisture content per unit of depth at saturation, is the growing medium thickness.
If a constant evapotranspiration rate Et is assumed during the rainfall, the water content at the end of a rainfall event of rainfall depth h and duration θ can be estimated as:
Analogously, if the same constant evapotranspiration rate Et is assumed also after the rainfall, the water content at the end of the dry period of duration d, that is at the beginning of the successive rainfall event, can be estimated as:
Equations (2) and (3) could be used for a simplified continuous simulation of a green roof, starting from an initial condition of water content, when a series of rainfall depth records is available.
2.1. Probabilistic Model
The aim of the proposed probabilistic model is to give an estimate of the growing medium thickness to be considered in the green roofs design. This estimation is based on the assumed probability of having a minimum water content to allow vegetation survival during dry periods without irrigation. The random variables considered in the stochastic process of rainfall events, that is rainfall depth h, rainfall duration θ, and interevent time d have been assumed to be independent and exponentially distributed. The model neglects the random nature of runoff coefficient [34]. To define the independent rainfall events in the stochastic process, a minimum interevent time Inter Event Time Definition (IETD) has been defined for their extraction from the series of rainfall records [35]. If the dry period between two consecutive rainfall events (interevent time) is smaller than IETD, they are joined into a single event. There are different methods to select IETD: estimating the autocorrelation coefficient of observations sample, choosing the values for which the coefficient of variation tends to one, evaluating the relationship between IETD and the average number of rainfall events.
In the developed model of probabilistic derivation, it was assumed that the rainfall variables have an exponential distribution. This hypothesis is usually considered in literature as a good compromise between compliance to rainfall records and the need of easier mathematical tractability [36,37,38]. Some authors suggested other probability distribution functions (PDFs), such as the Weibull [39] or the double-exponential [28]. Although a better fitting of the observed frequencies of rainfall records can be achieved with these alternative PDFs, the improvement in terms of model accuracy seems negligible compared with the significant increase of the mathematical difficulty in the model development.
Exponential PDFs of rainfall depth, rainfall duration, and interevent time are expressed as:
where: ; ; ; and , and are, respectively, the mean values of rainfall depth, rainfall duration and interevent time. Water content can be different from zero at the end of a dry period, due to a pre-filling from previous events, when results (zg· − w)/Et > IETD. To translate this condition in probabilistic terms, two different cases have been analyzed: a single rainfall and a series of chained rainfall events. When a single rainfall event is considered, the probability P to have, at the end of the dry period between two consecutive rainfalls, a minimum water content into the growing medium to ensure vegetation survival results to be:
When a series of N chained rainfall events is considered, the probability P results to be:
The quantities γ, β, βN, and βN* are equal to:
Equation (8) can be used to estimate the growing medium thickness zg required in the green roofs design. Inputs to the model are: the mean values of rainfall variables, the IETD, the growing medium moisture content per unit depth at saturation , the evapotranspiration rate Et, the minimum water content for vegetation survival w, the number of chained events N. The evapotranspiration rate Et was assumed constant and equal to its potential value Etp. Results are shown in terms of the probability P to have a minimum water content in a green roof without irrigation for vegetation survival.
2.2. Case Studies
To validate the proposed procedure, Equations (7) and (8) have been applied to two experimental green roofs. One located on a building in Milano, at Politecnico di Milano [40] (called in the following GREEN ROOF (1); the other on a building in Cosenza, at the University of Calabria [41] (called in the following GREEN ROOF (2). They are both extensive green roofs, vegetated with three native Mediterranean species and sedum. The thickness of growing medium is 170 mm in GREEN ROOFS 1 and 80 mm in GREEN ROOF 2.
They are representative, respectively, of continental-temperate and Mediterranean climate conditions: average annual precipitation in Milano is about 1013 mm/year, with a mean annual temperature of 13.1 °C; average annual precipitation at the University of Calabria is about 881 [mm/year], with a mean annual temperature of 15 °C [42]. The main difference lies in the distribution of precipitation over the year: in Milano, there are not, on average, completely dry months; in Cosenza, summer is much less rainy than winter, with dry periods that can last for more than one month. For the green roof simulation two rainfall series were used: for GREEN ROOF 1, the series recorded at Milano-Monviso raingauge station in the period 1971–2005; for GREEN ROOF 2, the series recorded at the raingauge station of the experimental site of University of Calabria in the period October 2015–September 2016 [41]. The length of the second series of rainfalls is quite limited, so results of the application of the first case study are more reliable. The period considered for the analysis of GREEN ROOF 2 represents a wet year with annual precipitation of 1256.3 mm/year, with respect to the average annual precipitation for the site equal to 881 mm/year. For both case studies, to identify independent events a minimum interevent time IETD = 6 h has been assumed. This is considered a good choice for green roofs, as supported by other studies [2,5,7,16,41]. Table 1, Table 2 and Table 3 report the average values, the coefficients of variation, and the correlation indexes of rainfall variables estimated from the two series of records.
With reference to the evapotranspiration rate, experimental results in literature show values ranging from 1 to 6 mm/day [43,44] according to different climate scenarios and green roof characteristics. For the two case studies analyzed in this paper, constant evapotranspiration rates have been assumed. For annual analysis, values of 0.075 mm/h for GREEN ROOF 1 and 0.122 mm/h for GREEN ROOF 2 were assumed, according to measurements reported in References [40,41,45]. For summer, the assumed values were Et = 0.115 mm/h for GREEN ROOF 1 [40,45] and Et = 0.700 mm/h for GREEN ROOF 2 [41].
The growing medium moisture content at saturation per unit depth has been set equal to = 0.40 for GREEN ROOF 1 and = 0.58 for GREEN ROOF 2; these values were taken from past studies of the two green roofs [40,41,45,46]. Eleven values of the growing medium thickness zg ranging from 50 mm to 200 mm have been considered. The minimum water content w has been set to zero to test the pre-filling conditions.
2.3. Assumptions
The hypothesis of exponential distribution of rainfall variables was tested. Results in Table 2 show a good fitting for rainfall duration, less for rainfall depth, and interevent time. However, previous studies [27] revealed that this simplifying assumption does not strongly influence the accuracy of the proposed approach.
The hypothesis of independence of rainfall variables was also tested. Results in Table 3 show that it substantially holds in all cases except for rainfall depth and rainfall duration. Although probabilistic models based on copulas could be used to take into account this issue [47] to allow the mathematical derivation of Equations (7) and (8), they have not been considered. Climate changes are not considered in the analysis as well as the building’s type that can affect the roof temperature and result in the evapotranspiration by the green roof.
The hypothesis of constant evapotranspiration, although assumed in other studies before [26,27], is usually too simplifying with respect to green roof behavior observed in real cases, especially during dry periods. A soil moisture retention/drying curve and hydraulic conductivity model should be used to simulate the evolution in time of soil moisture content. However, for the aim of this paper, which is to develop a probabilistic estimation model of water content evolution due to successive rainfall events, the simple scheme of Equations (2) and (3) is at the same time essential and adequate. Moreover, we suggest the use of the potential evapotranspiration rate to achieve conservative results and counterbalance the effects of this simplifying hypothesis.
3. Results and Discussion
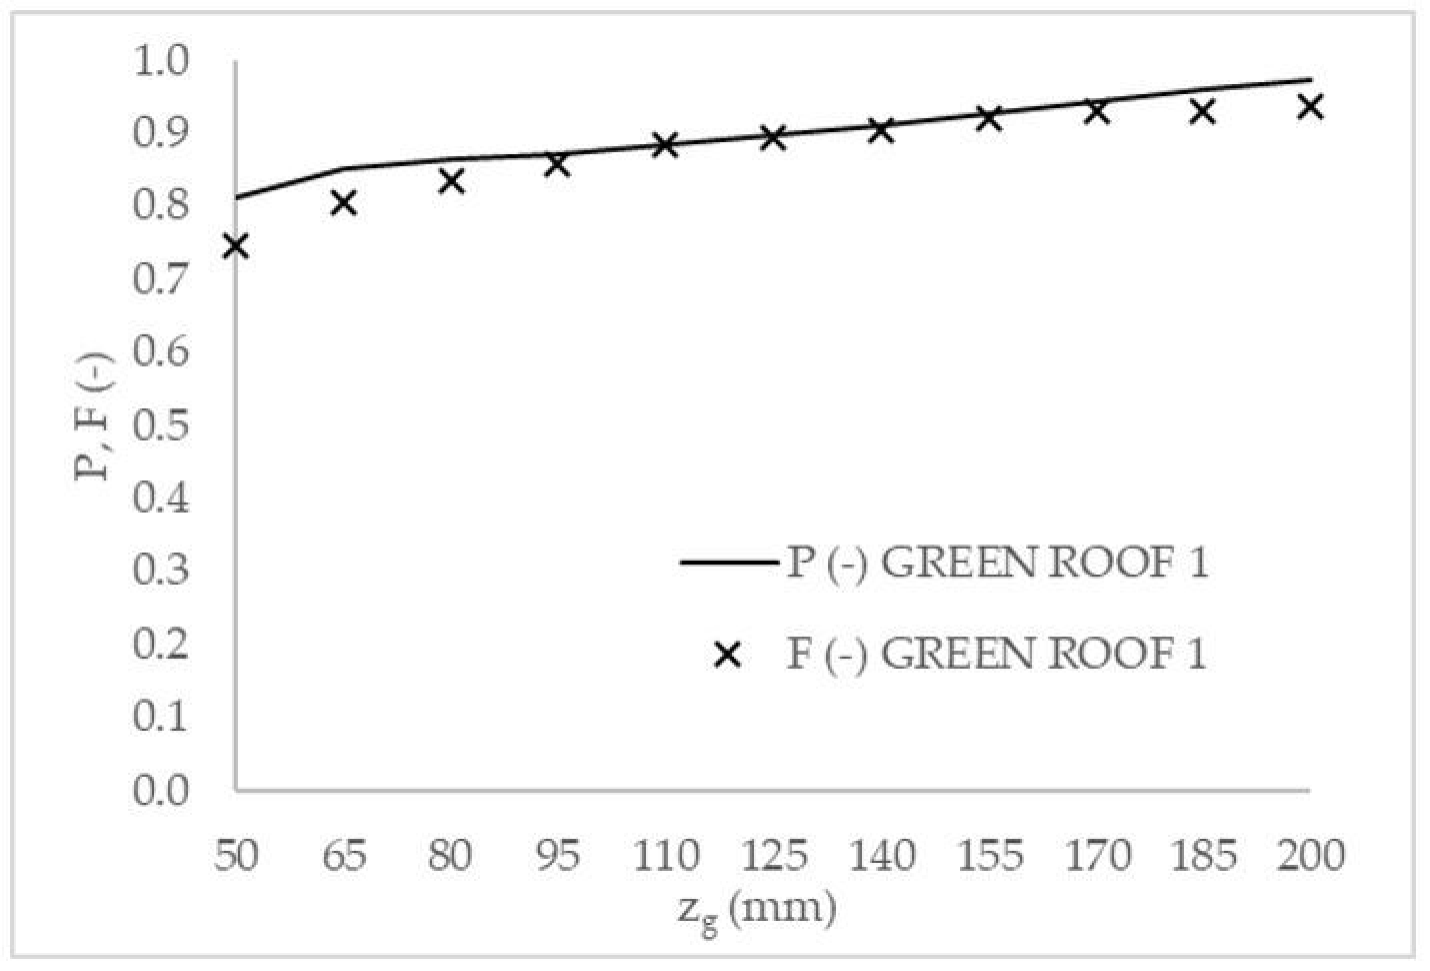
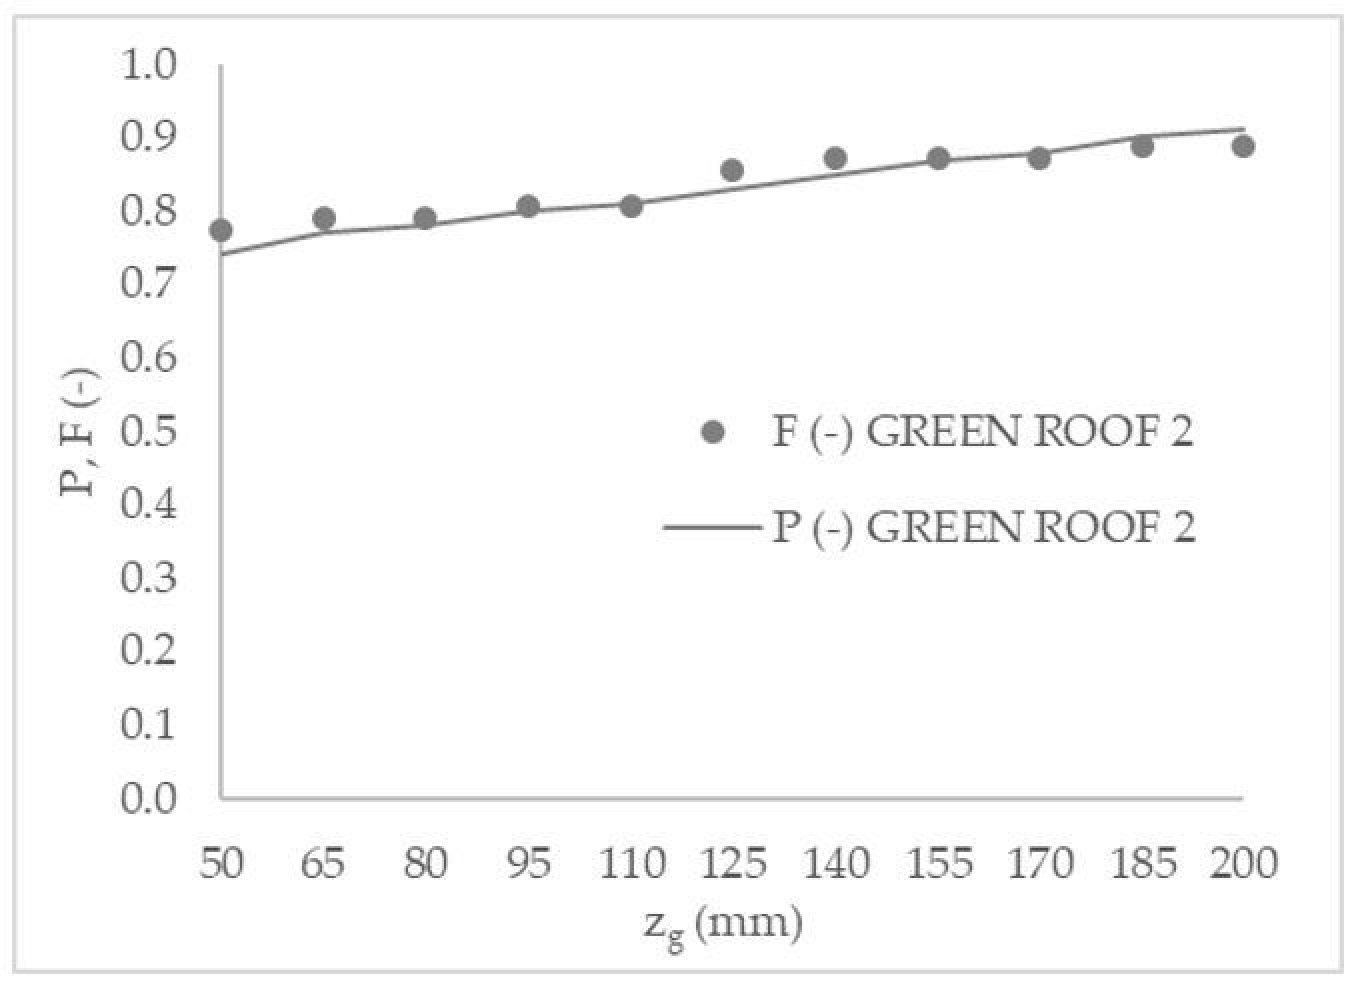
The proposed probabilistic model has been validated and tested by comparison with continuous simulation. Probabilities P, from Equations (7) and (8) with N = 5, and cumulated frequencies F from continuous simulation are compared in Figure 2 and Figure 3.
As can be seen, there is a good fitting between P and F for both sites. In both cases, as expected, the probability to have a minimum water content for vegetation survival without irrigation increases with the thickness of growing medium. Considering the whole period of analysis, P results slightly higher for GREEN ROOF 1 with respect to GREEN ROOF 2. This is due to the higher value of constant evapotranspiration rate used for the roof at the University of Calabria. In Table 4 and Table 5, the probability of vegetation survival P, estimated by Equations (7) and (8), and the related average return interval ARI = 1/(1 − P) are reported for growing medium thickness ranging from 50 mm to 200 mm.
In the case of GREEN ROOF 1, P varies between 0.81 and 0.97. For the actual growing medium thickness zg = 170 mm, P is equal to 0.94, corresponding to an ARI = 18 years. In the case of GREEN ROOF 2, P varies between 0.74 and 0.91. For the actual growing medium thickness zg = 80 mm, P is equal to 0.78, corresponding to an ARI = 5 years.
Previous results are related to the behavior of green roofs along the whole year. In the following, the focus is on summer, the most critical season for vegetation survival without irrigation. Table 6 shows the average values of rainfall variables measured at Milano-Monviso station (GREEN ROOF 1) and at the experimental site of the University of Calabria (GREEN ROOF 2) in this season.
For both sites, summer is characterized by higher rainfall intensities and longer dry periods; this climatic feature is more evident for GREEN ROOF 2 because it is characterized by a Mediterranean climate with summers much less rainy than winters.
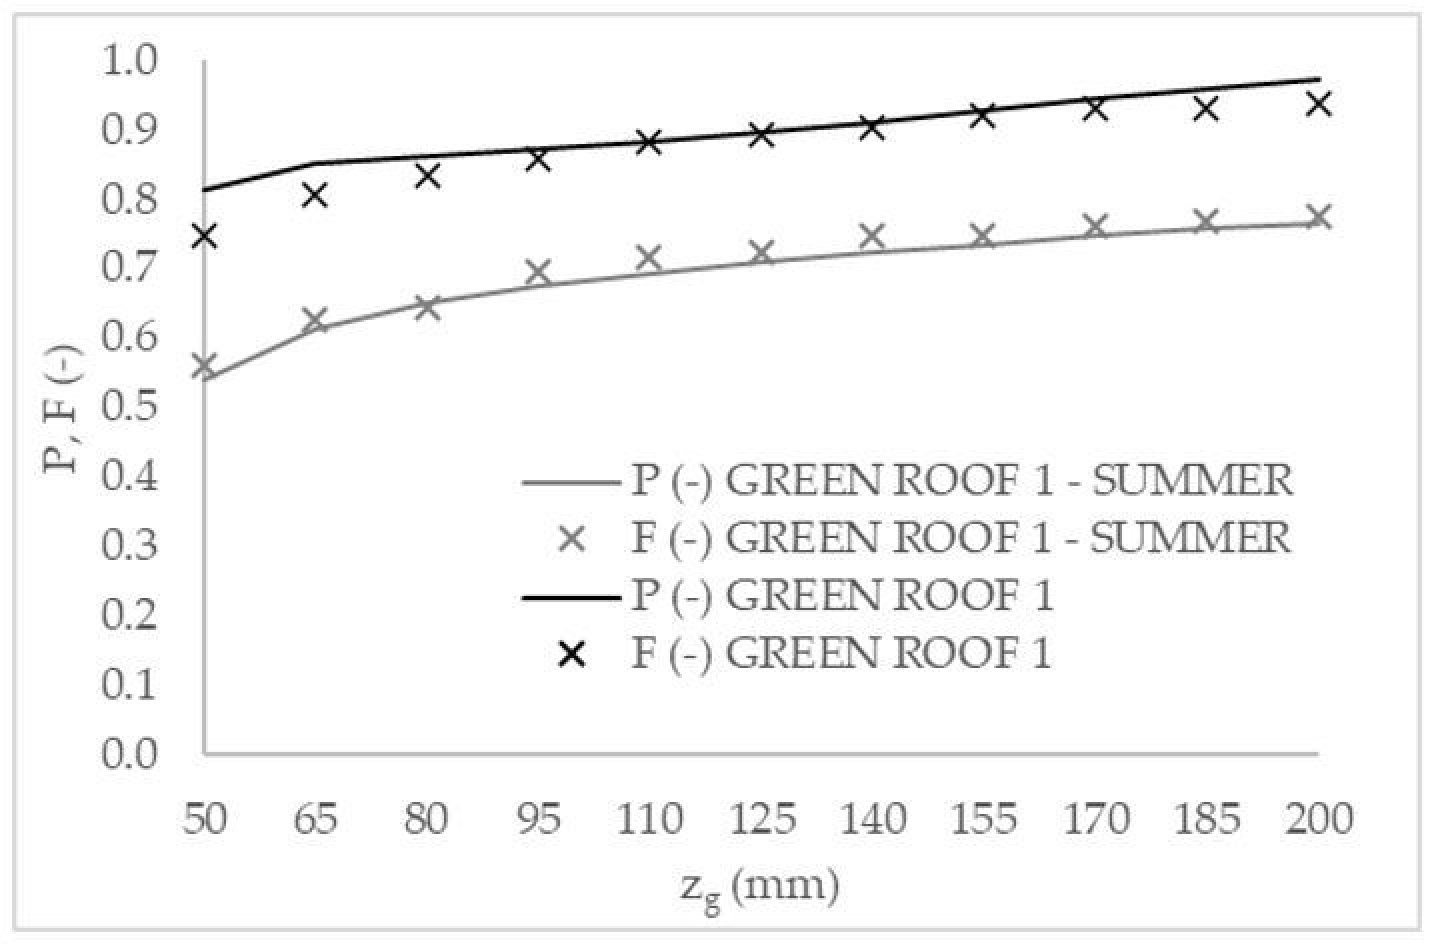
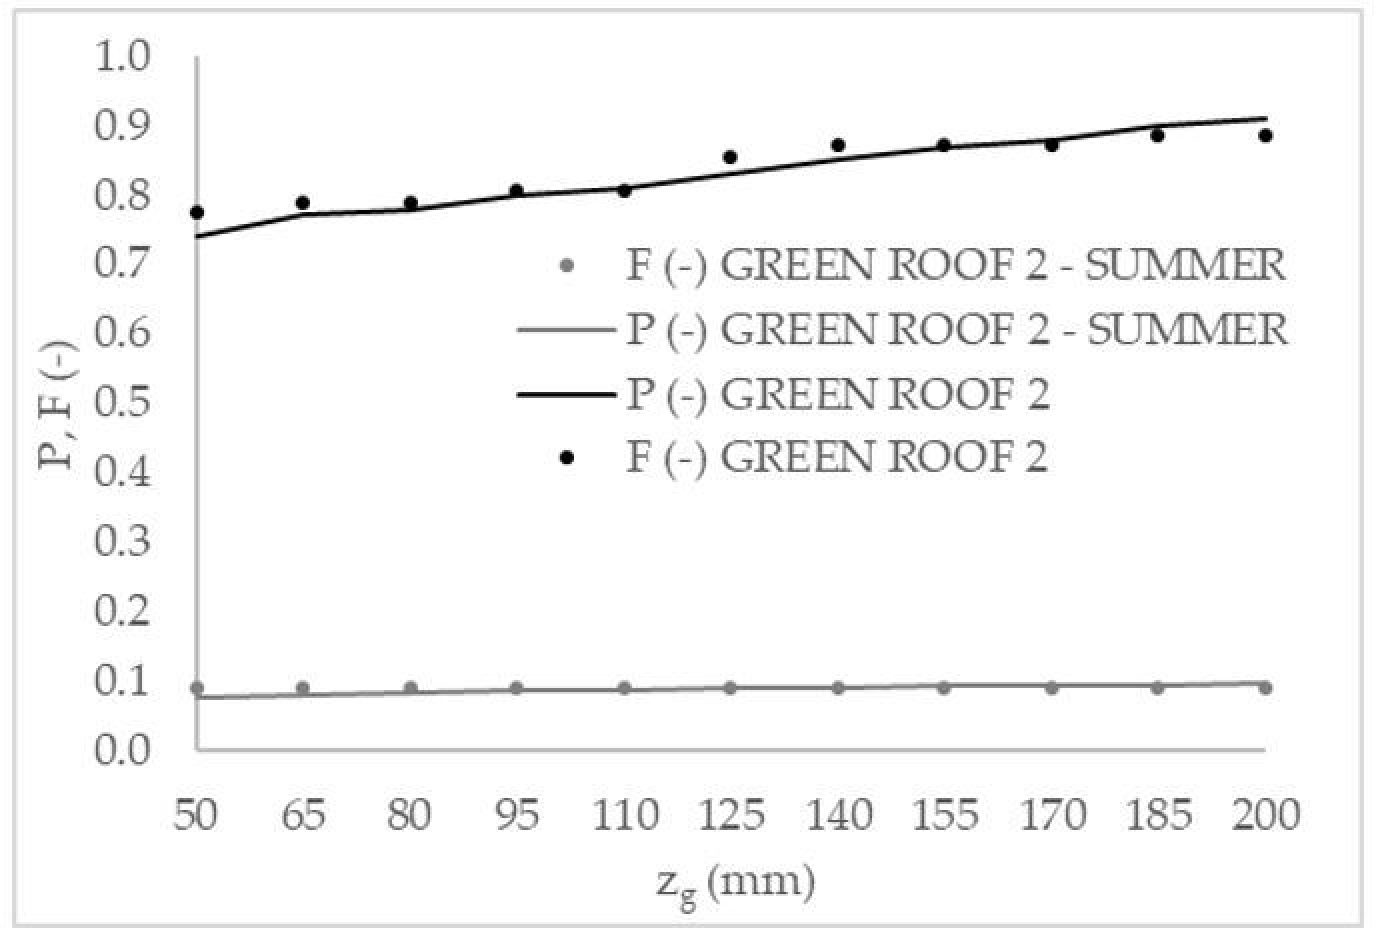
The same considerations previously done for the whole year are valid for summer. In the case of GREEN ROOF 2 at the University of Calabria, however, a stronger correlation among variables is observed. This result could be influenced also by the short length of the series of rainfall records. In Figure 4 and Figure 5, probabilities P, from Equations (7) and (8) with N = 5, and cumulated frequencies F from continuous simulation are compared for summer.
Furthermore, in the case of summer, results show good accordance between P and F. Obviously, during summer, the probabilities of vegetation survival without irrigation are lower due to the higher evapotranspiration rates and longer dry periods.
In the case of GREEN ROOF 1, P varies between 0.54 and 0.77. For the actual growing medium thickness zg = 170 mm, P is equal to 0.75, corresponding to an ARI = 4 years. For GREEN ROOF 2, P varies between 0.08 and 0.10. For the actual growing medium thickness zg = 80 mm, P is equal to 0.08, corresponding to an ARI = 1 years.
It is important to observe that the increase of growing medium thickness does not correspond to a significant increase of the ARI, so a meaningful growth of the probability of vegetation survival can be achieved only by irrigation.
4. Conclusions
A model for the estimation of the probability of survival for vegetation of green roofs without irrigation is proposed. Developed equations relate this probability to the thickness of growing medium, average potential evapotranspiration rate, and climate features. The application to two case studies at Politecnico di Milano and at the University of Calabria (Italy) has shown excellent accordance to results from continuous simulation.
An important value of the model is the possibility of taking into account the effects of chained rainfall events, without the need of continuous simulation of hydrological processes. This makes results more reliable and application easier and cheaper in terms of computational time and data needs.
Equations (7) and (8) can be used in green roof design, together with others from previous studies [26], to achieve the identification of a thickness of growing medium that results proper for both runoff control and vegetation survival. An interesting achievement is the possibility to identify an optimal value of the growing medium thickness above which the probability of vegetation survival does not increase significantly without irrigation.
Further future improvements of this study will focus mainly on the identification of the optimal number of chained rainfall events to be considered in the analysis. Another issue will be the extension of the model also to cases where limited information on the stochastic process for rainfall events is available. The model will be tested also on case studies in different climate conditions.
Author Contributions
Conceptualization, G.B. and A.R.; methodology, A.R., U.S. and G.B.; formal analysis, A.R.; validation: A.R.; data curation, A.R.; writing—original draft preparation, A.R.; writing—review and editing, A.R., G.B. and M.M.; supervision, G.B. All authors have read and agreed to the published version of the manuscript.
Funding
This research received no external funding.
Institutional Review Board Statement
Not applicable.
Informed Consent Statement
Not applicable.
Data Availability Statement
3rd Party Data.
Conflicts of Interest
The authors declare no conflict of interest.
Glossary/Nomenclature
The following symbols are used in this paper:
| h | rainfall depth; |
| θ | rainfall duration; |
| d | interevent time; |
| v | runoff volume; |
| zg | growing medium thickness; |
| zd | drainage layer thickness; |
| z0 | overflow height; |
| ET | evapotranspiration volume; |
| ETp | potential evapotranspiration volume; |
| Et | evapotranspiration rate; |
| Etp | potential evapotranspiration rate; |
| growing medium moisture content per unit depth at saturation; | |
| hge | water content into growing medium at the end of the dry period (from previous rainfalls); |
| hgu | water content into growing medium at the end of rainfall event; |
| N | number of consecutive events; |
| average rainfall depth; | |
| average rainfall duration; | |
| average interevent time; | |
| w | minimum water content; |
| IETD | Inter Event Time Definition; |
| P | probability; |
| F | frequency; |
| ARI | Average Return Interval; |
| V | coefficient of variation; |
| ρ | correlation index; |
References
- Carter, T.L.; Rasmussen, T.C. Hydrologic behavior of vegetated roofs 1. JAWRA J. Am. Water Resour. Assoc. 2006, 42, 1261–1274. [Google Scholar] [CrossRef]
- Getter, K.L.; Rowe, D.B.; Andresen, J.A. Quantifying the effect of slope on extensive green roof stormwater retention. Ecol. Eng. 2007, 31, 225–231. [Google Scholar] [CrossRef]
- Li, Y.; Babcock, R.W., Jr. Green roof hydrologic performance and modeling: A review. Water Sci. Technol. 2014, 69, 727–738. [Google Scholar] [CrossRef] [PubMed]
- Li, Y.; Babcock, R.W., Jr. Modeling hydrologic performance of a green roof system with HYDRUS-2D. J. Environ. Eng. 2015, 141, 04015036. [Google Scholar] [CrossRef]
- Palla, A.; Gnecco, I.; Lanza, L. Compared performance of a conceptual and a mechanistic hydrologic models of a green roof. Hydrol. Process. 2012, 26, 73–84. [Google Scholar] [CrossRef]
- Locatelli, L.; Mark, O.; Mikkelsen, P.S.; Arnbjerg-Nielsen, K.; Bergen, J.M.; Binning, P.J. Modelling of green roof hydrological performance for urban drainage applications. J. Hydrol. 2014, 519, 3237–3248. [Google Scholar] [CrossRef]
- Stovin, V.; Vesuviano, G.; De-Ville, S. Defining green roof detention performance. Urban Water J. 2017, 14, 574–588. [Google Scholar] [CrossRef] [Green Version]
- Hakimdavar, R.; Culligan, P.J.; Finazzi, M.; Barontini, S.; Ranzi, R. Scale dynamics of extensive green roofs: Quantifying the effect of drainage area and rainfall characteristics on observed and modeled green roof hydrologic performance. Ecol. Eng. 2014, 73, 494–508. [Google Scholar] [CrossRef]
- Peng, L.L.; Jim, C.Y. Seasonal and diurnal thermal performance of a subtropical extensive green roof: The impacts of background weather parameters. Sustainability 2015, 7, 11098–11113. [Google Scholar] [CrossRef] [Green Version]
- Herrera, J.; Flamant, G.; Gironás, J.; Vera, S.; Bonilla, C.A.; Bustamante, W.; Suárez, F. Using a hydrological model to simulate the performance and estimate the runoff coefficient of green roofs in semiarid climates. Water 2018, 10, 198. [Google Scholar] [CrossRef] [Green Version]
- Carbone, M.; Turco, M.; Nigro, G.; Piro, P. Modeling of hydraulic behaviour of green roof in catchment scale. In Proceedings of the International Multidisciplinary Scientific Geo Conferences SGEM 2014, Albena, Bulgaria, 19–25 June 2014; pp. 471–478. [Google Scholar]
- Palermo, S.A.; Talarico, V.C.; Turco, M. On the LID systems effectiveness for urban stormwater management: Case study in Southern Italy. IOP Conf. Ser. Earth Environ. Sci. 2020, 410, 012012. [Google Scholar] [CrossRef]
- Nawaz, R.; McDonald, A.; Postoyko, S. Hydrological performance of a full-scale extensive green roof located in a temperate climate. Ecol. Eng. 2015, 82, 66–80. [Google Scholar] [CrossRef]
- Andrés-Doménech, I.; Perales-Momparler, S.; Morales-Torres, A.; Escuder-Bueno, I. Hydrological Performance of Green Roofs at Building and City Scales under Mediterranean Conditions. Sustainability 2018, 10, 3105. [Google Scholar] [CrossRef] [Green Version]
- Berndtsson, J.C. Green roof performance towards management of runoff water quantity and quality: A review. Ecol. Eng. 2010, 36, 351–360. [Google Scholar] [CrossRef]
- Voyde, E.; Fassman, E.; Simcock, R. Hydrology of an extensive living roof under sub-tropical climate conditions in Auckland, New Zealand. J. Hydrol. 2010, 394, 384–395. [Google Scholar] [CrossRef]
- Bengtsson, L. Peak flows from thin sedum-moss roof. Hydrol. Res. 2005, 36, 269–280. [Google Scholar] [CrossRef]
- Adams, B.; Papa, F. Analytical Probabilistic Models for Stormwater Management Planning; John Wiley and Sons: New York, NY, USA, 2000. [Google Scholar]
- Becciu, G.; Raimondi, A.; Dresti, C. Semi-probabilistic design of rainwater tanks: A case study in Northern Italy. Urban Water J. 2018, 15, 192–199. [Google Scholar] [CrossRef]
- Raimondi, A.; Becciu, G. Probabilistic modeling of rainwater tanks. Procedia Eng. 2014, 89, 1493–1499. [Google Scholar] [CrossRef] [Green Version]
- Raimondi, A.; Becciu, G. Probabilistic design of multi-use rainwater tanks. Procedia Eng. 2014, 70, 1391–1400. [Google Scholar] [CrossRef] [Green Version]
- Zhang, S.; Guo, Y. An analytical equation for evaluating the stormwater volume control performance of permeable pavement systems. J. Irrig. Drain. Eng. 2015, 141, 06014004. [Google Scholar] [CrossRef]
- Zhang, S.; Guo, Y. Stormwater capture efficiency of bioretention systems. Water Resour. Manag. 2014, 28, 149–168. [Google Scholar] [CrossRef]
- Guo, Y. Stochastic analysis of hydrologic operation of green roofs. J. Hydrol. Eng. 2016, 21, 04016016. [Google Scholar] [CrossRef]
- Zhang, S.; Guo, Y. Analytical probabilistic model for evaluating the hydrologic performance of green roofs. J. Hydrol. Eng. 2013, 18, 19–28. [Google Scholar] [CrossRef]
- Guo, Y.; Zhang, S.; Liu, S. Runoff Reduction Capabilities and Irrigation Requirements of Green Roofs. Water Resour Manag. 2014, 28, 1363–1378. [Google Scholar] [CrossRef]
- Raimondi, A.; Becciu, G. Performance of Green Roofs for Rainwater Control. Water Resour. Manag. 2020, 34, 1–13. [Google Scholar]
- Becciu, G.; Raimondi, A. Factors affecting the pre-filling probability of water storage tanks. WIT Trans. Ecol. Environ. 2012, 164, 473–484. [Google Scholar]
- Becciu, G.; Raimondi, A. Probabilistic analysis of spills from stormwater detention facilities. WIT Trans. Built Environ. 2014, 139, 159–170. [Google Scholar]
- Becciu, G.; Raimondi, A. Probabilistic analysis of the retention time in stormwater detention facilities. Procedia Eng. 2015, 119, 1299–1307. [Google Scholar] [CrossRef] [Green Version]
- Becciu, G.; Raimondi, A. Probabilistic modeling of the efficiency of a stormwater detention facility. Int. J. Sustain. Dev. Plan. 2015, 10, 795–805. [Google Scholar] [CrossRef] [Green Version]
- Raimondi, A.; Becciu, G. On pre-filling probability of flood control detention facilities. Urban Water J. 2017, 12, 344–351. [Google Scholar] [CrossRef]
- Raimondi, A.; Becciu, G. On the efficiency of stormwater detention tanks in pollutant removal. Int. J. Sustain. Dev. Plan. 2017, 12, 144–154. [Google Scholar] [CrossRef] [Green Version]
- Becciu, G.; Paoletti, A. Random characteristics of runoff coefficient in urban catchments. Water Sci. Technol. 1997, 36, 39–44. [Google Scholar] [CrossRef]
- United States Environmental Protection Agency (US-EPA). Methodology for Analysis of Detention Basins for Control of Urban Runoff Quality; U.S. Environmental Protection Agency Office of Water, Nonpoint Source Branch: Washington, DC, USA, 1986; p. 51. [Google Scholar]
- Adams, B.J.; Fraser, H.G.; Howard, C.D.; Sami Hanafy, M. Meteorological data analysis for drainage system design. J. Environ. Eng. 1986, 112, 827–848. [Google Scholar] [CrossRef]
- Eagleson, P.S. Climate, soil, and vegetation: 2. The distribution of annual precipitation derived from observed storm sequences. Water Resour. Res. 1978, 14, 713–721. [Google Scholar] [CrossRef] [Green Version]
- Bedient, P.B.; Huber, W.C.; Vieux, B.E. Hydrology and Floodplain Analysis; Pearson: New York, NY, USA, 2008. [Google Scholar]
- Bacchi, B.; Balistrocchi, M.; Grossi, G. Proposal of a semi-probabilistic approach for storage facility design. Urban Water J. 2008, 5, 195–208. [Google Scholar] [CrossRef]
- Monitoring of eight green roofs in Milano. Hygrothermal performance and microclimate mitigation potential. Available online: https://re.public.polimi.it/handle/11311/758488#.X_gvUxapTIU (accessed on 7 January 2021).
- Palermo, S.A.; Turco, M.; Principato, S.; Piro, P. Hydrological effectiveness of an extensive green roof in Mediterranean climate. Water 2019, 11, 1378. [Google Scholar] [CrossRef] [Green Version]
- Brunetti, G.; Šimůnek, J.; Piro, P. A Comprehensive Analysis of the Variably Saturated 461 Hydraulic Behavior of a Green Roof in a Mediterranean Climate. Vadose Zone J. 2016, 15, 1146–1151. [Google Scholar] [CrossRef] [Green Version]
- Wolf, D.; Lundholm, J.T. Water uptake in green roof microcosms: Effects of plant species and water availability. Ecol. Eng. 2008, 33, 179–186. [Google Scholar] [CrossRef]
- Kaiser, D.; Kohler, M.; Schmidt, M.; Wolff, F. Increasing Evapotranspiration on Extensive Green Roofs by Changing Substrate Depths, Construction, and Additional Irrigation. Buildings 2019, 9, 173. [Google Scholar] [CrossRef] [Green Version]
- Lamera, C.; Becciu, G.; Rulli, M.C.; Rosso, R. Green roofs effects on the urban water cycle components. Procedia Eng. 2014, 70, 988–997. [Google Scholar] [CrossRef] [Green Version]
- Van Genuchten, M.T. A closed-form equation for predicting the hydraulic conductivity of unsaturated soils. Soil Sci. Soc. Am. J. 1980, 44, 892–898. [Google Scholar] [CrossRef] [Green Version]
- Abdollahi, S.; Akhoond-Ali, A.M.; Mirabbasi, R.; Adamowski, J.F. Probabilistic Event Based Rainfall-Runoff Modeling Using Copula Functions. Water Resour. Manag. 2019, 33, 3799–3814. [Google Scholar] [CrossRef]
Figure 1.
Conceptual scheme considered for the modeling of green roofs. h: rainfall depth; ET: evapotranspiration volume; v: runoff volume; zg: growing medium thickness; zd: drainage layer thickness; z0: overflow height.
Figure 1.
Conceptual scheme considered for the modeling of green roofs. h: rainfall depth; ET: evapotranspiration volume; v: runoff volume; zg: growing medium thickness; zd: drainage layer thickness; z0: overflow height.

Figure 2.
Comparison between probability (P) and frequency (F) distribution function of water content into growing medium varying its thickness (zg), GREEN ROOF 1.
Figure 2.
Comparison between probability (P) and frequency (F) distribution function of water content into growing medium varying its thickness (zg), GREEN ROOF 1.

Figure 3.
Comparison between probability (P) and frequency (F) distribution function of water content into growing medium varying its thickness (zg), GREEN ROOF 2.
Figure 3.
Comparison between probability (P) and frequency (F) distribution function of water content into growing medium varying its thickness (zg), GREEN ROOF 2.

Figure 4.
Probability (P) and frequency (F) distribution function of water content into growing medium varying its thickness (zg) during the whole year and summer, GREEN ROOF 1.
Figure 4.
Probability (P) and frequency (F) distribution function of water content into growing medium varying its thickness (zg) during the whole year and summer, GREEN ROOF 1.

Figure 5.
Probability (P) and frequency (F) distribution function of water content into growing medium varying its thickness (zg) during the whole year and summer, GREEN ROOF 2.
Figure 5.
Probability (P) and frequency (F) distribution function of water content into growing medium varying its thickness (zg) during the whole year and summer, GREEN ROOF 2.


Table 1.
Average values of rainfall variables.
| μ | GREEN ROOF 1 | GREEN ROOF 2 |
|---|---|---|
| h (mm) | 17.97 | 20.26 |
| θ (hour) | 11.67 | 11.59 |
| d (hour) | 150.70 | 127.72 |
Table 2.
Coefficient of variation of rainfall variables.
| V | GREEN ROOF 1 | GREEN ROOF 2 |
|---|---|---|
| h (-) | 1.16 | 1.17 |
| θ (-) | 1.04 | 1.04 |
| d (-) | 1.42 | 1.31 |
Table 3.
Correlation indexes among rainfall variables.
| GREEN ROOF 1 | GREEN ROOF 2 | |
|---|---|---|
| ρh,d (-) | 0.10 | −0.02 |
| ρθ,h (-) | 0.69 | 0.88 |
| ρd,θ (-) | 0.10 | −0.10 |
Table 4.
Analysis results on the whole period of records, GREEN ROOF 1.
| zg (mm) | 50 | 65 | 80 | 95 | 110 | 125 | 140 | 155 | 170 | 185 | 200 |
| P (-) | 0.81 | 0.85 | 0.86 | 0.87 | 0.88 | 0.90 | 0.91 | 0.93 | 0.94 | 0.96 | 0.97 |
| ARI (years) | 5 | 7 | 7 | 8 | 9 | 10 | 11 | 14 | 18 | 24 | 37 |
Table 5.
Analysis results on the whole period of records, GREEN ROOF 2.
| zg (mm) | 50 | 65 | 80 | 95 | 110 | 125 | 140 | 155 | 170 | 185 | 200 |
| P (-) | 0.74 | 0.77 | 0.78 | 0.80 | 0.81 | 0.83 | 0.85 | 0.87 | 0.88 | 0.90 | 0.91 |
| ARI (years) | 4 | 4 | 5 | 5 | 5 | 6 | 7 | 7 | 8 | 10 | 11 |
Table 6.
Average values of rainfall variables in summer.
| μ | GREEN ROOF 1 | GREEN ROOF 2 |
|---|---|---|
| h (mm) | 17.19 | 13.96 |
| θ (hour) | 5.42 | 7.66 |
| d (hour) | 175.02 | 206.18 |
Table 7.
Coefficient of variation of rainfall variable in summer.
| V | GREEN ROOF 1 | GREEN ROOF 2 |
|---|---|---|
| h (-) | 1.13 | 0.90 |
| θ (-) | 1.32 | 0.95 |
| d (-) | 1.18 | 0.60 |
Table 8.
Correlation indexes among rainfall variables in summer.
| GREEN ROOF 1 | GREEN ROOF 2 | |
|---|---|---|
| ρh,d (-) | 0.05 | −0.49 |
| ρθ,h (-) | 0.56 | 0.71 |
| ρd,θ (-) | 0.02 | −0.49 |
Table 9.
Analysis results in summer, GREEN ROOF 1.
| zg (mm) | 50 | 65 | 80 | 95 | 110 | 125 | 140 | 155 | 170 | 185 | 200 |
| P (-) | 0.54 | 0.61 | 0.65 | 0.68 | 0.69 | 0.71 | 0.72 | 0.73 | 0.75 | 0.76 | 0.77 |
| ARI (years) | 2 | 3 | 3 | 3 | 3 | 3 | 4 | 4 | 4 | 4 | 4 |
Table 10.
Analysis results in summer, GREEN ROOF 2.
| zg (mm) | 50 | 65 | 80 | 95 | 110 | 125 | 140 | 155 | 170 | 185 | 200 |
| P (-) | 0.08 | 0.08 | 0.08 | 0.09 | 0.09 | 0.09 | 0.09 | 0.09 | 0.09 | 0.10 | 0.10 |
| ARI (years) | 1 | 1 | 1 | 1 | 1 | 1 | 1 | 1 | 1 | 1 | 1 |
Publisher’s Note: MDPI stays neutral with regard to jurisdictional claims in published maps and institutional affiliations. |
© 2021 by the authors. Licensee MDPI, Basel, Switzerland. This article is an open access article distributed under the terms and conditions of the Creative Commons Attribution (CC BY) license (http://creativecommons.org/licenses/by/4.0/).
Share and Cite
MDPI and ACS Style
Raimondi, A.; Marchioni, M.; Sanfilippo, U.; Becciu, G. Vegetation Survival in Green Roofs without Irrigation. Water 2021, 13, 136. https://doi.org/10.3390/w13020136
AMA Style
Raimondi A, Marchioni M, Sanfilippo U, Becciu G. Vegetation Survival in Green Roofs without Irrigation. Water. 2021; 13(2):136. https://doi.org/10.3390/w13020136
Chicago/Turabian StyleRaimondi, Anita, Mariana Marchioni, Umberto Sanfilippo, and Gianfranco Becciu. 2021. "Vegetation Survival in Green Roofs without Irrigation" Water 13, no. 2: 136. https://doi.org/10.3390/w13020136
Note that from the first issue of 2016, this journal uses article numbers instead of page numbers. See further details here.