On the Rainfall Triggering of Phlegraean Fields Volcanic Tremors


Department of Earth Sciences, Environment and Georesources, University of Naples Federico II, Complesso Universitario di Monte S. Angelo, via Cinthia, 21, 80126 Naples, Italy
*
Author to whom correspondence should be addressed.
†
Retired.
Water 2021, 13(2), 154; https://doi.org/10.3390/w13020154
Submission received: 7 December 2020
/
Revised: 6 January 2021
/
Accepted: 7 January 2021
/
Published: 11 January 2021
(This article belongs to the Section Hydraulics and Hydrodynamics)
Abstract
:We study whether the shallow volcanic seismic tremors related to the bradyseism observed at the Phlegraean Fields (Campi Flegrei, Pozzuoli, and Naples) from 2008 to 2020 by the Osservatorio Vesuviano could be partially triggered by local rainfall events. We use the daily rainfall record measured at the nearby Meteorological Observatory of San Marcellino in Naples and develop two empirical models to simulate the local seismicity starting from the hypothesized rainfall-water effect under different scenarios. We found statistically significant correlations between the volcanic tremors at the Phlegraean Fields and our rainfall model during years of low bradyseism. More specifically, we observe that large amounts and continuous periods of rainfall could trigger, from a few days to 1 or 2 weeks, seismic swarms with magnitudes up to M = 3. The results indicate that, on long timescales, the seismicity at the Phlegraean Fields is very sensitive to the endogenous pressure from the deep magmatic system causing the bradyseism, but meteoric water infiltration could play an important triggering effect on short timescales of days or weeks. Rainfall water likely penetrates deeply into the highly fractured and hot shallow-water-saturated subsurface that characterizes the region, reduces the strength and stiffness of the soil and, finally, boils when it mixes with the hot hydrothermal magmatic fluids migrating upward. The structural collapse of the saturated fractured soil and the mixing of the meteoric fluid with the hot deep fluids triggers the local seismic activity.
1. Introduction
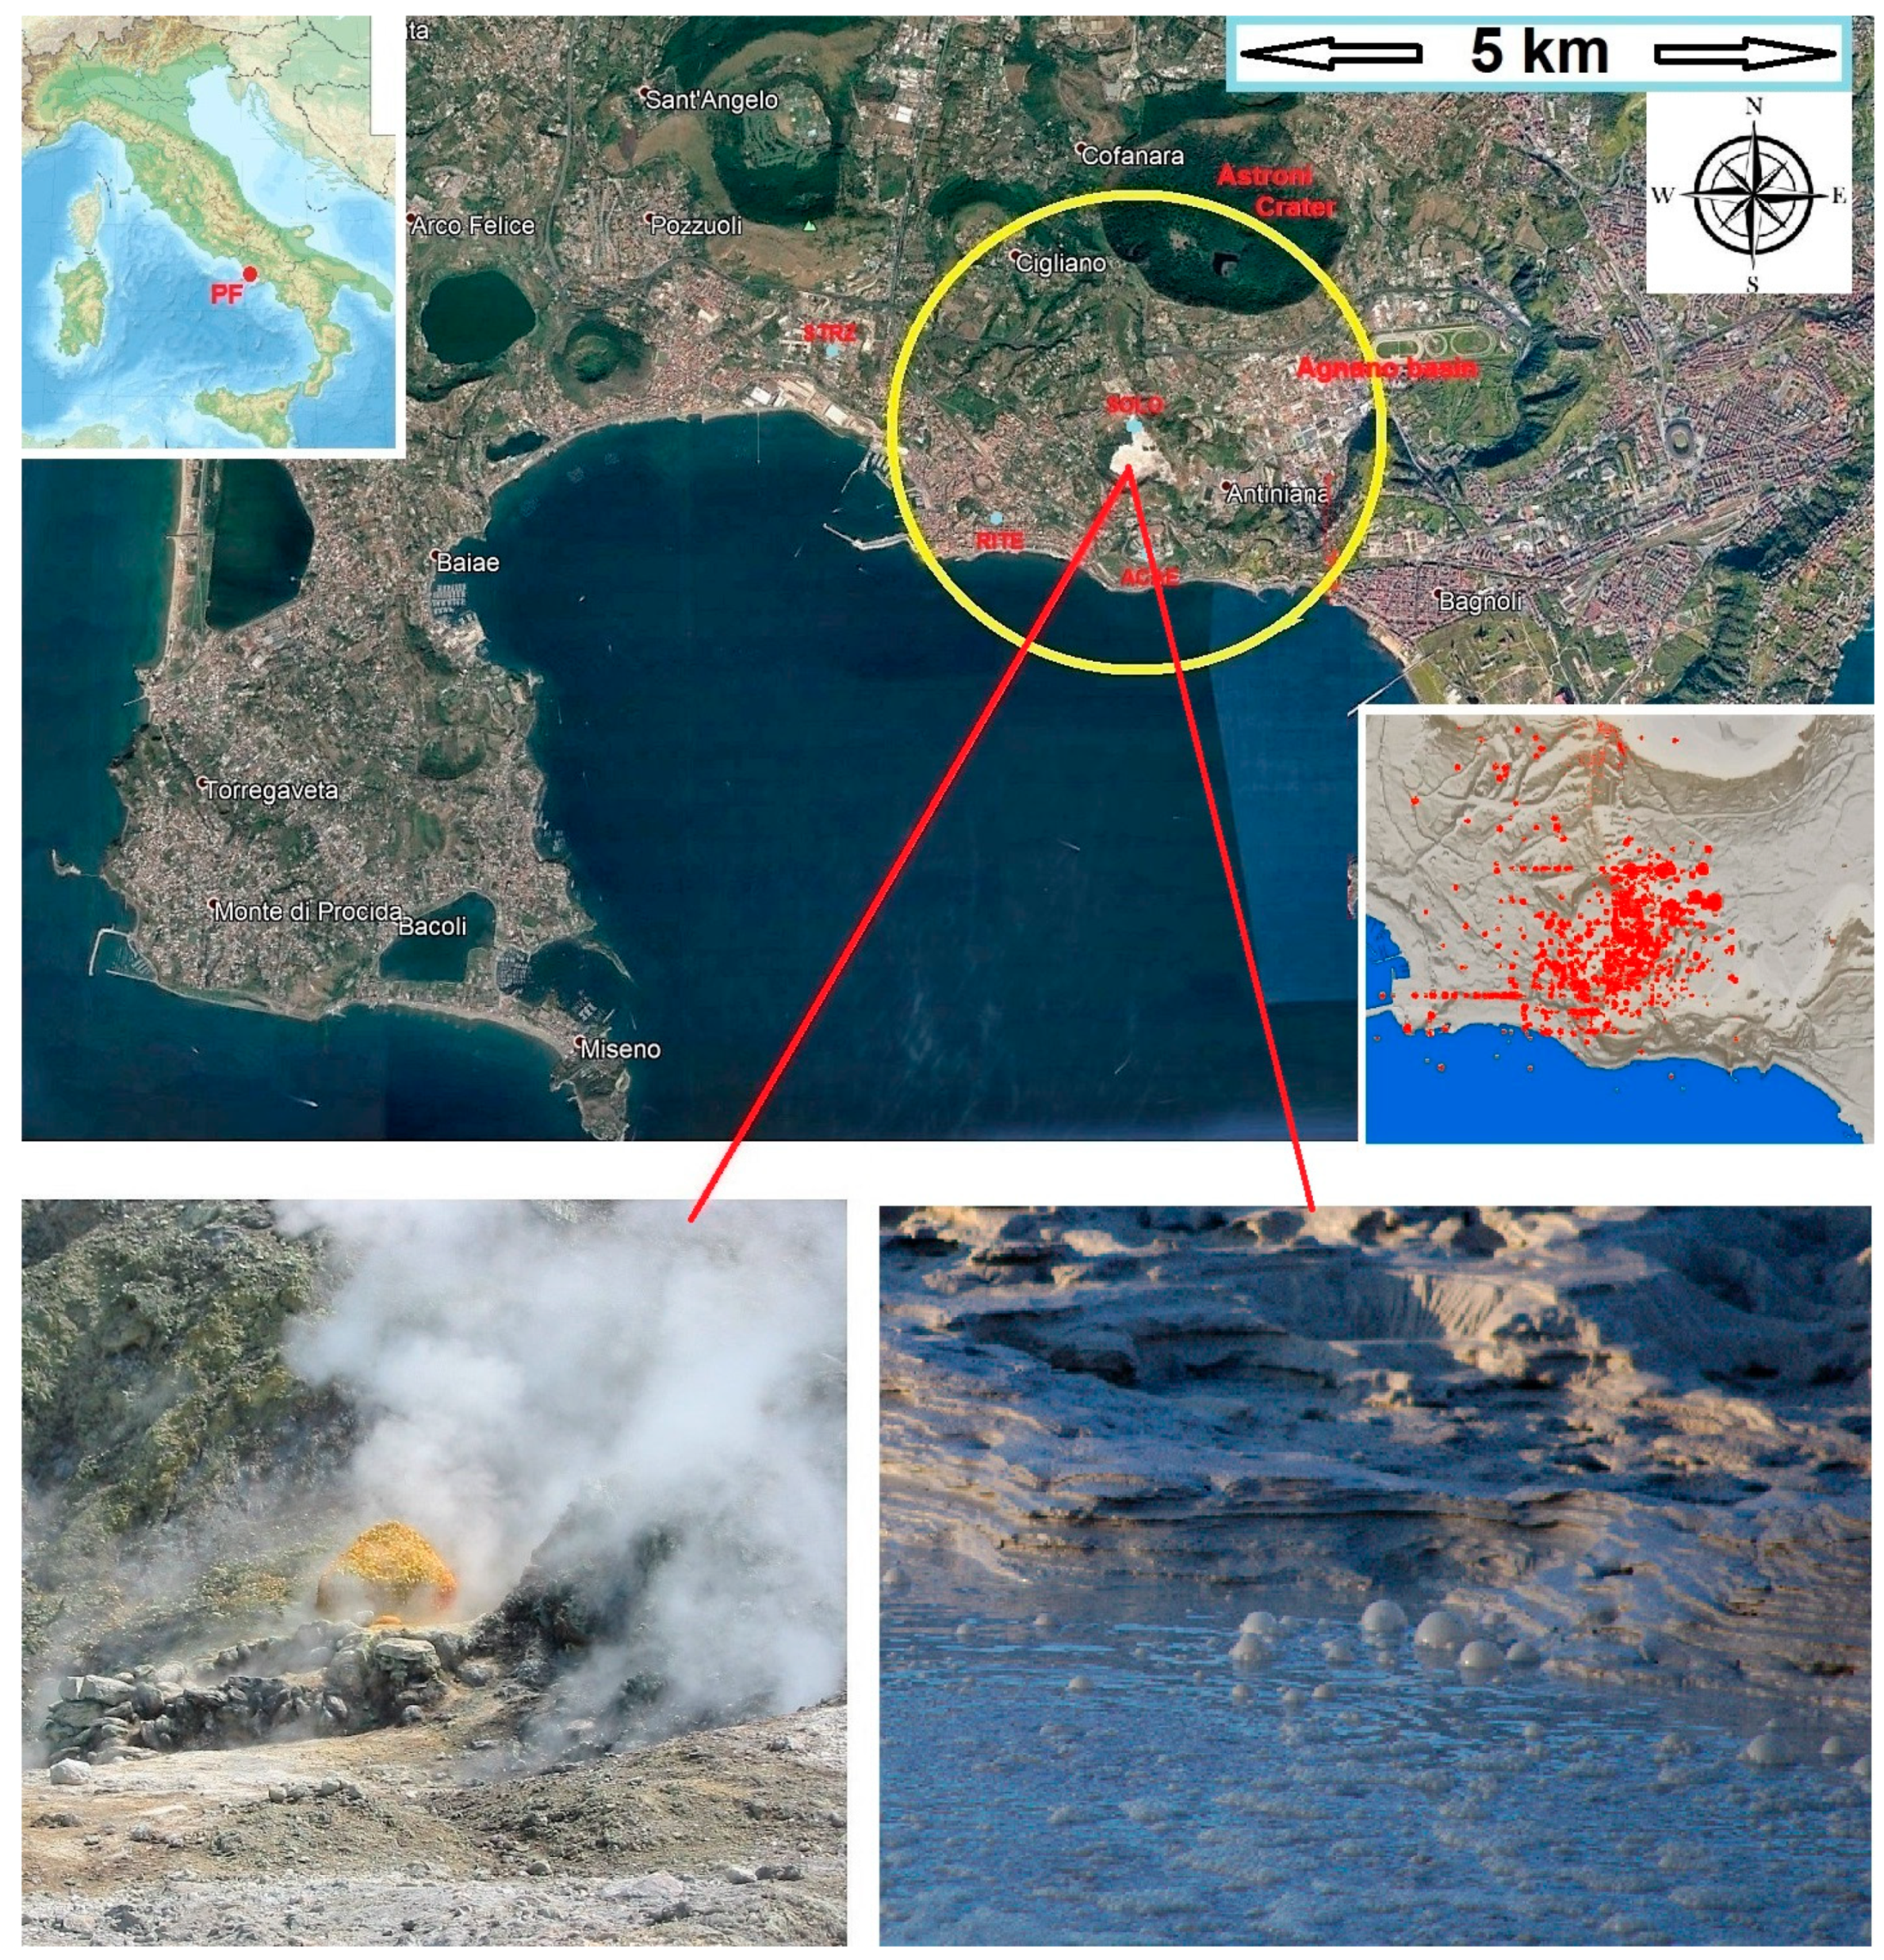
The active volcanic area including the Phlegraean Fields (Campi Flegrei) and the Somma-Vesuvius complex in the province of Naples (Italy) is exposed to serious seismic hazards due to its high-density population of about 4 million people [1,2,3]. For this reason, the volcanism in Campania has been extensively studied since Roman times. In this work, we evaluate whether a link exists between meteorological rainfall events and the seismic tremors occurring in the Phlegraean Fields. This area includes the municipality of Pozzuoli, Bacoli, Monte di Procida, the Phlegraean islands (Ischia, Procida, Vivara), and Pisciarelli-Agnano (Figure 1).
Rainfall events and atmospheric pressure variations have been often claimed to influence seismic and volcanic activity [4,5,6,7,8,9,10,11,12,13,14,15]. For example, the 1924 explosions from Halemaʻumaʻu crater located in Hawaii Volcanoes National Park, and many that occurred between about 1500 and 1790, resulted from interactions between magma or lava with ground- or lake-water [16]. Seismicity and ground deformation of Nevado del Ruiz Volcano (Colombia) are also correlated with weekly rainfall [17]. Other studies correlated rainfall and volcanic and seismic phenomena in Montserrat [10,11,12,18]. Similarly, at Guaga Pichinga (Equador) [19] and Mount Etna (Sicily, Italy) [20], deadly volcanic explosions were associated with rainfalls although the volcanologists did not have enough information to fully document it. Extreme rainfall triggered the 2018 rift eruption at Kīlauea Volcano [15]. Similarly, seismic tremors recorded at Mount Vesuvius present a daily cycle even after the cultural noise is filtered out, which suggests that such tremors are linked with meteorological and geomagnetic activity [21,22].
The seismicity of the Phlegraean Fields has been related to its bradyseism since ancient times [2,23]. Bradyseism is the gradual uplift or descent of a terrain area induced by the filling or emptying of an underground magma chamber and/or by hydrothermal activity. This phenomenon happens particularly in some volcanic calderas such as the Phlegraean Fields and Yellowstone in the USA.
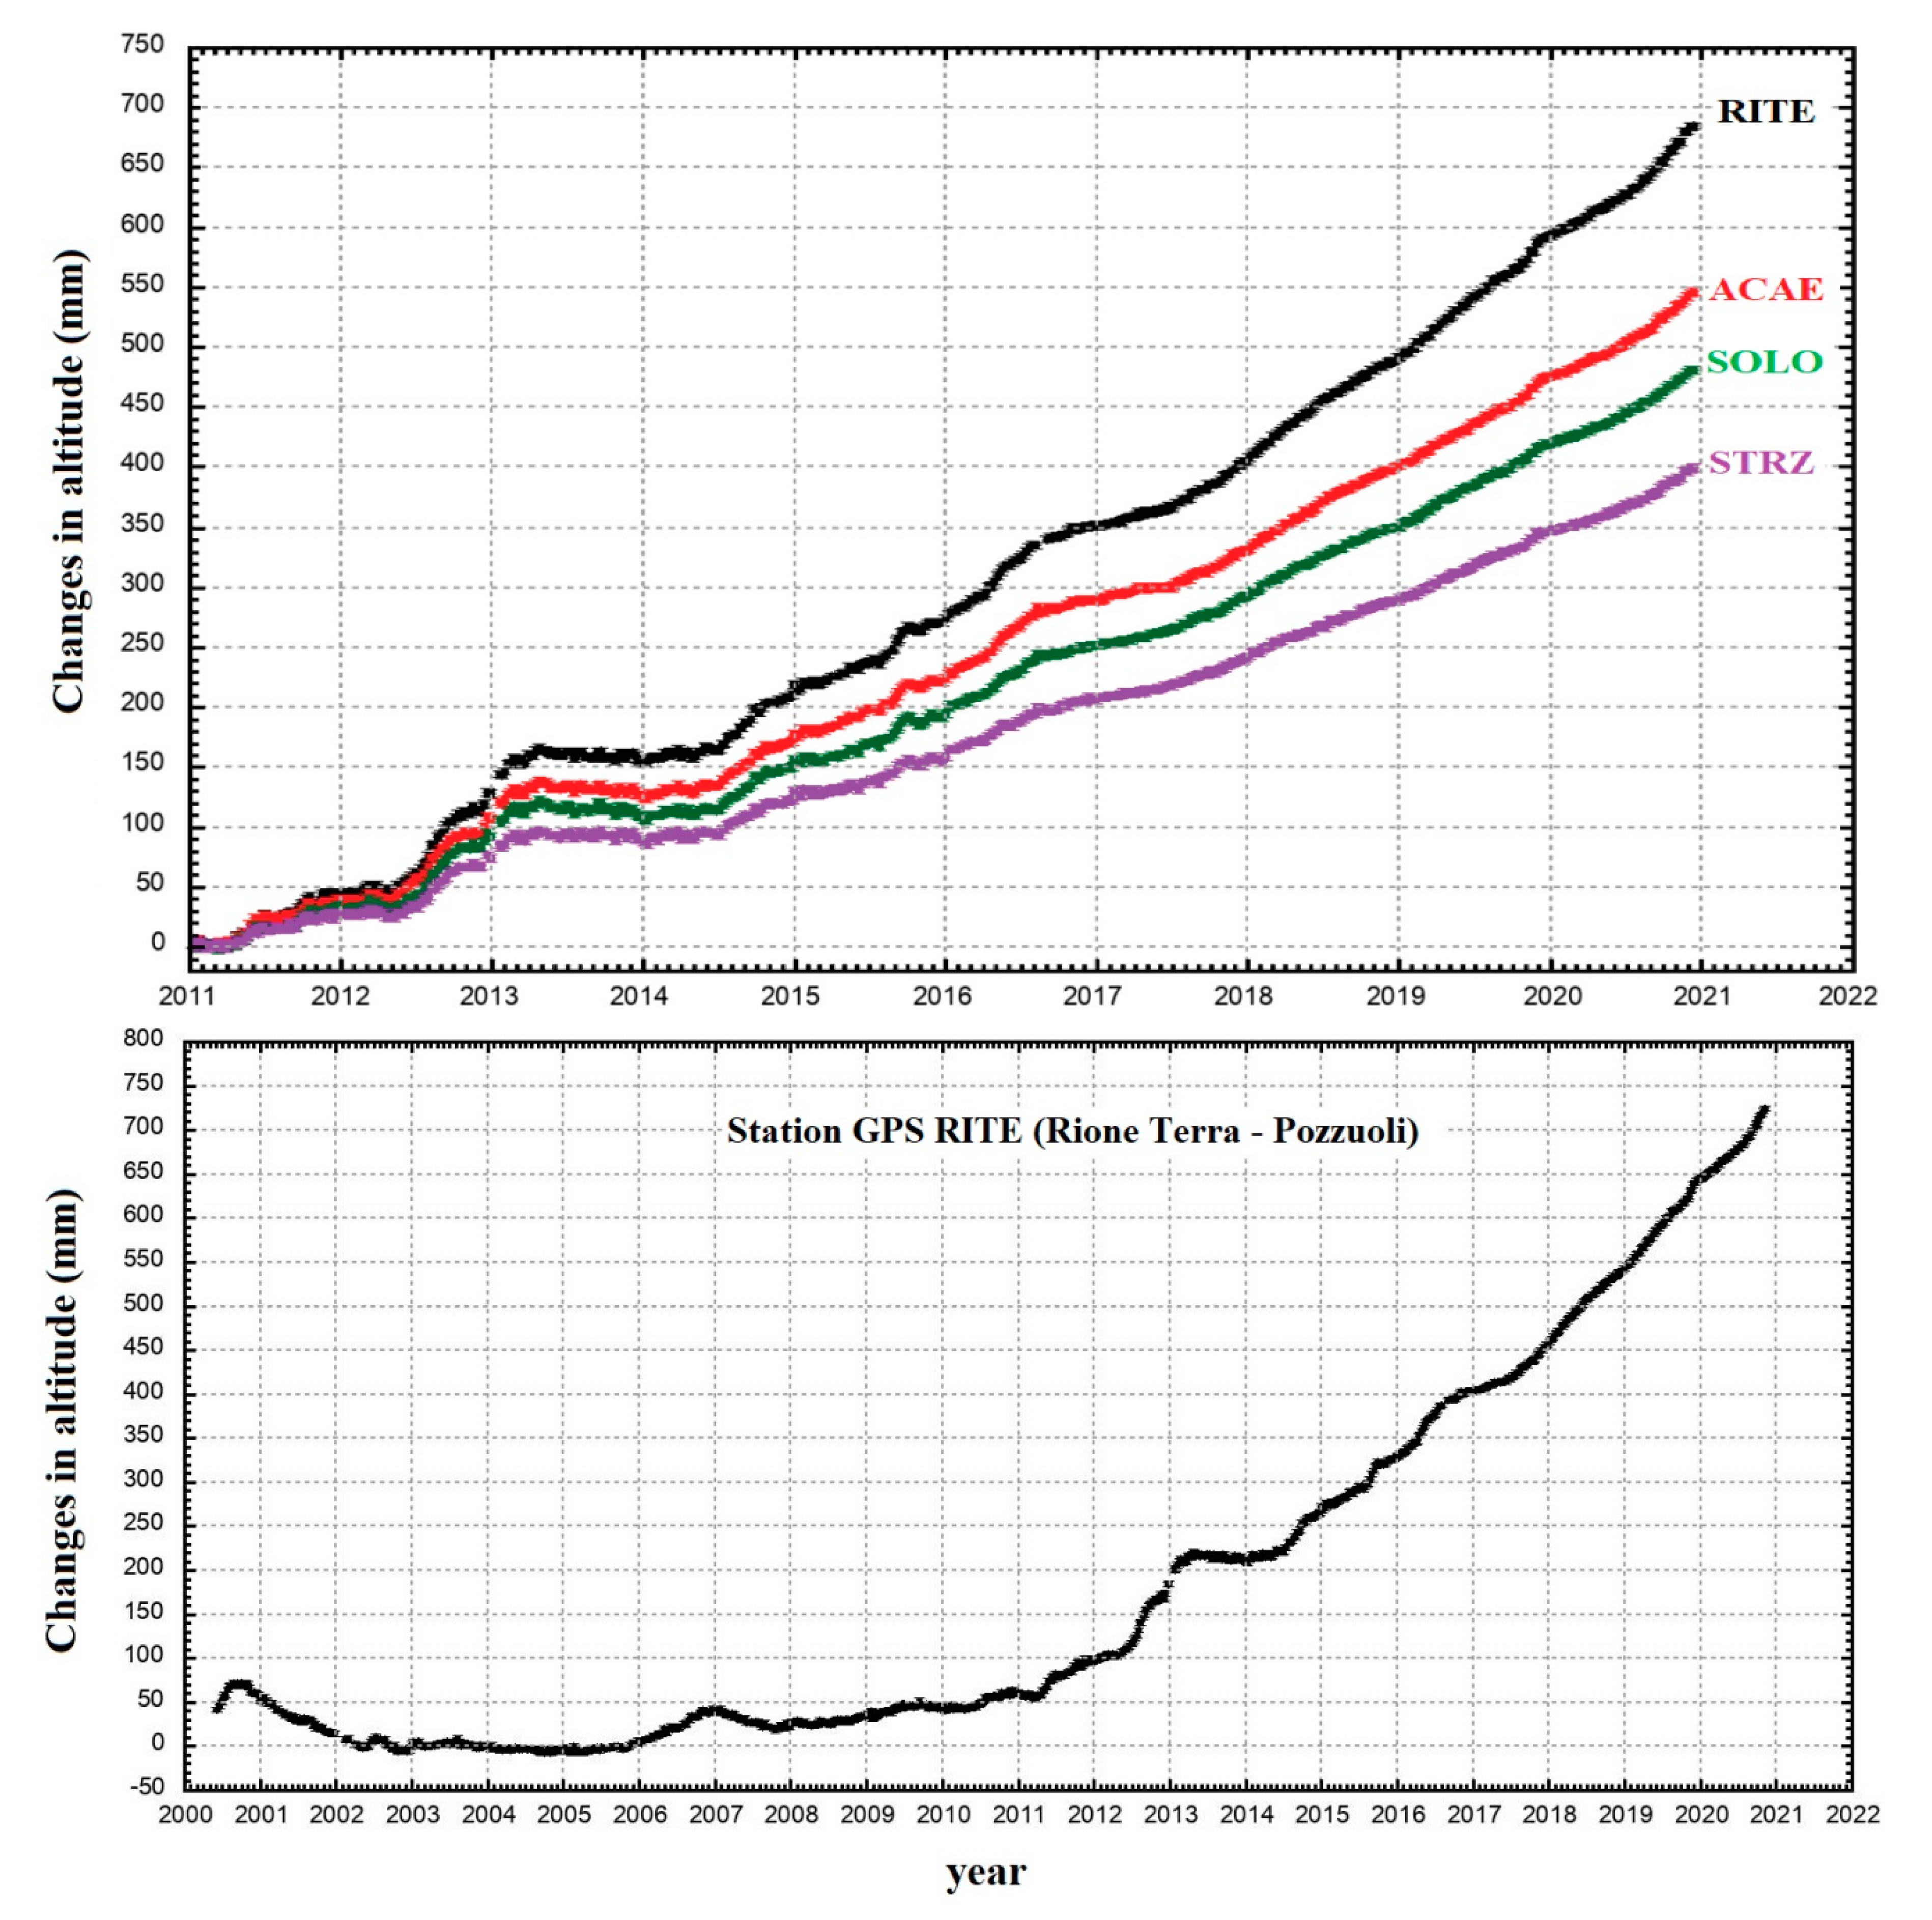
In the recent past, this includes the strong uplifting of some regions of the Phlegraean Fields up to 150–170 cm that occurred in 1970–1972 and of 180 cm that occurred in 1982–1984. Figure A1 in the appendix shows time-series of changes in altitude from 2000 to 2020 of four different stations placed at Pozzuoli-Rione Terra (RITE), Accademia Aeronautica (ACAE), Solfatara (SOLO), and Pozzuoli-Cemetery (STRZ) (adapted from the Instituto Nazionale di Geofisica e Volcanologia—Osservatorio Vesuviano, INGV-OV). At RITE, the soil was lifted by about 650 mm from 2008 to 2020. From 2008 to 2020, more than 3200 seismic tremors occurred. As discussed later, the number of seismic tremors of the region has increased during years of fast soil uplift.
Modeling suggests that the magmatic-hydrothermal system of the area becomes particularly unstable and produces seismic and bradyseism activity when the impermeable crystalline layer surrounding the magmatic system (6 km depth) fractures [24,25,26]. These fractures facilitate the migration of the deep hot fluids of magmatic origin toward the transition zone between the lithostatic and hydrostatic domain.
The deep fluids push from below the impermeable layer located at about 2.5 km of depth and can cause the lifting of the surface and, therefore, a bradyseism crisis. Subsidence would begin when the upper impermeable layer seriously fractures and the deep hot fluids migrate toward the surface and eventually cool down by mixing with the meteoric and marine waters that feed the near-surface hydrothermal system. This is when most of the near-surface tremors would occur, triggered by the underwater boiling.
The first phase refers to the evolution of the status of the deep magma and has a time-period of tens to thousands of years. The second transitory phase is made of cyclical events of uplifting and subsidence of the soil and has a timescale from a year to a few decades.
On shorter timescales (e.g., days to weeks), we suggest that the fracturing of the soil of the area facilitates the infiltration of the meteoric and marine waters toward the deeper hot zones. By mixing with deeper hot fluids and rocks, the input of meteoric water could further destabilize the soil and trigger tremors at a depth of about 0–2.5 km [27,28].
The Phlegraean Fields also experience enhanced rainfalls relative to the surrounding areas, which can also trigger flashfloods [29]. Moreover, the region is characterized by several basins (e.g., Astroni crater) that collect large amounts of meteoric water that can easily penetrate the subsurface. Herein, we develop a statistical model based on the local rainfall record to test whether a link between rainfalls and seismic activity could be physical.
Understanding the triggering phenomenology of the local seismic activity is also socially important because, over the past decades, local inhabitants have been alarmed by the erratic and increasing seismic activity of the area and fear the risk that drilling for geothermal purposes, which is rarely allowed by the authorities, could trigger phreatic explosions, gas emissions, and other harmful phenomena. These events could even culminate with the opening of volcanic fumaroles within the urban areas and seismically destabilize an already highly critical region as extensively reported in the latest book on the topic by De Vivo et al. [2].
2. Data
We analyze and compare the following data.
(A): The catalog of earthquake events that occurred at the Phlegraean Fields from 2008 to 2019 available from http://www.ov.ingv.it/ov/doc/ct_FLE_2007_12_dic_2019.txt. The record was updated using the data from January to December 2020, available from the main website of the observatory (http://www.ov.ingv.it/ov/it/campi-flegrei.html, accessed on 1 January 2021). The catalog contains several uncertain events whose magnitude was not recorded (indicated as NaN). In the following analysis, these uncertain events were not considered.
(B): The daily catalog of rainfall measured at the first-class Meteorological Observatory of San Marcellino of the University of Naples Federico II, located in the historical center of Naples. This record is representative also of the daily scale of the rainfall measured at Solfatara-Pisciarelli site because the two sites are about 10 km from each other. In Appendix B, we show that similar rain events occur simultaneously in the two locations, although at the Solfatara, on average, it rains 40% more than in Naples because of the specific orography of the place [29]. The data are available from http://www.meteo.unina.it/davis/reports-mensili-e-annuali, accessed on 1 January 2021.
As discussed below in more detail, the yearly number of days with earthquakes greatly increased from 8 in 2008 to 209 in 2020. The total number of seismic events also greatly increased from 53 events in 2008 to 766 events in 2020. The magnitude of the seismic events at the Phlegraean Fields varied from M = −1.6 to M = 3.3. There were only two events with M > 3: one occurred on 6 December 2019 (M = 3.1), and the other occurred on 26 April 2020 (M = 3.3). This area is characterized by a typical Mediterranean climate that has relatively dry summer months and wet autumns, winters, and springs. The daily rainfall varied up to 70 mm in Naples.
3. Methods
The hypothesis to be tested is whether rainfalls could trigger seismic activity at the Phlegraean Fields with a delay up to a few days or weeks depending on the rainfall amount, as observed in similar cases in other regions [13].
To do this, we develop an empirical model inspired by Darcy’s law [32,33], which describes the volumetric water flow dependency on the pressure difference between the two sides of a soil sample. The proposed model has to simulate a plausible time evolution of the wet-state of the soil as a function of the timing and amount of the rainfall events. We need a time-delayed function that varies with the rainfall amount that can be directly compared against the seismic record. In fact, rainfall water needs some time to percolate inside the soil and reach critical saturated regions where a seismic tremor could occur and, obviously, if the rainfall amount is larger, the effect could last longer. A function with such properties can be obtained in the following way.
If ti (i = 1, 2, 3, … N) is the timing of consecutive rainy days, and RA(ti) is the rainfall amount occurring in the day ti, we propose a time-delayed model, F(t), defined by the following equations:
where N is the number of rainfall days, and Fi(t, ti) gives the contribution of the single rain event that occurred at time ti. The parameter τ is a characteristic timescale describing, for example, the water percolation in the soil. The effect is supposed to weaken exponentially following Darcy’s law [32,33], which states that the volumetric flow depends on the pressure difference between the two sides of a sample. The variant proposed in Equation (2) describes how water flows vertically through saturated soil by gravity.
In our case, the pressure difference between two levels is altered by the addition of meteoric water on the top side, that is, at the surface. If h(t) is the amount of the meteoric water at the surface at a given time t, it induces an additional pressure equal to Stevino’s law p(t) = ρgh(t) above the stationary condition, where ρ is the water density and g is the constant of gravity. As this water penetrates the ground, the pressure at the surface diminishes at a rate that is proportional to the top pressure itself, that is, as h(t) = −τ dh(t)/dt, where τ is the characteristic time of the process.
If, at time t0, a given amount of meteoric water h(t0) is added to the surface, the solution of the above differential equation is h(t) = h(t0) exp(−(t − t0)/τ), which is like Equation (2). For large t, h(t) tends towards 0, which indicates that all meteoric water added to the system at time t0 has been absorbed by the soil. Then, the system returns to its stationary state unless it is again perturbed by additional meteoric water. This cumulative process is related to all rainfall events and is indicated by Equation (3), which is herein defined in the units of the rainfall amount (mm) in Naples.
In Darcy’s law, the characteristic time τ is given by L/K, where L is the specimen length, which is the depth of the soil, and K is the hydraulic conductivity of the soil, which is the speed of the water in the ground. We also have K = krg/m, where m is the water viscosity and k is the permeability of the soil.
A threshold R can be chosen such that, only when F(t) > R, the meteoric perturbation could affect the seismic activity. Thus, we define wet days as those for which F(t) > R and dry days as all the others. With this threshold, Equation (2) means that the larger the rainfall amount RA(ti) on a given day ti, the longer its ability to trigger tremors lasts.
In the following, we evaluate the statistics of having seismic tremors on wet days or on dry days to determine whether the wet days are more likely to experience seismic activity than the dry days.
The values assigned to R and τ are heuristically chosen because our purpose is to determine whether there exists a rainfall model of the type given by Equations (1)–(3) that correlates rainfall events with the seismic events with a delay from a few days to a few weeks.
By assuming a specimen length of L = 1000 m (which is about the mean depth where the seismic tremors occur at the Phlegraean Fields) and τ = 1 day, the hydraulic conductivity of the soil is K = L/τ = 1.2 cm/s. Such a value of K corresponds to soils made of karst limestones, highly fractured rocks, sand, and/or gravel [34]. Indeed, for the first 2.7 km depth, the Phlegraean Fields are characterized by such a kind of soil [35].
In general, meteoric water can percolate down quite fast through fractured soil [36] and can rapidly affect an already water-saturated and critically unstable underground. With a value of τ equal to about 1 or 2 days, the required time-delayed effect from a few days to 1 or 2 weeks can be modeled with R values around 0.1 or 0.2 mm, which usually correspond to the pluviometry sensitivity. Note that 0.1 mm corresponds to 0.1 kg of rainfall water on a square meter. Thus, these thresholds are heuristically determined.
We run several simulations using different values of R and τ near the values estimated above. In the following, we show our results for four scenarios:
- (1)
- R = 0.2 mm and τ = 1 day;
- (2)
- R = 0.1 mm and τ = 1 day;
- (3)
- R = 0.2 mm and τ = 2 day;
- (4)
- R = 0.1 mm and τ = 2 day.
From scenarios #1 to #4, the model allows the rainfall water to have more and more time (from a few days to 1–2 weeks) to affect the seismic activity in the area. For each scenario and each year from 2008 to 2020, we evaluate the following observables:
- the number of days for each year (DY);
- the number of wet days (WD) as defined by Equation (3) with the threshold R;
- the number of days when earthquakes occur (DE);
- the number of wet days when earthquakes occur (WDE);
- the total number of earthquakes (E);
- the total number of earthquakes that occur during wet days (EWD).
Finally, for each year and scenario, we evaluate the relative statistics made of the following measures:
- the probability of having random earthquakes with no relation with wet days (Rand = WD divided by DY), which is our null hypothesis to be tested;
- the measured probability of having a seismic day during a wet day (WEQD = WDE divided by DE);
- the measured probability of having an earthquake during a wet day (WEQ = EWD divided by E).
The last step of our statistical analysis evaluates whether the measured probabilities differ significantly from the random hypothesis. To do this, we obtained the following exact probability equations derived from an extension of the binomial distribution and considering all possible combinations:
where α = 0.5 for i = n1, and α = 1 for i > n1. The meaning of the two equations is the following.
Equation (4) calculates the probability P1 of obtaining a number of wet days with earthquakes larger than measured n1, assuming a random distribution of days with seismic activity. Here, n is the number of days with earthquakes, n1 is the number of wet days with earthquakes, d is the total number of days (e.g., 365 or 366 for one year), and d1 is the number of wet days in the same period (e.g., 1 year). The equation assumes that if (d1 − i) < 0, then 1/(d1 − i)! = 0 because x! = Γ(x + 1) and, for negative integers, the gamma function diverges to infinity. In particular, in the extreme cases in which, for example, our proposed model (Equation (3)) would cover the entire year with wet days or, alternatively, earthquakes occur all days of the year, the probabilities P1 and P2 give values equal to 0.5, which means that no relation could be established between rainfalls and seismic activity.
Equation (5) calculates the probability P2 of obtaining a number of earthquakes in wet days larger than measured (n1) assuming a random distribution of seismic events. This equation assumes that more than one seismic event could occur on the same day. Here n is the number of earthquakes, n1 is the number of earthquakes that occur on wet days, d is the total number of days, and d1 is the number of wet days.
We compare these two statistical tests because the seismic data tend to form swarms and clusters where single events may not be physically independent of each other. The comparison between the two tests is necessary to establish whether and how meteoric water affects the seismic properties of the soil on these short timescales. The statistical test is repeated for each scenario and for each year from 2008 to 2020 to get an ensemble of independent results that are then statistically evaluated.
The above procedure is needed for correctly interpreting the test based on P2 (Equation (5)). In fact, even one large seismic swarm, which can occur on a wet day or a dry day, could bias the statistics in one way or the other. Thus, finding an extreme value regarding P2 (e.g., P2 < 0.05 or P2 > 0.95) by using only a single record means that in such a period, an excess of events occurred during wet or dry days, respectively. However, because of the clustering nature of the phenomenon, the finding could have been occasional. Thus, running a single test would be inconclusive.
However, by using an ensemble of independent tests using one-year sub-periods from 2008 to 2020, we obtain 13 full and independent 1-year segments that can be statistically tested. For example, if the same result (for example, P2 < 0.05, which implies that meteoric water could enhance the seismic activity of the area) is found for a significantly large majority of the analyzed years, the working hypothesis cannot be rejected.
4. Results
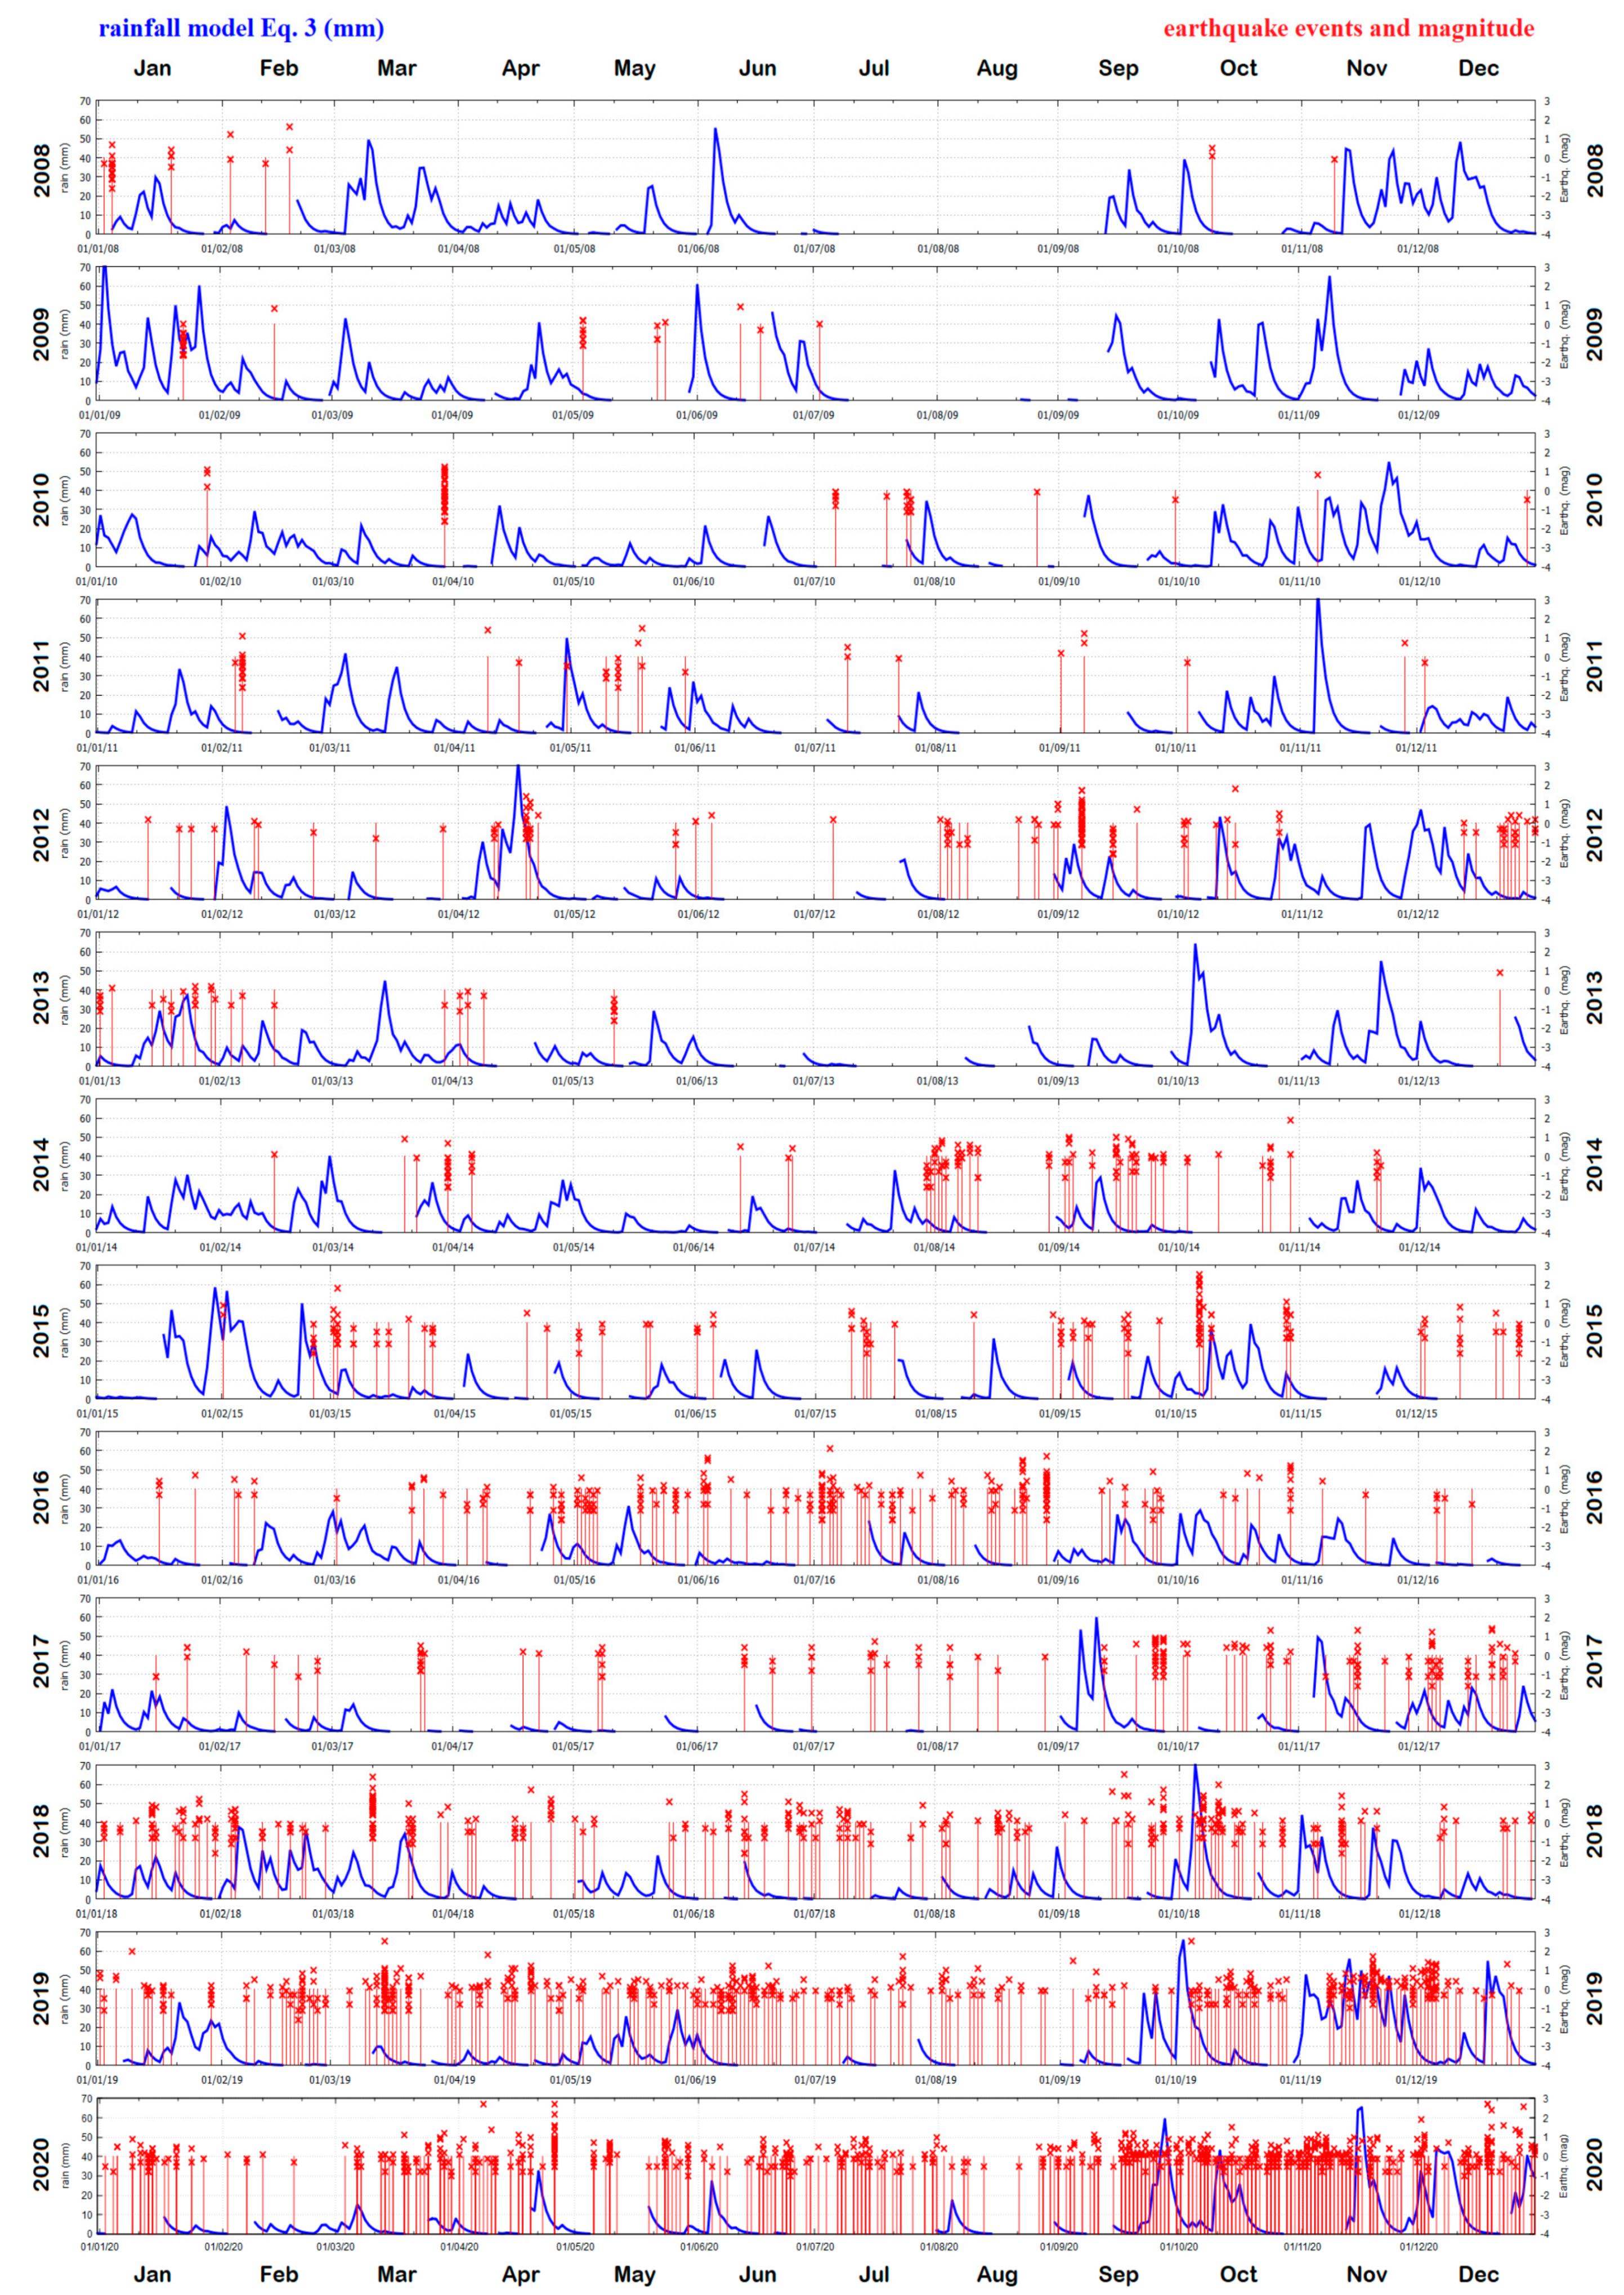
The statistics referring to scenarios #1, #2, #3, and #4 are reported in Table 1, Table 2, Table 3 and Table 4, which summarize the graphs depicted in Figure 2, Figure 3, Figure 4 and Figure 5 for each year from 2008 to 2020. These figures show the timing of the earthquake events with their relative magnitude against the four rainfall models given by Equation (3) according to the four scenarios. The final results regarding the distributions of the probabilities P1 and P2 reported in the four tables are finally collected in Figure 6.
Table 1, Table 2, Table 3 and Table 4 report the statistics associated with each year for the four scenarios listed above. We divided the probability range from 0 to 1 into 5 sectors: p ≤ 0.05, 0.05 < p ≤ 0.30, 0.30 < p < 0.70, 0.70 ≤ p < 0.95, 0.95 ≤ p < 1.00. A value of p ≤ 0.05 means that the null hypothesis has a probability to be true that is less than 5%, which also means that the probability that earthquakes are triggered by rainfall events is higher than 95%. A value of p ≥ 0.95 means the opposite. The alternative values of p mean a moderate bias in one direction or the other if 0.05 < p ≤ 0.30 or 0.70 ≤ p < 0.95, respectively. Values 0.30 < p < 0.70 indicate a neutral condition, which means that no relation in one way or the other can be established between rainfalls and seismic activity. The Table 1, Table 2, Table 3 and Table 4 highlight in bold the cases p ≤ 0.05 and 0.05 < p ≤ 0.30, which support a relation between rainfalls and seismic activity.
From scenarios #1 to #4, the model gives the rainfall more and more time (from a few days to 1–2 weeks) to affect the seismic activity in the area. The analysis suggests that the seismic days (that is, days when at least one seismic event has been recorded) are not particularly linked with wet days. In fact, for the analyzed scenarios and for the 13 years from 2008 to 2020, we almost always found 0.05 < P1 < 0.95. One year (scenarios #2 and #4) and 2 years (scenario #1) had P1 ≥ 0.95, and one year had P1 ≤ 0.05 in all scenarios. Therefore, by considering the 13 analyzed years, no bias in one direction or the other can be established according to the first test.
On the contrary, the values P2 reported in Table 1, Table 2, Table 3 and Table 4 suggest that the number of seismic-events could be linked with wet days for most years. That is, seismic swarms are more likely to occur in these conditions. In fact, for each scenario, we found the following statistics:
- Scenario #1: R = 0.2 mm and τ = 1 day. P2 ≤ 0.05 for 6 years (2008, 2009, 2012, 2014, 2015, and 2017), 0.05 < P2 ≤ 0.30 for 3 other years (2018, 2019 and 2020), while P2 ≥ 0.95 for three years (2010, 2011 and 2016);
- Scenario #2: R = 0.1 mm and τ = 1 day. P2 ≤ 0.05 for 6 years (2008, 2009, 2012, 2014, 2015, and 2018) while P2 ≥ 0.95 for just 3 years (2010, 2011 and 2016);
- Scenario #3: R = 0.2 mm and τ = 2 day. P2 ≤ 0.05 for 9 years (2008, 2009, 2011, 2012, 2013, 2014, 2017, 2018, and 2019), while P2 ≥ 0.95 for just 2 years (2010, 2016);
- Scenario #4: R = 0.1 mm and τ = 2 day. P2 ≤ 0.05 for 9 years (2008, 2009, 2010, 2011, 2012, 2013, 2014, 2017, and 2019), 0.05 < P2 ≤ 0.30 for 2 years (2018 and 2020), while P2 ≥ 0.95 for just one year (2016).
Thus, scenario #4 shows the strongest evidence for demonstrating a time-delayed correlation between the rainfalls and seismic events in the Phlegraean Fields. In fact, the values P2, reported in Table 4, suggest that the number of seismic events could be linked with wet days at least for 9 of the 13 analyzed years, that is, in 2008, 2009, 2010, 2011, 2012, 2013, 2014, 2017, and 2019.
The statistical results referring to the other three scenarios assume a more rapid seismic response to water infiltration: in these cases, we found that the years 2015 and 2018 are characterized by P2 ≤ 0.05. Figure 2, Figure 3, Figure 4 and Figure 5 also show that earthquake events tend to cluster. More specifically, seismic swarms are observed and last up to about one hour. For example, on 23 January 2009, there were 143 tremors (without counting those whose magnitude was unknown) in 36 min from 5:15 a.m. to 5:51 a.m. We could not find tremor swarms extending from a day to the following one. Thus, events occurring on different days belong to different clusters. Several seismic events are also isolated; that is, they do not generate any seismic swarm even if their magnitude is relatively high. This result suggests that the seismic properties of the area are not stationary in time. In fact, the physical properties of the soil are expected to be modified by the addition of meteoric water.
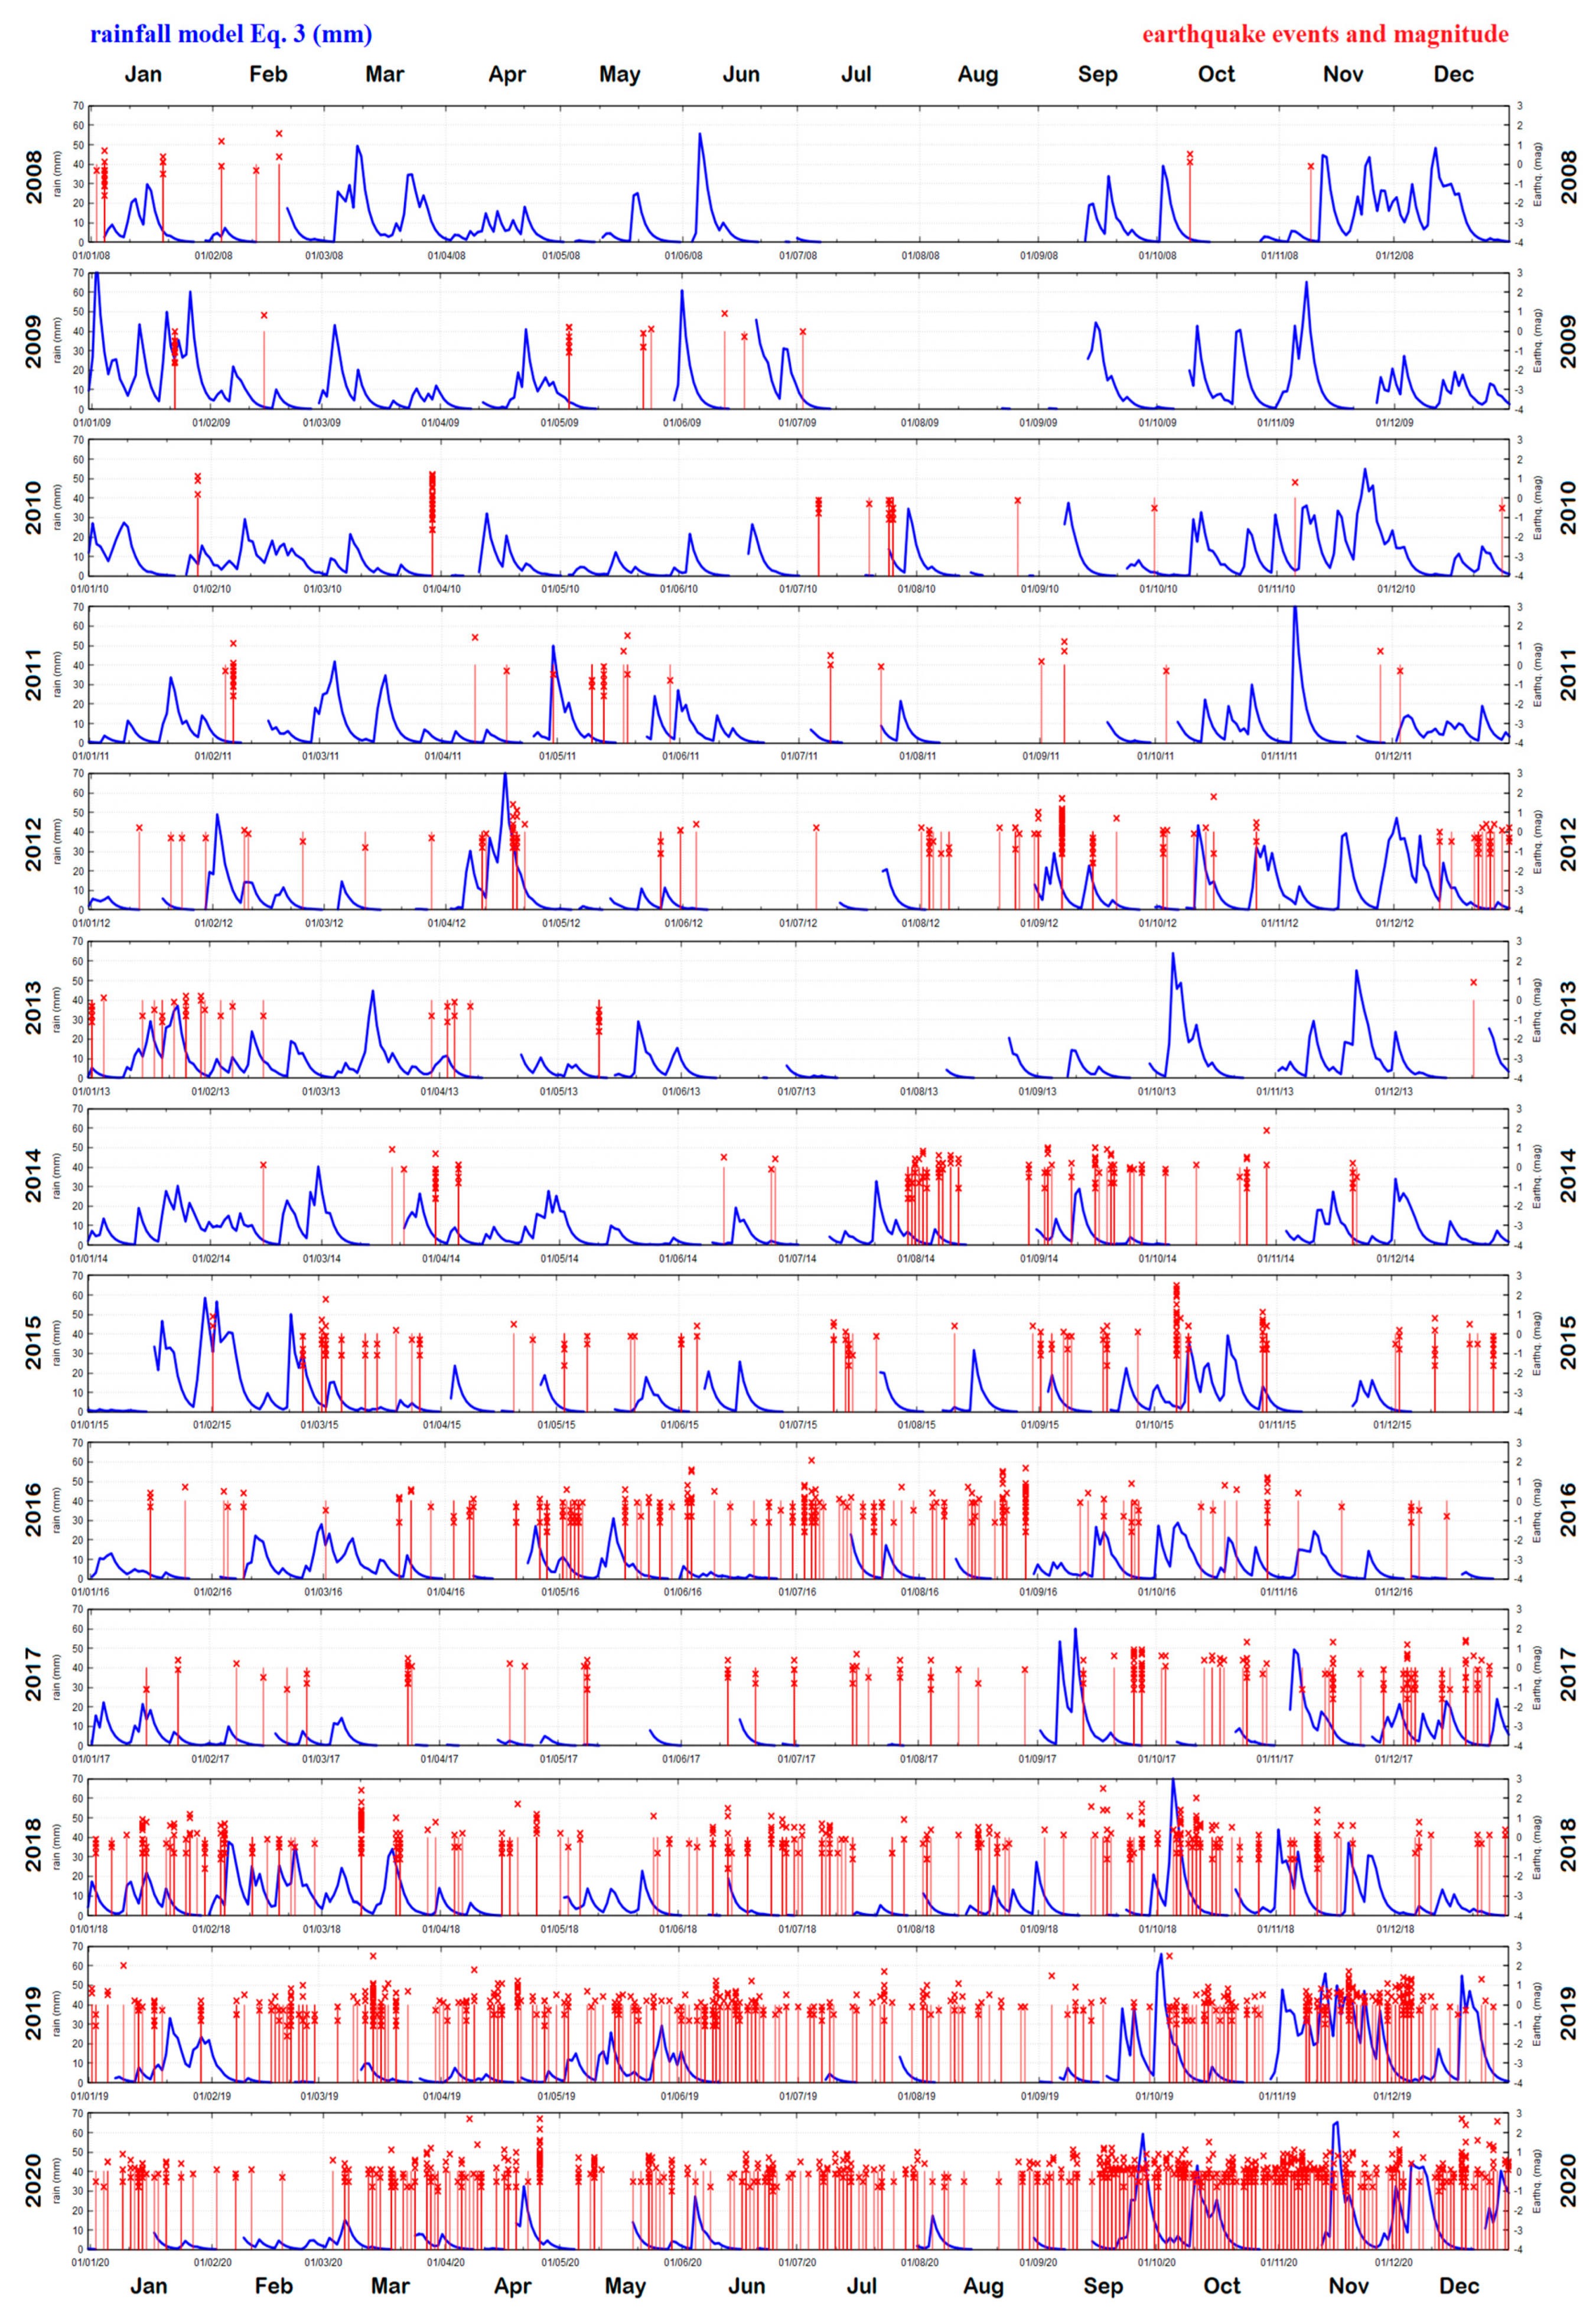
Figure 2, Figure 3, Figure 4 and Figure 5 also suggest that many seismic events occurred during wet days, that is, up to a few days or 1–2 weeks after large rainfall events. This behavior is more evident for scenario #4 and from 2008 to 2014 than from 2015 to 2000, when the number of seismic events increased significantly.
It is worth noting that, if the seismic events significantly increase, its correlation with the rainfall record would also increase. This makes the association between rainfalls and seismic activity statistically and visually more challenging. However, Equations (4) and (5) already take this problem into account by evaluating the probability of obtaining a number of wet days with earthquakes larger than that measured n1, assuming a random distribution of days with seismic activity.
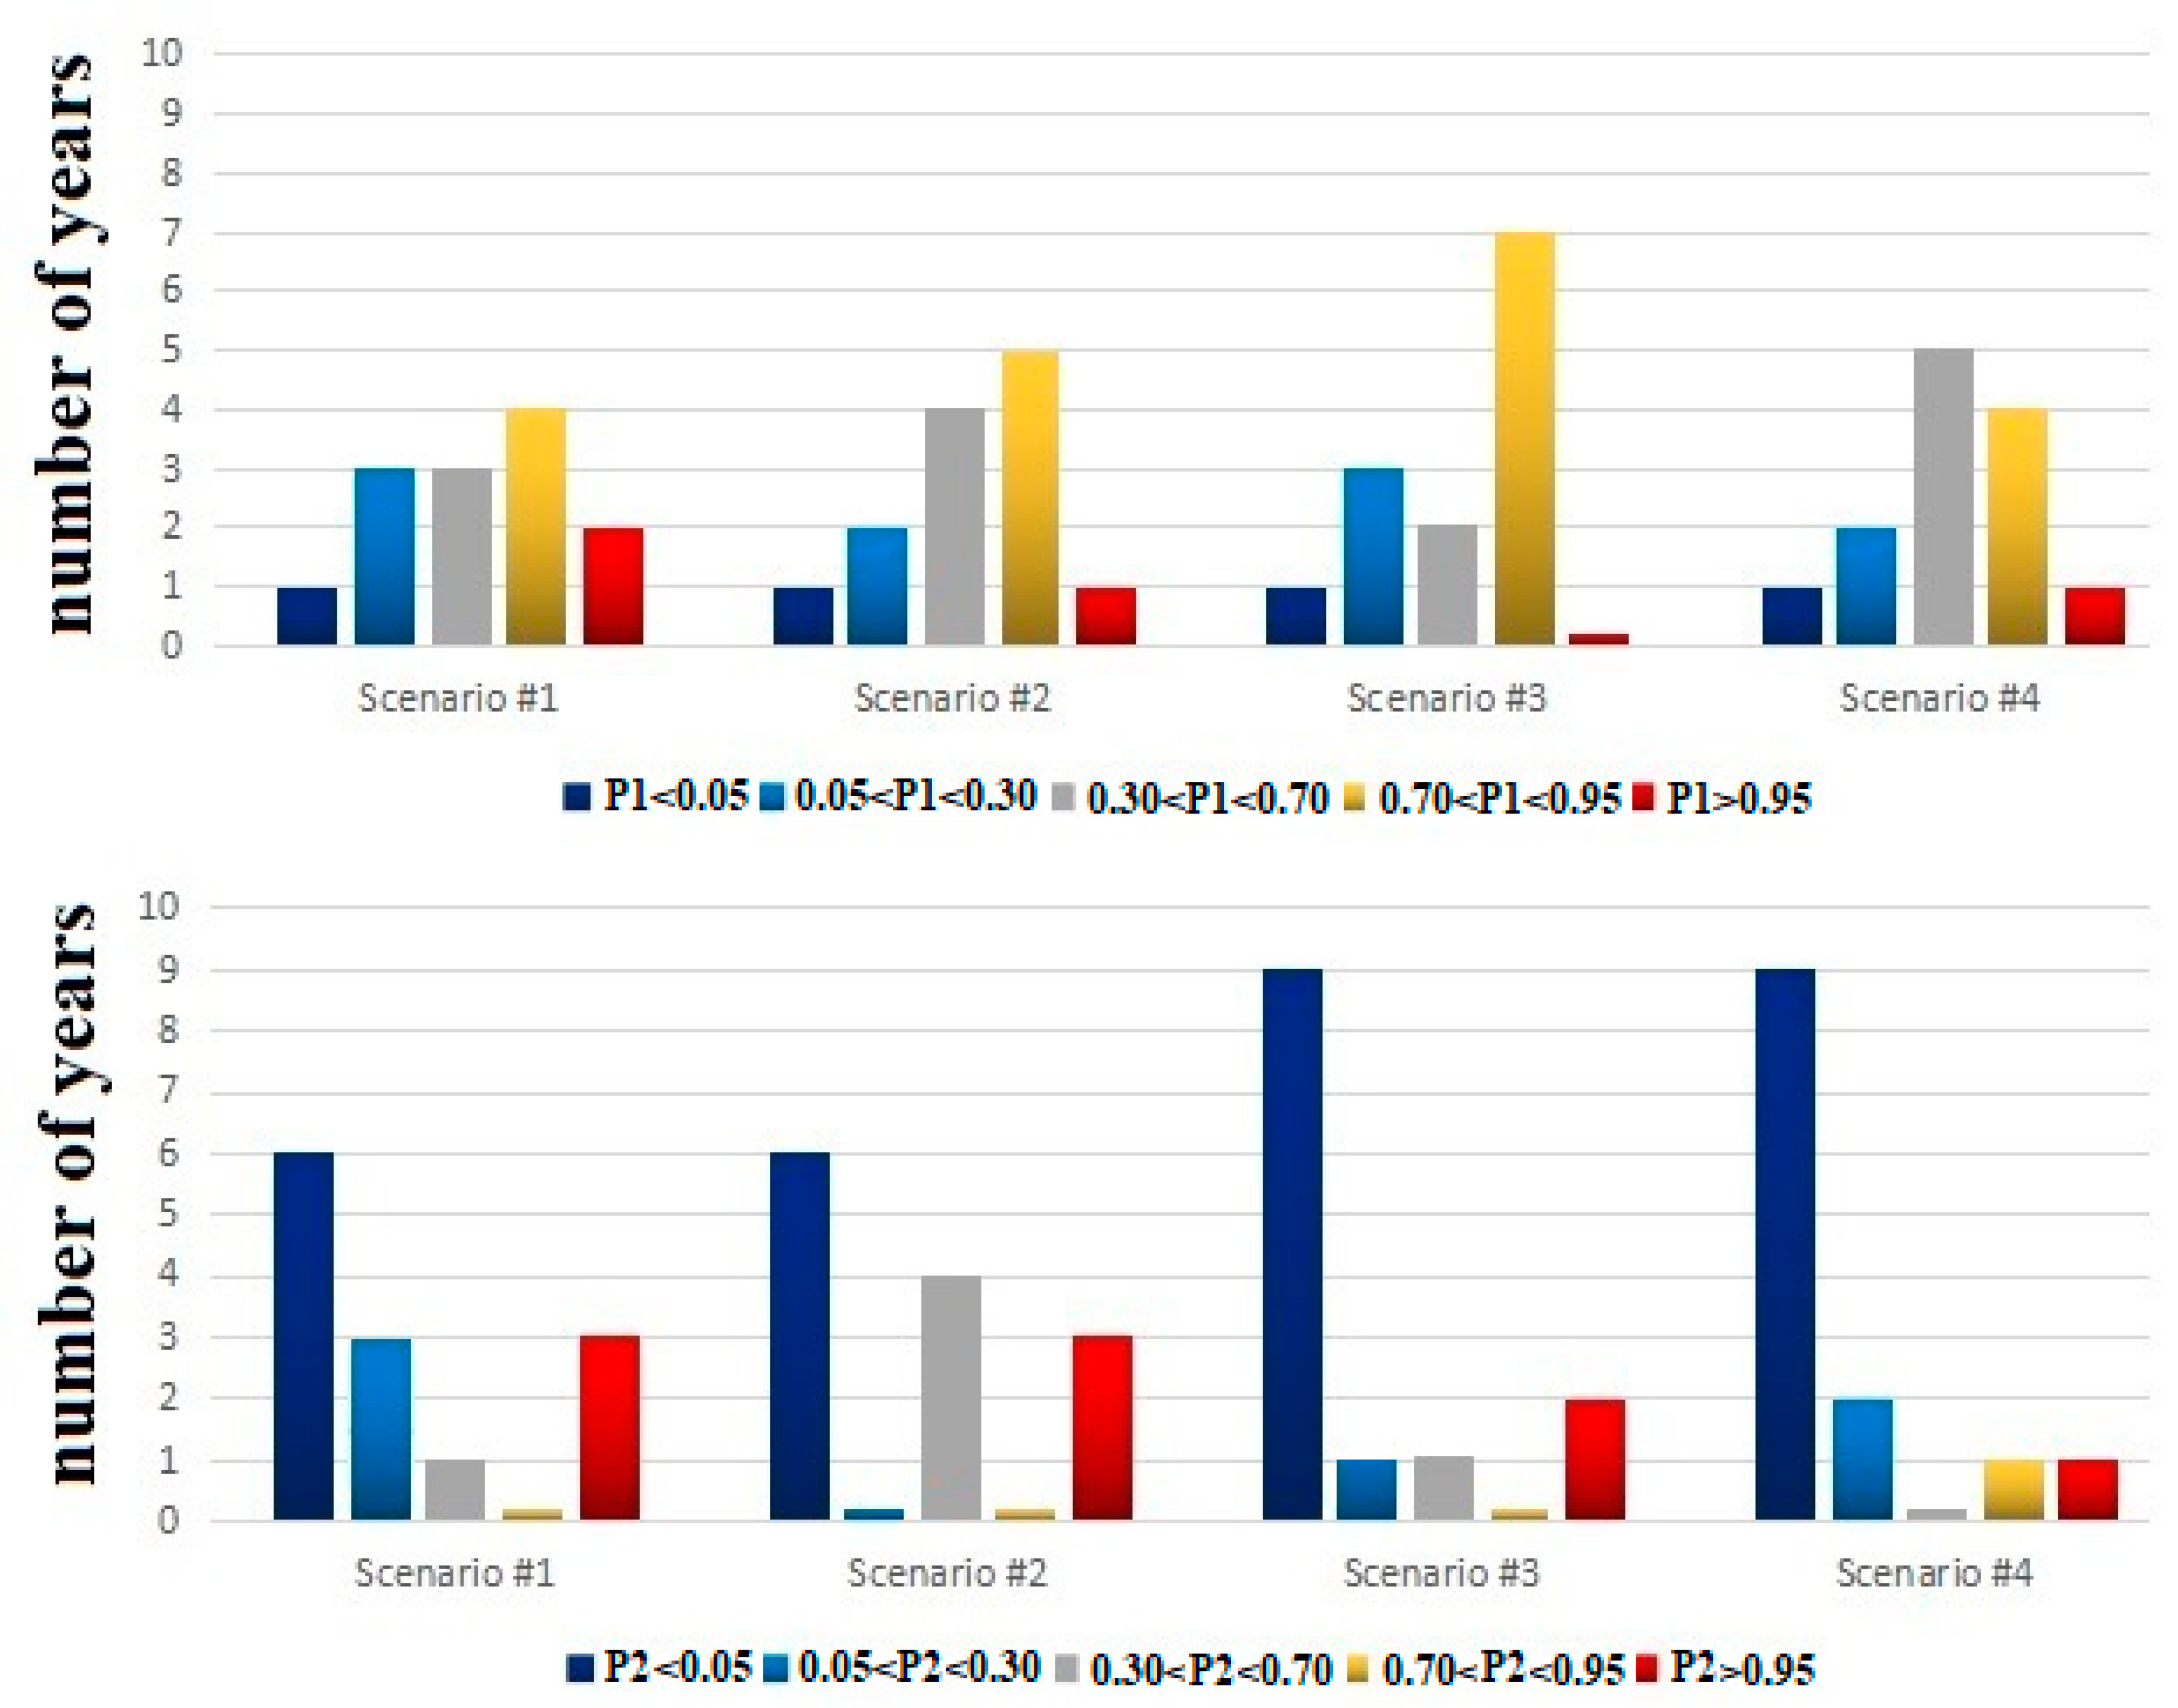
For the four analyzed scenarios #1, #2, #3, and #4, Figure 6 (top panel) shows the number of years when the probabilities P1 fall within each of the five probability ranges for the years 2008–2020. These histograms do not show a significant bias toward wet or dry days. At most, it is possible to observe a slight skewness toward dry days.
Figure 6 (bottom panel) depicts the number of years when the probabilities P2 fall within each of the five probability ranges for the years 2008–2020. From scenario #1 to #4, the number of years when P2 ≤ 0.05 increases from 6 to 9; the number of years when P2 ≥ 0.95 decreases from 3 to 1. Thus, scenario #1 would already support our hypothesis. However, the statistical significance of a positive correlation significantly improves for scenario #4 when the probability that rainfalls could affect seismic events in each given year (P2 ≤ 0.05) exceeds the alternative possibility by 9 to 1. Two other years (2018 and 2020) had 0.05 < P2 ≤ 0.30; only one year (2015) had 0.70 ≤ P2 < 0.95, and one year (2016) had P2 ≥ 0.95.
Thus, for scenario #4, by applying the binomial distribution, we obtain less than 1% probability for obtaining more than 9 “yes” (P2 ≤ 0.05) versus 1 “no” (P2 ≥ 0.95) with 10 independent trials (if the other three years are ignored) or for obtaining more than 9 + 2 = 11 “yes” (P2 ≤ 0.30 or P2 < 0.50) versus 1 + 1 = 2 “no” (P2 ≥ 0.70 or P2 > 0.50) with 13 independent trials (if the leaning years are respectively associated with their correspondent closest hypothesis). We would still get just a probability of 9% for obtaining more than 9 “yes” (P2 ≤ 0.05) versus 4 “no” (P2 > 0.05) with 13 independent trials (if the other four cases are considered contrary to our hypothesis).
Scenario #4 also suggests that a link between earthquakes and rainfall events could be stronger when fewer earthquakes occur, which usually happens when the bradyseism of the area is weak. In fact, Figure A1 shows that the years from 2002 to 2014 had a relatively modest vertical land movement, which was momentarily interrupted by the 2012 uplift [37]. On the contrary, from 2015 to 2020 a continuous and strong uplift was observed with just a short pause around 2017. According to Table 1, P2 ≤ 0.05 from 2008 to 2014 and in 2017 and 2019. Thus, we always found (=100% of the trials) P2 ≤ 0.05 during the 7 years when the bradyseism was relatively modest (2008-2011, 2013, 2014 and 2017).
5. Discussion and Conclusions
Our analysis suggests that rainfall events in the Phlegraean Fields can trigger, with a delay up to some days or weeks (which depends on the rainfall amount), a majority of the seismic events locally recorded. There should also be an additional input from the seawater infiltration, whose level increases with the reduction in atmospheric pressure occurring when it rains [4,28,38].
The novelty of our result relative to previous studies relating atmospheric events and seismic or volcanic activity [4,5,6,7,8,9,10,11,12,13,14,15] resides in the fact that this area is in a seismic critical state because it is subjected to positive bradyseism, which is the first reason why the region is seismically active. Thus, we found that rainwater infiltration triggers local tremors on short time scales by interacting with the endogenous conditions of the underground driven by the pressure of the active magmatic chamber located as near as 6 km below the surface while the impermeable layer is located at about 2.5 km below the surface.
Our statistical analysis highlighted that the observed seismic events usually occur in large clusters, particularly after large rainfalls lasting for several days or weeks. The link between rainfall and seismic activity appears more evident when the annual number of seismic events was small (up to about 200), as it happened from 2008 to 2014. When the number of seismic events greatly increases, more aftershock tremors could be triggered by the previous tremors, and the process would last longer. In this situation, it is more difficult to track the seismic sequence and to identify their cause. This could have happened in 2016 (288 events).
However, using statistical inference, we could detect an association between rainfall events and seismic activity P2 ≤ 0.05 also in 2018, which experienced 375 seismic events, and in 2019, with 592 recorded seismic events. Even in 2020, when 766 seismic events were recorded, our statistical approach could still detect a moderate correlation 0.05 < P2 ≤ 0.30 between rainfall and seismic events. In 2020 it is possible to visually notice a very large increase in seismic activity from September to December, which was also the most rainy period of the year. In fact, from January to August the rainfall amount was 205.7 mm and there were 339 seismic tremors; from September to December the rainfall amount was 571.4 mm and there were 437 tremors.
Within 13 years (from 2008 to 2020), for 9 years, we get P2 ≤ 0.05 (=“yes” to our hypothesis), for 1 year we get P2 ≥ 0.95 (=“no” to our hypothesis); two years led toward “yes” (0.05 < P2 ≤ 0.30) and one year led toward “no” (0.70 ≤ P2 < 0.95). The probability of getting such a result randomly is less than 1%. However, if the analysis is limited to the 7 years of modest bradyseism (2008, 2009, 2010, 2011, 2013, 2014, 2017: see Appendix A), we found P2 ≤ 0.05 for all years (100% of the cases).
In conclusion, large seismic swarms often occurred in correspondence, or closely following significant rainy periods. Indeed, as rainfalls reduce the soil suction pressure, a wide area around Naples and Vesuvius is affected by frequent landslide phenomena due to the instability of the pyroclastic cover influenced by wetting–drying cycles resulting in shallow structural collapses, fast landslides, flow liquefaction, and more [39]. An additional effect could derive from seawater variation due to tides and atmospheric pressure variation [28,38].
Several studies have evaluated the hydrogeological cross-sections at the Phlegraean Fields [36,40,41,42,43]. They found that the terrain below the area centered in the Solfatara crater (see Figure 1) is characterized by a magmatic chamber below about 6 km from the sea level. The magmatic chamber is surmounted by a mixing zone at a temperature above 350 °C until about 2.5 km. This region is followed by a large hydrothermal zone saturated with liquids of meteoric origin and gas up to the sea level, with temperatures ranging from about 100 °C to 220 °C [41,43]. During the last years (2018–2020) the number of seismic events increased significantly, despite not having a significant increase in rainfall as compared to earlier years. In fact, the area is seismically active mostly because of the increased endogenous pressure from the deep magmatic chamber, which accelerated the lifting of the ground.
Thus, rainfall water likely penetrates deeply in the highly fractured and hot shallow-water-saturated subsurface from 0 to 2.5 km depth that characterizes the region, reduces the strength and stiffness of the soil, and, finally, boils when it mixes with the hot hydrothermal magmatic fluids migrating upward. The structural collapse of the saturated soil and the mixing of the meteoric fluid with the hot deep fluids should be what triggers the local seismic activity.
However, we also found a number of days experiencing some seismic events in the so-called dry days, which could have happened independently of rainfall events. Thus, rainfall events do not always trigger earthquakes in the Phlegraean Fields, nor do all seismic events appear to be triggered by water infiltration. In fact, the area is seismically active not because it rains but because of the soil instability induced by the local bradyseism [2]. The rainfall water infiltration simply perturbs an already highly critical system. The overall result suggests that meteoric water infiltrating the soil increases the seismic sensitivity and activity of the local faults by favoring large swarms once a seismic tremor occurs, while the local bradyseism keeps the area in a seismic critical state where even small perturbations can have observable triggering effects.
We speculate that the area is particularly sensitive to rainfalls also because of its numerous and large basins of volcanic origin. For example, large amounts of rainfall water are collected by the Astroni crater (the basin is 2,500,000 m2), where a small lake of about 50,000 m2 also exists; by the basin of Agnano (about 3,000,000 m2), where a large volcanic lake of about 1,000,000 m2 formed in the 11th century and existed until 1870 when it was artificially drained; and by the Solfatara crater itself. The first two large basins and the sea surround the Solfatara crater, which is the area most affected by seismic activity (Figure 1). Other craters and basins are on the Western sides of the Phlegraean area, where Avernus lake is located. Moreover, the underground hot aquifers of the area are very shallow, as demonstrated by the numerous thermal springs of the area and by the boiling mud at Solfatara (Figure 1). Thus, the results of this work envisage the possibility of developing specific rainfall-draining systems or other hydrological strategies to possibly mitigate the seismic activity at the Phlegraean Fields.
In conclusion, when the shallow crust is in a critical seismic state, as happens at the Phlegraean Fields because of its bradyseism, even tiny pressure and permeability changes induced in the soil by meteoric water infiltration could trigger earthquakes swarm from near the surface to up to 2.5 km depth [13,44].
It is also interesting to observe that our result confirms the intuitions of Neapolitan scientists of the 18th and 19th centuries. In fact, the phenomenology of lava deposits and fumaroles at the Vesuvius and Solfatara convinced some (e.g., Gaetano De Bottis [45] and Giovanni Maria Della Torre [46]) that meteorological events were correlated with volcanic activity. In addition, the Vesuvian Observatory (Osservatorio Vesuviano, the oldest volcanology observatory in the world: http://www.ov.ingv.it/ov/en.html), was founded in 1841 to study the influence of meteorology on volcanological phenomena. In this regard, we note the work of Luigi Palmieri, who was appointed director of the Osservatorio Vesuviano from 1854 to his death in 1896, and who, simultaneously, was also appointed in 1860 director of the Meteorological Observatory of the University of Naples Federico II. Thus, there is an ancient and consolidated scientific tradition in Naples linking rainfall events to the local volcanic and seismic activity.
Author Contributions
N.S. contributed to the project, the data collection and analysis, and to the writing of the paper; A.M. contributed to the project, the data collection and the writing of the paper. Both authors have read and agreed to the published version of the manuscript.
Funding
This research received no external funding.
Institutional Review Board Statement
It is no needed.
Informed Consent Statement
It is no needed.
Data Availability Statement
All data are freely available online at the websites listed in Section 2.
Conflicts of Interest
The authors declare no conflict of interest.
Appendix A
The significant seismicity of the Phlegraean Fields is related to its bradyseism [2]. Figure A1 shows time series of changes in altitude of four different stations placed at Pozzuoli-Rione Terra (RITE), Accademia Aeronautica (ACAE), Solfatara (SOLO), and Pozzuoli-Cemetery (STRZ) from January 2000 to May 2020 [37]. At RITE, the soil was lifted by about 650 mm from 2008 to 2020. As shown in the main paper, these curves are correlated with the frequency of the seismic tremors of the region.
Figure A1.
Time series of changes in altitude of the RITE station (Pozzuoli-Rione Terra), ACAE (Accademia Aeronautica), SOLO (Solfatara), and STRZ (Pozzuoli-Cemetery) from January 2000 to May 2020 (modified from: INGV-OV Bulletin of Surveillance Phlegraean Area, © CC BY-NC-ND 4.0).
Figure A1.
Time series of changes in altitude of the RITE station (Pozzuoli-Rione Terra), ACAE (Accademia Aeronautica), SOLO (Solfatara), and STRZ (Pozzuoli-Cemetery) from January 2000 to May 2020 (modified from: INGV-OV Bulletin of Surveillance Phlegraean Area, © CC BY-NC-ND 4.0).

Appendix B
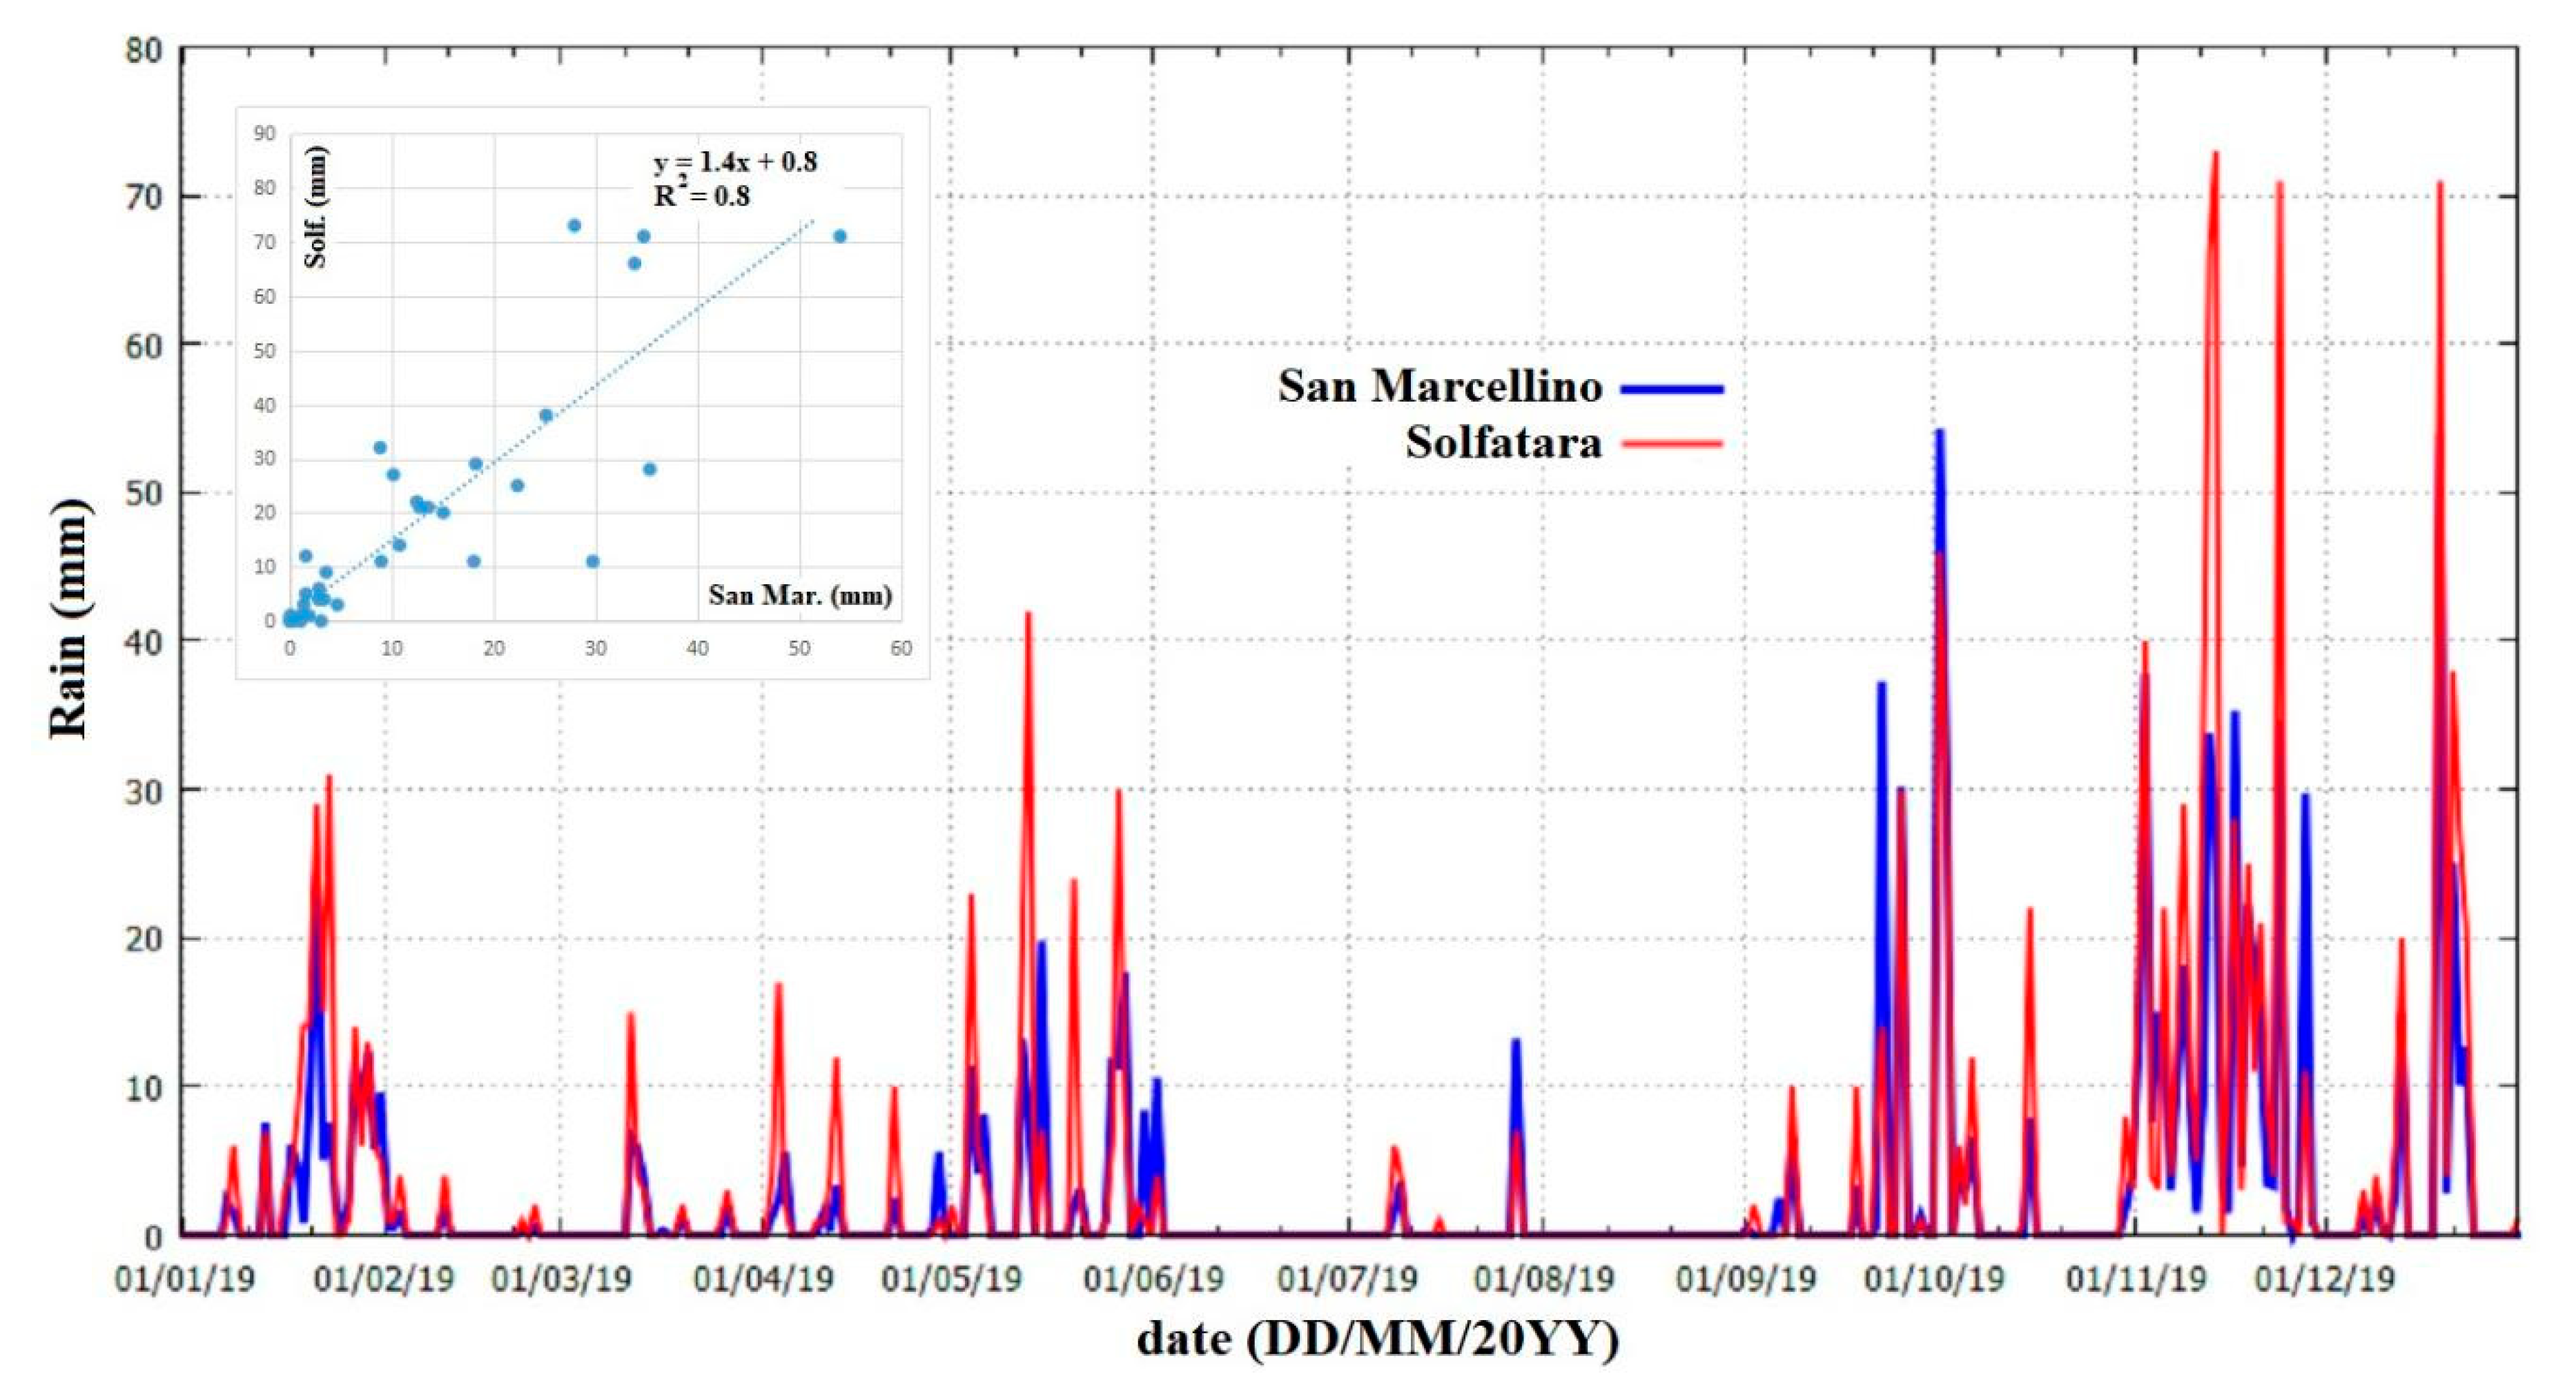
In the main paper, we used the daily catalog of rainfall measured at the first-class Meteorological Observatory of San Marcellino of the University of Naples Federico II, located in the historical center of Naples. Figure A2 depicts a comparison between these data (red) and those measured at the Meteorological Observatory of San Marcellino (blue). The figure and its insert demonstrate that similar rain events occurred simultaneously in the two locations, although the amount of rainfall is usually not the same. In 2019, the meteorological station at the Solfatara registered 1385 mm of rain versus 1014 mm measured at San Marcellino, which suggests that on average the former is about 40% larger than the latter, at least in 2019. This result is expected because the rainfall amount at Pozzuoli is enhanced by the local orography and the presence of the nearby island of Ischia, which also induce frequent flash-floods. For additional details on the statistics of the rainfall record in Naples see Ref. [47].
Figure A2.
Rainfall time series measured at the Meteorological Observatory of San Marcellino in Naples (blue line) and the Solfatara (red line). The insert represents the calibration of Solfatara on San Marcellino.
Figure A2.
Rainfall time series measured at the Meteorological Observatory of San Marcellino in Naples (blue line) and the Solfatara (red line). The insert represents the calibration of Solfatara on San Marcellino.

References
- Charlton, D.; Kilburn, C.; Edwards, S. Volcanic unrest scenarios and impact assessment at Campi Flegrei caldera, Southern Italy. J. Appl. Volcanol. 2020, 9, 7. [Google Scholar]
- De Vivo, B.; Belkin, H.; Rolandi, G. Vesuvius, Campi Flegrei, and Campanian Volcanism; Elsevier: Amsterdam, The Netherlands, 2020. [Google Scholar]
- De Vivo, B.; Rolandi, G. Volcanological risk associated with Vesuvius and Campi Flegrei. In Vesuvius, Campi Flegrei, and Campanian Volcanism; De Vivo, B., Belkin, H.E., Rolandi, G., Eds.; Elsevier: Amsterdam, The Netherlands, 2020; Volume 17, pp. 471–493. [Google Scholar]
- Palumbo, A. Influence of external tidal and meteorological forces on the bradyseismic phenomenon in the Phlegraean Fields. Il Nuovo Cimento C 1985, 8, 538–551. [Google Scholar] [CrossRef]
- Mazzarella, A.; Palumbo, A. Does the solar cycle modulate seismic and volcanic activity? J. Volc. Geoth. Res. 1989, 39, 89–93. [Google Scholar] [CrossRef]
- Mastin, L.G. Can rain cause volcanic eruptions? In U.S.G.S., Open-File Report; US Geological Survey: Reston, VA, USA, 1993; pp. 93–445. Available online: https://pubs.usgs.gov/of/1993/0445/ (accessed on 30 November 2020).
- Mastin, L.G. Explosive tephra emissions at Mount St. Helens, 1989–1991: The violent escape of magmatic gas following storms? Geol. Soc. Am. Bull. 1994, 106, 175–185. [Google Scholar]
- Neuberg, J. External modulation of volcanic activity. Geophys. J. Int. 2000, 142, 232–240. [Google Scholar] [CrossRef] [Green Version]
- Violette, S.; De Marsily, G.; Carbonnel, J.P.; Goblet, P.; Ledoux, E.; Tijani, S.M.; Vouille, G. Can rainfall trigger volcanic eruptions? A mechanical stress model of an active volcano: ‘Piton de la Fournaise’, Reunion Island. Terra Nova 2001, 13, 18–24. [Google Scholar]
- Matthews, A.J.; Barclay, J.; Carn, S.; Thompson, G.; Alexander, J.; Herd, R.; Williams, C. Rainfall-induced volcanic activity on Montserrat. Geoph. Res. Lett. 2002, 29, 1644. [Google Scholar] [CrossRef] [Green Version]
- Matthews, A.J.; Barclay, J. A thermodynamical model for rainfall triggered volcanic dome collapse. Geoph. Res. Lett. 2004, 31, L05614. [Google Scholar] [CrossRef] [Green Version]
- Matthews, A.J.; Barclay, J.; Johnstone, J. The fast response of volcano-seismic activity to intense precipitation: Triggering of primary volcanic activity by rainfall at Soufrière Hills Volcano, Montserrat. J. Volcanol. Geoth. Res. 2009, 184, 405–415. [Google Scholar]
- Hainzl, S.; Kraft, T.; Wassermann, J.; Igel, H.; Schmedes, E. Evidence for rainfall-triggered earthquakes activity. Geophys. Res. Lett. 2006, 33, L19303. [Google Scholar]
- Miller, S.A. Note on rain-triggered earthquakes and their dependence on karst geology. Geophys. J. Int. 2008, 173, 334–338. [Google Scholar] [CrossRef] [Green Version]
- Farquharson, J.I.; Amelung, F. Extreme rainfall triggered the 2018 rift eruption at Kīlauea Volcano. Nature 2020, 580, 491–495. [Google Scholar] [CrossRef] [PubMed]
- Dana, J.D. Characteristics of Volcanoes: With Contributions of Facts and Principles from the Hawaiian Islands; Dodd, Mead and Co.: New York, NY, USA, 1891. [Google Scholar]
- Banks, N.G.; Mora, H.; Tryggvaso, E. Deformation monitoring at Nevado del Ruiz, Colombia—October 1985—March 1988. J. Volcanol. Geoth. Res. 1990, 41, 269–295. [Google Scholar] [CrossRef]
- Barclay, J.; Alexander, J.; Sušnik, J. Rainfall-induced lahars in the Belham Valley, Montserrat, West Indies. J. Geol. Soc. 2007, 164, 815–827. [Google Scholar]
- Smithsonian Institution. Guagua Pichincha (Ecuador): Phreatic explosion kills two scientists: Bull. Glob. Volcanism Netw. 1993, 18, 2.
- Guest, J.; Murray, J.; Kilburn, C.; Lopes, R. Eruptions on Mount Etna during 1979. Earthq. Inf. Bull. 1980, 12, 154–160. [Google Scholar]
- Mazzarella, A.; Scafetta, N. Evidences for higher nocturnal seismic activity at the Mt. Vesuvius. J. Volc. Geoth. Res. 2016, 321, 102–113. [Google Scholar] [CrossRef] [Green Version]
- Scafetta, N.; Mazzarella, A. Cultural noise and the night-day asymmetry of the seismic activity recorded at the Bunker-East (BKE) Vesuvian Station. J. Volc. Geoth. Res. 2018, 349, 117–127. [Google Scholar] [CrossRef] [Green Version]
- Cannatelli, C.; Spera, F.J.; Bodnar, R.J.; Lima, A.; De Vivo, B. Ground movement (bradyseism) in the Campi Flegrei volcanic area: A review. In Vesuvius, Campi Flegrei, and Campanian Volcanism; De Vivo, B., Belkin, H.E., Rolandi, G., Eds.; Elsevier: Amsterdam, The Netherlands, 2020; Chapter 15; pp. 407–433. [Google Scholar]
- De Vivo, B.; Lima, A. A hydrothermal model for ground movements (bradyseism) at Campi Flegrei, Italy. In Volcanism in the Campania Plain: Vesuvius, Campi Flegrei and Ignimbrites; De Vivo, B., Ed.; Developments in Volcanology 9; Elsevier: Amsterdam, The Netherlands, 2006; pp. 289–317. [Google Scholar]
- Bodnar, R.J.; Cannatelli, C.; De Vivo, B.; Lima, A.; Belkin, H.E.; Milia, A. Quantitative model for magma degassing and ground deformation (bradyseism) at Campi Flegrei, Italy: Implications for future eruptions. Geology 2007, 35, 791–794. [Google Scholar]
- Lima, A.; De Vivo, B.; Spera, F.J.; Bodnar, R.J.; Milia, A.; Nunziata, C.; Belkin, H.E.; Cannatelli, C. Thermodynamic model for the uplift and deflation episodes (bradyseism) associated with magmatic-hydrothermal activity at the Campi Flegrei active volcanic center (Italy). Earth Sci. Rev. 2009, 97, 44–58. [Google Scholar] [CrossRef]
- Calò, M.; Tramelli, A. Anatomy of the Campi Flegrei caldera using Enhanced Seismic Tomography Models. Sci. Rep. 2018, 8, 16254. [Google Scholar] [CrossRef] [PubMed]
- Petrosino, S.; Cusano, P.; Madonia, P. Tidal and hydrological periodicities of seismicity reveal new risk scenarios at Phlegraean Area caldera. Sci. Rep. 2018, 8, 13808. [Google Scholar] [CrossRef] [PubMed] [Green Version]
- Fortelli, A.; Scafetta, N.; Mazzarella, A. Nowcasting and real-time monitoring of heavy rainfall events inducing flash-floods: An application to Phlegraean area (Central-Southern Italy). Nat. Hazards 2019, 97, 861–889. [Google Scholar] [CrossRef]
- Ausilio, C. Phlegraean Area, allarme trivellazioni: Scatenate fumarole alte dieci metri. Vesuvius Live, 15 June 2020. Available online: https://www.vesuviolive.it/ultime-notizie/343822-agnano-trivellazioni-fumarole/ (accessed on 30 November 2020).
- Contessa, L. Progetto GEOGRID e Trivellazioni ad Agnano: Interviene l’Osservatorio Vesuviano. Cronaca Flegrea, Rione Terra News, 15 June 2020. Available online: https://www.cronacaflegrea.it/progetto-geogrid-e-trivellazioni-ad-agnano-interviene-losservatorio-vesuviano/ (accessed on 30 November 2020).
- Whitaker, S. Flow in porous media I: A theoretical derivation of Darcy’s law. Transp. Porous Media 1986, 1, 3–25. [Google Scholar] [CrossRef]
- Liu, C.; Evett, J.B. Soils and Foundations; Prentice Hall: Upper Saddle River, NJ, USA, 2001. [Google Scholar]
- Bear, J. Dynamics of Fluids in Porous Media; Dover Publications: Mineola, NY, USA, 1972. [Google Scholar]
- Zollo, A.; Maercklin, N.; Vassallo, M.; Dello Iacono, D.; Virieux, J.; Gasparini, P. Seismic reflections reveal a massive melt layer feeding Campi Flegrei caldera. Geophys. Res. Lett. 2008, 35, L12306. [Google Scholar] [CrossRef] [Green Version]
- Piochi, M.; Kilburn, C.R.J.; Di Vito, M.A.; Mormone, A.; Tramelli, A.; Troise, C.; De Natale, G. The volcanic and geothermally active Campi Flegrei caldera: An integrated multidisciplinary image of its buried structure. Int. J. Earth Sci. 2014, 103, 401–421. [Google Scholar] [CrossRef]
- De Martino, P.; Tammaro, U.; Obrizzo, F. GPS time series at Campi Flegrei caldera (2000–2013). Ann. Geophys. 2014, 57, S0213. [Google Scholar]
- Palumbo, A.; Mazzarella, A. Mean sea level variations and their practical applications. J. Geophys. Res. 1982, 87(C6), 4249–4256. [Google Scholar] [CrossRef]
- Pasculli, A.; Sciarra, N.; Esposito, L.; Esposito, A.W. Effects of wetting and drying cycles on mechanical properties of pyroclastic soils. Catena 2017, 156, 113–123. [Google Scholar] [CrossRef]
- Troiano, A.; Isaia, R.; Di Giuseppe, M.G.; Tramparulo, F.D.A.; Vitale, S. Deep Electrical Resistivity Tomography for a 3D picture of the most active sector of Campi Flegrei caldera. Sci. Rep. 2019, 9, 15124. [Google Scholar] [CrossRef] [Green Version]
- Bruno, P.P.G.; Ricciardi, G.P.; Petrillo, Z.; Di Fiore, V.; Troiano, A.; Chiodini, G. Geophysical and hydrogeological experiments from a shallow hydrothermal system at Solfatara Volcano, Campi Flegrei, Italy: Response to caldera unrest. J. Geophys. Res. 2007, 112, B06201. [Google Scholar] [CrossRef] [Green Version]
- Bernardinetti, S.; Bruno, P.P.G. The Hydrothermal System of Solfatara Crater (Campi Flegrei, Italy) Inferred from Machine Learning Algorithms. Front. Earth Sci. 2019, 7, 286. [Google Scholar] [CrossRef] [Green Version]
- Caliro, S.; Chiodini, G.; Paonita, A. Geochemical evidences of magma dynamics at Campi Flegrei (Italy). Geochim. Cosmochim. Acta 2014, 132, 1–15. [Google Scholar] [CrossRef]
- Shapiro, S.A.; Patzig, R.; Rothert, E.; Rindschwentner, J. Triggering of seismicity by pore-pressure perturbations: Permeability-related signatures of the phenomenon. In Thermo-Hydro-Mechanical Coupling in Fractured Rock (1051–1066); Birkhäuser: Basel, Switzerland, 2003. [Google Scholar]
- De Bottis, D.G. Istoria dei Vari incendi del Monte Vesuvio; Stamperia Regale: Napoli, Italy, 1786. [Google Scholar]
- Della Torre, G.M. Storia e Fenomeni del Vesuvio; Raimondi Editore: Napoli, Italy, 1755. [Google Scholar]
- Palumbo, N.; Mazzarella, A. Rainfall Statistical Properties in Naples. Monthly Weather Rev. 1980, 108, 1041–1045. [Google Scholar] [CrossRef] [Green Version]
Figure 1.
(Top) The Phlegraean Fields (PF) area, with the most seismic region highlighted (yellow circle) (modified from Google Earth Pro). The events that occurred in 2020 are shown in the right insert against the digital terrain model of the area (modified from INGV-OV: http://www.ov.ingv.it, © CC BY-NC-ND 4.0). (Bottom-left): The fumarolic field at the Solfatara (https://en.wikipedia.org/wiki/Solfatara_(volcano), © CC BY-SA 3.0). (Bottom-right): Close-up view of a boiling mud pool at the Solfatara (https://en.wikipedia.org/wiki/Solfatara_(volcano), © CC BY-SA 4.0).

Figure 2.
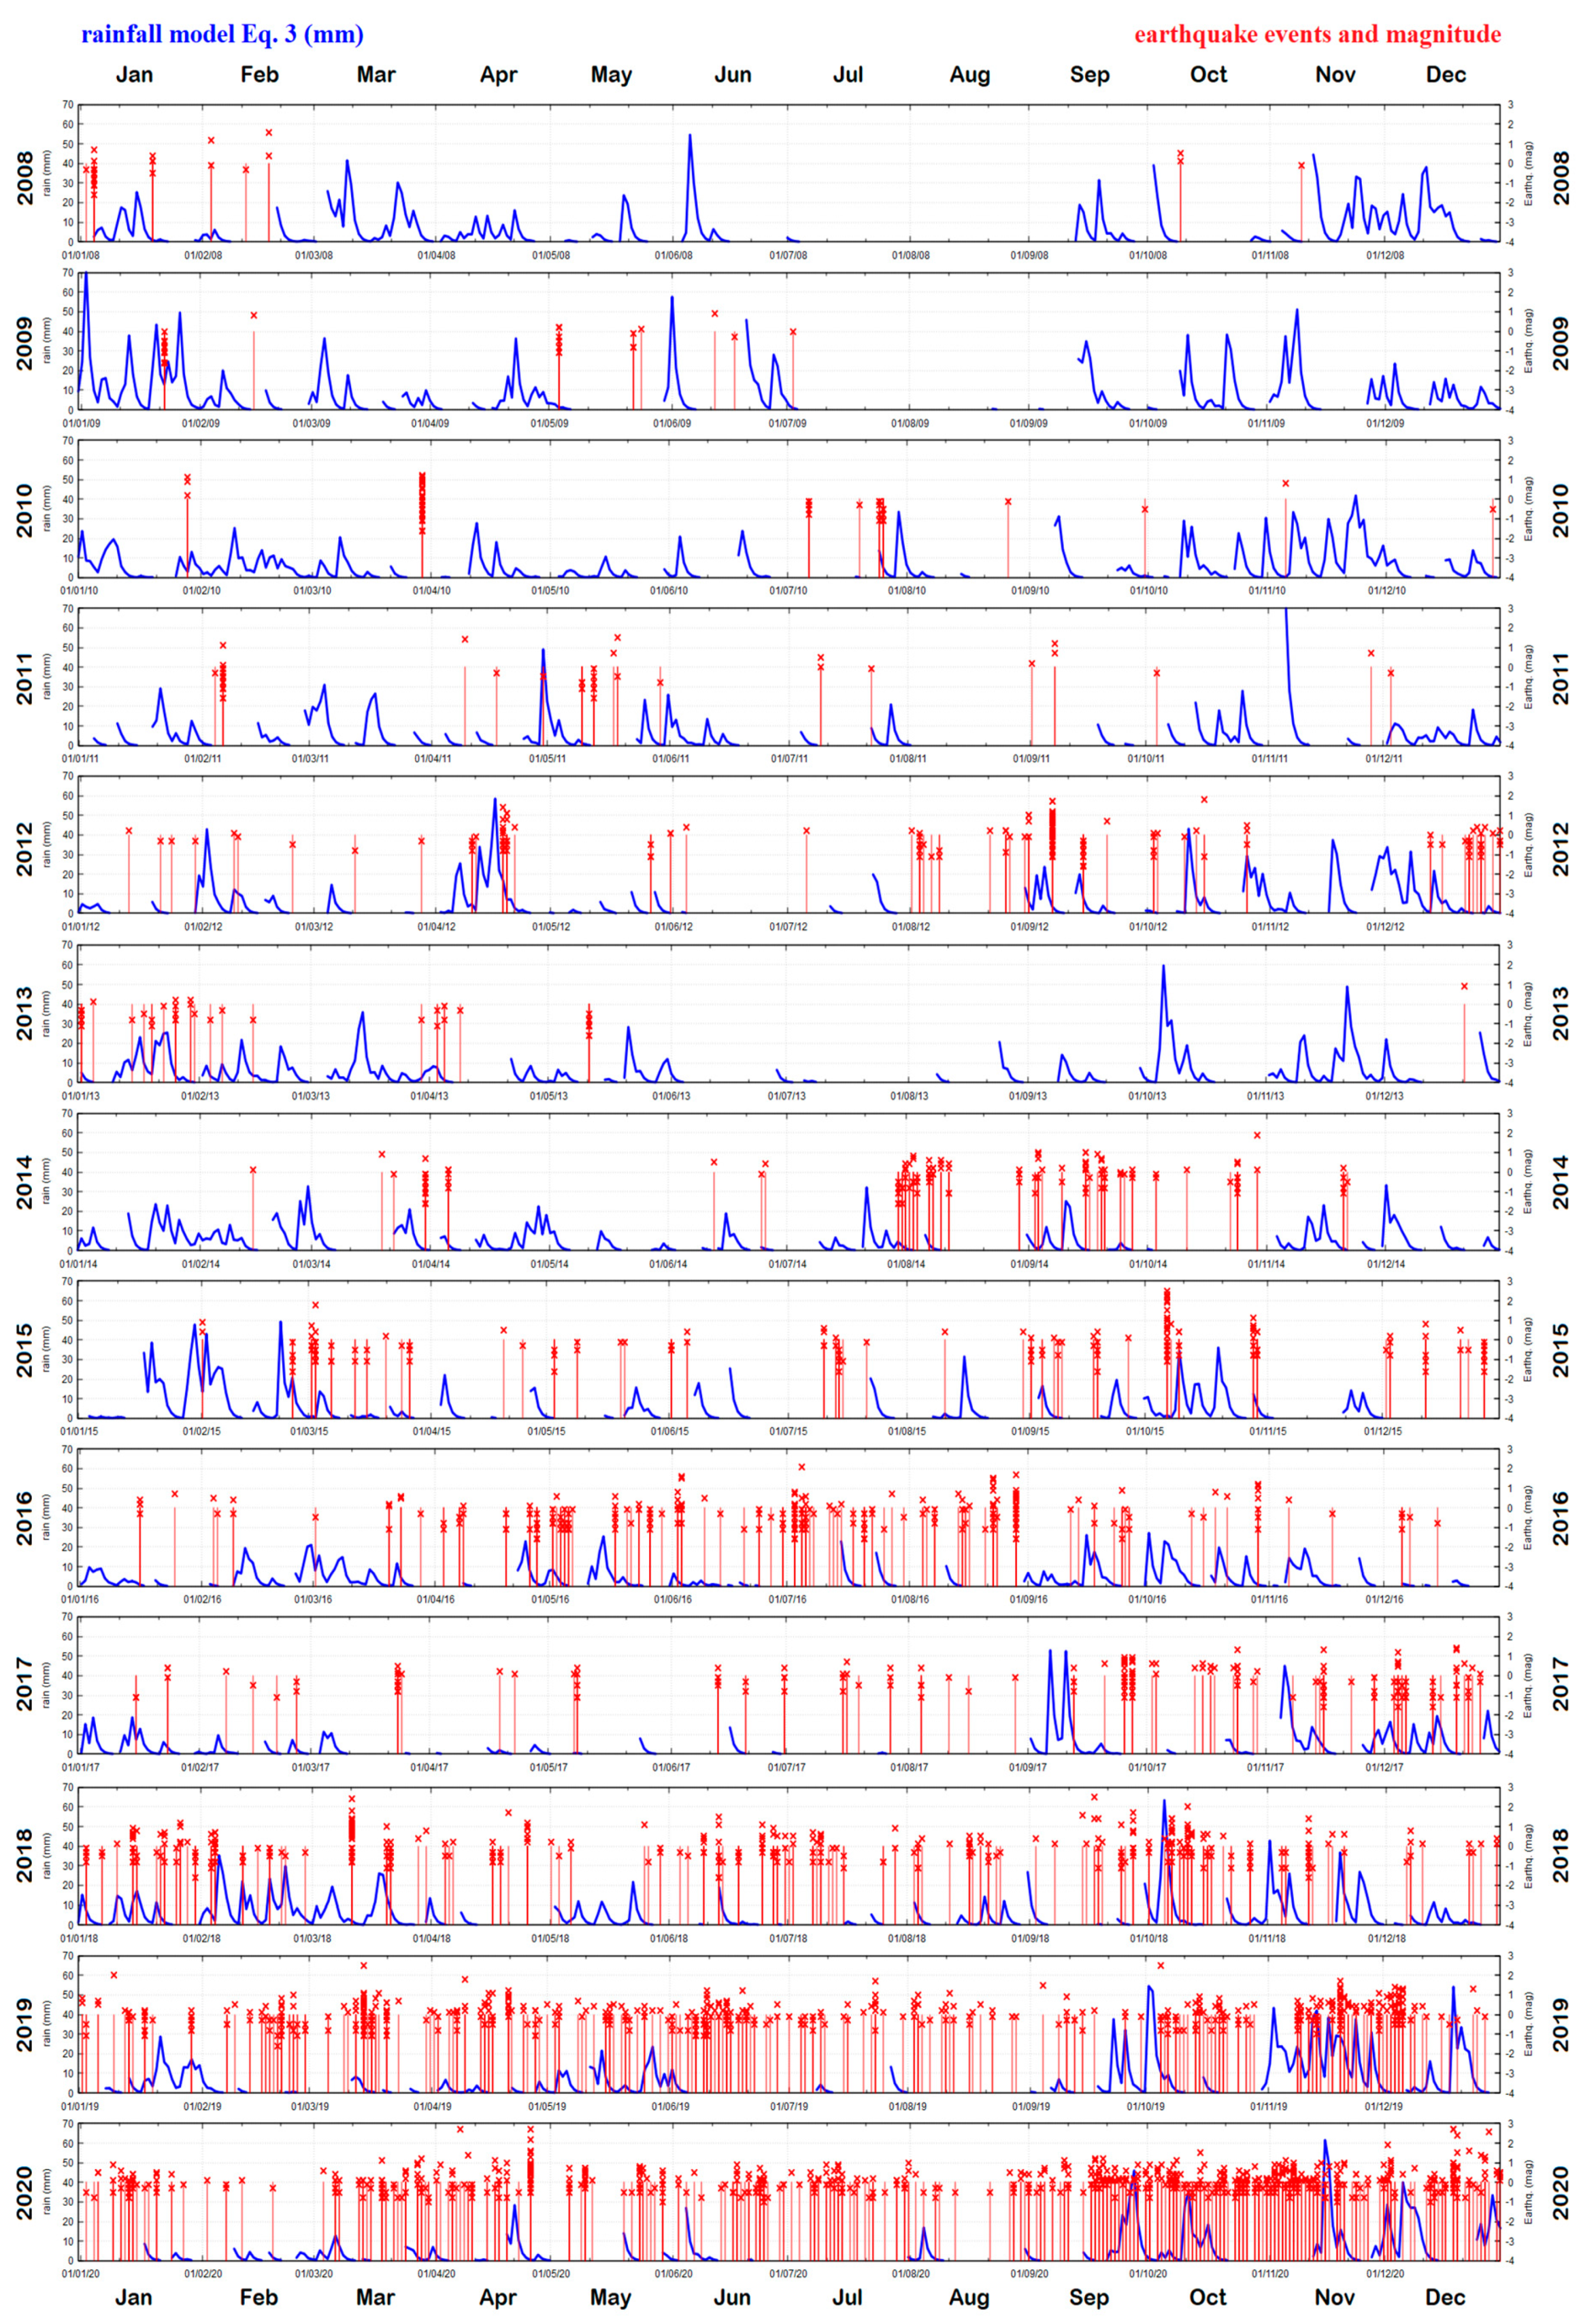
Scenario #1: R = 0.2 mm and τ = 1 day. Comparison between the empirical water stress-function (Equation (3)) estimated with the rainfall record of the Meteorological Observatory at San Marcellino in Naples (blue) and the seismic events at the Phlegraean Fields from 2008 to 2020 (red). Each panel covers one year. See Table 2.
Figure 2.
Scenario #1: R = 0.2 mm and τ = 1 day. Comparison between the empirical water stress-function (Equation (3)) estimated with the rainfall record of the Meteorological Observatory at San Marcellino in Naples (blue) and the seismic events at the Phlegraean Fields from 2008 to 2020 (red). Each panel covers one year. See Table 2.

Figure 3.
Scenario #2: R = 0.1 mm and τ = 1 day. Comparison between the empirical water stress-function (Equation (3)) estimated with the rainfall record of the Meteorological Observatory at San Marcellino in Naples (blue) and the seismic events at the Phlegraean Fields from 2008 to 2020 (red). Each panel covers one year. See Table 2.

Figure 4.
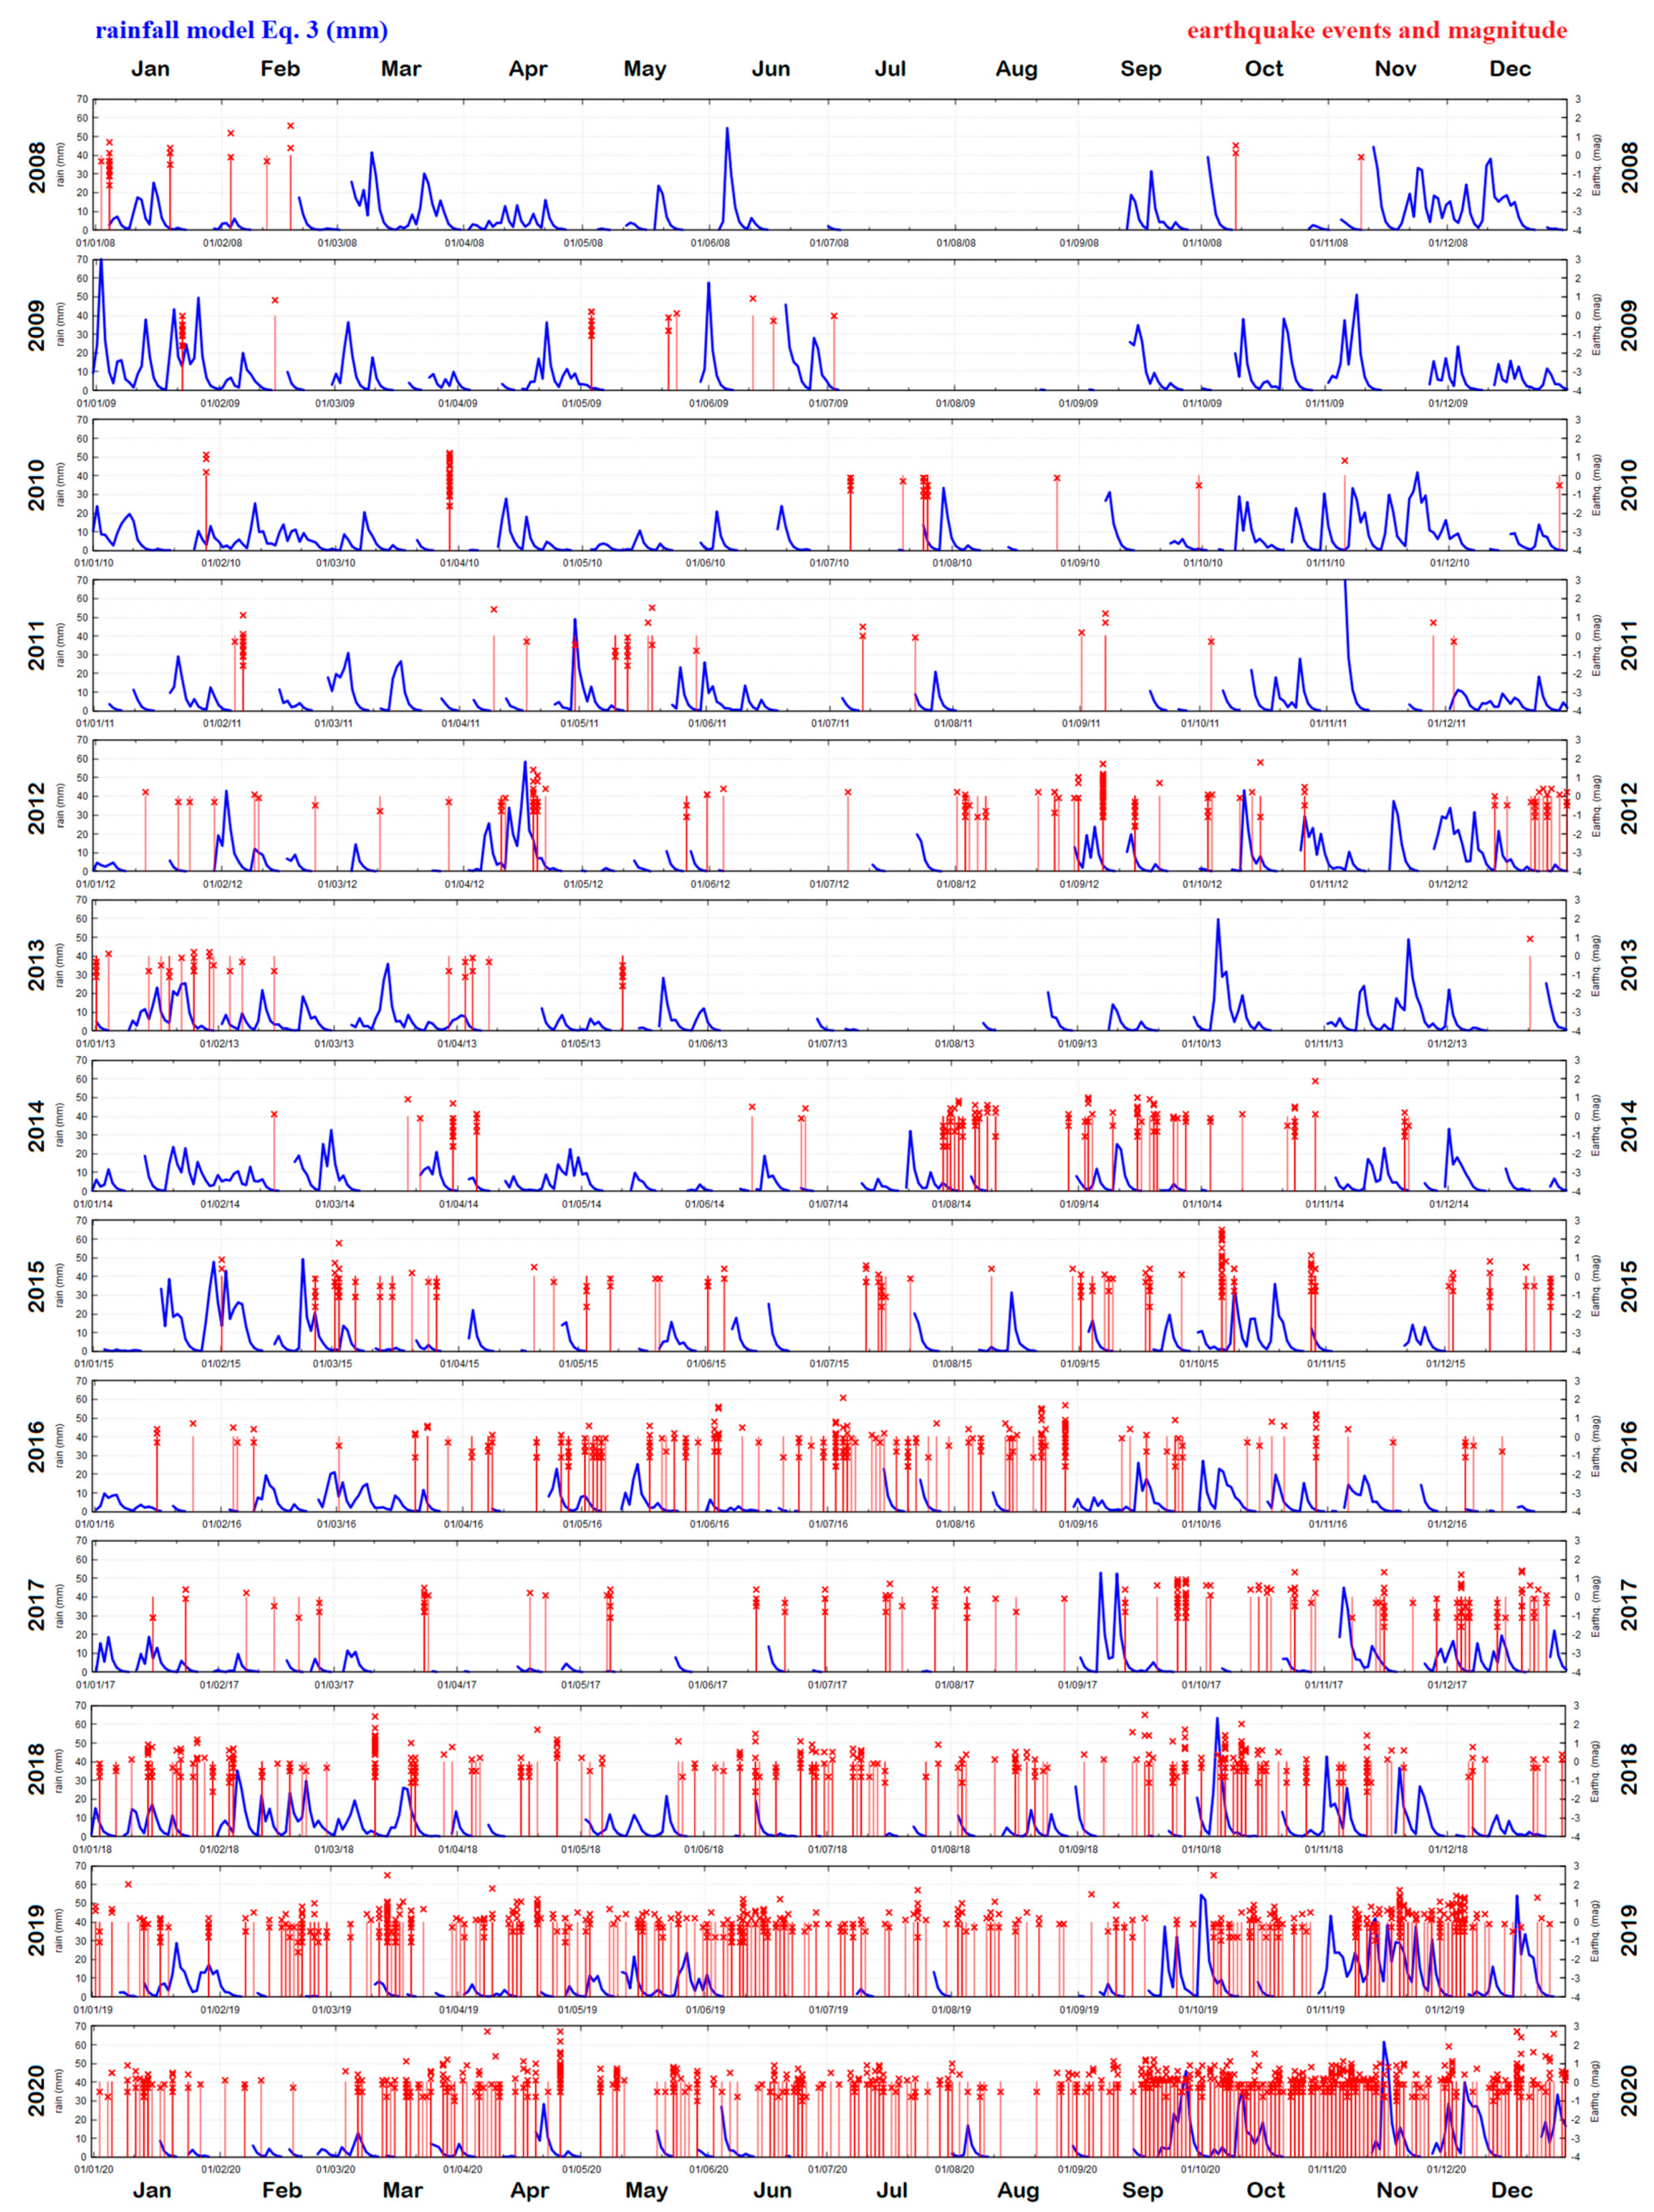
Scenario #3: R = 0.2 mm and τ = 2 day. Comparison between the empirical water stress-function (Equation (3)) estimated with the rainfall record of the Meteorological Observatory at San Marcellino in Naples (blue) and the seismic events at the Phlegraean Fields from 2008 to 2020 (red). Each panel covers one year. See Table 3.
Figure 4.
Scenario #3: R = 0.2 mm and τ = 2 day. Comparison between the empirical water stress-function (Equation (3)) estimated with the rainfall record of the Meteorological Observatory at San Marcellino in Naples (blue) and the seismic events at the Phlegraean Fields from 2008 to 2020 (red). Each panel covers one year. See Table 3.

Figure 5.
Scenario #4: R = 0.1 mm and τ = 2 day. Comparison between the empirical water stress-function (Equation (3)) estimated with the rainfall record of the Meteorological Observatory at San Marcellino in Naples (blue) and the seismic events at the Phlegraean Fields from 2008 to 2020 (red). Each panel covers one year. See Table 4.

Figure 6.
Histograms reporting the number of times the P1 and P2 value ranges occur in Table 1, Table 2, Table 3 and Table 4 from 2008–2020. The upper panel does not show any prevailing tendency, which suggests that the seismic activity exists because of the bradyseism. However, the bottom panel shows a strong prevailing tendency toward P2 ≤ 0.05 (blue) that increases from scenario #1 to scenario #4, which suggests that the seismic swarms are mostly linked to rainfalls. The results indicate that wet days enhance the seismic activity in the Phlegraean Fields.


Table 1.
Scenario #1, rain threshold R = 0.2 mm, memory τ = 1 day. The cases 0 < P ≤ 0.30 are highlighted in bold.
Table 1.
Scenario #1, rain threshold R = 0.2 mm, memory τ = 1 day. The cases 0 < P ≤ 0.30 are highlighted in bold.
| Year | DY | WD | DE | WDE | E | EWD | Rand (%) | WEQD (%) | P1 | WEQ (%) | P2 |
|---|---|---|---|---|---|---|---|---|---|---|---|
| 2008 | 366 | 195 | 8 | 3 | 53 | 46 | 53 | 38 | (0.70 ≤ p < 0.95) | 87 | (p ≤ 0.05) |
| 2009 | 365 | 204 | 8 | 3 | 162 | 155 | 56 | 38 | (0.70 ≤ p < 0.95) | 96 | (p ≤ 0.05) |
| 2010 | 365 | 237 | 10 | 6 | 124 | 19 | 65 | 60 | (0.30 < p < 0.70) | 15 | (p ≥ 0.95) |
| 2011 | 365 | 187 | 17 | 5 | 59 | 10 | 51 | 29 | (p ≥ 0.95) | 17 | (p ≥ 0.95) |
| 2012 | 366 | 183 | 47 | 26 | 225 | 186 | 50 | 55 | (0.05 < p ≤ 0.30) | 83 | (p ≤ 0.05) |
| 2013 | 365 | 212 | 18 | 14 | 47 | 27 | 58 | 78 | (p ≤ 0.05) | 57 | (0.30 < p < 0.70) |
| 2014 | 365 | 219 | 38 | 22 | 155 | 106 | 60 | 58 | (0.30 < p < 0.70) | 68 | (p ≤ 0.05) |
| 2015 | 365 | 178 | 44 | 20 | 175 | 108 | 49 | 45 | (0.30 < p < 0.70) | 62 | (p ≤ 0.05) |
| 2016 | 366 | 208 | 78 | 38 | 288 | 104 | 57 | 49 | (0.70 ≤ p < 0.95) | 36 | (p ≥ 0.95) |
| 2017 | 365 | 154 | 54 | 25 | 180 | 87 | 42 | 46 | (0.05 < p ≤ 0.30) | 48 | (p ≤ 0.05) |
| 2018 | 365 | 227 | 107 | 60 | 375 | 241 | 62 | 56 | (0.70 ≤ p < 0.95) | 64 | (0.05 < p ≤ 0.30) |
| 2019 | 365 | 194 | 180 | 87 | 592 | 322 | 53 | 48 | (p ≥ 0.95) | 54 | (0.05 < p ≤ 0.30) |
| 2020 | 366 | 165 | 209 | 97 | 776 | 364 | 45 | 46 | (0.05 < p ≤ 0.30) | 47 | (0.05 < p ≤ 0.30) |
| all | 4749 | 2563 | 818 | 406 | 3211 | 1775 | 54 | 50 | 55 |
Table 2.
Scenario #2, rain threshold R = 0.1 mm, memory τ = 1 day. The cases 0 < P ≤ 0.30 are highlighted in bold.
Table 2.
Scenario #2, rain threshold R = 0.1 mm, memory τ = 1 day. The cases 0 < P ≤ 0.30 are highlighted in bold.
| Year | DY | WD | DE | WDE | E | EWD | Rand (%) | WEQD (%) | P1 | WEQ (%) | P2 |
|---|---|---|---|---|---|---|---|---|---|---|---|
| 2008 | 366 | 211 | 8 | 4 | 53 | 47 | 58 | 50 | (0.30 < p < 0.70) | 89 | (p ≤ 0.05) |
| 2009 | 365 | 217 | 8 | 3 | 162 | 155 | 59 | 38 | (0.70 ≤ p < 0.95) | 96 | (p ≤ 0.05) |
| 2010 | 365 | 258 | 10 | 7 | 124 | 20 | 71 | 70 | (0.30 < p < 0.70) | 16 | (p ≥ 0.95) |
| 2011 | 365 | 205 | 17 | 5 | 59 | 10 | 56 | 29 | (p ≥ 0.95) | 17 | (p ≥ 0.95) |
| 2012 | 366 | 203 | 47 | 31 | 225 | 195 | 55 | 66 | (0.05 < p ≤ 0.30) | 87 | (p ≤ 0.05) |
| 2013 | 365 | 225 | 18 | 15 | 47 | 28 | 62 | 83 | (p ≤ 0.05) | 60 | (0.30 < p < 0.70) |
| 2014 | 365 | 235 | 38 | 25 | 155 | 115 | 64 | 66 | (0.30 < p < 0.70) | 74 | (p ≤ 0.05) |
| 2015 | 365 | 200 | 44 | 22 | 175 | 112 | 55 | 50 | (0.70 ≤ p < 0.95) | 64 | (p ≤ 0.05) |
| 2016 | 366 | 228 | 78 | 44 | 288 | 118 | 62 | 56 | (0.70 ≤ p < 0.95) | 41 | (p ≥ 0.95) |
| 2017 | 365 | 173 | 54 | 26 | 180 | 88 | 47 | 48 | (0.30 < p < 0.70) | 49 | (0.30 < p < 0.70) |
| 2018 | 365 | 247 | 107 | 66 | 375 | 272 | 68 | 62 | (0.70 ≤ p < 0.95) | 73 | (p ≤ 0.05) |
| 2019 | 365 | 210 | 180 | 97 | 592 | 345 | 58 | 54 | (0.70 ≤ p < 0.95) | 58 | (0.30 < p < 0.70) |
| 2020 | 366 | 180 | 209 | 106 | 776 | 381 | 49 | 51 | (0.05 < p ≤ 0.30) | 49 | (0.30 < p < 0.70) |
| all | 4749 | 2792 | 818 | 451 | 3211 | 1886 | 59 | 55 | 59 |
Table 3.
Scenario #3, rain threshold R = 0.2 mm, memory τ = 2 day. The cases 0 < P ≤ 0.30 are highlighted in bold.
Table 3.
Scenario #3, rain threshold R = 0.2 mm, memory τ = 2 day. The cases 0 < P ≤ 0.30 are highlighted in bold.
| Year | DY | WD | DE | WDE | E | EWD | Rand (%) | WEQD (%) | P1 | WEQ (%) | P2 |
|---|---|---|---|---|---|---|---|---|---|---|---|
| 2008 | 366 | 248 | 8 | 5 | 53 | 49 | 68 | 63 | (0.30 < p < 0.70) | 92 | (p ≤ 0.05) |
| 2009 | 365 | 260 | 8 | 5 | 162 | 157 | 71 | 63 | (0.70 ≤ p < 0.95) | 97 | (p ≤ 0.05) |
| 2010 | 365 | 293 | 10 | 7 | 124 | 20 | 80 | 70 | (0.70 ≤ p < 0.95) | 16 | (p ≥ 0.95) |
| 2011 | 365 | 264 | 17 | 11 | 59 | 51 | 72 | 65 | (0.70 ≤ p < 0.95) | 86 | (p ≤ 0.05) |
| 2012 | 366 | 255 | 47 | 37 | 225 | 203 | 70 | 79 | (0.05 < p ≤ 0.30) | 90 | (p ≤ 0.05) |
| 2013 | 365 | 267 | 18 | 17 | 47 | 46 | 73 | 94 | (p ≤ 0.05) | 98 | (p ≤ 0.05) |
| 2014 | 365 | 292 | 38 | 32 | 155 | 136 | 80 | 84 | (0.05 < p ≤ 0.30) | 88 | (p ≤ 0.05) |
| 2015 | 365 | 253 | 44 | 26 | 175 | 122 | 69 | 59 | (0.70 ≤ p < 0.95) | 70 | (0.30 < p < 0.70) |
| 2016 | 366 | 280 | 78 | 56 | 288 | 148 | 77 | 72 | (0.70 ≤ p < 0.95) | 51 | (p ≥ 0.95) |
| 2017 | 365 | 215 | 54 | 35 | 180 | 122 | 59 | 65 | (0.05 < p ≤ 0.30) | 68 | (p ≤ 0.05) |
| 2018 | 365 | 293 | 107 | 82 | 375 | 314 | 80 | 77 | (0.70 ≤ p < 0.95) | 84 | (p ≤ 0.05) |
| 2019 | 365 | 254 | 180 | 122 | 592 | 445 | 70 | 68 | (0.70 ≤ p < 0.95) | 75 | (p ≤ 0.05) |
| 2020 | 366 | 226 | 209 | 130 | 776 | 490 | 62 | 62 | (0.30 < p < 0.70) | 63 | (0.05 < p ≤ 0.30) |
| all | 4749 | 3400 | 818 | 565 | 3211 | 2303 | 72 | 69 | 72 |
Table 4.
Scenario #4, rain threshold R = 0.1 mm, memory τ = 2 day. The cases 0 < P ≤ 0.30 are highlighted in bold.
Table 4.
Scenario #4, rain threshold R = 0.1 mm, memory τ = 2 day. The cases 0 < P ≤ 0.30 are highlighted in bold.
| Year | DY | WD | DE | WDE | E | EWD | Rand (%) | WEQD (%) | P1 | WEQ (%) | P2 |
|---|---|---|---|---|---|---|---|---|---|---|---|
| 2008 | 366 | 262 | 8 | 6 | 53 | 50 | 72 | 75 | (0.30 < p < 0.70) | 94 | (p ≤ 0.05) |
| 2009 | 365 | 270 | 8 | 5 | 162 | 157 | 74 | 63 | (0.70 ≤ p < 0.95) | 97 | (p ≤ 0.05) |
| 2010 | 365 | 312 | 10 | 8 | 124 | 117 | 85 | 80 | (0.30 < p < 0.70) | 94 | (p ≤ 0.05) |
| 2011 | 365 | 278 | 17 | 12 | 59 | 52 | 76 | 71 | (0.70 ≤ p < 0.95) | 88 | (p ≤ 0.05) |
| 2012 | 366 | 274 | 47 | 38 | 225 | 204 | 75 | 81 | (0.05 < p ≤ 0.30) | 91 | (p ≤ 0.05) |
| 2013 | 365 | 280 | 18 | 17 | 47 | 46 | 77 | 94 | (p ≤ 0.05) | 98 | (p ≤ 0.05) |
| 2014 | 365 | 302 | 38 | 32 | 155 | 136 | 83 | 84 | (0.30 < p < 0.70) | 88 | (p ≤ 0.05) |
| 2015 | 365 | 269 | 44 | 28 | 175 | 124 | 74 | 64 | (0.70 ≤ p < 0.95) | 71 | (0.70 ≤ p < 0.95) |
| 2016 | 366 | 297 | 78 | 57 | 288 | 149 | 81 | 73 | (p ≥ 0.95) | 52 | (p ≥ 0.95) |
| 2017 | 365 | 234 | 54 | 38 | 180 | 143 | 64 | 70 | (0.05 < p ≤ 0.30) | 79 | (p ≤ 0.05) |
| 2018 | 365 | 314 | 107 | 87 | 375 | 328 | 86 | 81 | (0.70 ≤ p < 0.95) | 87 | (0.05 < p ≤ 0.30) |
| 2019 | 365 | 270 | 180 | 131 | 592 | 473 | 74 | 73 | (0.30 < p < 0.70) | 80 | (p ≤ 0.05) |
| 2020 | 366 | 245 | 209 | 139 | 776 | 531 | 67 | 67 | (0.30 < p < 0.70) | 68 | (0.05 < p ≤ 0.30) |
| all | 4749 | 3607 | 818 | 598 | 3211 | 2510 | 76 | 73 | 78 |
Publisher’s Note: MDPI stays neutral with regard to jurisdictional claims in published maps and institutional affiliations. |
© 2021 by the authors. Licensee MDPI, Basel, Switzerland. This article is an open access article distributed under the terms and conditions of the Creative Commons Attribution (CC BY) license (http://creativecommons.org/licenses/by/4.0/).
Share and Cite
MDPI and ACS Style
Scafetta, N.; Mazzarella, A. On the Rainfall Triggering of Phlegraean Fields Volcanic Tremors. Water 2021, 13, 154. https://doi.org/10.3390/w13020154
AMA Style
Scafetta N, Mazzarella A. On the Rainfall Triggering of Phlegraean Fields Volcanic Tremors. Water. 2021; 13(2):154. https://doi.org/10.3390/w13020154
Chicago/Turabian StyleScafetta, Nicola, and Adriano Mazzarella. 2021. "On the Rainfall Triggering of Phlegraean Fields Volcanic Tremors" Water 13, no. 2: 154. https://doi.org/10.3390/w13020154
Note that from the first issue of 2016, this journal uses article numbers instead of page numbers. See further details here.