Relative Abundance and Invasion Dynamics of Alien Fish Species Linked to Chemical Conditions, Ecosystem Health, Native Fish Assemblage, and Stream Order


Department of Bioscience and Biotechnology, Chungnam National University, Daejeon 34134, Korea
*
Author to whom correspondence should be addressed.
†
Indicates equal author contributions.
Water 2021, 13(2), 158; https://doi.org/10.3390/w13020158
Submission received: 11 November 2020
/
Revised: 8 January 2021
/
Accepted: 8 January 2021
/
Published: 12 January 2021
(This article belongs to the Section Biodiversity and Functionality of Aquatic Ecosystems)
Abstract
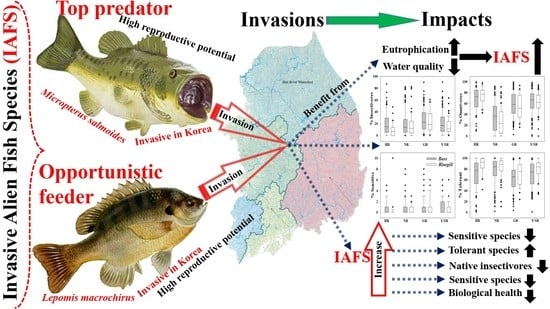
:The incidence and dispersal of invasive alien fish species (IAFS) have ecological impacts on biodiversity and environmental health at regional to global scales. We identified links between the presence of largemouth bass (Lb) and bluegill (Bg), and selected indicators of environmental water quality, trophic and tolerance guilds, ecological health factors, and stream order. We used the data collected from national biomonitoring study sites in four major rivers of South Korea. IAFS occurred in eutrophic waters (Lb = total phosphorus: 140 ± 170 µg/L, chlorophyll a: 16.7 ± 27.5 µg/L; Bg = total phosphorus: 160 ± 190 µg/L, chlorophyll a: 19.43 ± 28.05 µg/L) and dominated at higher ambient ratios of total nitrogen to total phosphorus (TN:TP). At TN:TP ≤ 100, the relative abundance of Lb and Bg was highest (95.3% and 96.0%, respectively). Concerning tolerance guilds, Lb (R2 = 0.78, p < 0.0001) and Bg (R2 = 0.59, p < 0.0001) had positive relationships with tolerant species in all four river watersheds and negative relationships with the percentages of insectivores and omnivores. This indicates the harmful impacts of IAFS on the aquatic food web. These invasive fish species also influenced stream health, particularly in the Nakdong and Yeongsan/Seomjin rivers. Our findings suggest that assessing chemical water quality can help identify the optimal and suboptimal survival and spread ranges of IAFS (Lb and Bg), as they directly influence tolerance and trophic guilds in the aquatic food web. In conclusion, these IAFS could be a major factor in the deteriorating ecosystem health, which had negative relationships with the abundance and occurrence of IAFS. Therefore, approaches that use appropriate water chemistry factors and species tolerance may provide critical insights into the efficient management of river health that has been perturbed by the presence of IAFS.
1. Introduction
Biological invasions are causing losses of biodiversity at regional to global scales [1,2]. The extent of the invasion influences the structure and size of the native community and its dynamics because of several factors, which are not limited to population responses to large-scale threats. Such factors, including climate change, environmental variations, habitat change, and ecological processes, are strongly interconnected [3,4,5,6]. These factors may affect the overall ecosystem by altering the community structure, ecosystem functions, and resultant ecological services [2,7]. Fish communities may be utterly jeopardized when a top carnivore (e.g., largemouth bass) and an opportunistic feeder (e.g., bluegill) become established and dispersed throughout a vulnerable aquatic ecosystem. Therefore, an in-depth study of successful fish invasions that considers the persistent ecological impacts of invasive alien fish species (IAFS) in lentic and lotic ecosystems is essential to achieving management priorities [8,9,10,11]. It is particularly critical in terms of environmental water quality, establishment, and expansion of these species to the recipient ecosystems.
With the deterioration of aquatic ecosystems, the abundance and diversity of fish species have been continuously declining in South Korea [12,13]. This decline has resulted in a reduction in sensitive species (SS) and an increase of tolerant species (TS) in streams and rivers [14,15]. Consequently, water resource management decisions, based on water quality assessment, have shifted toward the biological management of fish species in inland waters [16,17,18,19,20]. Using the index of biological integrity (IBI) introduced by Karr [21] is the most common method of diagnosing and evaluating aquatic ecosystems based on fish assemblages [22,23,24].
According to the IBI, every ecosystem comprises biological assemblages that undergo continuous intraspecific and interspecific environmental interactions. Furthermore, IBI is widely applicable due to its political and social implications as described in, for instance, European Water Framework Directive 2000/60/EC, as well as has a broad range of usage not limited to streams but widely used for ecological health assessment of natural [25] and artificial lakes [26], and coastal areas [27]. Therefore, evaluating and comparing the health of streams with pristine ecosystems could yield vital links between changes in ecological integrity and ecosystem processes [28,29,30,31]. Fish populations include species of various tolerance levels (SS, intermediate species [IS], and TS) and trophic guilds (herbivores, carnivores, insectivores, and omnivores). Such species traits may provide critically valuable insights for integrated management and analysis of vulnerable aquatic ecosystems [32,33,34]. At the same time, it is also essential to examine the degradation of water quality and habitat and its effects on fish communities, as these factors could predict cryptic shifts in fish communities and the presence of IAFS [35,36,37].
Micropterus salmoides (largemouth bass: Lb) and Lepomis macrochirus (bluegill: Bg) are designated harmful ecosystem-disturbing fish species in South Korea. In reservoirs and slow-flowing waters, native fish species are under grave threat from largemouth bass [15,38,39]. Numerous studies have revealed the tolerance and trophic traits of various fish species [21,40,41], indicating particular links with water chemistry, organic matter loads, specific nutrients (total nitrogen (TN) and total phosphorus (TP)), and ambient nutrient ratios. For example, TS and omnivorous species are regularly observed in polluted regions, whereas SS and insectivorous species prefer relatively clean and fast-flowing (riffle) zones [42,43]. Such characteristics of indicator guilds are fundamental tools for evaluating the relationships between ecosystem health, water chemistry, fish assemblages, and IAFS in lotic ecosystems [44,45,46,47].
The habitat selection and exploitation, spawning, and feeding patterns of largemouth bass and bluegill are identical [38,41]. In addition, the tolerance attributes of these two fish species are the same. Therefore, comparative analyses of the tolerance ranges of these two species in terms of water chemistry could yield valuable links for evaluating riverine ecosystem health in the presence of invasive fish species. However, almost no recent research is available on the relationships and dynamics among the relative abundance (RA) of largemouth bass and bluegill populations, water quality variables, and the ecological health of riverine waters. It is essential to mention that the invasive species trigger the degradation of a suite of ecosystem services, including recreational fishing, native fish breeding and feeding grounds, water chemistry, and indirectly inflict economic lassoes, making it imperative to understand their invasion dynamics at the watershed scale.
Therefore, we investigated the links among selected environmental variables, the presence and dispersal of IAFS, and ecological health based on fish assemblages in four major rivers in South Korea. We also identified the tolerance ranges of these two fish species according to physicochemical water quality parameters. We explored whether the tolerance guilds of these two species indicate ecosystem health, as represented by physicochemical water quality parameters and the fish community’s characteristics. Furthermore, we investigated the relationships between IAFS and stream order in four major river basins as well as the overall ecological health of the river basin. Finally, we estimated the dynamic interactions between largemouth bass and bluegill populations in relation to environmental guilds.
2. Materials and Methods
2.1. Biological Overview of the Selected Invasive Fish Species
There are several exotic invasive fish species in South Korean freshwater ecosystems that are actively damaging those ecosystems. However, largemouth bass and bluegill are some of the most damaging fish species. Therefore, we will discuss these two species as follows.
2.1.1. Largemouth Bass
Largemouth bass, which falls within the Perciforms (Centrarchidae), is an apex predator in the aquatic food chain that can cause a significant disturbance in aquatic ecosystems [37,38]. Since its introduction to extensive parts of the world, it has become widely established. The presence of aquatic vegetation enhances adult largemouth bass’s foraging efficiency and provides shelter to juveniles, protecting them against predation [39,41]. This species can thrive in rivers with little or no flowing water, indicating high tolerance for unfavorable conditions. It is a robust carnivorous species that usually preys on fish, aquatic insects, and shrimp [48,49].
2.1.2. Bluegill
Bluegill, the most common sunfish species, is native to the lakes and rivers of North America [50]. It has general feeding preferences, including prey from zooplankton to small vertebrates, and is considered an opportunistic feeder [51]. Where naturalized, it puts enormous pressure on native fish fauna, which can result in threats to and even extinction of native species [46]. Because of its numerous ecosystem-disrupting traits, bluegill’s release is strongly forbidden in South Korea by the Korean Ministry of Environment (MOE) [52]. Bluegill has shown a propensity for high fertility relative to native fish species. It inhabits shallow waters that include grassy areas with a depth of approximately 1 m. When the water temperature drops, it moves to pool areas for overwintering, which allows it to survive under unfavorable environmental conditions [53].
2.2. Study Area
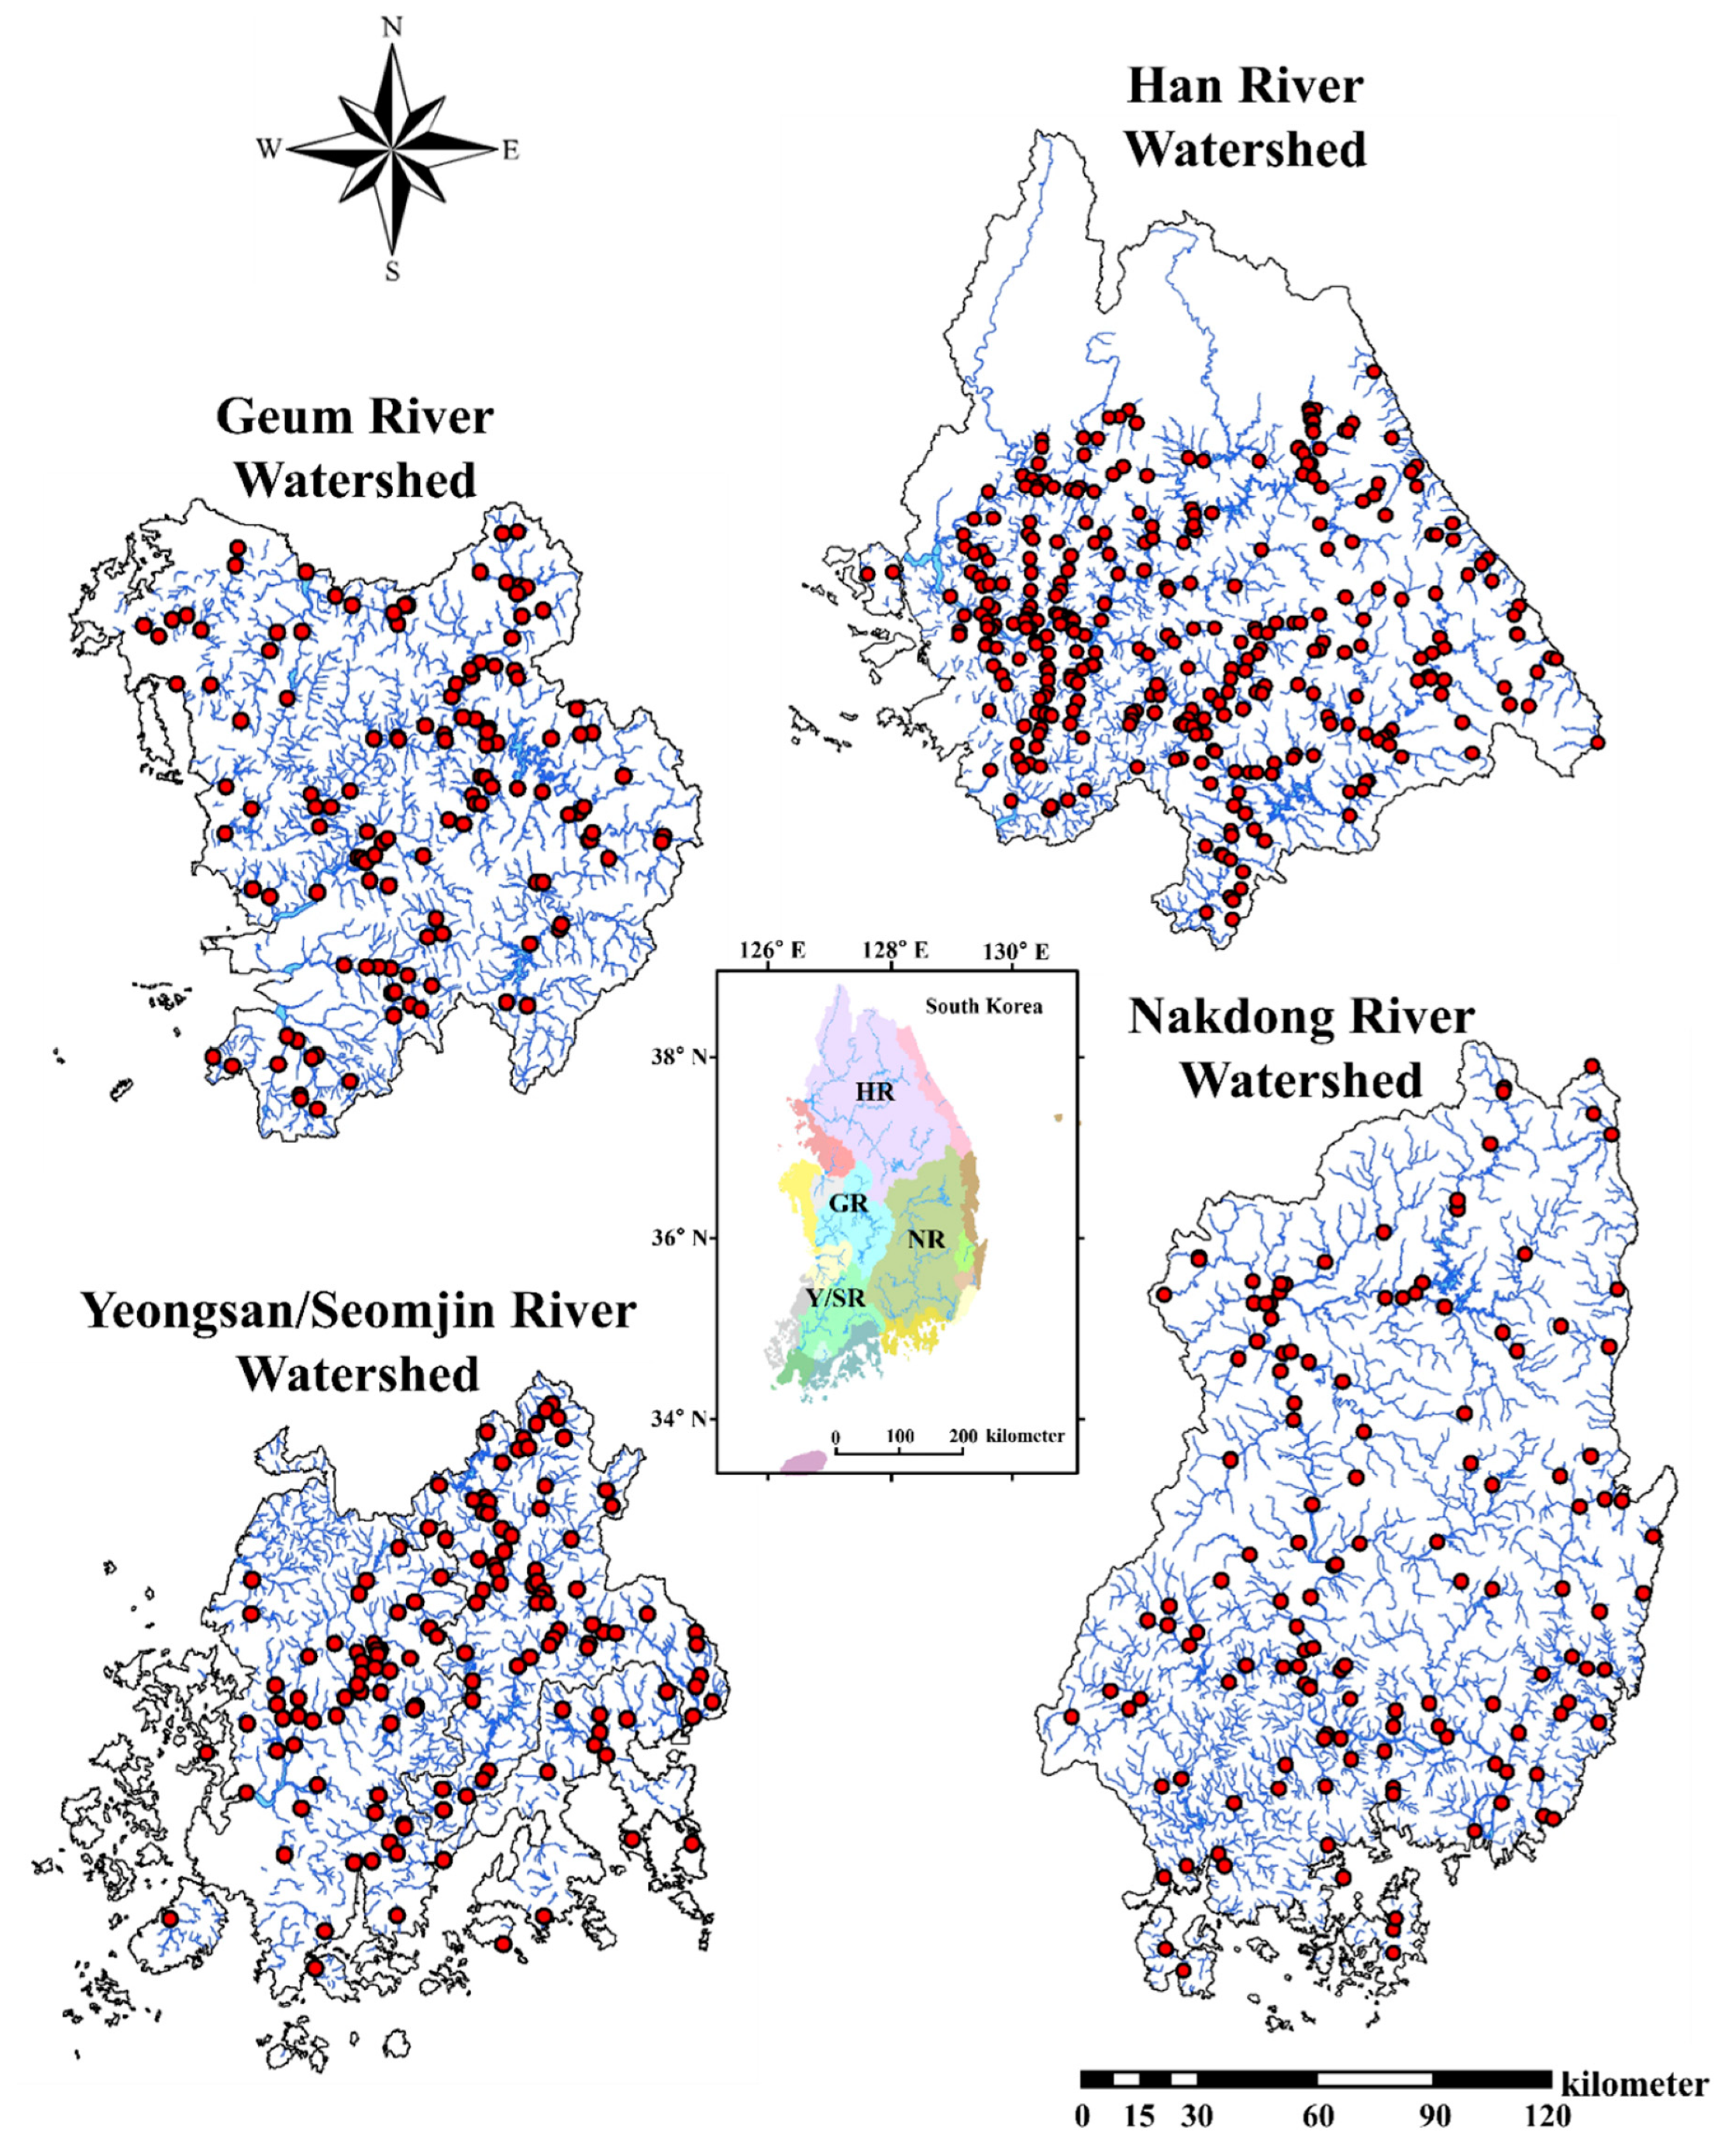
This study was conducted in the watersheds of four major rivers in South Korea: Han River (HR; total length: 514 km, watershed area: 26,219 km2), Geum River (GR; total length: 414 km, watershed area: 9886 km2), Nakdong River (NR; total length: 525 km, watershed area: 23,860 km2), and Yeongsan/Seomjin River (Y/SR; total length: 348 km, watershed area: 8267 km2). We treated the Yeongsan and Seomjin rivers as one watershed because of similar geographic settings, and climate, fish fauna, anthropic pressures, as well as to equalize the watershed size of the other three river basins. The sampling stations were located in streams ranging from first to sixth orders based on the Strahler [54] classification system. The boundaries of the targeted watersheds are shown in Figure 1. Geographic, demographic, and hydrological details are provided in Table 1. This study spanned two consecutive years, 2008–2009, at study stations designated by the Korean MOE for national biomonitoring. The number of sites surveyed was 640 in 2008 (HR: 320, GR: 100, NR: 100, and Y/SR: 120) and 720 in 2009 (HR: 320, GR: 130, NR: 130, and Y/SR: 140). These sites were sampled twice per year during the study period. The land-use configurations in the four major rivers’ basins were unique in each watershed, as were the locations of point and nonpoint sources. For example, the upper HR watershed is mostly forest, whereas the downstream area of HR is an urban population center. The GR and NR watersheds share identical longitudinal gradients and receive anthropogenic impacts, whereas Y/SR is mainly cropland.
2.3. Fish Sampling
Field sampling of fish was conducted twice per year in the pre-monsoon (April–June) and post-monsoon (September–October) seasons of 2008–2009. We used the wading method of An et al. [44] and the MOE National Institute of Environmental Research (NIER) approved methods [55], which was modified from the U.S. Environmental Protection Agency (US EPA) method [38] based on catch per unit effort (CPUE). During sampling events, we considered all habitat types, including riffles, runs, and pools. We also considered the origin of fish species (native or exotic). We sampled an upstream to downstream reach of at least 200 m length for 50 min. The fish sampling gears used included cast net (5 × 5 mm; CN) and kick net (3 × 3 mm; KN), while no other gears were used due to the MOE restrictions. All fish were identified to the species level on-site using the identification key compiled by Kim and Park [56] and the taxonomic classification system of Nelson [57], then released immediately. All captured fish specimens were carefully examined for any external anomalies such as deformities (D), erosion (E), lesions (L), and tumors (T), collectively referred to as DELT, based on Sanders et al. [58].
2.4. Analysis of Ecological Indicators
The presence of invasive fish species is mainly associated with a change in various ecological indicators, including riverine water chemistry. We used the US EPA [42] and Karr [21] methodology to elucidate those relationships between fish assemblages and water chemistry indicators by sorting species into guilds based on tolerance and trophic level. Based on Barbour et al. [43], the tolerance guild structure was composed of sensitive species (SS), intermediate species (IS), and tolerant species (TS). In this structure, the SS group contained species that cannot tolerate degraded water quality or a perturbed habitat and may disappear or be displaced rapidly in lotic ecosystems. However, the TS group includes fish species that increased in their relative abundance despite the degradation of water quality and habitat. Meanwhile, the IS group contained all the fish species that do not fit neatly into the SS and TS groups. Similarly, we applied the trophic guild grouping considering omnivore (O), insectivore (I), carnivore (C), and herbivore (H) species. Barbour et al. [43] described omnivore proportions increased with decreasing water quality, whereas insectivore proportions decreased as water quality deteriorates.
2.5. IBI for Ecosystem Health Analyses
The IBI theory states that diverse fish communities and assemblages react predictably to or are displaced by modification and degradation of habitat and water quality. For example, decreasing biotic integrity indicates structural modifications in total native, TS, and SS fish populations [59,60]. The IBI is composed of eight metrics divided into three main classes: species richness and composition, trophic and tolerance guild compositions, and total fish abundance. Each metric represents a specific type of fish assemblage, thereby covering nearly all fish found in Korean freshwater bodies. The metrics are M1: total number of native species, M2: number of riffle-benthic species, M3: number of SS, M4: proportion of individuals that are TS, M5: proportion of individuals that are omnivorous species, M6: proportion of individuals that are insectivorous species, M7: total number of native individuals, and M8: proportion of individuals that are abnormal species. The four of the eight metrics, namely, M1, M2, M3, and M7, were evaluated in the famous maximum species richness line (MSRL) concept presented by Rankin and Yoder [61] in relation to stream order. Each metric has ascribed a score of 5, 3, or 1, and we obtained the final health assessment by summing all scores. Finally, based on the total scores, sites were placed into five categories: excellent (Ex; 40–36), good (G; 34–28), fair (F; 26–20), poor (P; 18–14), or very poor (VP; 13–8).
2.6. Physicochemical Analyses of Water Quality
Selected water quality parameters were monitored monthly at designated study sites of national biomonitoring survey in the four major river basins. The parameters were chosen on the assumption that changes in these factors may indicate conditions that support endemic or invasive fish species. All the tested water quality parameters are independent parameters that were measured separately. The parameters included biological oxygen demand (BOD), chemical oxygen demand (COD), TN, nitrate-nitrogen (NO3-N), ammonia nitrogen (NH4-N), TP, total suspended solids (TSS), and electrical conductivity (EC). Water samples 1 L in volume were collected in polyethylene bottles, stored in a dark icebox to avoid light-induced chemical reactions, and transported from the study site to the laboratory. TN was appraised through the second derivative method following a digestion protocol in a persulfate solution [62]. NH4-N and NO3-N were evaluated with the phenate method and ion chromatography, respectively, followed by filtration of the extract from the source sample through coarse glass fiber (GF/C) filters (Whatman, Maidstone, UK). TP was assessed through the ascorbic acid technique followed by persulfate oxidation [63]. EC, COD, BOD, and TSS were estimated with standard methods [42,64,65]. Analyses of nutrients (TN, TP) and their allied chemical species were executed in triplicate, whereas BOD testing was duplicated [42,64].
2.7. Statistical Analyses
We conducted linear regression on log-transformed data representing native and invasive fish assemblages and water chemistry results. The total number of sites where largemouth bass was sampled (n = 527) was considered its presence level, and the bluegill presence level was determined in the same manner (n = 178). The difference between the feeding guild classes of the largemouth bass and bluegill was calculated from the presence sites at the interval of five and the percent of fish species from each fish guild was plotted with the help of Sigma plot. Then we checked the regression relationships among the classes. Regression analysis was also performed on the basis of presence data with the help of Sigma Plot. The percentages of trophic and tolerance guilds at the watershed scale were calculated based on invasive species presence data. However, this is important to mention that largemouth bass and bluegill are not the only fish species present in the four major rivers watershed. The compelling reason for selecting these two species as IAS include their wider distribution and potential ecological damaging activities that jeopardize the local fish communities. We used Sigma Plot (ver. 14.0) to make illustrations, and means and standard deviations were calculated with SPSS Statistics ver. 22 (IBM, Armonk, NY, USA). Furthermore, we used a t-test to identify significant differences in water quality factors and invasive fish species. Our study targeted the different aspects of largemouth bass and bluegill only as they are reportedly posing serious management challenges to the South Korean freshwater ecosystems. Given many study sites, we visually analyzed relationships based on the significant fish assemblages present and selected water quality parameters. For those analyses, we calculated IBI values following the Korea IBI model. Furthermore, we identified superficial relationships between selected parameters using regression and correlation techniques.
3. Results and Discussion
3.1. Ambient Water Chemistry and Invasive Species
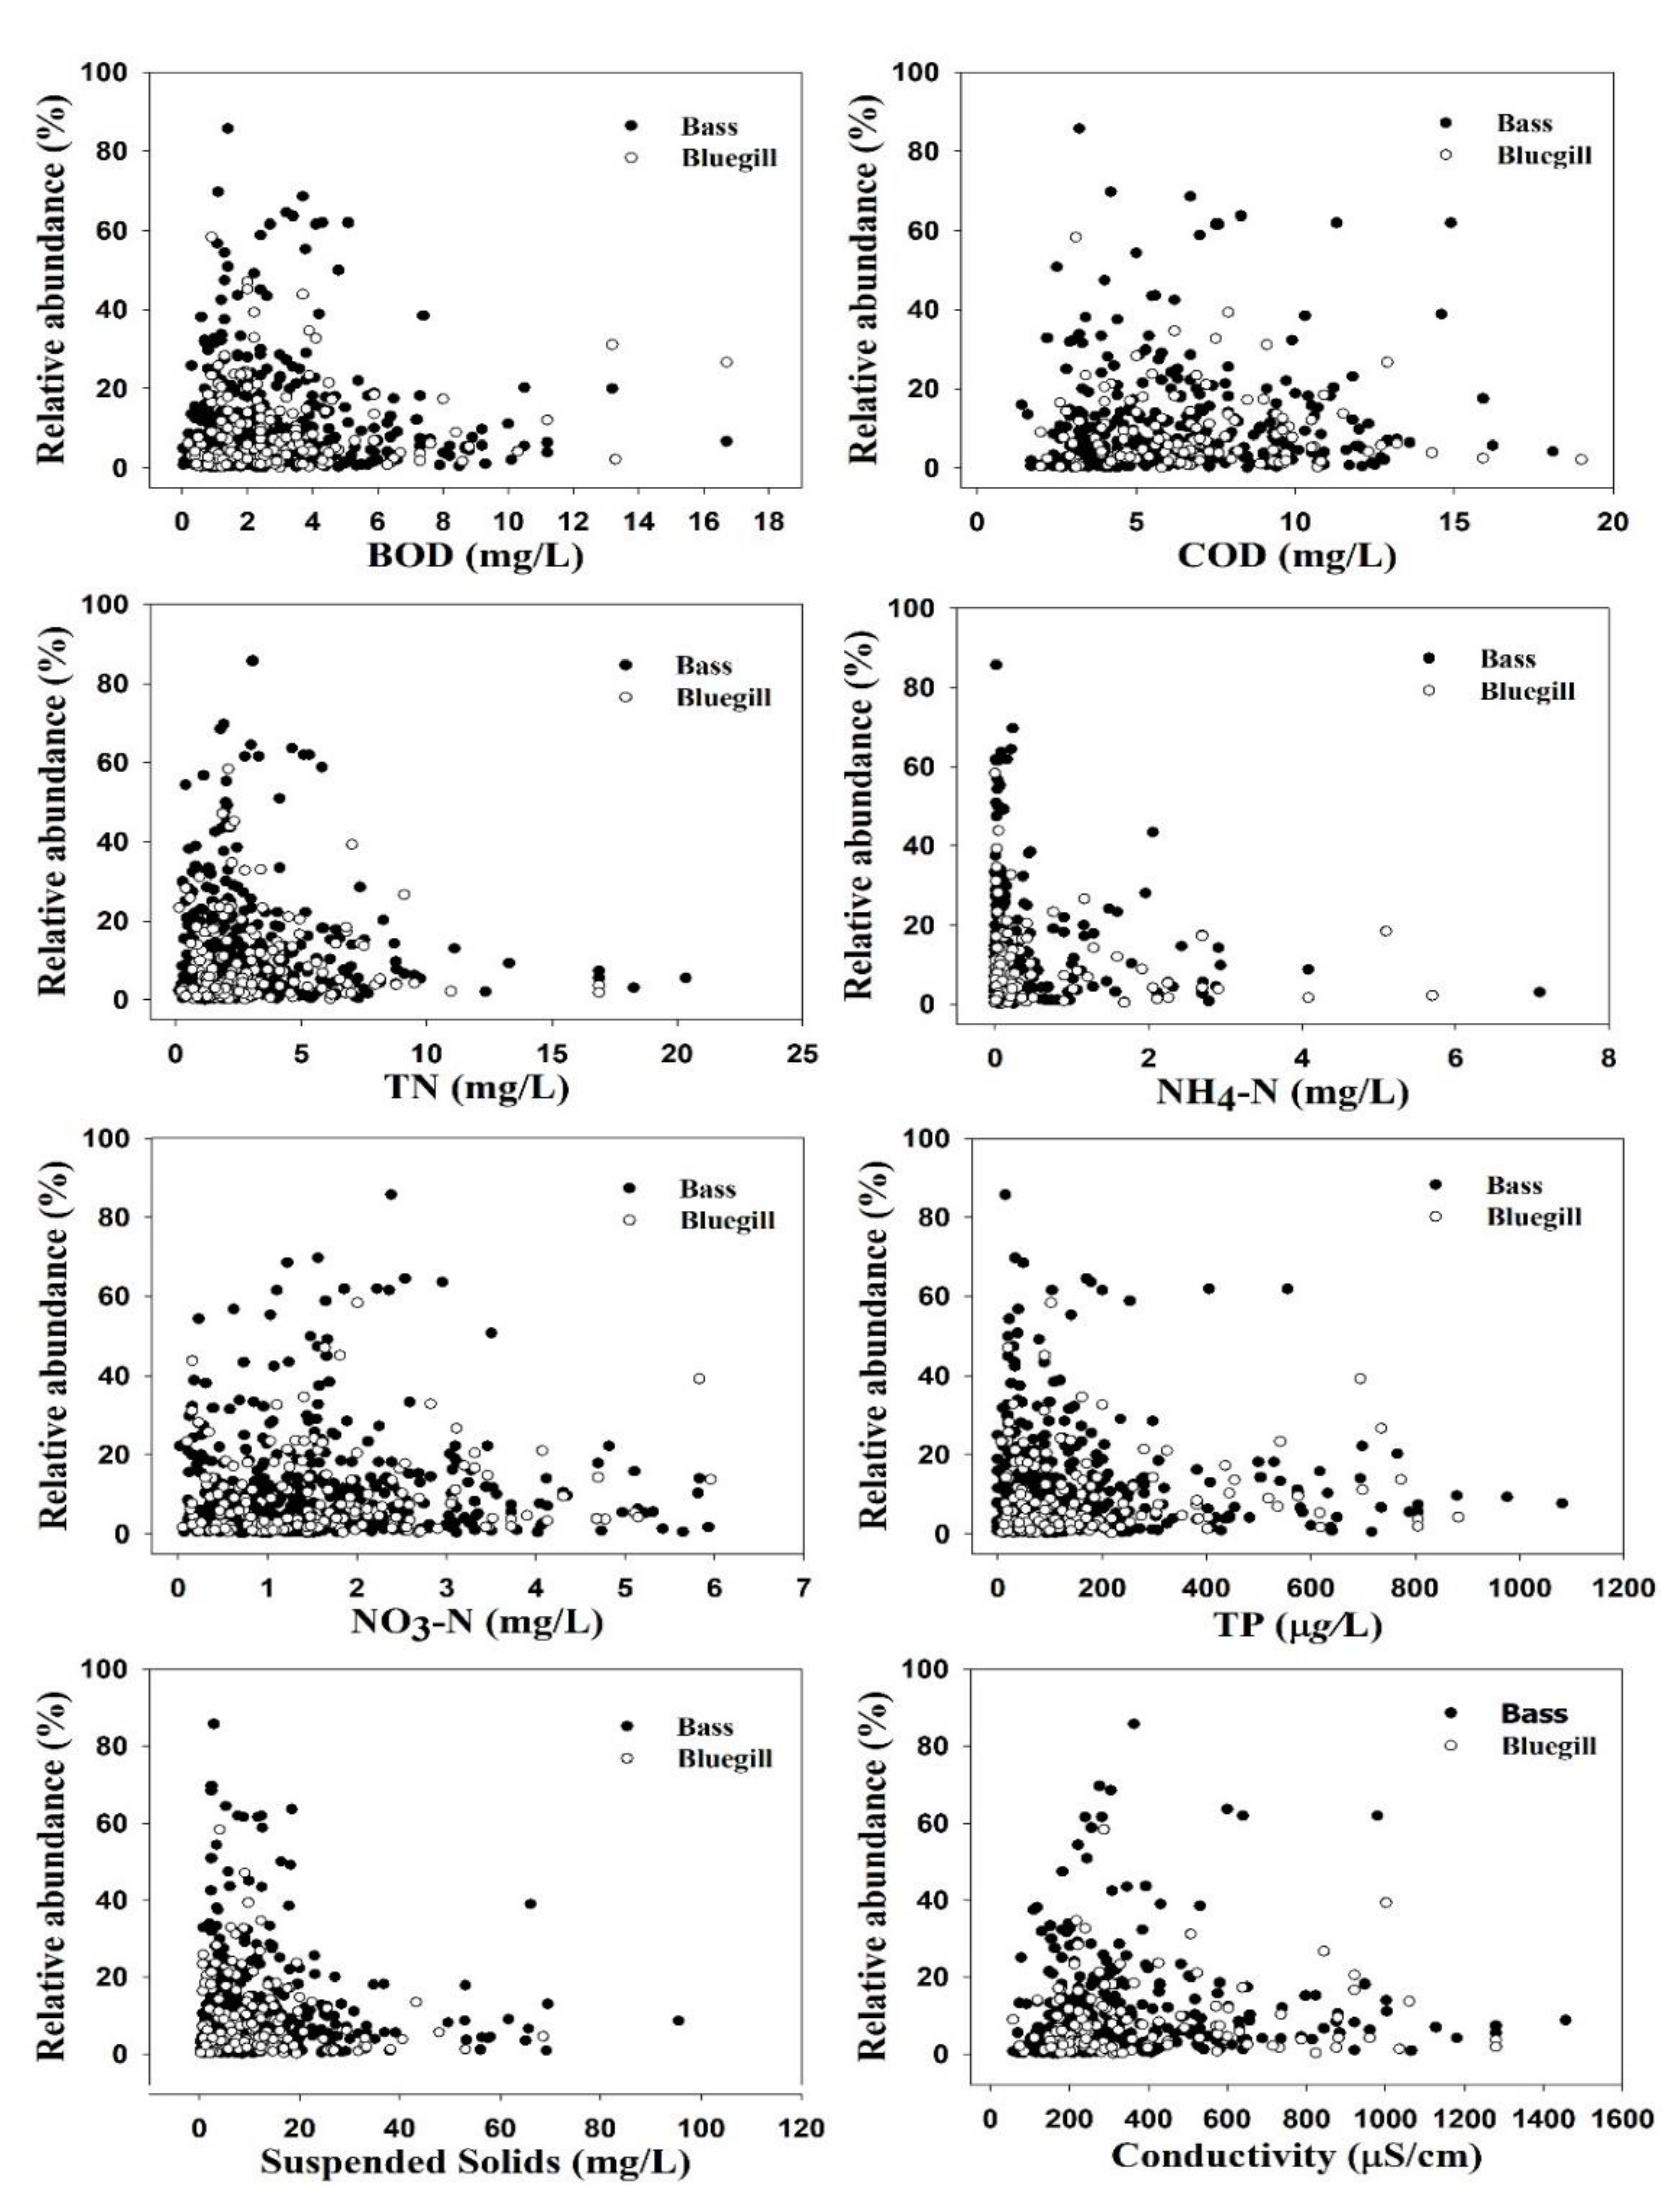
We investigated the relationships between IAFS and ambient water quality factors, and the results indicated that tolerance ranges and water quality parameters (TP, TN, NO-N3, NH4-N, EC, BOD, COD, and TSS) had a broad range of interactions (Table 2). With the exception of EC (F = 8.06, t = –2.565, p = 0.011), the water chemistry variables showed no statistically significant differences by population (p > 0.05). The means of all water quality variables except TSS (12.25 ± 12.6) and COD (6.15 ± 2.9) were lower for largemouth bass populations than bluegill. This result supports the notion that largemouth bass is a hardy species that increases its tolerance range when exposed to deteriorating water quality. The negative sign before the t value in Table 2 indicates that the sample means less than the hypothesized mean, supporting the alternative hypothesis. Therefore, both fish species distributions are mainly dependent on the range of tolerance to ambient water quality. This hypothesis is supported by the higher number (n) of largemouth bass individuals sampled relative to bluegill, with n ranges of 381–532 and 125–178, respectively.
The ranges of NH3-N, EC, BOD, and COD indicate that bluegill has the potential to thrive at higher levels of critical organic matter. We created separate scatter plots relating to the two invader species distributions with selected water quality parameters (Figure 2). Another notable result revealed by the final range of values is that largemouth bass is better able to tolerate significantly elevated levels of TP (0–1080 µg/L) and chlorophyll-a (0–252.3 µg/L), which corroborates recent local studies in South Korea [46]. The preference for lower levels of parameters that could hamper water clarity may be related to visibility, as largemouth bass depends on sight to select its prey.
We further tested the likelihood of the presence of largemouth bass and bluegill based on levels of ambient nutrients (TN, TP, and chlorophyll a) and their ratios, and the results showed that both species preferred eutrophic bodies of water (Table 3). The values (mean ± standard deviation, and range) for percent RA (%RA) of two invaders are presented. Note that phosphorus and nitrogen act as limiting factors in the ecosystem, and additional supply leads to intense eutrophication. However, in South Korea, lotic waters have gradually become more nitrogen-rich, causing phosphorus to be the limiting factor in most circumstances. As indicated by ambient TN:TP ratios, most largemouth bass (RA = 95.3%) and bluegill (RA = 96.0%) were distributed at TN:TP ≤ 100, whereas neither species was observed at TN:TP > 300. We found that both species were found in waters with either eutrophic or mesotrophic nutrient levels when we used TN and TP separately to distinguish sites into oligotrophic, mesotrophic, and eutrophic ranges. Furthermore, the highest %RA for largemouth bass (42.5) and bluegill (44.3) was recorded in eutrophic waters (TP > 0.1 µg/L).
Deciphering the potential abiotic and biotic factors that render lotic ecosystems vulnerable to likely invasive species and predicting observable distribution patterns has long been a significant challenge in freshwater ecology [35,66]. Available data indicate that IAFS have greater diversity and richness in new and disrupted aquatic ecosystems relative to stable biotic and abiotic environments [67,68,69]. Therefore, water chemistry and habitat are critical factors for identifying ecosystems threatened by impending invasions [70,71].
3.2. Ecological Guild Dynamics and RA of Invasive Species
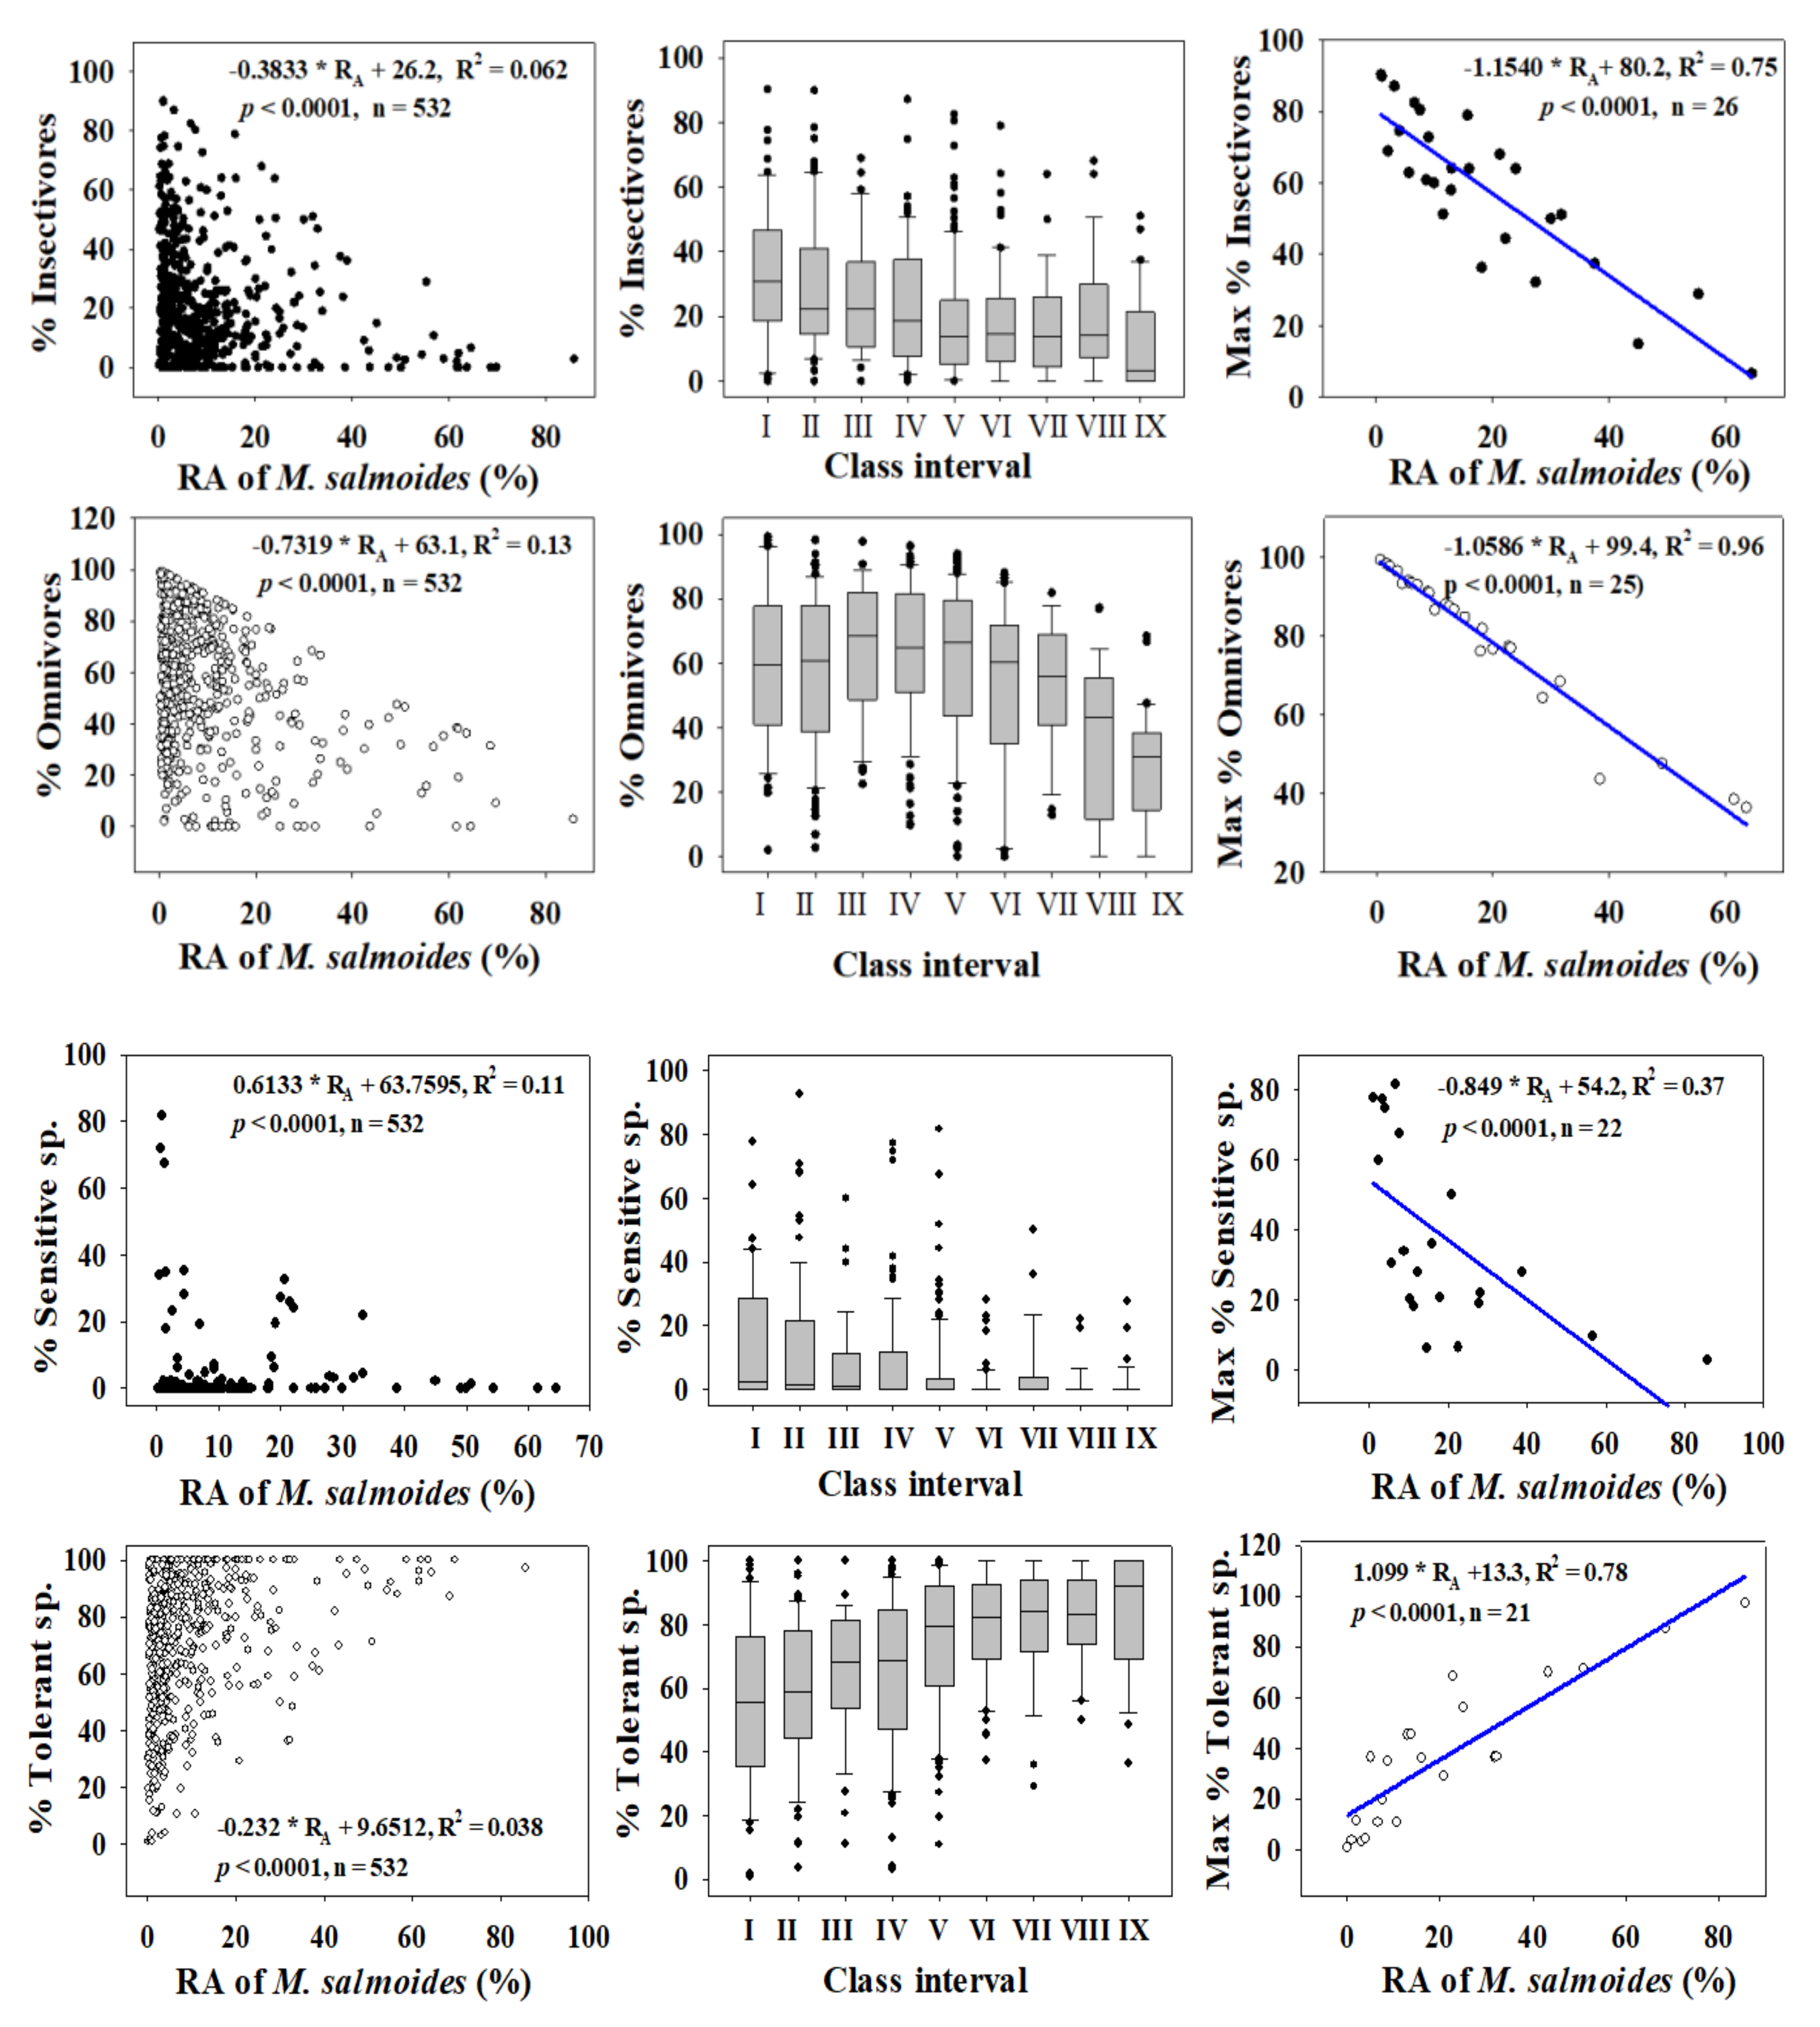
We investigated the dynamics of %RA, as well as those of trophic and tolerance guilds, to determine the distributions of trophic and tolerance assemblages and to clarify their trends through regression modelling for largemouth bass (Figure 3) and bluegill (Figure 4) in four major rivers in South Korea. We used the assemblage class intervals to identify spatial trends in the numbers of largemouth bass and bluegill individuals collected.
Trophic guild analyses showed that the maximum percentages of insectivores (R2 = 0.75) and omnivores (R2 = 0.96) had strong negative relationships with the %RA of largemouth bass. However, the percentages of insectivores (R2 = 0.062, p < 0.0001) and omnivores (R2 = 0.13, p < 0.0001) were inversely linked to the %RA of largemouth bass in the four major rivers.
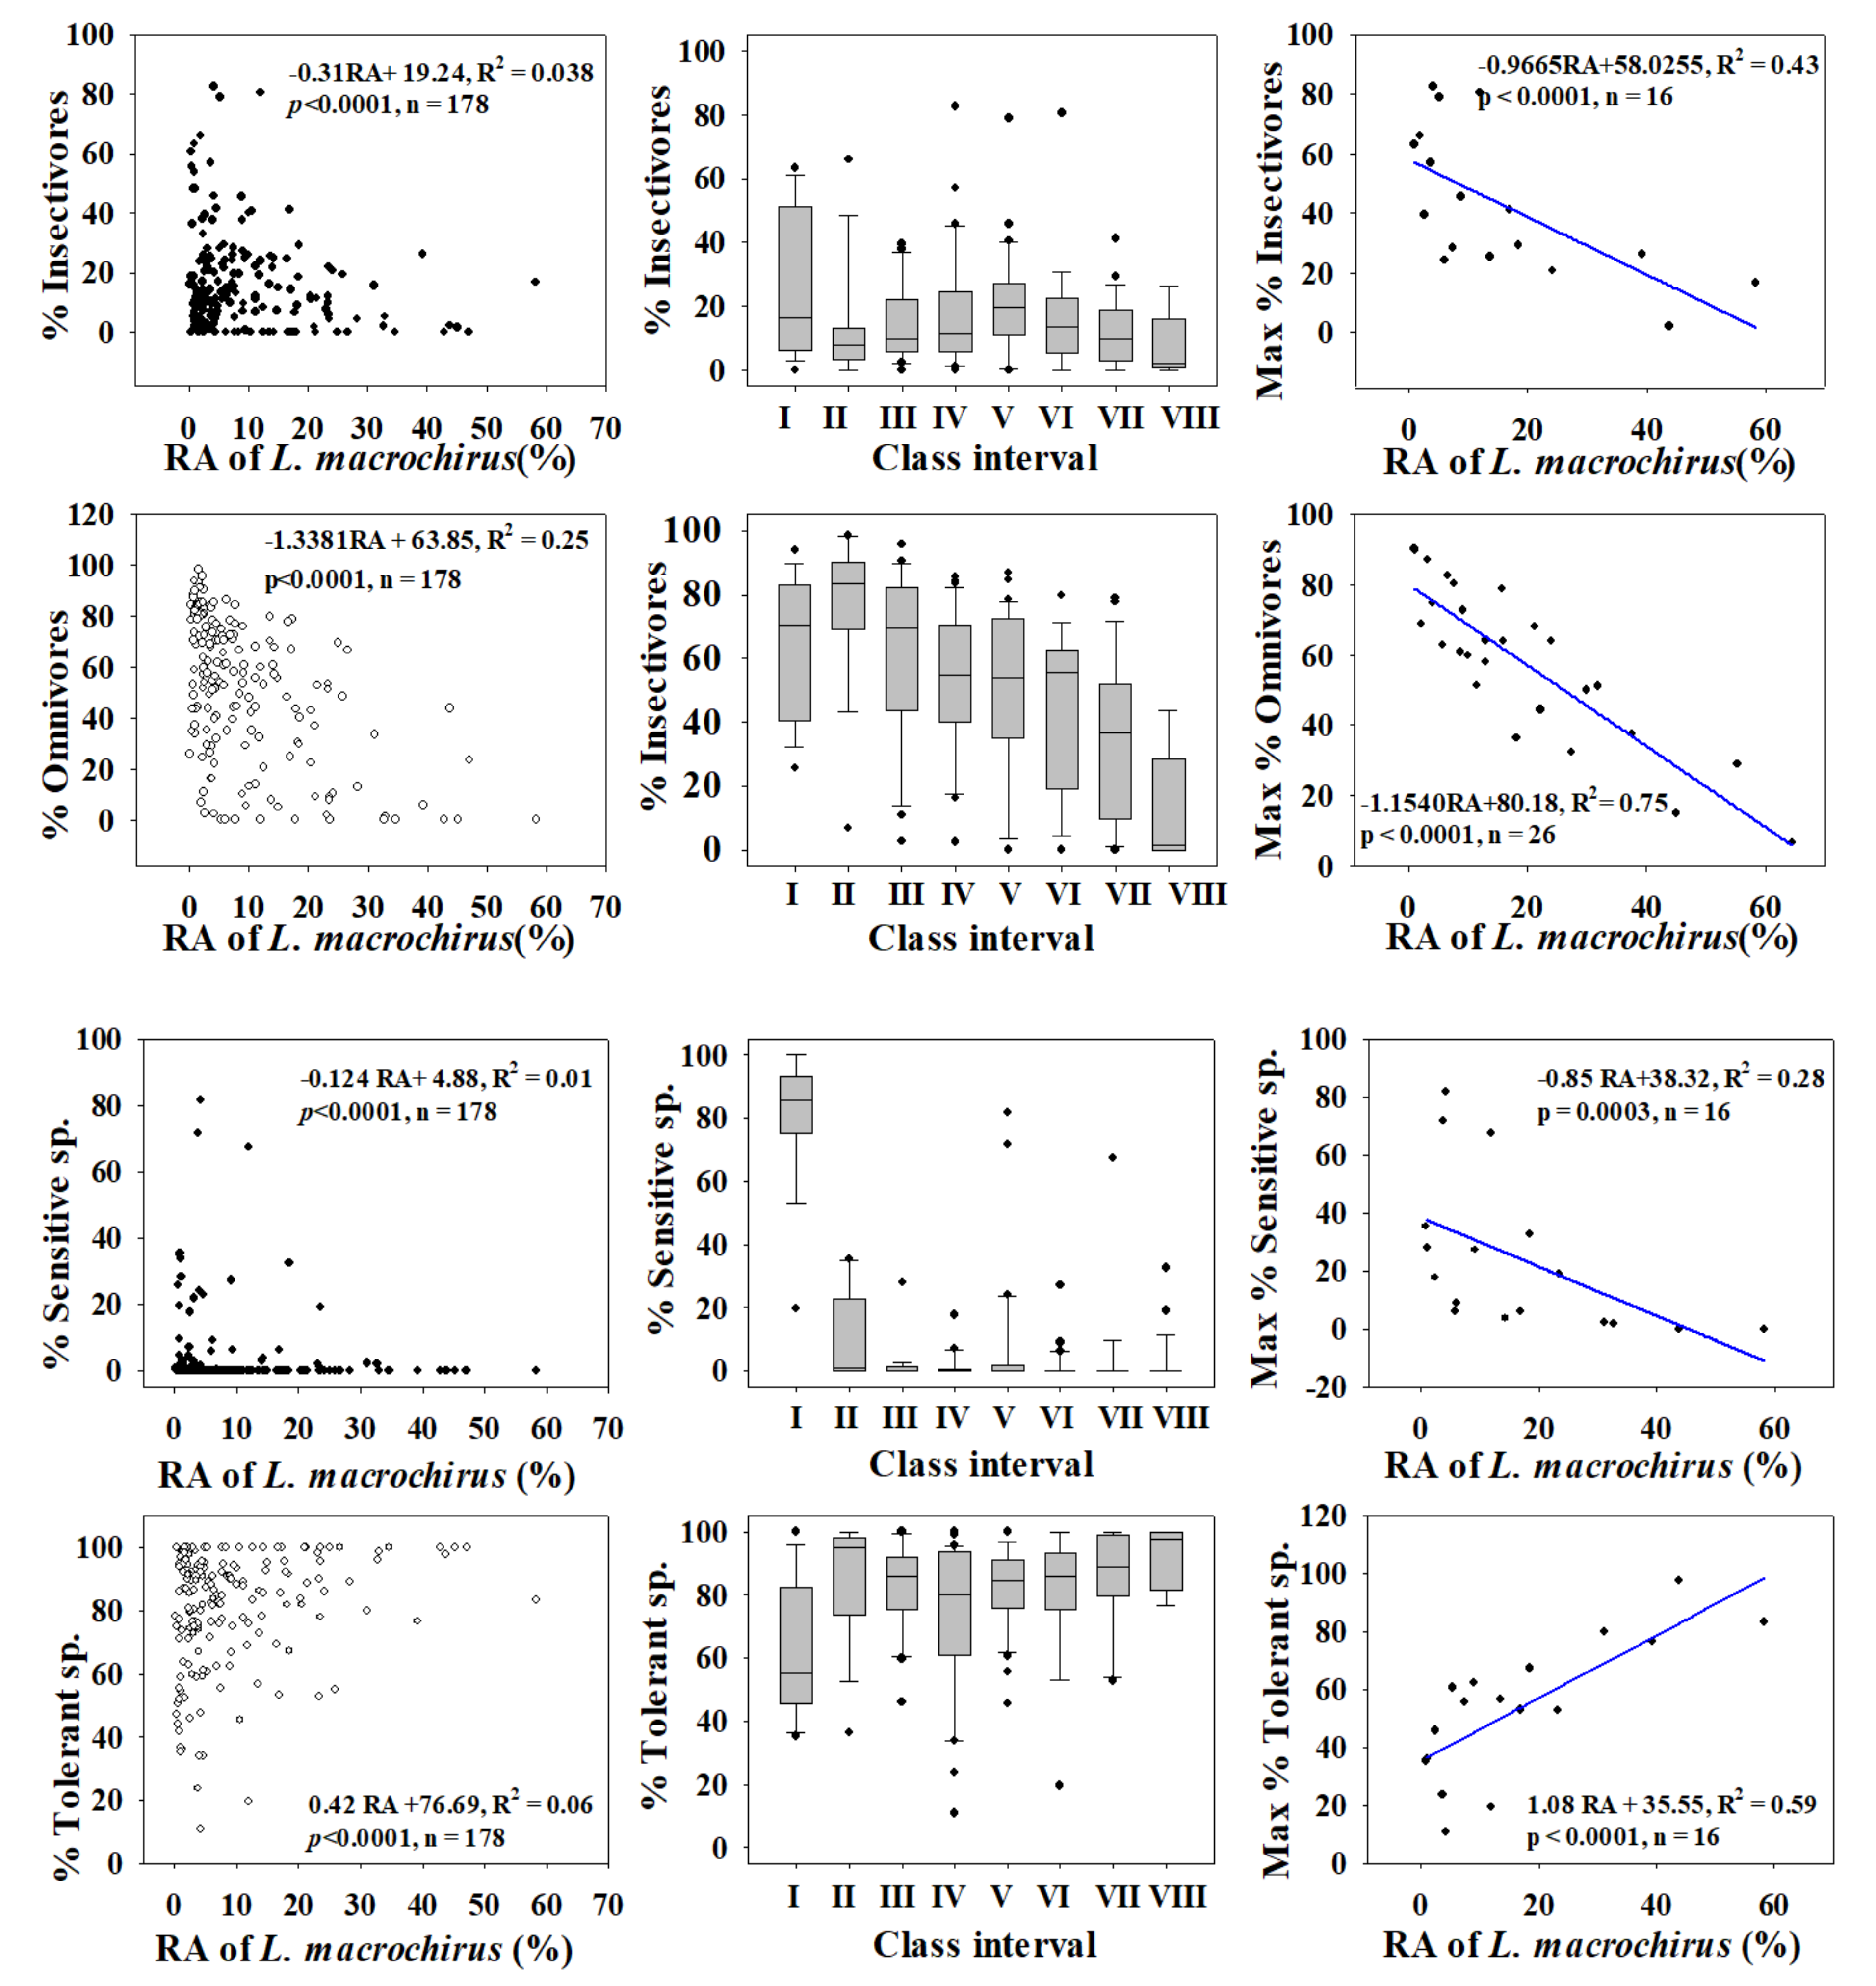
Relations with trophic guild compositions showed similar trends for bluegill, with a slightly greater intensity of impacts. As the RA of bluegill increased, the percentages of insectivores (R2 = 0.038, p < 0.0001) and omnivores (R2 = 0.25, p < 0.0001) decreased. The maximum percentages of insectivores (R2 = 0.43) and omnivores (R2 = 0.75) decreased as the bluegill RA increased. The strong negative trend between trophic guild (omnivore and insectivore) assemblages and largemouth bass highlights the impact of a top predator on food webs at the habitat and ecosystem levels. This finding provides an impetus for managing rivers and streams to mitigate the impacts of invasions.
Tolerance guild analyses showed varying degrees of impact on SS and TS of invasive species. The proportion of SS decreased as the RA of largemouth bass increased (R2 = 0.11, p < 0.0001), whereas TS increased (R2 = 0.038, p < 0.0001). However, the proportion of SS showed a smaller decline with increasing the bluegill population (R2 = 0.01, p < 0.0001), and the abundance of TS increased (R2 = 0.06, p < 0.0001).
We confirmed this result using the distribution of class intervals for both tolerance guilds. The RA of SS decreased similarly with largemouth bass (R2 = 0.37, p < 0.0001) and bluegill populations (R2 = 0.28, p = 0.0003). Tolerant assemblages increased in the presence of invaders, a clear indication of the survival of only hardy species in the face of ecological degradation in lotic bodies of water. It is interesting that the minimum TS appears to show the opposite trend relative to the maximum SS, further illustrating the ecological crisis associated with the presence of invaders. The proliferation of SS suggests better ecological health, whereas intensification of TS indicates a declining ecology [12,15,23,42,72]. The present findings show that these two species impact lotic ecosystems by altering the trophic and tolerance guilds, with diverse impacts on native fish assemblages.
3.3. Ecosystem Health Dynamics and Invasive Species
We investigated the dynamics of ecosystem health by applying the IBI to four major river watersheds, evaluating individual study sites, combining the results for each study site’s ecological health, and obtaining the overall ecosystem health, as shown in Table 4. The total number of native fish species had above-average scores in all watersheds except NR (2.14), which showed a propensity toward declining native fish abundance. The total number of riffle-benthic species decreased at all sites except HR (2.49), in particular, NR (1.23) and Y/SR (1.29). This indicated decline of riffle-benthic fish species, which mostly prefer rapid currents with good water quality, may be linked to several factors. The factors could include deteriorating water quality, habitat degradation, and the proliferation of top predators such as largemouth bass and opportunistic feeders such as bluegill, which create a hostile environment for these species. Similarly, the number of SS was approximately equal to the number of riffle-benthic species, which might have emigrated for various reasons. Our results also provide valuable insights into the increasing levels of point and nonpoint source pollutants in these watersheds. However, they also show that TS individuals were approximately as abundant as riffle-benthic species and SS and increased in basins where those assemblages declined.
Among trophic guilds, the proportions of individuals that were omnivores and insectivores differed. For example, omnivores in the GR (1.74) and Y/SR (1.97) watersheds displayed an increasing trend, reflecting a disturbance in the food chain that could be linked to omnivorous occurrence bluegill and largemouth bass, a top predator. However, for native insectivorous species, the lowest score was obtained in GR, where a reasonable proportion is present but shows signs of a possible decline in the future. In terms of fish abundance and condition, the findings showed declines in NR and Y/SR, whereas GR had little change in native individuals. The declining quantity of native individuals indicates the alarming impacts of IAFS along with other environmental factors. The overall physical health (DELT) of sampled fish individuals showed similar results across all four major watersheds.
The overall ecosystem health of each basin reflected the impacts of significant anthropogenic activity in the watersheds. HR displayed fair (23.37) biological integrity, as did GR (20.04), which narrowly escaped being listed in the poor category. The NR and Y/SR watersheds showed poor ecosystem health, again reflecting degrading water quality and habitat as well as disturbed fish assemblages due to invasions of exotic fish species. Our results reaffirm the impacts of invasive and ecosystem-disturbing species on native sensitive and riffle-benthic populations as well as their disruption of ecological balance through increasing TS. However, this responsibility cannot be placed solely on IAFS, as each species’ physicochemical water quality preferences and environmental characteristics must also be considered.
Alexander et al. [73] reported increased impacts of IAFS on the incidence of habitat modification and simplification triggered by native fish assemblage dislocation. Note that biological disturbances spread in every microhabitat and affect almost all fish assemblages. Alarming changes to habitat, anthropogenic and agricultural pollution, and monsoon weather create change in hydrological regimes, dam and weir construction, river channel modification, unbalanced nutrient inputs, demolition of riverine foliage, and succession of shelter-providing aquatic plants accompany successful invasions [15,74,75]. These findings show the magnitude of adverse impacts from environmental deterioration and IAFS on Korean lotic water bodies. In addition, they suggest immediate management measures that can be taken to rehabilitate disturbed and declining native fish assemblages.
3.4. Stream Order Preferences of Invasive Fish Species
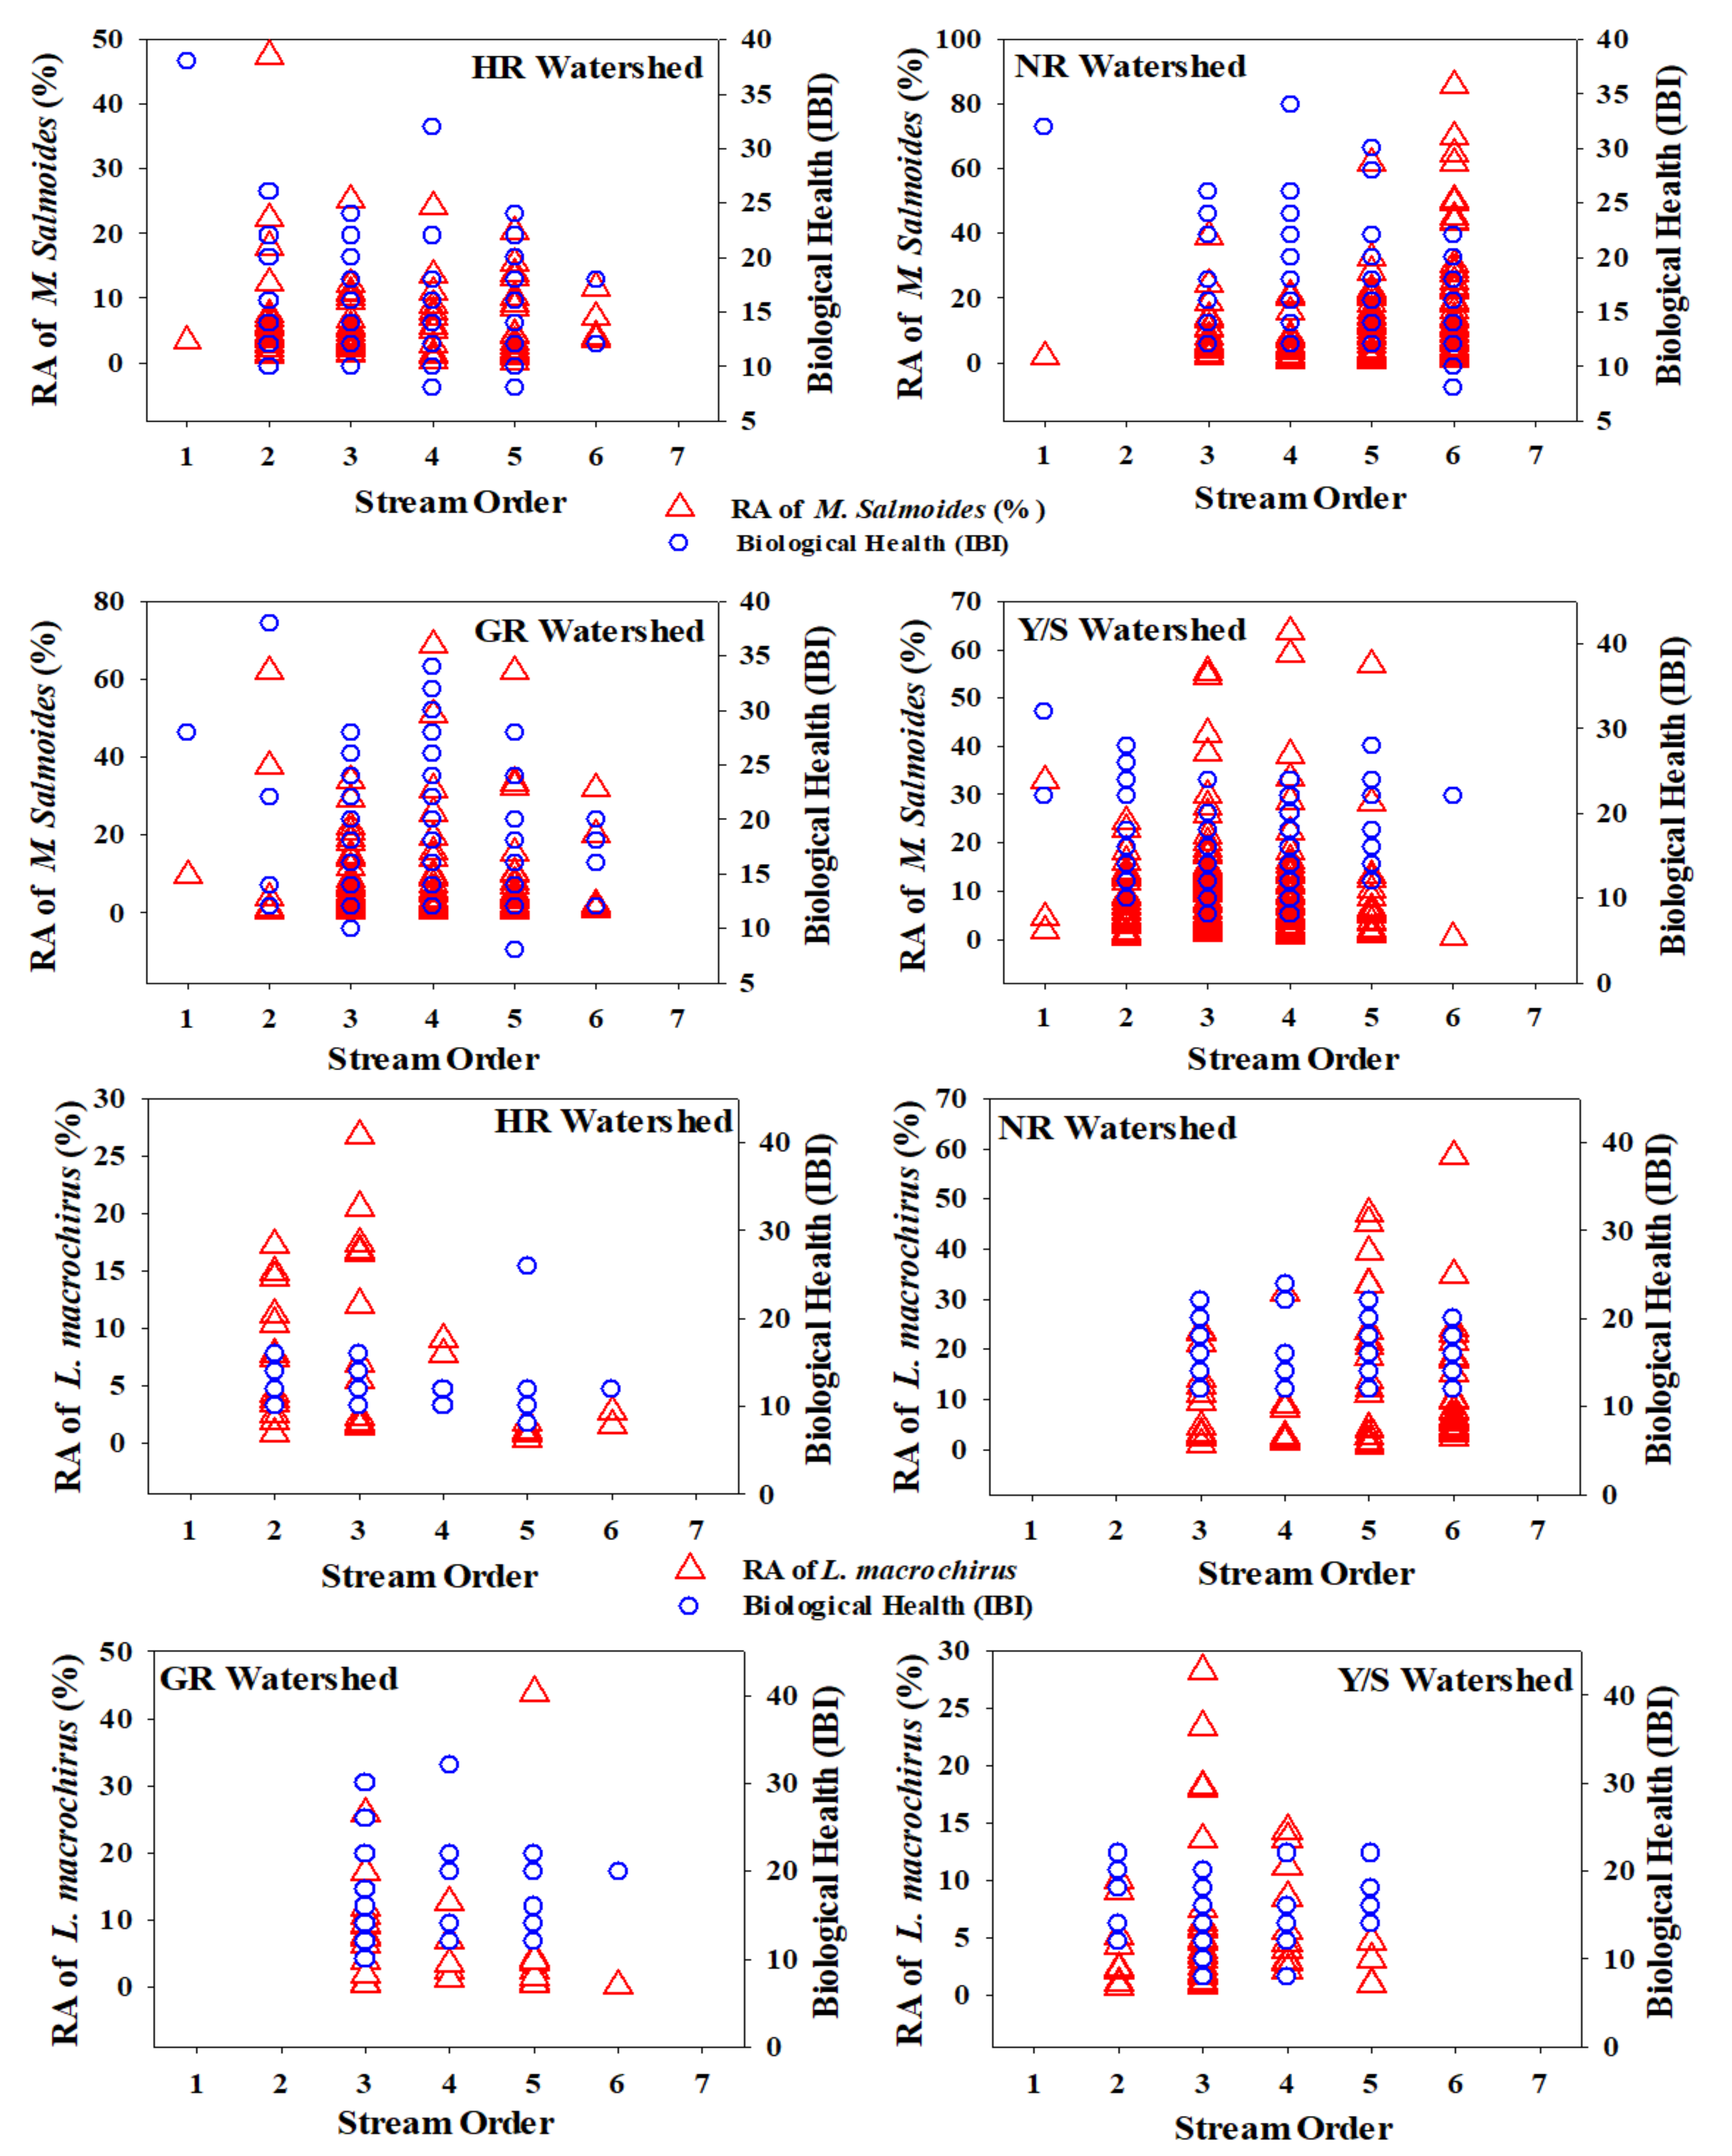
We explored the presence of invasive species concerning stream order and their relationships with the biotic health of four major rivers. The %RA of both invaders was specific to stream order (Figure 5). We plotted the %RA of the ecosystem-disturbing fish species and ecosystem health based on the IBI in first- to sixth-order streams in the four major watersheds, which revealed interesting patterns. Most largemouth basses preferred relatively deep waters, mainly in third- to fifth-order streams, except NR, where the highest percentage was recorded in a sixth-order stream. This result may provide useful insights into stream fish assemblage structures. First- and second-order streams in South Korea can be easily waded, which indicates a countermeasure used by this species to escape from danger. Other reasons for this preference could be a lack of shelter for spawn and frequent drought events that cause prolonged shortages of sustainable streamflow.
Furthermore, hydrological fluctuations due to widespread weir construction combined with intensive monsoon rainfall lead to extreme flow events that could affect native fish species and their food chains at the local scale. HR showed decreased largemouth bass with increasing stream order, whereas NR displayed an inverse relationship between %RA and stream order. No bluegill was observed in any first-order streams. The HR watershed showed decreasing bluegill abundance, whereas NR displayed an increasing trend, similar to that of largemouth bass. GR supported the fewest bluegill, with first- and second-order streams showing zero occurrences and a decreasing trend with increasing stream order. In the Y/SR watershed, bluegill did not appear in first- and sixth-order streams and occurred most often in third-order streams.
It is essential to understand the spatial distribution of both native species and IAFS for conservation and management [76]. Longitudinal gradients structure fish assemblages [77], supported by numerous studies, and species richness increases in the downstream direction. This longitudinal increase may be explained by two factors, namely, faunal zonation and species addition. Faunal zonation occurs when ecologically related species form distinctive assemblages in reaction to fluctuations in the local habitat [76,78], with excellent examples in cold-to-warm water system transitions experiencing channel morphological alterations [79]. Species addition can follow downstream gradients; however, the acquisition may occur with or without disappearances and replacements [76,77,80,81]. Previous studies have also indicated that TS and top predator species show increasing trends toward downstream waters [23,82].
3.5. Relationships between Trophic and Tolerance Guild and IAFS
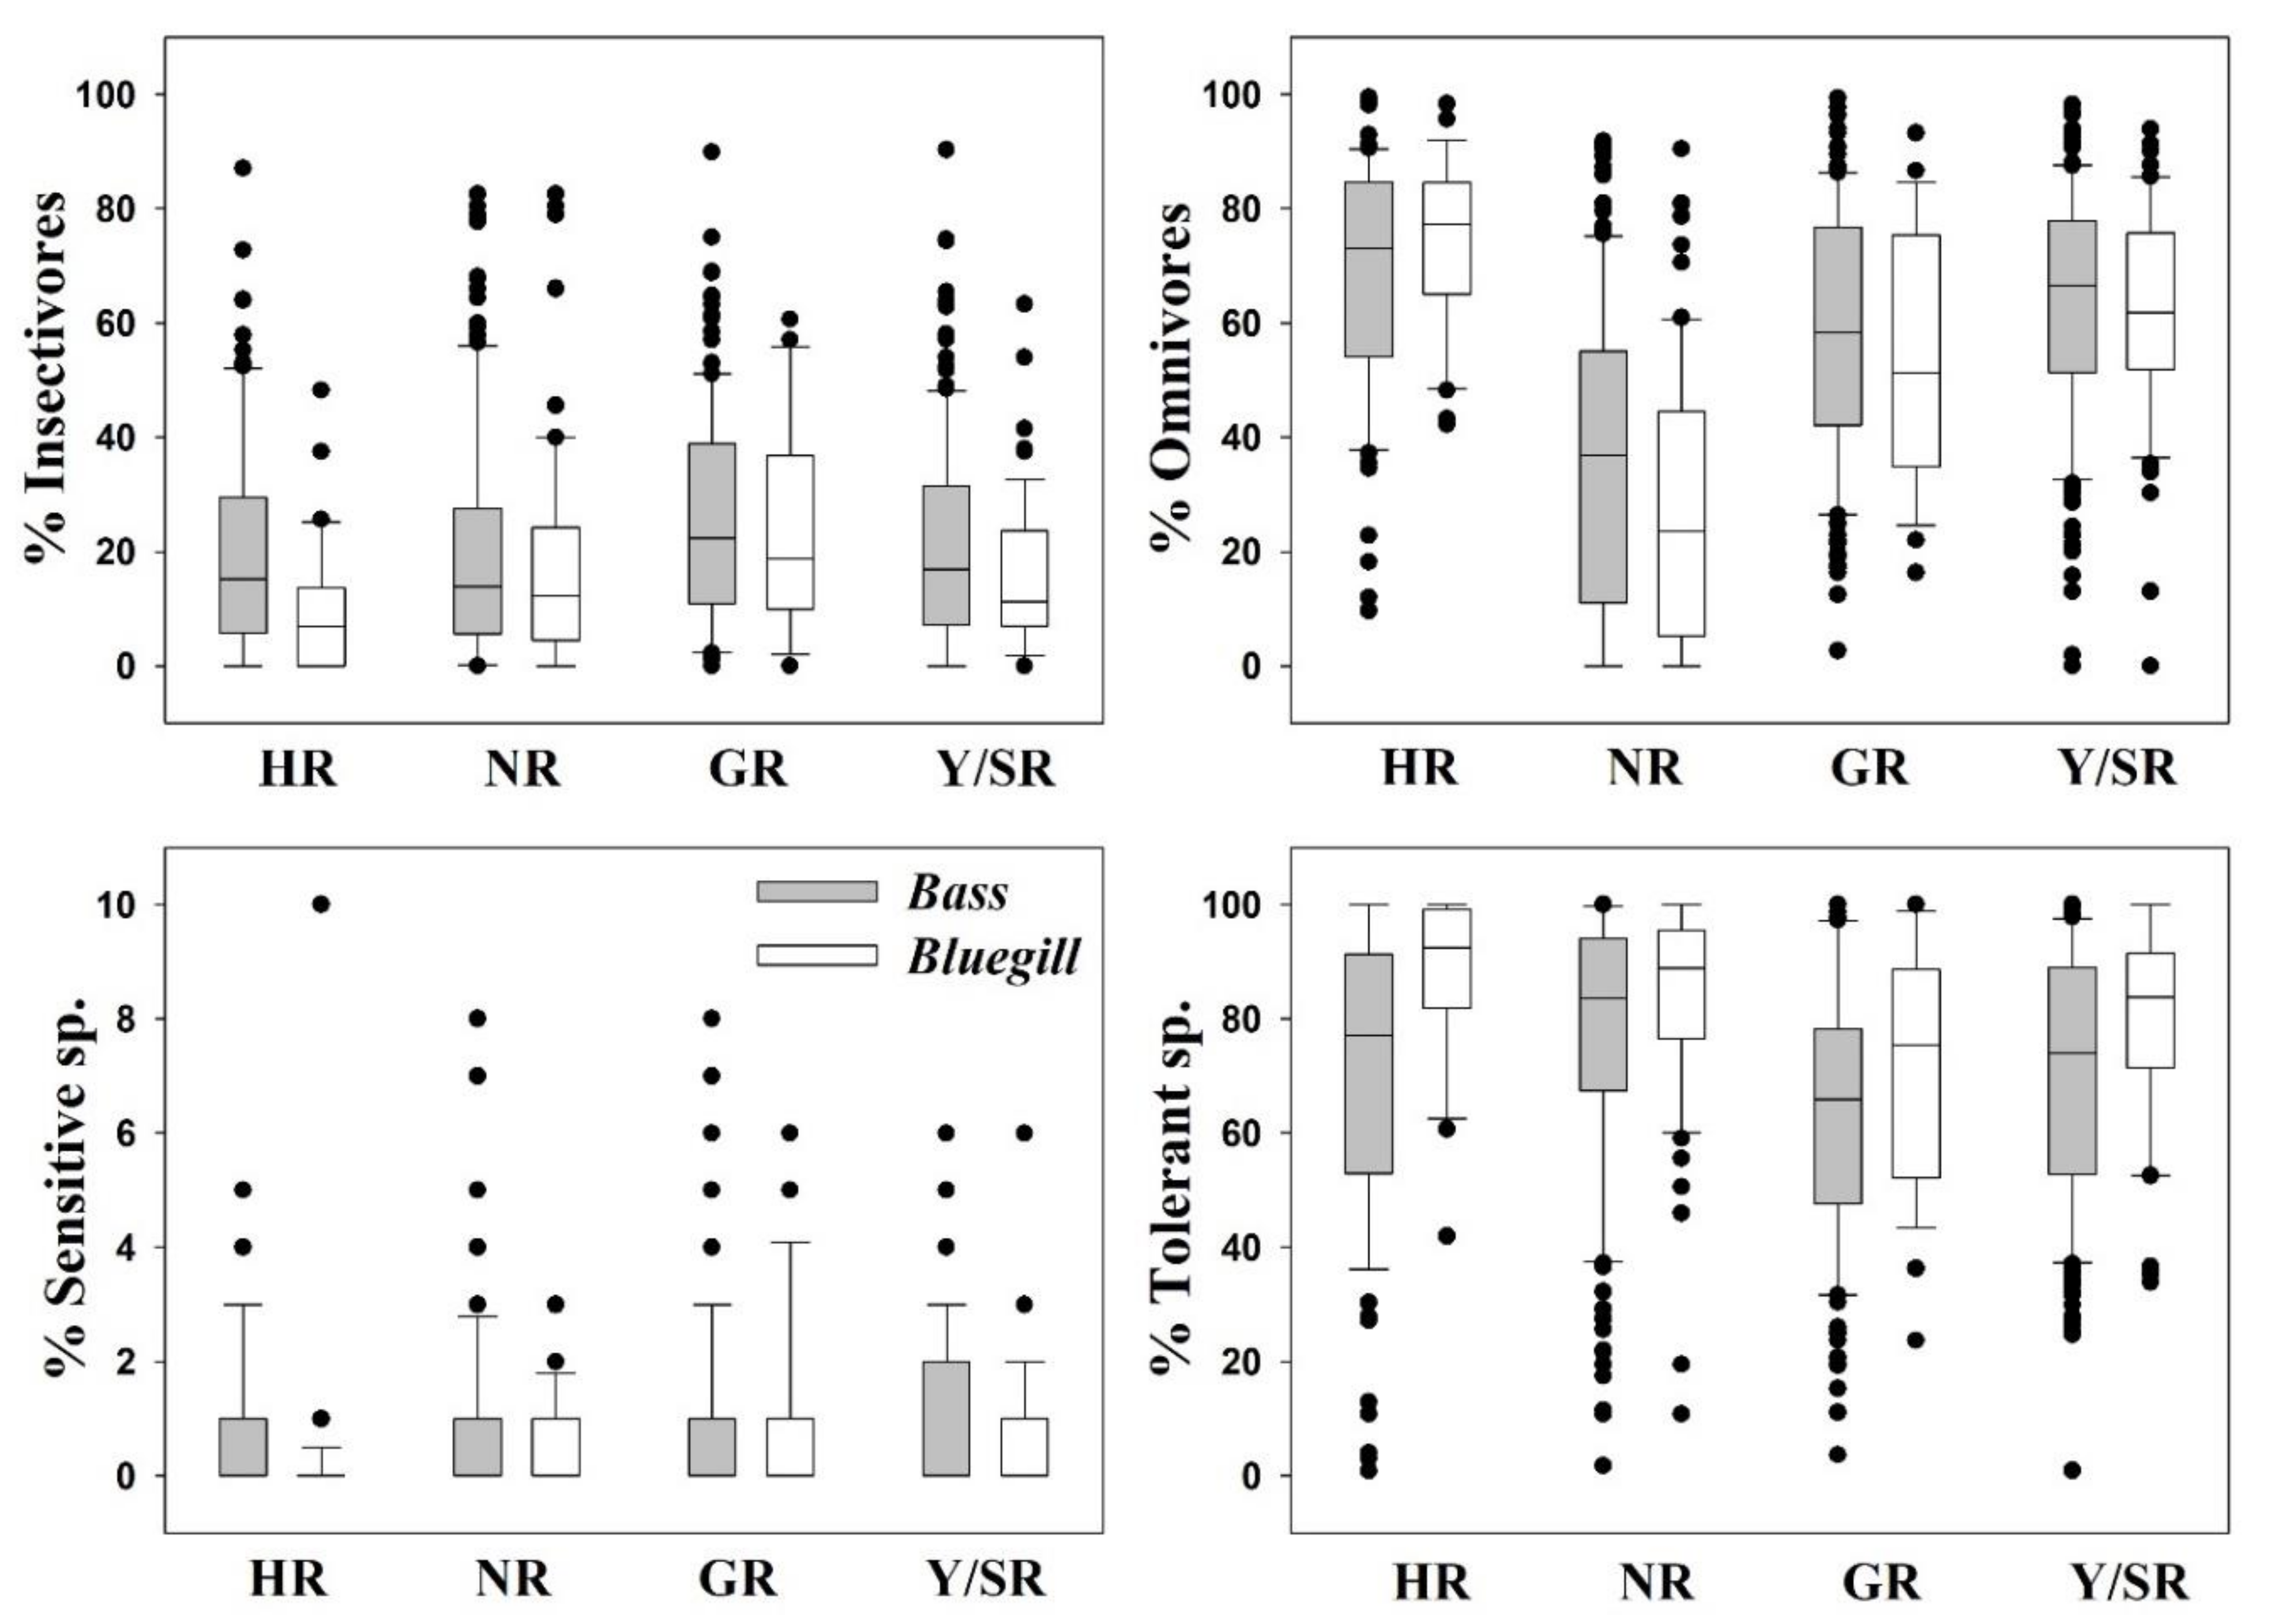
We examined interactions between trophic and tolerance guilds and ecosystem-disturbing fish species (i.e., largemouth bass and bluegill) and obtained fascinating results. Insectivorous and sensitive fish assemblages showed significant declines in the presence of largemouth bass and bluegill. Simultaneously, omnivorous species and TS increased concomitant with these alien species (Figure 6). An in-depth exploration suggested that the increase in largemouth bass populations further compressed the insectivorous and sensitive fish populations in the four major rivers. The role of bluegill in the destruction of SS and insectivorous species was smaller. For largemouth bass, the mean RA of insectivores was 15.17% (HR), 14.08% (NR), 22.55% (GR), and 16.55% (Y/SR), whereas that of omnivores was 72.64% (HR), 36.67% (NR), 57.13% (GR), and 65.94% (Y/SR). Proportions of insectivores and omnivores were approximately inversely proportional to each other. SS abundance was 0.95% (HR), 0.94% (NR), 0.98% (GR), and 1.93% (Y/SR), whereas of largemouth bass as TS levels were 76.54% (HR), 83.24% (NR), 65.59% (GR), and 73.72% (Y/SR). However, the RA of bluegill, as TS was 92.08% (HR), 88.53% (NR), 75.15% (GR), and 83.24% (Y/SR).
It is interesting that the occurrence of these ecological nuisance species precipitously decreased the abundance of SS. However, this finding may not be solely associated with these species, as the environment reflects the worsening water quality. Insectivores and sensitive fish species are usually quick to respond to declining water quality, as their feeding grounds are disturbed. The invasion of ecosystem-disturbing fish into vulnerable freshwater bodies can have detrimental effects, disrupting the food web from either its apex or center [75,83]. Both omnivorous and tolerant assemblages were invigorated by the invasions of the two species investigated here. Head-to-head competition between the two invaders occurs in these four major rivers and has devastating effects on the local ecosystems. In HR, bluegill was dominant over largemouth bass, whereas bluegill was outcompeted in the remaining three watersheds (NR, GR, and Y/SR).
However, the percentages of TS generally improved in the presence of bluegill, as it outcompeted largemouth bass in all watersheds. This finding is also symptomatic of the notion that bluegill is more tolerant of environmental degradation because of its prolific breeding and resistance to ecological disturbances. This species has shown a strong capacity to benefit from a deteriorating environment and fluctuating hydrological conditions [69]. It was previously hypothesized that invasions have grave consequences when anthropogenic impacts are already present, and this hypothesis was validated by this case [84,85].
4. Conclusions and Further Research
This study provides detailed insights into the potential links between two ecosystem-disturbing IAFS and the relationships of their presence and abundance with the water chemistry and biotic communities of four major river watersheds in South Korea. Our findings could clarify priorities for management actions at the watershed scale to mitigate the impacts of IAFS. The results suggest that both largemouth bass and bluegill thrive in deteriorating water quality and can succeed in water bodies poised to become eutrophic. The majority of these fish were sampled at sites with ambient TN:TP ratios of less than 100.
The most strongly impacted native fish assemblages were the sensitive and insectivore fish species, given the springy and voracious feeding styles of these invaders, which disrupt the feeding grounds and food web. This devastating feeding and preying habit damages the overall food web and native fish assemblages and their normal activities. The degradation of water quality further aggravates this situation due to anthropogenic impacts. In this study, the most critical water quality factors that stressed native populations and supported invading fish were TN, TP, chlorophyll a, COD, and BOD, all of which were strongly connected to oxygen depletion. These findings indicate which factors should be prioritized in the management and conservation of the impacted watersheds. Future studies should include robust interdisciplinary analyses of hydrobiology, taxonomy, hydrochemistry, ecological niche modelling, and habitat suitability in these areas. We suggest the inclusion of associated urban, forest, estuarine, and agricultural regions is essential, which may affect the hydrological regime, particularly the water flow and anthropogenic activities that could render the ecologically degraded environments suitable for invasion. Therefore, more studies are required to elaborate on the critical links prevalent among the biotic and abiotic factors that might help spread these exotic fish species. In this way, we can comprehensively manage and improve water quality, predict threatened fish communities, and mitigate the impending threats of IAFS at the regional and global scales.
Author Contributions
Conceptualization, J.Y.K., U.A., and K.-G.A.; data curation, J.Y.K. and K.-G.A.; formal analysis, U.A.; investigation, J.Y.K. and U.A.; methodology, J.Y.K., U.A., and K.-G.A.; project administration, U.A. and K.-G.A.; resources, K.-G.A.; software, J.Y.K. and U.A.; supervision, K.-G.A.; validation, U.A. and K.-G.A.; visualization, J.Y.K. and U.A.; writing—original draft, J.Y.K. and U.A.; writing—review and editing, U.A., J.Y.K. and U.A., who all equally participated in this study. All authors have read and agreed to the published version of the manuscript.
Funding
This work was supported by "Korea Environment Industry & Technology Institute (KEITI)" through “Exotic Invasive Fish Species Management Project”, funded by the Ministry of Environment, Korea (Grant No.: 2018-1467-02) and the Daejeon Green Environment Center under the Research Development Program (Year 2016).
Institutional Review Board Statement
Not applicable.
Informed Consent Statement
Not applicable.
Data Availability Statement
The data presented in this study are available on request from the corresponding author but with subject to approval from the relevant authorities.
Conflicts of Interest
The authors declare no conflict of interest.
References
- Piria, M.; Simonović, P.; Kalogianni, E.; Vardakas, L.; Koutsikos, N.; Zanella, D.; Ristovska, M.; Apostolou, A.; Adrović, A.; Mrdak, D.; et al. Alien freshwater fish species in the Balkans-Vectors and pathways of introduction. Fish Fish. 2018, 19, 138–169. [Google Scholar] [CrossRef] [Green Version]
- Jia, Y.; Kennard, M.J.; Liu, Y.; Sui, X.; Chen, Y.; Li, K.; Wang, G.; Chen, Y. Understanding invasion success of Pseudorasbora parva in the Qinghai-Tibetan Plateau: Insights from life-history and environmental filters. Sci. Total Environ. 2019, 694, 133739. [Google Scholar] [CrossRef] [PubMed]
- Lomnicky, G.A.; Whittier, T.R.; Hughes, R.M.; Peck, D.V. Distribution of nonnative aquatic vertebrates in western US streams and rivers. N. Am. J. Fish. Manag. 2007, 27, 1082–1093. [Google Scholar] [CrossRef]
- Cucherousset, J.; Olden, J.D. Ecological impacts of nonnative freshwater fishes. Fisheries 2011, 36, 215–230. [Google Scholar] [CrossRef]
- Casatti, L.; Teresa, F.B.; Zeni, J.d.O.; Ribeiro, M.D.; Brejão, G.L.; Ceneviva-Bastos, M. More of the same: High functional redundancy in stream fish assemblages from tropical agroecosystems. Environ. Manag. 2015, 55, 1300–1314. [Google Scholar] [CrossRef]
- Marquez, J.F.; Lee, A.M.; Aanes, S.; Engen, S.; Herfindal, I.; Salthaug, A.; Sæther, B. Spatial scaling of population synchrony in marine fish depends on their life history. Ecol. Lett. 2019, 13360. [Google Scholar] [CrossRef]
- Bae, M.-J.; Murphy, C.A.; García-Berthou, E. Temperature and hydrologic alteration predict the spread of invasive Largemouth Bass (Micropterus salmoides). Sci. Total Environ. 2018, 639, 58–66. [Google Scholar] [CrossRef]
- García-Berthou, E. The characteristics of invasive fishes: What has been learned so far? J. Fish. Biol. 2007, 71, 33–55. [Google Scholar] [CrossRef]
- Copp, G.H.; Vilizzi, L.; Wei, H.; Li, S.; Piria, M.; Al-Faisal, A.J.; Almeida, D.; Atique, U.; Al-Wazzan, Z.; Bakiu, R.; et al. Speaking their language—Development of a multilingual decision-support tool for communicating invasive species risks to decision makers and stakeholders. Environ. Model. Softw. 2021, 135, 104900. [Google Scholar] [CrossRef]
- Simberloff, D.; Martin, J.-L.; Genovesi, P.; Maris, V.; Wardle, D.A.; Aronson, J.; Courchamp, F.; Galil, B.; García-Berthou, E.; Pascal, M.; et al. Impacts of biological invasions: What’s what and the way forward. Trends Ecol. Evol. 2013, 28, 58–66. [Google Scholar] [CrossRef] [Green Version]
- Shackleton, C.M. The role of invasive alien species in shaping local livelihoods and human well-being: A review. J. Environ. Manag. 2019, 229, 145–157. [Google Scholar] [CrossRef]
- Atique, U.; Kwon, S.; An, K.-G. Linking weir imprints with riverine water chemistry, microhabitat alterations, fish assemblages, chlorophyll-nutrient dynamics, and ecological health assessments. Ecol. Indic. 2020, 117, 106652. [Google Scholar] [CrossRef]
- Hara, J.; Atique, U.; An, K.G. Multiyear links between water chemistry, algal chlorophyll, drought-flood regime, and nutrient enrichment in a morphologically complex reservoir. Int. J. Environ. Res. Public Health 2020, 17, 3139. [Google Scholar] [CrossRef]
- Atique, U.; An, K.-G. Reservoir water quality assessment based on chemical parameters and the chlorophyll dynamics in relation to nutrient regime. Pol. J. Environ. Stud. 2019, 28, 1043–1061. [Google Scholar] [CrossRef]
- Kim, J.-J.; Atique, U.; An, K.-G. Long-term ecological health assessment of a restored urban stream based on chemical water quality, physical habitat conditions and biological integrity. Water 2019, 11, 114. [Google Scholar] [CrossRef] [Green Version]
- Haque, M.A.; Jewel, M.A.S.; Atique, U.; Paul, A.K.; Iqbal, S. Seasonal and spatial variation of flagellate communities in a tropical river. Limnologica 2020, 85, 125824. [Google Scholar] [CrossRef]
- Lee, M.; Jung, I. Assessment of an urban stream restoration project by cost-benefit analysis: The case of Cheonggyecheon stream in Seoul, South Korea. KSCE J. Civ. Eng. 2016, 20, 152–162. [Google Scholar] [CrossRef]
- Koutsikos, N.; Zogaris, S.; Vardakas, L.; Kalantzi, O.-I.; Dimitriou, E.; Economou, A.N. Tracking non-indigenous fishes in lotic ecosystems: Invasive patterns at different spatial scales in Greece. Sci. Total Environ. 2019, 659, 384–400. [Google Scholar] [CrossRef]
- Bae, D.-Y.; Atique, U.; Yoon, J.; Lim, B.; An, K.-G. Ecological risk assessment of urban streams using fish biomarkers of DNA damages and physiological responses. Pol. J. Environ. Stud. 2020, 29, 1–10. [Google Scholar] [CrossRef]
- Atique, U.; Iqbal, S.; Khan, N.; Qazi, B.; Javeed, A.; Anjum, K.M.; Haider, M.S.; Khan, T.A.; Mahmood, S.; Sherzada, S. Multivariate assessment of water chemistry and metals in a river impacted by tanning industry. Fresenius Environ. Bull. 2020, 29, 3013–3025. [Google Scholar]
- Karr, J.R. Assessment of biotic integrity using fish communities. Fisheries 1981, 6, 21–27. [Google Scholar] [CrossRef]
- Qadir, A.; Malik, R.N. Assessment of an index of biological integrity (IBI) to quantify the quality of two tributaries of river Chenab, Sialkot, Pakistan. Hydrobiologia 2009, 621, 127–153. [Google Scholar] [CrossRef]
- An, K.-G.; Choi, J.W.; Lee, Y.J. Modifications of ecological trophic structures on chemical gradients in lotic ecosystems and their relations to stream ecosystem health. Anim. Cells Syst. 2013, 17, 53–62. [Google Scholar] [CrossRef] [Green Version]
- Atique, U.; An, K.-G. Stream health evaluation using a combined approach of multi-metric chemical pollution. Water 2018, 10, 661. [Google Scholar] [CrossRef] [Green Version]
- Argillier, C.; Caussé, S.; Gevrey, M.; Pédron, S.; De Bortoli, J.; Brucet, S.; Emmrich, M.; Jeppesen, E.; Lauridsen, T.; Mehner, T.; et al. Development of a fish-based index to assess the eutrophication status of European lakes. Hydrobiologia 2013, 704, 193–211. [Google Scholar] [CrossRef] [Green Version]
- Blabolil, P.; Logez, M.; Ricard, D.; Prchalová, M.; Říha, M.; Sagouis, A.; Peterka, J.; Kubečka, J.; Argillier, C. An assessment of the ecological potential of Central and Western European reservoirs based on fish communities. Fish. Res. 2016, 173, 80–87. [Google Scholar] [CrossRef] [Green Version]
- Pérez-Domínguez, R.; MacI, S.; Courrat, A.; Lepage, M.; Borja, A.; Uriarte, A.; Neto, J.M.; Cabral, H.; Straykov, V.; Franco, A.; et al. Current developments on fish-based indices to assess ecological-quality status of estuaries and lagoons. Ecol. Indic. 2012, 23, 34–45. [Google Scholar] [CrossRef]
- Long, J.M.; Walker, D.J. Small scale application and assessment of an Index of Biotic Integrity for a large boreal river. Hydrobiologia 2005, 544, 177–187. [Google Scholar] [CrossRef]
- Moon, W.-K.; Atique, U.; An, K.-G. Ecological risk assessments and eco-toxicity analyses using chemical, biological, physiological responses, DNA damages and gene-level biomarkers in Zebrafish (Danio rerio) in an urban stream. Chemosphere 2020, 239, 124754. [Google Scholar] [CrossRef]
- Saeed, F.; Iqbal, K.J.; Atique, U.; Javid, A.; Khan, N.; Iqbal, S.; Majeed, H.; Azmat, H.; Khan, B.Y.A.; Baboo, I.; et al. Toxic trace metals assessment in selected organs of edible fish species, sediment and water in Head Punjnad, Punjab, Pakistan. Punjab Univ. J. Zool. 2020, 35, 43–50. [Google Scholar] [CrossRef]
- An, K.-G.; Choi, S.-S. An assessment of aquatic ecosystem health in a temperate watershed using the index of biological integrity. J. Environ. Sci. Health Part A Toxic Hazard. Subst. Environ. Eng. 2003, 36, 1115–1130. [Google Scholar] [CrossRef] [PubMed]
- Khanom, D.A.; Nesa, A.; Jewel, M.A.S.; Haque, M.A.; Paul, A.K.; Iqbal, S.; Atique, U.; Alam, L. Muscular tissue bioaccumulation and health risk assessment of heavy metals in two edible fish species (Gudusia chapra and Eutropiichthys vacha) in Padma River, Bangladesh. Punjab Univ. J. Zool. 2020, 35, 81–89. [Google Scholar] [CrossRef]
- Iqbal, S.; Atique, U.; Mahboob, S.; Haider, M.S.; Iqbal, H.S.; Al-Ghanim, K.A.; Al-Misned, F.; Ahmed, Z.; Mughal, M.S. Effect of supplemental selenium in fish feed boosts growth and gut enzyme activity in juvenile tilapia (Oreochromis niloticus). J. King Saud Univ. Sci. 2020, 32, 2610–2616. [Google Scholar] [CrossRef]
- Diana, M.; Allan, J.D.; Infante, D. The influence of physical habitat and land use on stream fish assemblages in southeastern Michigan. Am. Fish. Soc. Symp. 2006, 48, 359–374. [Google Scholar]
- Crooks, J.A.; Chang, A.L.; Ruiz, G.M. Aquatic pollution increases the relative success of invasive species. Biol. Invasions 2011, 13, 165–176. [Google Scholar] [CrossRef] [Green Version]
- Atique, U.; An, K.-G. Water quality and trophic state index analysis in relation to land use patterns in agricultural reservoirs. Korea Soc. Environ. Ecol. Proc. 2019, 2019, 110. [Google Scholar]
- Jang, M.-H.; Kim, J.-G.; Park, S.-B.; Jeong, K.-S.; Cho, G.-I.; Joo, G.-J. The current status of the distribution of introduced fish in large river systems of South Korea. Int. Rev. Hydrobiol. 2002, 87, 319–328. [Google Scholar] [CrossRef]
- Mamun, M.; Kim, S.; An, K.-G. Distribution pattern prediction of an invasive alien species largemouth bass using a maximum entropy model (MaxEnt) in the Korean peninsula. J. Asia Pac. Biodivers. 2018, 11, 516–524. [Google Scholar] [CrossRef]
- Kawamura, K.; Yonekura, R.; Katano, O.; Taniguchi, Y.; Saitoh, K. Origin and dispersal of bluegill sunfish, Lepomis macrochirus, in Japan and Korea. Mol. Ecol. 2006, 15, 613–621. [Google Scholar] [CrossRef]
- Kim, I.S. Freshwater fishes. Illustrated Encyclopedia of Fauna and Flora of Korea; Ministry of Education: Seoul, Korea, 1997; Volume 37.
- Kim, J.G.; Park, J.Y. Visual cells of the introduced bluegill Lepomis macrochirus (Pisces; Centropomidae) of Korea. Appl. Microsc. 2016, 46, 89–92. [Google Scholar] [CrossRef]
- US EPA. United States Environmental Protection Agency (US EPA). Fish. Field and Laboratory Methods for Evaluating the Biological Integrity of Surface Waters; EPA 600-R-92-111; Environmental Monitoring Systems Laboratory—Cincinnati Office of Modeling, Monitoring Systems, and Quality Assurance Office of Research Development; US EPA: Cincinnati, OH, USA, 1993; p. 348.
- Barbour, M.T.; Gerritsen, J.; Snyder, B.D.; Stribling, J.B. Rapid Bioassessment Protocols for Use in Streams and Wadeable Rivers: Periphyton, Benthic Macroinvertebrates and Fish, 2nd ed.; EPA 841-B-99-002; US Environmental Protection Agency, Office of Water: Washington, DC, USA, 1999.
- An, K.-G.; Yeom, D.H.; Lee, S.K. Rapid bioassessments of kap stream using the index of biological integrity. Korean J. Environ. Biol. 2001, 19, 261–269. [Google Scholar]
- Choi, J.W.; Kumar, H.K.; Han, J.H.; An, K.-G. The development of a regional multimetric fish model based on biological integrity in lotic ecosystems and some factors influencing the stream health. Water Air Soil Pollut. 2011, 217, 3–24. [Google Scholar] [CrossRef]
- Lee, J.H.; An, K.G. Integrative restoration assessment of an urban stream using multiple modeling approaches with physical chemical, and biological integrity indicators. Ecol. Eng. 2014, 62, 153–167. [Google Scholar] [CrossRef]
- Jang, M.-H.; Joo, G.-J.; Lucas, M.C. Diet of introduced largemouth bass in Korean rivers and potential interactions with native fishes. Ecol. Freshw. Fish. 2006, 15, 315–320. [Google Scholar] [CrossRef]
- Brown, T.G.; Runciman, B.; Pollard, S.; Grant, A.D.A. Biological synopsis of largemouth bass (Micropterus salmoides). In Canadian Manuscript Report of Fisheries and Aquatic Sciences; Fisheries and Oceans Canada: Nanaimo, BC, Canada, 2009; p. 2884. [Google Scholar]
- Becker, G.C. Fishes of Wisconsin; The University of Wisconsin Press: Madison, WI, USA, 1983. [Google Scholar]
- Fuller, P.L.; Nico, L.G.; Williams, J.D. Nonindigenous Fishes Introduced into Inland Waters of the United States; Special Publication 27; American Fisheries Society: Bethesda, MD, USA, 1999. [Google Scholar]
- Azuma, M. Ecological release in feeding behavior: The case of bluegills in Japan. Hydrobiologia 1992, 243/244, 269–276. [Google Scholar] [CrossRef]
- Ministry of the Environment in Republic of Korea. The Outlaws of the Ecosystem—Invasive Alien Species. 2005. Available online: http://eng.me.go.kr/user/policies/6_nature_08.html (accessed on 26 March 2010).
- Froese, R.; Pauly, D. The Fishbase. 2005. Available online: www.fishbase.org (accessed on 4 April 2010).
- Strahler, A.N. Quantitative analysis of watershed geomorphology. Trans. Am. Geophys. Union 1957, 38, 913. [Google Scholar] [CrossRef] [Green Version]
- MOE/NIER. The Ministry of Environment/National Institute of Environmental Research (MOE/NIER). The Survey and Evaluation of Aquatic Ecosystem Health in Korea; The Ministry of Environment/National Institute of Environmental Research (NIER): Incheon, Korea, 2008.
- Kim, I.S.; Park, J.Y. Freshwater Fish of Korea; Kyohak Publishing: Seoul, Korea, 2002; p. 465. [Google Scholar]
- Nelson, J.S. Fishes of the World, 4th ed.; John Wiley & Sons: New York, NY, USA, 2006; p. 624. [Google Scholar]
- Sanders, R.E.; Milter, R.J.; Yondr, C.O.; Rankin, E.T. The use of external deformities, erosion, lesions, and tumors (DELT anormalies) in fish assemblages for characterising aquatic resources: A case study of seven Ohio streams. In Assessing the Sustainability and Biological Integrity of Water Resources Using Fish Communities; Simon, T.P., Ed.; CRC Press: Boca Raton, FL, USA, 1999; pp. 225–245. [Google Scholar]
- Karr, J.R.; Fausch, K.D.; Angermeier, P.L.; Yant, P.R.; Schlosser, I.J. Assessing biological integrity in running waters: A method and its rationale. Ill. Nat. Hist. Surv. Spec. Publ. 1986, 55, 28. [Google Scholar]
- Casatti, L.; Ferreira, C.P.; Langeani, F.A. Fish-based biotic integrity index for assessment of lowland streams in southeastern Brazil. Hydrobiologia 2009, 623, 173–189. [Google Scholar] [CrossRef]
- Rankin, E.T.; Yoder, C.O. Adjustments to the index of biotic integrity: A summary of Ohio experiences and some suggested modifications. In Assessing the Sustainability and Biological Integrity of Water Resources Using Fish Communities; Simon, T.P., Ed.; CRC Press: Boca Raton, FL, USA, 1999; p. 672. [Google Scholar]
- Crumpton, W.G.; Isenhart, T.M.; Mitchell, P.D. Nitrate and organic N analyses with second-derivative spectroscopy. Limnol. Oceanogr. 1992, 37, 907–913. [Google Scholar] [CrossRef] [Green Version]
- Prepas, E.E.; Rigler, F.H. Improvements in quantifying the phosphorus concentration in lake water. Can. J. Fish. Aquat. Sci. 1982, 39, 822–829. [Google Scholar] [CrossRef]
- MOE (Ministry of Environment). Standard Methods for the Examination of Water Quality Contamination; The Ministry of Environments (MOE): Gwacheon, Korea, 2000.
- APHA (American Public Health Association); American Water Works Association (AWWA); Water Environment Federation (WEF). Standard Methods for the Examination of Water and Wastewater; AWWA: Washington, DC, USA, 2012; ISBN 9780875530130. [Google Scholar]
- Atique, U.; An, K.-G. Landscape heterogeneity impacts water chemistry, nutrient regime, organic matter and chlorophyll dynamics in agricultural reservoirs. Ecol. Indic. 2020, 110, 105813. [Google Scholar] [CrossRef]
- Lozon, J.D.; Macisaac, H.J. Biological invasions: Are they dependent on disturbance? Environ. Rev. 1997, 144, 131–144. [Google Scholar] [CrossRef]
- Paavola, M.; Olenin, S.; Leppäkoski, E. Are invasive species most successful in habitats of low native species richness across European brackish water seas? Estuar. Coast. Shelf Sci. 2005, 64, 738–750. [Google Scholar] [CrossRef]
- Anufriieva, E.V.; Shadrin, N.V. Extreme hydrological events destabilise aquatic ecosystems and open doors for alien species. Quat. Int. 2018, 475, 11–15. [Google Scholar] [CrossRef]
- Gallardo, B.; Aldridge, D.C. Inter-basin water transfers and the expansion of aquatic invasive species. Water Res. 2018, 143, 282–291. [Google Scholar] [CrossRef]
- Atique, U.; Byungjin, L.; Johee, Y.; An, K.-G. Biological health assessments of lotic waters by biotic integrity indices and their relations to water chemistry. Water 2019, 11, 436. [Google Scholar] [CrossRef] [Green Version]
- Villéger, S.; Miranda, J.R.; Hernández, D.F.; Mouillot, D. Contrasting changes in taxonomic vs. functional diversity of tropical fish communities after habitat degradation. Ecol. Appl. 2010, 20, 1512–1522. [Google Scholar] [CrossRef]
- Alexander, M.E.; Kaiser, H.; Weyl, O.L.F.; Dick, J.T.A. Habitat simplification increases the impact of a freshwater invasive fish. Environ. Biol. Fishes 2015, 98, 477–486. [Google Scholar] [CrossRef] [Green Version]
- Bunn, S.E.; Arthington, A.H. Basic principles and ecological consequences of altered flow regimes for aquatic biodiversity. Environ. Manag. 2002, 30, 492–507. [Google Scholar] [CrossRef] [Green Version]
- Castaldelli, G.; Pluchinotta, A.; Milardi, M.; Lanzoni, M.; Giari, L.; Rossi, R.; Fano, E.A. Introduction of exotic fish species and decline of native species in the lower Po basin, north-eastern Italy. Aquat. Conserv. Mar. Freshw. Ecosyst. 2013, 23, 405–417. [Google Scholar] [CrossRef]
- Beard, Z.S.; Quist, M.C.; Hardy, R.S.; Ross, T.J. Patterns in fish assemblage structure in a small western stream. Copeia 2018, 106, 589–599. [Google Scholar] [CrossRef]
- Matthews, W.J. Patterns in Freshwater Ecology; Chapman and Hall: New York, NY, USA, 1998. [Google Scholar]
- Quist, M.C.; Hubert, W.A.; Isaak, D.J. Fish assemblage structure and relations with environmental conditions in a Rocky Mountain watershed. Can. J. Zool. 2004, 82, 1554–1565. [Google Scholar] [CrossRef] [Green Version]
- Rahel, F.J.; Hubert, W.A. Fish assemblages and habitat gradients in a Rocky Mountain—Great Plains stream: Biotic zonation and additive patterns of community change. Trans. Am. Fish. Soc. 1991, 120, 319–332. [Google Scholar] [CrossRef]
- Gard, R.; Flitner, G.A. Distribution and abundance of fishes in Sagehen Creek, California. J. Wildl. Manag. 1974, 38, 347–358. [Google Scholar] [CrossRef]
- Bonanno, G. Alien species: To remove or not to remove? That is the question. Environ. Sci. Policy 2016, 59, 67–73. [Google Scholar] [CrossRef]
- Hintz, W.D.; Schuler, M.S.; Jones, D.K.; Coldsnow, K.D.; Stoler, A.B.; Relyea, R.A. Nutrients influence the multi-trophic impacts of an invasive species unaffected by native competitors or predators. Sci. Total Environ. 2019, 694, 133704. [Google Scholar] [CrossRef]
- Strayer, D.L. Alien species in fresh waters: Ecological effects, interactions with other stressors, and prospects for the future. Freshw. Biol. 2010, 55, 152–174. [Google Scholar] [CrossRef]
- Copp, G.H.; Robert Britton, J.; Cucherousset, J.; García-Berthou, E.; Kirk, R.; Peeler, E.; Stakėnas, S. Voracious invader or benign feline? A review of the environmental biology of European catfish Silurus glanis in its native and introduced ranges. Fish Fish. 2009, 10, 252–282. [Google Scholar] [CrossRef]
- Shrestha, B.B.; Shrestha, U.B.; Sharma, K.P.; Thapa-Parajuli, R.B.; Devkota, A.; Siwakoti, M. Community perception and prioritisation of invasive alien plants in Chitwan—Annapurna Landscape, Nepal. J. Environ. Manag. 2019, 229, 38–47. [Google Scholar] [CrossRef]
Figure 1.
Study area map showing distinct watershed boundaries of each of the four major rivers included as well as the distribution of all the study sites sampled during this study.
Figure 1.
Study area map showing distinct watershed boundaries of each of the four major rivers included as well as the distribution of all the study sites sampled during this study.

Figure 2.
Relative abundance (RA %) of largemouth bass and bluegill as a function of selected water quality parameters in four major river watersheds in Korea.
Figure 2.
Relative abundance (RA %) of largemouth bass and bluegill as a function of selected water quality parameters in four major river watersheds in Korea.

Figure 3.
Dynamics of trophic and tolerance guilds in relation to the relative abundance (RA %) of Largemouth bass (M. salmoides).
Figure 3.
Dynamics of trophic and tolerance guilds in relation to the relative abundance (RA %) of Largemouth bass (M. salmoides).

Figure 4.
Dynamics of trophic and tolerance guilds in relation to the relative abundance (RA %) of Bluegill (L. machrochirus).
Figure 4.
Dynamics of trophic and tolerance guilds in relation to the relative abundance (RA %) of Bluegill (L. machrochirus).

Figure 5.
Relative abundance of M. salmoides and L. macrochirus against stream order and ecological health assessment based on the Index of Biological Integrity (IBI). HR = Han River, NR = Nakdong River, GR = Geum River, Y/SR = Yeongsan/Seomjin Rivers.
Figure 5.
Relative abundance of M. salmoides and L. macrochirus against stream order and ecological health assessment based on the Index of Biological Integrity (IBI). HR = Han River, NR = Nakdong River, GR = Geum River, Y/SR = Yeongsan/Seomjin Rivers.

Figure 6.
Invasive fish species interactions with trophic and tolerance guilds in the four major rivers during 2008–2009. HR = Han River, NR = Nakdong River, GR = Geum River, Y/SR = Yeongsan/Seomjin Rivers.
Figure 6.
Invasive fish species interactions with trophic and tolerance guilds in the four major rivers during 2008–2009. HR = Han River, NR = Nakdong River, GR = Geum River, Y/SR = Yeongsan/Seomjin Rivers.


Table 1.
Geographic locations coordinates, and demographic and hydrological details of the four major rivers in South Korea.
Table 1.
Geographic locations coordinates, and demographic and hydrological details of the four major rivers in South Korea.
| Variables | Han River | Nakdong River | Geum River | Yeongsan/Seomjin Rivers |
|---|---|---|---|---|
| Geographic location coordinates | 36° N 30′, 126° E 24′–38° N 55′, 129° E 02′ | 35° N 03′, 127° E 27′–37° N 13′, 129° E 18′ | 35° N 35′, 126° E 41′–37° N 05′, 128° E 25′ | 34° N 40′, 126° E 26′–35° N 50′, 127° E 53′ |
| Human Population * | 27,432,203 | 13,726,794 | 6,251,437 | 4,174,595 |
| Daily discharge (m3/s) * | 1,089,801.92 | 1,363,452.72 | 692,017.98 | 235,607.66 |
* The information is taken from NIER (National Institute of Environmental Research) Korea, 2013.
Table 2.
Chemical gradients and tolerance of largemouth bass (Micropterus salmoides) and bluegill (Lepomis macrochirus) populations and independent-samples t-test analyses.
Table 2.
Chemical gradients and tolerance of largemouth bass (Micropterus salmoides) and bluegill (Lepomis macrochirus) populations and independent-samples t-test analyses.
| Ambient Factors | Largemouth Bass | Bluegill | t-Test | ||||
|---|---|---|---|---|---|---|---|
| n | Mean ± SD (Min-Max) | n | Mean ± SD (Min-Max) | F Value | t Value | p Value | |
| BOD (mg/L) | 532 | 2.63 ± 2.3 (0–16.7) | 178 | 2.91 ± 2.55 (0–17) | 0.806 | −1.419 | 0.156 |
| COD (mg/L) | 381 | 6.15 ± 2.9 (1–18) | 128 | 6.66 ± 3.03 (2–19) | 0.060 | −1.572 | 0.117 |
| TN (mg/L) | 525 | 2.64 ± 2.4 (0–20.00) | 175 | 2.95 ± 2.6 (0–17) | 2.923 | −1.479 | 0.088 |
| NO3-N (mg/L) | 526 | 1.50 ± 1.1 (0.02–5.96) | 178 | 1.66 ± 1.2 (0–6) | 2.591 | −1.592 | 0.112 |
| NH4-N (mg/L) | 422 | 0.40 ± 1.4 (0–7.09) | 137 | 0.62 ± 1.7 (0–5.7) | 4.787 | −1.493 | 0.136 |
| TP (µg/L) | 522 | 140 ± 170 (0–1080) | 177 | 160 ± 190 (0–1000) | 3.185 | −1.398 | 0.075 |
| PO4-P (mg/L) | 514 | 0.08 ± 0.12 (0–0.82) | 171 | 0.10 ± 0.15 (0–1) | 3.279 | −1.502 | 0.134 |
| TSS (mg/L) | 465 | 12.25 ± 12.6 (0–96) | 158 | 11.58 ± 10.69 (0–69) | 1.597 | 0.600 | 0.549 |
| Conductivity (µS/cm) | 381 | 318.9 ± 221.7 (58–1456) | 125 | 380.18 ± 260.05 (58–1279) | 8.062 | −2.565 | 0.011 |
| Chl-a (µg/L) | 527 | 16.7 ± 27.5 (0–252.3) | 175 | 19.43 ± 28.05 (0–154) | 1.285 | −1.131 | 0.259 |
BOD = Biological oxygen demand, COD = Chemical oxygen demand, TN = Total nitrogen, NO3-N = Nitrate-nitrogen, NH4-N = Ammonia-nitrogen, TP = Total phosphorus, PO4-P = Phosphate-phosphorus, TSS = Total suspended solids, Chl-a = Chlorophyll-a, SD = Standard deviation, n = number.
Table 3.
Relationship between the relative abundance (RA %) of largemouth bass and bluegill populations, ambient Chl-a, TN, TP, and their ratios.
Table 3.
Relationship between the relative abundance (RA %) of largemouth bass and bluegill populations, ambient Chl-a, TN, TP, and their ratios.
| Ambient Factors | Criteria | Largemouth Bass RA (%) | Bluegill RA (%) |
|---|---|---|---|
| Ambient nutrients | TN (%) | 2.64 ± 2.367 (0–20) | 2.95 ± 2.585 (0–17) |
| TP (%) | 0.14 ± 0.17 (0–1.08) | 0.16 ± 0.19 (0–1) | |
| Chl-a (%) | 16.70 ± 27.36 (0–0.82) | 19.43 ± 28.05 (0–154) | |
| TN:TP Ratios (%) | TN:TP ≤ 100 | 95.3 | 96.0 |
| 100 < TN:TP < 200 | 3.7 | 3.4 | |
| TN:TP > 300 | 0 | 0 | |
| TN (%) | TN ≤ 1 | 14.8 | 15.5 |
| TN ≤ 2 | 36.1 | 28.2 | |
| TN > 3 | 25.5 | 31.0 | |
| TP (%) | TP ≤ 0.02 | 10.7 | 13.2 |
| TP ≤ 0.05 | 22.6 | 18.4 | |
| TP > 0.1 | 42.5 | 44.3 |
TN = Total nitrogen, TP = Total phosphorus, TN:TP = Ambient ratios of nitrogen and phosphorus.
Table 4.
Ecological health assessment based on the index of biotic integrity (IBI) in the four major rivers watersheds during 2008–2009. HR = Han River, NR = Nakdong River, GR = Geum River, Y/SR = Yeongsan/Seomjin Rivers.
Table 4.
Ecological health assessment based on the index of biotic integrity (IBI) in the four major rivers watersheds during 2008–2009. HR = Han River, NR = Nakdong River, GR = Geum River, Y/SR = Yeongsan/Seomjin Rivers.
| Category | Metric | Scoring Criteria | Four Major Watersheds | |||||
|---|---|---|---|---|---|---|---|---|
| 5 | 3 | 1 | HR | NR | GR | YR | ||
| Species richness and compositions | M1: Total number of native fish species | Expectations of M1–M3 vary with stream size and region. | 3.25 | 2.14 | 3.62 | 3.25 | ||
| M2: Number of riffle benthic species | 2.49 | 1.23 | 1.73 | 1.29 | ||||
| M3: Number of sensitive species | 2.53 | 1.57 | 1.52 | 1.91 | ||||
| M4: Proportion of individuals as tolerant species | <5 | 5–20 | >20 | 2.2 | 1.85 | 1.3 | 1.52 | |
| Trophic compositions | M5: Proportion of individuals as omnivore species | <20 | 20–45 | >45 | 2.65 | 2.9 | 1.74 | 1.97 |
| M6: Proportion of individuals as native insectivore species | >45 | 45–20 | <20 | 3.45 | 2.94 | 2.69 | 3.06 | |
| Fish abundance and conditions | M7: Total number of native individuals | Expectations of M7 vary with stream size and region. | 2.6 | 1.6 | 3.09 | 2.2 | ||
| M8: Proportion of individuals with deformities, erosion, lesion, and tumors (DELT) | 0 | 0–1 | >1 | 4.22 | 4.65 | 4.35 | 4.23 | |
| Outcome | 23.39 (Fair) | 18.88 (Poor) | 20.04 (Fair) | 19.43 (Poor) | ||||
Publisher’s Note: MDPI stays neutral with regard to jurisdictional claims in published maps and institutional affiliations. |
© 2021 by the authors. Licensee MDPI, Basel, Switzerland. This article is an open access article distributed under the terms and conditions of the Creative Commons Attribution (CC BY) license (http://creativecommons.org/licenses/by/4.0/).
Share and Cite
MDPI and ACS Style
Kim, J.Y.; Atique, U.; An, K.-G. Relative Abundance and Invasion Dynamics of Alien Fish Species Linked to Chemical Conditions, Ecosystem Health, Native Fish Assemblage, and Stream Order. Water 2021, 13, 158. https://doi.org/10.3390/w13020158
AMA Style
Kim JY, Atique U, An K-G. Relative Abundance and Invasion Dynamics of Alien Fish Species Linked to Chemical Conditions, Ecosystem Health, Native Fish Assemblage, and Stream Order. Water. 2021; 13(2):158. https://doi.org/10.3390/w13020158
Chicago/Turabian StyleKim, Ji Yoon, Usman Atique, and Kwang-Guk An. 2021. "Relative Abundance and Invasion Dynamics of Alien Fish Species Linked to Chemical Conditions, Ecosystem Health, Native Fish Assemblage, and Stream Order" Water 13, no. 2: 158. https://doi.org/10.3390/w13020158
Note that from the first issue of 2016, this journal uses article numbers instead of page numbers. See further details here.