Climate Change-Enhanced Cyanobacteria Domination in Lake Kinneret: A Retrospective Overview


Migal-Scientific Research Institute, P.O. Box 831, Kiryat Shmone 11016, Israel
Water 2021, 13(2), 163; https://doi.org/10.3390/w13020163
Submission received: 30 November 2020
/
Revised: 25 December 2020
/
Accepted: 27 December 2020
/
Published: 12 January 2021
(This article belongs to the Special Issue Cyanobacterial Threat on Freshwater Safety)
Abstract
:The objective of this study is re-evaluation of the long-term record of limnological parameters in Lake Kinneret (1970–2018) and its drainage basin (1940–2018) aimed at an indication of the possible impact of climate change on water quality in Lake Kinneret. The methodological approach is based on indication of significant changes, of temperature increase, decline in rainfall, causing a reduction in river discharges, and lake water inflows. These climatological changes were accompanied by a reduction in nitrogen and a slight increase in phosphorus in the lake Epilimnion. The outcome was Epilimnetic Nitrogen deficiency and Phosphorus sufficiency, which enhanced domination replacement of Peridinium spp. by Cyanobacterial. We concluded sequel suggested climate change affected water quality deterioration in Lake Kinneret.
1. Introduction
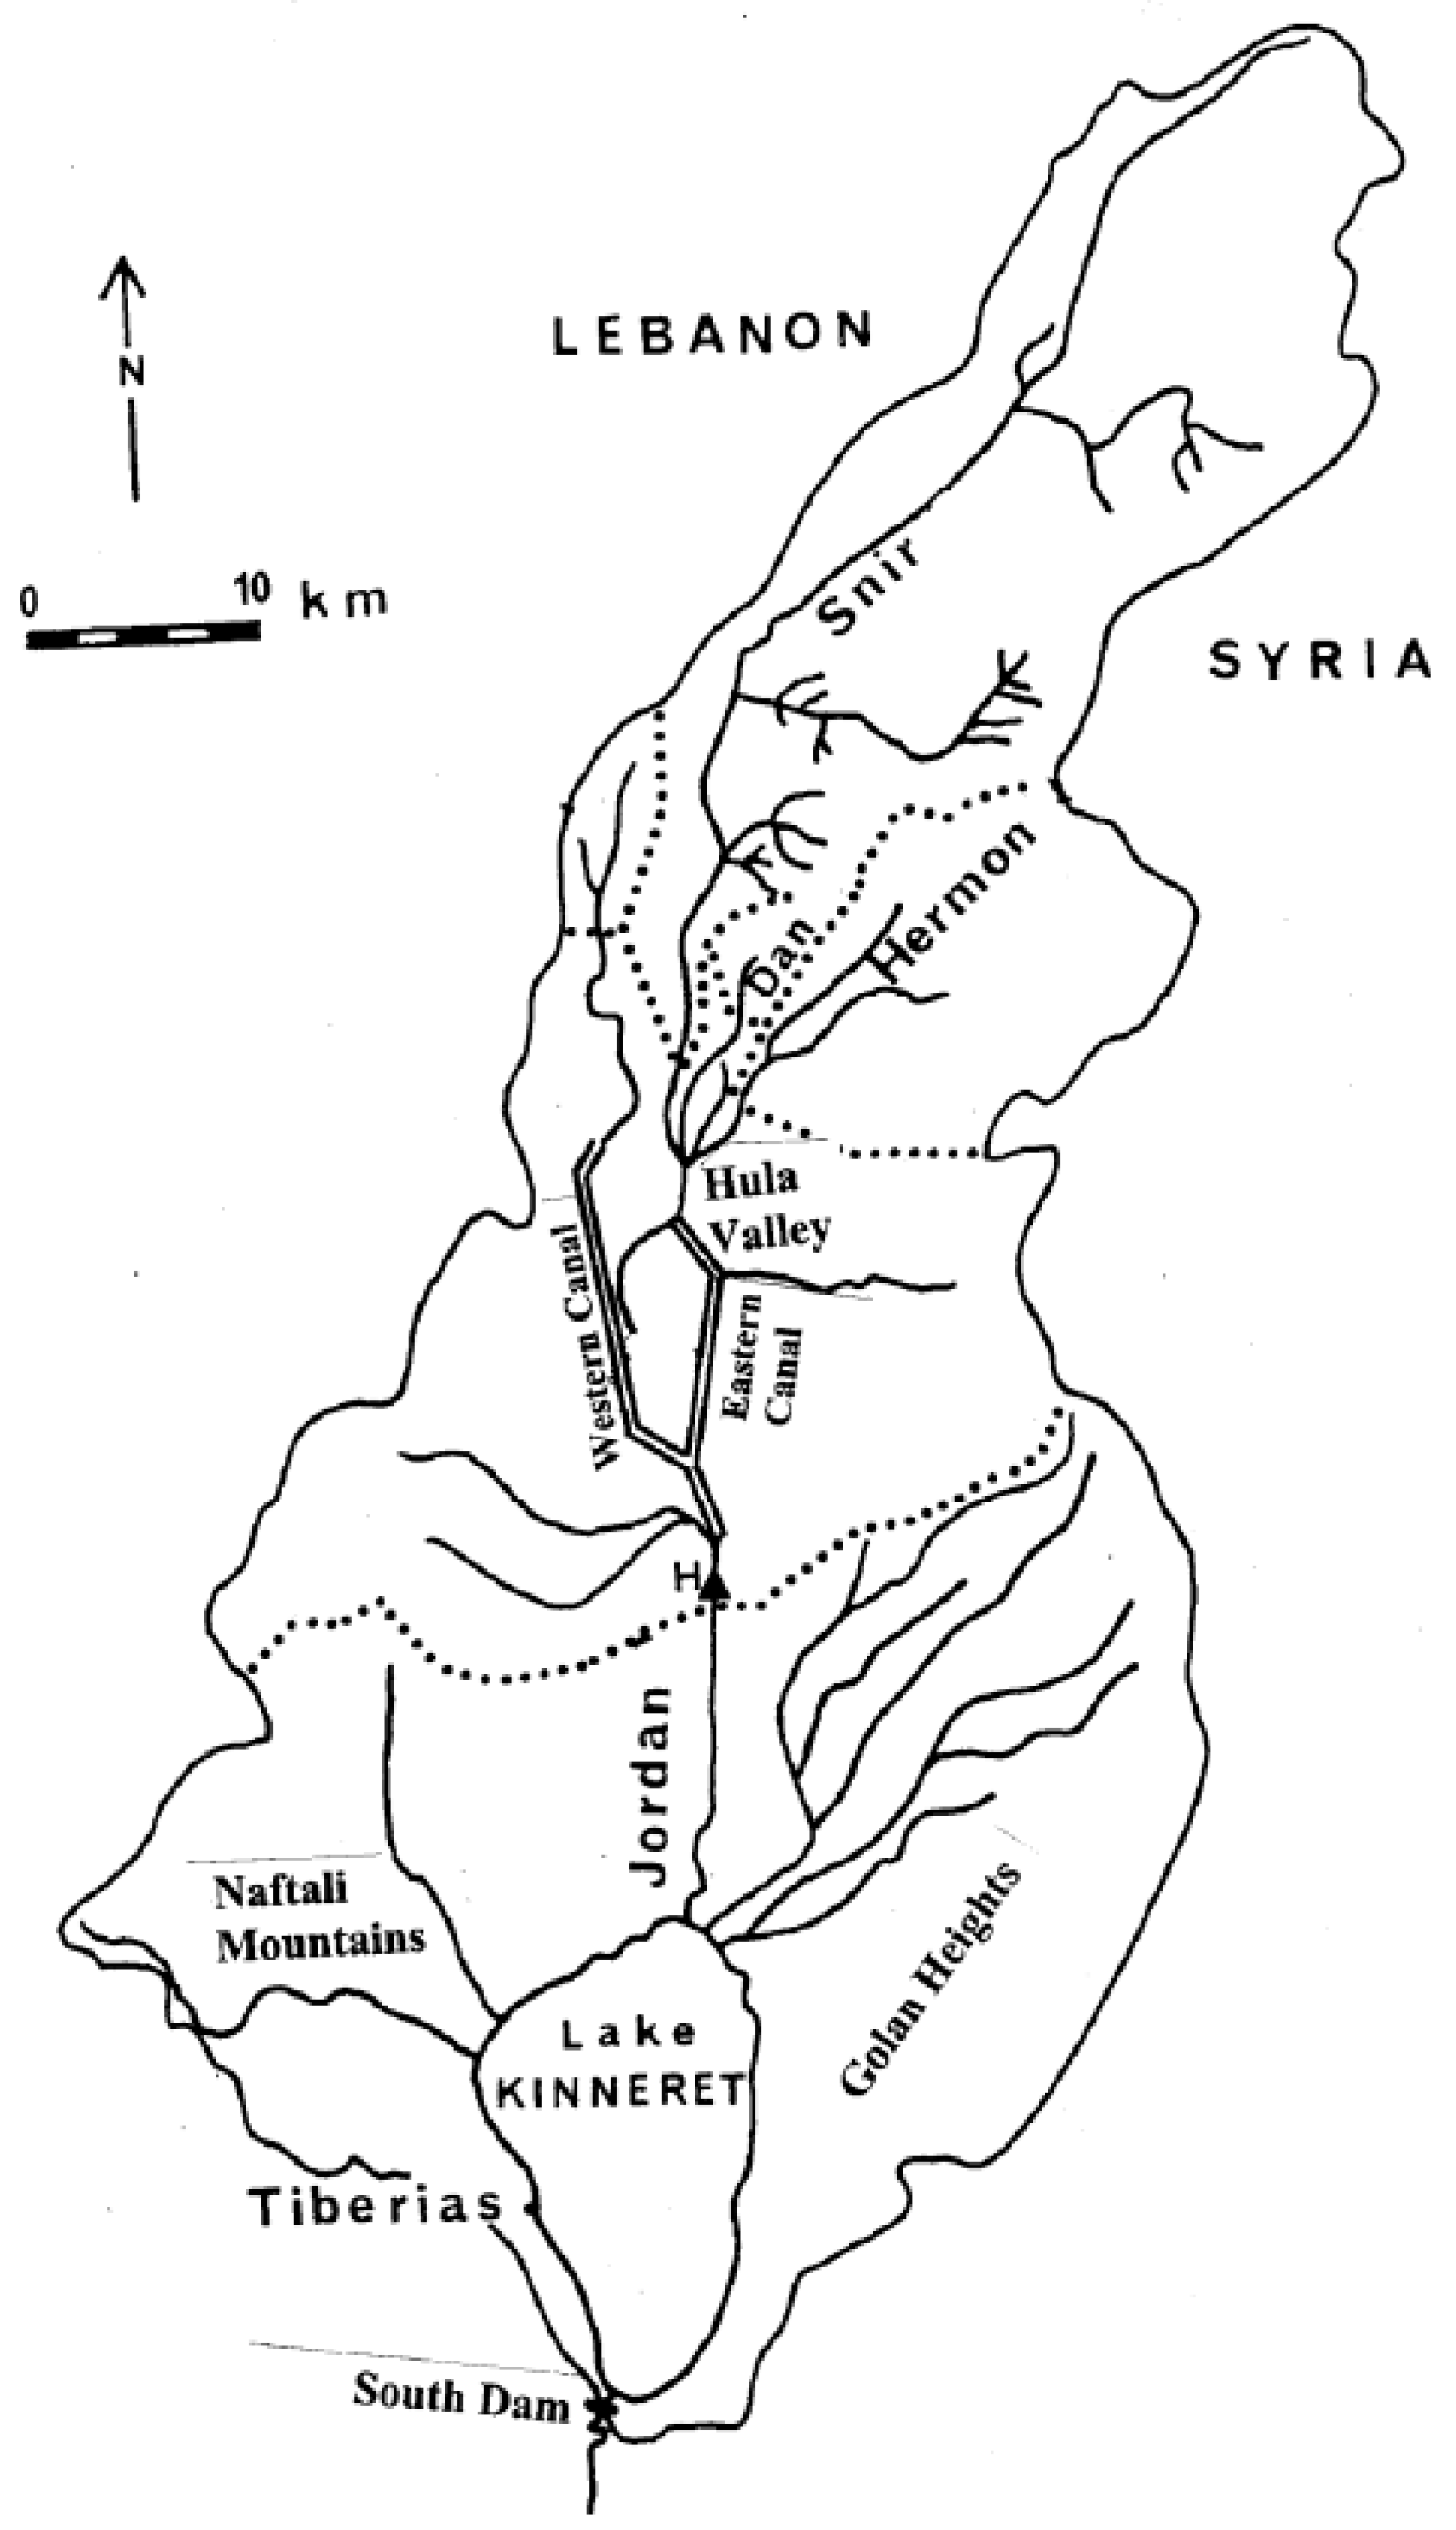
Lake Kinneret in the Syrian-African rift valley in northern Israel (Figure 1 and Figure 2) is the only natural freshwater lake in Israel. Kinneret is a warm Monomictic lake stratified from May to December [1,2,3,4] Above 95% of the Israeli natural water resources are utilized. The total national water supply is 2.11 bcm, of which 0.55 bcm comes from the Kinneret-Jordan system and 0.7 bcm from desalinization. Lake Kinneret supplies national multi-ecological services, such as water supply and recreation, and is also exploited for fishing by about 200 licensed fishermen.
Three major rivers (Hatzbani, Banyas, and Dan) flow from the Hermon mountain region in the northern part of the Kinneret drainage basin. These rivers jointly flow into River Jordan, which crosses the Hula Valley through two major man-made canals, the eastern and western canals. At the south end of the Valley, the two canals jointly flow again as the Jordan River flowing downstream into Lake Kinneret [1,2,3,4]. The Jordan River contributes to about 63% of the Kinneret water budget, and more than 50% of the total external nutrient inputs come from the Hula Valley region. The drainage basin area of Lake Kinneret is 2730 km2, and is located mostly to the north of the lake from which the Hula Valley is about 200 km2. The Kinneret ecosystem has undergone significant changes in the last 70 years [3]. Some of the changes are natural, while others are anthropogenic. During the last 25 years, a depletion of Epilimnetic bio-availability of nitrogen and a slight increase of Epilimnetic phosphorus was documented. The Kinneret Epilimnion has limited phosphorus. The TN/TP mass ratio in the Epilimnion consequently declined [4]. The global outcome of climate change in freshwater bodies was Eutrophication accompanied by water scarcity. Therefore, the susceptibility of drinking water sources to Cyanobacteria blooms has been significantly enhanced.
Removal of cyanobacteria is efficiently carried out by using chemicals, but decomposed toxic Cyanobacteria cells release dissolved toxins. These toxins degrade water quality and their elimination is crucial not only for water quality improvement but also for recreational enhancement. Lake Kinneret is a popular suitable site for recreation, and the nuisance of toxic Cyanobacteria [5,6,7] is, therefore, a harmful threat.
This paper attempts to address the recent increase in the level of Cyanobacteria biomass in Lake Kinneret. The paper focuses on the impact of climate change on N and P availability on phytoplankton composition and the threat of Cyanobacteria on water safety.
2. Material and Methods
The long-term datasets (1970–2018) of Lake Kinneret and its watershed were statistically evaluated. Included parameters were water and air temperature, rainfall regime, nutrient dynamics, lake plankton community structure, and river discharges (mcm/y; 106 m3 annually). Data were obtained from the following sources: Annual Reports, Kinneret Limnological Laboratory [5], annual reports of the Israeli National Meteorological Service and the Israeli National Hydrological Service (National Water Authority), MIGAL, Hula Project Service [8], Interim and Annual Reports by Mekorot Water Supply Company Ltd. (Nazareth, Israel) Monitoring Unit Jordan District, Agriculture Ministry Northern Branch—Upper Galilee Office, and TAHAL Water Planning for Israel.
Annual temperatures, nutrient concentrations, and plankton densities (1970–2014) in the epilimnion, as well as sampling procedures and analytical methods, were taken from the Lake Kinneret database [4] of the Kinneret Limnological Laboratory. Data on the Jordan River nutrient loads, concentrations, and discharge were taken from the annual and temporal reports published by Mekorot, the National Water Company.
Statistical analyses (fractional polynomial regression) (FP) were carried out using STATA 9.1, Statistics-Data Analysis, Chapter fracpoly-Fractional Polynomial regression; StataCorp, 2005, Stata Statistical Software: Release 9. College Station, TX, USA: StataCorp LP. pp. 357–370 (See also: Royston, P. and D. G. Altman, 1994.) Regression was carried out using Fractional Polynomial of continuous covariates: Parsimonious parametric modeling (with discussion), Applied Statistics 43: 429–467. The purpose of FPs is to increase the flexibility of the family of conventional polynomial models. Although polynomials are popular in data analysis, linear and quadratic functions are severely limited in their range of curve shape, whereas cubic and higher-order curves often produce undesirable artifacts such as “edge effects” and “waves” (STATA 9).
3. Results and Discussion
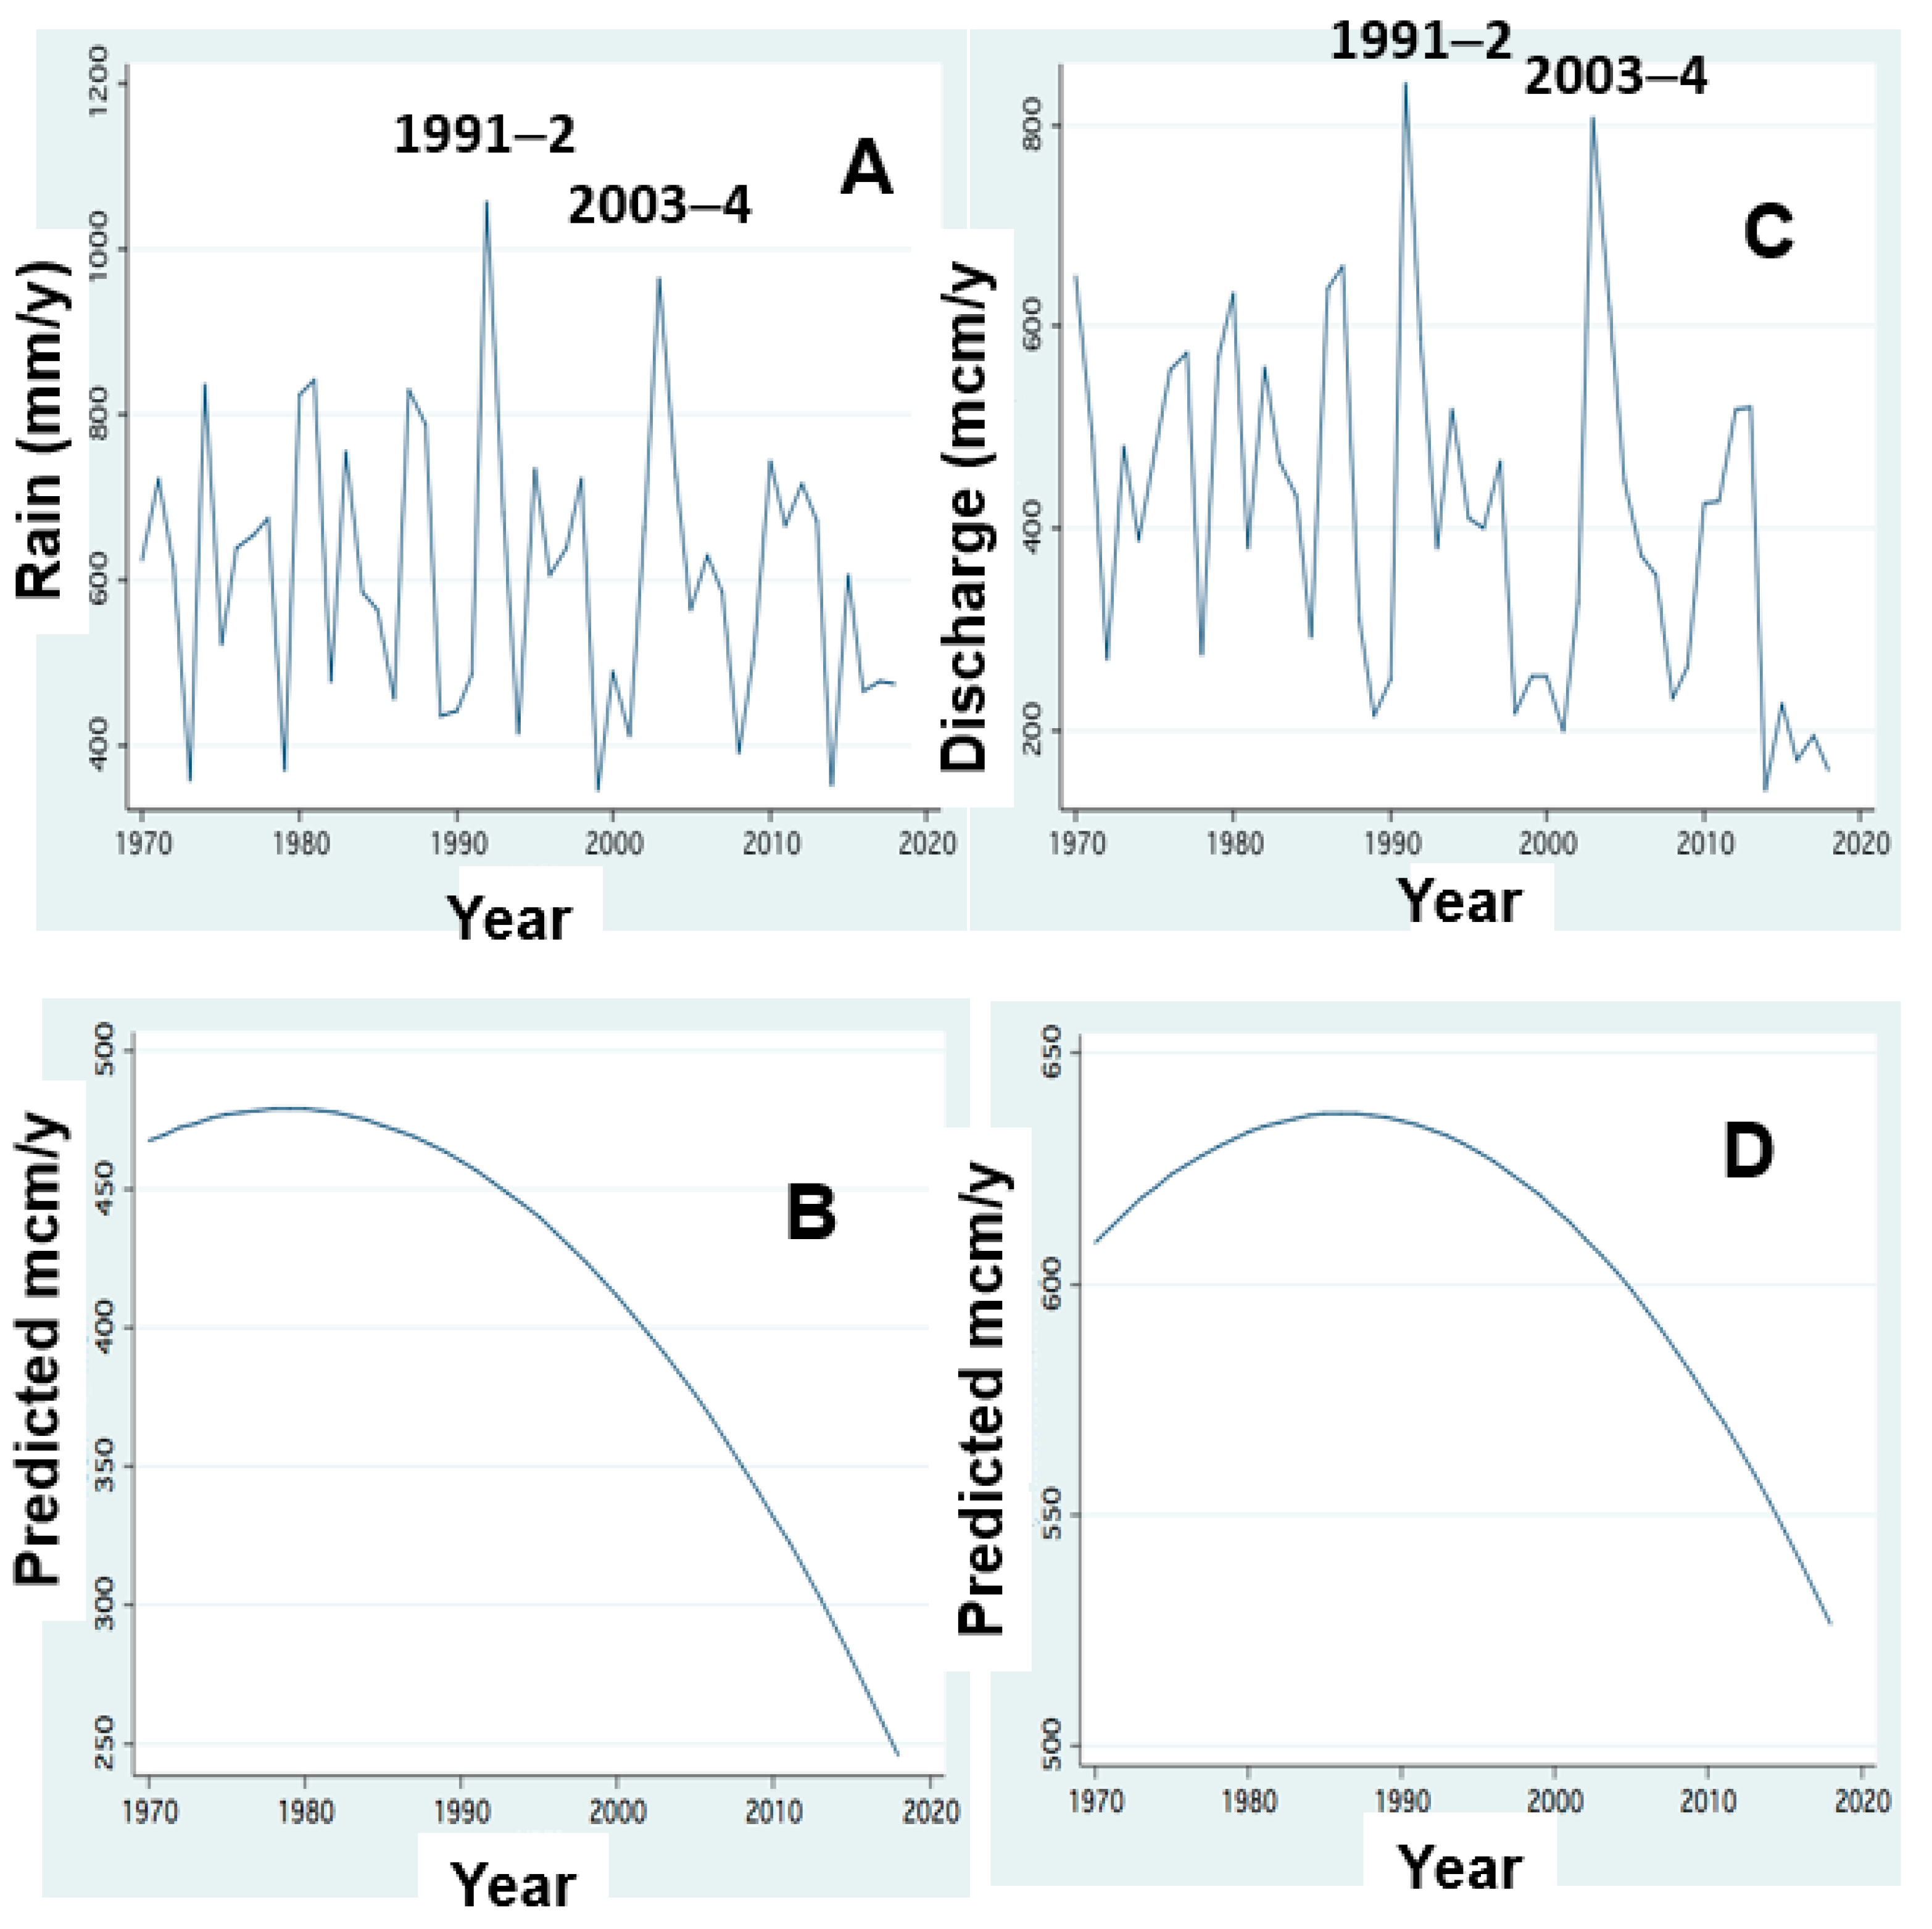
The hydrological symptoms of climate change included in this paper are rainfall and discharge decline [9,10,11] (Figure 3). These conditions resulted in the reduction of water exchange in the lake and prolongation of water residence time (RT).
The changes of nitrogen and phosphorus input dynamics through the discharges of River Jordan are shown in Figure 4, Figure 5, Figure 6, Figure 7, Figure 8 and Figure 9 [11,12].
The replacement of Peridinium domination by Cyanobacteria enhancement is presented in Figure 10 and Figure 11.
Results given in Figure 9 indicate the impact of RT (Residence Time) length on Peridinium and Cyanobacteria densities whilst Figure 12 represents the temporal changes of RT length.
The relations between discharges of River Jordan and DIN (Dissolved Inorganic Nitrogen) inputs and their impact on Cyanobacteria are given in Figure 13 and Figure 14. Figure 15 represents the temporal changes of TN (Total Nitrogen) and TP (Total Phosphorus) total lake standing stocks and mass ratio.
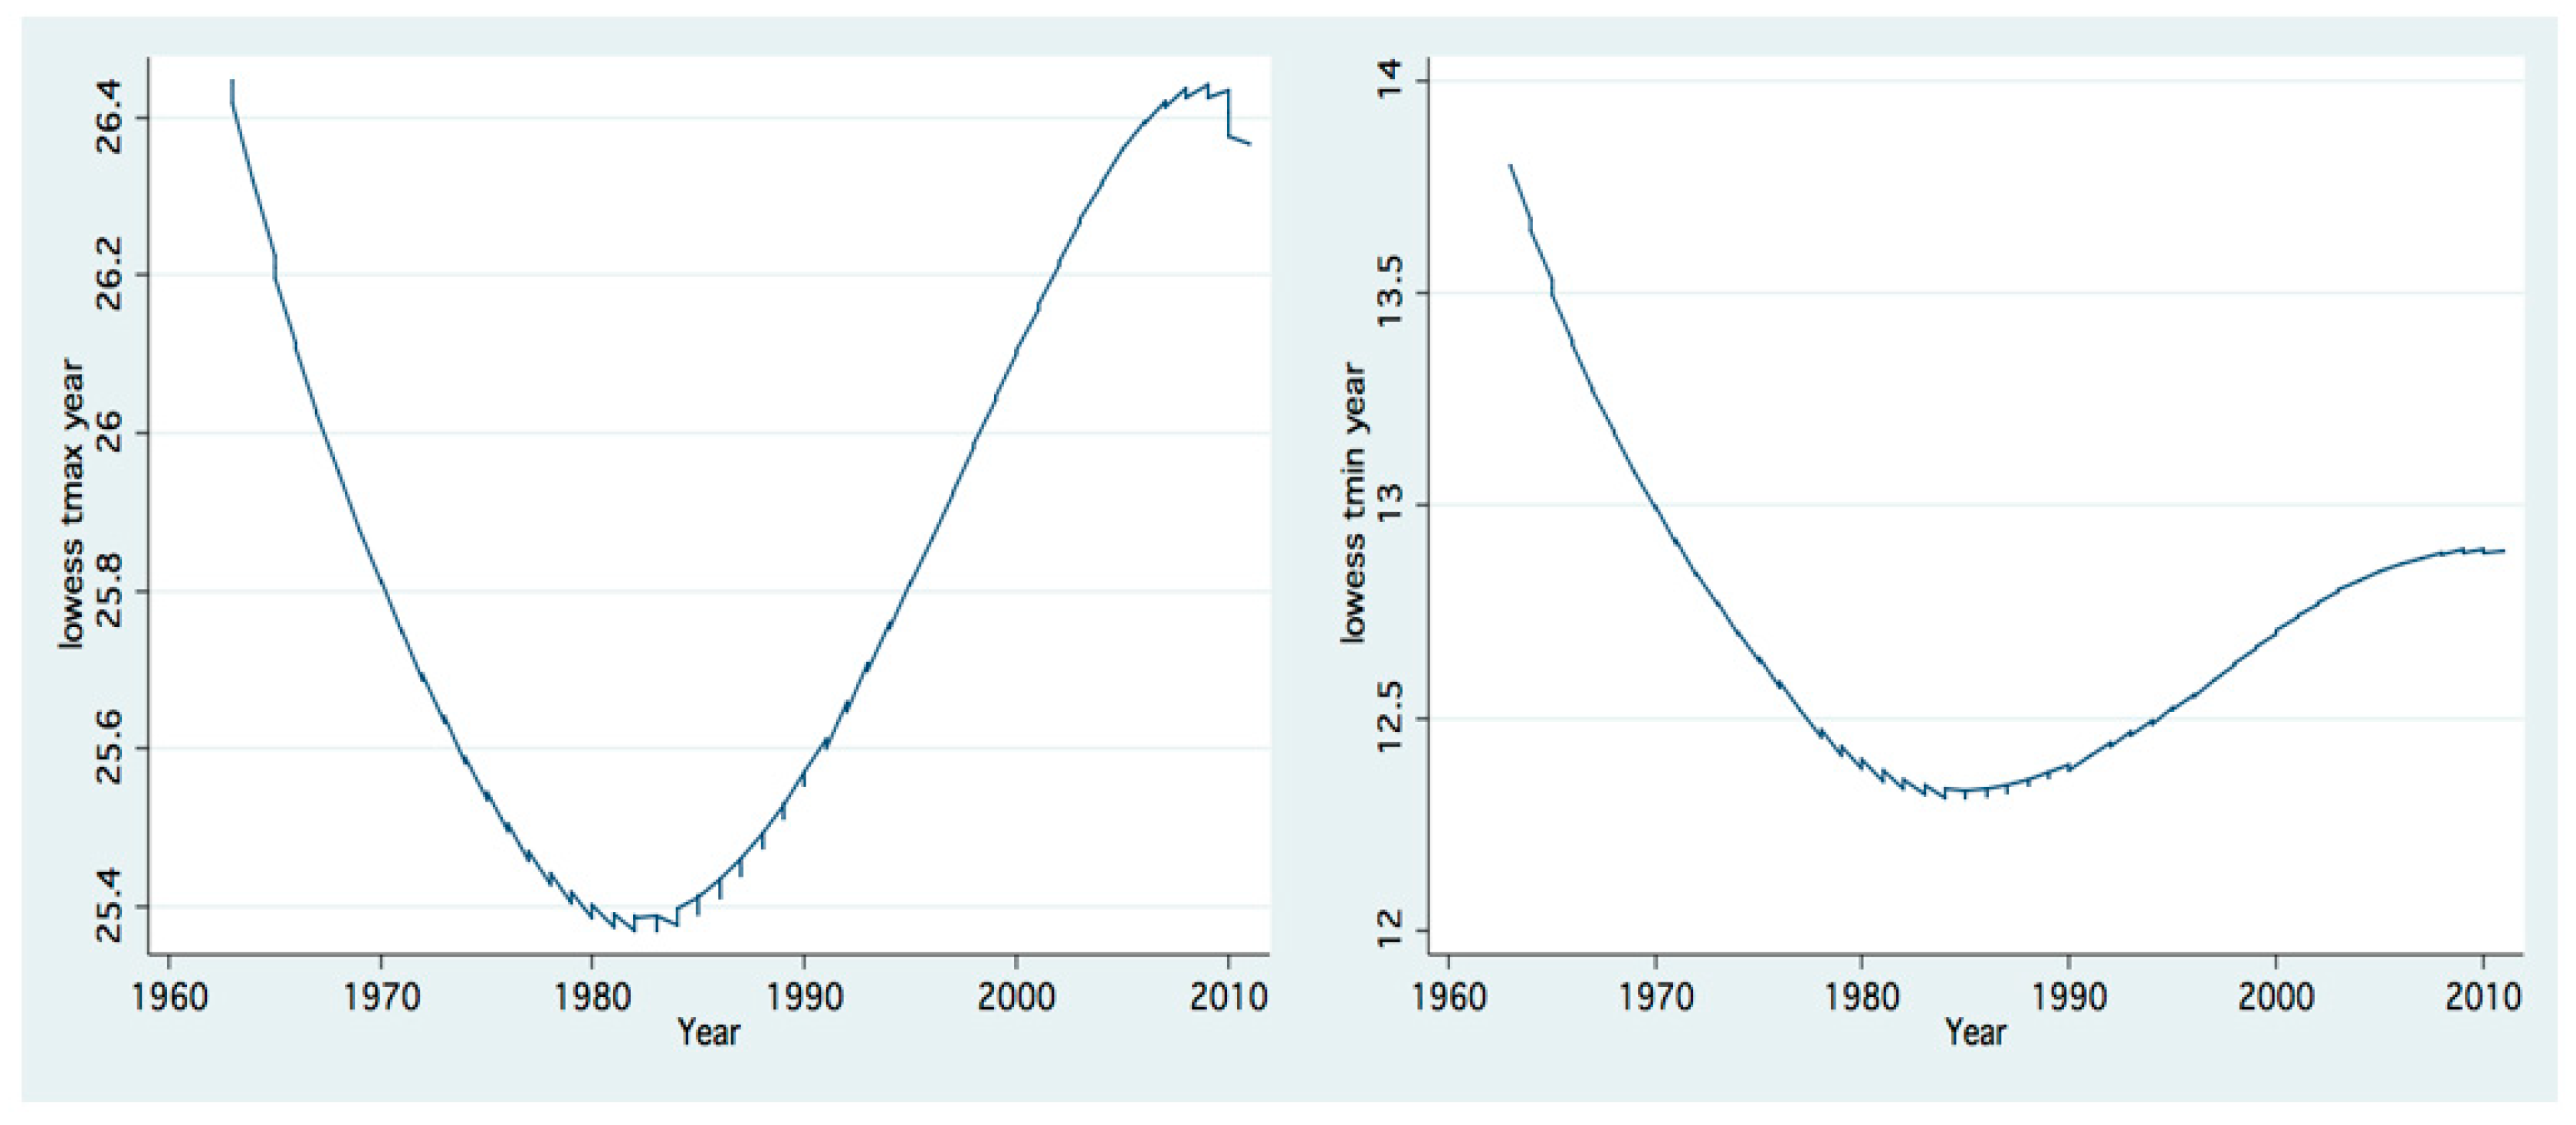
As part of climate change indication, air and water temperature increases since the early 1980s are shown in Figure 16 and Figure 17.
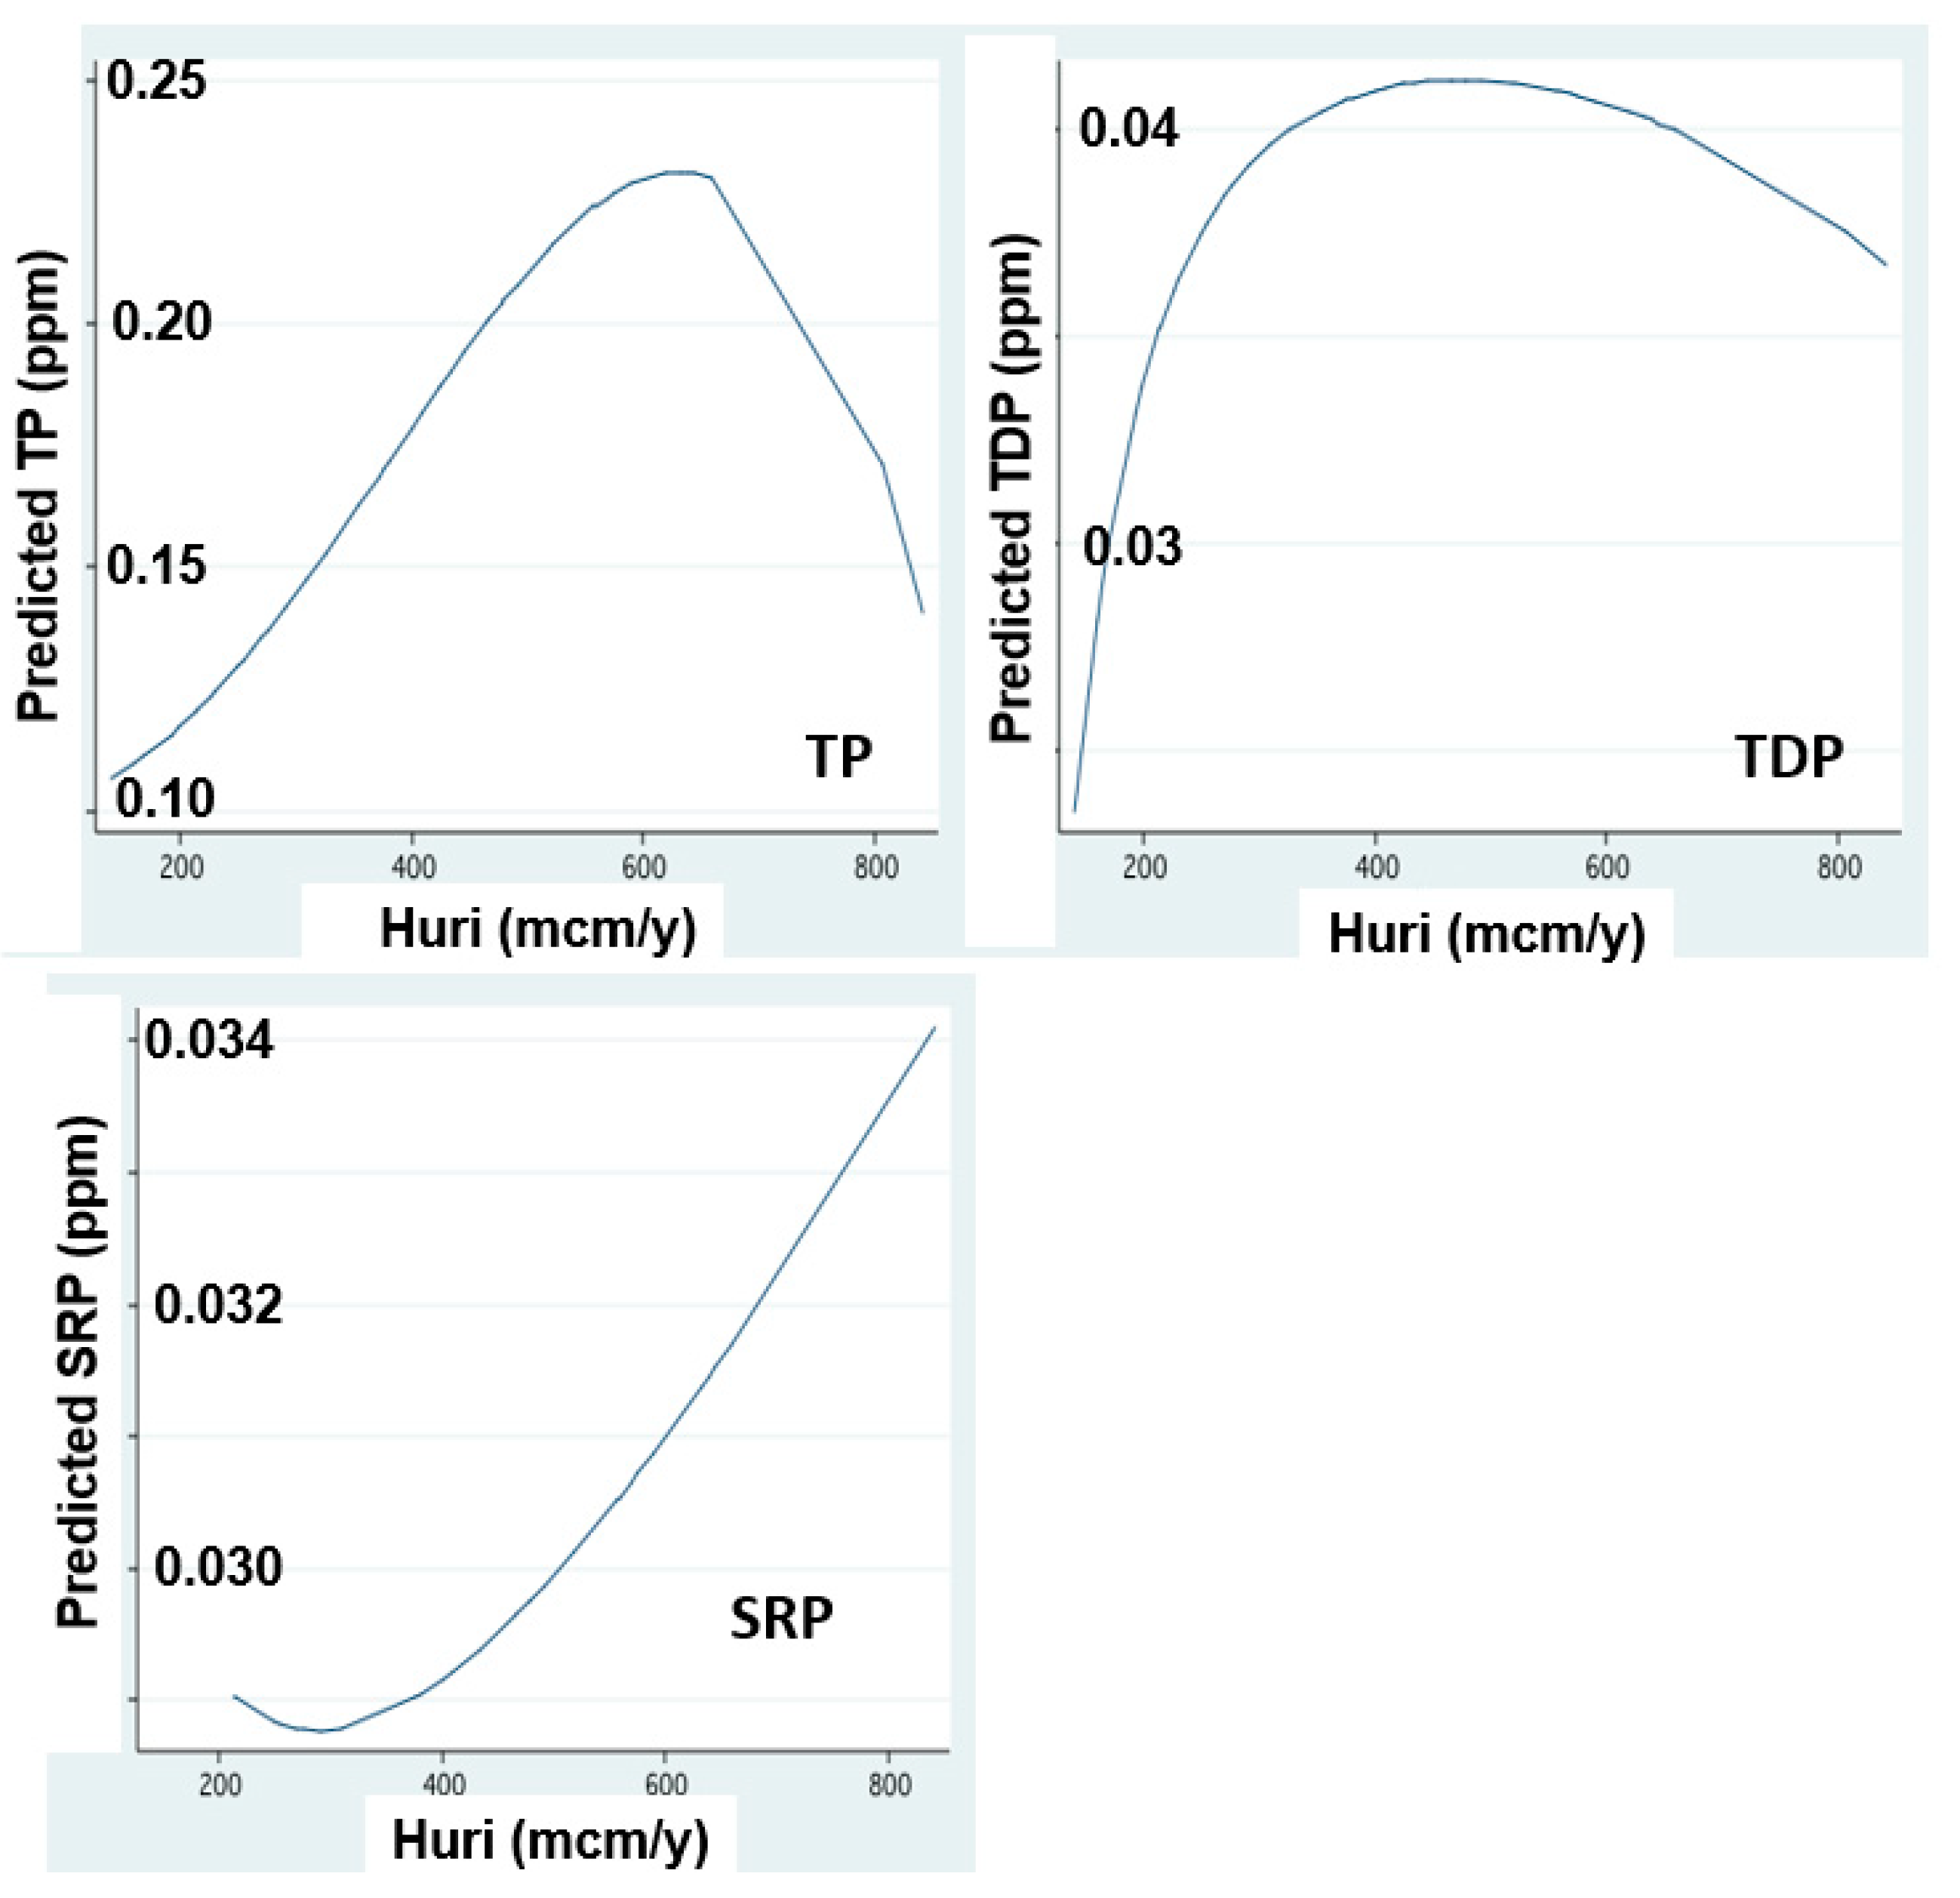
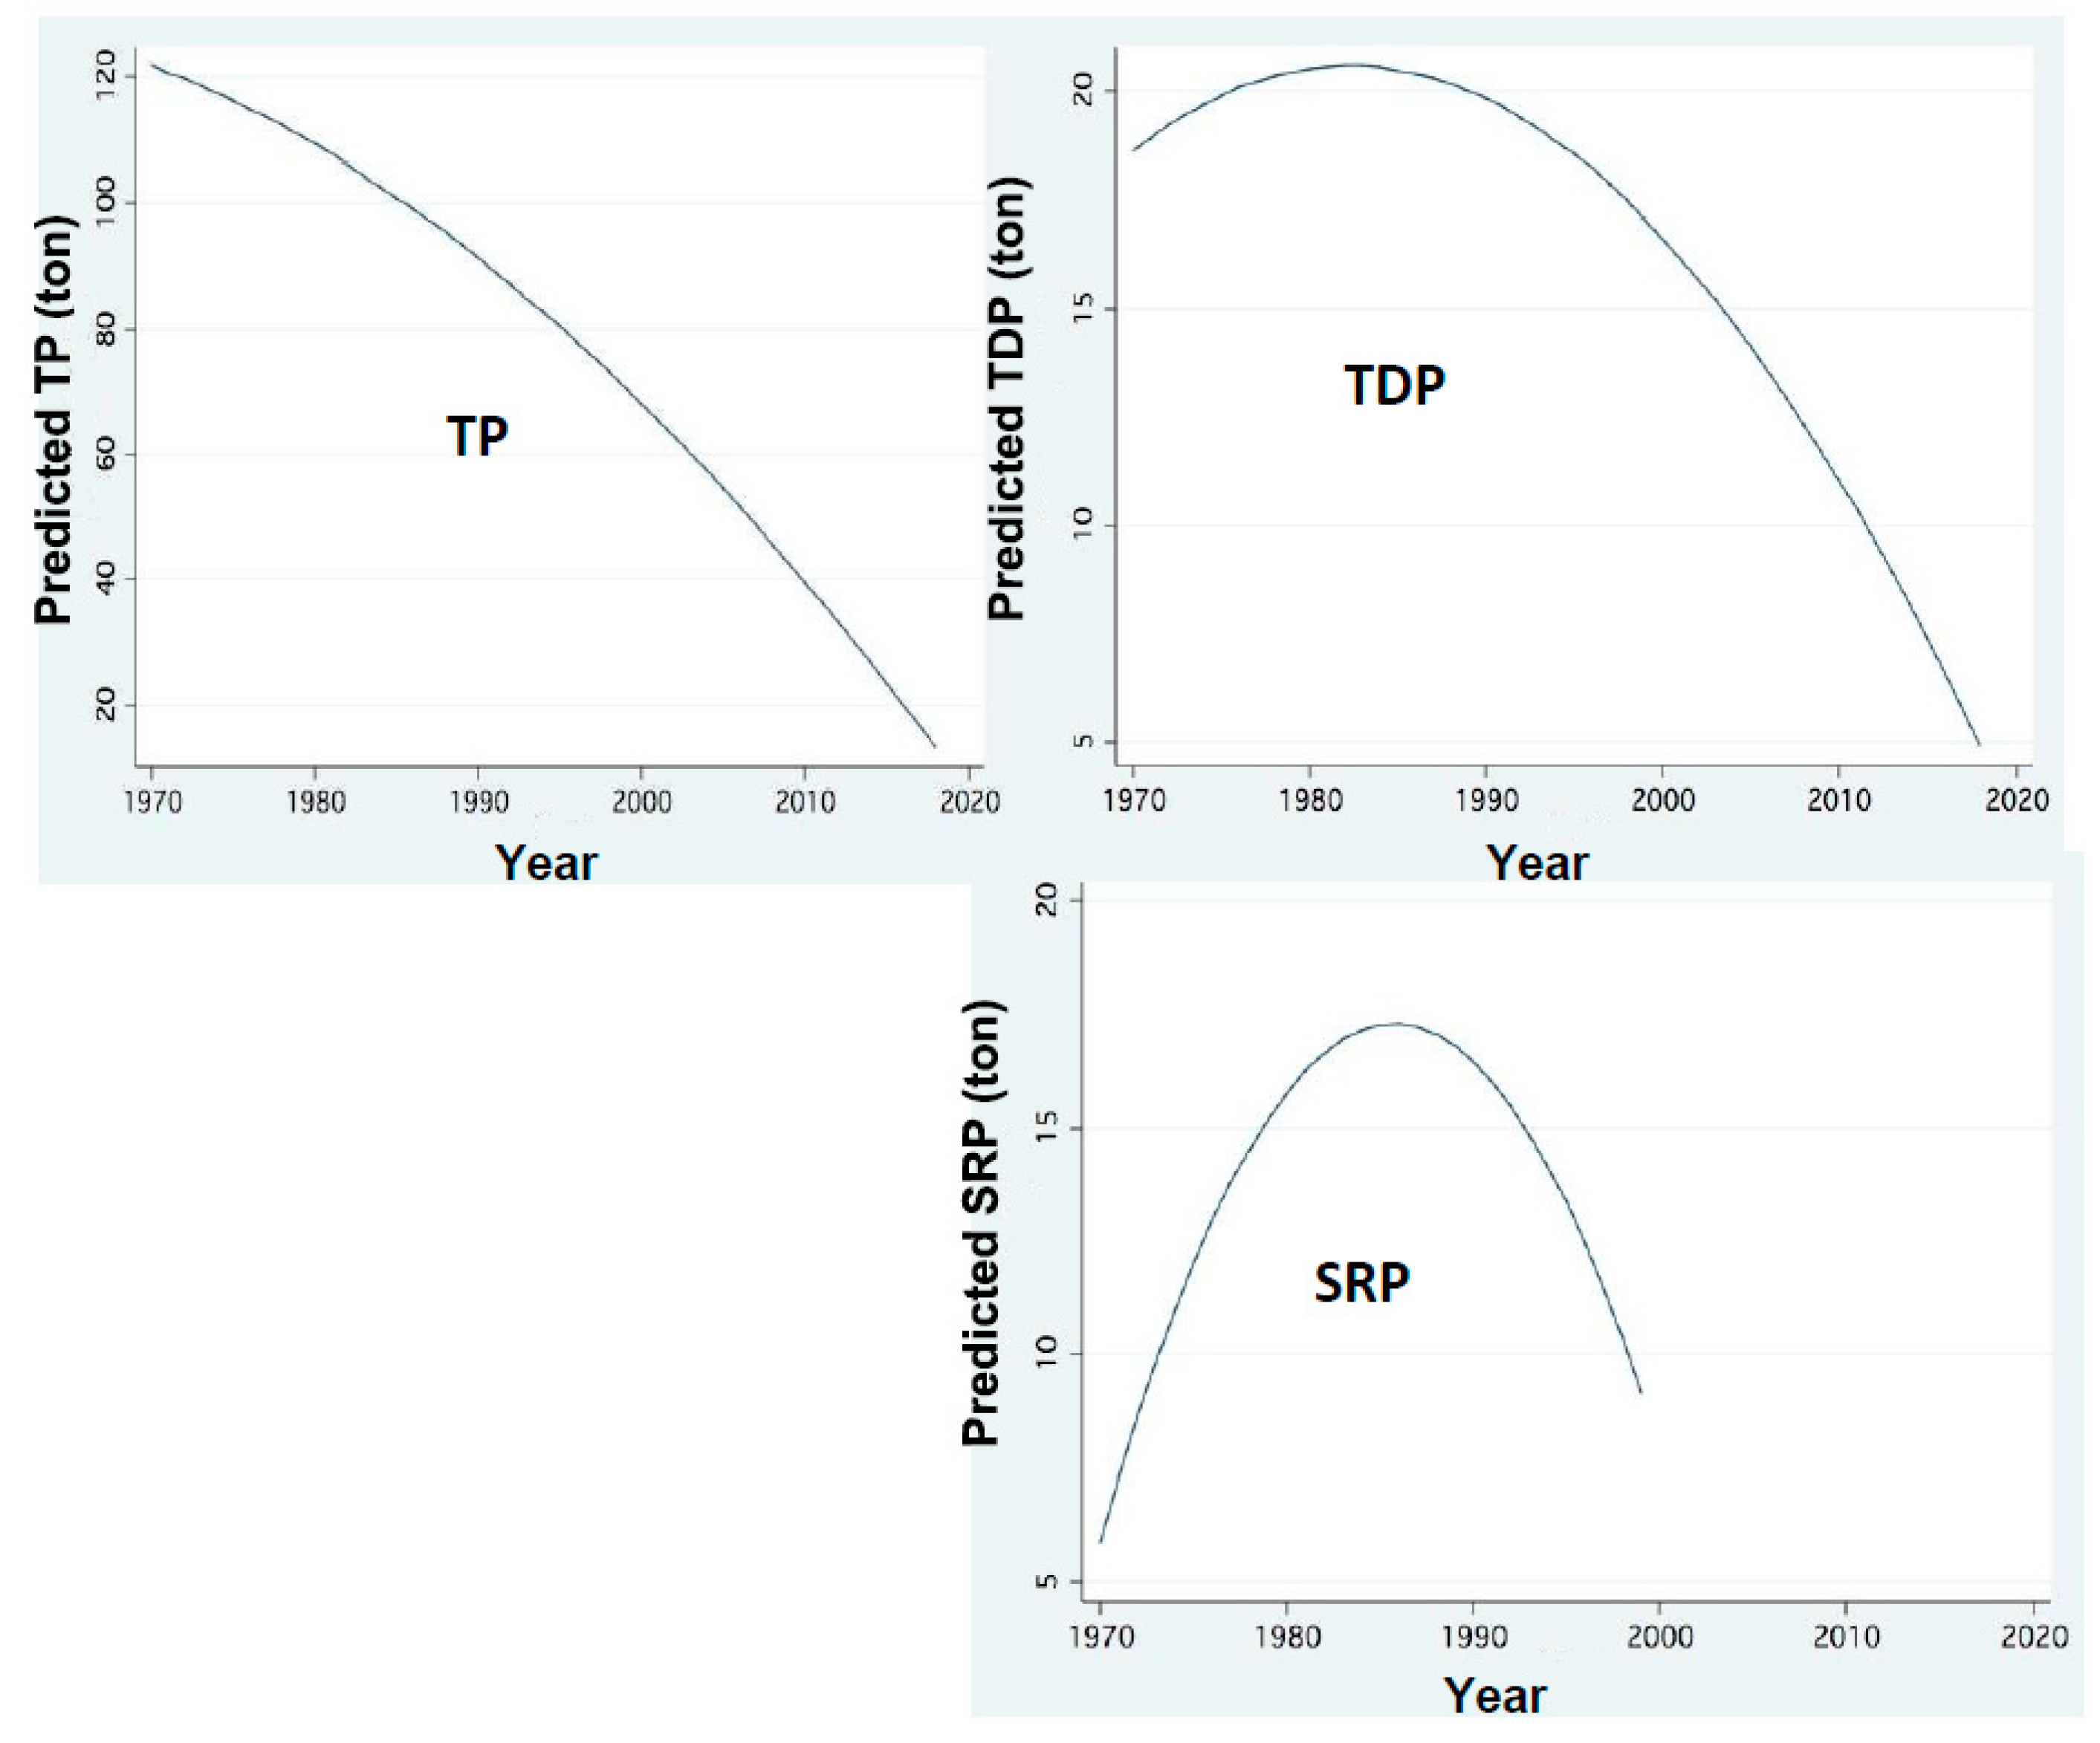
The hydrological symptoms of climate change included in this paper are rainfall and discharge decline [9,10,11] (Figure 3). These conditions resulted in the reduction of water exchange in the lake and prolongation of water residence time (RT). The changes of nitrogen and phosphorus input dynamics through the discharges of River Jordan are shown in Figure 5, Figure 6, Figure 7, Figure 8 and Figure 9 [11,12]. The replacement of Peridinium domination by Cyanobacteria enhancement is presented in Figure 10 and Figure 11. Results given in Figure 9 indicate the impact of RT length on Peridinium and Cyanobacteria densities whilst Figure 12 represents the temporal changes of RT length. The relations between discharges of River Jordan and DIN inputs and their impact on Cyanobacteria are given in Figure 13 and Figure 14. Figure 15 represents the temporal changes of TN and TP total lake standing stocks and mass ratio. As part of climate change indication, air and water temperature increase since the early 1980s are shown in Figure 16 and Figure 17. Results shown in Figure 3 indicate a temporal decline in rainfall and the Jordan River discharge between 1980 and 2020. Two exceptions of the Jordan River discharge are indicated (Figure 3): 842 and 807 mcm/y in the winters of 1991–2 and 2003–4, respectively. Results shown in Figure 2 indicate an increase of TP, TDP and SRP concentrations (ppm) in Jordan waters in relation to the river discharge. The increase in SRP concentration is positively related to the elevation in the discharge range of 200–800 mcm/y whilst that of TP and TDP is between 200–600 mcm/y. Results shown in Figure 3 for TP and TDP annual input loads through Jordan waters (ton/y) were decreased since the 1980s with respect to the decrease in rainfall and discharge (Figure 3). The distribution pattern of SRP was different and increased between 1970 and 1990, followed by a decline afterwards.
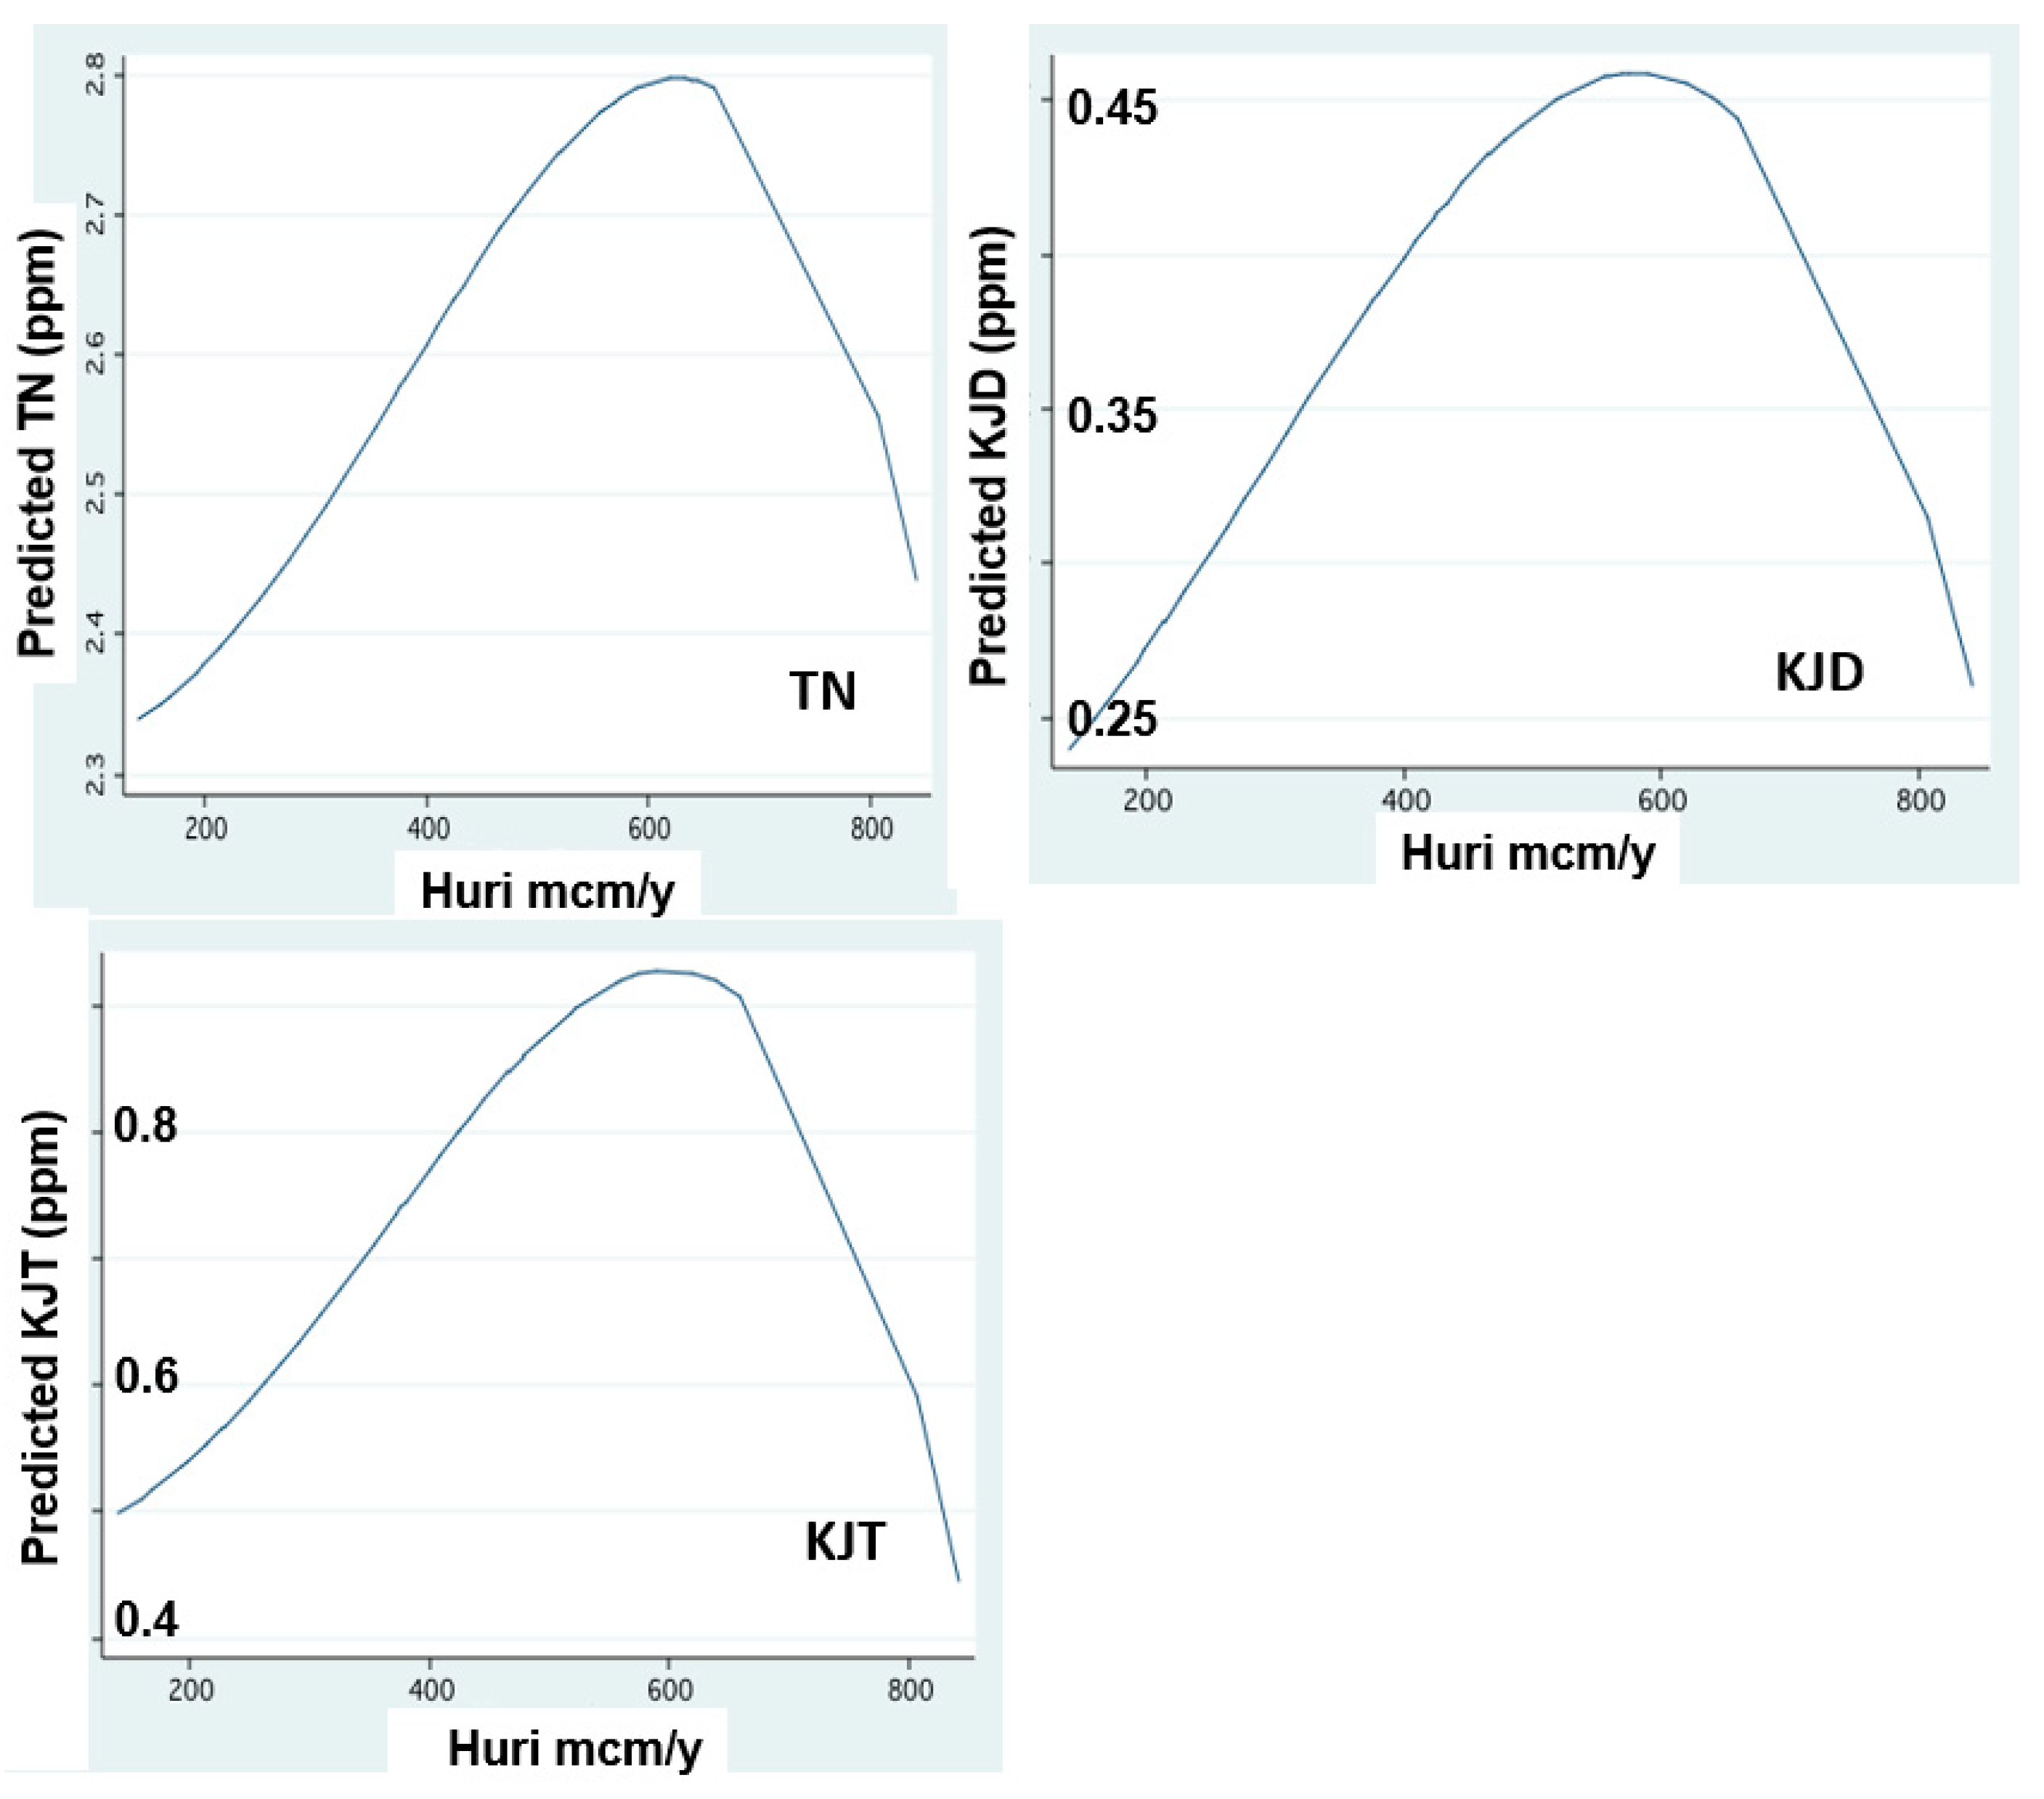
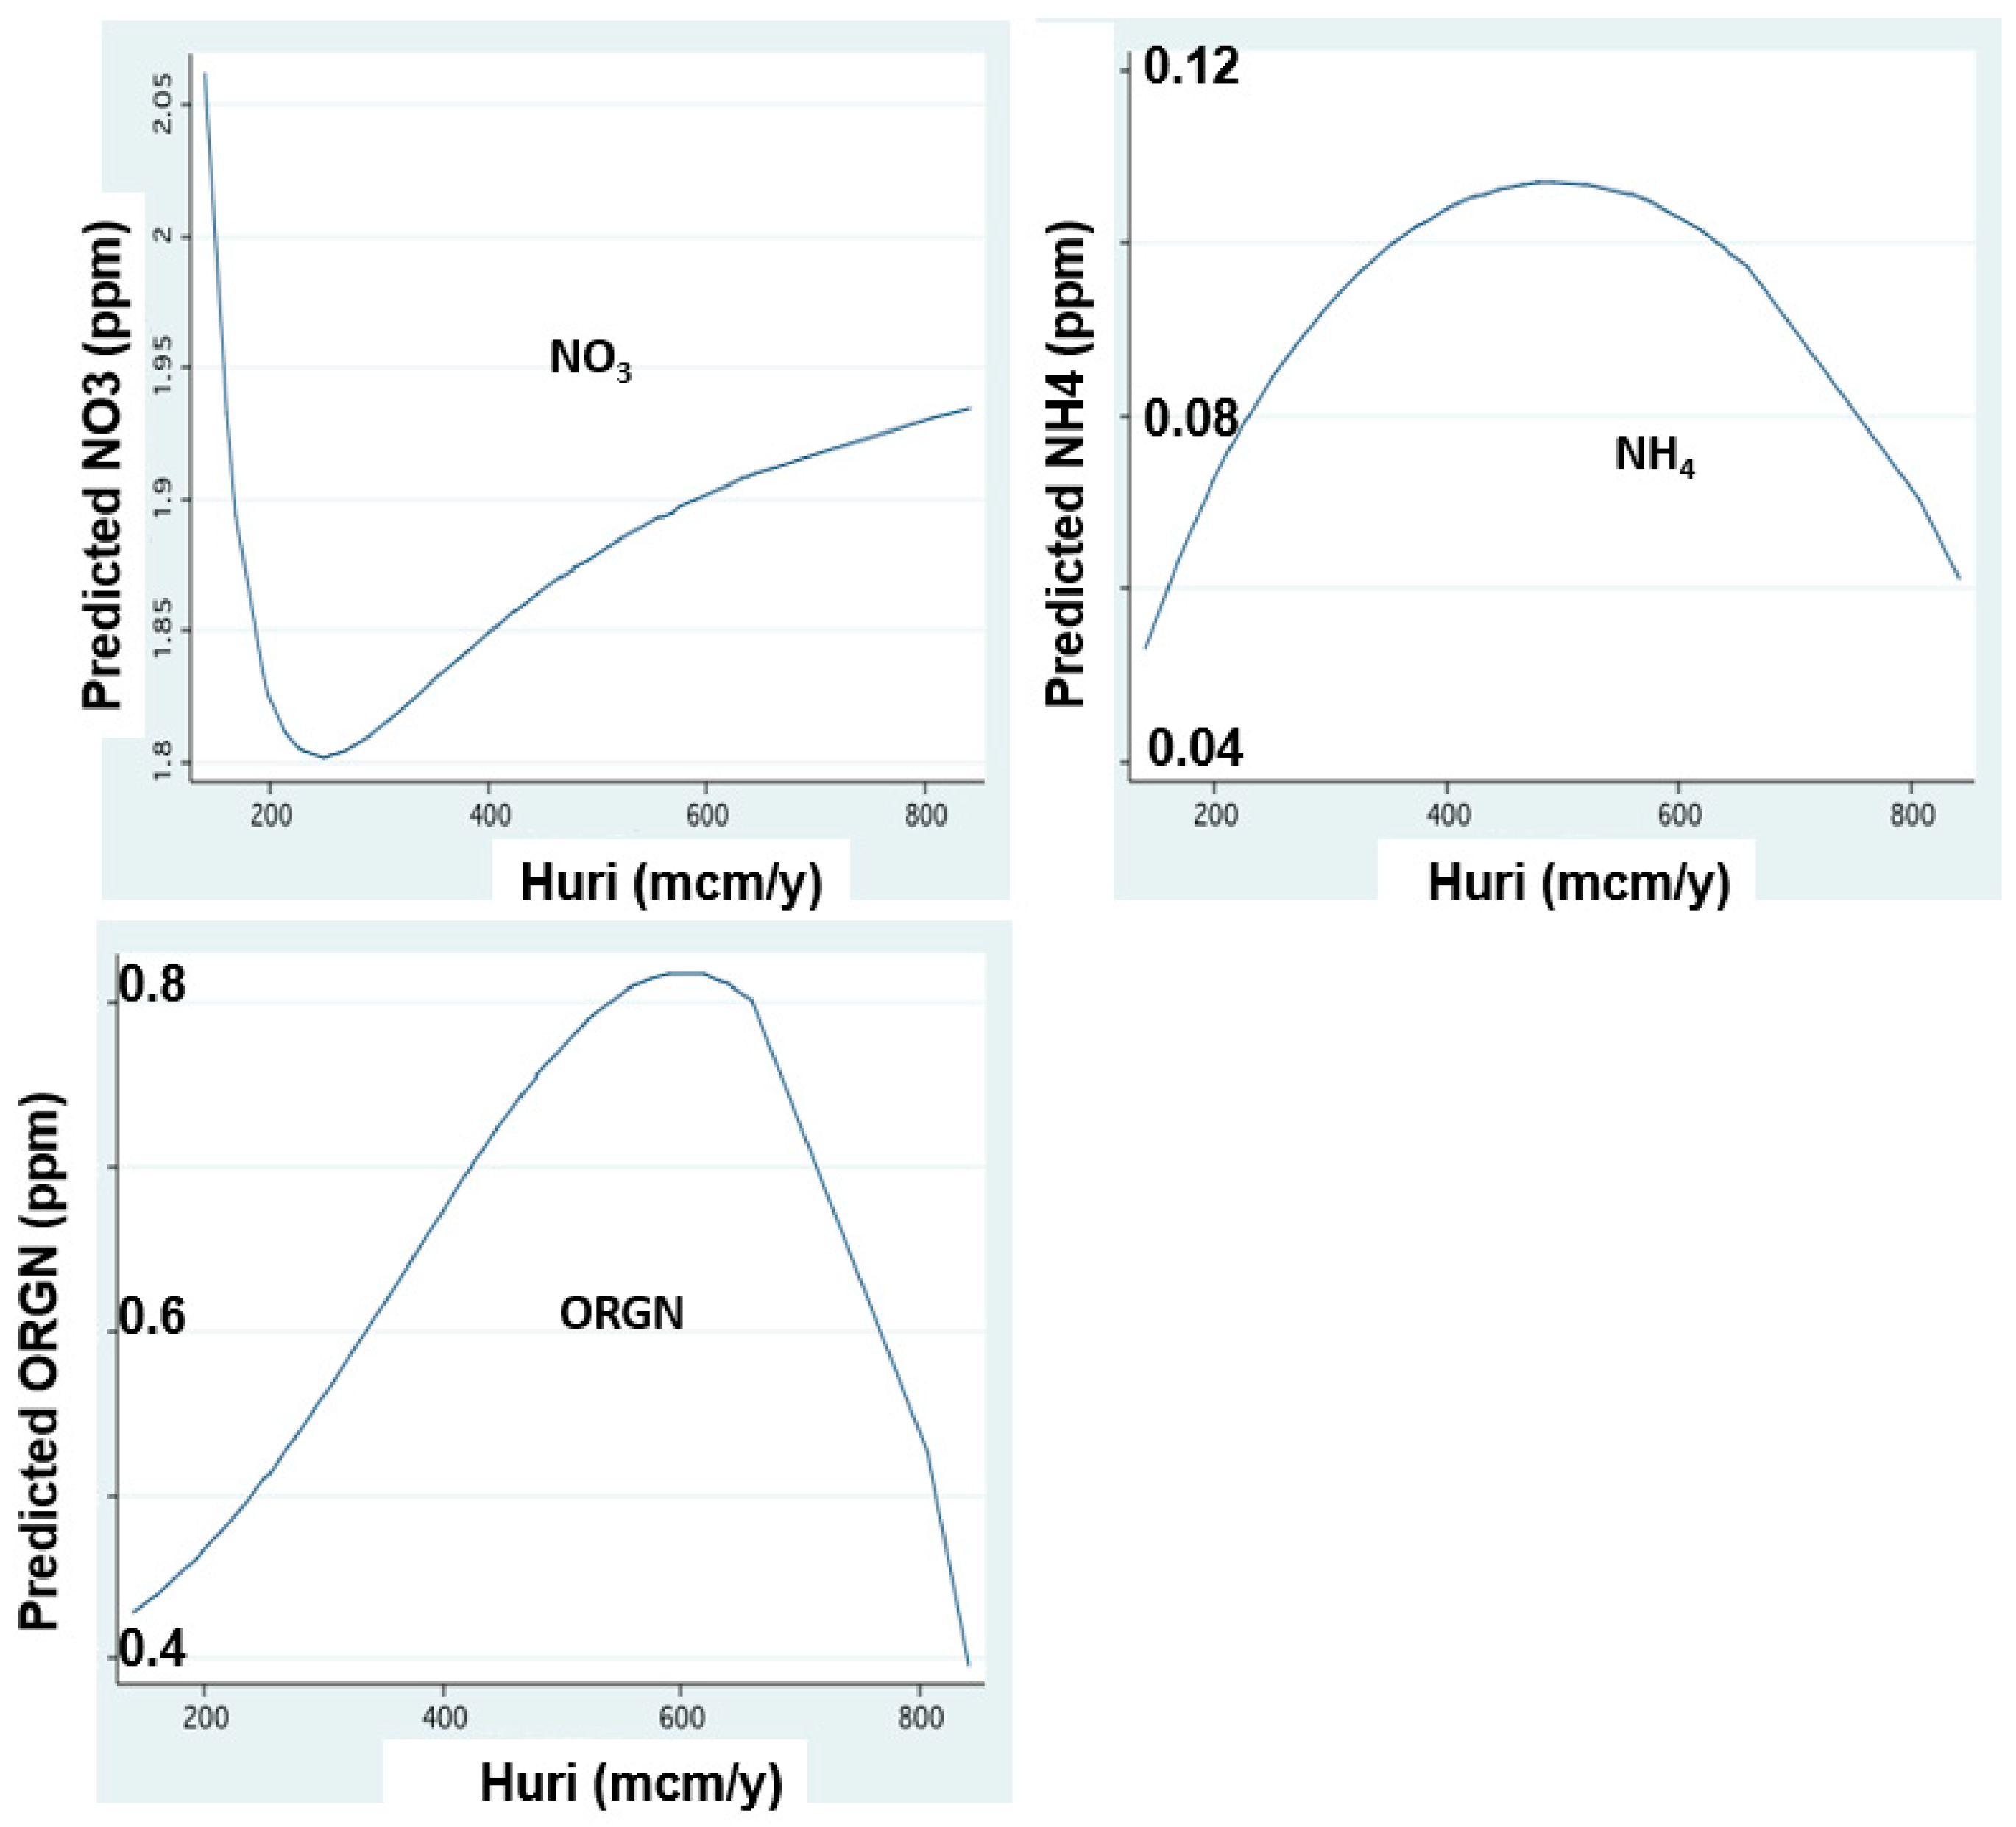
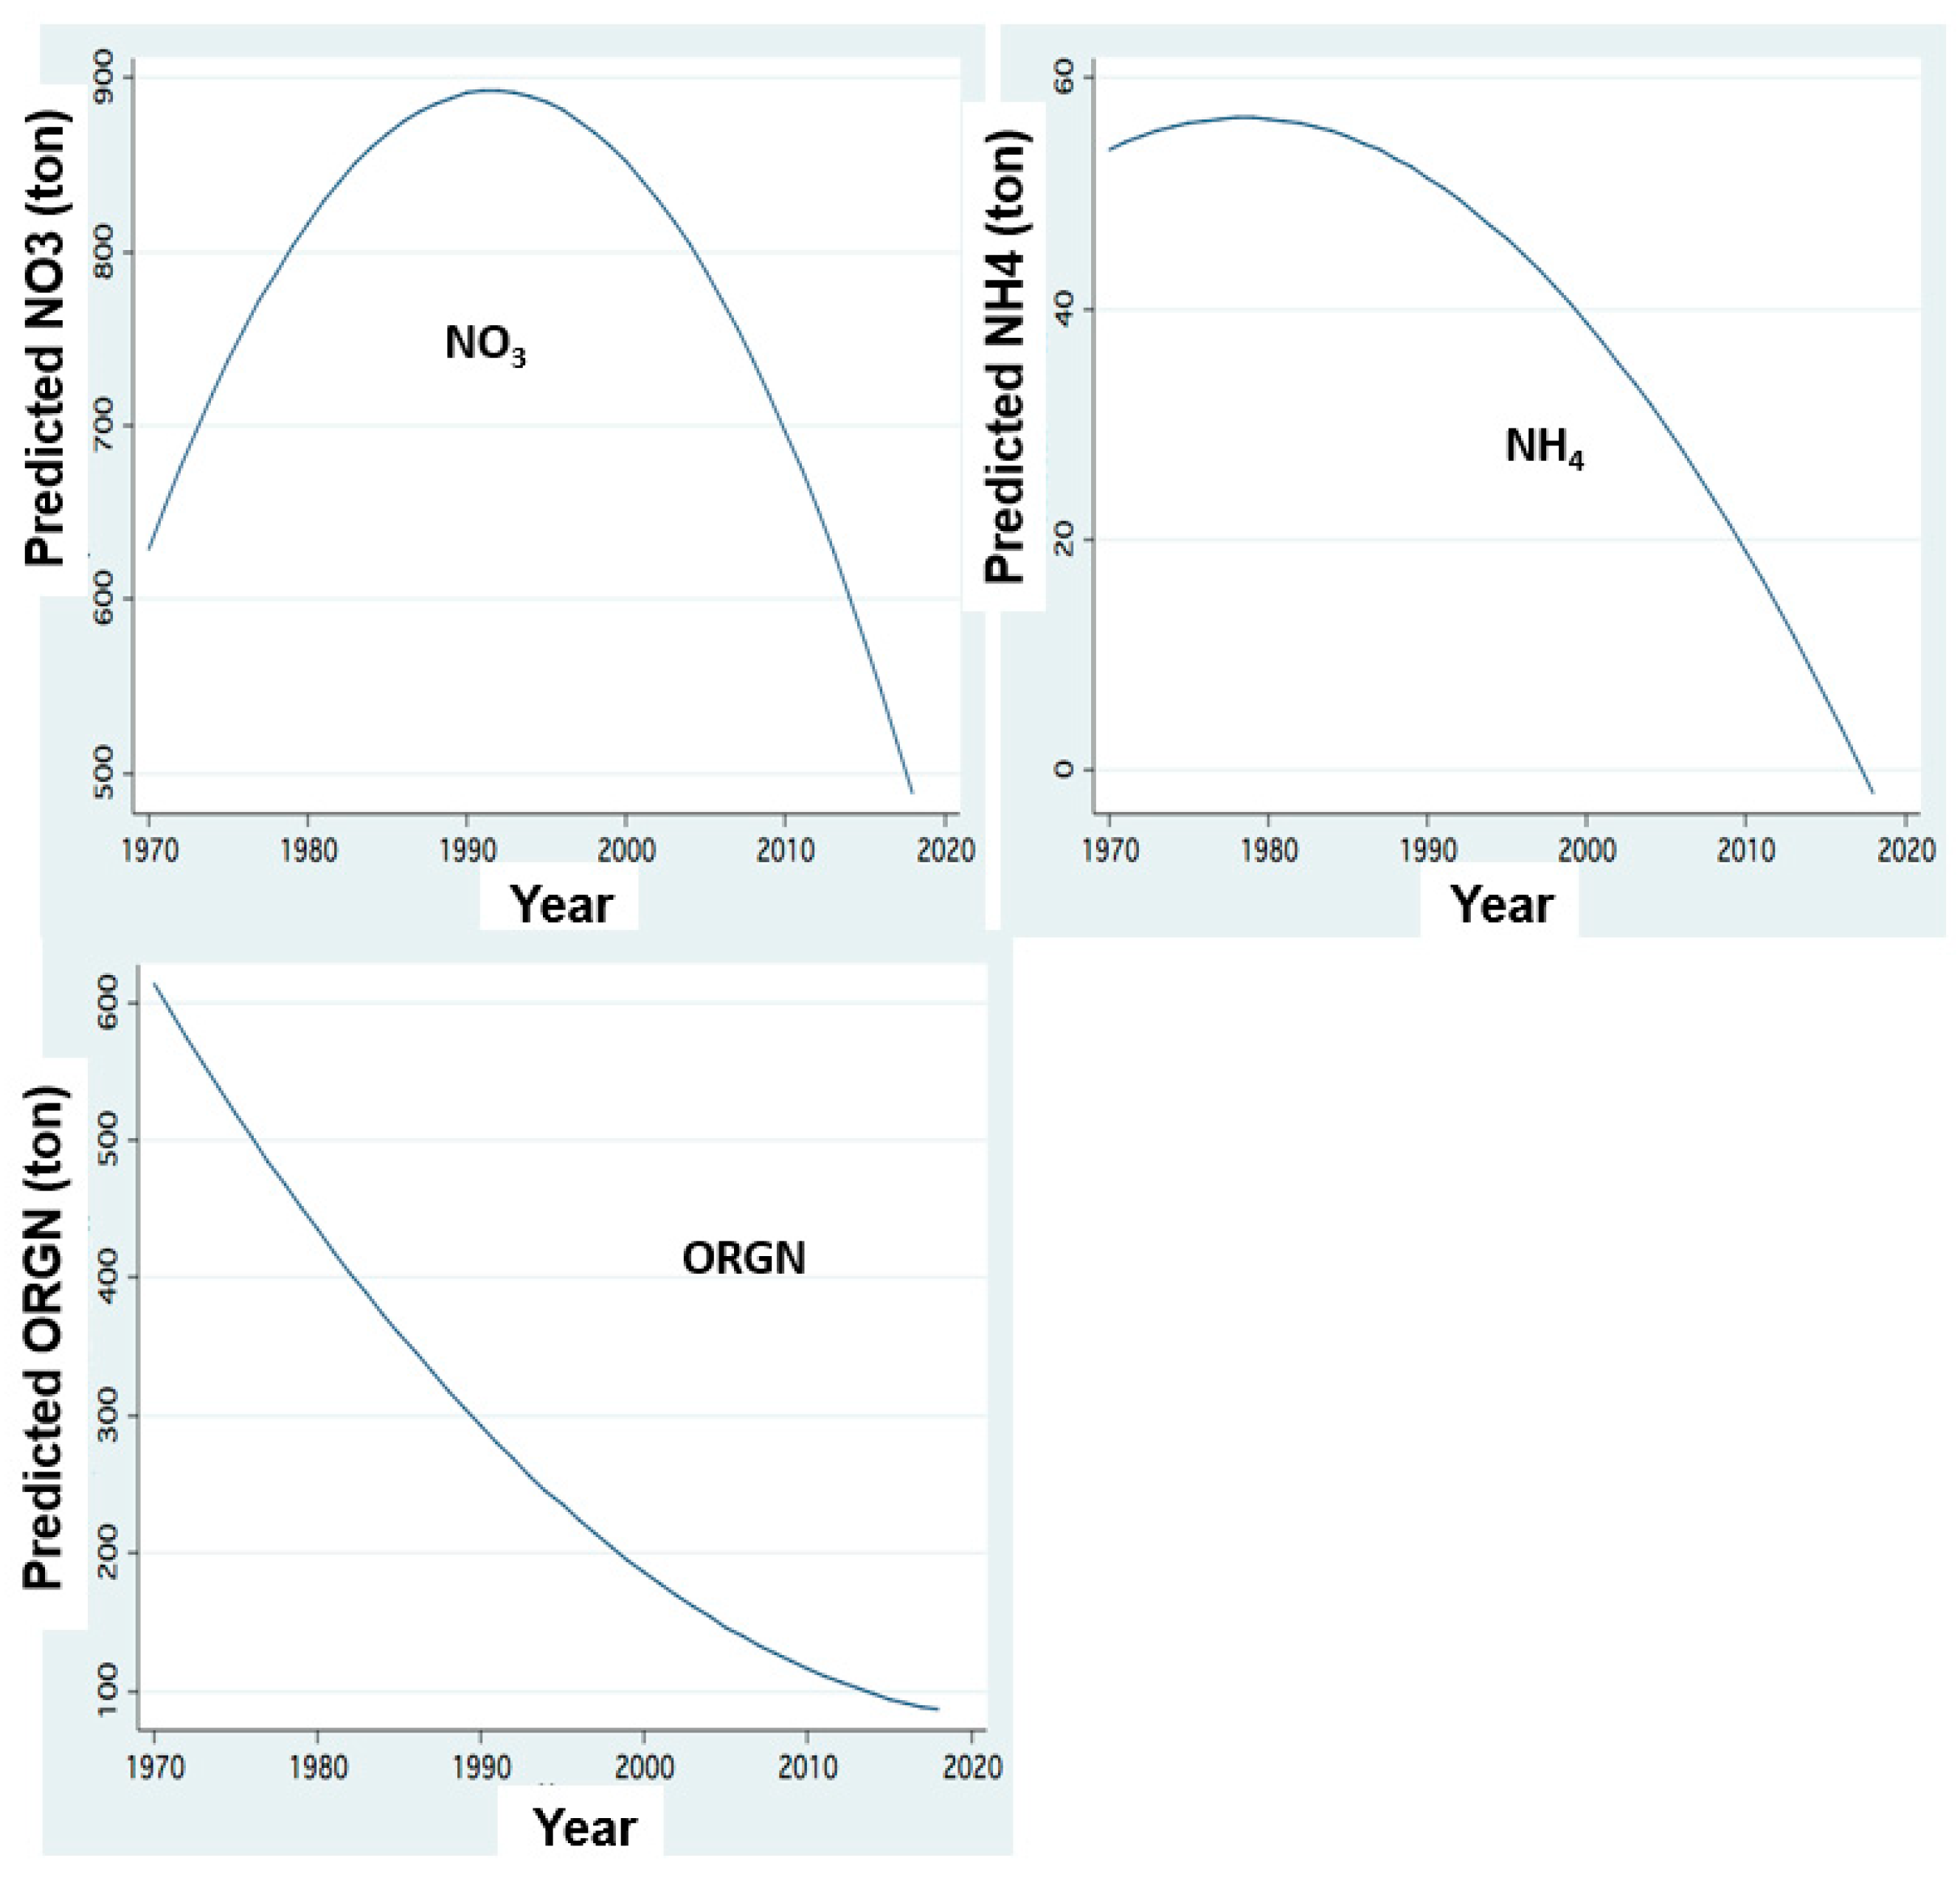
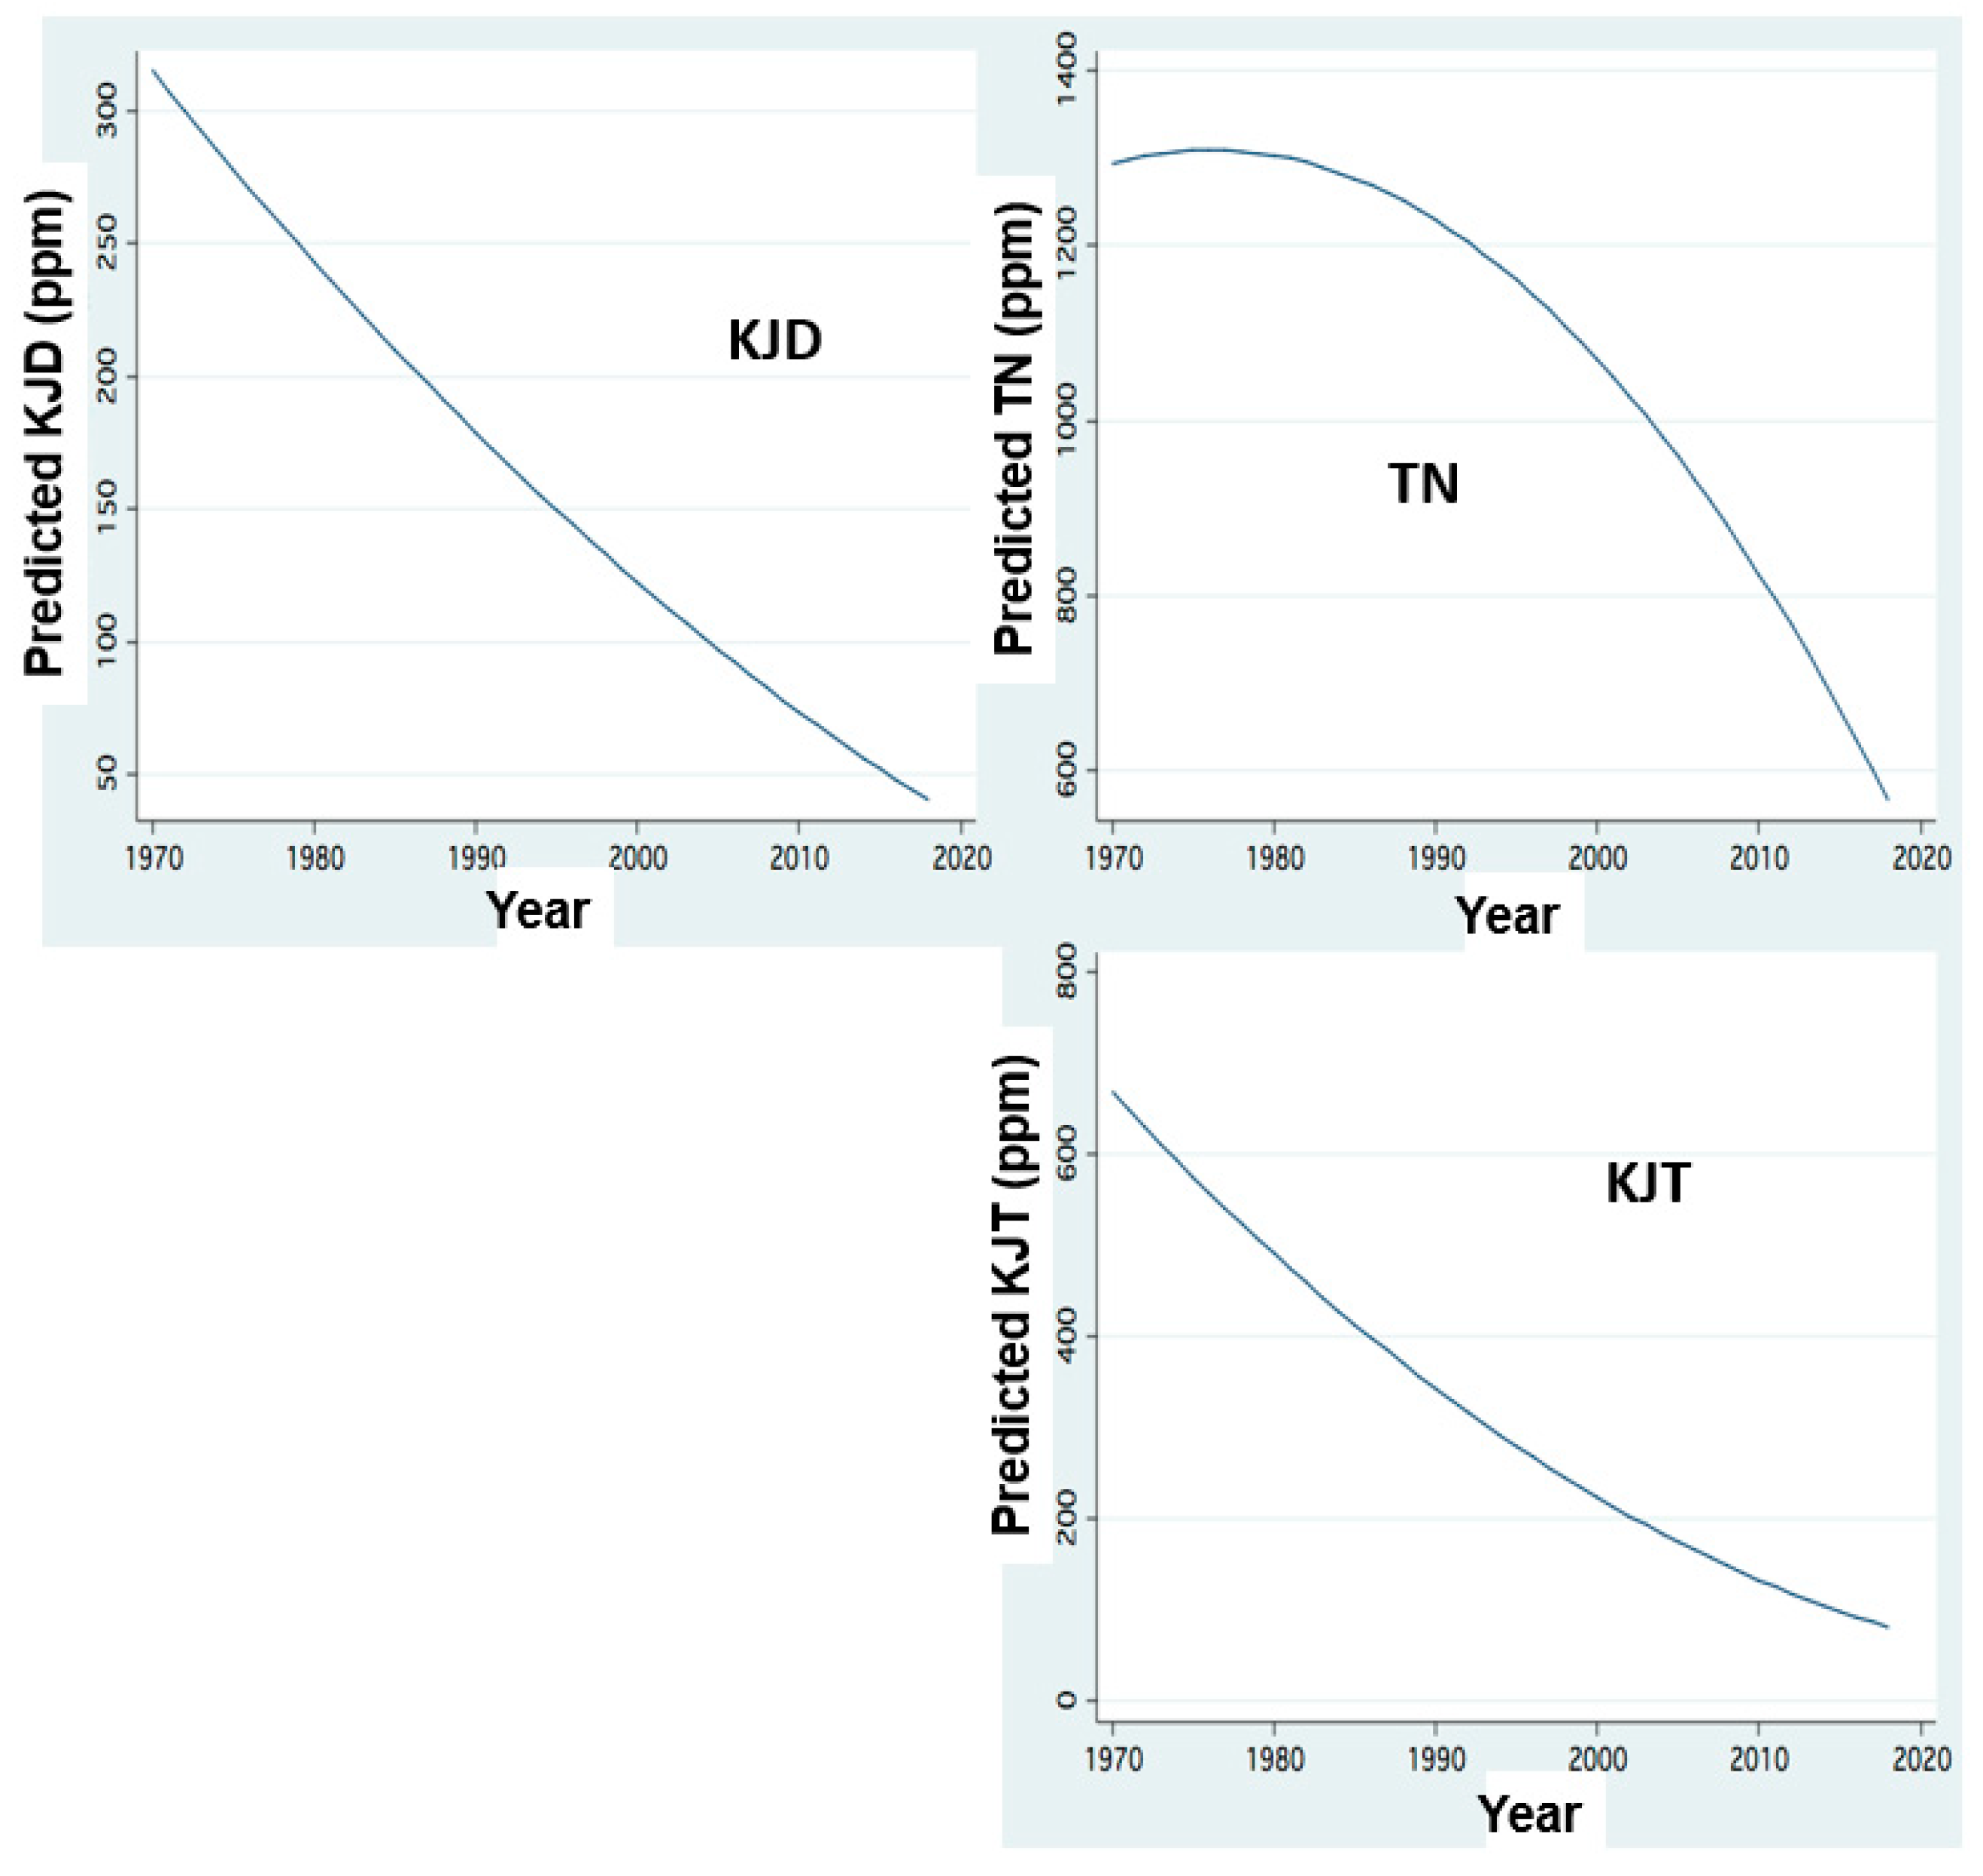
The temporal changes of nitrogen form dynamics supplied by the Jordan discharges are shown in Figure 6, Figure 7, Figure 8 and Figure 9. These results indicate an increase in the concentrations of all nitrogen forms in relation to the river discharge elevation below 600 mcm. Moreover, temporal changes of nitrogen form loads (tons/y) represent temporal decline since the mid-1980s except those of organic nitrogen which continually declined between 1970 and 2020. The decline of nitrogen form loads since the mid-1980s is correlated with the rainfall and discharge decline (Figure 3).
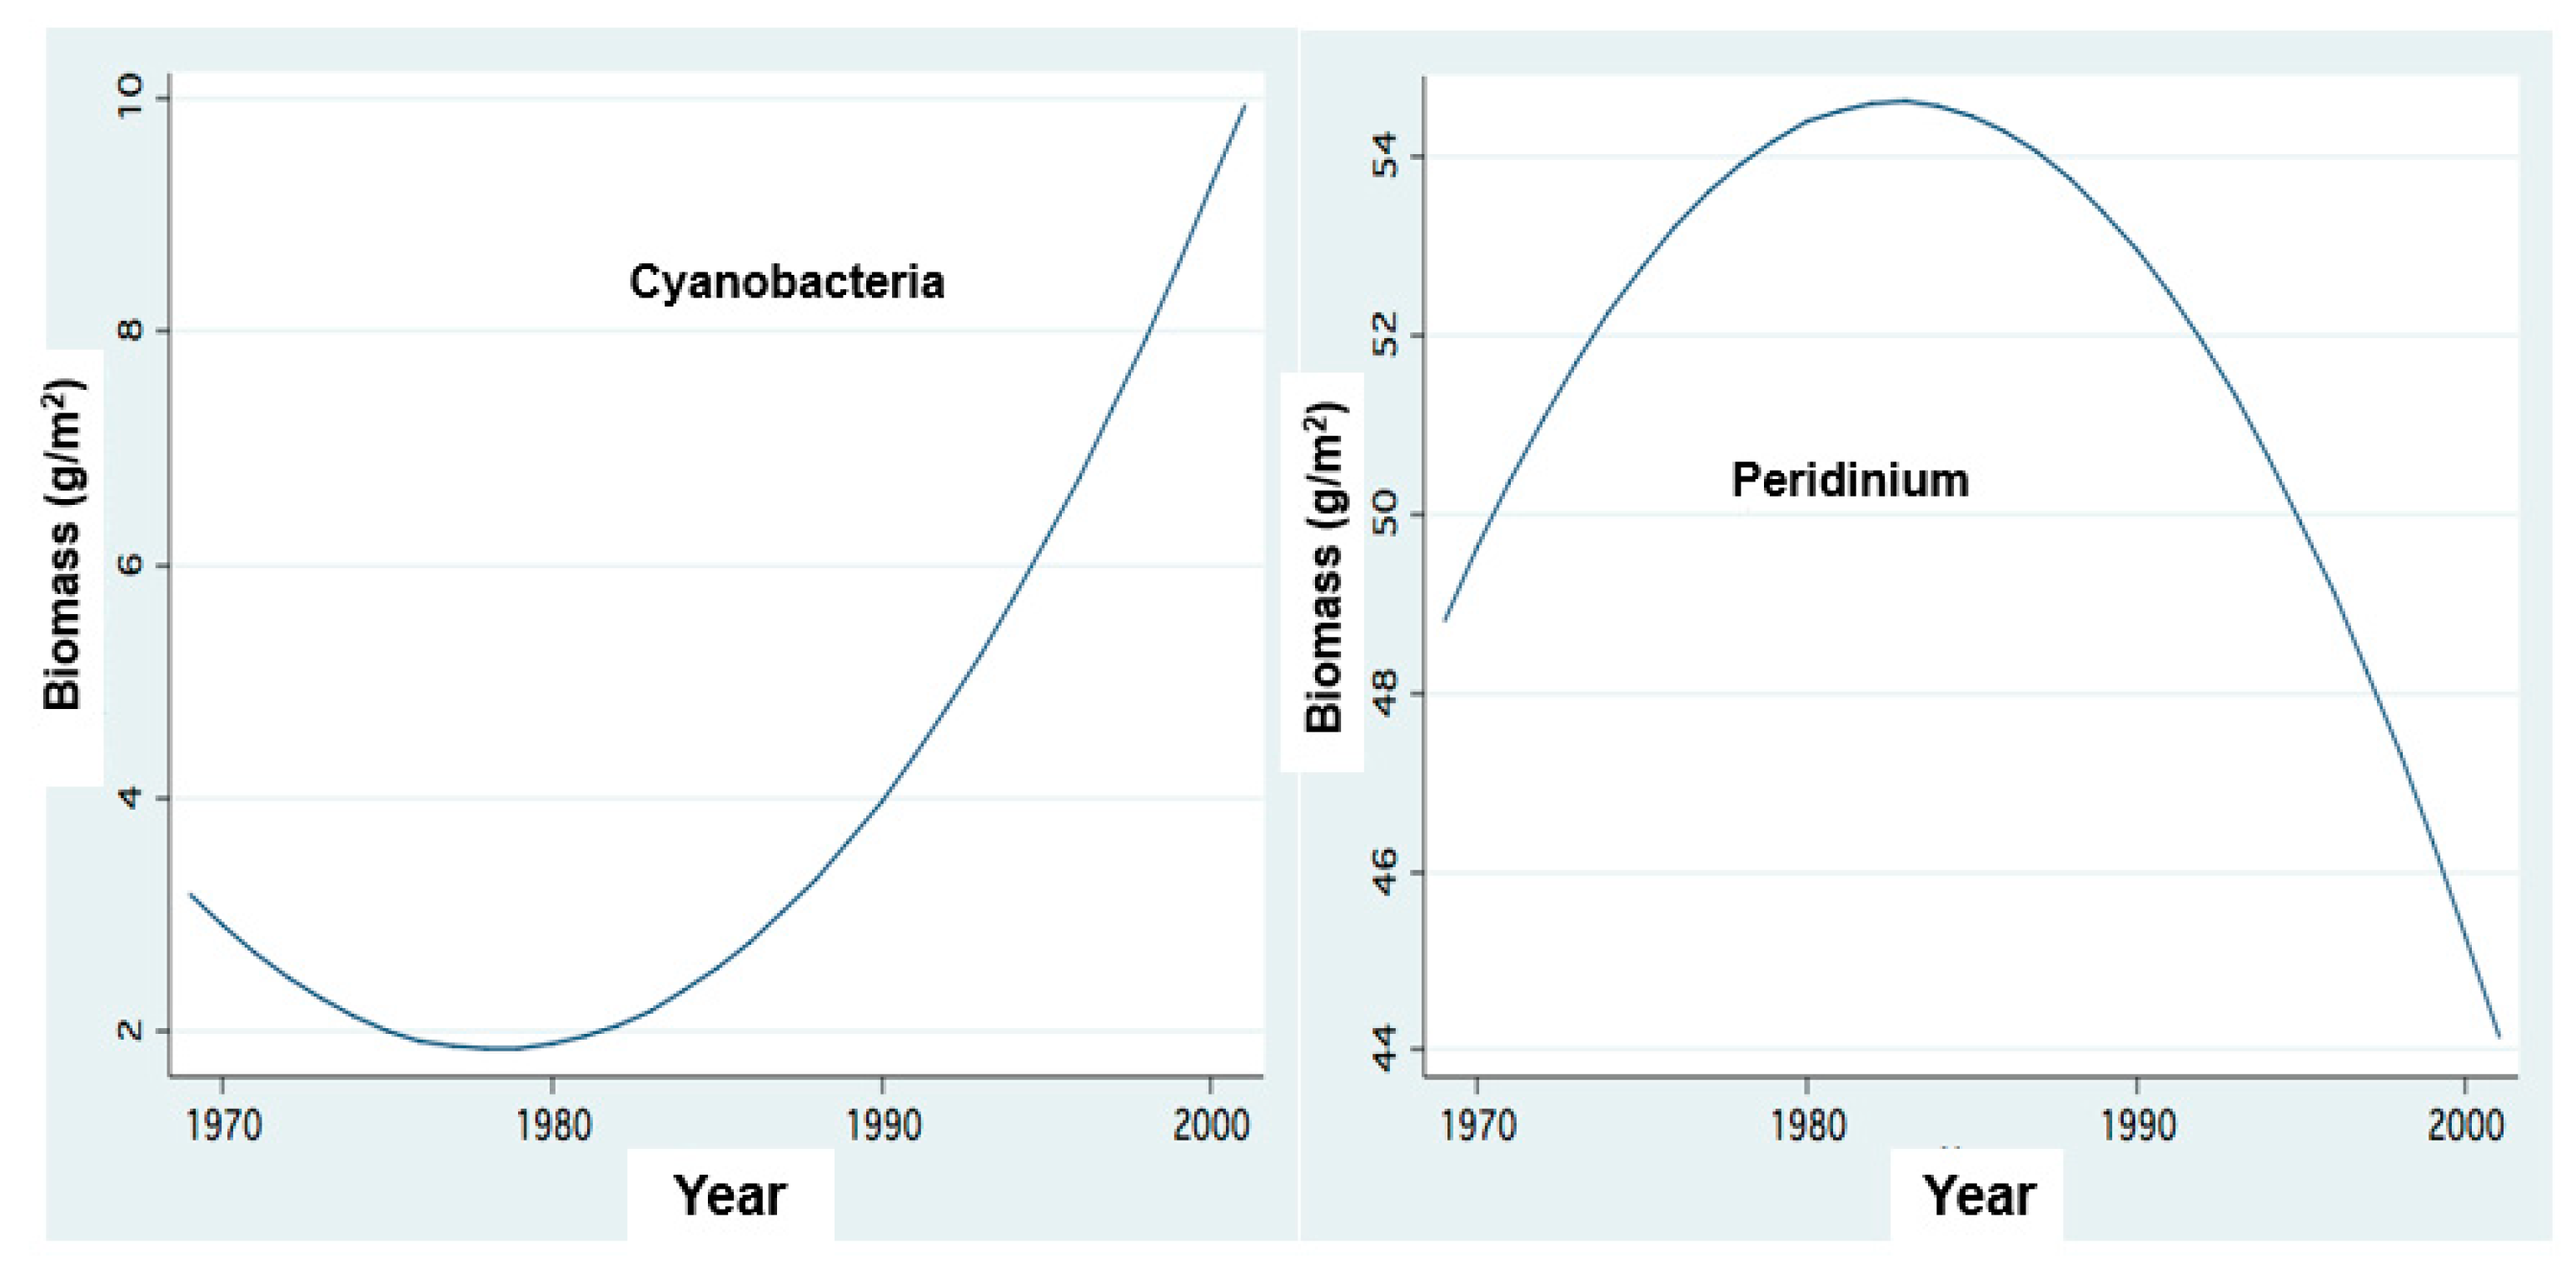
Before the 1990s, algal biomass in Lake Kinneret was dominated by Peridinium, commonly accompanied by Chlorophyta and Diatom. After the 1990s, Peridinium domination was replaced by Cyanobacteria, accompanied by Diatoms and Chlorophyta) [1,4,11].
Documentation of the concentration of cyanobacterial toxins in Lake Kinneret is shown in Table 1 [4]. It has to be considered that no impact of HFCB toxicity on Kinneret zooplankton and fishes [13,14,15,16,17] was not indicated.
Taking into account the maximal level measured in 2016 of 93.8 micrograms per gram DW when maximal biomass of HFCB documented between January and June was 12 g(ww) per m2 [4] and 40% DW of WW, the total (Lake Kinneret surface area—168×106 m2) weight of Microcystins in Lake Kinneret waters was about 76 kg.
The first record of the toxic Aphanizomenon ovalisporum in Lake Kinneret in July 1994 was an indication that the water quality might have been threatened. Nevertheless, it was not a real surprise. Seven years earlier, the possibility had been predicted. Moreover, blooms of Microcystis spp. were observed several times before then. The bloom of Aphanizomenon indicated a significant modification accompanied by the cessation of Peridinium annual bloom. Consequently, this 1994 modification reflected a long-term change of ecosystem. As in similar widely known changes, the change in the nutrient dynamics was likely a major part of the reasons [18,19,20,21,22,23,24]. Change in nutrient dynamics was reasonably justified but further study about the reason for those changes was incomplete. This paper is a tentative confirmation of the impact of climate change on nutrient dynamics and consequent modification of Phytoplankton composition. Likely, climate changes of temperature increase and decline in rainfall and water discharges caused the decline of Peridinium and Cyanobacteria enhancement [25,26,27,28,29]. It is suggested that rainfall and river discharge decline caused the reduction of nitrogen supply [29]. The result was that the Peridinium domination was replaced by the Cyanobacteria, including HFCB [17,18,19,20,21,22,23]. Change in patterns of rainfall [15] probably also enhanced the concentration of Cyanobacterial toxins.
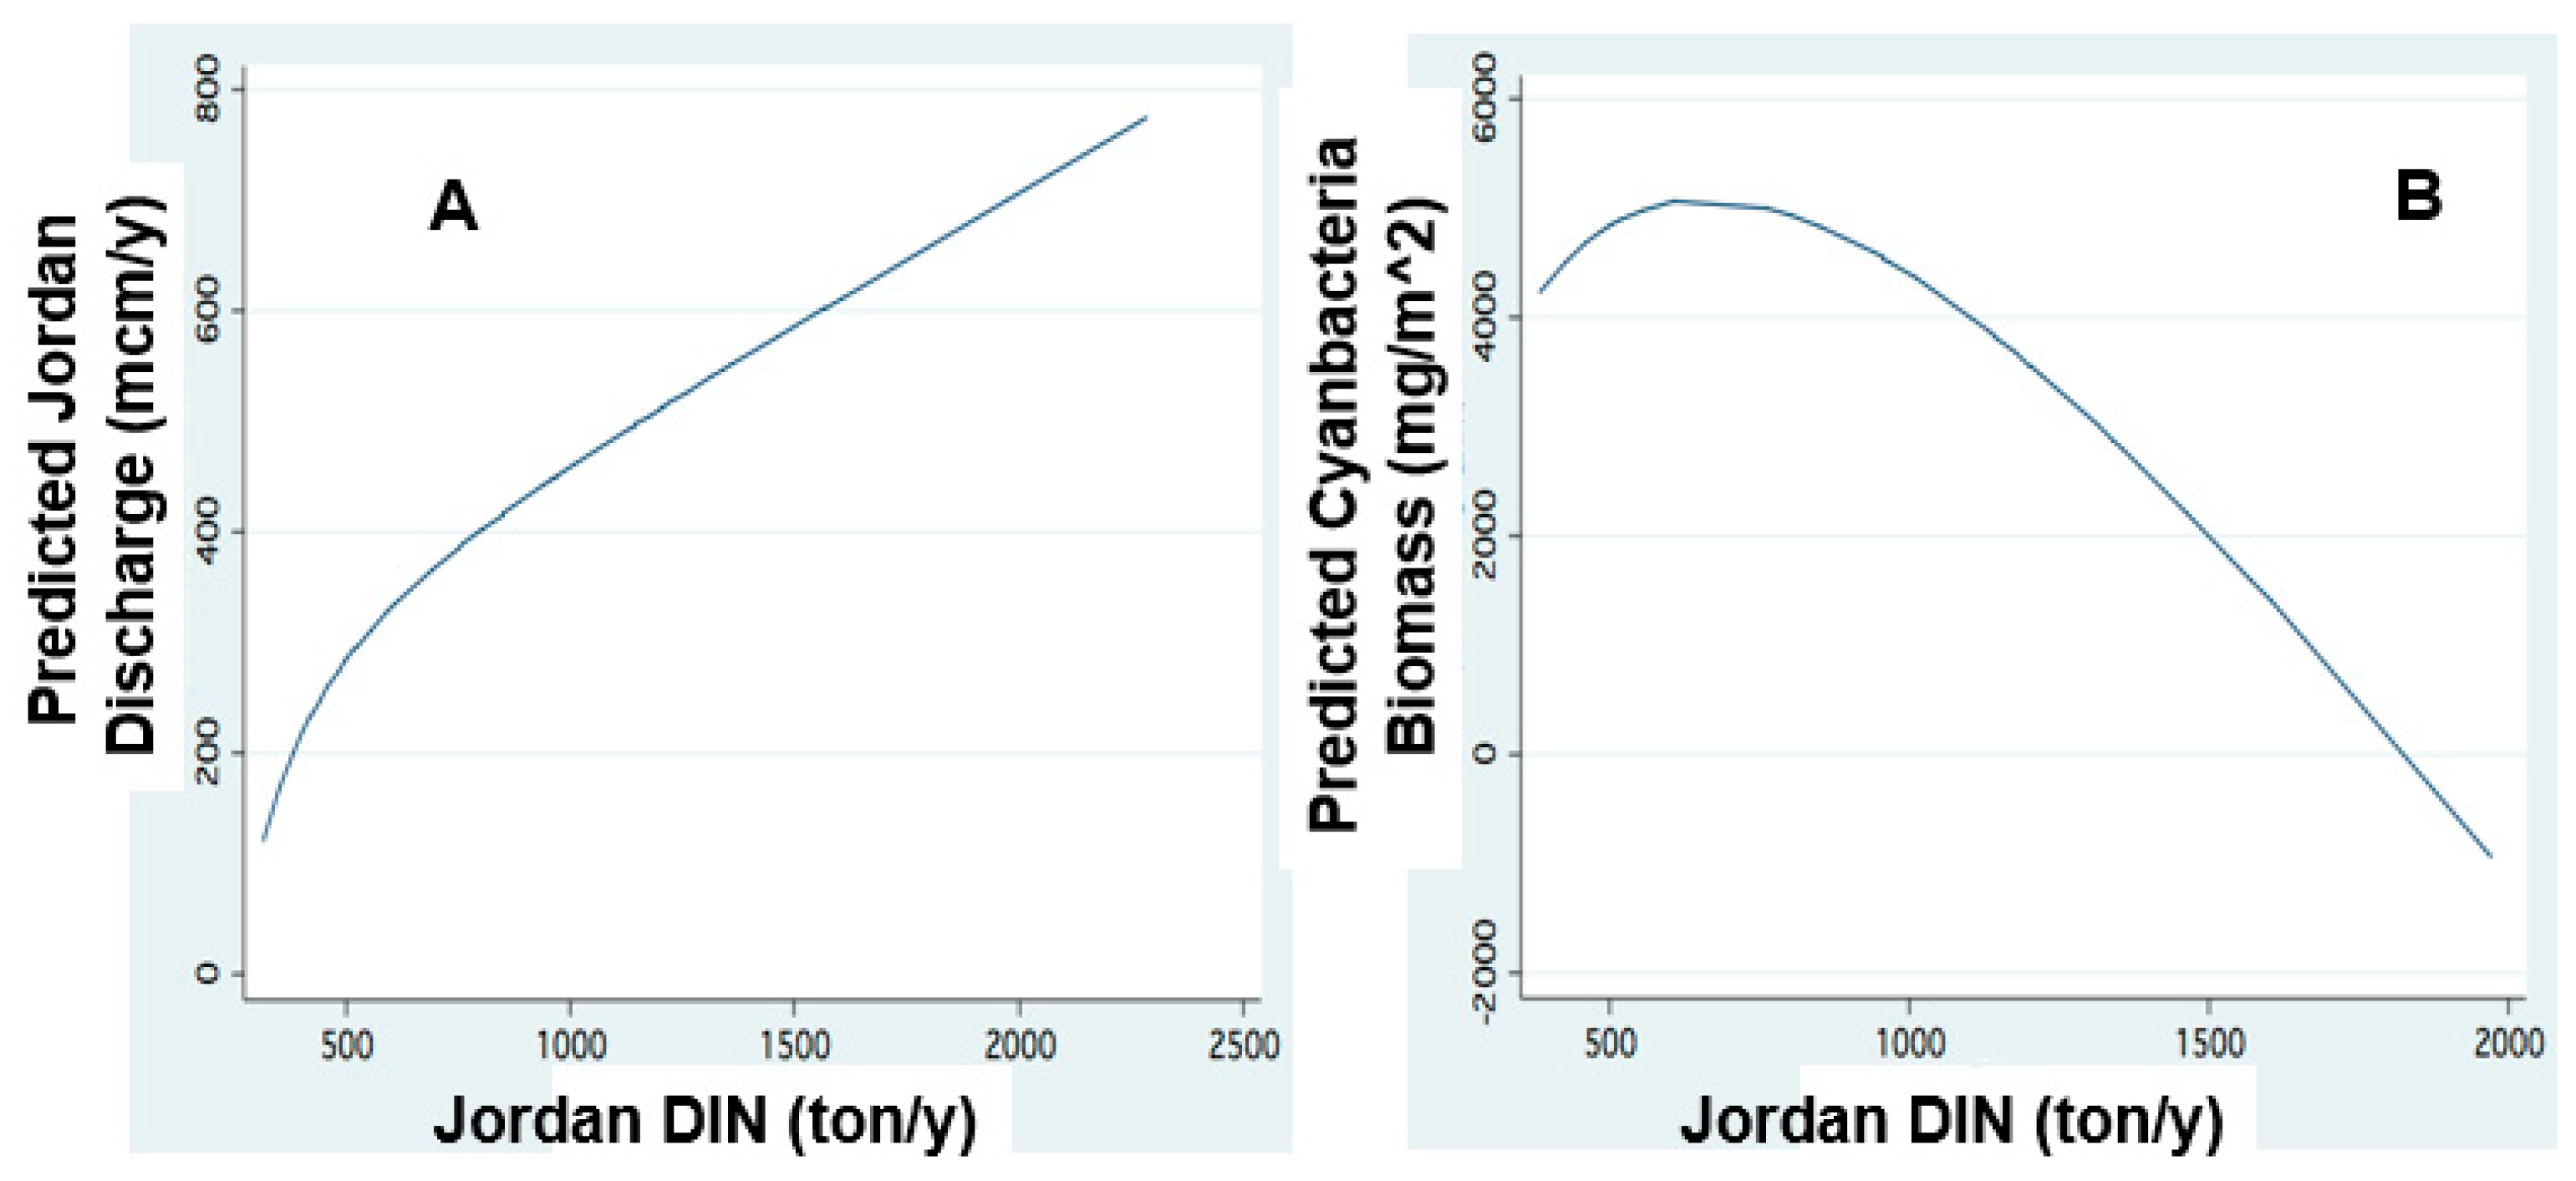
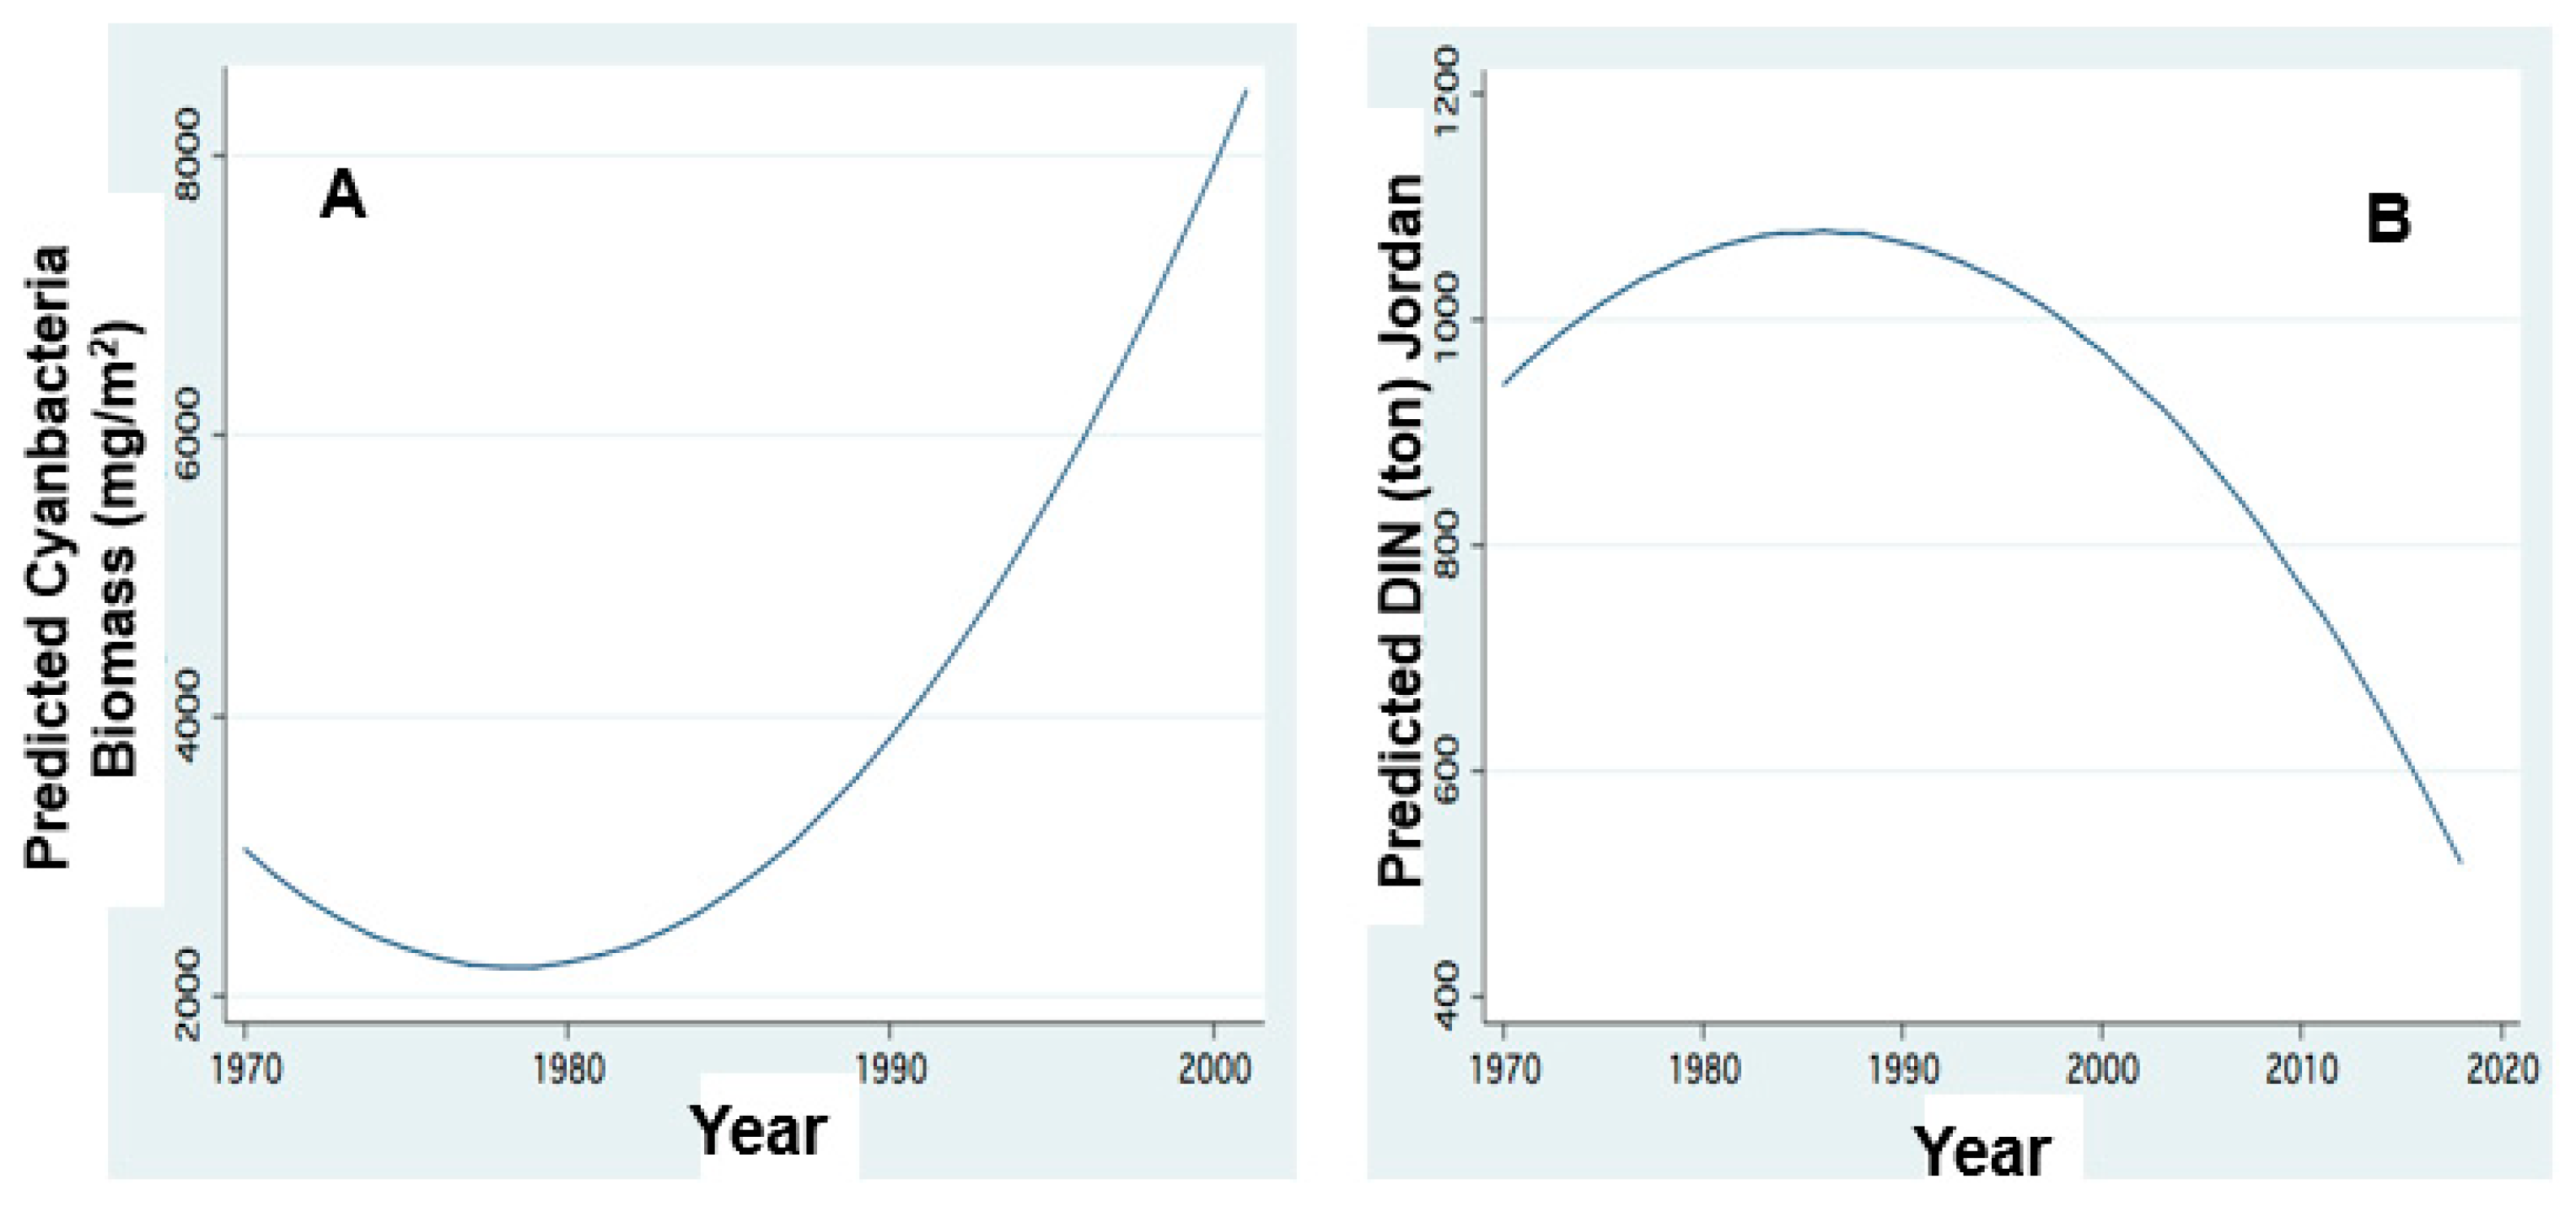
Two additional ecological issues are considered: (1) the impact of Hula Wetlands drainage [30,31] and (2) the role of externally supplied and internally effective influence of dissolved and total inorganic nitrogen (DIN or TIN) within the eco-dynamics of the lake [6,7]. The study of Hula Drainage impact is mostly concerned with soil chemistry, but also with anthropogenic involvement such as the complete removal of raw sewage and the restriction of aquaculture (fishpond) area from 1700 ha to 3.5 ha, which significantly changed water utilization in the Hula Valley. Those changes reduced fluxes of organic nitrogen from the Hula Valley to the lake. Although [30] did not take into account these two anthropogenically modified parameters, he suggested that reduction in nitrogen input might cause the decline of the Epilimnetic N/P mass ratio in the lake and may potentially favor Cyanobacterial enhancement [23]. Figure 13 and Figure 14 indicate the impact of DIN on the lake biomass of Cyanobacteria. Figure 11 indicates that the higher the Jordan discharge increases the higher the DIN load (and input), and the lower the DIN input the lower the biomass of Cyanobacteria. The reduction in nitrogen (mostly organic and DIN) resulted in (Figure 15) temporal decline in nitrogen standing stock and Figure 10 confirms the consequent decline of Peridinium) and Cyanobacteria enhancement. Nitrogen deficiency was replaced by alternative resource as nitrogen fixation by Cyanobacteria. Figure 14 prominently confirms the temporal decline of DIN input whilst N2-fixers Cyanobacteria proliferated.
Mass development of Cyanobacteria is quite often associated with Eutrophication and is a threat to water quality and the ecological stability of the ecosystem. These organisms can have harmful effects when their biomass is high. Cyanobacteria were found to be toxic not only to human population and livestock but also to freshwater invertebrates, although Harmful Cyanobacteria (HFBC) toxication of Kinneret zooplankton was not documented [18,19,20,21,22]. The impact of hydrological and temperature changes on Cyanobacteria bloom enhancement as a factor of Eutrophication was widely documented [31]. Two potential directions of the impact were defined [31]: Nutrient dynamics induce enhancement of growth rate and physical effect of stratification stabilization. Heat-wave events also enhanced the biomass of Cyanobacterial. Recent studies indicate that climate change, as a primary promoter of Cyanobacteria bloom formation, includes not only temperature elevation but also extreme events (such as rain/wind storm and heat-wave) [32,33,34,35,36,37]. The positive relationship between temperature and Cyanobacteria bloom formation enhanced by physiological processes that accelerate the growth rate [32,33,34] might be the outcome of a complex interaction between temperature and nutrients [35]. The impact of Cyanobacteria bloom formation on water quality includes their physical nuisance and difficulties of their removal, due to their colonial feature and presence of gelatinous wrap and their toxicity. Cyanobacteria growth rate and their ability to produce toxins are positively correlated with temperature elevation and nutrient availability. Cyanobacteria are ubiquitous in inland aquatic ecosystems. The geographical distribution of Cyanobacteria includes tropical, sub-tropical and temperate global zones. The diversity, density, toxicity and longevity of Cyanobacteria vary due to physical conditions (temperature, water mass motion, thermal structure, light intensity), chemical conditions of nutrient availability, allelopathic-compete relations, and grazing by fish, zooplankton, and large invertebrates. So far, what happens in Lake Kinneret?
The present climate conditions in the Kinneret region are a flexible threat to water safety. If drought seasons succession continue, there might be a bloom outbreak of harmful Cyanobacteria (HFCB), and whilst the event of rainy season might export plenty of nitrogen to the lake, return of the Peridinium domination is possible. Climate change caused a temperature elevation of air and water, which probably enhanced HFCB standing stock supported also by the decline of Epilimnetic nitrogen availability. The impact of climate change intensified dryness, periodical prolongation of the drought season, and irregularities in the patterns of rainfall. The total volume of rainfall declined, river discharge reduced, and water input diminished. The reduction of water inputs caused a decline in nitrogen input. Consequently, there was an Epilimnetic nitrogen insufficiency, which caused the disappearance of the long-term (1960–1995) documented Peridinium bloom formation and its replacement by HFCB. The composition of the phytoplankton assemblages was modified and the question is why? The discharge reduction did not only cause the decline of nitrogen loads but also its concentration in the Jordan waters. This was reflected by a modification of the nutrient dynamics in the Kinneret Epilimnion: insufficient nitrogen but sufficient phosphorus because phosphorus resources are partly other than discharge mediated. Although the quantity of phosphorus in the Jordan waters has declined, its Epilimnetic availability remains fairly stable and even slightly increased due to dust deposition [36] and chemical–microbiological supply from the sediments whilst the watershed is almost the sole nitrogen source. A combined ecological event was documented: warming, dryness, reduction in water inputs and nutrient availabilities, and modified phytoplankton composition. HFCB are a nuisance, harmful to water quality and therefore a threat to public health.
Due to the recent deterioration of water quality, the Kinneret ecosystem services of aquatic recreation were damaged. Therefore, the bloom dominance of HFCB has economic implications for the utilization of Lake Kinneret. No discrimination was done between N2-fixer and non-N2-fixer cyanobacteria, and a general term of harmful Cyanobacteria (HFCB) was used. Some of the HFCB, such as Microcystis spp., are not N2-fixers. Microcystis blooms and scum formation are a globally known factor affecting water quality. These blooms and scum formation recently became common in Lake Kinneret. Nitrogen is a limiting factor for Peridinium bloom formation. Anthropogenic operations of aquaculture restriction and sewage removal also contributed to the decline of nitrogen input in the watershed. The temperature increase was additional support to the flourishing of Cyanobacteria. Due to the source nature of N and P, the correlation between their input and Epilimnetic content is likely more effective for nitrogen than for phosphorus. The positive correlation between Jordan discharge and phosphorus form (TP, TDP) concentrations and resulted load capacity is probably due to their flushing mechanism from the soil. The majority of their moveable portion is removed from the soil by water flushing (rainfall and irrigation) which therefore is enhanced by an increase of water capacity and consequent discharge within a range of 200–600 mcm/y as shown in Figure 2 for phosphorus (TP, TDP) and in Figure 4 and Figure 5 for nitrogen except for nitrate. Enhancement of rainfall and consequently river discharge above 600 mcm/y is not exceeded by moveable TP and TDP. On the other hand, SRP migration which is affected by chemo-physical processes, which are enhanced by soil moisture behave differently: the higher the rainfall, and consequent discharge within a full range (200–800 mcm/y)—the higher the soil moisture which enhances SRP formation and migration. Nevertheless, the impact of the Hula Reclamation Project (HRP) on nitrate flux from the Hula Valley into the lake is evaluated from Figure 8 and Figure 9. Before the 1980s, nitrate load increased (Figure 8), probably resulted from soil deterioration, whilst its later reduction was probably affected by both, the HRP and rainfall decline (Figure 8). The elevation of nitrate loads relative to the Jordan discharge increase between 200 and 800 mcm/y indicates the breakable linkage between nitrate and soil particles resulting in effective flushing capacity.
The limitation of phosphorus in the Kinneret Epilimnion mostly results from Jordan particulate and dissolved phosphorus dissipates quickly after entering the lake water [1]. The suspended P particles settle and the dissolved fraction creates un-dissolved P-Ca complexes which efficiently settle as a result of the high pH and Ca content of the lake water. Conclusively, as a result of climate change, conditions for Cyanobacteria blooms in Lake Kinneret have been improved since the mid-1990s, whilst interfering with the domination of Peridinium blooms.
The potential impact on the Kinneret phytoplankton composition might be through the Jordan algal import. Algal biomass transported with the River Jordan water inflows indicates that the maximal summer biomass density of Cyanobacteria varies between 4 and 8 g(ww)/m3 (20–80% of the total phytoplankton biomass in Jordan waters) [1]. Microcystis is common in the watershed, probably as a result of the high availability of nitrate [17]. Despite the approximated annual input of 2820 tons of algal wet biomass when the Jordan inflow was 470 mcm/y (Figure 3), Peridinium bloom formation was very little disordered until the mid-1990s. Previous studies suggested that the timing of the Jordan floods has an impact on Microcystis distribution in Lake Kinneret [18,19,37]. If the winter flood comes early before the Peridinium blooms, Microcystis can flourish, utilizing the flood-imported nitrogen. If the flood comes later, after the initiation of the Peridinium blooms, the competition for nitrogen is less favorable for Microcystis. The Jordan waters inject high loads of nitrates and nitrifying bacteria into the lake. Therefore, early rainfall storms resulting in heavy floods loaded with available nitrogen and nitrifying bacteria might cause a delay of Peridinium bloom by Microcystis enhancement [37].
The biomass densities of Cyanobacteria before the mid-1990s were enhanced (Figure 10), varying between 10 and 100 g(ww)/m2 whilst Peridinium blooming declined (Figure 10). Moreover, during the late winter of 2016, heavy Microcystis scum covered the majority of the Kinneret surface, resulting in long-term conditions of nitrogen deficiency which contributed to the diminished Peridinium bloom but favored the Cyanobacteria. Annual Reports [5] documented 45% of cyanobacteria biomass in the autumn of 2008, with the summer blooms of Cyanobacteria comprising 28–58% of the total algal biomass. Documentation of Cylindrospermopsis raciborskii for the years 2003–2006 showed a summer biomass range of 25–100 g(ww)/m2. About 20–48% of the total algal biomass was attributed to Cyanobacteria in 2009. Throughout the summer of 2011, Cyanobacteria were dominant (42–55% of the total algal biomass).
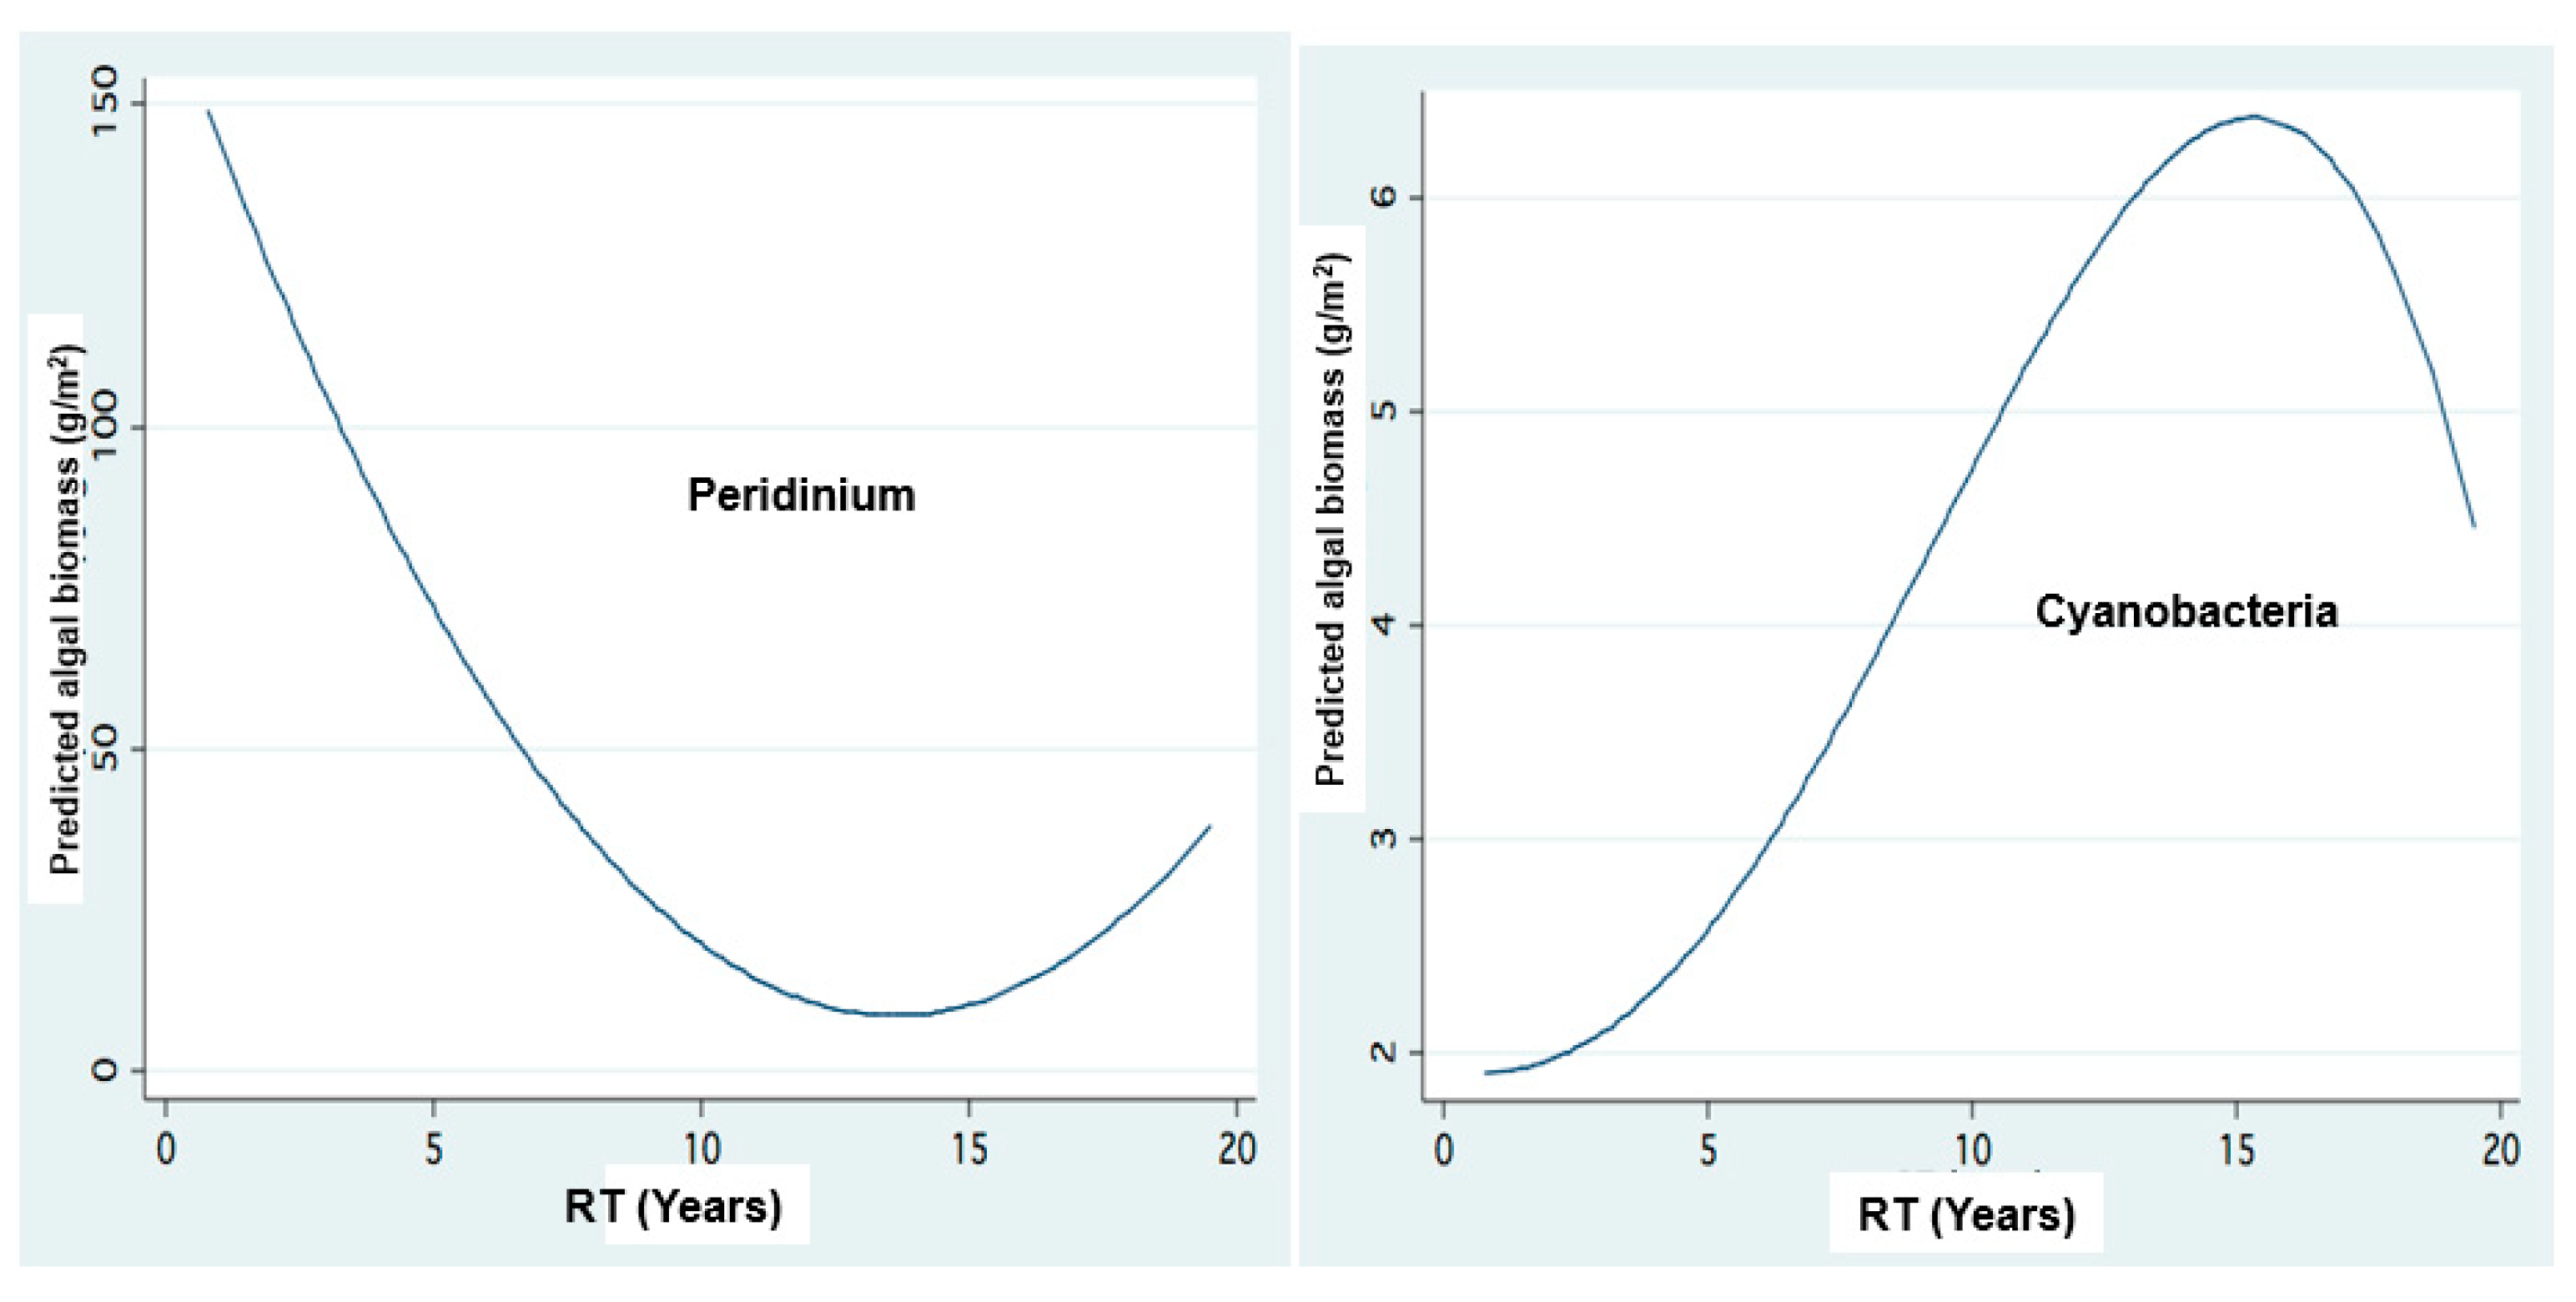
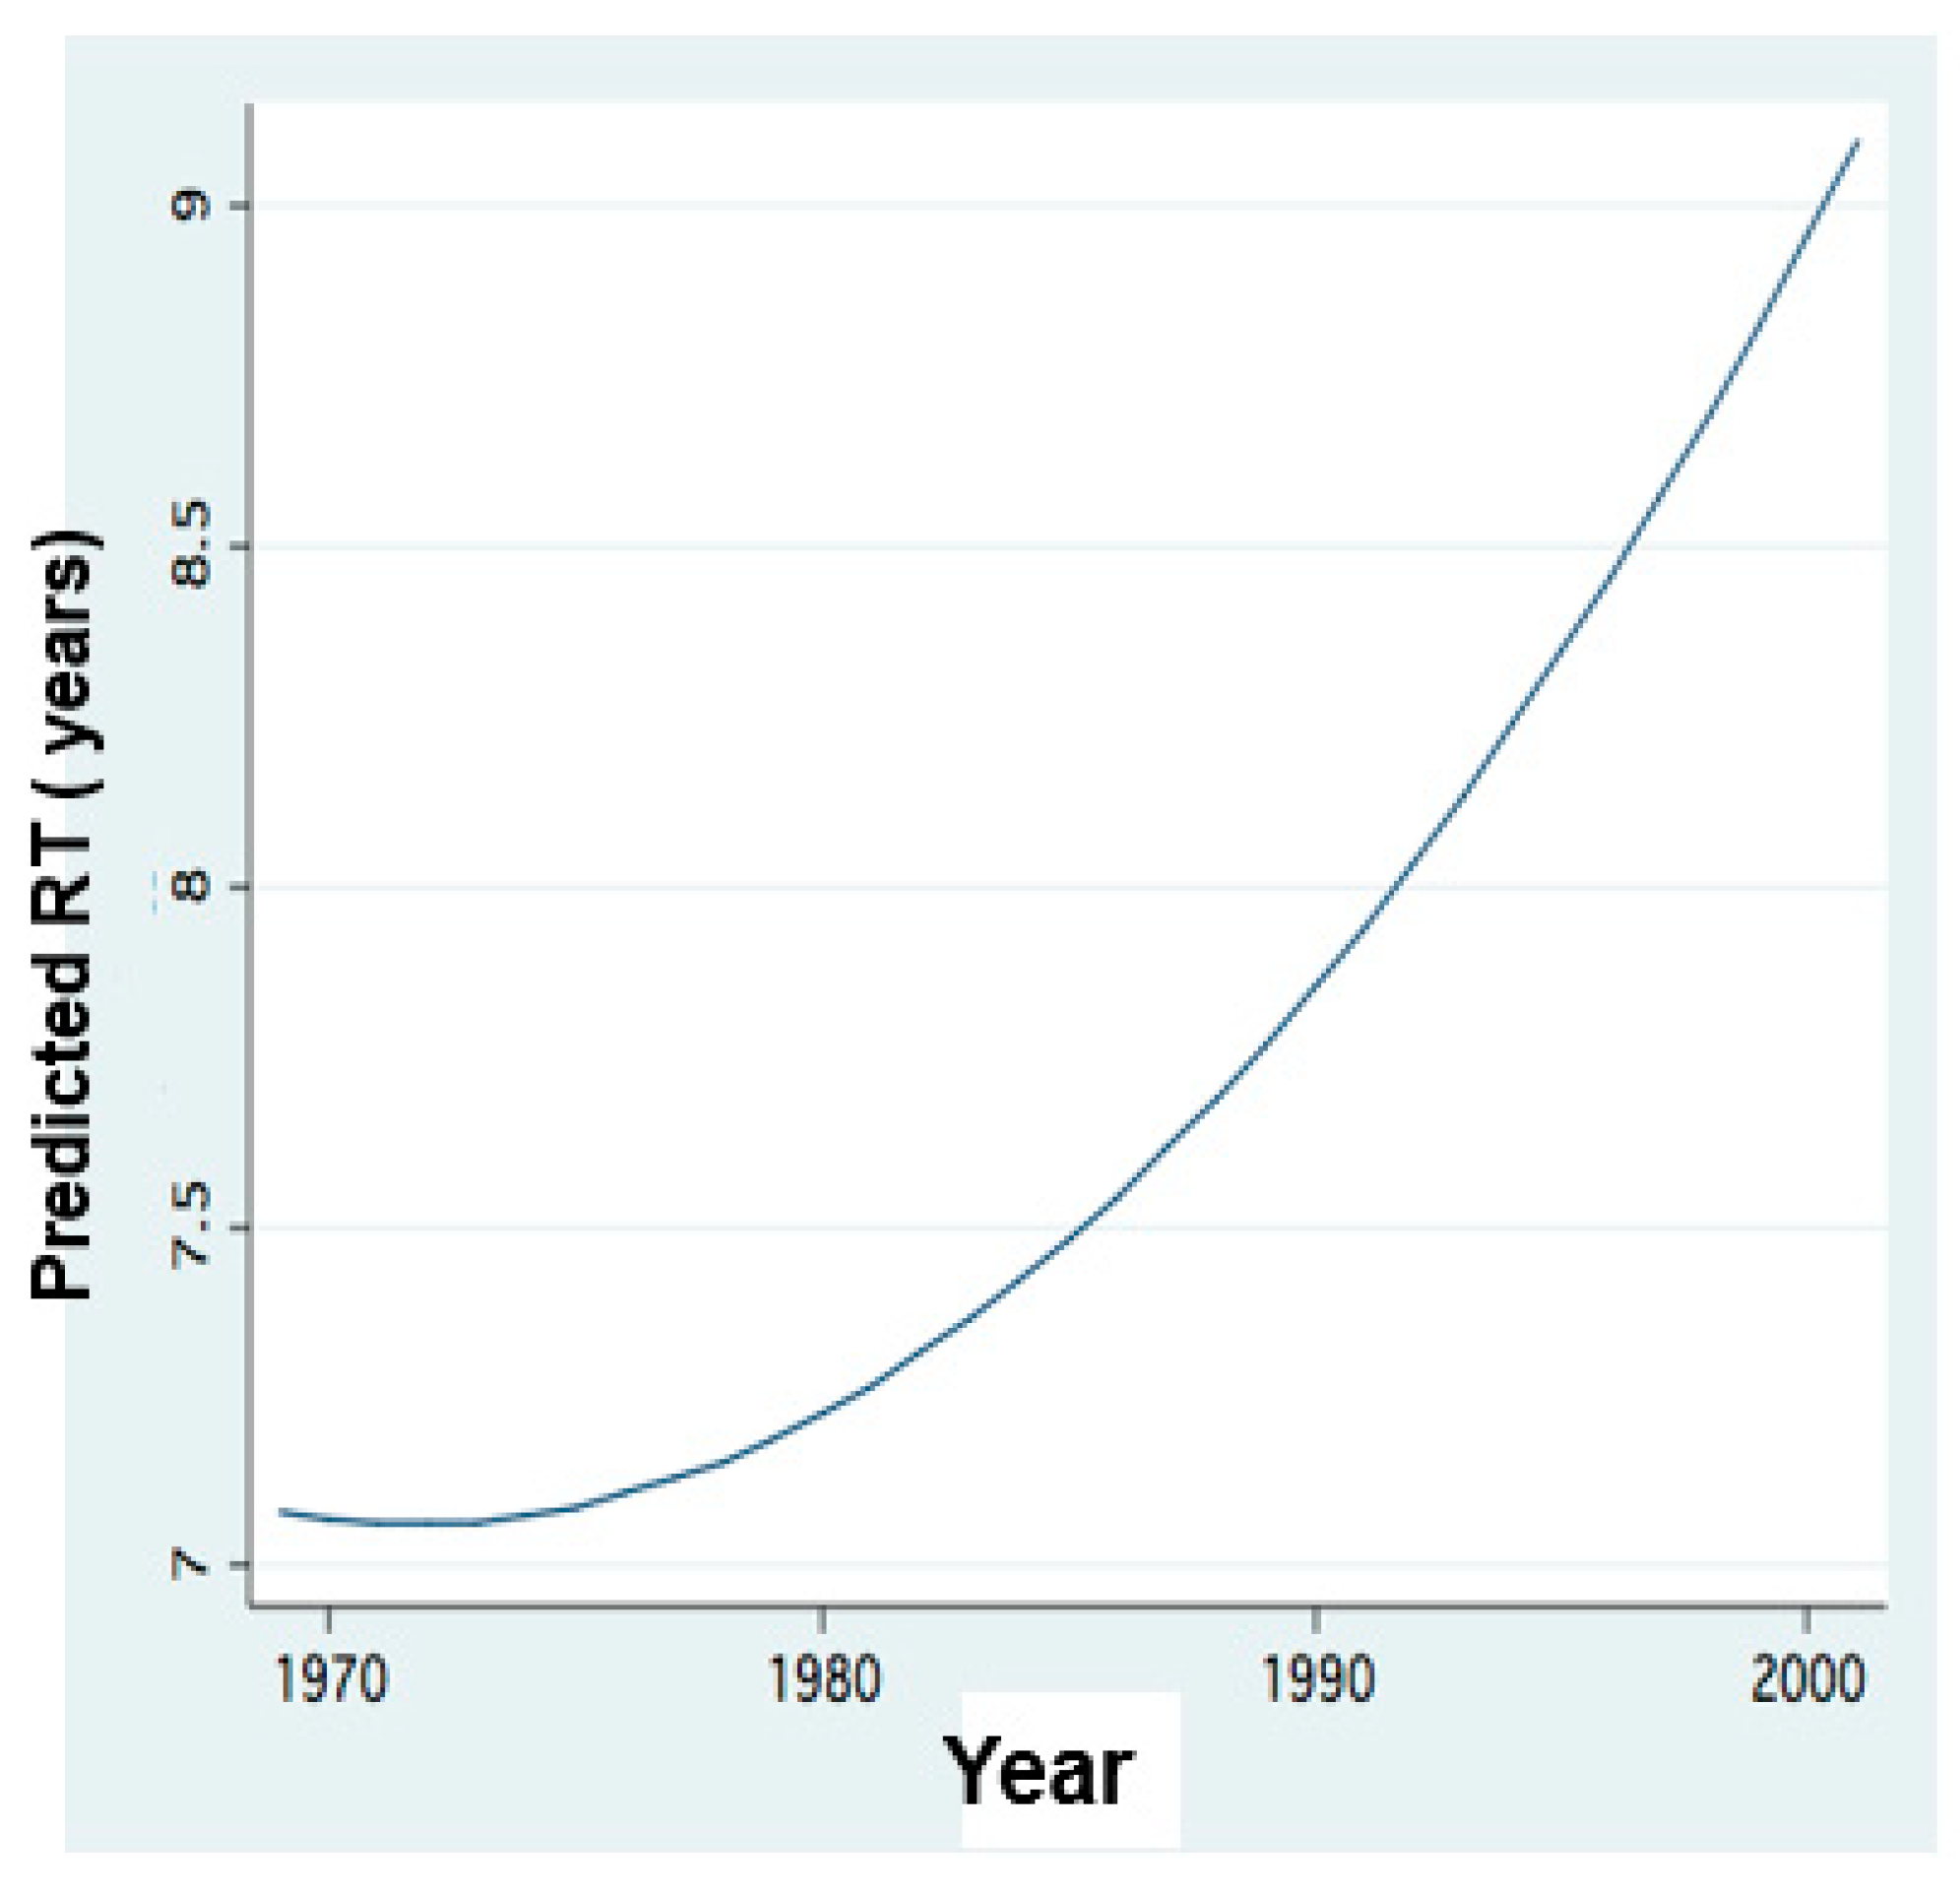
Hydrological management design in Lake Kinneret is a crucial issue. Parameters such as water balance, water supply storage, WL and South Dam control policy are critical but their consequences on water quality are not less. The results shown in Figure 11 are an example of the relations between phytoplankton composition and Residence Time (RT) length. A constraint of anthropogenic management aimed at water storage for supply accompanied by climate change of advanced dryness dictates close dam policy which induces RT prolongation. The consequence of RT elongation under rainfall decline, in Lake Kinneret, indicates (Figure 11 and Figure 12) Peridinium decline and Cyanobacteria (and Nitrogen Fixation enabled) enhancement. The impact of the increase of salinity and nitrogen deficiency is suggested [15,38]. The competitive advantage of Cyanobacteria under nitrogen insufficiency is due to their feature of nitrogen-fixation, especially when nitrate and ammonium concentrations are low [32]. Nevertheless, climate change [10,11,12,39] (Figure 3) condition also included temperature increase. Cyanobacteria bloom formation is defined as “Blooms Like It Hot” [40]. Fristachi and Sinclair [41] have indicated that “Blooms of Cyanobacteria tend to be greater and last longer in warmer climates”, and “light, temperature, hydrological and chemical factors may be involved in Cyanobacterial bloom formation and toxin production” [42,43,44,45,46]. Cyanobacteria growth is known to be enhanced by temperature increase. These organisms are known as superior competitors against other algal groups at high temperatures, higher salinity and in stratified lakes [32,33,34,35]. Cyanobacteria are known to have a high rate of phosphorus uptake in comparison with other phytoplankters, which is an advantageous property in P-limited aquatic ecosystems such as Lake Kinneret. Amano et al. [34] documented less than 0.1 ppm of P concentration as sufficient to induce excessive growth of Cyanobacteria, enabling bloom formation under oligotrophic conditions [34,35,47].
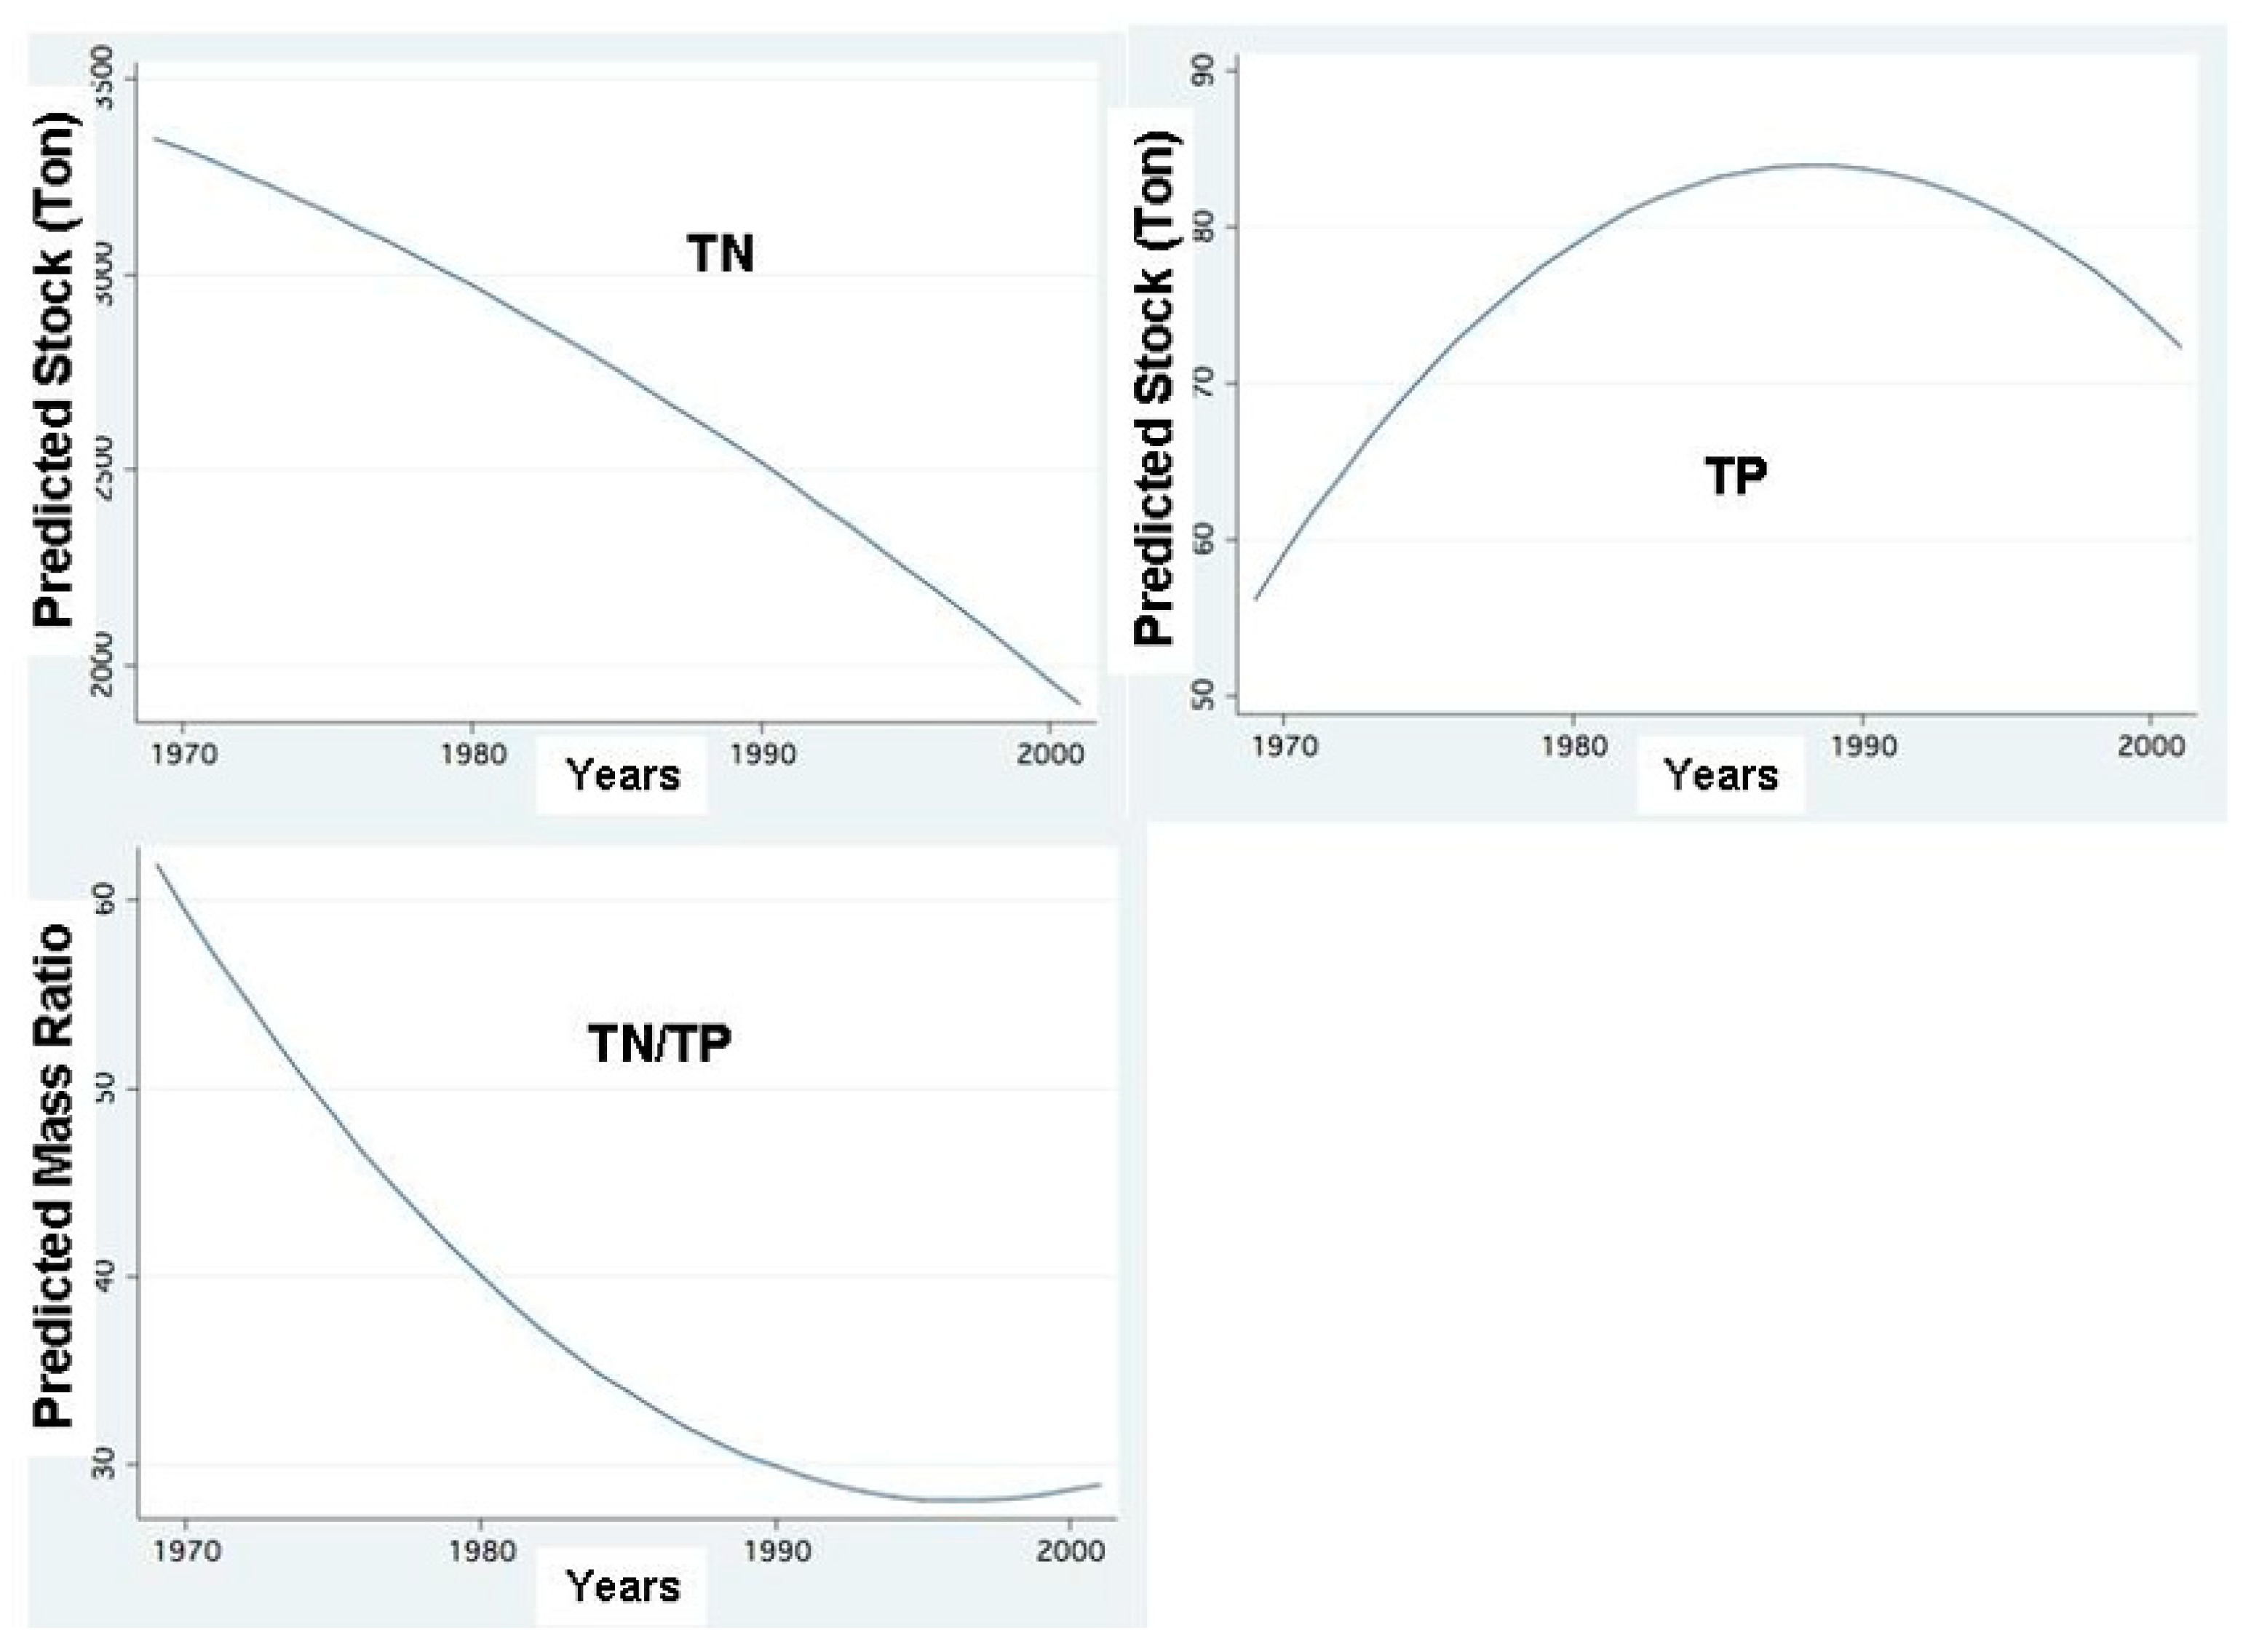
The SRP and TP Epilimnetic mean concentration value and range in Lake Kinneret are 0.002 and 0.014–0.017 ppm, respectively, while those of ammonium, nitrate and nitrite are 0.014–0.057, 0.002–0.056 and 0.001–0.005 ppm, respectively. The competitive advantages of Cyanobacteria under such N and P limitation may explain their dominance when TN: TP mass-ratio is below 29 [38]. The impact of phosphorus increase through sediment release and dust deposition is significant. The significance of low N:P ratio (Figure 15) for the formation of Cyanobacteria blooms has been widely documented [33,34,48,49], but this sole factor among others that enhance Cyanobacteria blooms and is relevant when the ambient common concentrations are not high. Harris and Baxter [50] demonstrated the dominance of Cyanobacteria blooms in drought and when there is a decline in the water level (WL), followed by surface scums when wind velocity diminishes. It has also been documented [23,50,51,52,53,54] that the dominance of a non-nitrogen fixing cyanobacterium, such as Microcystis aeruginosa, depends more on TN:TP ratio decline (Figure 15) than on nitrogen availability alone [47,51]. The decline in TN:TP mass ratio (Figure 15), regional enhancement of dryness, increased frequency of drought (SPI), and longer residence time (RT) (Figure 12) were accompanied by the enhancement of Cyanobacteria blooms and increased Epilimnetic salinity in Lake Kinneret [52].
It is assumed that increased salinity in Lake Kinneret selectively favored Cyanobacteria [38,52,53]. It is also suggested that an event of heavy rainfall that injects an exceptionally high load of nitrogen into the lake might enhance the growth of Cyanobacteria despite a slight and short-term decline in salinity [50,54]. Such a situation was recently found to be relevant to Lake Kinneret when there was an event of heavy rain after a long-term drought. With the elevation of salinity, water managers achieved water storage by closing the dam. This prevented long-term salinity decline, potentially favoring Cyanobacteria. This management of prolonged RT initiated a slowdown of water exchange [11,55,56,57] (Figure 11 and Figure 12). These conditions did not enhance nitrogen input, but an increase in phosphorus bio-availability was possible.
Results shown in Figure 13 confirm the link between the external supply of DIN and HFCB biomass in the lake: the simultaneous decline of DIN loads and HFCB enhancement. When plenty of DIN is supplied, it is likely that HFCB has no advantage and other algal groups compete and are enhanced (Figure 13). Figure 11 indicates a temporal decline in DIN loads and simultaneous enhancement of Cyanobacteria.
The reduction of recreational ecosystem service capabilities of Lake Kinneret by Cyanobacterial blooms was indicated [41]. Cyanobacteria responsible for bloom formation are mostly gas-vacuole species. They tend to promptly appear on the surface of waterbodies, especially under calm weather conditions and reduced turbulence. Change in climate conditions accelerates the buoyant migration of Cyanobacteria to the surface [58]. Conclusively, climate change was the principal factor of propulsion of the Lake Kinneret ecosystem from “Peridinium Era” (PE) towards the Cyanobacterial period (CE). In a comprehensive ecological study about parameters that induce HFCB harmful blooms, Mioni et al. [55] summarized the direct impact of climate change on surface water temperature and the indirect impact on nitrogen (ammonium and nitrate) and phosphorus (orthophosphate) concentrations as key drivers of Cyanobacterial harmful biomass density and toxicity [57,58]. Nitrogen and phosphorus inputs into Lake Kinneret transported by the Jordan discharges are positively related to the river flow capacity: the higher the rate of the discharge, the higher the concentrations and loads of the nutrients. A side effect was introduced by the HRP, which reduced the nitrate flushing capacity of the Hula Valley soil. The dominant and major impact is due to the climate change expressed by the decline in the regional season of rainfall and the increased dryness. Nevertheless, a low nitrogen-to-phosphorus (N/P) ratio alone is not the only indicator for the flourishing of Cyanobacteria but is mostly relevant when the Inorganic Nitrogen (ION) concentration is lower than the range of 0.05–0.10 ppm. The concentration of ION in the stratified Kinneret epilimnion ranges between 0.017 and 0.118 ppm [4]. Therefore, the impact of a low N/P ratio is potentially relevant.
Although climate change evidently creates the nutrient input reduction, the lake dynamics of the nitrogen and phosphorus are different since the sources of N and P are dissimilar. The N resources are allochthonous from the watershed, while sources of P are partly autochthonous (lake bottom sediments) and partly external (atmospheric dust deposition and erosive flush activity in the watershed) [36,59,60,61]. Moreover, during the Peridinium domination, Epilimnetic phosphorus input from the bottom sediments was mediated by Peridinium-germinated cysts. Therefore, the availabilities of N and P in the lake are different. The source differs between N and P supply for the lake biota, inducing response changes by the nutrient consumers, the phytoplankton community. Indicative nutrients utilization features by Peridinium and Cyanobacteria are: nitrogen is a limiting factor for Peridinium whilst Cyanobacteria are not highly affected by nitrogen deficiency due to their ability to maintain atmospheric nitrogen-fixation, and phosphorus is limited for both. Nevertheless, the replacement of Peridinium by Cyanobacteria was mostly due to a change in nutrient dynamics as a result of climate change. The conclusion about the depletion of nitrogen supply was based on recorded data without Se input dynamics. Thus, it is likely that both, supplied nitrogen and selenium, affected the decline in Peridinium dominance. Nevertheless, Cyanobacteria dominance likely replaced Peridinium domination mostly as a result of a change in the dynamics of N and P, which was a result of climate change. Peridinium is an indigenous component of Kinneret, [1,4,5,14,37] which has also been found sporadically in River Jordan and Hula Valley waters but its (as well and other algal species) algal biomass inputs through Jordan waters are negligible [12]. In 1970 and mid-1980s, raw sewage (app. 29,000 m3 daily) and fishpond (1700 ha) effluents were fluxed from the Hula Valley into Lake Kinneret. Moreover, even after the implementation of the newly created shallow Lake Agmon-Hula as part of the peat soil reclamation project (HRP), the biomass density of Cyanobacteria, and Peridinium spp., in outflow waters was negligible [9].
The impact of selenium (Se) inputs from the watershed into the lake is not yet fully understood. It is suggested that in addition to nitrogen deficiency, a decline in Se input may lead to a decline in Peridinium domination. The Hula peat soils are Se-rich, and Se is a limiting factor of Peridinium growth. The most available chemical derivate of Se4+ is the dominant form in the Jordan River waters [36,59,61]. Nevertheless, prior to the draining of Lake Hula and the surrounding swamps, the chemical trait of the peat soil was reductive and Peridinium bloomed intensively in the lake, but the soil conditions are currently oxidative, and, therefore, limitation of Se is not doubtful [36,59,60,61,62,63]. Studies carried out at the University of Uppsala, Sweden [62,63] Lindstrom, 1980; 1982 indicated that Peridinium cinctum can produce heavy blooms (4000 cells per ml) when Se concentration is low (10–20 ng/L). They suggested that precipitation and runoff discharges are an important source of Se forms of selenates, selenites and organic Se (bioavailable) efficiently incorporated by primary producers. Bioactive Se is stable under alkaline and oxygen-rich conditions, whilst low pH and reductive environment enhance bio-inactivation of Se [62,63]. Lindstrom [61,62] concluded that high availability of Se in the surface waters of Kinneret watershed might be a significant promoter of Peridinium heavy [10,11,36,60,61]. Nevertheless, awareness towards the possibility of the presence of Cyanotoxins resulted by temporary or permanent suitable conditions is critical [64].
4. Future Recommendations
Future management recommendations include: enhancement of external nitrogen supply through the diversion of Hula Project effluents into the Kinneret inflows; reduction of external phosphorus inputs through manageable resources: diary and domestic sewage treatment and agricultural fertilization control in the Hula Valley; introduction of exotic fish unable to reproduce in the lake and of Microcystis consumers and fishery contributor such as Silver Carp (Hypophthalmichthys molitrix).
Author Contributions
The author declare his own contribution of this paper. The author has read and agreed to the published version of the manuscript.
Funding
This research received no external funding.
Institutional Review Board Statement
The review board of Migal Scientific Research Institute herewith confirmed the publication of this paper.
Informed Consent Statement
Informed Consent Statement is herewith confirmed by the author.
Data Availability Statement
The author confirmed data availability in this paper.
Conflicts of Interest
The author declares no conflict of interest.
References
- Serruya, C. Lake Kinneret:Monographiae Biologicae; Springer: London, UK, 1978; Volume 32, 501p. [Google Scholar]
- Gvirzman, H. Israel Water Resources, Chapters in Hydrology and Environmental Sciences; Yad Ben-Zvi Press: Jerusalem, Israel, 2002; 287p. (In Hebrew) [Google Scholar]
- Gophen, M. Different Kinneret; Glilit and Migal: Jerusalem, Israel, 2019; 158p. (In Hebrew) [Google Scholar]
- Serruya, C.; Gophen, M.; Pollingher, U. Carbon Flow Patterns and Ecosystem Management. Arch. Hydrobiol. 1980, 88, 265–302. [Google Scholar]
- LKDB. 1970–2018, Kinneret Limnological Laboratory, IOLR, Co. Ltd. Annual Reports. and Chapters Entitled “Cyanophyta Toxins Distribution in Lake Kinneret” (Sukenik, A., and Y. Viner-Mozzini) Are Included; IOLR-KLL Publishers: Haifa-Migdal, Israel, 1970–2018. [Google Scholar]
- Hadas, O.; Pinkas, R.; Malinsky-Rushanski, N.; Nishri AKaplan, A.; Rimmer, A.; Sukenik, A. The invasion of diazotrophic cyanobacteria to Lake Kinneret (Sea of Galilee), Israel. Freshw. Biol. 2012, 57, 1214–1227. [Google Scholar] [CrossRef]
- Hadas, O.; Kaplan, A.; Sukenik, A. Long-term changes in Cyanobacteria populations in Lake Knneret (Sea of Galilee), Israel: An eco-physiological outlook. Life 2015, 5, 418–431. [Google Scholar] [CrossRef] [PubMed]
- Gophen, M. Hula Project Monitoring, Annual Reports; MIGAL-Scientific Research Institute: Kiryat Shmona, Israel; Israel Water Authority, and Jewish National Fund (KKL): Jerusalem, Israel, 1995; (1995–2005—In Hebrew, 2006–In English). [Google Scholar]
- Gophen, M. Climate and Water Balance Changes in the Kinneret Watershed: A review. Open J. Mod. Hydrol. 2020, 10, 21–29. [Google Scholar] [CrossRef] [Green Version]
- Gophen, M. Lake Kinneret (Israel) Dam Open Management dilemma: A commentary Review. Jpn. J. Res. 2020, 1, 1–5. [Google Scholar]
- Gophen, M. Relation Significance between Hydrological Residence Time and Phytoplankton Dynamics in Lake Kinneret (Israel). Open J. Ecol. 2020, 9, 479–492. [Google Scholar] [CrossRef] [Green Version]
- Falconer, I.R. Cyanobacteria Toxins of Drinking Water Supplies: Cylindrospermopsins and Microcystins; CRC Press: Boca Raton, FL, USA, 2000; 279p. [Google Scholar]
- Carmichael, W.W. Cyanobacteria secondary metabolites—The cyanotoxins. J. Appl. Bacteriol. 1992, 72, 445–459. [Google Scholar] [CrossRef]
- Carmichael, W.W. The toxins of cyanobacteria. Sci. Am. 1994, 270, 78–86. [Google Scholar] [CrossRef]
- Carmichael, W.W.; Falconer, I.R. Disease related to freshwater blue-green algal toxins, and control measures. In Algal Toxins in Seafood and Drinking Water; Academic Press: London, UK, 1993; pp. 187–209. [Google Scholar]
- Ferrao-Filho, A.; da Silva, D.A. Saxitoxin-producing Raohidiopsis raciborskii (Cyanobacteria) inhibits swimming and physiological parameters in Daphnia simillis. Sci. Total Environ. 2020, 706, 135751. [Google Scholar] [CrossRef]
- Marzur–Marzec, H.; Plinski, M. Do toxic cyanobacteria blooms pose a threat to the Baltic ecosystem? Oceanologia 2009, 51, 293–319. [Google Scholar] [CrossRef] [Green Version]
- Carvalho, L.; McDonald, C.; De Hoyos, C.; Mischke, U.; Philips, G.; Borics, G.; Polkane, S.; Skejlbred, B.; Solheim, I.; Wichelen, A.; et al. Sustaining recreational quality of European lakes: Minimizing the health risks from algal blooms through phosphorus control. J. Appl. Ecol. 2013, 50, 315–323. [Google Scholar] [CrossRef] [Green Version]
- Serruya, C.; Pollingher, U. An attempt at forecasting the Peridinium bloom in Lake Kinneret (Lake Tiberias). Mitt. Internat. Verein. Limnol. 1971, 19, 277–291. [Google Scholar] [CrossRef]
- Gophen, M. Climate change and water loss in the Kinneret drainage basin. Land Use Policy 2018, 80, 424–429. [Google Scholar] [CrossRef]
- Gophen, M. The Sinergistic Impact of Climate Change and Anthropogenic Management on the Lake Kinneret and Hula Valley Ecosystems. In Frontiers of Global Ecology Intechopen Limited; ELSVIER: Amsterdam, The Netherlands, 2019; pp. 1–18. [Google Scholar]
- Gophen, M. The Impact of Climate Change on the River Jordan-Lake Kinneret (Israel) Ecosystem. J. Earth Sci. Clim. Chang. 2020, 105. [Google Scholar] [CrossRef]
- Gophen, M.; Smith, V.H.; Nishri, A.; Stephen, T.T. Nitrogen deficiency, phosphorus sufficiency, and the invasion of Lake Kinneret, Israel, by N2-fixing cyanobacterium Aphanizomenon ovalisporum. Aquat. Sci. 1999, 1, 1–14. [Google Scholar] [CrossRef]
- Gophen, M. The Impact of Available Nitrogen Defficiency on Long-Term Changes in the Lake Kinneret Ecosystem. Open J. Ecol. 2015, 5, 147–157. [Google Scholar] [CrossRef] [Green Version]
- Gophen, M. The Impact of Nitrogen and Phosphorus Dynamics on the Kinneret Phytoplankton: II: Chlorophyta, Cyanophyta, Diatoms and Peridinium. Open J. Mod. Hydrol. 2017, 7, 298–313. [Google Scholar] [CrossRef] [Green Version]
- Markenstein, H.; Moore, K.; Persson, I. Simulated lake phytoplankton composition shifts towards cyanobacteria dominance in a future warmer climat. Ecol. Appl. 2010, 20, 752–767. [Google Scholar] [CrossRef]
- Kosten, S.; Huszar, V.L.M.; Bercares, E.; Costa, L.S.; Van-Donk, E.; Hasson, L.A.; Jeppessen, E.; Eruk, C.; Lacerot, G.; Mazzeo, N.; et al. Warmer climate boost cyanobacterial dominance in shallow lakes. Glob. Chang. Biol. 2012, 18, 118–126. [Google Scholar] [CrossRef]
- Elliot, J.A. Is the future blue-green? A review of the current model predictions of how climate change could affect pelagic freshwater cyanoacteria. Water Res. 2012, 46, 1364–1371. [Google Scholar] [CrossRef] [Green Version]
- Hadas, O.; Pinkas, R.; Delphine, E.; Vardi, A.; Kaplan, A.; Sukenik, A. Limnological and ecophysiological aspects of Aphanizomoenon ovalisporum, in Lake Kinneret, Israel. J. Plankton Res. 1999, 21, 1439–1453. [Google Scholar] [CrossRef] [Green Version]
- Nishri, A. Long-term impacts of draining a watershed wetlands on a downstream lake, Lake Kinneret, Israel. Air Soil Water Res. 2020, 4. [Google Scholar] [CrossRef] [Green Version]
- O’Neil, J.M.; Davis, T.W.; Burford, M.A.; Gobler, C.J. The rise of harmful cyanobacteri blooms: The potential roles of eutrophication and climate change. Harmful Algae 2012, 14, 313–334. [Google Scholar] [CrossRef]
- Reynolds, C.S. The Ecology of Phytoplankton; Cambridge University Press: Cambridge, UK, 2006. [Google Scholar]
- Guildford, S.J.; Hecky, R.E. Total nitrogen, total phosphorus, and nutrient limitation in lakes and oceans: Is there a common relationship? Limnol. Oceanogr. 2000, 45, 1213–1223. [Google Scholar] [CrossRef] [Green Version]
- McQueen, D.J.; Leam, D.R.S. Influence of water temperature and nitrogen to phosphorus ration the dominance of blue-green algae in lake St-George, Ontario. Can. J. Fish. Aquat. Sci. 1987, 44, 598–604. [Google Scholar] [CrossRef]
- Amano, Y.; Sakal, Y.; Sekiya, K.; Taki, K.; Machida, M. Effect of Phosphorus fluctuation caused by river water dilutionin eutrophic lake on competitionbetween blue-green alga Microcystis aeruginosa and diatom Cyclotella sp. J. Environ. Sci. China 2010, 22, 1666–1673. [Google Scholar] [CrossRef]
- Nishri, A. Atmospheric Sources: Dry Deposition (Dust). In Lake Kinneret: Ecology and Management; Springer: Berlin, Germany, 2014; pp. 341–346. [Google Scholar]
- Pollingher, U. Chapter: The Algae of the River Jordan. In Lake Knneret Monographiae Biologice; Springer: Berlin, Germany, 1978; pp. 223–228. [Google Scholar]
- Gophen, M. A review on Modeling of Kinneret Salinity with Practical Recommendations. Open J. Mod. Hydrol. 2016, 6, 129–139. [Google Scholar] [CrossRef] [Green Version]
- Gophen, M.; Meron, M.; Levin-Orlov, V.; Tsipris, Y.; Peres, M. Climate Change, Regional Water Balance and Land Use Policy, in the Watershed of Lake Kinneret (Israel). Open J. Ecol. 2020, 10, 200–224. [Google Scholar] [CrossRef]
- Johnk, K.D.; Hausman, J.; Sharples, J.; Sommeijer, B.; Visser, P.M.; Stroom, J.M. Summer heat-waves promote blooms of harmful Cyanobacteria. Glob. Chang. Biol. 2008, 14, 495–512. [Google Scholar] [CrossRef] [Green Version]
- Fristachi, A.; Sinclair, A. Occurance of Cyanobacterial Harmful Algal Blooms Workshop Report. Adv. Exp. Med. Biol. 2008, 619, 45–103. [Google Scholar] [CrossRef]
- Paerl, H.W.; Huisman, J. Blooms like it hot. Science 2008, 320, 57–58. [Google Scholar] [CrossRef] [Green Version]
- Izydorczyk, K.; Jurzcak, T.; Wojtal-Frankiewicz, A.; Skowron, A.; Mankiewicz-Boczek, J.; Tarczynska, M. Influence of abiotic and biotic factors on microcystin content in Microcystis aeruginos cells in a eutrophic temperate reservoir. J. Plankton Res. 2008, 30, 393–400. [Google Scholar] [CrossRef]
- De Figueiredo, D.R.; Roboleira, A.S.S.P.; Antunes, S.C.; Abrantes, N.; Azeiteiro, U.; Goncalves, F.; Pereira, M. The effect of environmental parameters and cyanobacterial blooms on phytoplankton dynamics of a Portuguese temperate lake. Hydrobiology 2006, 568, 145–157. [Google Scholar] [CrossRef]
- Lurling, M.; Eshetu, F.; Faassen, E.J.; Kosten, S.; Huszar, V.L.M. Comparison of cyanobacterial and green algae growth rates at different temperatures. Freshw. Biol. 2013, 58, 552–559. [Google Scholar] [CrossRef]
- Toth, L.G.; Padisak, J. Meteorological factors affecting the bloom of Anabaenopsis—Raciborskii Woloz (Cyanophyta, Hormogonales) in the shallow Lake Balaton, Hungary. J. Plankton Res. 1986, 8, 353–363. [Google Scholar] [CrossRef]
- Lang, D.S.; Brown, E.J. Phosphorus limitedgrowth of green-algae and blue-green algae. Appl. Environ. Microbiol. 1981, 42, 1002–1009. [Google Scholar] [CrossRef] [PubMed] [Green Version]
- Downing, J.A.; Warson, S.B.; McCauly, E. Predicting Cyanobacteria dominance in lakes. Can. J. Fish. Aquat. Sci. 2001, 82, 240–248. [Google Scholar] [CrossRef]
- Smith, V.H. Low nitrogen to phosphorus ratio favor dominance by blue-green algae jn lake phytoplankton. Science 1983, 221, 669–671. [Google Scholar] [CrossRef] [PubMed] [Green Version]
- Harris, G.P.; Baxter, G. Interannual variability in phytoplankton biomass species composition in a subtropical reservoir. Freshw. Biol. 1996, 35, 545–560. [Google Scholar] [CrossRef]
- Chorus, I.; Bartram, J. Toxic Cyanobacteria in Water: A Guide to Their Public Health Consequences, Monitoring and Management; CRC Press, Taylor and Francis Group: Boca Raton, FL, USA, 1999. [Google Scholar]
- Chorus, I.; Mur, L. Preventive Measures. In Toxic Cyanobacteria in Water: A Guide To Their Health Consequences, Monitoring and Management; Chorus, I., Bartram, J., Eds.; CRC Press: Boca Raton, FL, USA, 1999. [Google Scholar]
- Smith, V.H.; Tilman, G.D.; Nekola, J.C. Eutrophication impacts of excess nutrient inputs on freshwater, marine, and terrestrial ecosystems. Environ. Pollut. 1999, 100, 179–196. [Google Scholar] [CrossRef]
- Lehmann, E.M.; McDonald, K.E.; Lehmann, J.T. Whole lake selective withdraw experiment to control harmful cyanobacteria in an urban impoundment. Water Res. 2009, 43, 1187–1198. [Google Scholar] [CrossRef] [PubMed]
- Gophen, M. Long Term (1970–2001) Eco-Hydrological Processes in Lake Kinneret and its Watershed. In Climatic Changes and Water Resources in the Middle East and North Africa; Zreiny, F., Hotzl, H., Eds.; Springer: Berlin/Hedelberg, Germany, 2004; pp. 373–401. [Google Scholar]
- Huisman, J.; Hulot, F.D. Population dynamic of harmful cyanobacteria. In Harmful Cyanobacteria; Springer: Dordrecht, The Netherlands; London, UK; Boston, MA, USA, 2005. [Google Scholar]
- Rangel, L.M.; Silva, L.H.S. Phytoplankton biomass is mainly controlled by hydrology and phosphorus concentrations in tropical hydrioelectric reservoirs. Hydrobiologia 2012, 693, 13–28. [Google Scholar] [CrossRef]
- Reynolds, C.S. Cyanobacteria water blooms. In Advances in Botanical Research; Callow, J.A., Ed.; Academic Press: London, UK, 1987; Volume 13, pp. 67–143. [Google Scholar]
- Nishri, A.; Brenner, I.B.; Hall, G.E.M.; Taylor, H.E. Temporal variation in dissolved Selenium in Lake Kinneret (Israel). Aquat. Sci. 1999, 61, 215–233. [Google Scholar] [CrossRef]
- Nishri, A.; Sukenik, A. Monitoring of Selenium Species in Lake Kinneret and Its Drainage Basin; IOLR Report # T23/2012; IOLR: Haifa, Israel, 2012. (In Hebrew) [Google Scholar]
- Nishri, A.; Gavrieli, I. Integrative Approach to the Study of the Impact of Water Bodies in the Hula Valley on Lake Kinneret; 2nd Annual Report Submitted to the Water Authority; IOLR Report No. T8-2019; IOLR: Hebrew, Israel, 2019; 22p. [Google Scholar]
- Gophen, M. The Ecological outcome of Climate Change in Lake Kinneret—ThermalPollution. Open J. Mod. Hydrol. 2019, 9, 89–102. [Google Scholar] [CrossRef] [Green Version]
- Lindström, K. Environmental Requirements of the Dinoflagellate Peridinium cinctum fa. Westii; Acta Universitatis Upsaliensis: Uppsala, Sweden, 1982. [Google Scholar]
- Holland, A.; Kinnear, S. Interprenting the Possible Ecological Role(s) of Cyanotoxins: Compound for Competitive Advantage and/or Physiological Aide? Mar. Drugs 2013, 11, 2239–2258. [Google Scholar] [CrossRef]
Figure 1.
Kinneret Drainage Basin Major Headwaters are Charted: Hermon(Banyas), Snir(Hatzbani), Dan, and “others” H = Huri Bridge; ...... Regional Drainage Sub-units domain.
Figure 1.
Kinneret Drainage Basin Major Headwaters are Charted: Hermon(Banyas), Snir(Hatzbani), Dan, and “others” H = Huri Bridge; ...... Regional Drainage Sub-units domain.

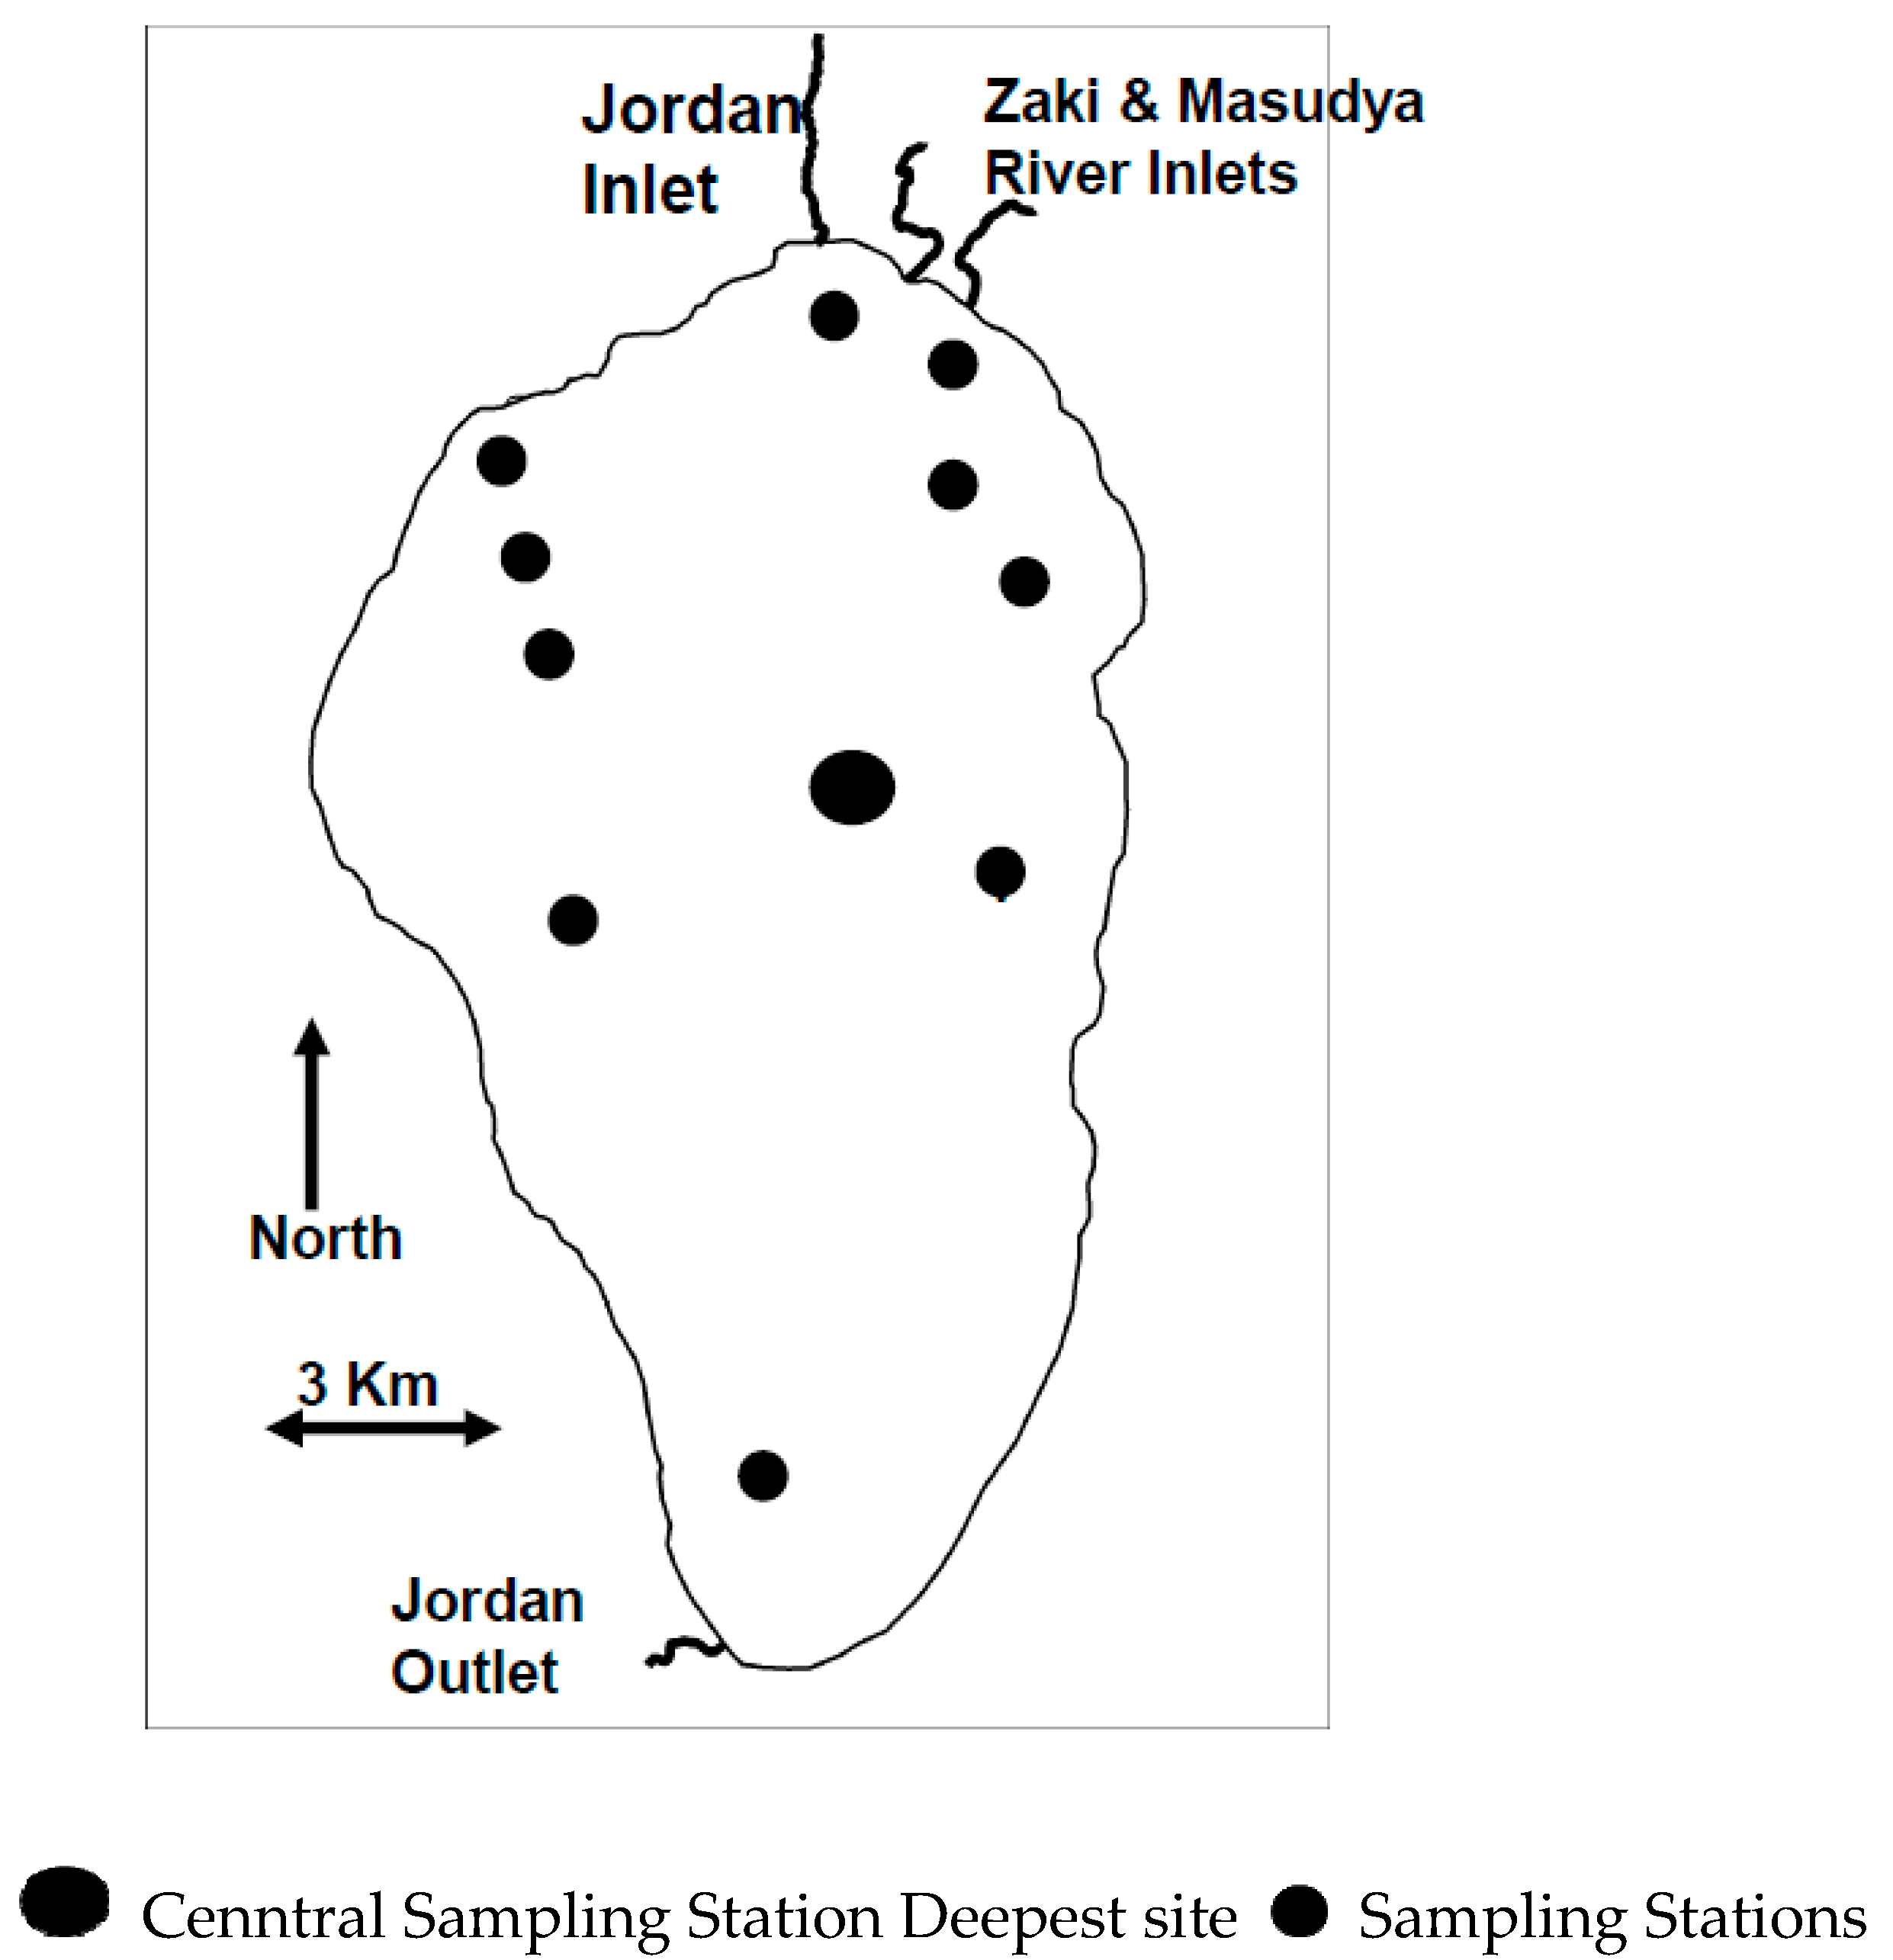
Figure 2.
Lake Kinneret Map with Sampling Station distribution.

Figure 3.
The decline of rainfall and river discharge: (A,B) Annual Rain (mm); (C,D) Jordan Discharge (mcm/y) (A,C) line scatter; (B,D) FP regression; Two exceptions: 1991–2: 842 mcm/y; 2003–4: 807 (mcm/y) are indicated.
Figure 3.
The decline of rainfall and river discharge: (A,B) Annual Rain (mm); (C,D) Jordan Discharge (mcm/y) (A,C) line scatter; (B,D) FP regression; Two exceptions: 1991–2: 842 mcm/y; 2003–4: 807 (mcm/y) are indicated.

Figure 4.
The increase of P form concentrations In relation to discharge: FP regression between annual (1970–2018) mean 4: concentrations (ppm) of Total Phosphorus (TP), Total Dissolved Phosphorus (TDP) and Soluble Reactive Phosphorus (SRP) in Jordan waters and annualJordan discharge (mcm/y).
Figure 4.
The increase of P form concentrations In relation to discharge: FP regression between annual (1970–2018) mean 4: concentrations (ppm) of Total Phosphorus (TP), Total Dissolved Phosphorus (TDP) and Soluble Reactive Phosphorus (SRP) in Jordan waters and annualJordan discharge (mcm/y).

Figure 5.
Temporal changes of P loads:FP regression between annual (1970–2018) Load inputs (ton) through Jordan discharge of Total Phosphorus (TP),Total Dissolved Phosphorus (TDP) and Soluble Reactive Phosphorus (SRP) and years.
Figure 5.
Temporal changes of P loads:FP regression between annual (1970–2018) Load inputs (ton) through Jordan discharge of Total Phosphorus (TP),Total Dissolved Phosphorus (TDP) and Soluble Reactive Phosphorus (SRP) and years.

Figure 6.
Nitrogen form concentrations in relation to Jordan discharge: FP regression between annual (1970–2018) mean concentrations (ppm) of Total Nitrogen (TN), Kjeldhal Dissolved (KJD) and Kjeldhal Total (KJT)in Jordan waters and annualJordan discharge (mcm/y).
Figure 6.
Nitrogen form concentrations in relation to Jordan discharge: FP regression between annual (1970–2018) mean concentrations (ppm) of Total Nitrogen (TN), Kjeldhal Dissolved (KJD) and Kjeldhal Total (KJT)in Jordan waters and annualJordan discharge (mcm/y).

Figure 7.
Nitrogen form concentrations in relation to Jordan discharge:FP regression between annual (1970–2018) mean concentrations (ppm) of Nitrate (NO3), Ammonium (NH4) and Organic Nitriogen (ORGN) in Jordan waters and annual Jordan discharge (mcm/y).
Figure 7.
Nitrogen form concentrations in relation to Jordan discharge:FP regression between annual (1970–2018) mean concentrations (ppm) of Nitrate (NO3), Ammonium (NH4) and Organic Nitriogen (ORGN) in Jordan waters and annual Jordan discharge (mcm/y).

Figure 8.
Temporal changes of N loads: FP regression between annual (1970–2018) Load inputs (ton) through Jordan discharge of Nitrate (NO3), Ammonium (NH4), and Organuc Nitrogen (ORGN)Nitrogen and years.
Figure 8.
Temporal changes of N loads: FP regression between annual (1970–2018) Load inputs (ton) through Jordan discharge of Nitrate (NO3), Ammonium (NH4), and Organuc Nitrogen (ORGN)Nitrogen and years.

Figure 9.
Temporal changes of N loads: FP regression between annual (1970–2018) Load inputs (ton) through Jordan discharge of Kjeldhal Dissolved (KJD), Total Nitrogen (TN), and Kjeldhal Total (KJT) and years.
Figure 9.
Temporal changes of N loads: FP regression between annual (1970–2018) Load inputs (ton) through Jordan discharge of Kjeldhal Dissolved (KJD), Total Nitrogen (TN), and Kjeldhal Total (KJT) and years.

Figure 10.
Temporal changes of Cyanobacteria and Peridinium Biomass: FP Regressions between annual averages of Phytoplankton Biomass (g/m2): (Peridinium) and, Cyanophyta and years.
Figure 10.
Temporal changes of Cyanobacteria and Peridinium Biomass: FP Regressions between annual averages of Phytoplankton Biomass (g/m2): (Peridinium) and, Cyanophyta and years.

Figure 11.
Biomass cfluctuations of Cyanobacteria and Peridiniun in relation to Residence Time (RT) length: FP regression between Residence Time length (RT) (Years) and Algal (Peridinium, Cyanophyta) Biomass (g/m2).
Figure 11.
Biomass cfluctuations of Cyanobacteria and Peridiniun in relation to Residence Time (RT) length: FP regression between Residence Time length (RT) (Years) and Algal (Peridinium, Cyanophyta) Biomass (g/m2).

Figure 12.
Temporal changes of Residence Time length in Lake Kinneret: FP regression between Annual means of monthly Residence Time (RT) value (years) and years in Lake Kinneret (1970–2018).
Figure 12.
Temporal changes of Residence Time length in Lake Kinneret: FP regression between Annual means of monthly Residence Time (RT) value (years) and years in Lake Kinneret (1970–2018).

Figure 13.
The relation between DIN and Cyanobacteria and Jordan discharge:FP regression: (A) Jordan Discharge (mcm/y) and Dissolved Inorganic Nitrogen(DIN) load (ton); (B): Wet Biomass of Cyanobacteria (mg/m2) and Jordan DIN annual loads.
Figure 13.
The relation between DIN and Cyanobacteria and Jordan discharge:FP regression: (A) Jordan Discharge (mcm/y) and Dissolved Inorganic Nitrogen(DIN) load (ton); (B): Wet Biomass of Cyanobacteria (mg/m2) and Jordan DIN annual loads.

Figure 14.
Temporal changes of Cyanobacteria biomass and DIN load. FP regression between: (A) Lake Wet Biomass (mg/m2) of Cyanobacteria and Year; (B) Predicted annual DIN Jordan Loads (ton) and Year.
Figure 14.
Temporal changes of Cyanobacteria biomass and DIN load. FP regression between: (A) Lake Wet Biomass (mg/m2) of Cyanobacteria and Year; (B) Predicted annual DIN Jordan Loads (ton) and Year.

Figure 15.
FP Regressions between annual averages of Standing Stocks (Ton) in the entire lake of Total Nitrogen (TN), Total Phosphorus (TP), and TN/TP mass ratio and Years.
Figure 15.
FP Regressions between annual averages of Standing Stocks (Ton) in the entire lake of Total Nitrogen (TN), Total Phosphorus (TP), and TN/TP mass ratio and Years.

Figure 16.
Trend of temporal (1963–2011) changes (LOWESS;0.8) of annual averages of daily maxima (upper) and minima (lower) of air temperatures Dafna meteorological station.
Figure 16.
Trend of temporal (1963–2011) changes (LOWESS;0.8) of annual averages of daily maxima (upper) and minima (lower) of air temperatures Dafna meteorological station.

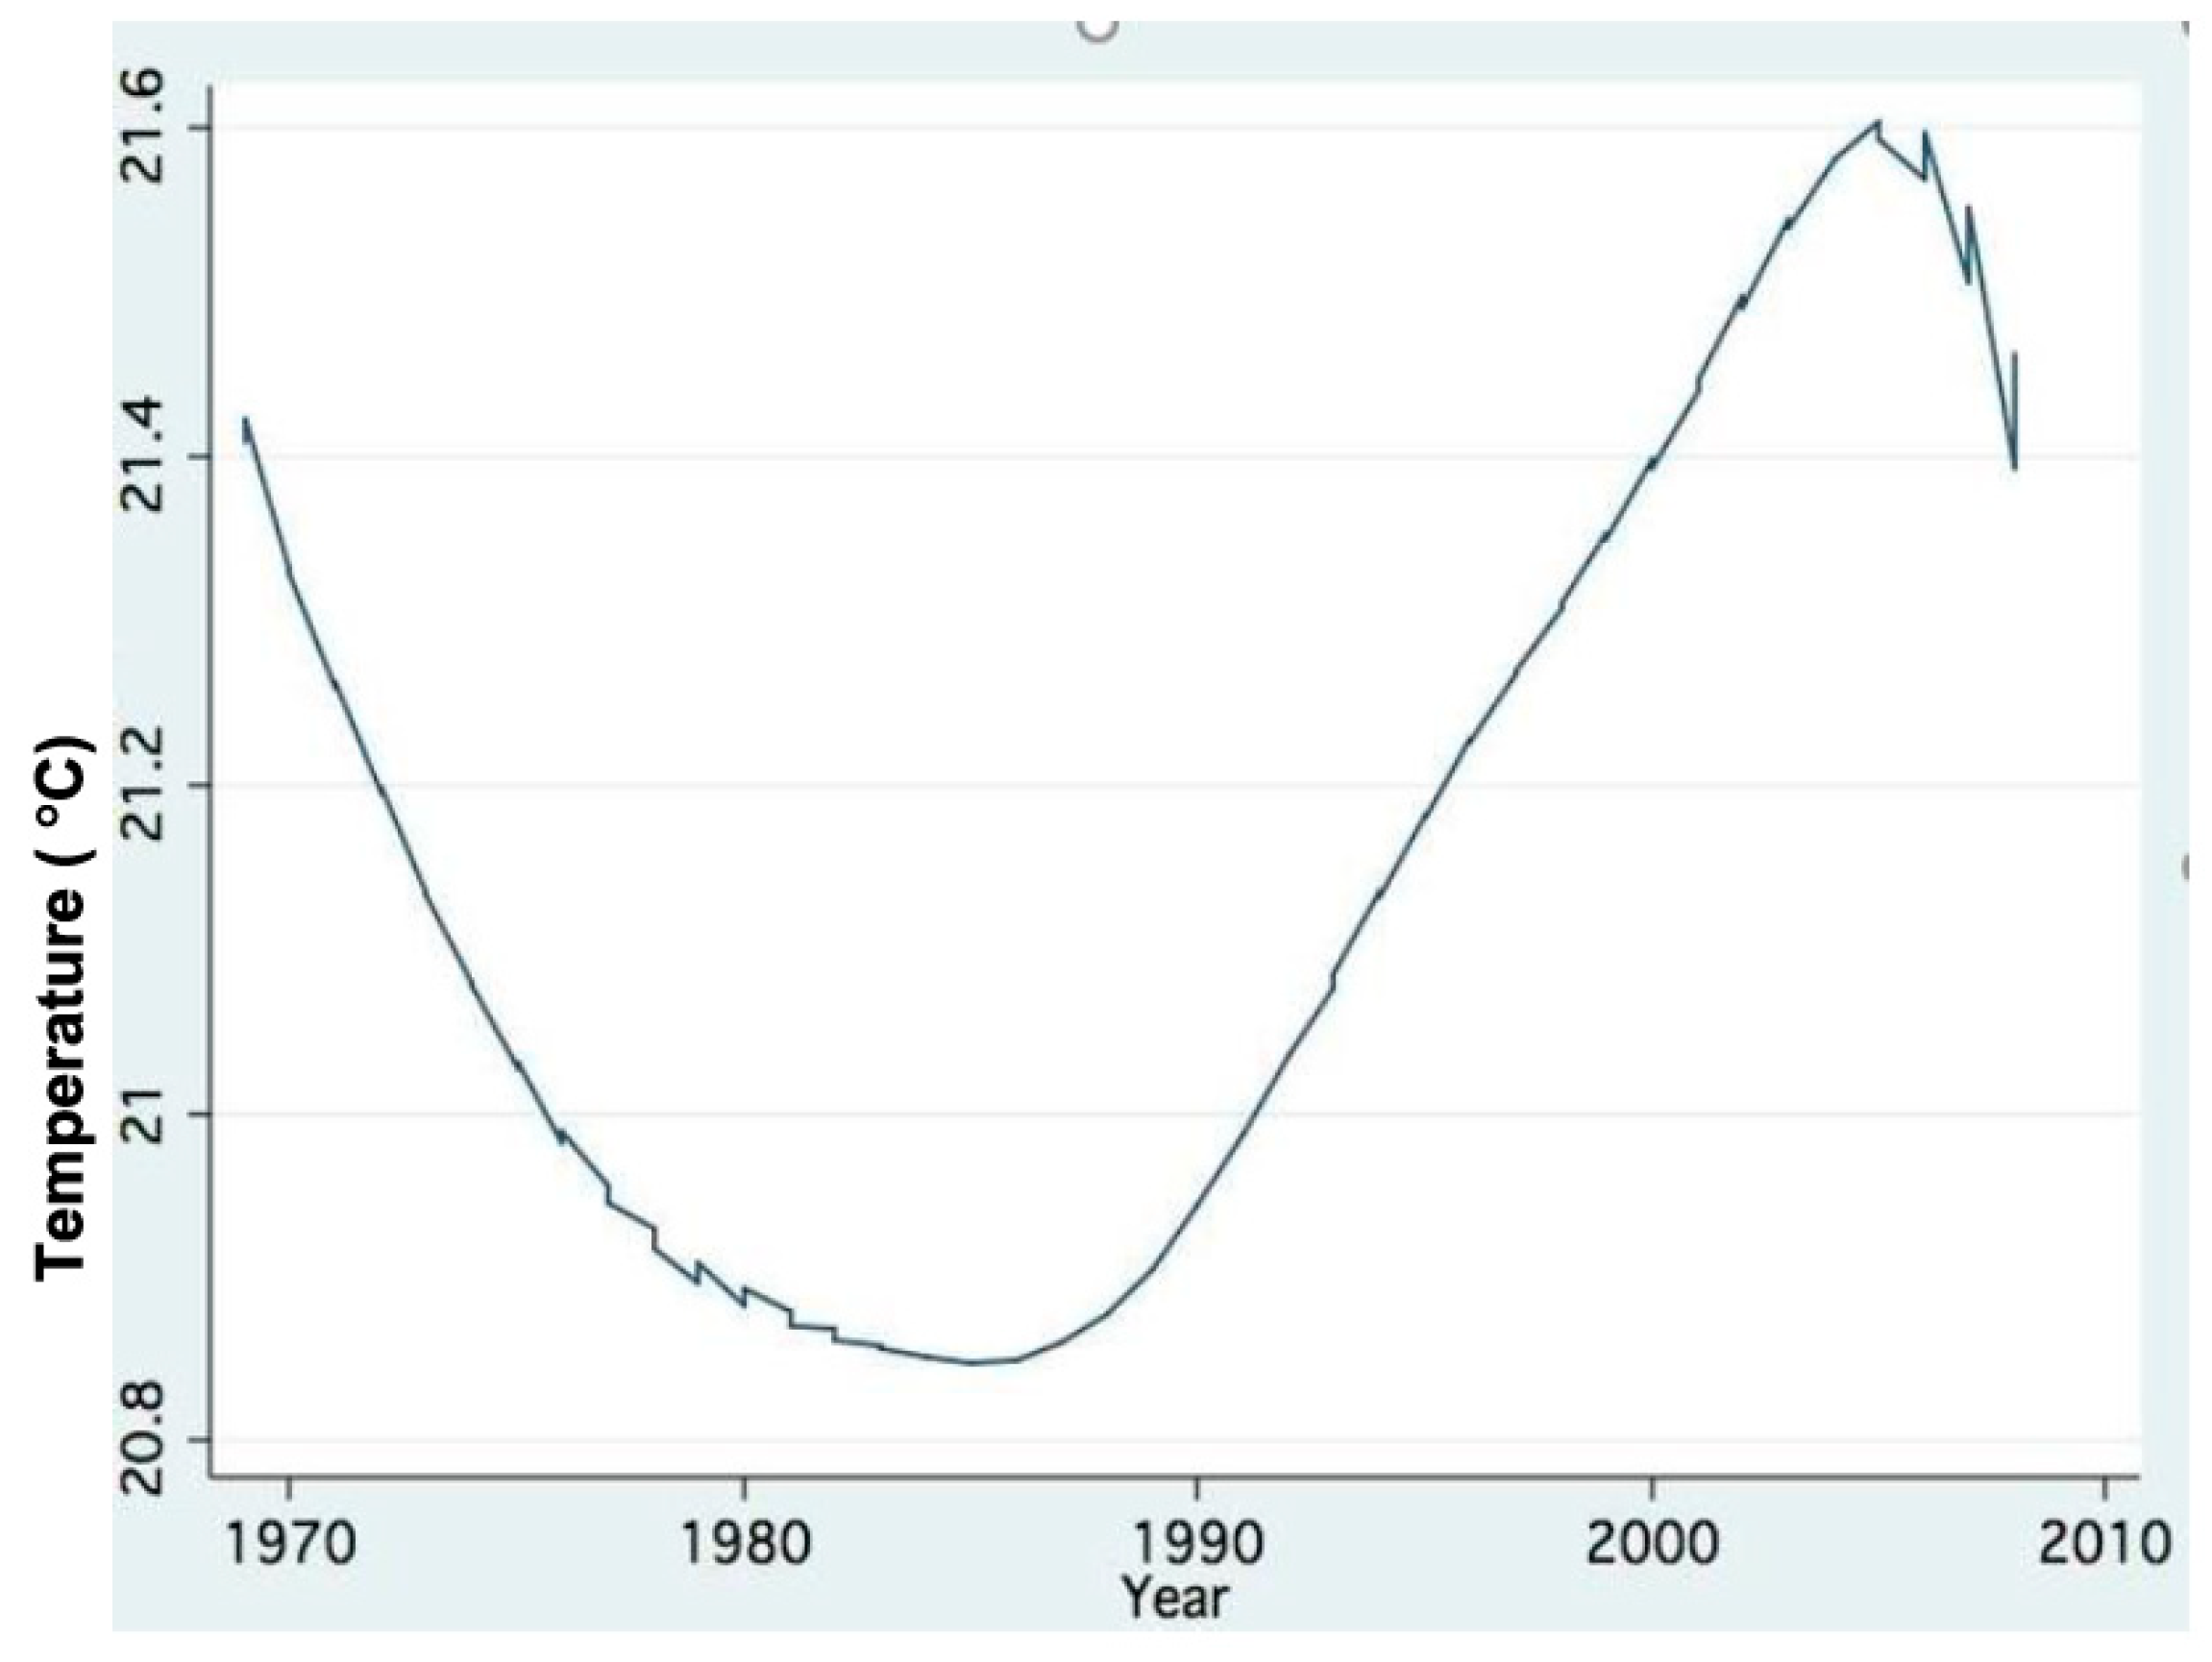
Figure 17.
Trend of changes (LOWESS;0.8) of annual means (1969–2008) of Epilimnetic mean temperature.
Figure 17.
Trend of changes (LOWESS;0.8) of annual means (1969–2008) of Epilimnetic mean temperature.


Table 1.
Maximal Concentrations of Microcystins in Lake Kinneret from 2005 to 2018 [5], given in microgram Microcystins per gram biomass (dry weight) of Microcystis sp. biomass (dry weight) and microgram per liter of sampled waters (n = number of samples) [5,7].
| Year | Microgram Per Gram Dw | Microgram Per L |
|---|---|---|
| 2005 | 22 (n = 1) | |
| 2006 | 539 (n = 3) | |
| 2007 | 366 (n = 5) | |
| 2008 | 494.3 (n = 3) | |
| 2009 | 750.6 (n = 9) | 1.31 (n = 6) |
| 2010 | 169.4 (n = 3) | 3.2 (n = 3) |
| 2011 | 9.4 (n = 1) | |
| 2012 | 135.8 (n = 8) | 1.43 (n = 9) |
| 2013 | 935.1 (n = 7) | 1.16 (n = 3) |
| 2014 | 252.6 (n = 1) | |
| 2015 | 9.8 (n = 3) | 1.65 (n = 2) |
| 2016 | 93.8 (n = 6) | 0.7 (n = 4) |
| 2017 | 116.3 (n = 4) | 1.0 (n = 1) |
| 2018 | 21.7 (n = 5) |
Publisher’s Note: MDPI stays neutral with regard to jurisdictional claims in published maps and institutional affiliations. |
© 2021 by the author. Licensee MDPI, Basel, Switzerland. This article is an open access article distributed under the terms and conditions of the Creative Commons Attribution (CC BY) license (http://creativecommons.org/licenses/by/4.0/).
Share and Cite
MDPI and ACS Style
Gophen, M. Climate Change-Enhanced Cyanobacteria Domination in Lake Kinneret: A Retrospective Overview. Water 2021, 13, 163. https://doi.org/10.3390/w13020163
AMA Style
Gophen M. Climate Change-Enhanced Cyanobacteria Domination in Lake Kinneret: A Retrospective Overview. Water. 2021; 13(2):163. https://doi.org/10.3390/w13020163
Chicago/Turabian StyleGophen, Moshe. 2021. "Climate Change-Enhanced Cyanobacteria Domination in Lake Kinneret: A Retrospective Overview" Water 13, no. 2: 163. https://doi.org/10.3390/w13020163
Note that from the first issue of 2016, this journal uses article numbers instead of page numbers. See further details here.