Spatial and Temporal Evolution of Leaching Zones within Potash Seams Reproduced by Reactive Transport Simulations


1
GFZ German Research Centre for Geosciences, 14473 Potsdam, Germany
2
Institute of Geosciences, University of Potsdam, 14469 Potsdam, Germany
3
K+S Aktiengesellschaft, 34131 Kassel, Germany
*
Author to whom correspondence should be addressed.
Water 2021, 13(2), 168; https://doi.org/10.3390/w13020168
Submission received: 29 October 2020
/
Revised: 6 January 2021
/
Accepted: 11 January 2021
/
Published: 13 January 2021
(This article belongs to the Special Issue Modeling of Flow and Transport in Saturated and Unsaturated Porous Media)
Abstract
:Leaching zones within potash seams generally represent a significant risk to subsurface mining operations and the construction of technical caverns in salt rocks, but their temporal and spatial formation has been investigated only rudimentarily to date. To the knowledge of the authors, current reactive transport simulation implementations are not capable to address hydraulic-chemical interactions within potash salt. For this reason, a reactive transport model has been developed and complemented by an innovative approach to calculate the interchange of minerals and solution at the water-rock interface. Using this model, a scenario analysis was carried out based on a carnallite-bearing potash seam. The results show that the evolution of leaching zones depends on the mineral composition and dissolution rate of the original salt rock, and that the formation can be classified by the dimensionless parameters of Péclet (Pe) and Damköhler (Da). For Pe > 2 and Da > 1, a funnel-shaped leaching zone is formed, otherwise the dissolution front is planar. Additionally, Da > 1 results in the formation of a sylvinitic zone and a flow barrier. Most scenarios represent hybrid forms of these cases. The simulated shapes and mineralogies are confirmed by literature data and can be used to assess the hazard potential.
1. Introduction
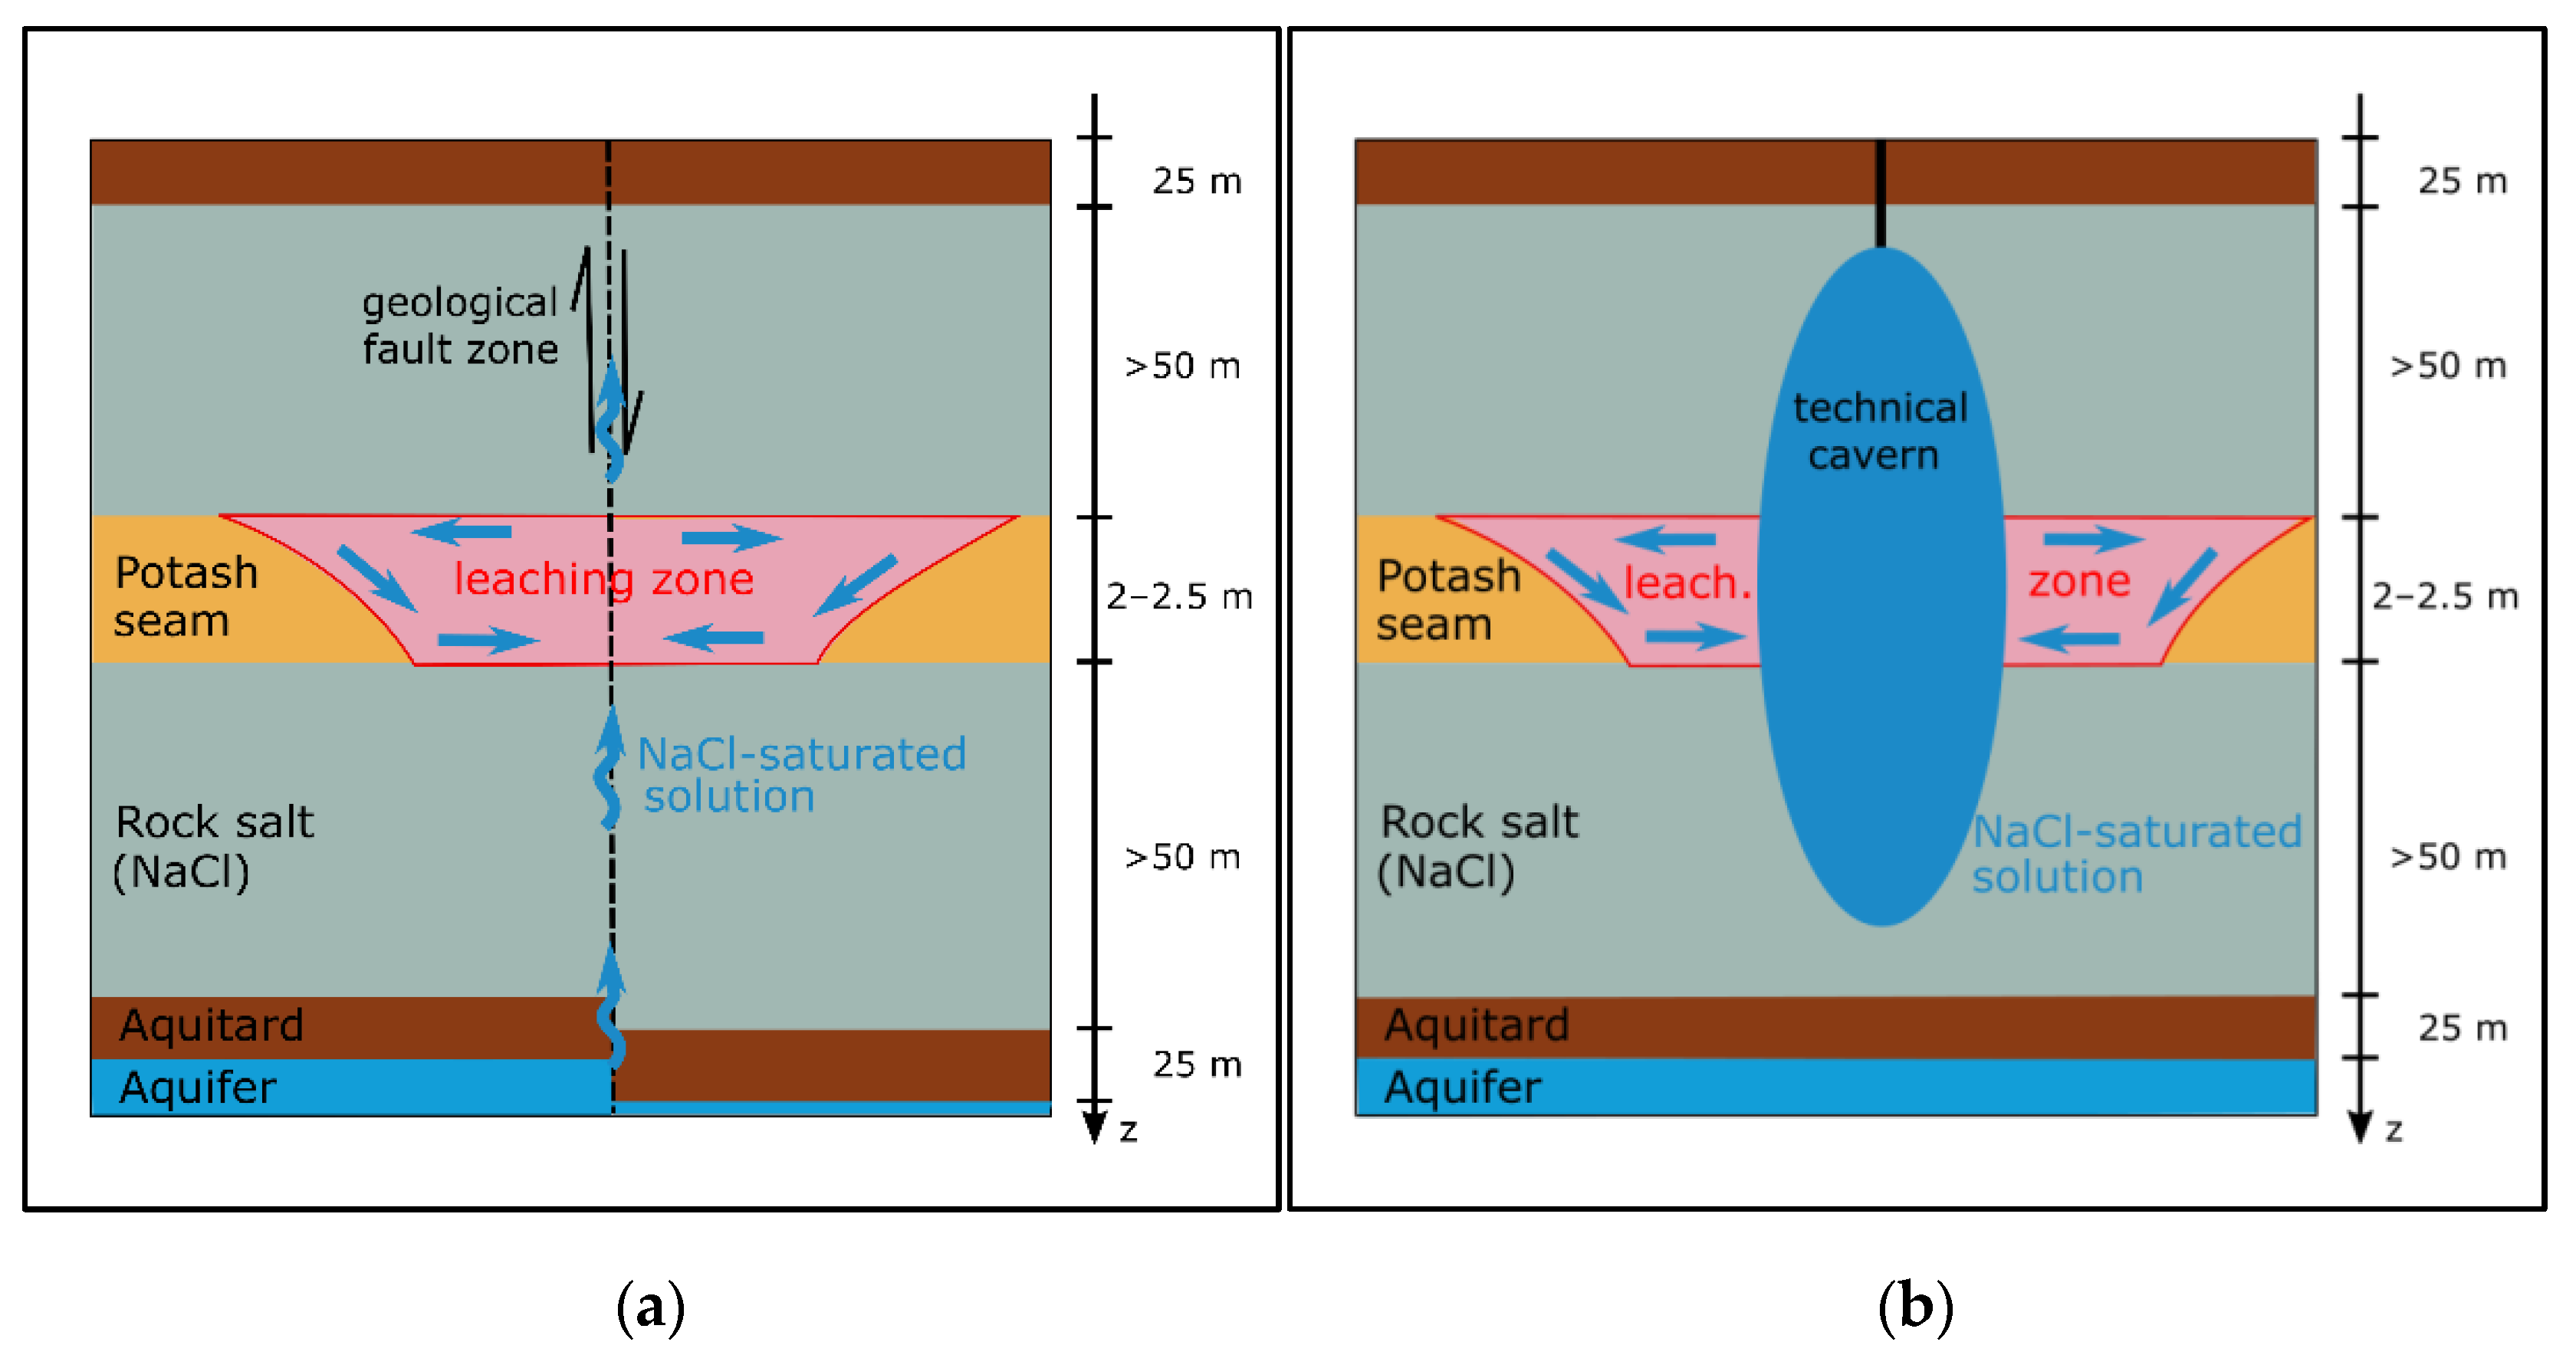
The formation of leaching zones within potash seams represents a significant safety risk in salt mining [1,2] and the construction of technical caverns [3,4]. The latter are needed in the course of the energy transition, for example for the storage of hydrogen [5]. Due to the increased solubility of potash salts, even NaCl-saturated solutions, if available, can penetrate deeply into potash seams and initiate leaching processes that generate fluid flow paths (Figure 1) and affect the mechanical stability [2,6]. In order to model the temporal and spatial evolution of leaching zones, coupling of chemical reactions with density-driven species transport is required [7]. One main difficulty is the description of transport and chemical reactions within regions of strongly varying porosities such as the dissolution front. If impermeable (dry) salt rock inhibits the inflow of solution, chemical reactions cannot take place and the dissolution front is immobile. Accordingly, a sequential coupling of transport and chemistry as described in Steefel et al. [8] does not suffice but an additional approach to describe the process interaction at the solid/liquid interface is required. Reactive transport models dealing with rock salt often use a mass transfer rate to overcome this limitation [9,10,11]. Laouafa et al. [12,13] introduced a local non-equilibrium diffuse interface model to describe the dissolution of halite and gypsum at the interface. However, these approaches have only been applied to binary systems yet. Furthermore, they do not consider precipitations which may inhibit the solution inflow into permeated areas as well. Therefore, a more sophisticated approach is required when dealing with potash salt which consists of several minerals and causes the precipitation of secondary minerals. So far, only simplified approaches [14] and benchmarks on selected rocks [15] are available for the development of leaching zones within potash seams.
The paper discusses a modelling approach, which allows to qualitatively reproduce the temporal and spatial evolution of leaching zones within potash seams. For this purpose, the TRANSport Simulation Environment (TRANSE) [16] was coupled with the geochemical reaction module PHREEQC [17], and extended by a new approach to describe the interchange of minerals and solution at the water-rock interface. A carnallite-bearing potash seam is used in the simulations to validate the results against literature data. Hereby, the present study especially focuses on density-driven flow, which governs natural leaching processes and cavern formation according to Anderson and Kirkland [18]. By means of scenario analyses the dissolution rate and the rock composition of the potash seam are varied and it is determined under which conditions the leaching zone growth is transport- or reaction-dominated, whether advection or diffusion dominates the transport and to what extent the evolution of the leaching zone is affected in this way.
2. Materials and Methods
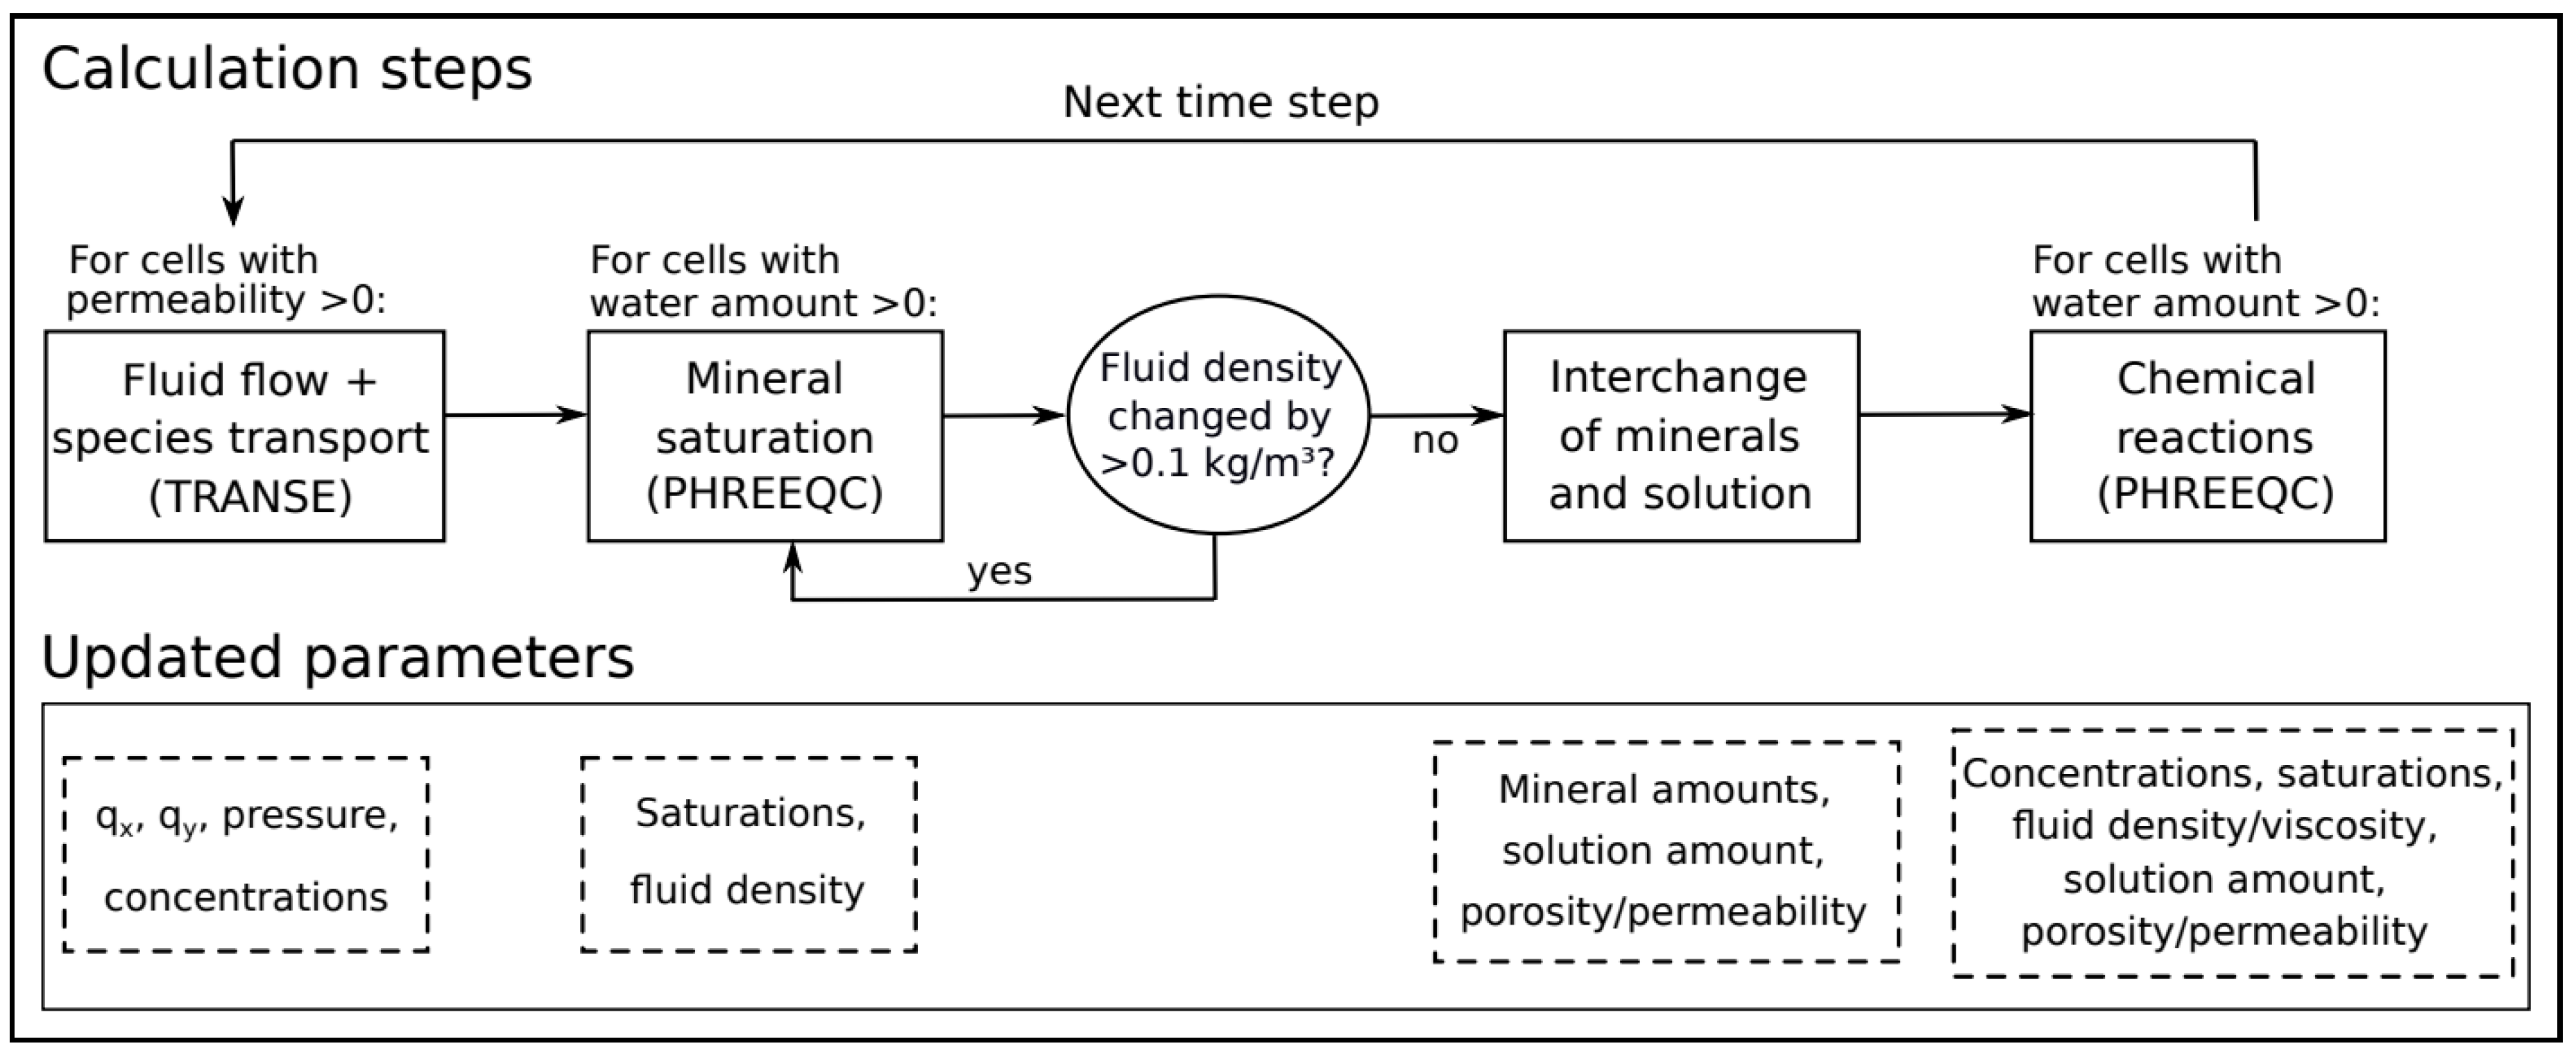
To simulate the spatial and temporal formation of leaching zones within potash seams, a numerical reactive transport model has been developed in the present study and is discussed in the following sections. An overview of all the calculation steps is shown in Figure 2. At the beginning of each time step, the simulation of fluid flow and transport of chemical species are carried out using TRANSE. Thereafter, saturation and fluid density are updated in order to minimize mass balance errors in the chemical reaction calculations. Saturation and fluid density as well as chemical reactions are determined by using the PHREEQC simulation module with the THEREDA database [19]. Between them, an additional step called “interchange” is performed. Finally, the calculated concentrations, fluid densities, viscosities and porosities are transferred back to the TRANSE simulator and used to calculate the fluid flow and mass transport of the next time step (Figure 2).
The term “saturated” is used in view of the chemical equilibration of the solution with respect to certain minerals. The fluid saturation in the pore space is referred to as “dry” or “permeated”. This subdivision is necessary, since pores within unaffected potash salt usually do not contain any water.
2.1. Fluid Flow and Transport of Chemical Species
TRANSE is a fluid flow and transport code that is based on the Finite Difference Method [16]. Due to the fact that the solution crosses several rock salt layers before it reaches the potash seam (Figure 1), it is generally NaCl-saturated with the consequence that halite is not dissolved during the formation of leaching zones. Hence, a porous medium is established within the potash seams [14] and consequently, Darcy flow in a medium fully saturated with a single phase fluid (further referred to as permeated) is applied in the present study. A fully-implicit numerical scheme is used to solve the density-driven formulation of the Darcy flow equation, coupled with the equations for transport of reactive chemical species. Therein, advective and diffusive species transport are taken into account. Input parameters from the previous time step are the spatial distribution of minerals and species concentration, fluid density and viscosity as well as porosity Φ and permeability kf. Using these input data, the numerical simulator computes the spatial distribution in flow velocities, fluid pressure and species concentration for the current time step. The coupled modelling results were thoroughly checked for any appearance of oscillations at locations with sharp concentration fronts. The choice of strict convergence criteria for the solution of both coupled partial differential equation systems, flow and transport, ensured that flow velocity and concentration changes due to oscillations were negligible during the entire simulation time. Alternative oscillation mitigation schemes such as artificial diffusion terms, cross-wind streamline diffusion correction, etc., were neither required nor applied. All details on the mathematical model and its numerical implementation are provided in Kempka [16].
2.2. Mineral Saturation and Fluid Density
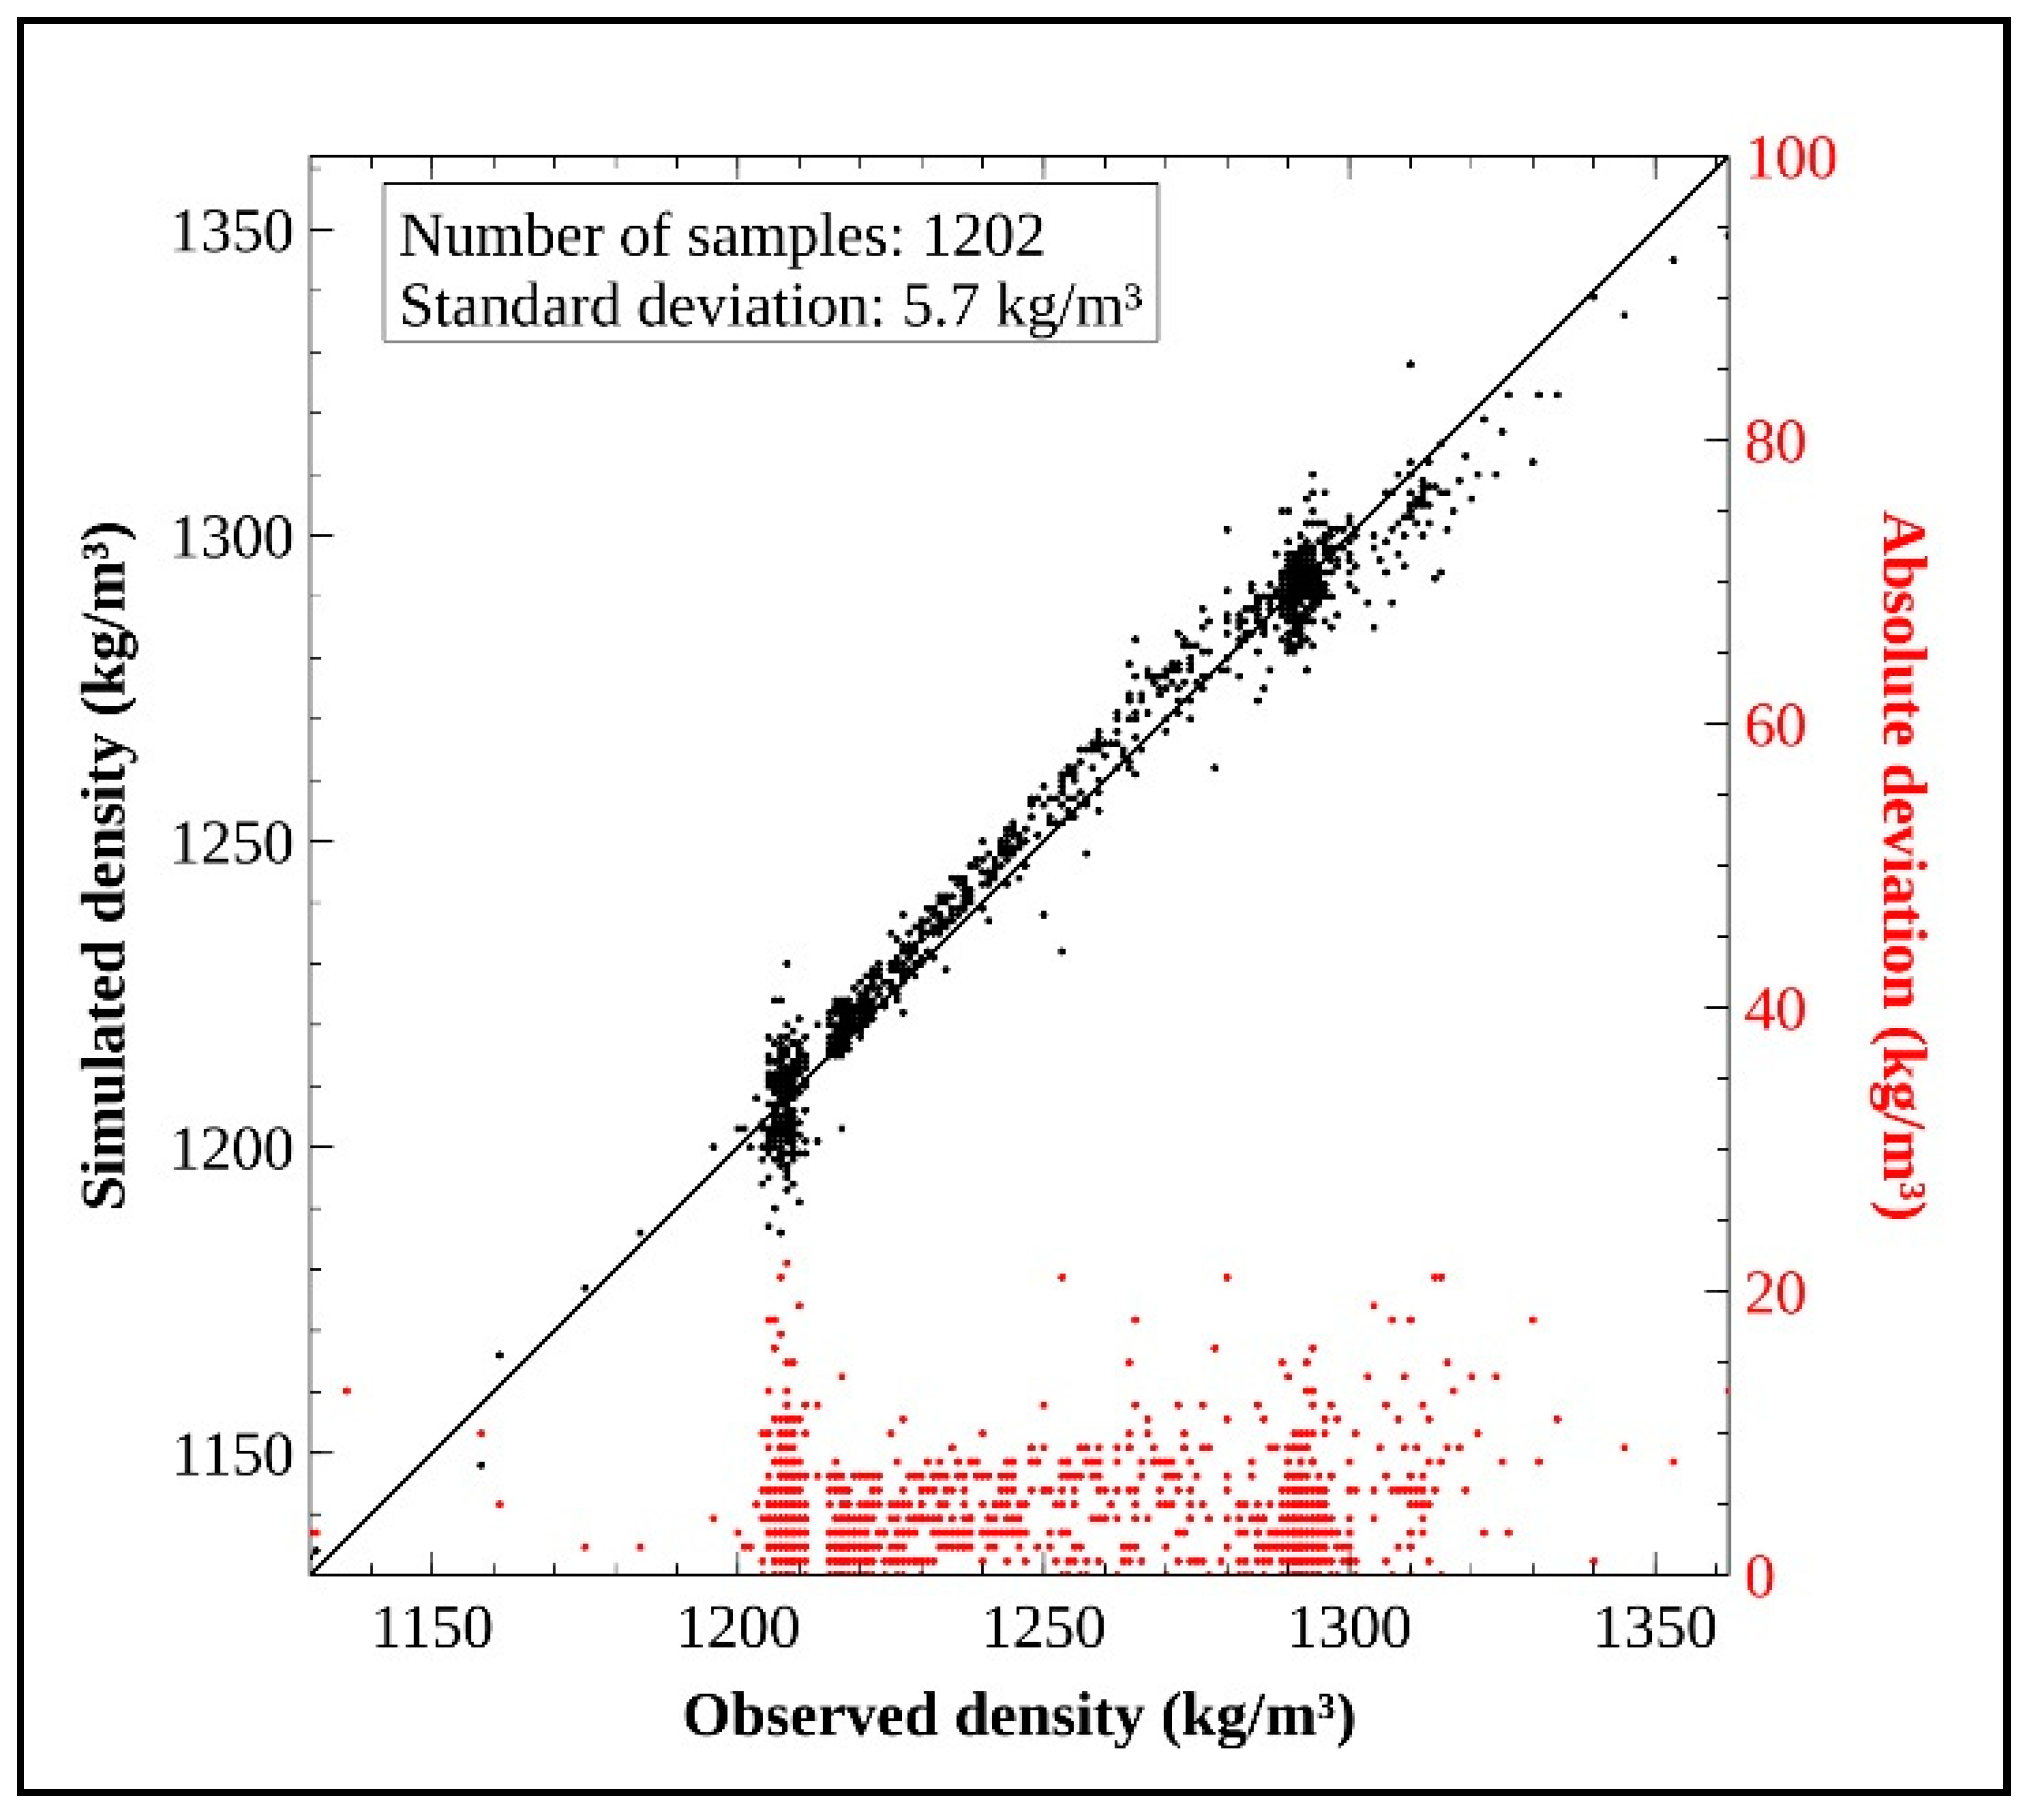
When using the updated concentrations after the flow and transport calculation in the chemical reaction calculations, an accurate fluid density is most important to minimize mass balance errors. For this purpose, the updated species concentrations are transferred to the PHREEQC simulation module to update the fluid density and saturation. In this regard, the THEREDA database was extended by molar volumes for the involved species. Its validation showed a very good agreement with the PHREEQC simulation results with more than 1000 fluid density measurements from a potash salt mine of K+S (Figure 3). If the updated fluid density differs by more than 0.1 kg/m3 from the input value, the process is iteratively repeated until a deviation of <0.1 kg/m3 is achieved. The saturation of the solution is needed for the interchange as well as for the chemical reaction calculations representing the final two calculation steps in each time step (Figure 2).
2.3. Interchange of Minerals and Solution at the Water-Rock Interface
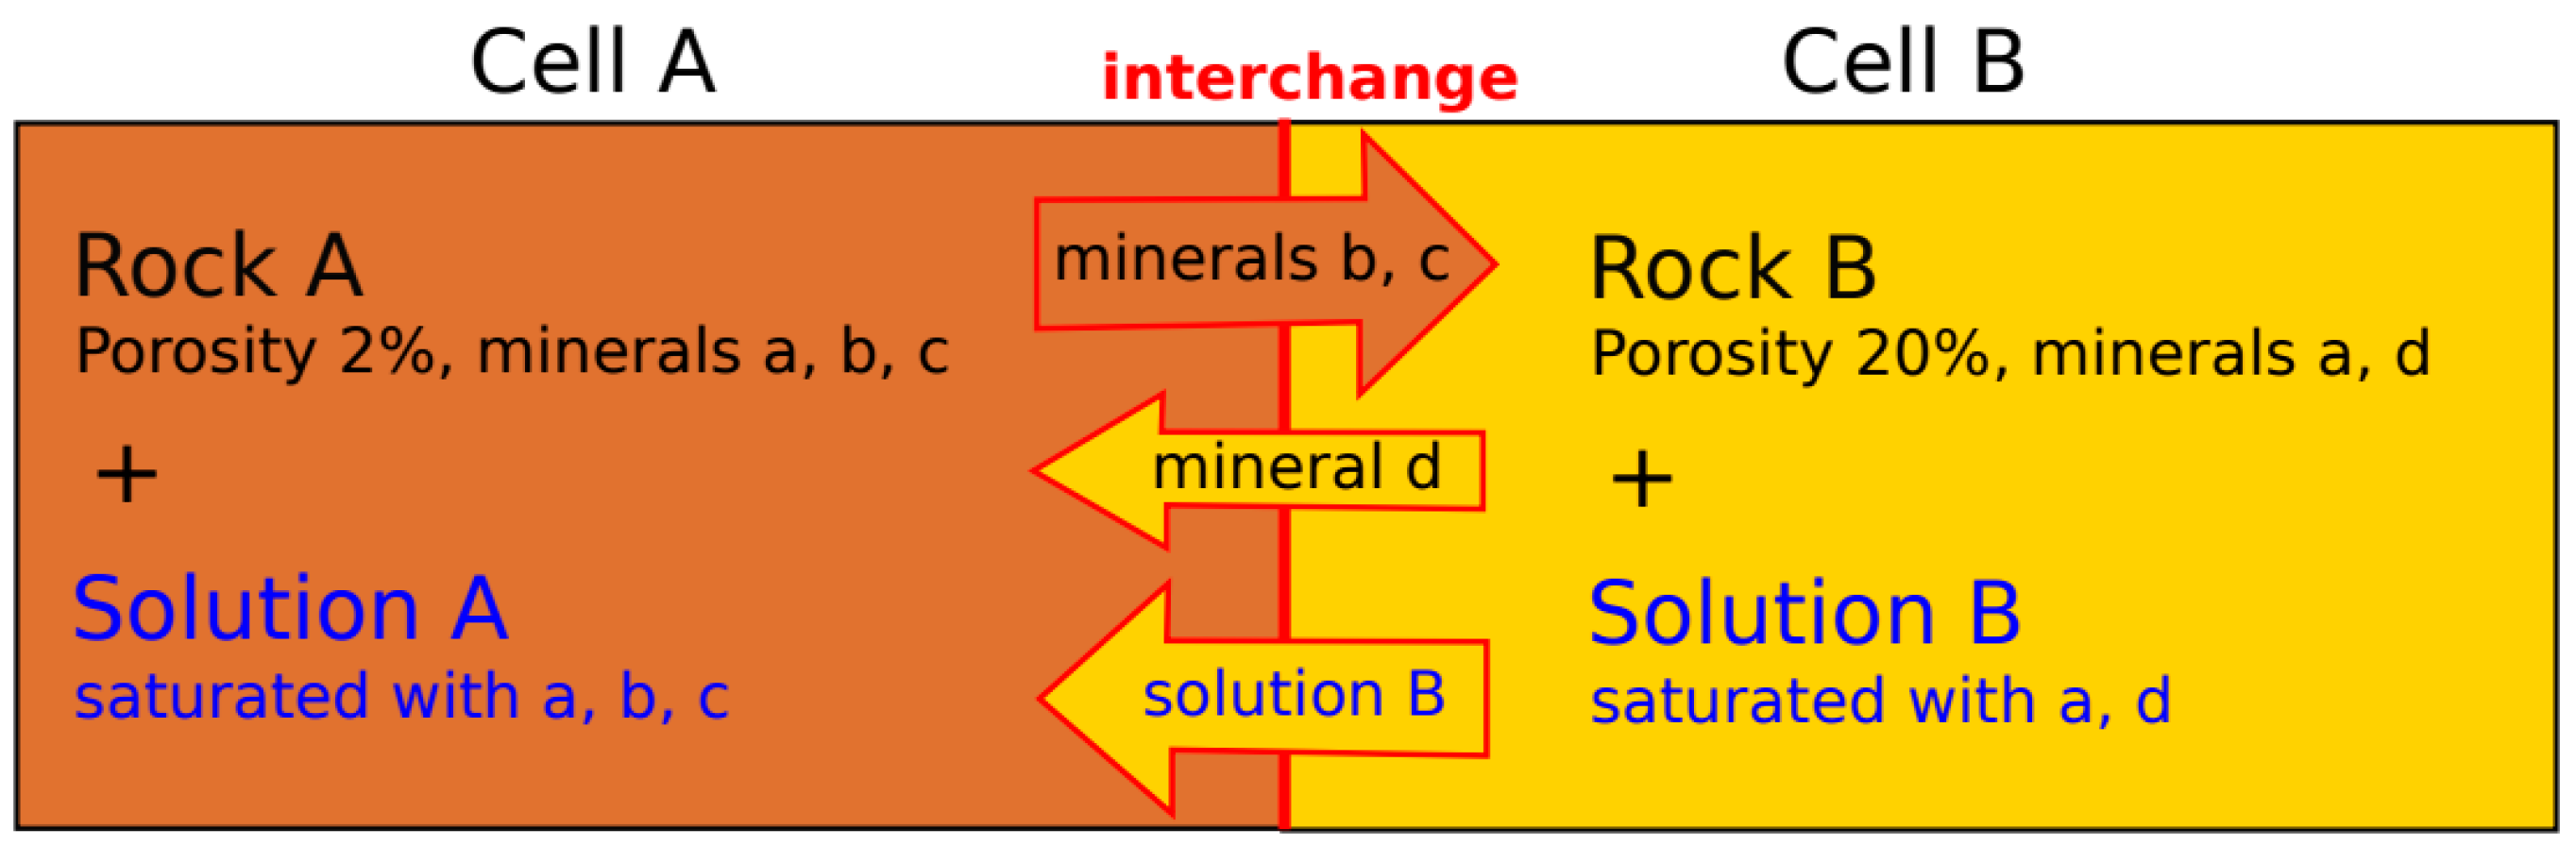
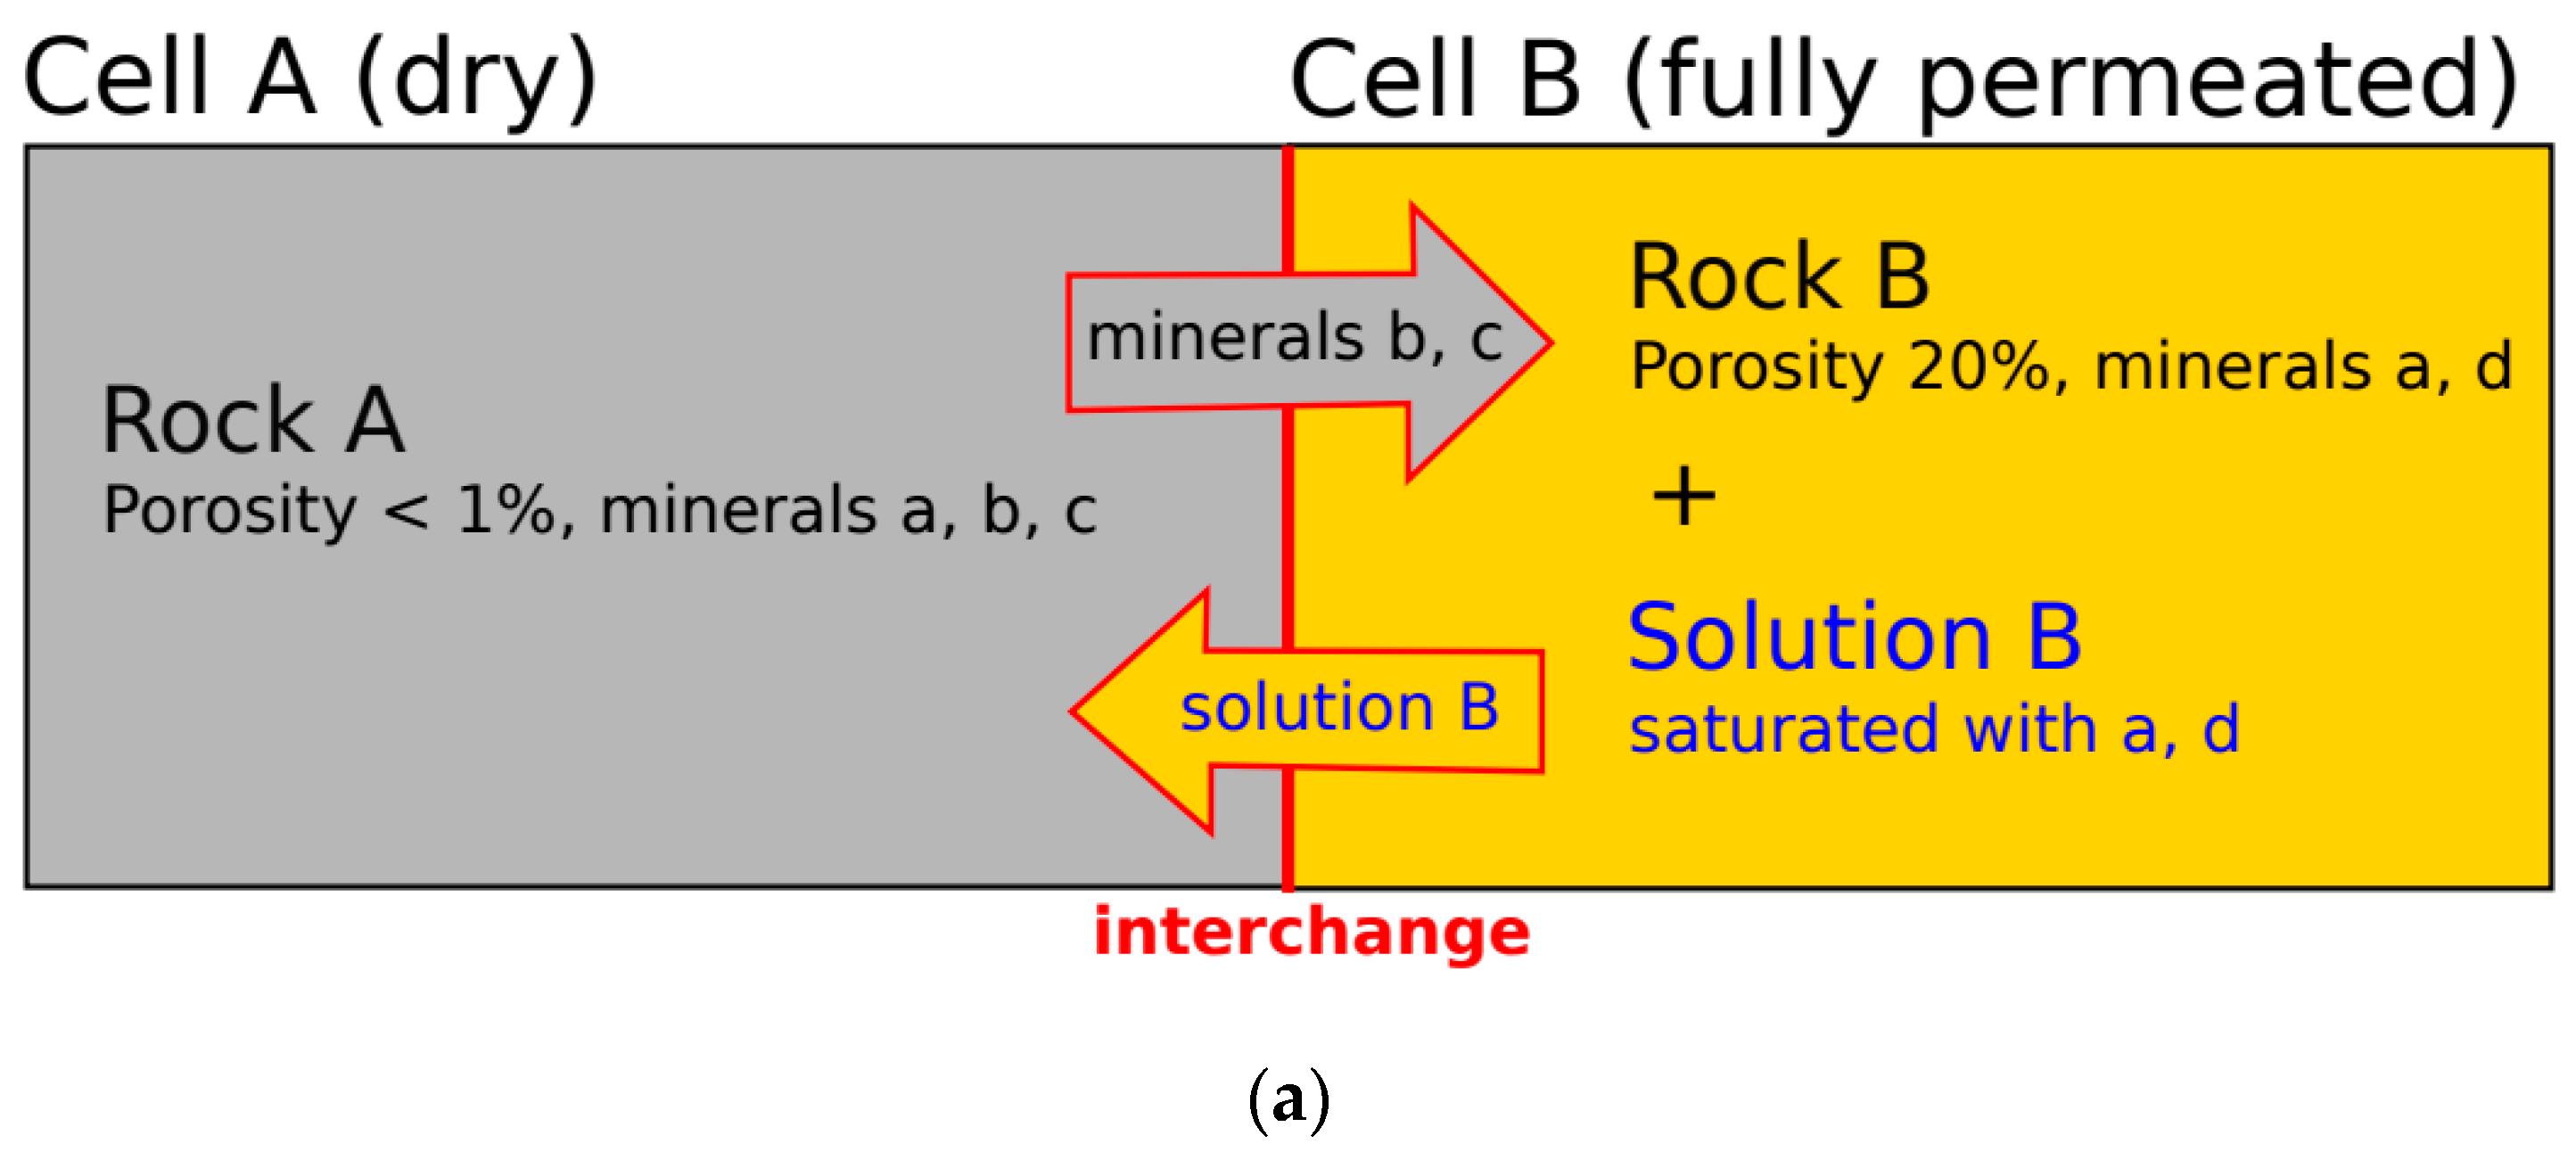
Describing the water-rock interface represents a particular challenge in the simulation of leaching zone growth. The porosity of dry, unaffected salt rock is negligible (<<1%). Even if completely permeated with brine, the result would be such a high solid-fluid ratio that all water present is converted into crystal water, while the very small existing pore space would be sealed by secondary minerals [15,20]. Accordingly, further fluid flow into the salt rock and resulting chemical reactions would cease. However, observations from the lab and the field prove that this is not the case if adjacent open pore space contains undersaturated solution. In order to manage the solid-liquid dissolution at the water-rock interface, a mineral and solution interchange modelling approach was developed in the present study. It describes the processes of mineral dissolution and transfer of solution between dry or permeated cells with very low porosities and adjacent cells with high porosity (Figure 4).
In our approach, a pre-determined amount of the minerals in cell A is dissolved into cell B, provided that solution is present in cell A and that it is undersaturated with respect to the corresponding minerals (Figure 4). This is also realized in reverse direction and at each interface between two cells within the model. In order to keep the volume of both cells constant, a corresponding fluid volume is transferred from the cell with the lower quantity of dissolved minerals into the cell with the larger quantity of dissolved minerals (Figure 4). The maximum amount of minerals that can react Minsol (mol) is given by a rate law, which considers the dissolution rate and also the contact area between solution and rock. Between cell A and cell B the amount is calculated by Equation (1):
The r (cm/s) represents the average dissolution rate of all minerals within the salt rock. MinA (mol) is the sum of minerals present in cell A. Divided by the cell diameter perpendicular to the dissolution front di (cm), it gives the affected amount of minerals if 1 cm rock from cell A is dissolved. By multiplying this amount with the porosity in cell B ΦB (-), the contact area between the rock in cell A and the solution in cell B is taken into account. dt (s) is the length of the time step. The resulting amount of minerals represents a sum that is split among all minerals present in cell A according to their molar fractions. This ensures that the different mineral densities are considered. Only those minerals are dissolved which are undersaturated in regard to the solution in cell B. Based on the saturation calculation after the transport (Section 2.2) it is deduced which minerals are added to cell B. The excess minerals remain in cell A, so that the dissolution process is selective. After calculating the interchange, the rock composition in each cell is updated accordingly (Figure 2). Chemical reactions are calculated afterwards and are described in Section 2.4.
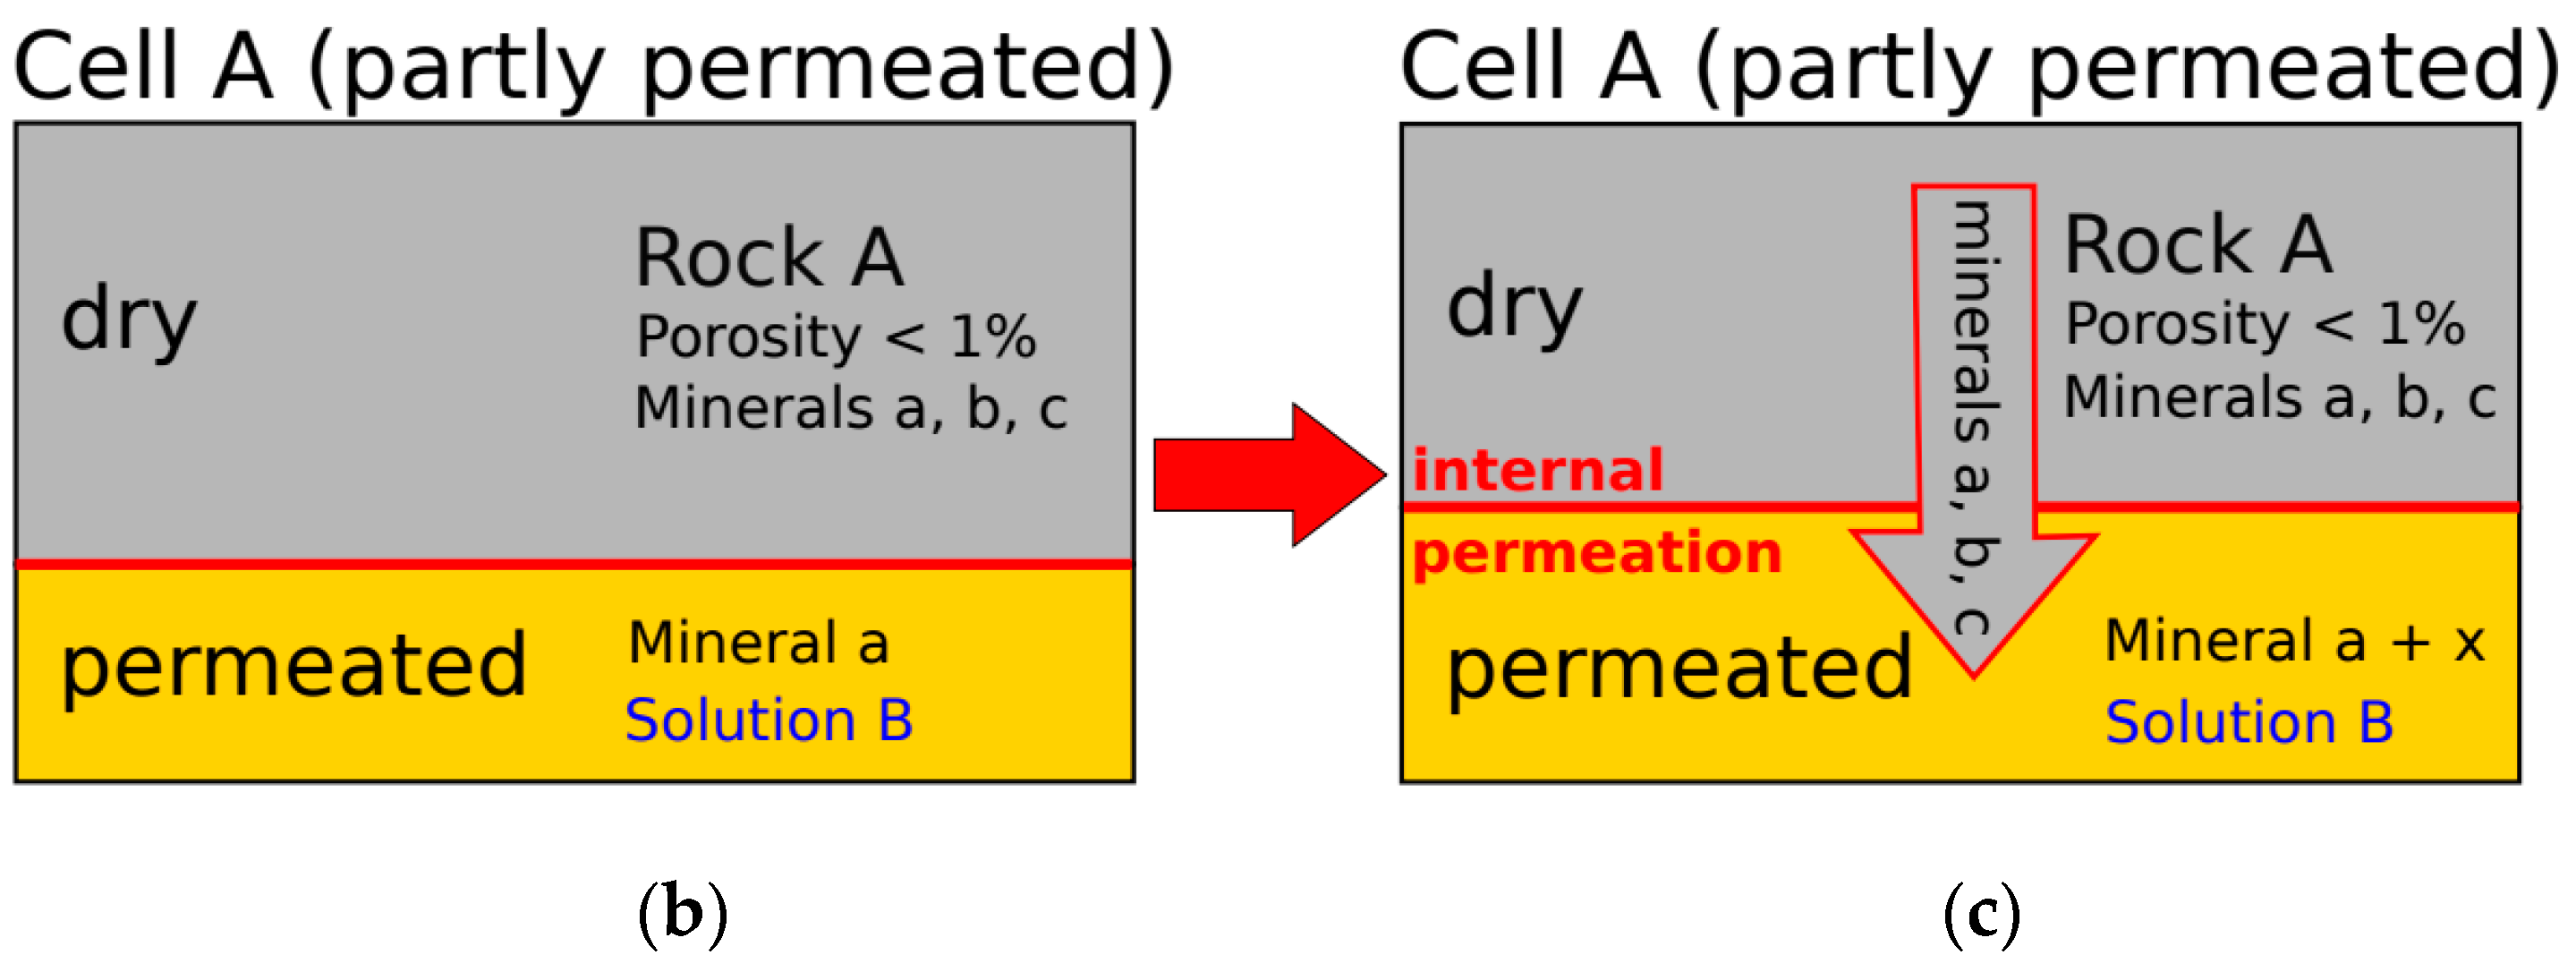
At the dissolution front, where permeated and dry potash salt are in contact, the dissolution of minerals is only allowed in one direction (Figure 5a). After calculating the interchange, the rock composition in each cell is updated. Again, the dissolution front represents a special case: originally dry cells that received solution for the first time are divided into a permeated and a dry sub-cell (Figure 5b). The permeated one contains those minerals that remained in the cell due to selective dissolution at the interface. Only this sub-cell is in contact with the solution transferred in the present modelling approach. The other part of the cell remains dry and is not considered in the subsequent calculation of chemical reactions. By this procedure, the immediate drying out of cells due to the high solid-fluid-ratio, and thus the requirement for re-permeation, are avoided. Dry and permeated sub-cells consist of different minerals. When the interchange between a partly permeated cell and an adjacent cell is calculated, both sub-cells are taken into account by weighting their volume fractions. However, mineral dissolution and inflow of solution from an adjacent cell can only occur in the permeated sub-cell.
In addition to the interchange between two cells, an internal permeation of the partly permeated cells at the dissolution front is taken into account. Here, dry minerals are gradually added to the permeated sub-cell, which may lead to the precipitation of new minerals (Figure 5c). The amount of minerals added Minadd (mol) follows the rate law in Equation (2);
in this case Mindry (mol) is the sum of minerals present in the dry sub-cell and Φper (-) is the porosity in the permeated sub-cell. As a result, the permeated sub-cell grows while the dry sub-cell shrinks. Only if a cell is fully permeated, a permeability >0 is assigned to it, so that fluid flow and transport of chemical species can take place. The chemical reactions resulting from transport and interchange are determined in the final calculation step (Figure 2) that is further described in the following section.
2.4. Chemical Reactions
If solution is transferred into a cell due to the interchange process (Figure 4), it is first mixed with the pre-existing solution in that cell by means of the PHREEQC simulation module. Thereafter, the occurring chemical reactions in each cell are calculated using the updated rock compositions after the interchange (Section 2.3). Based on our previous results [20], it is valid to assume that salt rock and saline solution quickly reach thermodynamic equilibrium. Therefore, within each permeated (sub-) cell all minerals are added to the solution and both are equilibrated by using the keywords “Reaction” and “Equilibrium Phases” in PHREEQC. The resulting solution and rock composition as well as fluid density are calculated using PHREEQC; viscosity is calculated according to Laliberté [21,22]. Porosity and permeability are updated in each cell following the chemical calculations. For this purpose, the volume of the minerals is determined according to Table 1 to calculate its relation to the cell volume. It may occur that the precipitated minerals exceed the available volume within the respective cell [15]. In such cases, the cell porosity is set to zero, while potential excess solution is neglected. If the total mineral volume is smaller than the cell volume, and the solution volume does not correspond to the volumetric difference, its amount is adjusted accordingly. This ensures that the pore space is always completely permeated, whereby the resulting errors in the mass balance are recorded. If the water in a permeated cell is fully consumed by the chemical reactions, the cell dries out. In case of a previously partly permeated cell, the minerals from the dry and the (formerly) permeated sub-cell are combined to form the updated dry rock composition. A porosity-permeability relationship (Equation (3)) introduced by Xie et al. [15] is applied.
2.5. Example Case of a Carnallite-Bearing Potash Seam
For the application example, leaching processes in a carnallite-bearing potash seam were simulated. Carnallitite is one of the most commonly occurring potash salts worldwide; besides carnallite (KMgCl3·6 H2O) and halite (NaCl) it contains also sylvite (KCl) and partly kieserite (MgSO4·H2O) as well as anhydrite (CaSO4). The chemical processes resulting from the contact with NaCl-saturated solution are well documented (among others) by Koch and Vogel [23]. The authors consider vertical fault zones as main cause for the reaction initiation (Figure 1a). Close to these, a porous matrix of leached halite is formed, followed by a sylvinitic zone which may also contain kainite. They state that both zones show an increased porosity compared to the original potash seam. At further distance follows the dry, carnallite-bearing potash salt, which does not belong to the leaching zone anymore. According to Koch and Vogel [23], the mineralogical boundaries between these three zones are often asymmetric with the leaching being more pronounced close to the hanging wall of the potash seam (Figure 1). However, in horizontal direction the leaching zone geometry is symmetric (Figure 1), so that 2D models are applied in the present study making use of this symmetry to reduce the computational time.
The aforementioned coupled reactive transport model was used to reproduce the formation of leaching zones. With regard to the rock composition, the main components carnallite, halite and sylvite with densities and dissolution properties according to Table 1 were taken into account. By their dissolution, the quaternary system NaCl-KCl-MgCl2-H2O was formed. The main overall reaction was the conversion of carnallite into sylvite and potash brine associated with the precipitation of halite (Equation (4)):
KMgCl3·6H2O + brine (NaCl)→ KCl + NaCl (brine) + brine (MgCl2, KCl, NaCl)
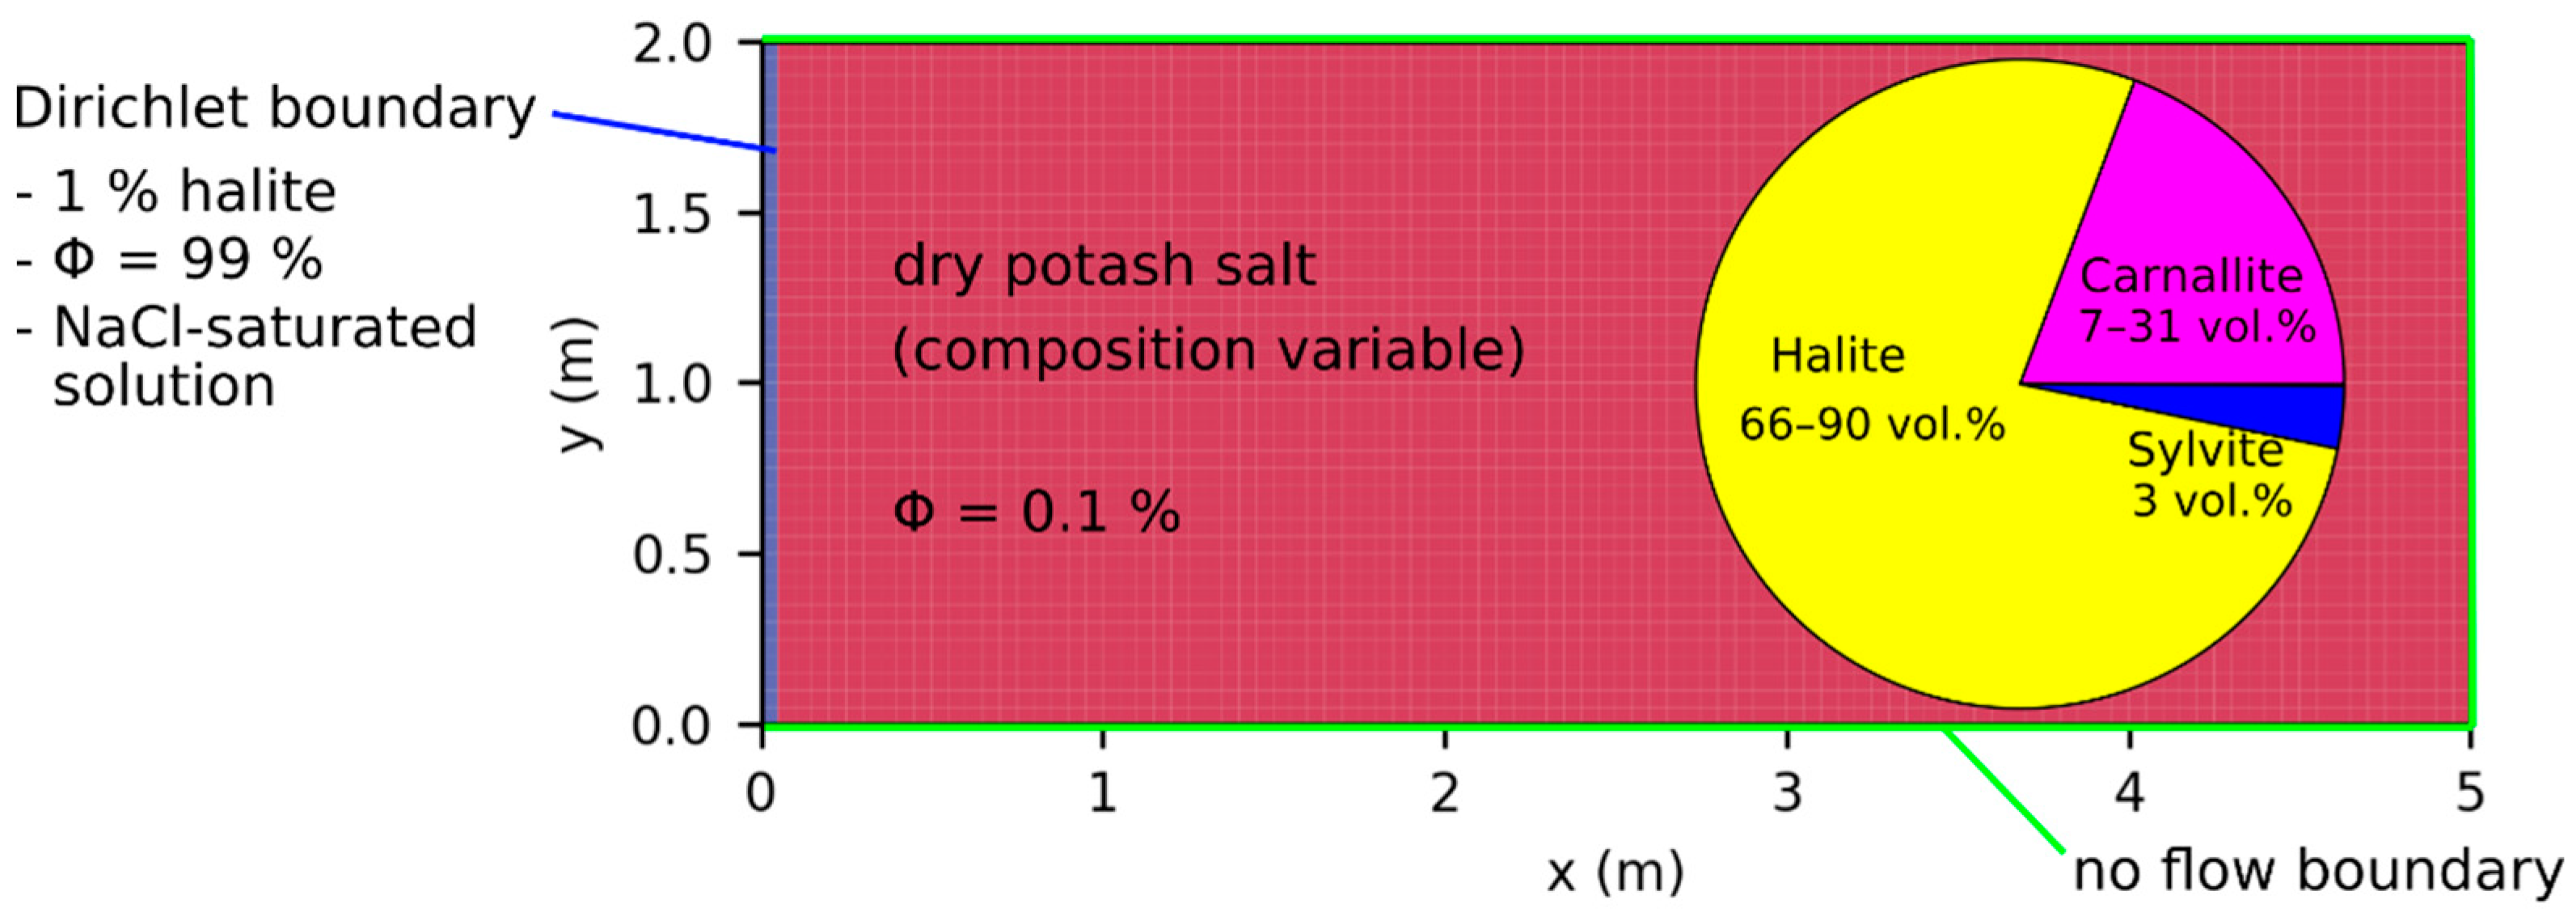
The reactive transport model applied was designed with a height of 2 m, based on the general thickness of potash seams in Germany, and a width of 5 m, and was discretized by 101 × 41 cells (Figure 6). In its initial state, the entire model consisted of dry, homogeneous carnallitite with a porosity of 0.1%. The left boundary represented a fault zone with a continuous inflow of fresh NaCl solution and formed the starting point of the leaching process within the carnallite-bearing potash seam. For that reason, the cells at the left boundary contained 1% halite, while the porosity was 99%, filled with a NaCl solution that was saturated with respect to halite. A Dirichlet boundary condition was used to keep the solution composition. Transport and interchange with adjacent cells were enabled, but precipitation was not permitted in these cells. Instead, it was assumed that all minerals were immediately transported out of these cells by the fluid flow present in the fault zone. This corresponded to a high exchange rate within the fault zone and, therefore, represented one of the most critical cases in nature with regard to its hazard potential [6]. All the other model boundaries were considered to be impermeable. A pre-defined pressure gradient was not applied.
The species diffusion coefficients in brines depend on the composition of the solution [24]. However, since leaching zones generally represent advection-dominated systems, all diffusion coefficients were assumed to be equal and constant in the present study for reasons of simplicity. Based on the investigations of Yuan-Hui and Gregory [25], an average value of Df = 1.5∙10−9 m2/s was used for all four transported species. Fluid compressibility was set to cf = 4.6∙10−10 1/Pa and the simulation was undertaken at isothermal conditions at a temperature of 25 °C. Dissolution rates of carnallitite were not available; however, it is known that they vary depending on rock and solution compositions [26,27,28]. For this reason, a sensitivity analysis for dissolution rates of r = 10−3 cm/s to 10−6 cm/s was performed. Furthermore, the carnallite content of the potash seam was varied between 5 wt.% and 25 wt.%, corresponding to 7 vol.% to 31 vol.% (Figure 6), to investigate the resulting flow velocities due to strongly changing porosities in the leaching zone. The sylvite content was always set to 3 wt.%, while the rest of the potash seam consisted of halite with a corresponding content between 72 wt.% and 92 wt.%.
3. Results
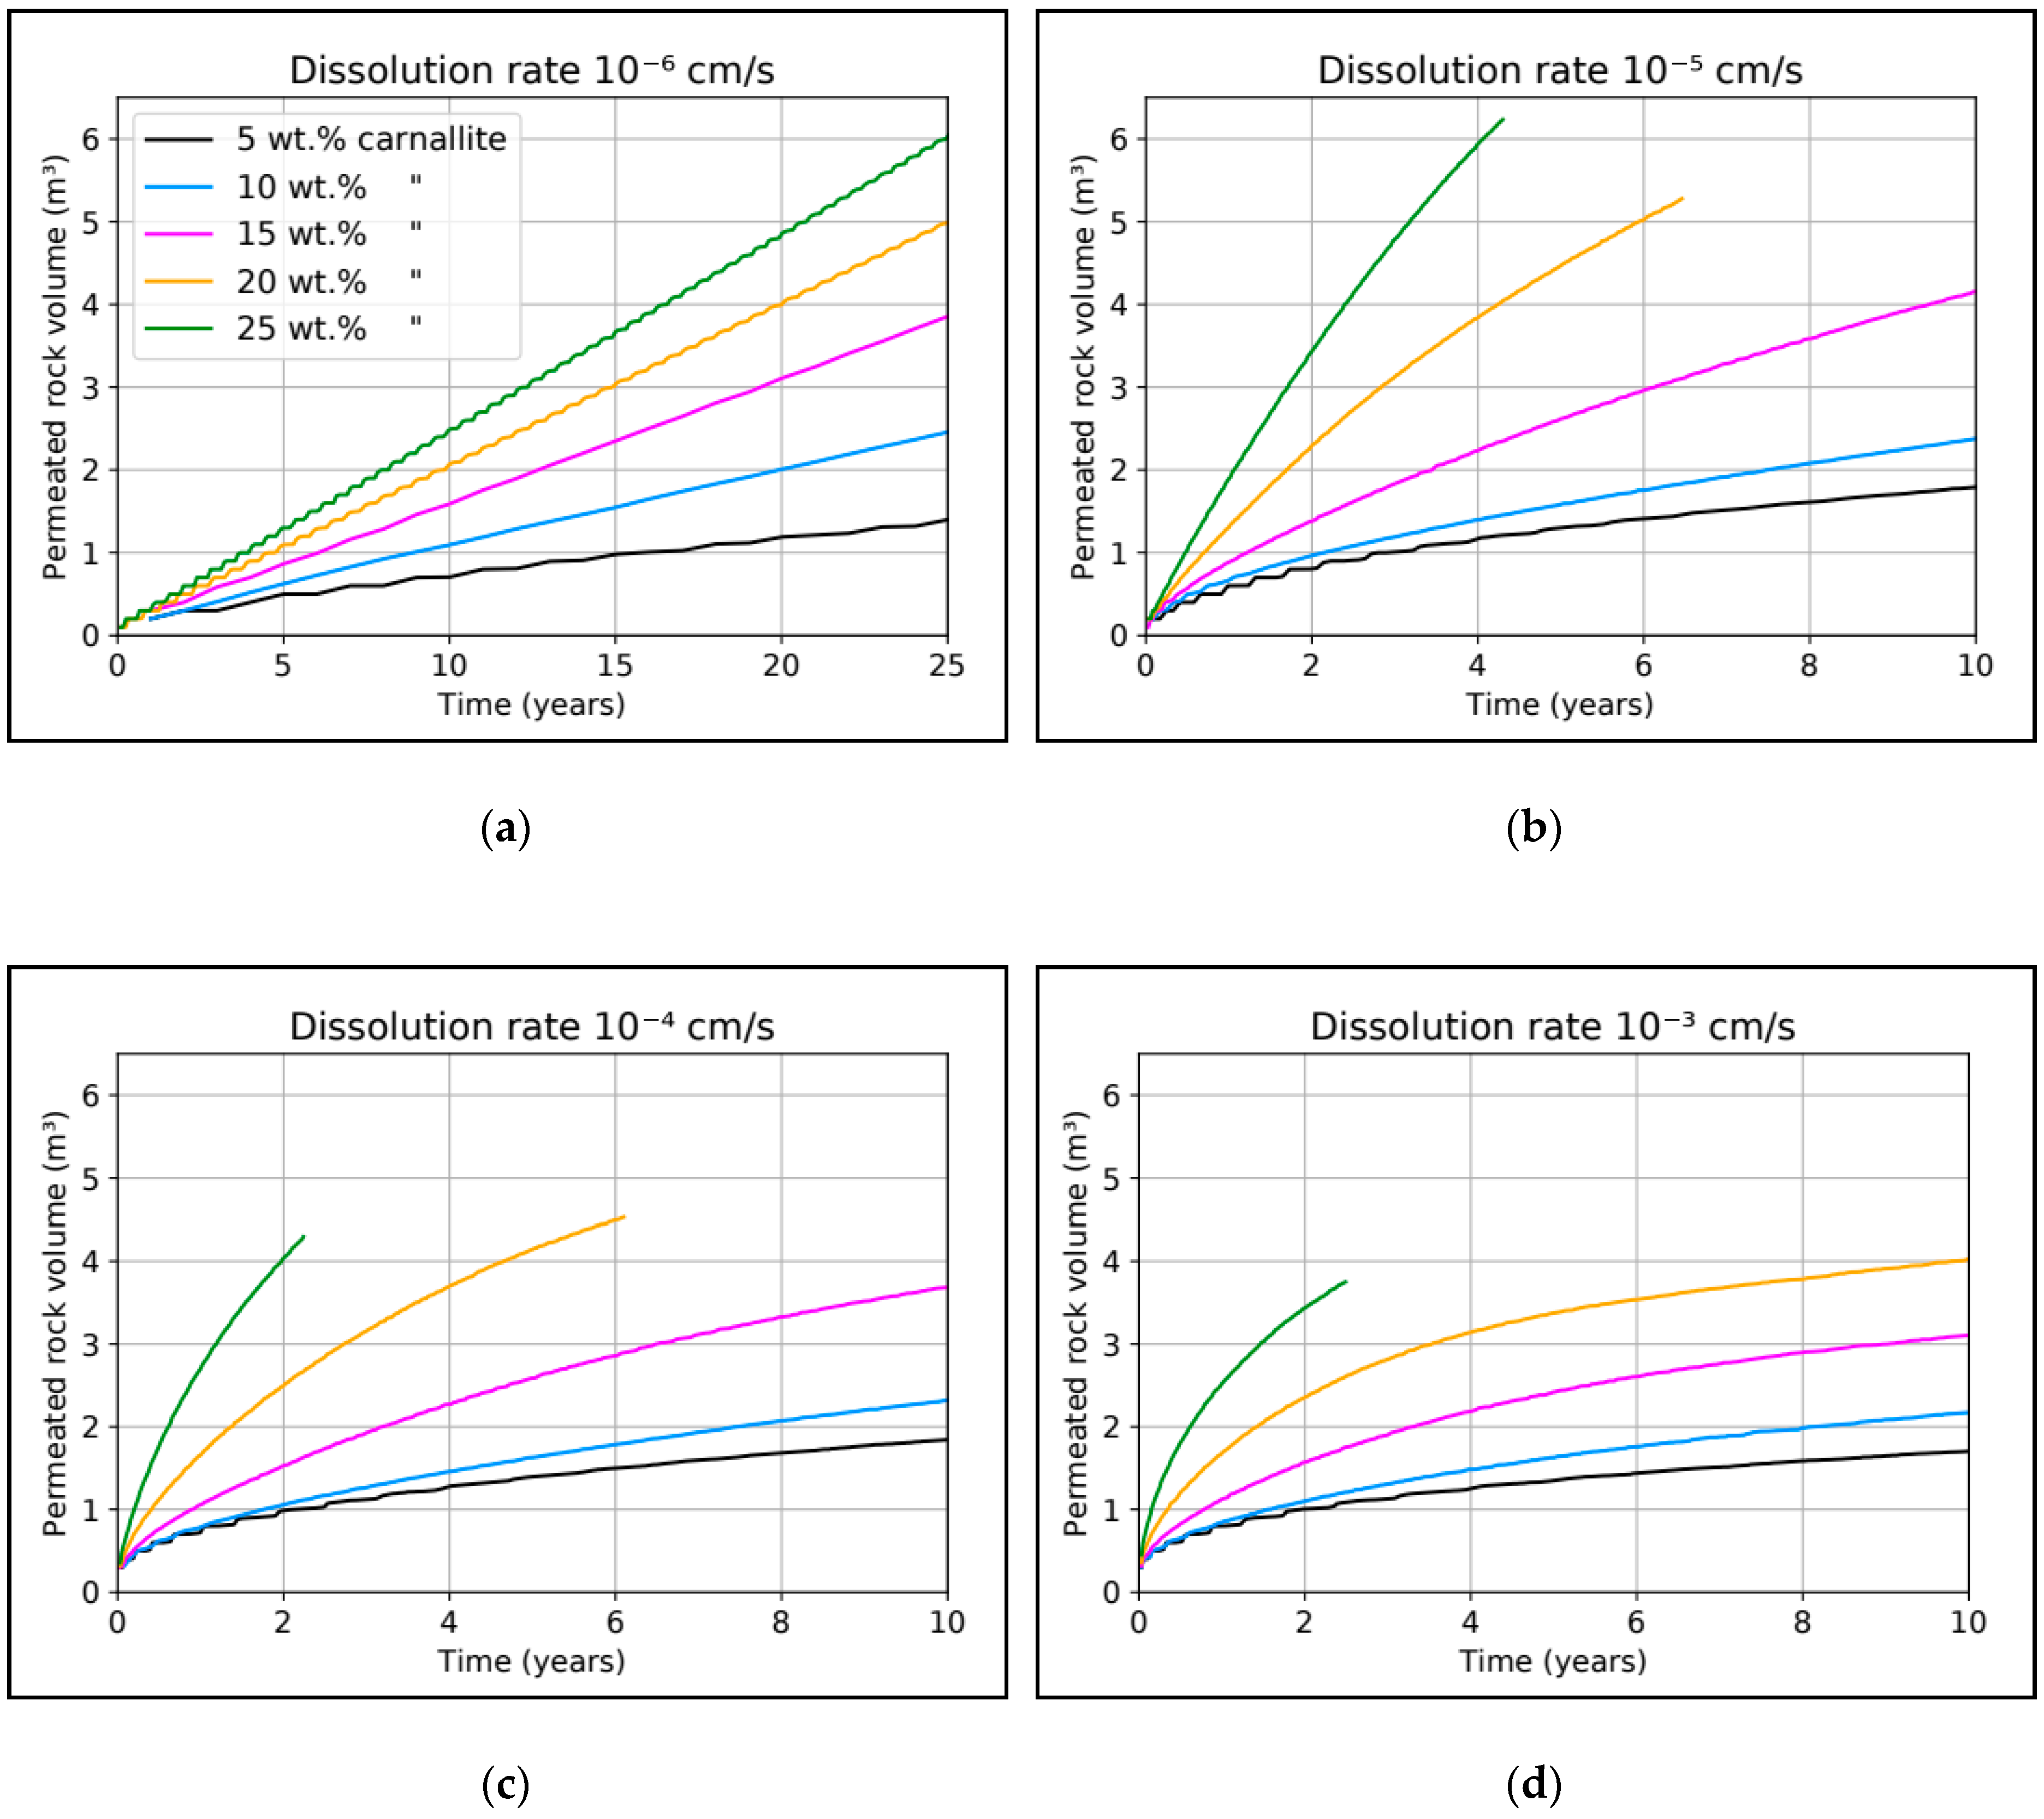
Shapes and growth rates of leaching zones differed significantly depending on carnallite content and dissolution rates. The evolution over time on the basis of the permeated rock volume is presented in Figure 7. Simulations were terminated when the leaching zone had (nearly) reached the right model boundary or the permeated rock volume did no longer change considerably. The results show that for the same dissolution rate, the leaching zone growth was faster with increasing carnallite content: the permeated rock volume for a 25 wt.% carnallite content was always three to six times larger than that for a 5 wt.% carnallite content. Furthermore, it was noticeable that the leaching zone growth was almost linear and comparably slow for a dissolution rate of 10−6 cm/s (Figure 7a). After 10 years, only 0.8–2.5 m3 of salt rock (depending on the carnallite content) were permeated, while the affected volume was 1.8 m3 to >6 m3 for higher dissolution rates. If the dissolution rate was above 10−6 cm/s, the curves were quite similar for identical carnallite contents, especially if these were below 15 wt.% (Figure 7b–d). In contrast to the permeated rock volume evolution for a dissolution rate of 10−6 cm/s, the curves flattened over time for higher dissolution rates, i.e., the growth rate of the leaching zone stagnated. This development could be particularly observed for high carnallite contents and becomes more pronounced with increasing dissolution rates. For example, in case of 25 wt.% carnallite and a dissolution rate of 10−3 cm/s (Figure 7d), the permeated rock volume within the first year was still as high or higher than for a dissolution rate of 10−4–10−5 cm/s (Figure 7b,c). However, after 2–2.5 years the permeated rock volume was smaller than for the lower rates due to the more pronounced flattening of the curve. Assuming a constant further development, the permeated rock volume would even be smaller than that for a dissolution rate of 10−6 cm/s and a carnallite content of 25 wt.% after 20–25 years (Figure 7a).
In general, two different shapes of the leaching zone could be observed in the present simulations. The first exhibited a vertical, planar dissolution front, where the leaching zone expanded uniformly across the entire potash seam thickness. The second one shows a funnel-type shape, where only the upper half of the potash seam was being permeated. A slow leaching zone growth was usually associated with a planar dissolution front, while a fast growing leaching zone often penetrated the potash seam preferentially close to the hanging wall. The Péclet (Pe) and Damköhler (Da) numbers (Equations (5)–(7)) were determined to improve the process understanding and to establish criteria that facilitate a leaching zone classification. These numbers provide information about the ratio between advection and diffusion rate and between transport velocity and dissolution rate, respectively.
The flow velocity v corresponds to the advection rate and is spatially and temporally variable. Df is the diffusion coefficient and l is the characteristic length over which diffusion occurs in the model. The characteristic length was best described by using the current width of the leaching zone, since the NaCl solution at the left model boundary and the highly saturated potash brine at the dissolution front introduced a concentration gradient which was mainly horizontal. The Damköhler number, which describes the ratio of the dissolution rate to the transport velocity, depends on the Péclet number. In an advection-dominated system with Pe > 2, the transport velocity corresponds to the advection velocity v, whereas in a diffusion-dominated system with Pe < 2 it corresponds to the diffusion rate . Therefore, Pe and Da were calculated individually for each cell based on the local flow velocity v and individual horizontal characteristic length l. Then, the median for all permeated cells was determined in order to derive an indicator for the entire system in addition to the median for the cells along the dissolution front.
The Péclet and Damköhler numbers allowed for a systematic classification of the different scenarios shown in Table 2. A Péclet number Pe < 2 indicated that the system was diffusion-dominated during the entire simulation period, while Pe > 2 indicated a permanently advection-dominated system. The term Pe sinking <2 meant that the system was advection-dominated in the beginning, but became diffusion-dominated over time. If the dominating transport process changed more than once, the system was called Pe alternating. In case of the Damköhler number, Da < 1 indicated that the system is permanently reaction-dominated, while Da > 1 represented a permanently transport-dominated system. Da rising >1 meant that the system was reaction-dominated in the beginning, but became transport-dominated over time. The results showed that most systems were dominated by transport either right from the beginning or at least in the long run. Only for a dissolution rate of 10−6 cm/s and more than 15 wt.% carnallite content, the system was permanently reaction-dominated. Regarding transport, diffusion permanently dominated if the carnallite content was 5 wt.%. Otherwise, the system was usually advection-dominated in the beginning, while in the long run diffusion dominated. Only for a dissolution rate of 10−6 cm/s and a carnallite content of more than 10 wt.%, the system was permanently dominated by advection. For a dissolution rate of 10−6 cm/s and 10 wt.% carnallite, both transport processes alternated.
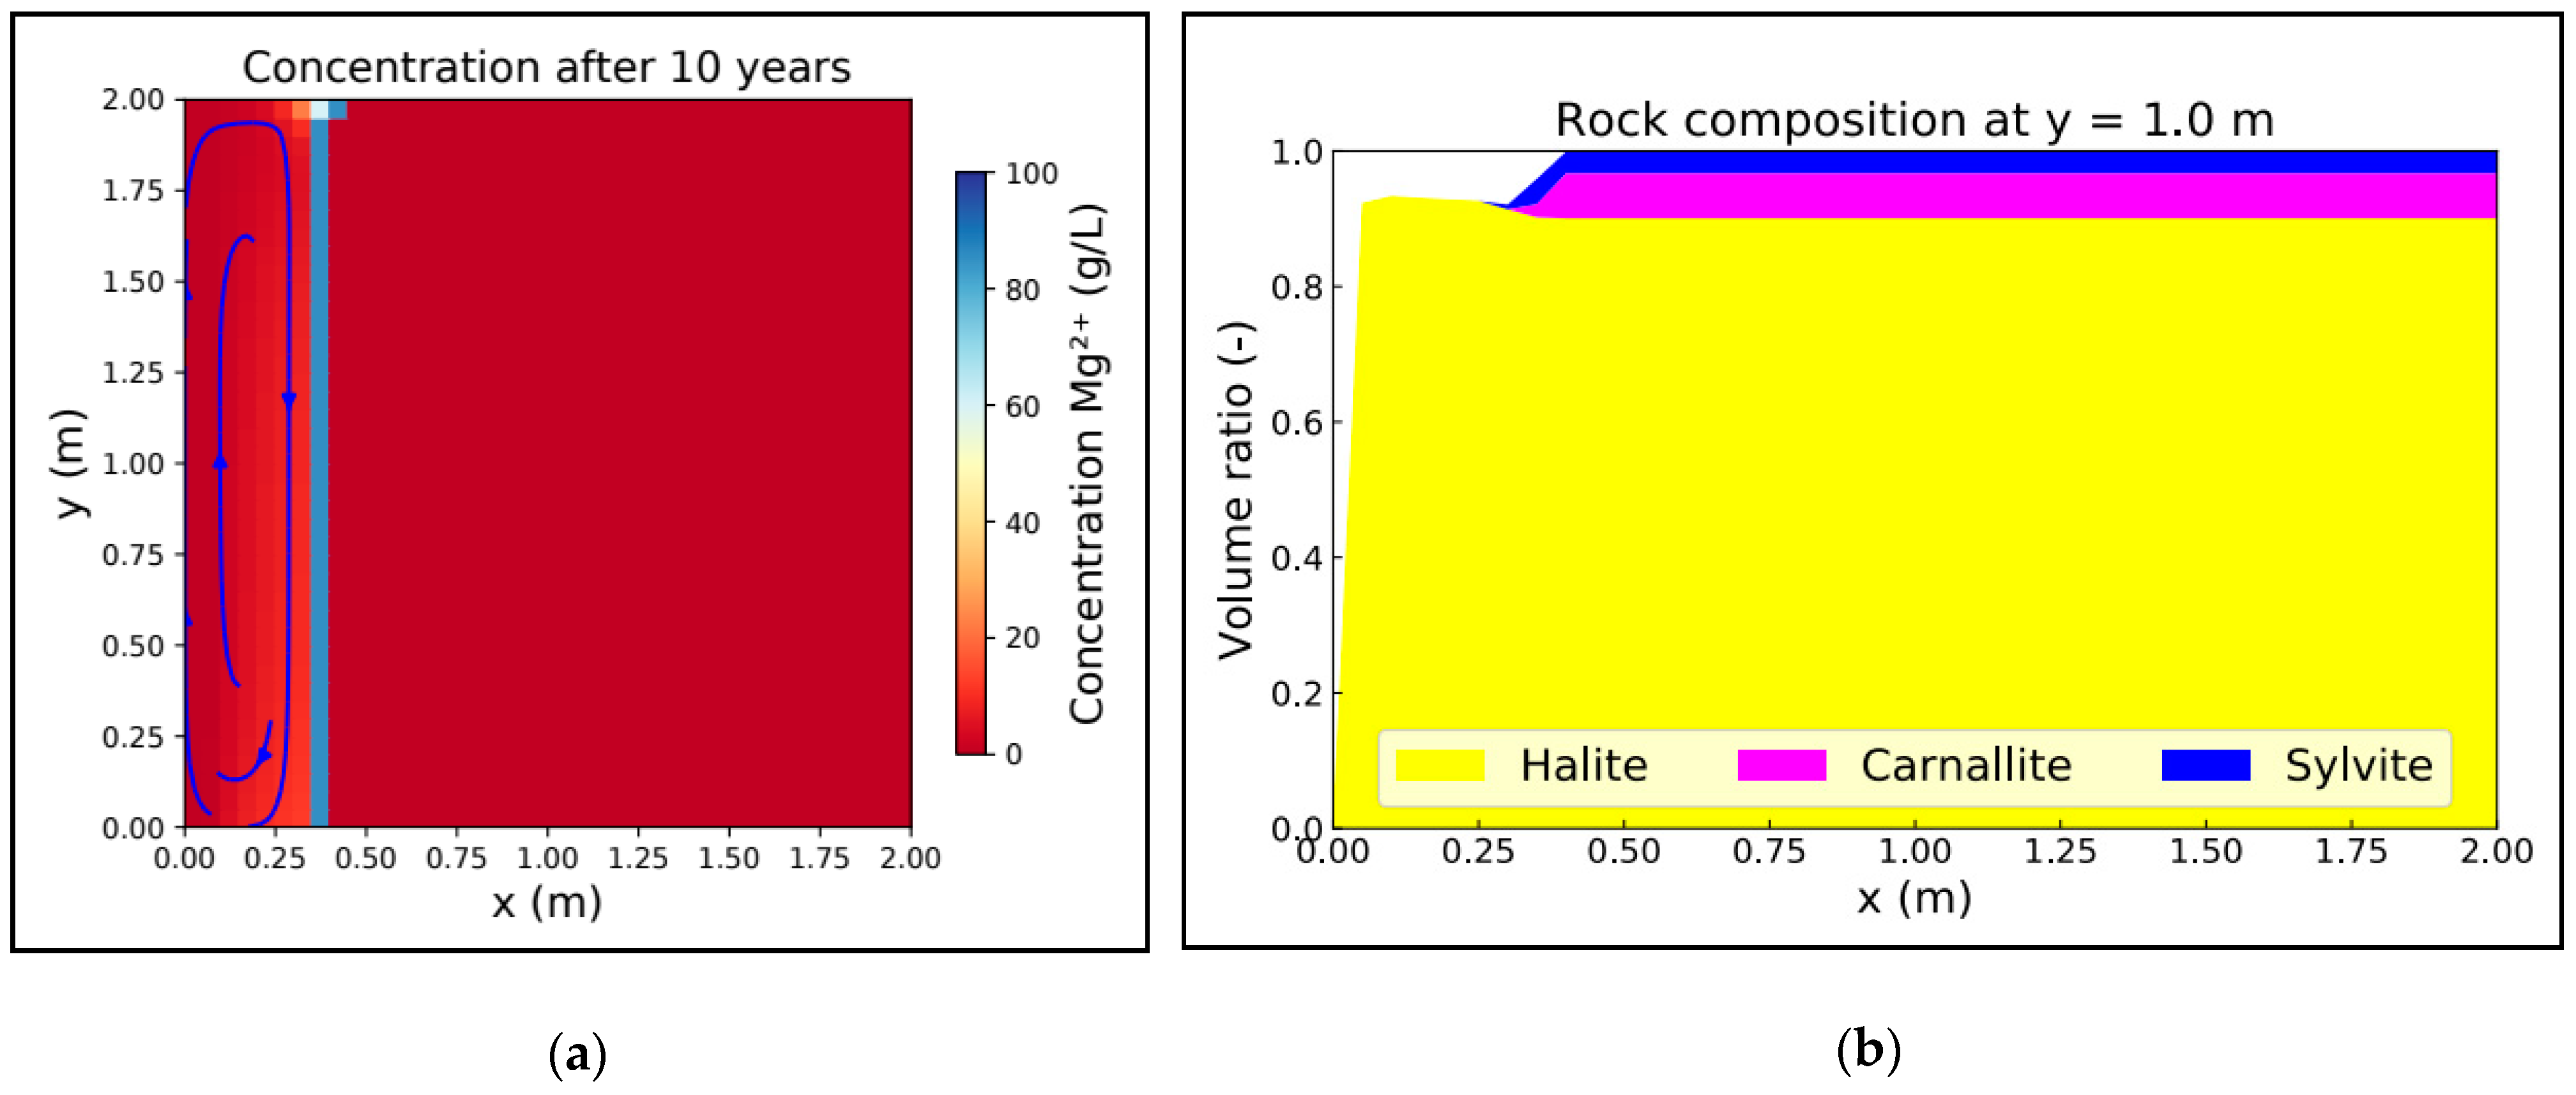
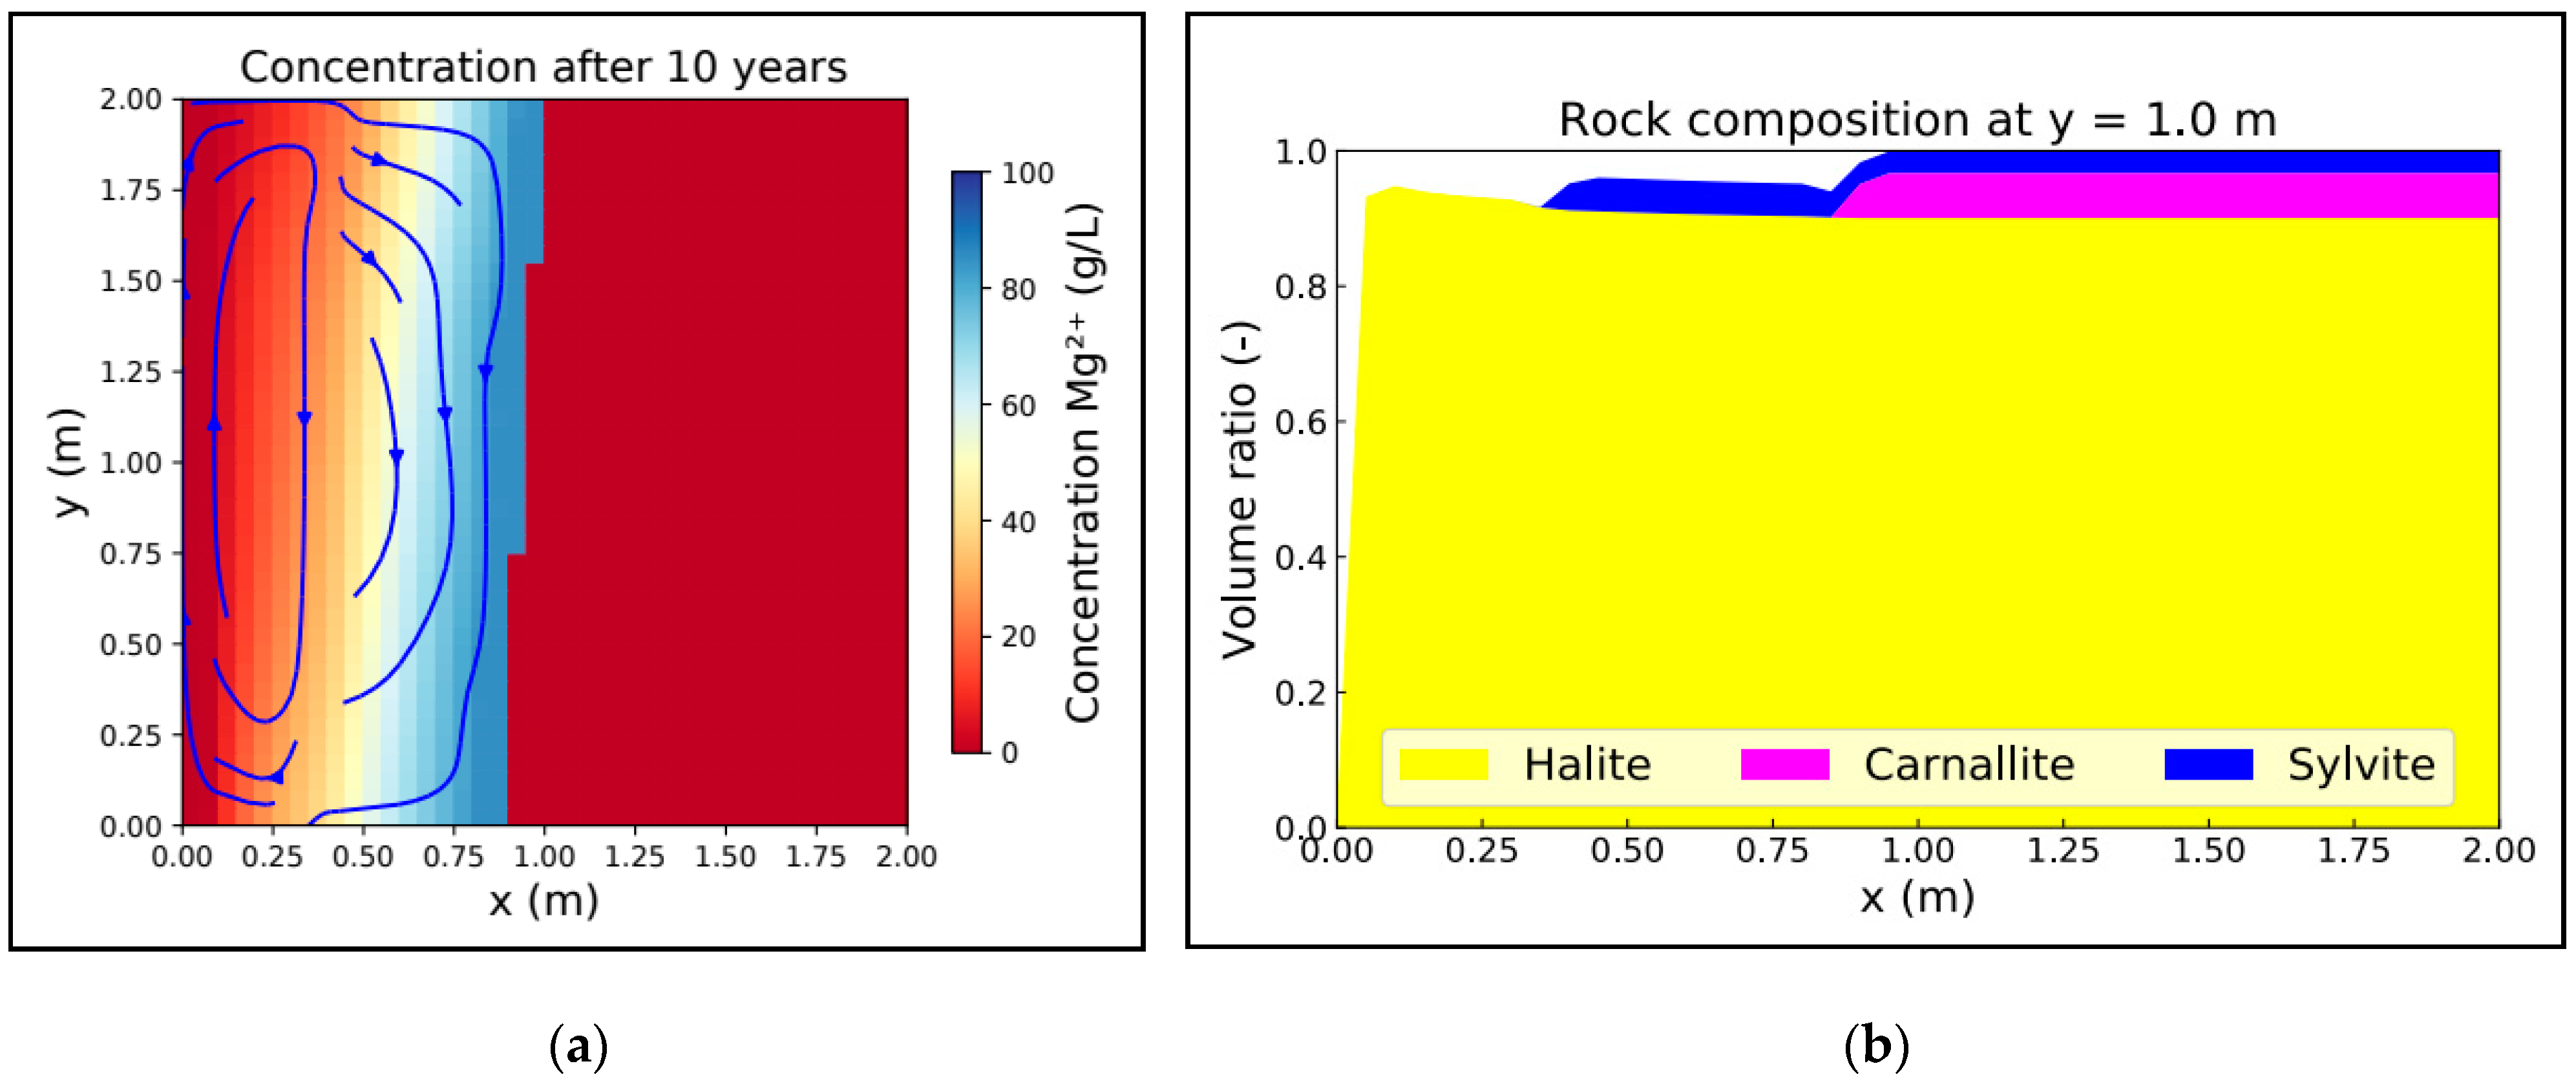
The classification based on Pe and Da (Table 2) correlated with different shapes and mineralogies of the leaching zone. Figure 8 and Figure 9 show the Mg2+ concentration distribution and mineralogy for two reaction-dominated systems where Pe was permanently below and above two, respectively. The Mg2+ concentration represents the fluid density and the saturation of the solution with respect to the potash salts carnallite and sylvite. While the NaCl solution at the left boundary, which did not contain any Mg2+, was maximally undersaturated with respect to sylvite and carnallite and showed a density of 1201 kg/m3, saturation and density increased with increasing Mg2+ concentration. First, the solution was saturated with respect to sylvite, and from about 85 g/L Mg2+ (at 25 °C) on also with respect to carnallite. Thereafter, the solution was in equilibrium with the carnallite-bearing potash seam and showed a density of 1273 kg/m3. Figure 8 and Figure 9 show that in a reaction-dominated system this kind of solution (blue) was only present within the partly permeated cells at the dissolution front where transport was not considered. Within the fully permeated leaching zone, saturation and fluid density were very low with a maximum concentration of 25 g/L Mg2+. In the diffusion-dominated system (Figure 8a), the concentrations were generally slightly lower compared to the advection-dominated system (Figure 9a), and the growth of the leaching zone was considerably slower (Figure 7a). Moreover, the concentration gradient within the fully permeated area of the diffusion-dominated system was exclusively horizontal, whereas it was predominantly vertical in the advection-dominated system. The latter resulted in a stronger concentration gradient between fully and partly permeated cells at the dissolution front within the upper half of the potash seam (Figure 9a). The flow field shows that the solution moved from the inflow region towards the dissolution front close to the hanging wall, from where it flowed down and returned to the inflow region close to the footwall (Figure 9a). The observed flow pattern corresponds to a typical convective flow system. Flow velocities close to the dissolution front were 1∙10−7 m/s to 2.4∙10−7 m/s (in the diffusion dominated system 1∙10−9 m/s to 2∙10−9 m/s). Saturation with respect to sylvite was not reached at any point, resulting in the absence of a sylvinitic zone (Figure 8b and Figure 9b). Instead, only halite was found with a volume fraction slightly higher than that in the initially dry rock, suggesting that the mineral precipitated evenly throughout the entire leaching zone. Therefore, a system that was reaction-dominated from the beginning always showed a vertical and planar dissolution front, whereby the permeated rock consisted entirely of halite.
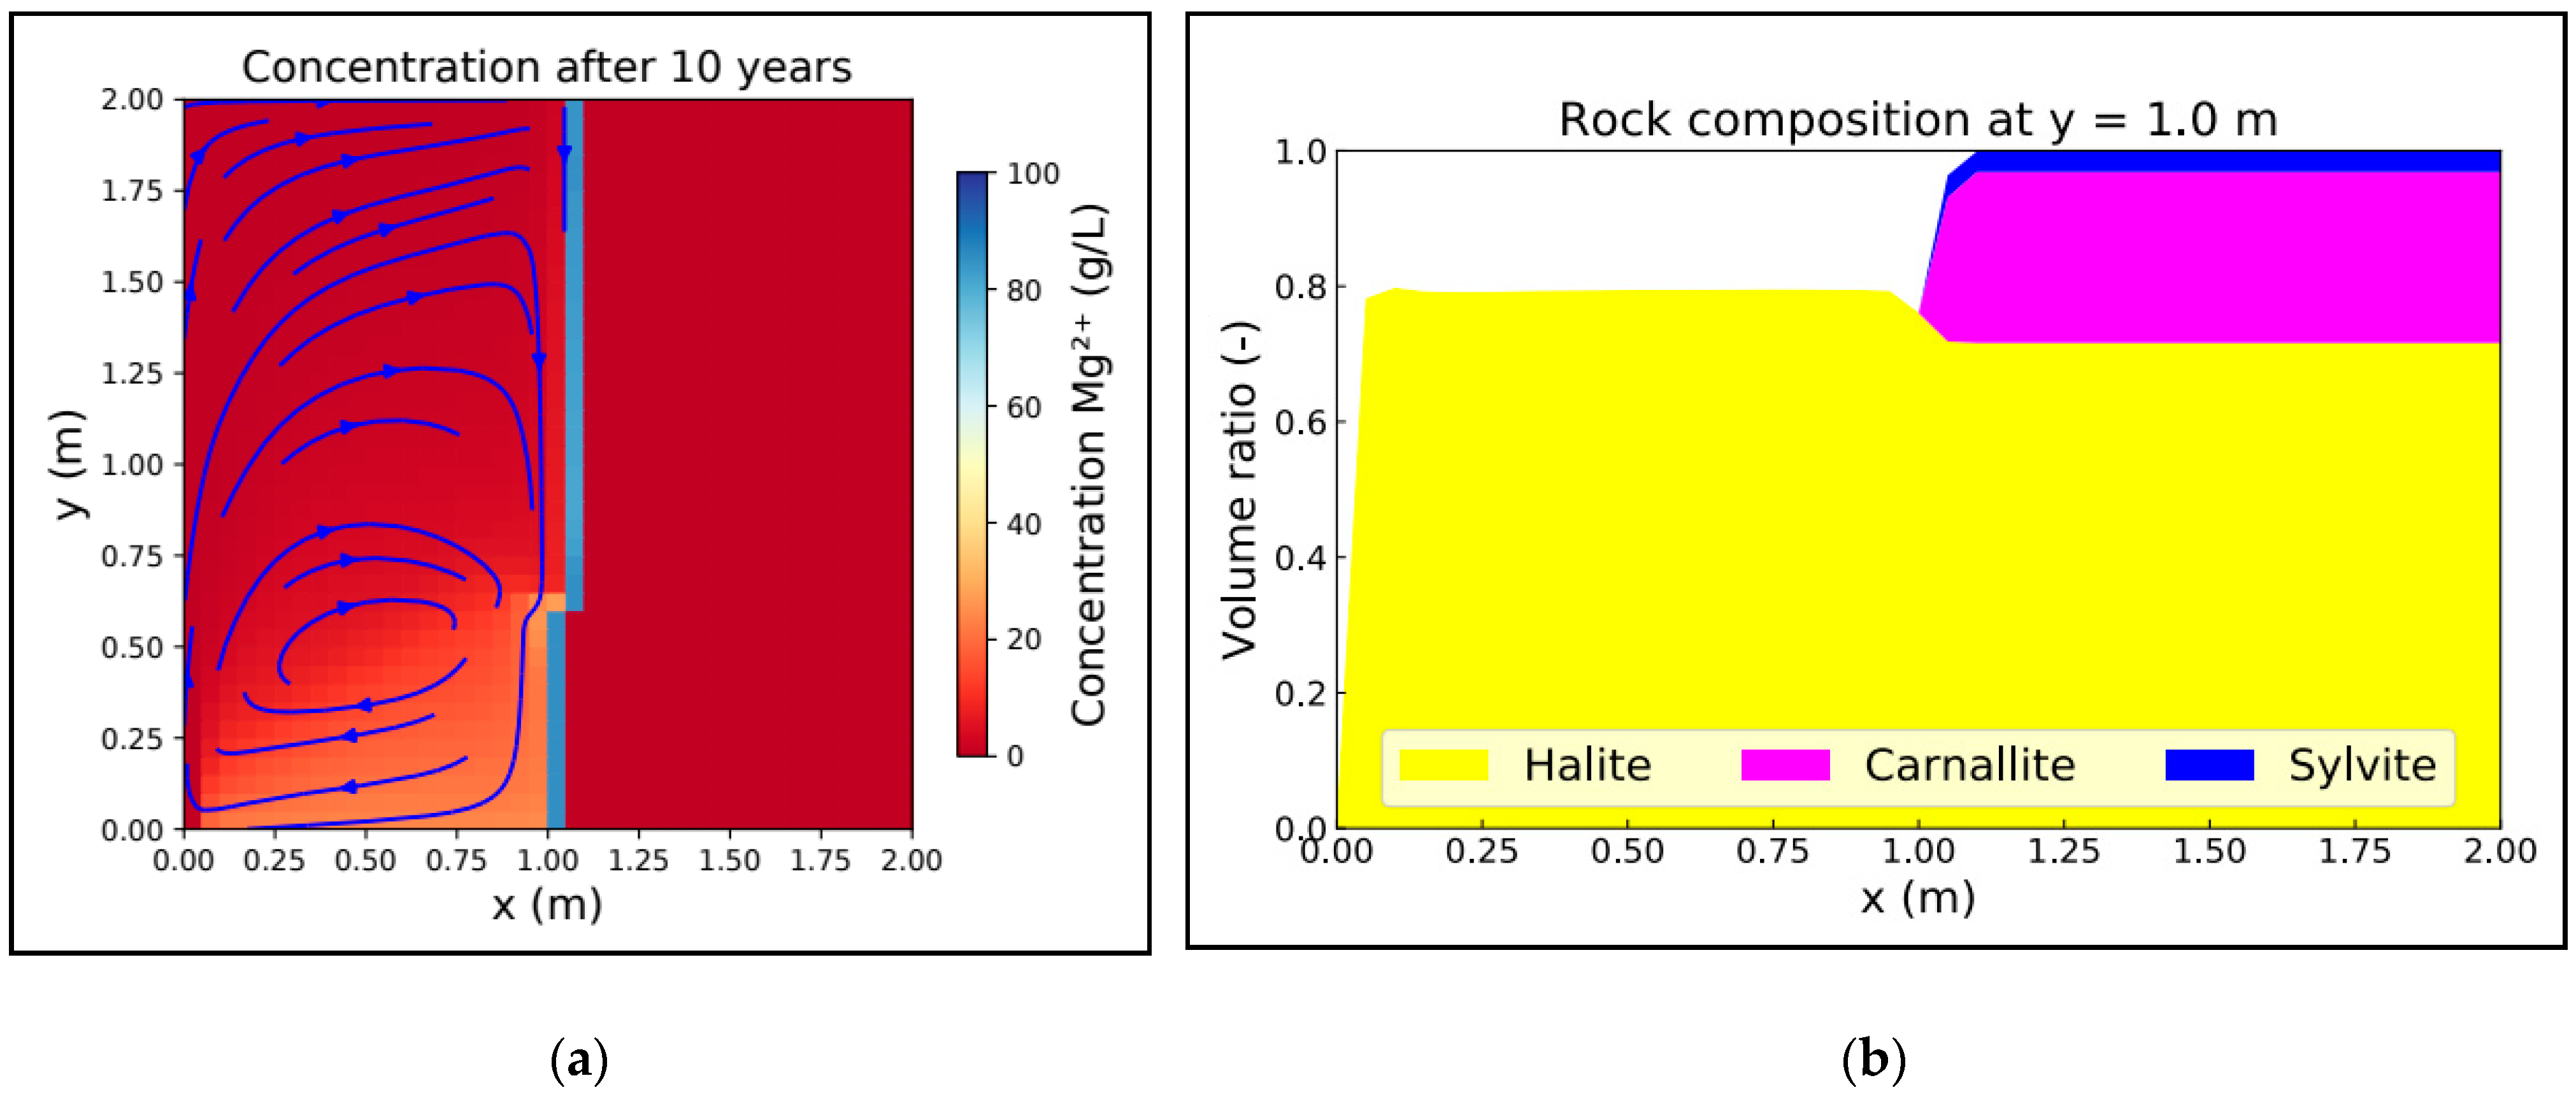
In contrast to reaction-dominated systems, transport-dominated systems showed very different leaching zone shapes, depending on whether advection or diffusion governed the transport. Figure 10 and Figure 11 show the Mg2+ concentration distribution and the mineralogy for both cases. It is noticeable that high Mg2+ concentrations (>60 g/L) not only occurred within the partly permeated cells at the dissolution front but within the entire right and lower half of the leaching zone, respectively. In the case of the diffusion-dominated system (Figure 10a), the concentration gradient was still horizontal as shown in Figure 8a, but the concentrations within the leaching zone covered the entire range from 0–85 g/L, and its growth was faster than in the reaction-dominated case. With a maximum of 1∙10−9 m/s, flow velocities were very low. The dissolution front was still almost planar. However, a sylvinitic zone was now established in front of it, covering more than half of the leaching zone (Figure 10b). The sylvite content within this area was higher than in the initially dry rock. Between the sylvinitic zone and the inflow region, the rock matrix consisted exclusively of halite. It should be noted that the halite content slowly increased towards the inflow region, i.e., the porosity decreased there.
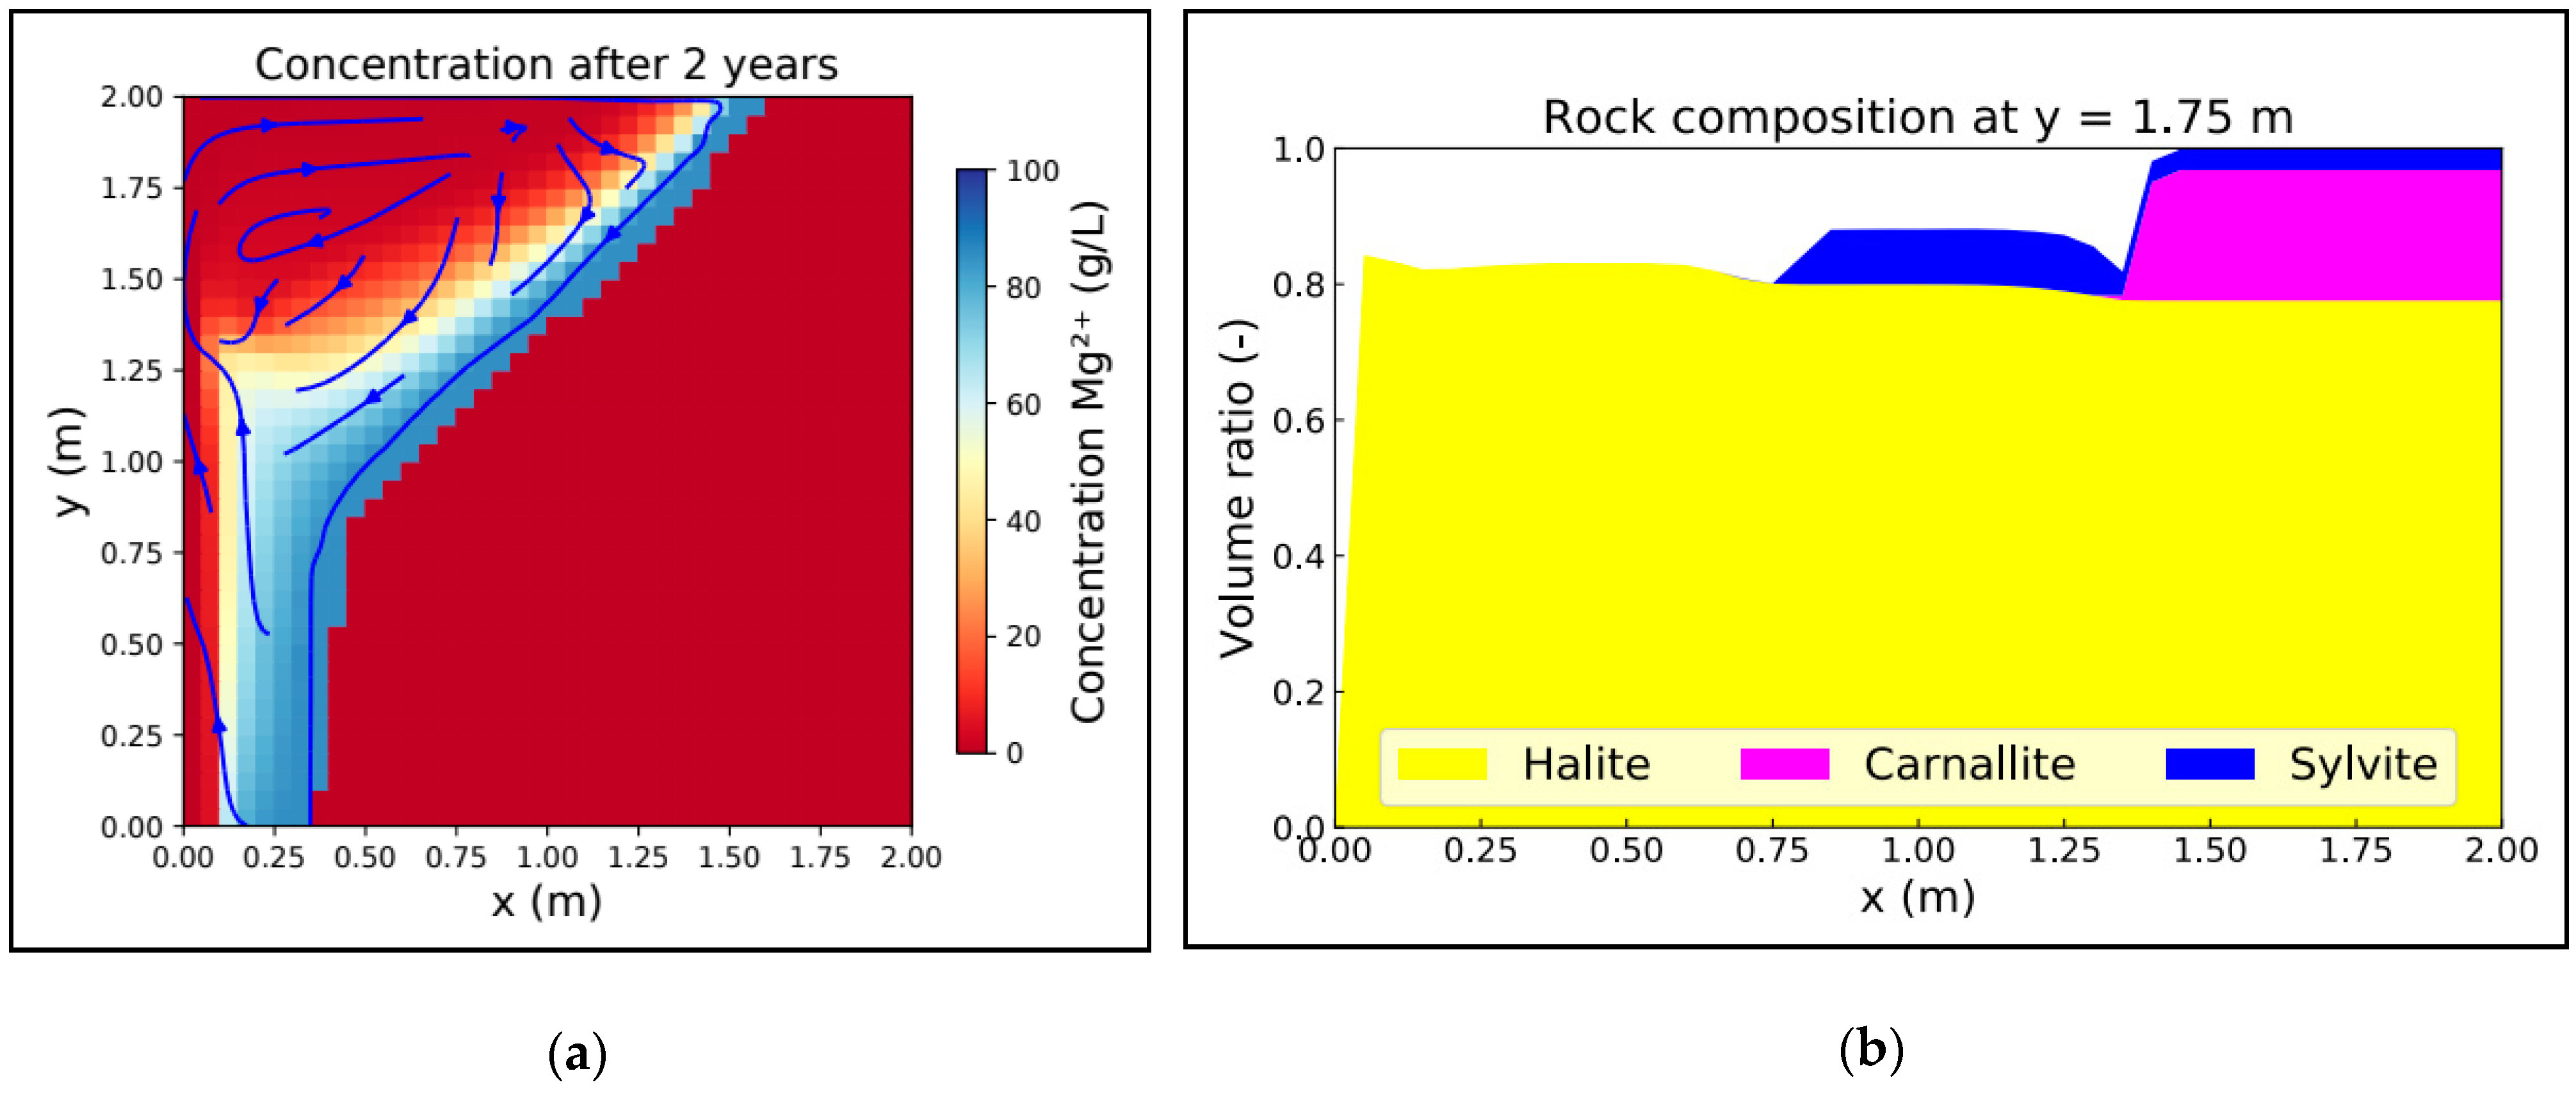
In an advection-dominated system (Figure 11), a concentration gradient in horizontal and vertical directions occurred, resulting in a highly undersaturated solution only in the upper left region of the potash seam. The shape of the leaching zone corresponded to a funnel that ends approximately halfway up the seam. While the dissolution front hardly moved forward at all and remained planar in the lower half of the seam, the width of the leaching zone increased evenly in the upper half and reached its maximum at the hanging wall (Figure 11a). A zone with significantly increased sylvite and slightly increased halite contents compared to the initial salt rock existed left to the dissolution front (Figure 11b). Figure 12 shows that their widths varied with height, whereby the sylvinitic zone corresponds to the yellow area with a porosity of approximately 15%. According to this, the zone reached its maximum width at a height of about 1.5 m, corresponding to the midway of the funnel. Below 1.5 m, its width decreased due to the funnel shape, while the leaching zone became wider above with the sylvinitic zone getting narrower, as a halite zone (20–25% porosity) of increasing thickness formed between it and the inflow region. Particularly at lower dissolution rates, its width increased much more towards the hanging wall than the width of the funnel did (Figure 12b). It was also noticeable, with increasing dissolution rates, that the funnel shape penetrated deeper into the potash seam and at the same time ended at a slightly higher location (Figure 12a). Thus, shape and mineralogy of the leaching zone varied slightly, depending on the dissolution rate and carnallite content. In principle, however, transport- and advection-dominated systems always resulted in a funnel shape where the dissolution processes were limited to the upper half of the potash seam.
The flow within transport- and advection-dominated systems was mainly limited to the upper part of the potash seam, where dissolution processes took place (Figure 11a and Figure 12). Again, a convective flow could be observed close to the hanging wall, where undersaturated solution flowed from the inflow region towards the dissolution front, down and then back towards the inflow region within the lower part of the funnel. The flow velocities varied depending on the carnallite content of the original rock: the higher its carnallite content, the higher the porosity and permeability of the later leaching zone, and thus the flow velocity of the solution. In case of 15 wt.% carnallite content, flow velocity was between 10−7 m/s and 10−8 m/s within the upper part of the potash seam, while it was around 10−7 m/s for 20 wt.% and even 10−6 m/s for 25 wt.% carnallite content. This resulted in a significantly faster growth of the leaching zone (Figure 7). Compared to a reaction- and advection-dominated system (Figure 9), the flow velocities were similar for a given porosity, but the leaching zone growth was much faster.
The porosity distributions in Figure 12 also show that precipitation occurred immediately next to the inflow region, reducing the porosity to almost zero, especially within the lower half of the potash seam. Accordingly, the solution exchange between the inflow region and the leaching zone was significantly restricted. The precipitations consisted entirely of halite, which was repeatedly supersaturated within this area. In the long run, the inflow of undersaturated solution and the outflow of saturated potash brine was thus only possible via the upper 0.5–1 m of the inflow region, since a flow barrier was formed by mineral precipitation. This phenomenon was also present in transport- and diffusion-dominated systems, but the precipitations were almost evenly distributed along the entire height and less pronounced with the porosity next to the inflow region being only slightly reduced (Figure 10b). Barrier formation was not observed in reaction-dominated systems (Figure 8b and Figure 9b).
Most of the calculated scenarios represent hybrid forms of the four cases described above (Table 2). For example, no system was permanently reaction- and diffusion-dominated. Scenarios with a dissolution rate of 10−6 cm/s and a carnallite content of 5–10 wt.% fell into that category for the first 10–15 years; after that, Da rose above one and the system became transport-dominated. As a result, the dissolution front remained almost planar, but the solution became more saturated with respect to sylvite and carnallite creating a sylvinitic zone (Figure 10b) and a barrier immediately next to the inflow region. The latter was limited to the lower half of the potash seam and its porosity decreased continuously towards the footwall. Whether the growth of the leaching zone would be affected by this in the long run was not clear since simulation times of 100 years showed only a slight inclination of the boundary between halitic and sylvinitic zone. In the scenario with 10 wt.% carnallite, Pe additionally alternated around two, i.e., advection gained influence, which was associated with a stronger barrier formation within the lower potash seam area as well as with a significant inclination of the dissolution front and the mineralogical boundary between halitic and sylvinitic zone (Figure 13b). At a medium porosity (15 wt.% carnallite), the system was already permanently advection-dominated; however, Da would only exceed 1 after about 10 years and would remain between 1 and 2 in the long run (permanently below 1 at the dissolution front). As a result, an (inclined) sylvinitic zone and a slightly inclined dissolution front were only formed within the lower part of the potash seam as shown in Figure 13b. For a dissolution rate of 10−6 cm/s and 20–25 wt.% carnallite, the system was permanently reaction- and advection-dominated as shown in Figure 9. Scenarios with a dissolution rate of 10−6 cm/s were thus always reaction-dominated at the beginning. Over time, Da increased, but a transport-dominated system only developed at low to medium porosities. Since diffusion was typically stronger than advection in these cases, the dissolution front tended to remain planar. Cases with an inclined dissolution front, as shown in Figure 13c, were the exception at very low dissolution rates.
Scenarios with a dissolution rate above 10−6 cm/s were usually dominated by transport, independent of maximum porosity (Table 2). Only in case of a dissolution rate of 10−5 cm/s and 15–25 wt.% carnallite (high porosity), a planar dissolution front was present at the beginning without or only a partially existing sylvinitic zone (Figure 14a), which was characteristic for a reaction-dominated system (Figure 8 and Figure 9). However, Da exceeded the threshold value of one after a short period of time in all these scenarios. Since high porosities were present, the systems were all advection-dominated at the beginning. Accordingly, the dissolution front quickly became inclined and a funnel shape was formed, which, however, did not end at half the thickness of the potash seam but extended down to the footwall (Figure 14b,c). In addition, the inclination was not uniform as in systems that were dominated by advection and transport right from the beginning (Figure 11a and Figure 12) and the sylvinitic zone did not extend to the hanging wall. On the other hand, the typical barrier formation within the lower potash seam area next to the inflow region could be observed here as well. The height of the barrier increased with simulation time (Figure 14), inhibiting the exchange of solutions between leaching zone and inflow region. Especially at the dissolution front, Pe and flow velocities decreased significantly within the lower potash seam area.
All other scenarios with dissolution rates above 10−6 cm/s were permanently transport-dominated. Diffusion dominated the transport if porosity was low (5 wt.% carnallite) (Table 2), resulting in a leaching zone geometry as presented in Figure 10. In this case, the growth rate hardly differed for varying dissolution rates (Figure 7b–d). If the porosity was slightly higher (10 wt.% carnallite), advection dominated at the beginning and the leaching zone developed a funnel shape, which was about two to three times wider at the hanging wall than at the footwall. The higher the dissolution rate, the more pronounced the funnel shape became; however, the barrier next to the inflow region also extended further upwards. After a few years, Pe regressed below two, and in case of high dissolution rates the dissolution front received a curved funnel shape similar to that in Figure 14c. In case of lower dissolution rates (10−5 cm/s), the dissolution front was steeper and more similar to that in Figure 13c. The sylvinitic zone was present throughout the entire seam thickness and covered the whole leaching zone behind the barrier, while it made up about 40% of its width at the hanging wall. The higher the barrier extended into the potash seam, the more the leaching zone growth rate was reduced. Finally, diffusion replaced advection as the main transport mechanism. If porosities were medium to high (>10 wt.% carnallite) and the dissolution rate was above 10−5 cm/s, the system was always transport-dominated with diffusion exceeding advection in the long run. During the first months or years, high Pe numbers facilitated the formation of a funnel shape according to Figure 11a and Figure 12, which ended at a height of 0.5–1 m. However, this was also associated with the formation of a flow barrier. Especially if the dissolution rate was 10−3 cm/s, the exchange of solutions was quickly inhibited up to a height of more than 1 m and Pe regressed below 2 at the dissolution front, while it remained above 2 for several years in the overall system. As a result, the dissolution front developed in a curved funnel shape (Figure 15) and the growth rate decreased while the lower part of the potash seam remained unaffected. The higher the porosity, the faster and deeper the leaching zone could penetrate into the potash seam before diffusion prevailed (Figure 15b). A sylvinitic zone was always present for this hybrid form and reached its maximum width slightly below the upper end of the barrier, which was constantly growing with time and may completely prevent the exchange of solutions in the long run.
4. Discussion
The simulation results show that a fundamental distinction must be made between reaction-dominated and transport-dominated systems as well as between diffusion-dominated and advection-dominated systems with regard to the formation of leaching zones within potash seams. Depending on which of the four potential combinations is given, differences in mineralogy as well as in spatial and temporal leaching zone growth will occur. A classification is feasible using the Péclet and Damköhler numbers. The scenario analyses have shown that Pe mainly depends on the amount of carnallite within the potash seam, which is completely dissolved once it comes into contact with undersaturated solution, and thus determines the resulting porosity of the leaching zone. In contrast, Da mainly depends on the dissolution rate of the initially dry rock (Table 2).
Assuming the inflow of a NaCl-saturated solution, the fluid in reaction-dominated systems (Da < 1) is neither saturated with respect to carnallite nor with respect to sylvite along the entire dissolution front (Figure 8a and Figure 9a). This state requires a very low dissolution rate in combination with a minimum porosity, so that the dissolution rate determines the growth rate of the leaching zone. Since the dissolution rate is constant in space and time, a planar dissolution front is formed moving slowly but steadily forward. This results in a matrix of leached halite, with a porosity determined by the volume fraction of the dissolved minerals carnallite and sylvite, reduced by a few percent due to halite precipitation. Since higher porosities correspond to a larger contact area between solution and dry rock, the growth is faster for higher carnallite contents despite identical dissolution rates (Figure 7a). The porosity within the leaching zone is homogeneous, whereby a sylvinitic zone does not exist due to the low saturation (Figure 8b and Figure 9b). Despite only small differences in concentration and fluid density, density-driven flow is established, inducing a mostly vertical concentration gradient in advection-dominated systems (Pe > 2). On the contrary, convection hardly has any influence and the concentration gradient is horizontal in diffusion-dominated systems (Pe < 2). In both cases, the low saturation of the solution with regard to potash salt is not sufficient to create halite precipitation next to the inflow region. Therefore, barrier formation is not observed and leaching zone growth is linear even for longer time periods (Figure 7a). However, it must be questioned whether the assumption of thermodynamic equilibrium in a reaction-dominated system is sufficiently accurate. On the other hand, scenario analyses and available field investigations [20,23] show that most systems are dominated by transport and that the assumption of thermodynamic equilibrium is generally reasonable in nature.
In transport-dominated systems (Da > 1), the ratio between advection and diffusion is much more decisive. If the system is diffusion-dominated (Pe < 2), the horizontal concentration gradient causes a uniform transport across the entire seam thickness, and thus a planar dissolution front (Figure 10a). Here, the saturations are much higher than in reaction-dominated systems, with sylvinite saturation reached after about 40% of the distance to the dissolution front, resulting in the formation of a wide sylvinitic zone (Figure 10b). Its porosity is always slightly lower than that of the halitic zone; however, the latter shows a decrease in porosity especially near the inflow region and the footwall. The halite precipitation occurring there can presumably be attributed to the influx of NaCl solution. Its contact with potash salt naturally leads to halite supersaturation [23], what can also be expected if it is mixed with potash brine. Due to the weak but nevertheless existing convection, the saturation with respect to potash salts is slightly higher within the lower potash seam area, and hence more precipitation occurs here (Figure 10a). Since diffusion-dominated systems require low porosities, even a few percent of additional halite can form a flow barrier. A reduction of the growth rate can be observed over time, but this is mainly due to the increasing distance between the inflow region and the dissolution front, which causes a decrease in the diffusion rate. In systems dominated by transport and diffusion, the diffusion coefficient plays an important role in the evolution of the leaching zone and the assumption of a uniform and constant value for all transported species is a strong simplification. However, most approaches to calculate diffusion coefficients depending on the brine composition are not validated for multicomponent systems with high salinities [29,30], especially if NaCl is not the main component [24]. Due to the very low porosities within these systems (Table 2) and the very slow leaching zone growth (Figure 7), the risk potential to mining operations is rather low and uncertainties in temporal scaling are acceptable.
For transport- and advection-dominated systems (Pe > 2), a significant flow barrier formation can be observed, which increasingly impedes the inflow of new NaCl solution, and thus slows down the growth of the leaching zone (Figure 12 and Figure 15). This is on the one hand due to the full saturation of the solution with respect to potash salts at the dissolution front, and on the other hand due to a much stronger density-driven flow, which forces the saturated solution to flow towards the lower part of the potash seam and the inflow region, creating particularly strong concentration gradients next to it (Figure 11a). As a result of the flow barrier formation, the flow velocity decreases sharply and the transport becomes increasingly diffusion-dominated. Although the leaching zone growth rate for this case is by far the fastest in the beginning, it is conceivable that in the long run reaction-dominated systems will expand further, since barrier formation will not impede or even stop the growing process (Table 2, Figure 7). Another characteristic of transport- and advection-dominated systems is the funnel shape of the leaching zone, which also results from convective flow (Figure 11a and Figure 12). It causes the solution, which is undersaturated with respect to potash salts, to arrive first at the upper part of the dissolution front, leading to maximum dissolution effects in this area. On its flow towards the model bottom, the solution becomes more saturated until finally rock is not dissolved anymore. The higher the dissolution rate, the earlier this state is reached. Hence, the funnel shape is more concentrated in the upper part of the potash seam and the underlying part that remains unaffected is more pronounced at higher dissolution rates. Within the latter, only the first 25–50 cm next to the inflow region are permeated at the beginning, since convective flow needs to develop first. Later, this area is located behind the halite barrier and contains saturated potash brine and sylvinite. Even within the funnel, the solution is mostly sufficiently saturated to create a sylvinitic zone. However, near the hanging wall its width decreases due to the inflow of NaCl solution.
The simulation results reveal a high qualitative agreement with the field studies by Koch and Vogel [23], which deal with the formation of sylvinitic alteration zones within carnallite-bearing potash seams. As in the present models, the point of leaching zone initiation is a fault zone that enables the intrusion of saline solutions from the underlying bedrock. The observed sequence of leached halite, followed by a particularly sylvite-rich alteration zone and finally the unaffected potash seam can be reproduced and explained by using the presented models (Figure 10b and Figure 11b). The special case without the development of a sylvinitic zone is also mentioned by Koch and Vogel [23] and associated with large fluid inflow rates. No statements are made about the shape and the dimensions of this special type of leaching zone, so that a comparison with the simulation results achieved for reaction-dominated systems (Figure 8 and Figure 9) is not feasible. On the other hand, leaching zones with a sylvinitic zone are usually described by Koch and Vogel [23] as being several meters wide and showing a clear inclination of the mineralogical boundaries as well as a preferential leaching near the hanging wall, which corresponds very well with the present findings. Many field investigations do not show any leaching within the lower half of the potash seam, resulting in leaching zone shapes as shown in Figure 15. The occurrence of narrower leaching zones is explained by a low or relatively short solution inflow. The simulation results further suggest that growth comes to a standstill if a lack of solution supply occurs; however, the main cause for this is not a lack of ascending solution but the precipitation of halite which leads to flow barrier formation. Whether this also occurs in nature is not described by Koch and Vogel [23]. In the present simulations, high concentration gradients are responsible for halite precipitation, whereby especially an increase in Mg2+ concentration induces a strong reduction of the halite solubility. It is conceivable that the assumption of a constant solution composition at the model boundary causes or at least artificially intensifies this phenomenon. The assumption of constant, uniform diffusion coefficients may also falsify concentrations and saturation within this area. However, the observations of Koch and Vogel [23] basically support the simulation results regarding the mineralogy and shape of the leaching zones.
The simulated leaching zone shapes have been observed on the laboratory scale as well. For example, caverns with a nearly planar dissolution front were documented by Field et al. [31], whereby nearly saturated NaCl solution was pumped through rock salt samples in vertical direction. On the other hand, caverns with more funnel-like shapes as shown in Figure 11a and Figure 12 were observed when artificial seawater was used as leaching solution. The growth rate of the funnel-shaped caverns was significantly higher, although the pumping rate was the same. According to Field et al. [31], the higher growth rate and the decreasing cavern width along the flow path are mainly due to an increase in saturation and the resulting decrease in the dissolution rates. For almost saturated NaCl solutions, this effect is smaller with the cavern width hardly changing along the flow path. On the other hand, Gechter et al. [32] and Weisbrod et al. [33] observed funnel-shaped caverns as well when pumping water horizontally through rock salt samples and explained this shape by density-driven flow. Consequently, the different cavern shapes in Field et al. [31] could also result from different Pe or Da numbers. The caverns generated at laboratory-scale conditions are cavities with presumably turbulent flow conditions, with diffusion playing only a minor role in species transport. The high dissolution rates in case of seawater are consistent with transport-dominated systems, and thus with the funnel shape (Figure 12), which was observed by Gechter et al. [32] as well for highly undersaturated solutions. Conversely, highly saturated solutions reduce the dissolution rate according to Field et al. [31], what is consistent with a reaction-dominated system and the resulting planar dissolution front (Figure 8a and Figure 9a).
The results of the scenario analysis indicate that usually hybrid forms of the cases discussed above can be found in situ (Figure 13, Figure 14 and Figure 15). The classification highly depends on the flow velocity and, therefore, on the porosity-permeability relationship. Only a few relationships are available for salt rock with medium or high porosities [15,34,35]. However, these relationships were derived from crushed rock salt samples that were compacted by mechanical loading. In the medium to long run, deformations in rock salt reduce the effective pore space [36] but the main porosity changes in leaching zones result from dissolution and precipitation processes. Several approaches are available to describe the effect of chemical reactions on permeability [37], but future investigations for leached potash salt are necessary to reduce the model uncertainty. The same accounts for the dissolution rate of varying potash salt compositions. Taking the different solubilities and saturation indices of minerals into account may result in a more selective dissolution process and different leaching zone shapes. However, laboratory data allowing for more precise calculations are so far only partially available.
The scenario analysis and the comparison with Koch and Vogel [23] indicate that most leaching zones in nature represent transport-dominated systems which are advection-dominated in the beginning and diffusion-dominated in the long run. The reactive transport model can be used for a qualitative description of their shape as well as for a quantitative description of their mineralogy. The good agreement with literature data qualitatively confirms both, while for a fully quantitative model validation further investigations on laboratory and field scale are required.
5. Conclusions and Outlook
The reactive transport model developed and presented here enables the temporal and spatial reproduction of the formation of leaching zones for the first time. The scenario analyses for a carnallite-bearing potash seam show that growth rate, resulting shape and mineralogy mainly depend on the fluid flow velocity governed by density-driven flow, which can be classified by the Péclet and Damköhler number. In principle, four cases need to be distinguished: (1) reaction- and diffusion-dominated (Da < 1 and Pe < 2); (2) reaction- and advection-dominated (Da < 1 and Pe > 2), (3) transport- and diffusion-dominated (Da > 1 and Pe < 2) and (4) transport- and advection-dominated systems (Da > 1 and Pe > 2). Only in the latter case, density-driven flow has a significant influence.
The first two cases occur if the dissolution rate is very low, impeding highly saturated solution at the dissolution front. The leaching zone growth proceeds slowly and evenly across the entire seam thickness and neither a sylvinitic zone nor a flow barrier are formed. At low porosities, diffusion dominates (case 1), while at high porosities advection prevails (case 2). The scenario analyses reveal that reaction- and diffusion-dominated systems usually become transport-dominated over time (Da rises >1) resulting in the formation of a sylvinitic zone, while the dissolution front remains planar. At dissolution rates >10−6 cm/s, the system is generally transport-dominated. Below 10% porosity, advection has almost no influence (case 3) and the dissolution front remains planar; however, a sylvinitic zone and a weak fluid flow barrier with slightly reduced porosities are formed. The latter consists of halite which is precipitated near the inflow region, and thus inhibits the in- and outflow of solution from the leaching zone. At porosities ≥10%, density-driven flow gains influence and a funnel-shaped, rapidly growing leaching zone including a sylvinitic zone develops, while the lower half of the potash seam remains practically unaffected (case 4). This is the most common case in the scenario analyses. Due to the rapid barrier formation starting at the footwall, in- and outflow of solution diminish and flow velocity decreases over time. As a result, the system becomes diffusion-dominated (Pe sinks < 2) and the growth of the leaching zone stagnates after a few years, especially in case of very high dissolution rates.
Available laboratory and field data support the simulation results. Dissolution experiments with water [32,33], seawater [31] and almost saturated NaCl solution [31] on rock salt samples also yielded nearly planar dissolution fronts for low dissolution rates (NaCl solution), and a funnel-shaped cavern for high dissolution rates (water, seawater). Natural leaching zones within carnallite-bearing potash seams often show the same inclined shape of the dissolution front as well as the same proportions and mineralogy that the present models yield for initially transport- and advection-dominated systems (Figure 15) [23]. The reaction-dominated cases (1) and (2) provide an explanation for the formation of leaching zones described by Koch and Vogel [23], where a sylvinitic zone does not occur. However, more detailed laboratory and field studies are required to further validate the present models.
Regarding the hazard potential to subsurface mining operations, case (4) is most critical in the short term since the leaching zone expands over several metres within the potash seam in only a few years. However, as soon as the flow barrier inhibits solution exchange, the leaching zone represents a closed system that remains stable over time and can therefore be safely controlled. On the contrary, in case (1) and (2) the slow expansion continues over long periods of time without a decrease in growth rate. Additionally, the entire potash seam is affected instead of only the upper half and the porosity is higher compared to transport-dominated systems since no sylvinitic zone occurs. Higher porosities reduce the mechanical stability of the halite matrix and raise the amount of brine that could leak out of it. Accordingly, reaction- and advection-dominated systems (case 2) may cause a higher hazard potential in the long term.
In the next step, it is planned to apply the model presented here to potash seams that also contain kieserite (MgSO4 · H2O) and anhydrite (CaSO4), which are two other important potash salts. Due to the resulting hexary system, which additionally contains Ca2+ and SO42−, a series of additional secondary minerals has to be expected, which will probably lead to the formation of more complex transition zones [20]. To control mass balance errors due to differences between the volume of the pore and the solution within a cell, it is planned to include source and/or sink terms in future source code developments. Furthermore, heterogeneities in the composition of the potash seams will be taken into account, as these can have a strong influence on the shape of leaching zones [23,31]. It is also planned to adapt the model in order to include saturation-dependent dissolution rates. In doing so, the formation of leaching zones and cavernous structures within potash seams can be investigated in further detail in order to quantify their long-term behavior and to assess their hazard potential.
Author Contributions
Conceptualization, M.K., S.S. and A.Z.; methodology, S.S. and T.K.; software, S.S. and T.K.; validation, S.S.; formal analysis, S.S.; investigation, S.S.; resources, M.K.; data curation, A.Z.; writing—original draft preparation, S.S.; writing—review and editing, S.S., T.K., A.Z. and M.K.; visualization, S.S.; supervision, T.K. and M.K. All authors have read and agreed to the published version of the manuscript.
Funding
This research was a contribution to the GEO:N project ProSalz and supported by the Federal Ministry of Education and Research, Germany, grant number 03A0014A.
Data Availability Statement
The data presented in this study belong to K+S and are not publicly available due to their sensitivity.
Acknowledgments
The authors like to thank the German Federal Ministry of Education and Research for the financial support of the project. Furthermore, we thank T. Radtke from K+S for his suggestions and advice with regard to the model conceptualization.
Conflicts of Interest
The authors declare no conflict of interest. The funders had no role in the design of the study; in the collection, analyses, or interpretation of data; in the writing of the manuscript, or in the decision to publish the results.
References
- Baumert, B. Die Laugenspeicher in den Schichten des Zechsteins und ihre Gefahren für den Salzbergbau. Z. Dtsch. Geol. Ges. 1953, 105, 729–733. [Google Scholar]
- Warren, J.K. Salt usually seals, but sometimes leaks: Implications for mine and cavern stabilities in the short and long term. Earth Rev. 2017, 165, 302–341. [Google Scholar] [CrossRef]
- Edler, D. The status of modeling software for salt cavern leaching, identification of some unsolved problems and investigation of few of their aspects. In Underground Storage of CO2 and Energy; Hou, M.Z., Xie, H., Yoon, J., Eds.; Taylor & Francis Group: London, UK, 2010. [Google Scholar]
- Thoms, R.L.; Gehle, R.M. Non-halites and fluids in salt formations, and effects on cavern storage operations. Geotech. Spec. Publ. 1999, 90, 780–796. [Google Scholar]
- Welder, L.; Ryberg, D.S.; Kotzur, L.; Grube, T.; Robinius, M.; Stolten, D. Spatio-temporal optimization of a future energy system for power-to-hydrogen applications in Germany. Energy 2018, 158, 1130–1149. [Google Scholar] [CrossRef]
- Höntzsch, S.; Zeibig, S. Geogenic caverns in rock salt formations—A key to the understanding of genetic processes and the awareness of hazard potential. In Earth System Dynamics, GeoFrankfurt 2014, Frankfurt a.M., Germany, Sept 2014; Schweizerbart Science Publishers: Stuttgart, Germany, 2014. [Google Scholar]
- Dijk, P.E.; Berkowitz, B. Buoyancy-driven dissolution enhancement in rock fractures. Geology 2000, 28, 1051–1054. [Google Scholar] [CrossRef]
- Steefel, C.I.; Appelo, C.A.J.; Arora, B.; Jacques, D.; Kalbacher, T.; Kolditz, O.; Lagneau, V.; Lichtner, P.C.; Mayer, K.U.; Meeussen, J.C.L.; et al. Reactive transport codes for subsurface environmental simulation. Comput. Geosci. 2015, 19, 445–478. [Google Scholar] [CrossRef] [Green Version]
- Zidane, A.; Zechner, E.; Huggenberger, P.; Younes, A. Simulation of rock salt dissolution and its impact on land subsidence. Hydrol. Earth Syst. Sci. 2014, 18, 2177–2189. [Google Scholar] [CrossRef] [Green Version]
- Li, J.; Shi, X.; Yang, C.; Li, Y.; Wang, T.; Ma, H. Mathematical model of salt cavern leaching for gas storage in high-insoluble salt formations. Sci. Rep. Nat. 2018, 8, 372. [Google Scholar] [CrossRef]
- Jinlong, L.; Wenjie, X.; Jiangjing, Z.; Wei, L.; Xilin, S.; Chunhe, Y. Modeling the mining of energy storage salt caverns using a structural dynamic mesh. Energy 2020, 193, 116730. [Google Scholar] [CrossRef]
- Laouafa, F.; Guo, J.; Quintard, M.; Luo, H. Numerical modelling of salt leaching-dissolution process. In Proceedings of the 49th US Rock Mechanics/Geomechanics Symposium, San Francisco, CA, USA, 28 June–1 July 2015. [Google Scholar]
- Laouafa, F.; Guo, J.; Quintard, M. Modeling of salt and gypsum dissolution: Applications, evaluation of geomechanical hazards. Eur. J. Environ. Civ. Eng. 2019, 1–22. [Google Scholar] [CrossRef]
- Velema, R.; Bullen, J.; Visser, J.; Bruining, J. Magnesium from solution mining of bischofite layers and carnallite layers. In Proceedings of the ECMOR 2010—12th European Conference on the Mathematics of Oil Recovery, Oxford, UK, 6–9 September 2010. [Google Scholar] [CrossRef]
- Xie, M.; Kolditz, O.; Moog, H. A geochemical transport model for thermo-hydro-chemical (THC) coupled processes with saline water. Water Resour. Res. 2011, 47, W02545. [Google Scholar] [CrossRef]
- Kempka, T. Verification of a Python-based TRANsport Simulation Environment for density-driven fluid flow and coupled transport of heat and chemical species. Adv. Geosci. 2020, 54, 67–77. [Google Scholar] [CrossRef]
- Parkhurst, D.L.; Appelo, C.A.J. Description of Input and Examples for PHREEQC Version 3—A Computer Program for Speciation, Batch-reaction, One-dimensional Transport, and Inverse Geochemical Calculations. In Techniques and Methods; U.S. Geological Survey: Reston, VA, USA, 2013. [Google Scholar]
- Anderson, R.Y.; Kirkland, D.W. Dissolution of salt deposits by brine density flow. Geology 1980, 8, 66–69. [Google Scholar] [CrossRef]
- Altmaier, M.; Brendler, V.; Bube, C.; Marquardt, C.; Moog, H.C.; Richter, A.; Scharge, T.; Voigt, W.; Wilhelm, S.; Wilms, T.; et al. THEREDA, Thermodynamische Referenz-Datenbasis; Report 265; Gesellschaft für Anlagen- und Reaktorsicherheit (GRS): Braunschweig, Germany, 2011; 63p. [Google Scholar]
- Steding, S.; Zirkler, A.; Kühn, M. Geochemical reaction models quantify the composition of transition zones between brine occurrence and unaffected salt rock. Chem. Geol. 2020, 532, 119349. [Google Scholar] [CrossRef]
- Laliberté, M. Model for Calculating the Viscosity of Aqueous Solutions. J. Chem. Eng. Data 2007, 52, 321–335. [Google Scholar] [CrossRef]
- Laliberté, M. A Model for Calculating the Heat Capacity of Aqueous Solutions, with Updated Density and Viscosity Data. J. Chem. Eng. Data 2009, 54, 1725–1760. [Google Scholar] [CrossRef]
- Koch, K.; Vogel, J. Zu den Beziehungen von Tektonik, Sylvinitbildung und Basaltintrusionen im Werra-Kaligebiet. In Freiberger Forschungshefte; VEB Deutscher Verlag für Grundstoffindustrie: Leipzig, Germany, 1980; C 347; 104p. [Google Scholar]
- Felmy, A.; Weare, J. Calculation of multicomponent ionic diffusion from zero to high concentration: I. The system Na-K-Ca-Mg-Cl-SO4-H2O at 25 °C. Geochim. Cosmochim. Acta 1991, 55, 113–131. [Google Scholar] [CrossRef]
- Yuan-Hui, L.; Gregory, S. Diffusion of ions in sea water and in deep-sea sediments. Geochim. Cosmochim. Acta 1974, 38, 703–714. [Google Scholar] [CrossRef]
- Hoppe, H.; Winkler, F. Beitrag zur Lösekinetik von Mineralien der Kaliindustrie. Wiss. Z. Techn. Hochsch. Chem. Leuna-Mersebg. 1974, 16, 23–28. [Google Scholar]
- Röhr, H.U. Lösungsgeschwindigkeiten von Salzmineralen beim Ausspülen von Hohlräumen im Salz. Kali Steinsalz 1981, 8, 103–111. [Google Scholar]
- Durie, R.; Jessen, F. Mechanism of the Dissolution of Salt in the Formation of Underground Salt Cavities. Soc. Pet. Eng. J. 1964, 4, 183–190. [Google Scholar] [CrossRef]
- Anderko, A.; Lencka, M. Modeling self-diffusion in multicomponent aqueous electrolyte systems in wide concentration ranges. Ind. Eng. Chem. Res. 1998, 37, 2878–2888. [Google Scholar] [CrossRef]
- Tosca, N.J.; McLennan, S.M.; Lamb, M.P.; Grotzinger, J.P. Physicochemical properties of concentrated Martian surface waters. J. Geophys. Res. 2011, 116, 05004. [Google Scholar] [CrossRef] [Green Version]
- Field, L.; Milodowski, A.E.; Evans, D.; Palumbo-Roe, B.; Hall, M.R.; Marriott, A.L.; Barlow, T.; Devez, A. Determining constraints imposed by salt fabrics on the morphology of solution-mined energy storage cavities, through dissolution experiments using brine and seawater in halite. Q. J. Eng. Geol. Hydrogeol. 2018, 52, 240–254. [Google Scholar] [CrossRef]
- Gechter, D.; Huggenberger, P.; Ackerer, P.; Niklaus Waber, H. Genesis and shape of natural solution cavities within salt deposits. Water Resour. Res. 2008, 44, W11409. [Google Scholar] [CrossRef] [Green Version]
- Weisbrod, N.; Alon-Mordish, C.; Konen, E.; Yechieli, Y. Dynamic dissolution of halite rock during flow of diluted saline solutions. Geophys. Res. Lett. 2012, 39, 09404. [Google Scholar] [CrossRef]
- Spangenberg, E.; Spangenberg, U.; Heindorf, C. An experimental study of transport properties of porous rock salt. Phys. Chem. Earth 1998, 23, 367–371. [Google Scholar] [CrossRef]
- Müller-Lyda, I.; Birthler, H.; Fein, E. Ableitung von Permeabilitäts-Porositätsrelationen für Salzgrus; Report 148; Gesellschaft für Anlagen- und Reaktorsicherheit (GRS): Braunschweig, Germany, 1999; 74p. [Google Scholar]
- Munson, D.E. Constitutive model of creep in rock salt applied to underground room closure. Int. J. Rock Mech. Min. Sci. 1997, 34, 233–247. [Google Scholar] [CrossRef]
- Zarrouk, S.J.; Sullivan, M.O. The effect of chemical reactions on the transport properties of porous media. In Proceedings of the 23rd New Zealand Geothermal Workshop, Auckland, New Zealand, 7–9 November 2001; pp. 231–236. [Google Scholar]
Figure 1.
Sketch of leaching zones (a) in salt mining (symmetrical in x- and y-direction) and (b) in the construction of technical caverns (radially symmetrical).
Figure 1.
Sketch of leaching zones (a) in salt mining (symmetrical in x- and y-direction) and (b) in the construction of technical caverns (radially symmetrical).

Figure 2.
Flow sheet of the coupled reactive transport model: calculation steps in each time step and associated output parameters.
Figure 2.
Flow sheet of the coupled reactive transport model: calculation steps in each time step and associated output parameters.

Figure 3.
Comparison between observed and simulated densities.

Figure 4.
Sketch of the implemented interchange approach. A defined amount of minerals according to Equation (1) is dissolved into an adjacent cell if the solution present there is undersaturated with respect to the minerals. To fill the newly formed pore space, solution is transferred into the cell with the larger quantity of dissolved minerals (in this case cell A).

Figure 5.
(a) Interchange at the dissolution front leads to (b) partly permeated cells; (c) internal dissolution of dry minerals causes further permeation of the cell as well as mineral precipitation.
Figure 5.
(a) Interchange at the dissolution front leads to (b) partly permeated cells; (c) internal dissolution of dry minerals causes further permeation of the cell as well as mineral precipitation.


Figure 6.
Initial and boundary conditions: the inflow region is prescribed by a Dirichlet boundary (blue line); all other boundaries are impermeable (green lines); the models are initialised with dry, homogeneous rock of varying mineral contents (following the scenario description).
Figure 6.
Initial and boundary conditions: the inflow region is prescribed by a Dirichlet boundary (blue line); all other boundaries are impermeable (green lines); the models are initialised with dry, homogeneous rock of varying mineral contents (following the scenario description).

Figure 7.
Comparison of the permeated rock volume over time for different dissolution rates (a–d) and carnallite contents (line colour) of the modelled potash seam. Curves that end before a simulation time of 10 years indicate the leaching zone arrival at the right model boundary.
Figure 7.
Comparison of the permeated rock volume over time for different dissolution rates (a–d) and carnallite contents (line colour) of the modelled potash seam. Curves that end before a simulation time of 10 years indicate the leaching zone arrival at the right model boundary.

Figure 8.
(a) Mg2+ concentration distribution and (b) mineralogy for a reaction- and diffusion-dominated system (scenario: dissolution rate 10−6 cm/s and 5 wt.% carnallite).
Figure 8.
(a) Mg2+ concentration distribution and (b) mineralogy for a reaction- and diffusion-dominated system (scenario: dissolution rate 10−6 cm/s and 5 wt.% carnallite).

Figure 9.
(a) Mg2+ concentration distribution and (b) mineralogy for a reaction- and advection-dominated system (scenario: dissolution rate 10−6 cm/s and 20 wt.% carnallite).
Figure 9.
(a) Mg2+ concentration distribution and (b) mineralogy for a reaction- and advection-dominated system (scenario: dissolution rate 10−6 cm/s and 20 wt.% carnallite).

Figure 10.
(a) Mg2+ concentration distribution and (b) mineralogy for a transport- and diffusion-dominated system (scenario: dissolution rate 10−5 cm/s and 5 wt.% carnallite).
Figure 10.
(a) Mg2+ concentration distribution and (b) mineralogy for a transport- and diffusion-dominated system (scenario: dissolution rate 10−5 cm/s and 5 wt.% carnallite).

Figure 11.
(a) Mg2+ concentration distribution and (b) mineralogy for a transport- and advection- dominated system (scenario: dissolution rate 10−4 cm/s and 15 wt.% carnallite).
Figure 11.
(a) Mg2+ concentration distribution and (b) mineralogy for a transport- and advection- dominated system (scenario: dissolution rate 10−4 cm/s and 15 wt.% carnallite).

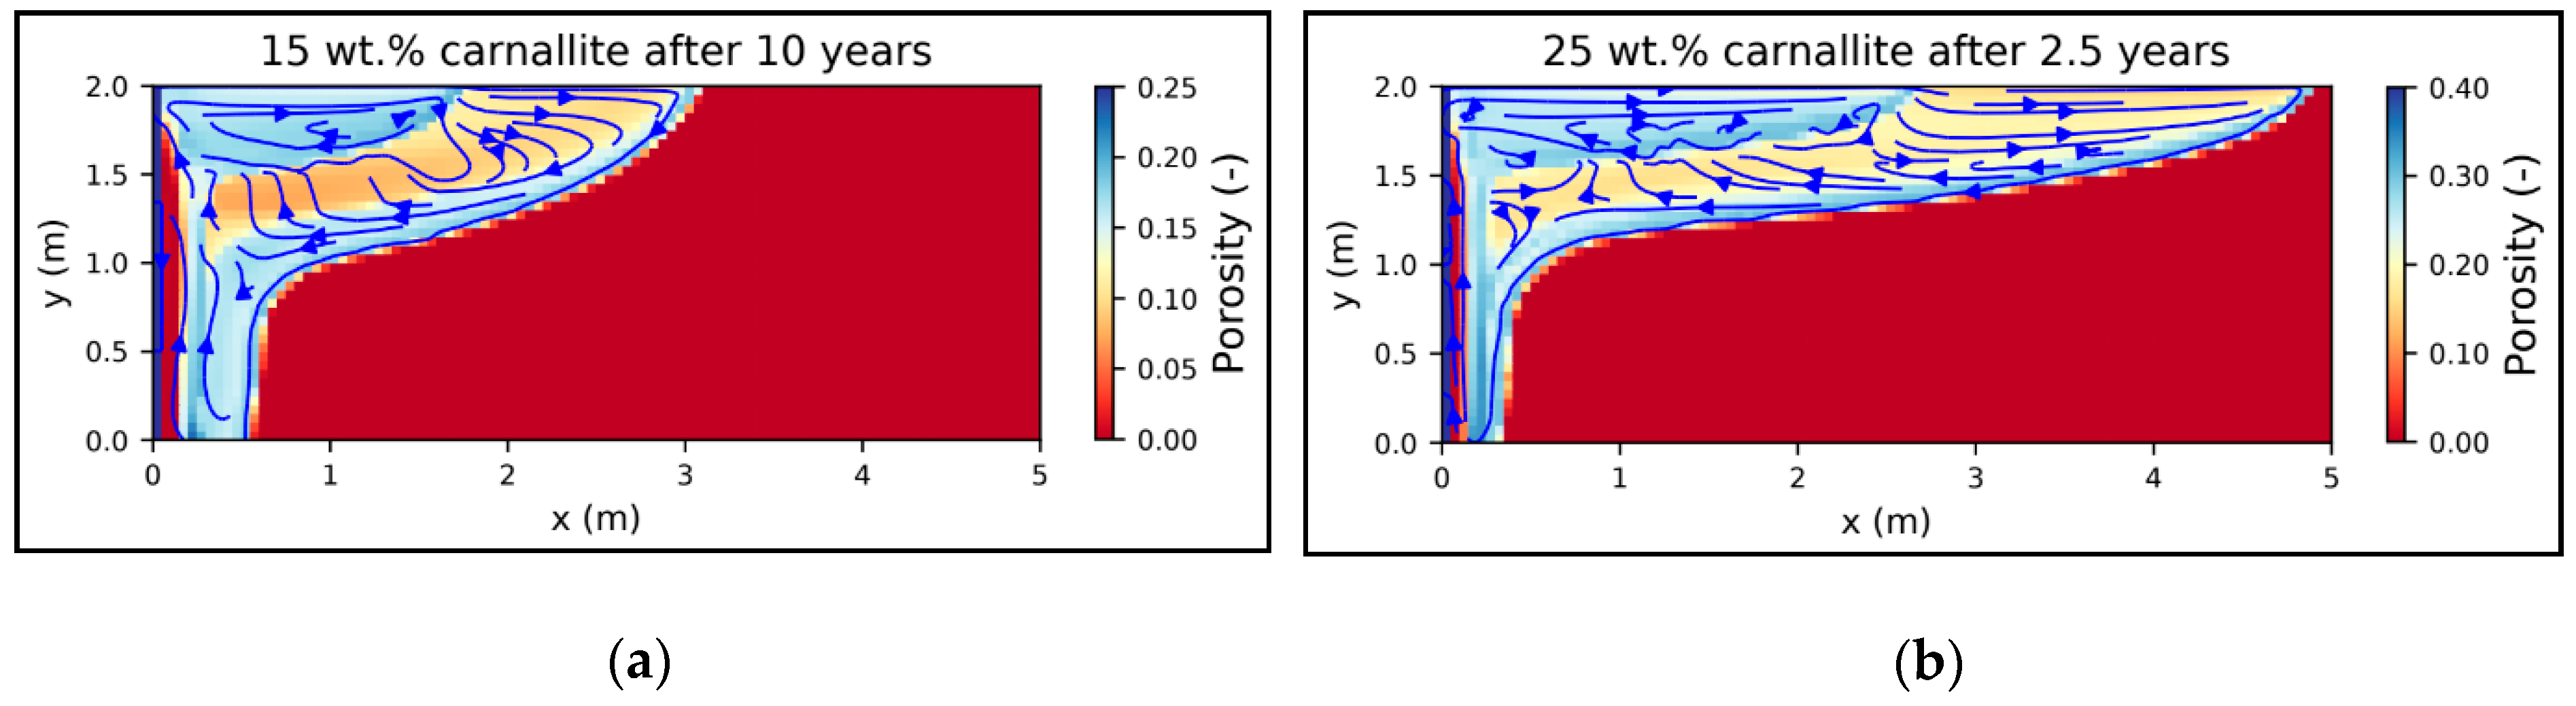
Figure 12.
Porosity distribution in a transport- and advection-dominated system with 20 wt.% carnallite and a dissolution rate of (a) 10−3 cm/s and (b) 10−4 cm/s.
Figure 12.
Porosity distribution in a transport- and advection-dominated system with 20 wt.% carnallite and a dissolution rate of (a) 10−3 cm/s and (b) 10−4 cm/s.

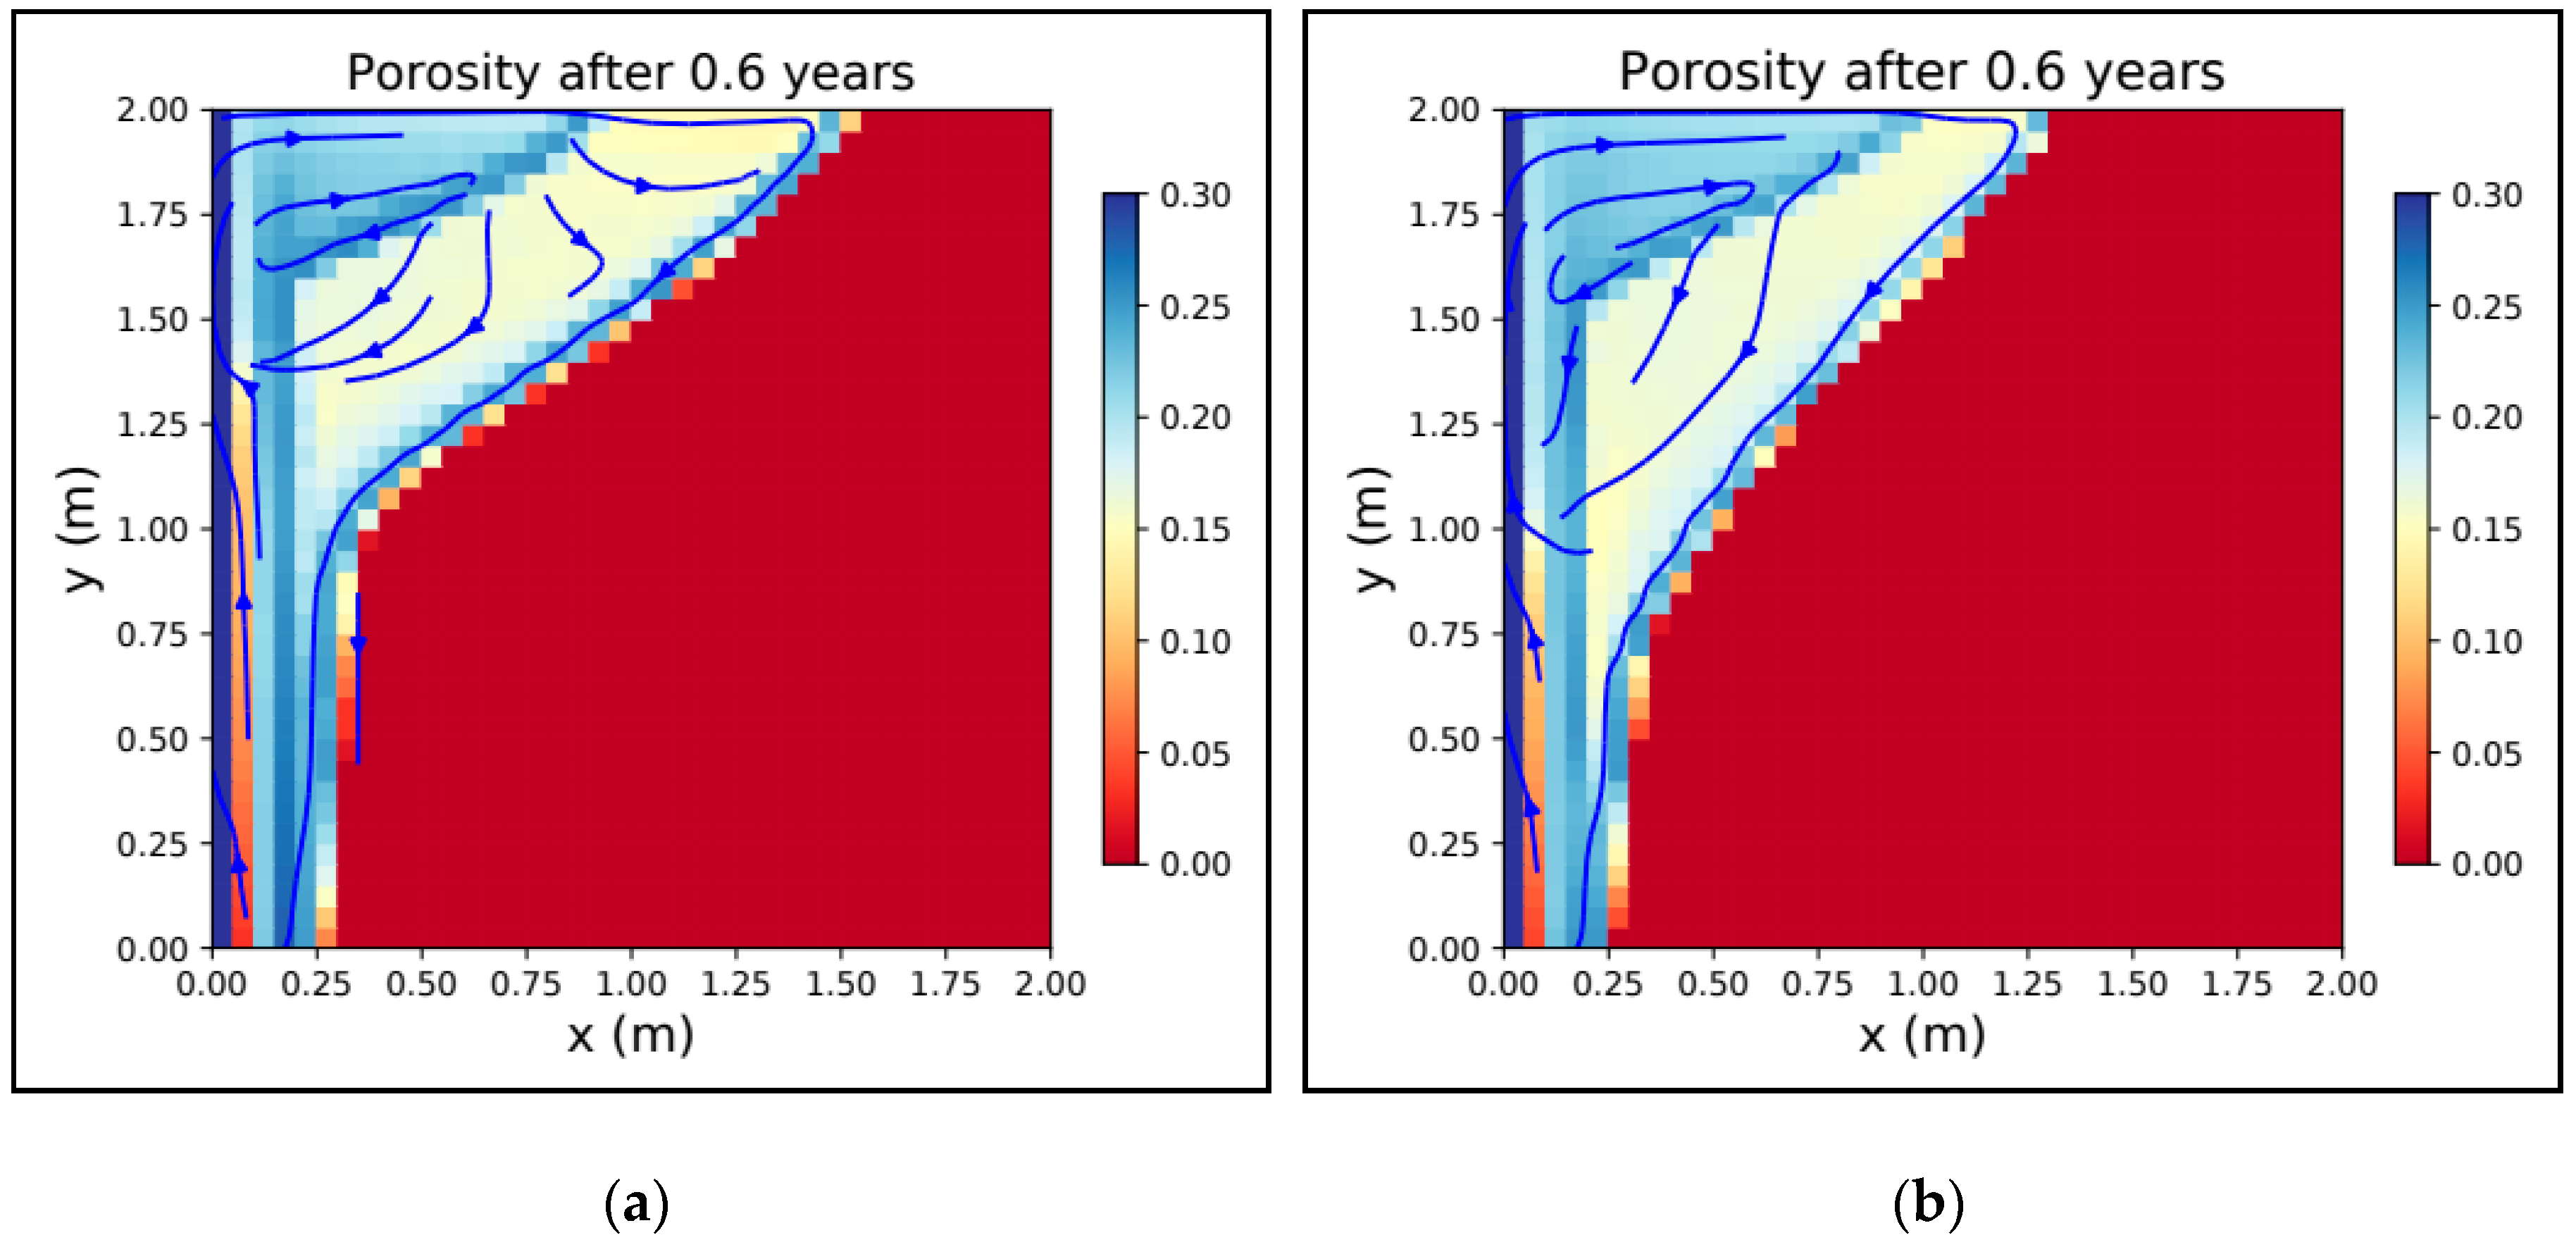
Figure 13.
Porosity distribution within an (a) initially reaction- and diffusion-dominated system; (b,c) in the long run transport-dominated and with an increasing influence of advection (scenario: dissolution rate 10−6 cm/s and 10 wt.% carnallite).
Figure 13.
Porosity distribution within an (a) initially reaction- and diffusion-dominated system; (b,c) in the long run transport-dominated and with an increasing influence of advection (scenario: dissolution rate 10−6 cm/s and 10 wt.% carnallite).

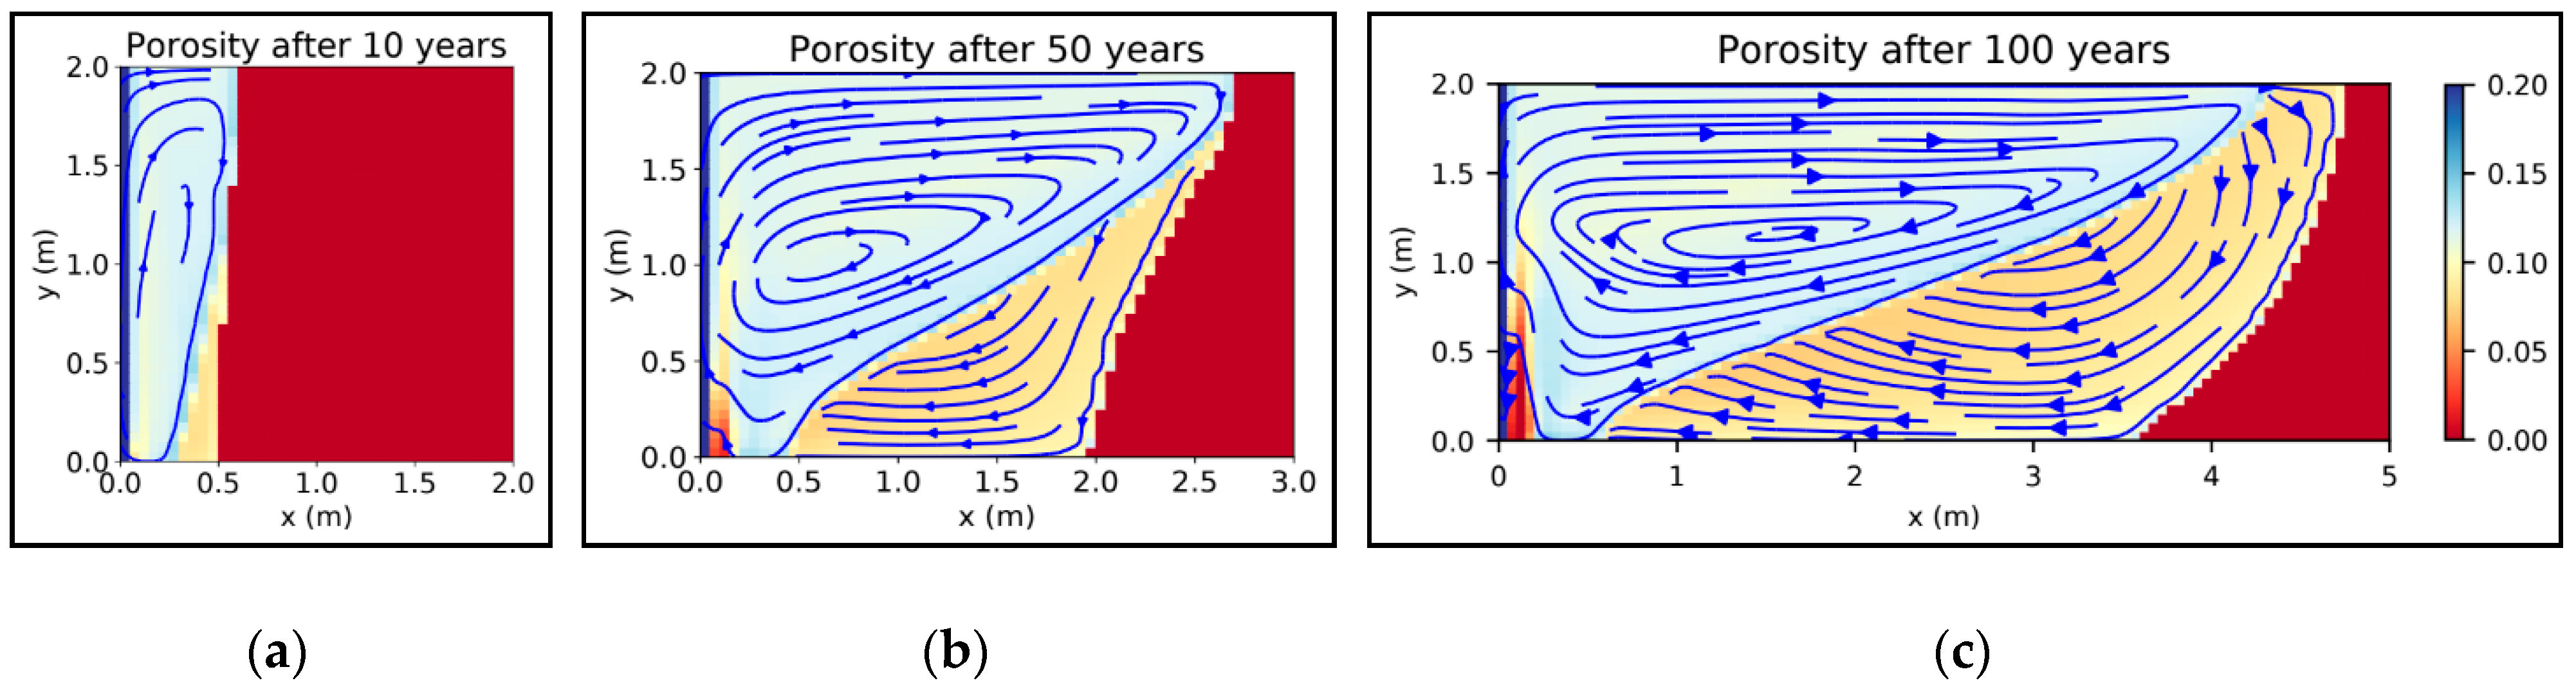
Figure 14.
Porosity distribution within an (a) initially reaction- and advection-dominated system; (b,c) in the long run transport-dominated and with an increasing influence of diffusion (scenario: dissolution rate 10−5 cm/s and 25 wt.% carnallite).
Figure 14.
Porosity distribution within an (a) initially reaction- and advection-dominated system; (b,c) in the long run transport-dominated and with an increasing influence of diffusion (scenario: dissolution rate 10−5 cm/s and 25 wt.% carnallite).

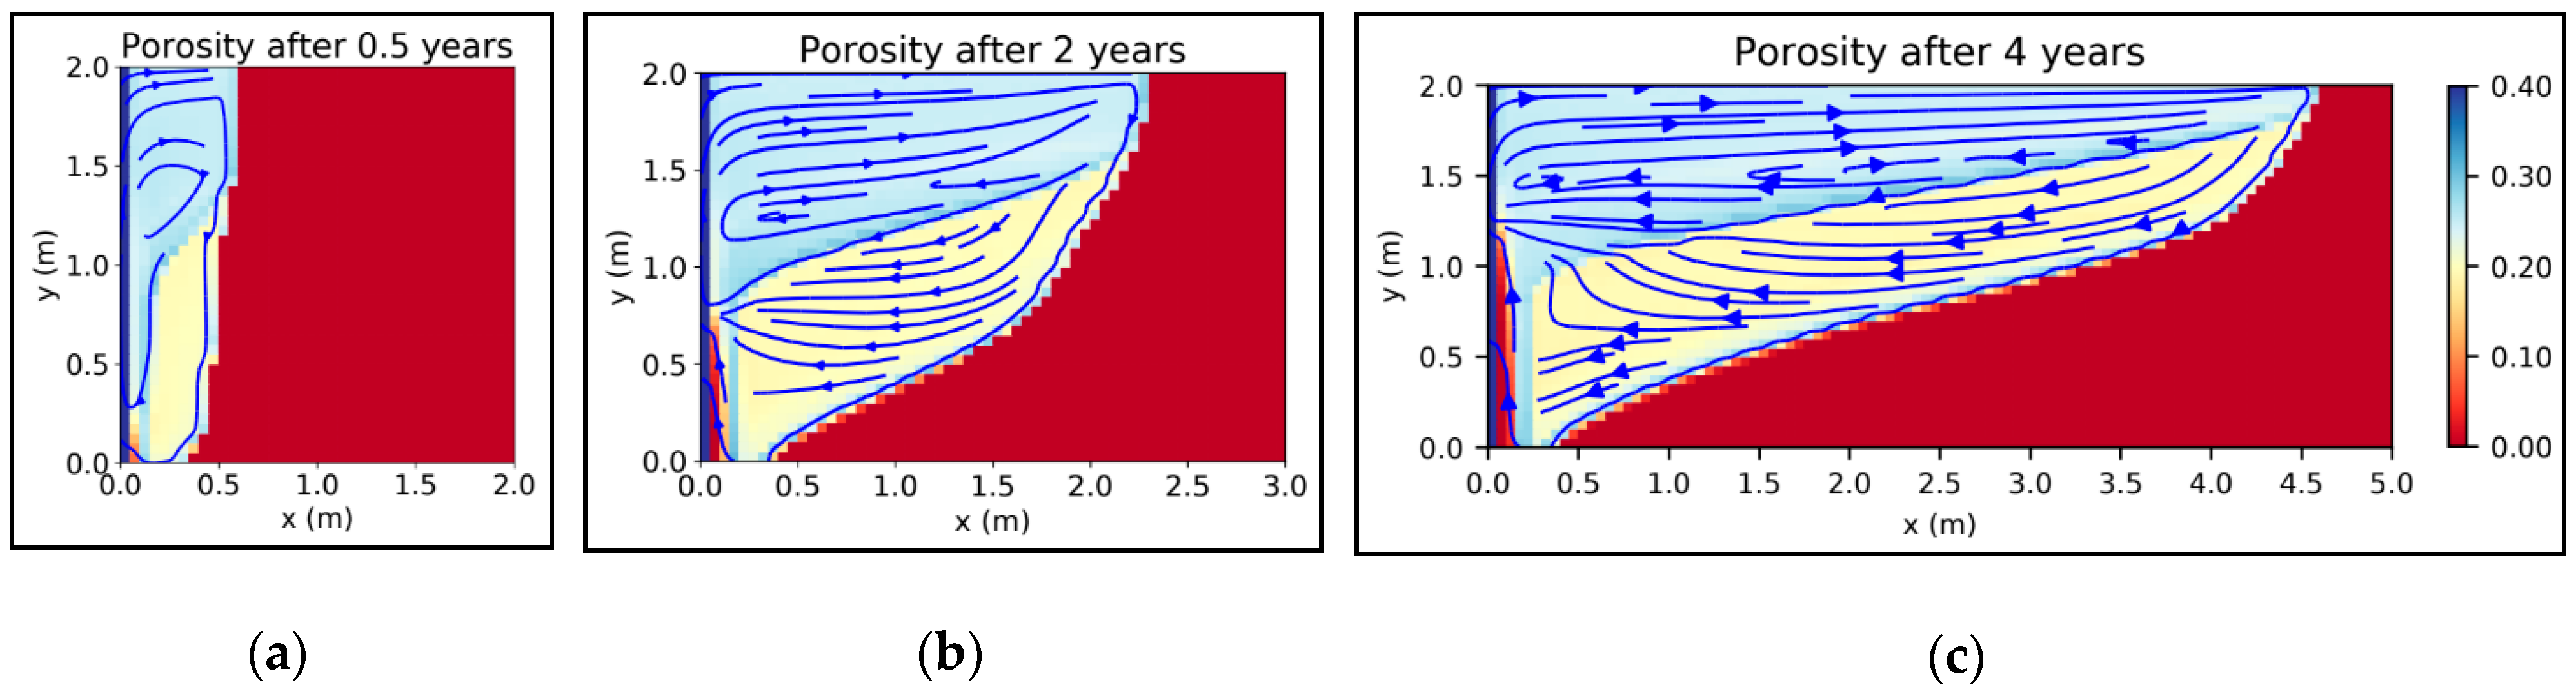
Figure 15.
Porosity distribution in an initially transport- and advection-dominated system, in the long run diffusion-dominated (dissolution rate 10−3 cm/s, carnallite content (a) 15 wt.% and (b) 25 wt.%).
Figure 15.
Porosity distribution in an initially transport- and advection-dominated system, in the long run diffusion-dominated (dissolution rate 10−3 cm/s, carnallite content (a) 15 wt.% and (b) 25 wt.%).


Table 1.
Potash salt mineral densities and dissolution properties.
| Mineral | Density (kg/m3) | Reaction Equation (Dissolution) | Log K |
|---|---|---|---|
| Carnallite | 1600 | 1KMgCl3 · 6H2O → 3Cl− + 6 H2O + 1K+ + 1Mg2+ | 4.33 |
| Halite | 2170 | 1NaCl → 1Cl− + 1Na+ | 1.586 |
| Sylvite | 1990 | 1KCl → 1Cl− + 1K+ | 0.915 |
Table 2.
Classification of the scenarios into diffusion-dominated (Pe < 2) or advection-dominated (Pe > 2) and reaction-dominated (Da < 1) or transport-dominated (Da > 1) systems as well as hybrid forms (Pe alternating, Pe sinks < 2, Da rises > 1).
Table 2.
Classification of the scenarios into diffusion-dominated (Pe < 2) or advection-dominated (Pe > 2) and reaction-dominated (Da < 1) or transport-dominated (Da > 1) systems as well as hybrid forms (Pe alternating, Pe sinks < 2, Da rises > 1).
| Dissolution Rate (cm/s) | Amount of Carnallite (wt.%) | ||||
|---|---|---|---|---|---|
| 5% | 10% | 15% | 20% | 25% | |
| 10−3 | Pe < 2 Da > 1 | Pe sinks < 2 Da > 1 | Pe sinks < 2 Da > 1 | Pe sinks < 2 Da > 1 | Pe sinks < 2 Da > 1 |
| 10−4 | Pe < 2 Da > 1 | Pe sinks < 2 Da > 1 | Pe sinks < 2 Da > 1 | Pe sinks < 2 Da > 1 | Pe sinks < 2 Da > 1 |
| 10−5 | Pe < 2 Da > 1 | Pe sinks < 2 Da > 1 | Pe sinks < 2 Da rises > 1 | Pe sinks < 2 Da rises > 1 | Pe sinks < 2 Da rises > 1 |
| 10−6 | Pe < 2 Da rises > 1 | Pe alternating Da rises > 1 | Pe > 2 Da rises > 1 | Pe > 2 Da < 1 | Pe > 2 Da < 1 |
Publisher’s Note: MDPI stays neutral with regard to jurisdictional claims in published maps and institutional affiliations. |
© 2021 by the authors. Licensee MDPI, Basel, Switzerland. This article is an open access article distributed under the terms and conditions of the Creative Commons Attribution (CC BY) license (http://creativecommons.org/licenses/by/4.0/).
Share and Cite
MDPI and ACS Style
Steding, S.; Kempka, T.; Zirkler, A.; Kühn, M. Spatial and Temporal Evolution of Leaching Zones within Potash Seams Reproduced by Reactive Transport Simulations. Water 2021, 13, 168. https://doi.org/10.3390/w13020168
AMA Style
Steding S, Kempka T, Zirkler A, Kühn M. Spatial and Temporal Evolution of Leaching Zones within Potash Seams Reproduced by Reactive Transport Simulations. Water. 2021; 13(2):168. https://doi.org/10.3390/w13020168
Chicago/Turabian StyleSteding, Svenja, Thomas Kempka, Axel Zirkler, and Michael Kühn. 2021. "Spatial and Temporal Evolution of Leaching Zones within Potash Seams Reproduced by Reactive Transport Simulations" Water 13, no. 2: 168. https://doi.org/10.3390/w13020168
Note that from the first issue of 2016, this journal uses article numbers instead of page numbers. See further details here.