Article

Biogeochemical Responses and Seasonal Dynamics of the Benthic Boundary Layer Microbial Communities during the El Niño 2015 in an Eastern Boundary Upwelling System

1
Observatorio de Ecología Microbiana, Departamento de Biología, Facultad de Ciencias Naturales y Exactas, Universidad de Playa Ancha, Avenida Leopoldo Carvallo 270, Playa Ancha, Valparaíso 2340000, Chile
2
HUB Ambiental UPLA, Universidad de Playa Ancha, Avenida Leopoldo Carvallo 200, Playa Ancha, Valparaíso 2340000, Chile
3
Escuela de Ciencias del Mar e Instituto Milenio de Oceanografía, Pontificia Universidad Católica de Valparaíso, Valparaíso, Chile, Altamirano 1480, Valparaíso 2360007, Chile
4
Centro de Observación Marino para Estudios de Riesgos del Ambiente Costero (COSTAR), Facultad de Ciencias del Mar y de Recursos Naturales, Universidad de Valparaíso, Casilla 5080, Reñaca, Viña del Mar 2520000, Chile
5
Laboratorio de Bentos, Escuela de Biología Marina, Universidad de Valparaíso, Viña del Mar 2520000, Chile
*
Authors to whom correspondence should be addressed.
Water 2021, 13(2), 180; https://doi.org/10.3390/w13020180
Submission received: 31 October 2020 / Revised: 22 December 2020 / Accepted: 5 January 2021 / Published: 13 January 2021
(This article belongs to the Special Issue Marine Biology: Biodiversity and Conservation)

Abstract

:
The Eastern South Pacific coastal zone is characterized by seasonal and interannual variability, driven by upwelling and El Niño Southern Oscillation (ENSO), respectively. These oceanographical conditions influence microbial communities and their contribution to nutrient and greenhouse gases recycling, especially in bottom waters due to oxygenation. This article addresses the seasonal hydrographic and biogeochemical conditions in the water and sediments during El Niño 2015. Bottom water active microbial communities, including nitrifiers, were studied using amplicon sequencing of 16S rRNA (cDNA) and RT-qPCR, respectively. The results of the hydrographic analysis showed changes in the water column associated with the predominance of sub-Antarctic Waters characterized by warmed and low nutrients in the surface and more oxygenated conditions at the bottom in comparison with El Niño 2014. The organic matter quantity and quality decreased during fall and winter. The bottom water active microbial assemblages were dominated by archaea (Ca. Poseidoniales) and putative ammonia oxidizing archaea. Active bacteria affiliated to SAR11, Marinimicrobia and Nitrospina, and oxygen deficient realms (Desulfobacterales, SUP05 clade and anammox) suffered variations, possibly associated with oxygen and redox conditions in the benthic boundary layer. Nitrifying functional groups contributed significantly more during late fall and winter which was consistent with higher bottom water oxygenation. Relationships between apparent oxygen utilization nitrate and nitrous oxide in the water support the contribution of nitrification to this greenhouse gas distribution in the water. In general, our study suggests that seasonal oceanographic variability during an El Niño year influences the microbial community and thus remineralization potential, which supports the need to carry out longer time series to identify the relevance of seasonality under ENSO in Eastern Boundary Upwelling Systems (EBUS) areas.

Graphical Abstract

1. Introduction

The coastal zone of central Chile is marked by high productivity, associated with upwelling events driven by the anticyclonic gyre seasonality, characteristic of Eastern Boundary Upwelling Systems (EBUS). In this area, upwelling occurs seasonally fertilizing the surface layers with high nutrient and oxygen deficient subsurface waters due to the presence of the oxygen minimum zone (OMZ) on the continental shelf [1]. Additionally, the upwelled water is characterized by the accumulation of greenhouse gases, such as CO2 and N2O, usually associated with pelagic and benthic anaerobic microbial activities [2,3,4]. However, the EBUS coastal areas in the eastern South Pacific (ESP) are also subject to great spatiotemporal dynamics, associated, for example, with the variability of upwelling-favorable winds, causing meso- and sub-mesoscale structures (eddies, filament meanders) [5]. Among other sources of oceanographic variability, coastal-trapped waves could be a relevant driver of interannual variability, influencing the oceanographic dynamics in this coastal area, for example, during “El Niño” when a deepening of the thermocline, and warmer and more oxygenated waters are characteristics at the surface layer [6,7]. During 2015–2016, strong temperature anomalies were observed in the equatorial region during the “Godzilla El Niño” event, in comparison with previous events since 1950 [8], impacting the biogeochemical conditions in the water, from moderate to strong, between early 2015 and mid-2015 at Callao coasts off Perú [9]. These authors reported higher temperatures, oxygen, pH and nitrate but lower silicate and phosphate concentrations at the surface layer during “El Niño”. The shifts in the nutrient reservoir in the surface water and oxygenation influences the phytoplankton community structure and thus primary productivity at different upwelling areas along the ESP coast [10,11,12]. Changes in the OMZ and nutrient availability are key factors in shaping the microbial communities’ structure and activities [2], including key microbial communities and their contribution to organic matter respiration, producing CO2 and N2O greenhouse gases. Aerobic versus anaerobic processes influence the N2O accumulation in the water column, which is aerobically produced through nitrification as a by-product of the ammonia oxidation to nitrite, carried out by bacteria and archaea in marine ecosystems [13,14]. N2O could also be anaerobically produced or consumed by denitrification, since it is an intermediate product of the dissimilative reduction of nitrate, generating molecular nitrogen, a significant process producing greenhouse gases and their potential exchange in the atmosphere in OMZs [15]. In addition, changes in oxygenation and in substrate availability generate profound microbial composition effects as determined in coastal areas of the ESP which are also subject to seasonal and interannual variability [16,17,18]. El Niño was found to influence benthic marine communities like macro and meiofauna [19,20] and sulfur oxidizing large filamentous bacteria Ca. Marithioploca. [21], due to changes in bottom water oxygenation, shifting sediment biogeochemistry [22,23]. However, little is known about the impact of seasonality and other sources of variability present during El Niño on the active microbial community in the central area of the ESP and its potential connection with water column biogeochemistry. Herein, we hypothesize that water column biogeochemical conditions will change during selected representative months per season during El Niño 2015, influencing benthic boundary layer microbial community composition and active aerobic ammonia oxidizing microbes in the continental shelf off Valparaíso, central Chile.

2. Materials and Methods

Valparaíso Bay in central Chile (32°9′ S, 71°6′ W) is situated in an Eastern Boundary Upwelling System influenced mainly by the seasonal upwelling of Eastern Subsurface Waters (ESSW) characterized by cold, nutrient rich and low oxygen waters, associated with the southern portion of the Oxygen Minimum Zone (OMZ) [24]. The alongshore southerly winds field versus the northerly winds field drives the upwelling dynamics and water column biogeochemical conditions, including the OMZ spatiotemporal variability, which is also affected by interannual conditions, such as El Niño, that deepens the thermocline [6]. In fact, ENSO cycles affect coastal primary productivity in the Valparaíso Bay [11]. Moreover, the Valparaíso Bay area is characterized by the influence of the Aconcagua River and anthropogenic effects associated with urban sewage outfalls and harbor activities, contributing to organic matter enrichment and benthic habitat heterogeneity in the coastal zone [25,26].
The oceanographic station is situated in the middle of the continental shelf area (Figure S1). This Station corresponds to the Oceanographic Time Series off Concón Water & Sediment (SOCAS, in Spanish) visited seasonally between 2012 and 2015 [25,26]. In this study, the SOCAS oceanographic station time series was visited during selected months between 2014 and 2015. The first stage of the sampling consisted in identifying the location and depth using a GPS Echo-sounder Garmin®. Temperature, salinity, and oxygen profiles were obtained by a CTDO (Seabird—19 plus). Discrete water sampling was carried out using Niskin bottles at four-six depth levels (0, 25, 50, 75, 100 and 125 m). Water was collected for oxygen (Winkler bottles) and ammonium (40 mL Schott Glass Bottles, DURAN) determinations in triplicate, immediately incubated with respective reagents following standard procedures and recommendations [27,28]. Seawater for nitrate, nitrite and phosphate analysis was filtered through a GF/F filter (Whatman) using syringes and filter holders of 25 mm diameter, into acid-clean Nalgene bottles (125 mL). These bottles were kept on board the ship in the dark and with ice packs until arrival at the lab (<5 h), and then they were frozen at −20 °C in the freezer until they were analyzed. Seawater for Chlorophyll-a (1 L) analyses was collected and kept in the dark until filtration in the laboratory. Seawater for greenhouse gases (GHG = CO2, CH4 and N2O) determination was collected in triplicates in 20 mL vials. The GHG samples were poisoned to avoid further biological activity, using 50 µL of saturated mercuric chloride. These samples were stored in the dark at room temperature until they were analyzed. Seawater (60 mL) for microbial cells was concentrated by filtration onto 0.22 μm hydrophilic PVDF filters, (GVWP02500, Millipore, Burlington, MA, USA) using sterile syringes and filter holders of 25 mm diameter during January, April, August, and December 2015. The filters were preserved with RNAlater® solution (Ambion, Austin, TX, USA), stored in ice packs until arrival at the lab and transferred to a −80 °C freezer until RNA extraction.
Non-disturbed sediment samples for biochemical analysis were collected from independent replicates using a gravity corer (internal diameter of 50 mm and 1000 mm length). Redox potential (Ehnhe) and pH measurements at surface sediment layer (0–2 cm) were determined on board using a platinum standard combination electrode with a calomel internal reference (SGTM, Mettler Toledo). Additionally, surface sediments for total organic matter, Chlorophyll-a, phaeopigments, carbon and nitrogen stable isotope ratios were collected and stored in Ziploc bags, kept with ice packs until arrival at the lab and finally they transferred to a −20 °C freezer until sediment chemical analyses. Sediments for DNA analysis were collected for benthic microbial community characterization. Approximately 0.5 g of surface sediment was subsampled from the gravity cores using plastic vials (duplicates) and preserved with RNAlater® solution (Ambion, Austin, TX, USA), kept with ice packs until arrival at the lab, and transferred to a −80 °C freezer until RNA extraction.

2.1. Water Column Chemical Analyses

Oxygen concentrations were determined by a modified Winkler method and using a DOSIMAT for microtitration [29]. This data was also used to calibrate oxygen data registered using a CTDO (Conductivity-Temperature-Depth-Optical). Ammonium was determined fluorometrically [28] using a Turner design® fluorometer (Sunnyvale, CA, USA). Nutrients were analyzed by spectrophotometry based on standard methods with a nutrient automatic analyzer [30]. Chlorophyll-a was determined in discrete seawater samples according to the method described by Holm-Hansen et al. [31]. GHG were determined based on the headspace method [32] and analyzed by a gas chromatograph (GC-2014 Greenhouse, Shimadzu, Kyoto, Japan) equipped with an electron capture detector (ECD) and a flame ionization detector (FID). Three-point calibration curves using helium, air and a standard of 600, 5 and 1 for CO2, CH4 and N2O mixture were run for absolute quantification (Scotty gas mixture; Air Liquid Co., Paris, France).

2.2. Sediment Chemical Analyses

The total organic matter (TOM) was determined using weight differences before and after ignition at 475–500 °C (four hours) [33]. TN and carbon (δ13C) and nitrogen (δ15N) isotopes in surface sediments were analyzed by mass spectrometry (Thermo Scientific Delta V Advantage IRMS with EA-2000 Flash Elemental analyzer). Carbon and nitrogen isotope values were reported according to Pee Dee Belemnite (VPDB) and air standard and analyzed at the Laboratory of Biogeochemistry and Applied Stable Isotopes (LABASI, PUC), Chile. Sediment-bound chlorophyll-a and phaeopigments were extracted from 1 g duplicate subsamples of wet sediment using 90% acetone following a procedure described by Gutiérrez et al. [34]. The total sulfides content was determined using colorimetric methods following Cline [35].

2.3. Microbial Communities’ Analyses

Sediment DNA extraction was conducted with the PowerSoil DNA Isolation Kit (MoBio Laboratories, Carlsbad, CA, USA) in accordance with the manufacturer’s specifications. Water RNA was extracted using Ambion® RNA extraction kit (AM1560) according to manufacturer’s protocol with the addition of a mechanical disruption step with 200-µm-diameter zirconium beads (Low Binding Zirconium Beads, OPS Diagnostics, Lebanon, NJ, USA) for two rounds of 30 s (~3000 rpm) using a Mini-Beadbeater-8™ (Biospec Products, Bartlesville, OK, USA). DNA and RNA quantification were determined by using fluorescence (Qbit 2.0). For the analyses of RNA, the DNA was removed using the TURBO DNA-free™ kit (Applied Biosystems, Foster City, CA, USA) and RNA was tested for residual DNA by bacterial 16S rRNA gene PCR amplification following standard procedures [16]. RNA was reverse-transcribed with random primers provided by the ImProm-II™ Reverse Transcription System (Promega Corp., Madison, WI, USA).
Bacterial and archaeal 16S rRNA gene were amplified using primers 28F (5′-GAGTTTGATCNTGGCTCAG) and 519R (5′-GTNTTACNGCGGCKGCTG) and Arch349F (5′-CCCTAYGGGGYGCASCAG) and Arch958R (5′-YCCGGCGTTGAMTCCAATT), respectively, and sequenced using high-throughput Illumina Miseq by a commercial laboratory (MrDNA, Shallowater, TX, USA). The 16S rRNA and rDNA gene sequences were checked, and quality standards were revised using the Mothur software v1.35.1 [36]. Sequences with short reads <200 bp, with more than one undetermined nucleotide (N) and with a maximum homopolymer length of eight nucleotides were deleted. Chimeric sequences were also identified using the Chimera UCHIME algorithm [37] and removed. The 16S rRNA and rDNA gene sequences retrieved were taxonomically classified using the automatic software pipeline SILVAngs available from https://www.arb-silva.de/ [38]. The sequences were deposited in the European Nucleotide Archive (ENA) under the project accession PRJEB31703 (experiments accession ID ERX3252743-ERX3252756).
Alpha diversity indexes were analyzed based on Operational Taxonomic Units (OTUs) using PRIMER (7.0.11) with the PERMANOVA add on PRIMER [39]. Rarefaction curves, Heatmap, and Venn Diagrams were analyzed with R using the ampvis2 package [40]. The comparison of the active bottom water versus surface sediment microbial community (16S rRNA versus 16S rDNA) was performed to identify a core active and present microbiome from the benthic boundary layer using dissimilarity analyses between categorical factors (sediment/water) considering the Similarity Percentages-species contributions (SIMPER). In addition, the comparison between active bottom water microbial communities from Upwelling (January and December) versus non-Upwelling seasons (April and August) was conducted to identify dissimilarities between seasons using SIMPER. Principal Coordinated Analyses (PCoA) were generated based on the Bray Curtis similarity matrix using square root transformed reads of the active bottom water microbial communities using OTUs. The relationships between water and sediment environmental conditions with bottom water active microbial community structure were visualized using correlation analyses (Pearson) overlaid on PCoA. Distance based linear models (DistLM) were estimated using a similarity matrix to evaluate the relative contribution of the bottom water conditions in the microbial community structure variability.
Aerobic ammonia oxidizing archaea Nitrosopumilus-like and ammonia oxidizing bacteria from Betaproteobacteria (βAOB) were quantified using RT-qPCR based on the ammonia monooxygenase subunit A (amoA) gene and the nitrite oxidizer, Nitrospina-like bacteria using 16S rRNA gene. First, cDNA was generated using the reversed primer Arch-amoAR [41], amoA-2R [42] and NitSSU_286R [43] with the ImProm-II Reverse Transcription System (Promega, Madison, WI, USA). Quantification was performed following previous studies [44], using the Brilliant II Sybr Green qPCR master mix (Stratagene) kit and PCR reactions consisting of a 20-μL, with approximately 5 ng of cDNA (2 μL) as a template and 0.4 μM of primer (423F–Arch-amoAR, amoA 1F-2R and NitSSU_130F- NitSSU_286R primers), in triplicate for samples, standards and negative controls. The PCR amplification protocol consisted in an initial activation and denaturation for 10 min at 95 °C, then 40 cycles of denaturation (30 s at 95 °C), annealing (30 s at 56°C for amoA and 57 °C for 16S rRNA gene), and a final extension (40 s at 72°C). A melting curve was also included. The standard curve was carried out using a PCR product (4–4 × 10⁷ copies/μL) with the following efficiency (109–114%) and r2 (>0.997). The qPCR was run on a MX3000P Stratagene Real—Time PCR System.

3. Results and Discussion

3.1. Oceanographic Features Observed

Hydrological conditions determined during time series are shown in Figure 1. The water column off Valparaíso was characterized by the presence of two water masses, the sub-Antarctic Water (SAAW) and the Equatorial Subsurface Water (ESSW) according to Silva et al. [24], the first usually located at the surface layer (<25 m depth) and the ESSW at deep and bottom waters (>50 m depth). During our study, waters with high salinity (34.6 PSU) and density (>26.2 Sigma-t), but with low temperature (<12 °C) and oxygen conditions (<2 mL/L) were associated with ESSW water mass mainly during 2014 and January 2015 (Figure 1, Table S1). However, during April, August, and December 2015 an increment of SAAW contribution in comparison with ESSW was observed in the water column using temperature versus salinity (T/S) diagram analyses (Figure 2).
Lower oxygen concentration associated with ESSW and potential OMZ development was only detected during 2014 and at the beginning of 2015 (<1.66 mL/L) in the subsurface or near to bottom waters, whereas higher oxygen concentration was observed from April- December 2015 in the subsurface water column. The changes observed during the late fall (April) and winter (August) 2015 were associated with the deepening of the thermocline (considered as the 12 °C isotherm) from 27 m in June 2014 to 68 m in August 2015 (Table S1 Supplementary Material). In fact, sea surface temperature (SST) anomalies obtained from satellite analyses between January 2014–January 2017 (Figure S2), indicated warmer conditions during fall (March and April 2015) followed by cooling conditions in winter (August 2015), and highest SST at the end of 2015. The Oceanic Niño Index (ONI) accounted for the increase in SST registered at the end of 2015 (Figure S2), one of the strongest El Niño events registered in the ESP [8]. Moreover, besides the El Niño event of 2015, an extremely strong storm and meteo-tsunami event [45] were reported twelve days before our sampling collection in August 2015.
Phytoplanktonic biomass analyses based on discrete chlorophyll-a surface water determinations, (Table S1 Supplementary Material), and satellite image analyses are depicted in Figure S3. Chlorophyll-a maxima were observed in the spring months of (September and November) 2014 and between spring and summer (October and December) 2015. Higher nutrient availability for phytoplankton in the study area was reported to be correlated with upwelling and other allochthonous sources, for example from the Aconcagua river [11]. In fact, during our sampling, the Aconcagua River showed a discharge increment in late 2015, the highest of the three-year analysis (Figure S4, Table S1 Supplementary Material). However, only slight salinity decreases were observed at the surface waters (Figure 1). Our results are consistent with the primary productivity observed during the last decade at a shallower coastal area off Valparaíso associated with the interannual upwelling dynamics, including the influence of ENSO warm and cold phases in longer time series during 1986 and 1996 [11].

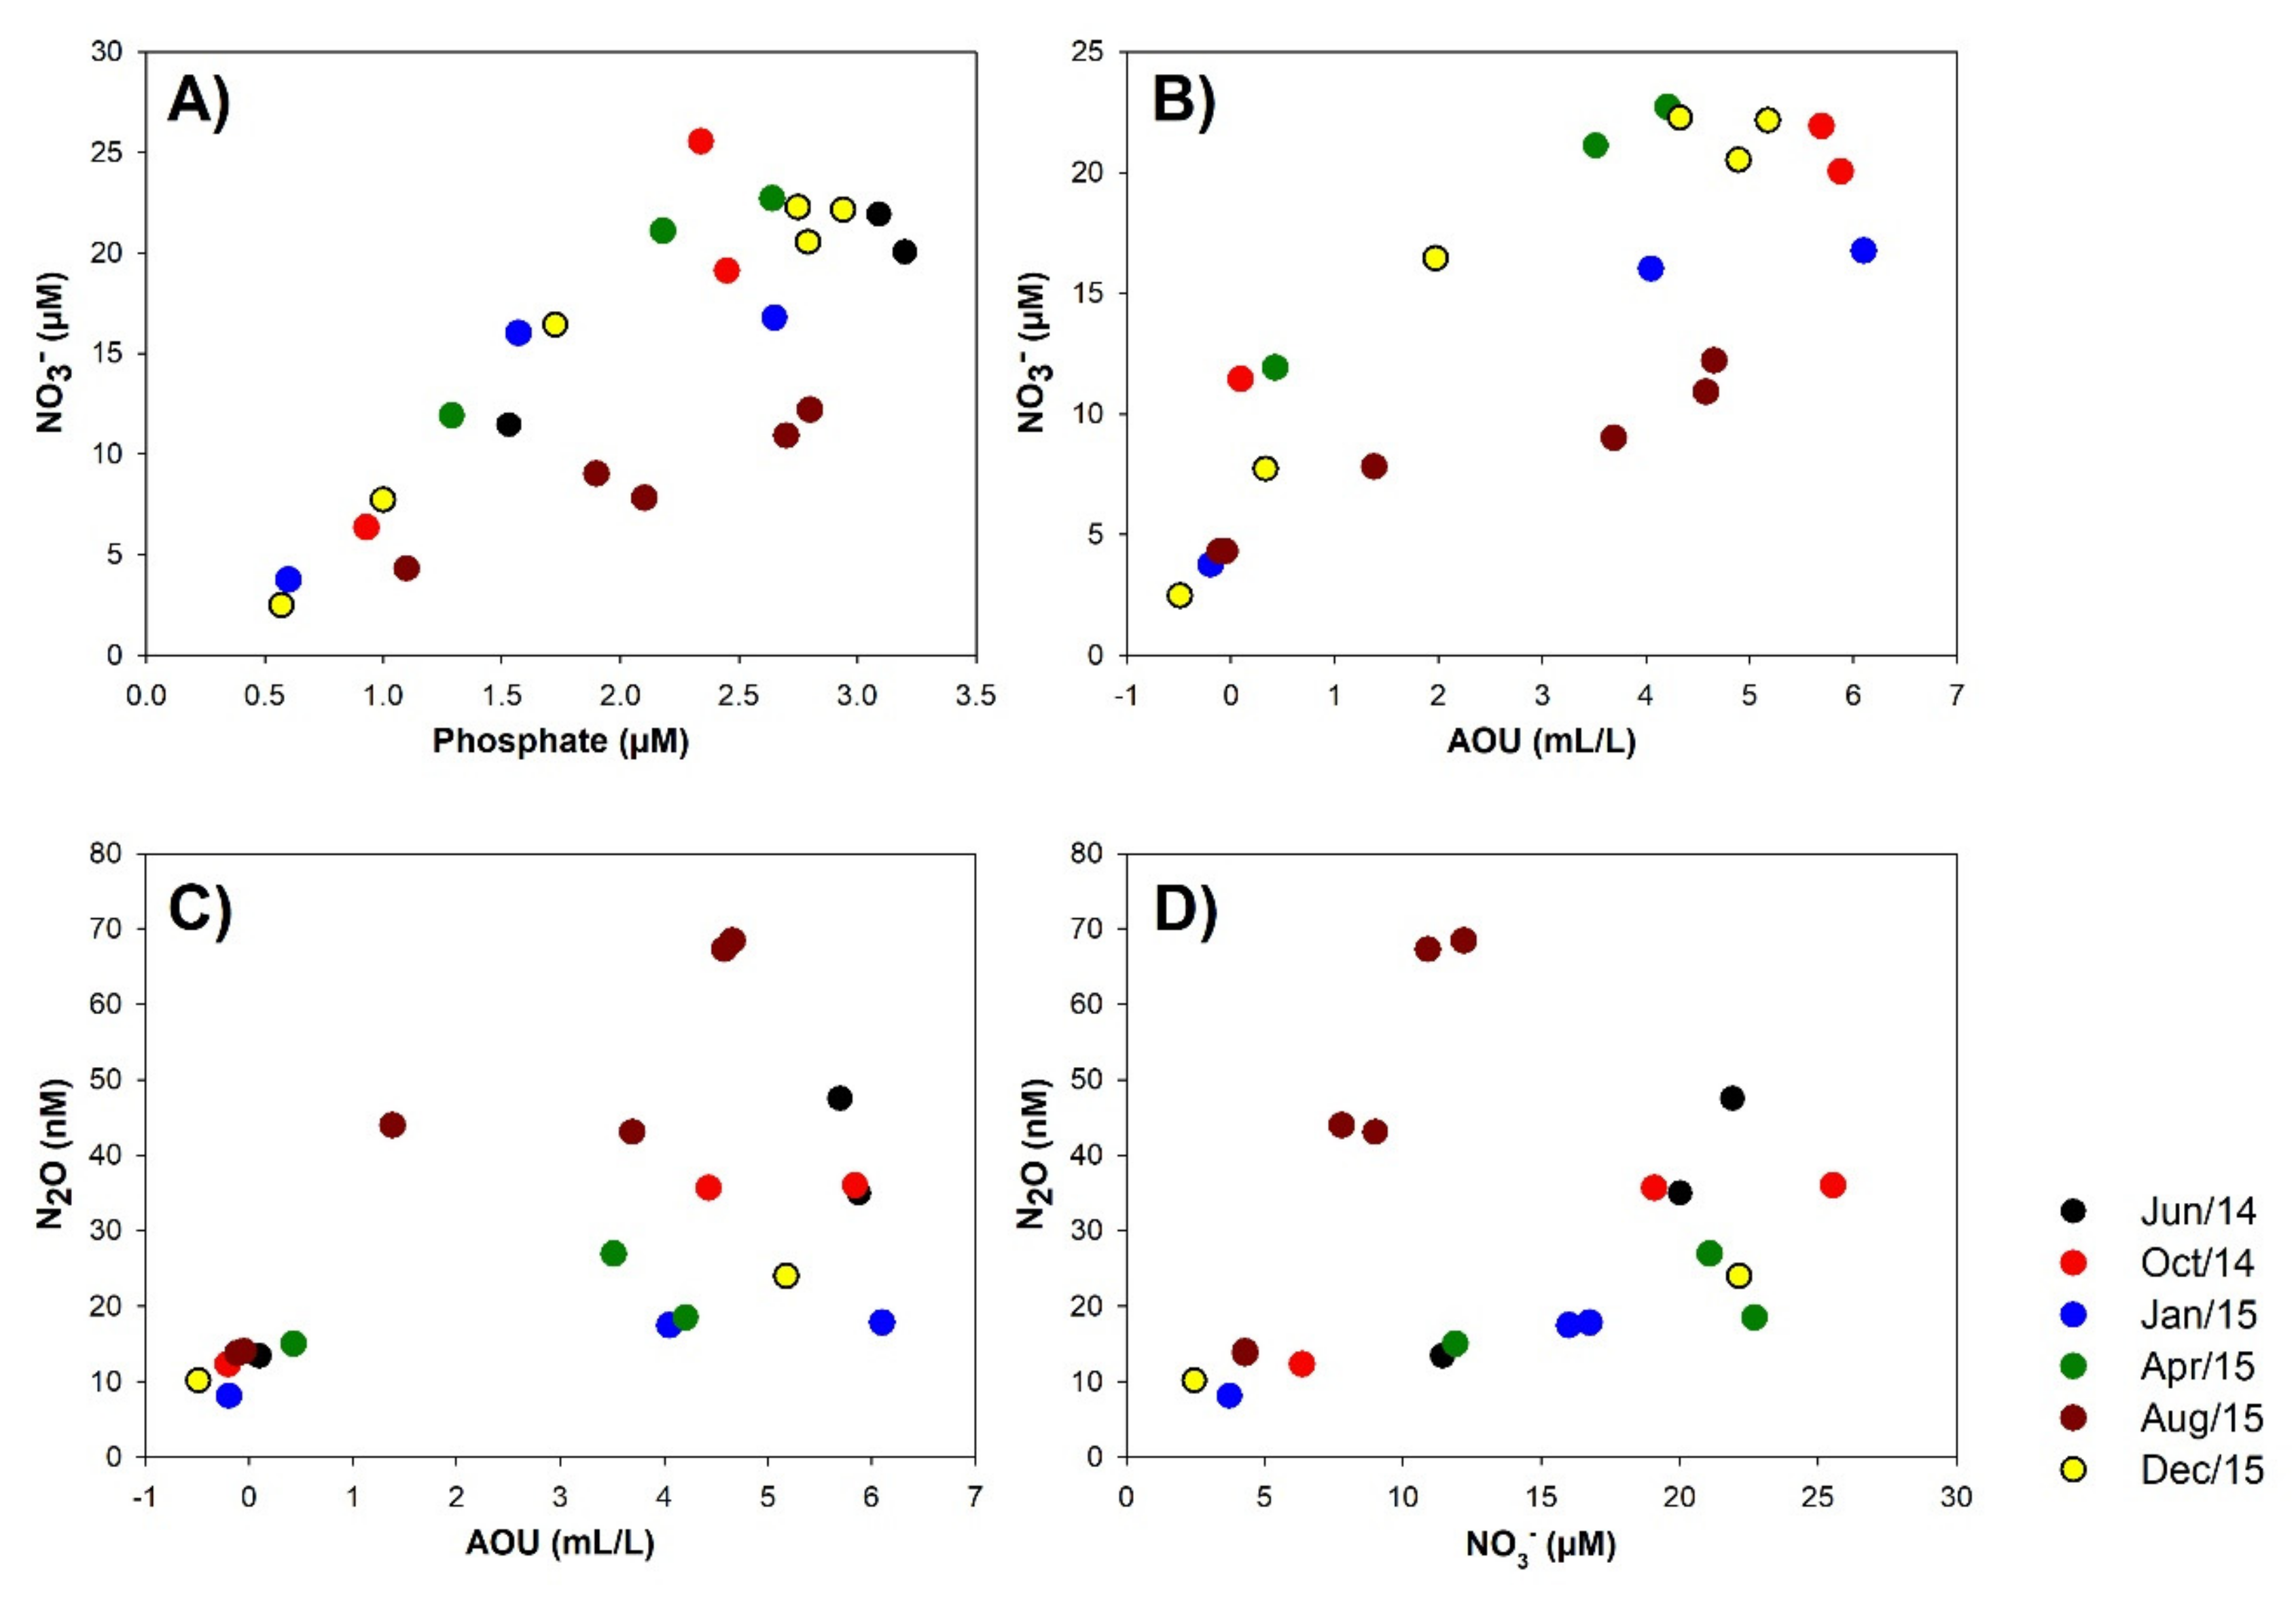
3.2. Biogeochemical Conditions in the Water Column

The water column biogeochemical conditions are shown in Figure 3. High nitrate (>20 µM) and phosphate (>2.5 μM) were predominant mostly during 2014 in subsurface waters (>15 m), whereas 2015 sampling periods presented high values restricted to the bottom waters during December. Lower nutrient concentrations were observed between April and August 2015. These latter months were also characterized by higher nitrite and ammonium concentration in subsurface and bottom waters, supporting a potential enhancement of remineralization in the water column.
Greenhouse distribution in the water column is present in Figure S5. Nitrous oxide presented a higher concentration at the oxyclines and deep subsurface waters during August and December 2015. Carbon dioxide presented higher concentration in bottom waters, whereas low methane concentrations were detected throughout the water column. The apparent oxygen utilization (AOU) was estimated using the difference between the expected oxygen saturation in the water, based on salinity and temperature, and the observed oxygen concentration (Figure 3). The AOU determination indicates a higher organic matter respiration potential during 2014 in comparison with the 2015 sampling months, in particular during late fall (April). In addition, nitrate and phosphate relationships were estimated to evaluate potential shifts from Redfield ratio ~16:1 and potential nitrogen loss processes based on N* Nitrogen deficit (Figure 3 and Figure 4). During August 2015, low N/P and N* were determined in subsurface waters. Negative N* values are associated with anaerobic processes such as denitrification and anammox [46,47], and both nitrogen loss processes are known to be active in the eastern South Pacific (ESP) as well as in the central-south coastal upwelling areas [17,48,49] and other oxygen-deficient regions [15,50]. Moreover, the nitrous oxide emissions contribute to nitrogen loss from the ocean, associated with intermediate products of denitrification and of aerobic ammonia oxidation [51]. The contribution of aerobic ammonia oxidation, the first step of nitrification, can be inferred from the relationship between nitrous oxide and AOU and nitrate [52]. In our study, nitrous oxide presented a positive relationship with nitrate and AOU, and nitrate was also positively related to AOU (Figure 4, Table S2).
The slope of the relationships varied in the different sampled months which was more evident during August for N2O vs. AOU (11 versus 2.85–10.02, R2 > 0.74) and N2O vs. nitrate (8.02 versus 1.35–3.38, R2 > 0.71). The positive relationship between nitrous oxide and nitrate with AOU (Table S2) indicate the predominance of nitrification as a source of nitrous oxide associated with more oxygenated waters. However, partial denitrification could also be active in high nitrate and low oxygen concentration ESSW (Figure 4). Our results were supported by nitrous oxide spatiotemporal dynamics in the upwelling area time series off Concepción (Centro de Investigación Oceanográfica en el Pacífico Sur-Oriental, COPAS time series) situated at central-southern Chile [3,4].

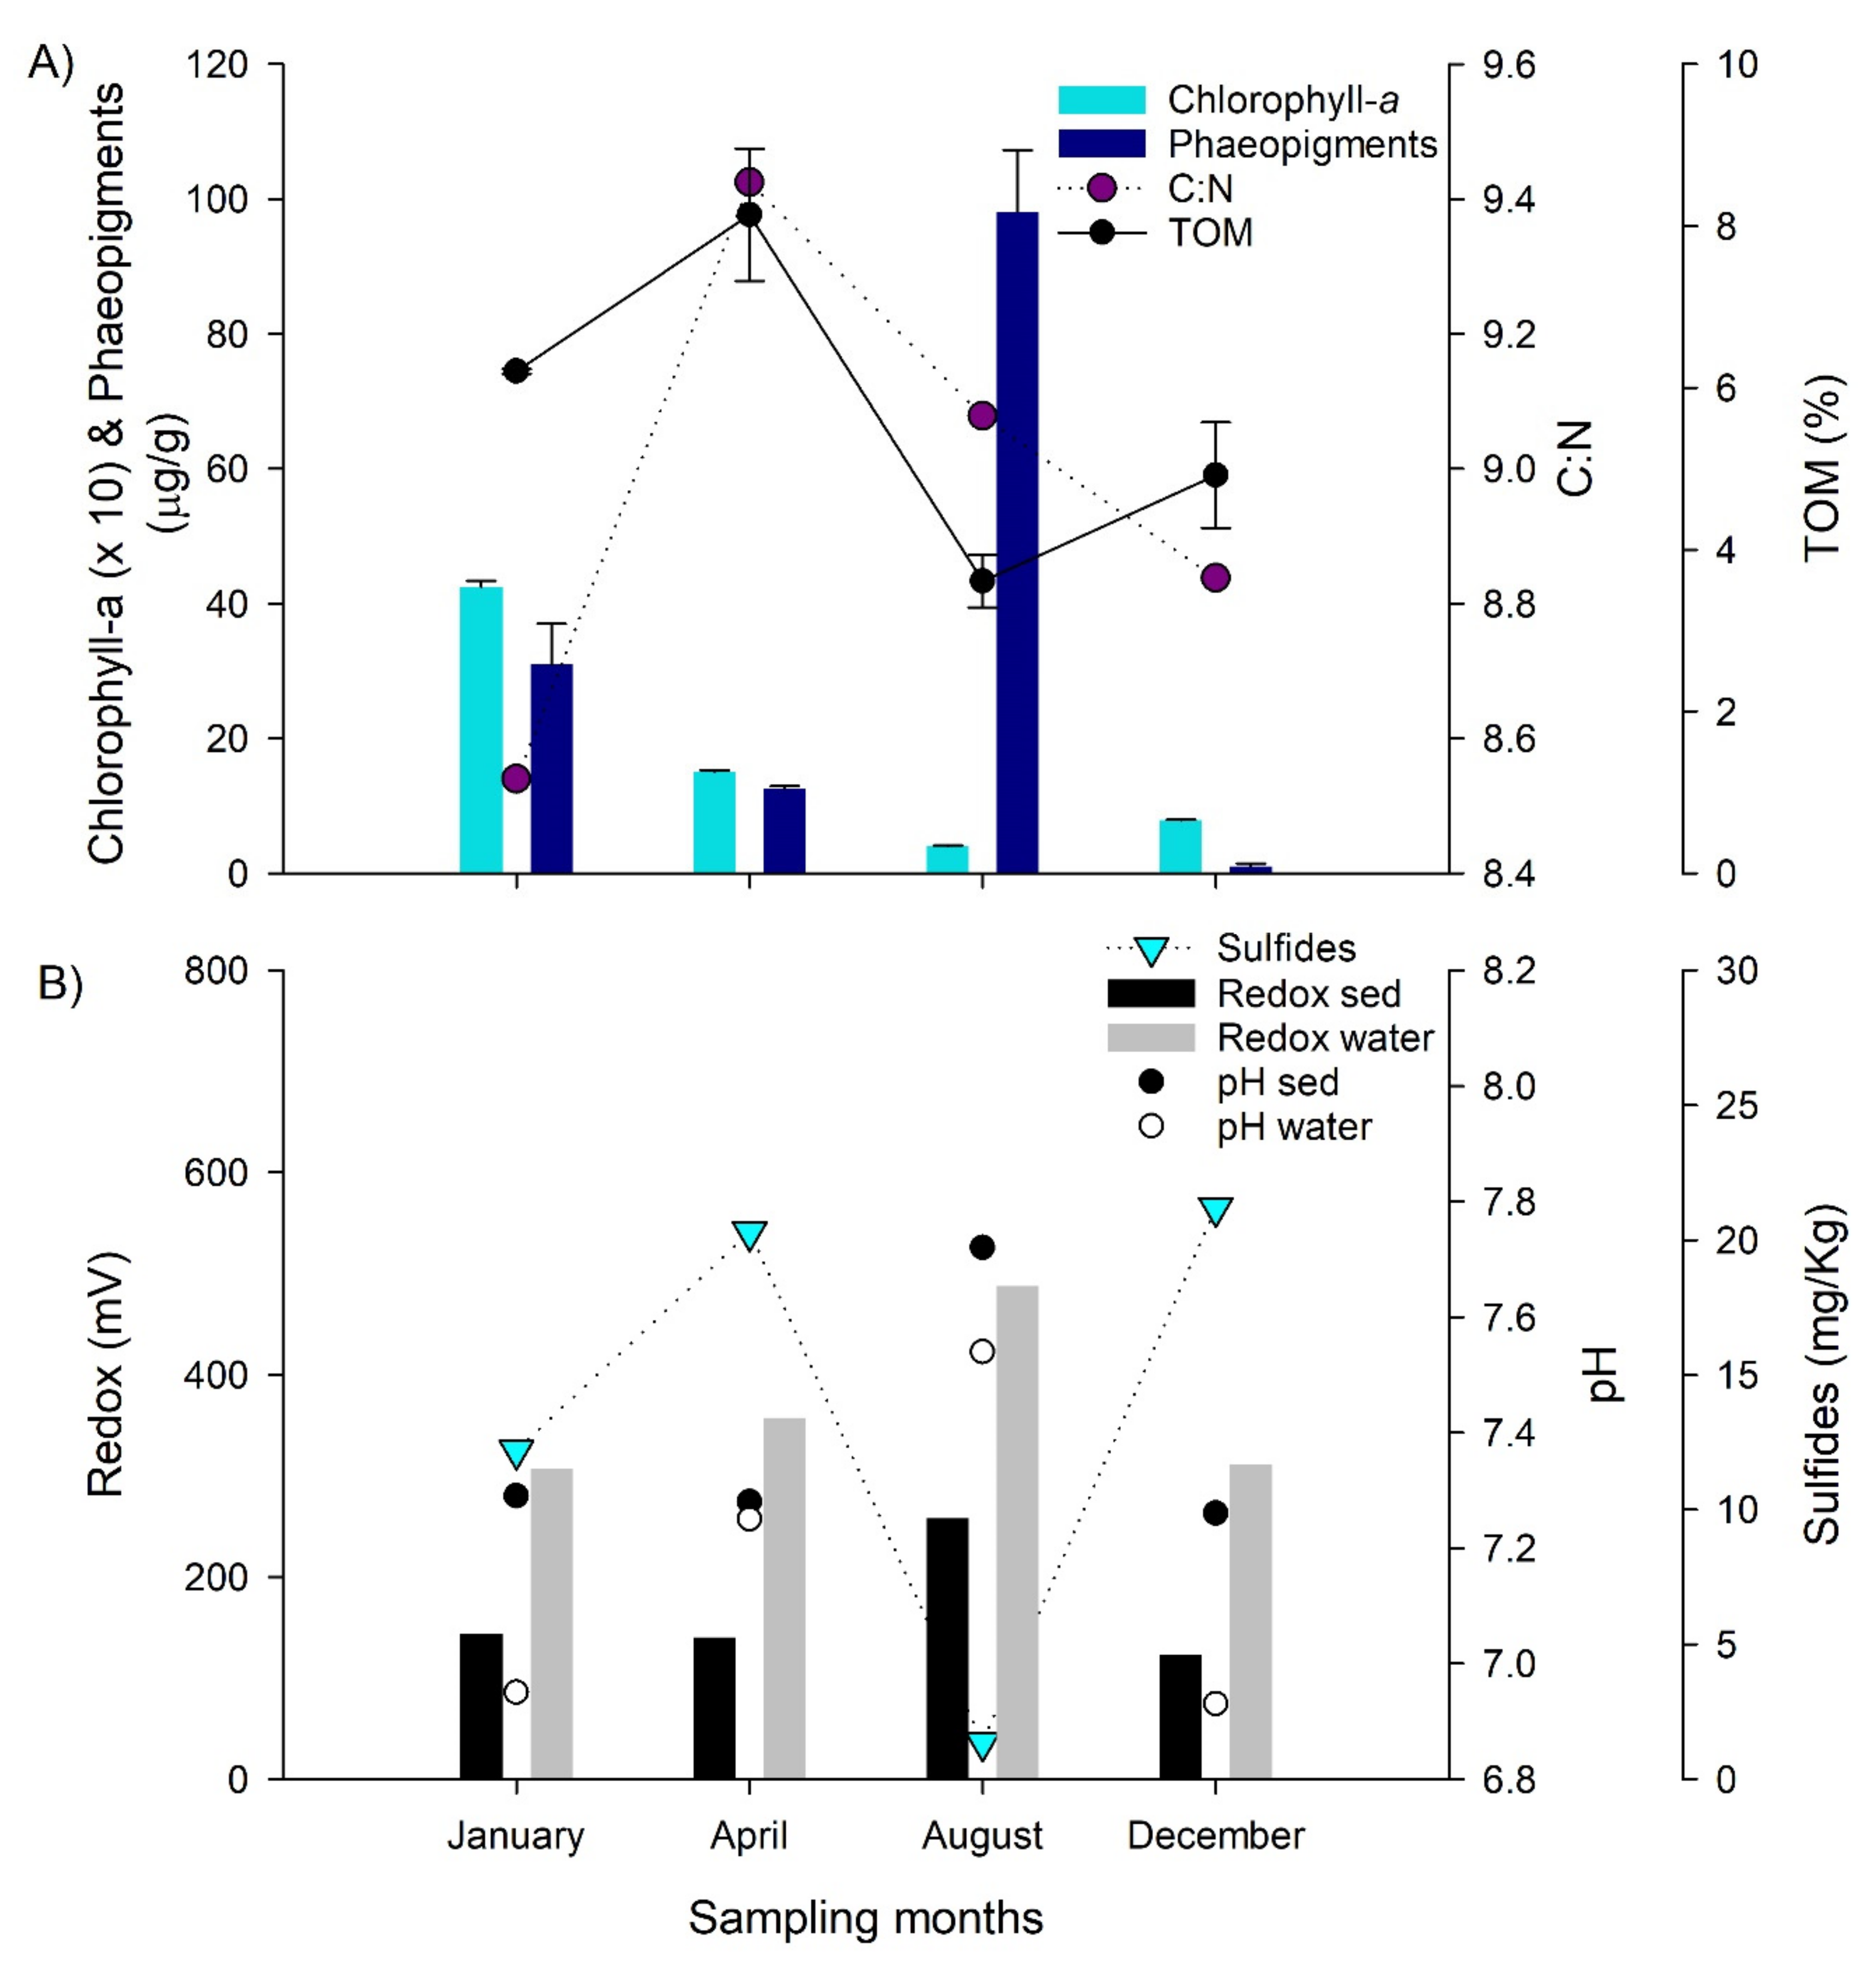
3.3. Sediment Conditions during the Selected Months

The sediments of the study area were mainly muddy (60%–67%) and characterized by high organic matter content (TOM 6%–8%) during January and April; meanwhile, low values (TOM < 4.9%) during the following months were registered (Figure 5, Table S3 Supplementary Material). In addition, a decrease in the %TOM associated with shifts in the organic matter composition was observed characterized by low C:N values in summer (<8.8, January and December) in comparison with the other months (Figure 5A). Total nitrogen varied between 23.74–33.89, showing higher values during April (Table S3). A decrease in the chlorophyll-a content was observed from January towards December (Figure 5A). In contrast, phaeopigments were variable and increased towards the last months sampled, having a maximum during winter (August). Higher redox and pH values, and lower total sulfides were observed during the winter months, and parameters were associated with organic matter composition (Figure 5B).
The carbon and nitrogen stable isotopes composition of the sediment ranged between −24.45–−23.85 for δ13C and between 6.59–6.88 for δ15N (Table S3). These isotopic signals were consistent with those values reported in other sites in central Chile [53], suggesting an important contribution of marine organic matter derived from primary production. Indeed, the higher δ15N values in August and lower values in January (Table S3) could be associated with sediment transport and the resuspension process of organic matter in coastal areas [54]. It is important to mention that the sedimentary conditions were highly variable during the study period considering oceanographic condition changes. Previous reports in the study area indicate a strong relationship between the food supply from primary production and the physical properties of the seafloor structuring the macrobenthos biodiversity and distribution [26]. Chlorophyll-a, used as a proxy for fresh organic matter content versus phaeopigments as an indicator of degradation products [55], indicate that January and April presented higher, and fresher, organic matter content, in comparison with the other months. The C:N values determined during our study were lower (<9.5) than previously reported for the same study area during 2013 (>10.9, [25]), suggesting a slightly higher lability during 2015. Total sulfide indicates that the potential of sulfate reduction, the predominant microbial remineralization process in marine sediments [56], was active during our sampling time, but its potential accumulation decreased during August. This latter month presented a higher oxygenation and greater redox potential suggesting an increase in aerobic remineralization processes and a potential bioturbation [34]. On the other hand, the δ13C and δ15N signatures indicate that during August a higher contribution of allochthonous material (terrigenous), more typical of shore stations closer to Aconcagua river discharge areas, are expected according with previous studies [25,53]. During August, the distinct isotopic signal in the sediments could be accounted for by modified oceanographic conditions on the water column and bottom due to the occurrence of meteo-tsunamis recorded 0n the coast of central Chile [45].

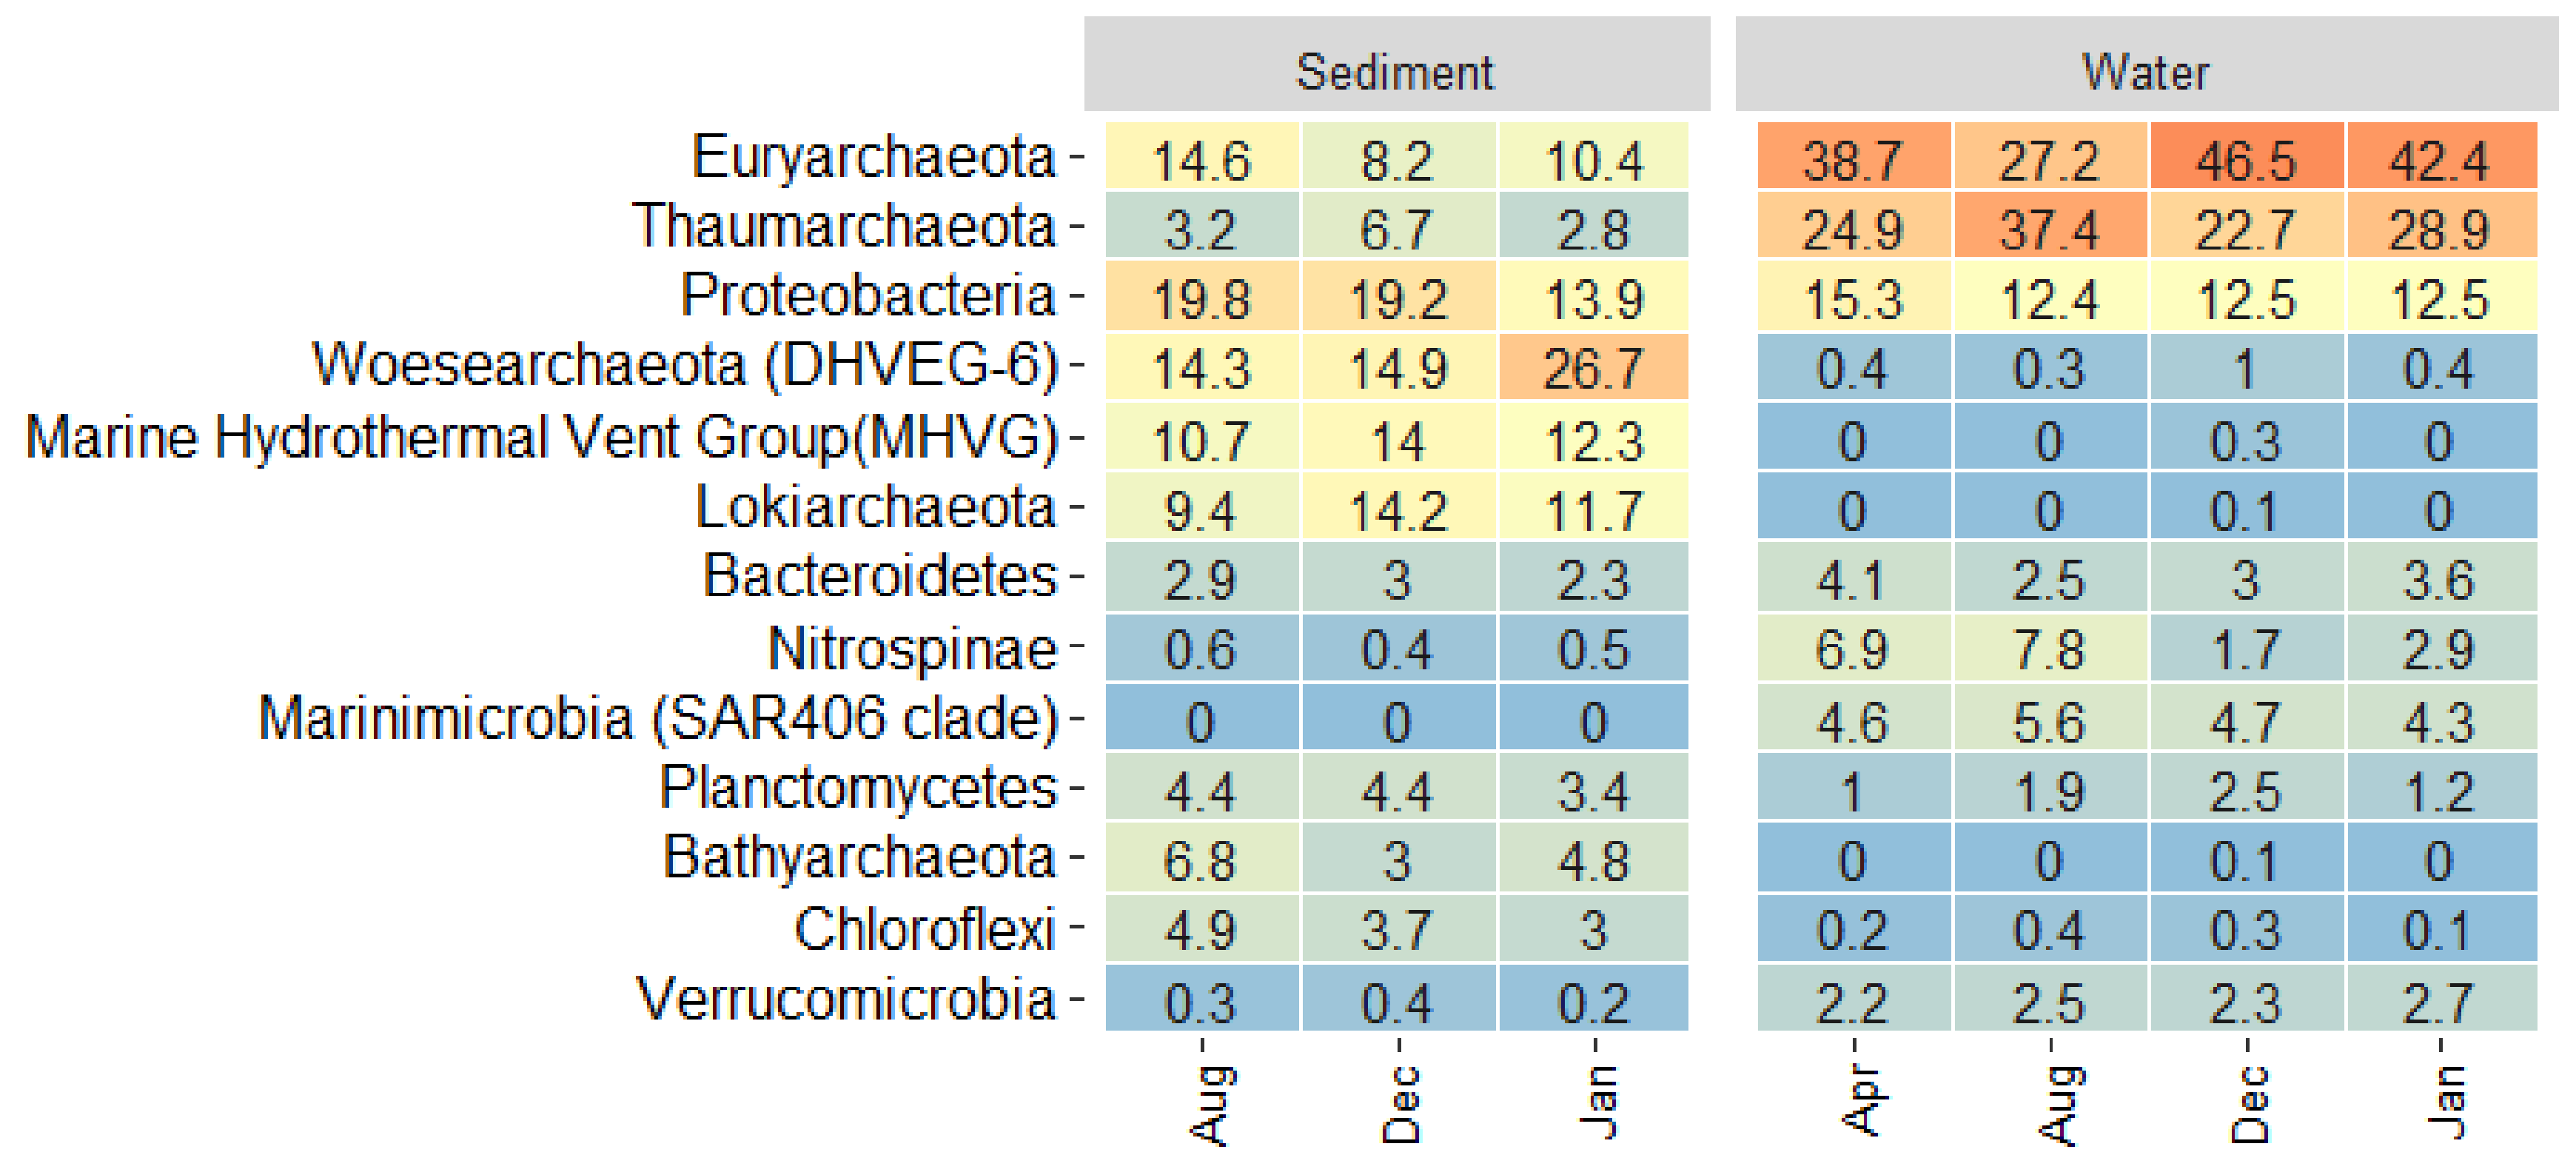
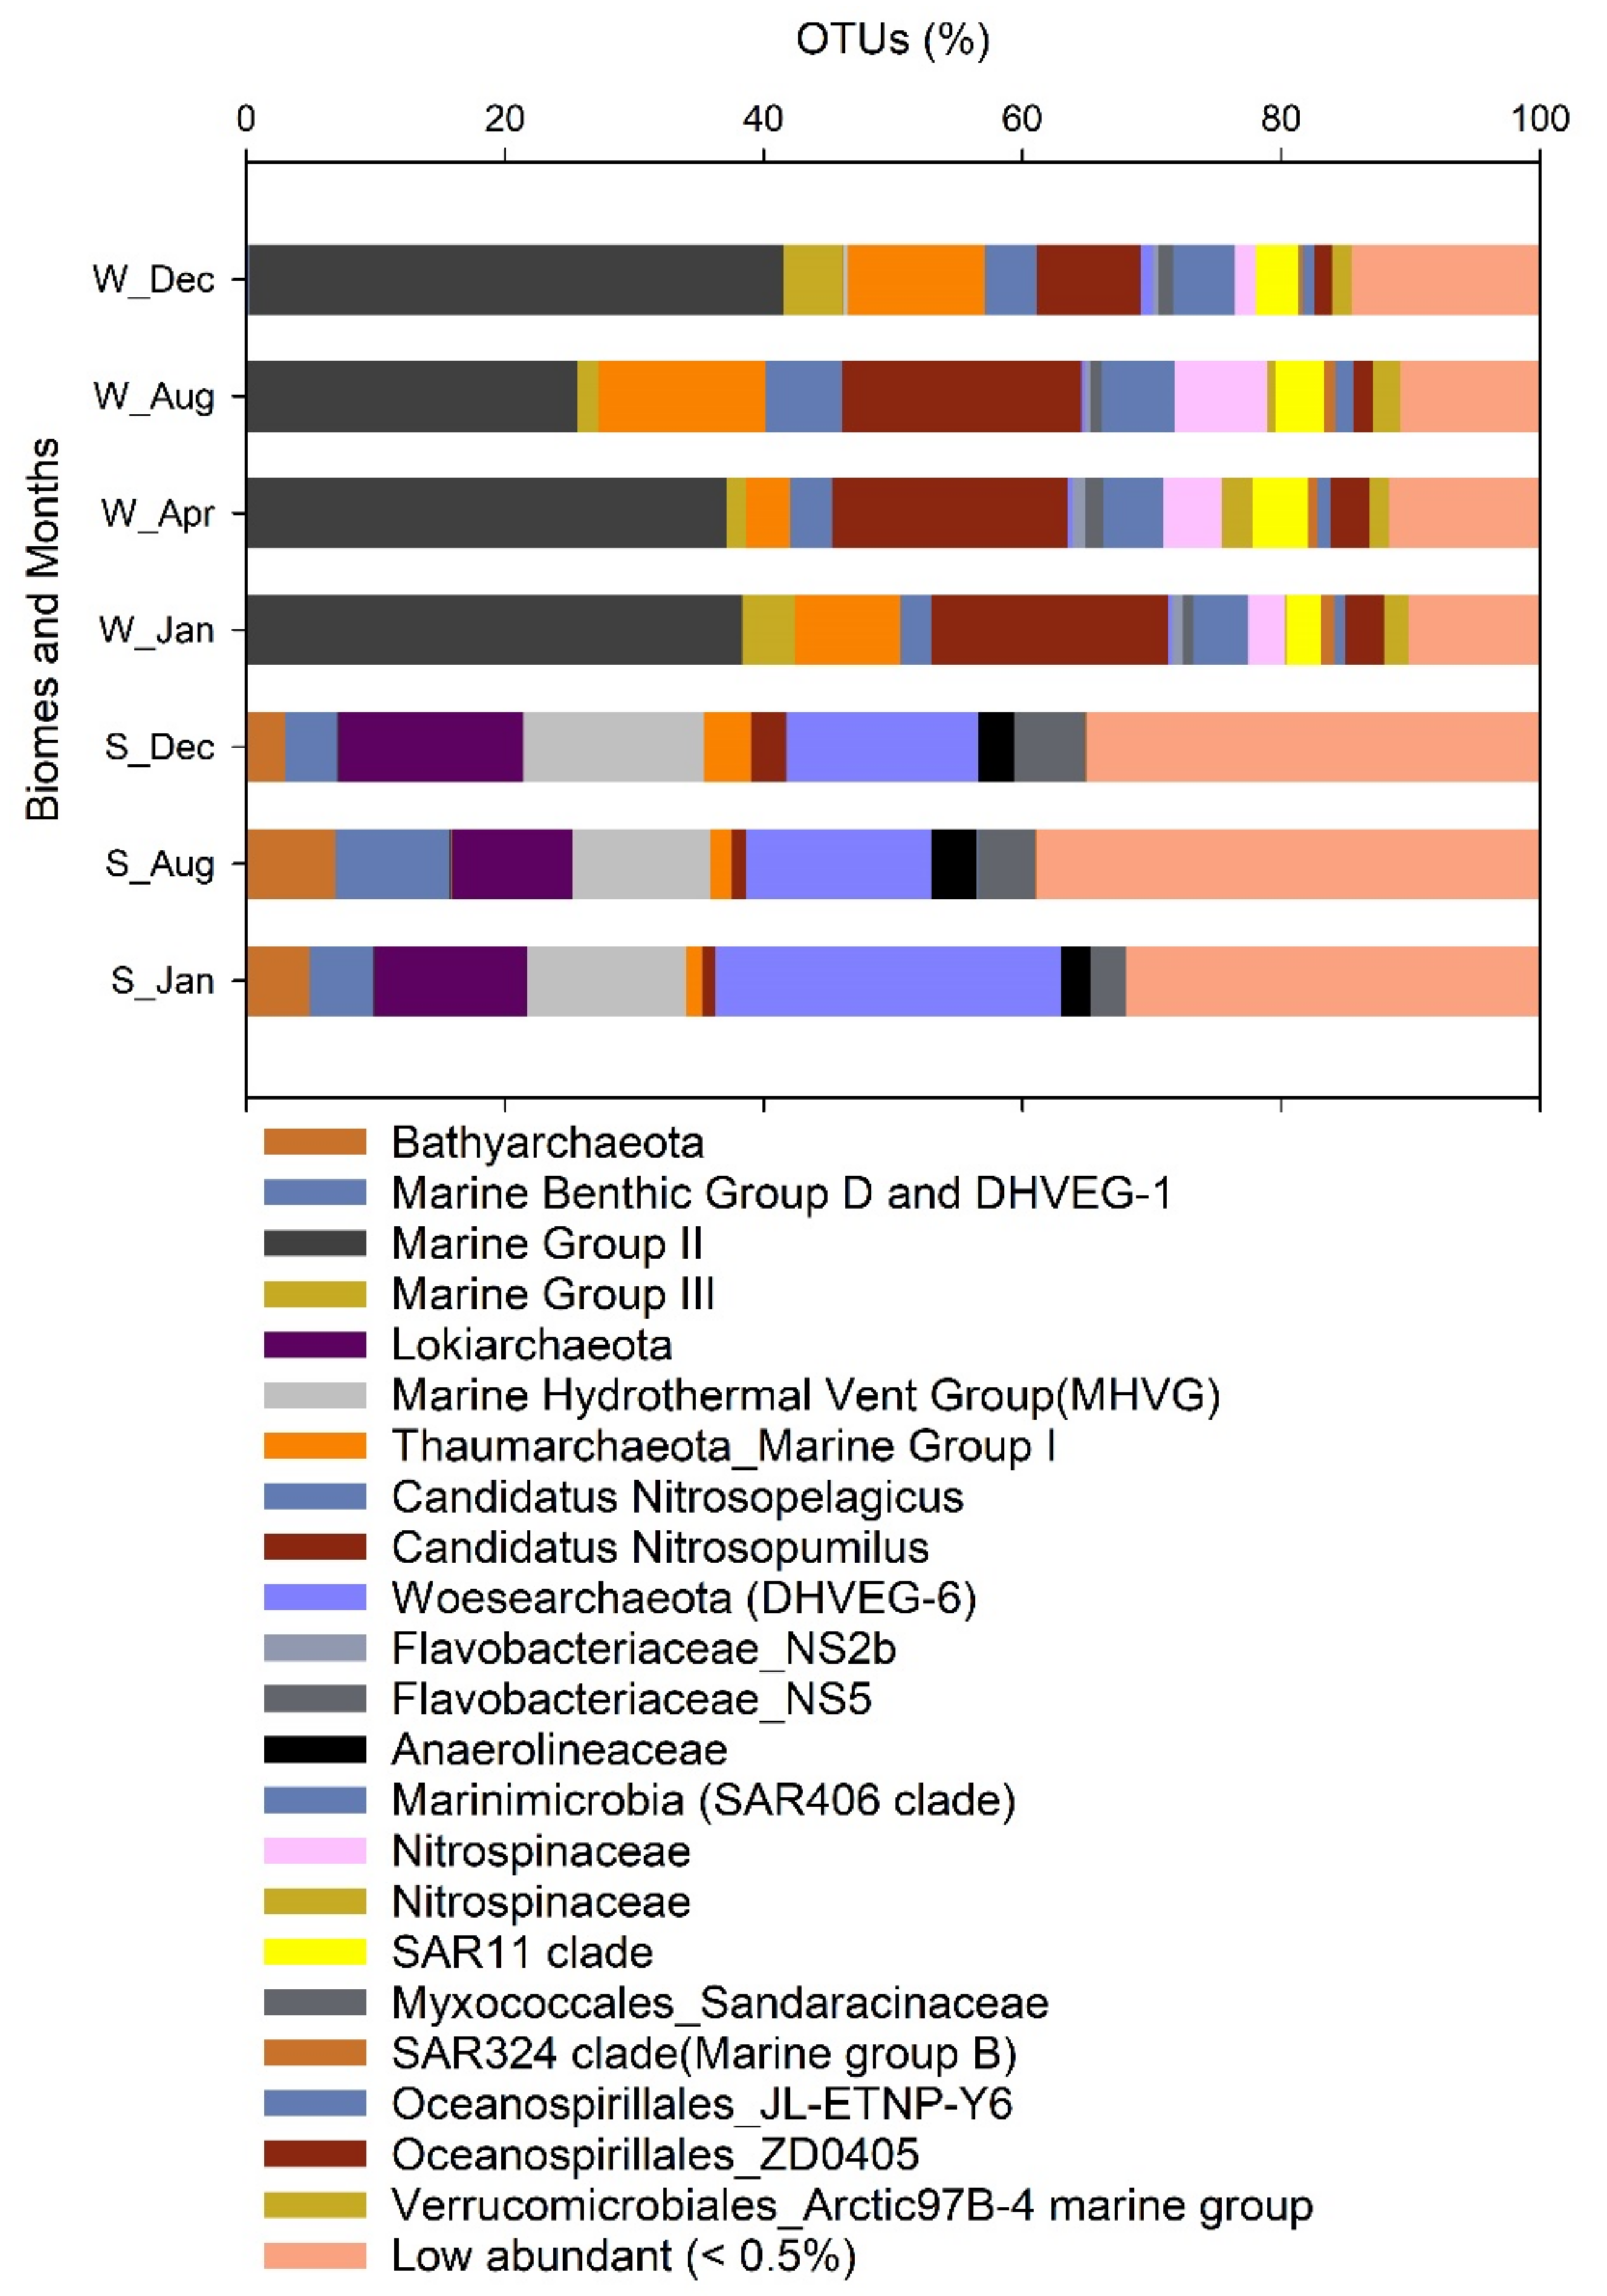
3.4. Microbial Community Dynamics in the Different Biomes

Amplicon 16S rRNA sequencing results indicate that sediments were characterized by a rich and diverse microbial community in comparison with bottom water (Table S4), especially during January and December (upwelling period). Rarefaction curves indicate that a higher richness was expected in the sediments, since a plateau was not reached in our sequence results (Figure S6A). In general, most of the microbial communities present in the surface sediments were active in the bottom water since >90.7% OTUs were shared in both biomes (Figure S6B), indicating a significant bottom boundary layer exchange. A total of 64 phyla were detected, but only 52 were distributed in more than three months and were listed according to SILVA 132 classification (Table S4). A heatmap analyses helped us to visualize the top abundant phyla that were variable in the different biomes and sampling months (Figure 6). Moreover, the specific high frequent OTUs are plotted in Figure 7.
The Marine Group II, currently affiliated within the order Ca. Poseidoniales, accounted for 25% of the total reads and was predominant during January and December (>42.4%, Figure 6). Putative ammonia oxidizing archaea related to Ca. Nitrosopumilus and Ca. Nitrosopelagicus from the order Nitrosophaerales contributed 22% of the total reads and were enriched in the water mainly during August, representative of winter (Figure 6). These predominant archaeal taxa were comparable with other marine areas globally, characterized by the abundant Ca. Poseidoniales known as a key heterotrophic order that peaks following phytoplankton blooms, and by Nitrosophaerales as putative relevant ammonia oxidizers in the ocean [14]. For example, our results agreed with Tara ocean metagenomic expedition reports showing the ubiquity of these group and the high frequency of Ca. Poseidoniales supported by its genetic versatility, including its ability to harvest light [57]. SIMPER analyses indicate that many archaeal OTUs, specially associated with putative ammonia oxidizers, were favored during April and August linked to non-upwelling period (Table S5).
On the other hand, Proteobacteria was the predominant phylum of the bacteria domain (Table S4), and was characterized by 17 classes with Gammaproteobacteria, Deltaproteobacteria and Alphaproteobacteria dominant in terms of sequences (Figure S7A). Uncultured Proteobacteria associated with single OTUs presented a significant contribution in the different biomes (Figure S7B). Many of these taxa, corresponded to cosmopolitan marine pelagic microbial groups, like SAR11 (Ca. Pelagibacter), ZD0405 and SAR86 (Oceanospirillales), and Marine Group B (SAR324). The SIMPER analyses indicate that these groups contributed greatly. mainly during the non-upwelling period (Table S5), supporting previous reports of longer historical time series studies such as at the North Sea, during winter [58], or oligotrophic conditions in different marine areas, such as The Bermuda Atlantic Time-series Study (BATS) and The San Pedro Ocean Time-series (SPOT) (reviewed in [59]).
In general, our predominant bottom water microbial groups were comparable with assemblages associated with SPOT deeper waters (>150 m depth), e.g., Thaumarchaeota, Marine Group A, SAR86 (Oceanospirillales), Nitrospina spp [59,60]. On the other hand, our results support other relevant functional microbial groups typically found in the OMZ of the Eastern South Pacific (ESP) [61,62], such as sulfur oxidizing bacteria from the SUP05 cluster (Figure S7B) and the anaerobic ammonia oxidizers (anammox bacteria) Ca. Scalindua, (Figure S8). In addition, Deltaproteobacteria OTU sva0081 (Desulfobacterales) presented a high number of reads in the sediment (Figure S7B). These marine bacteria are a H2 oxidizer key functional group of anaerobic organic matter degradation in marine sediment [63], known for rapid growth under micro-aerophilic conditions [64]. In our study, Desulfobacterales were characterized by various OTUs (22) and is an order known to be enriched during low-oxygen conditions further south in the ESP area off Concepción [16]. Besides hydrogenotrophic, other bacteria of this order are sulfate reducers [65], a significant remineralization process in marine sediments [56,61].

3.5. Nitrifying Microbial Groups and Their Predominance in the Bottom Water during Non-Upwelling

Keystone microorganisms associated with nitrogen cycling, such as putative archaea ammonia oxidizers (Ca. Nitrosopumilus, Ca. Nitrosopelagicus, and others) and Nitrite oxidizers affiliated with Nitrospina spp. presented a higher contribution in the water biome, and during non-upwelling conditions based in SIMPER analyses (Table S5, Figure 7 and Figure S8). The specific quantification of active putative ammonia oxidizers associated with Nitrosupumilus-like and βAOB, and the nitrite oxidizers Nitrospina-like (RT-qPCR amoA and 16S rRNA genes, respectively) supports the results based on amplicon 16S rRNA sequencing. Higher RT-qPCR counts indicate that the nitrifying functional groups presented a higher activity during the non-upwelling period, i.e., April and August, in comparison with the upwelling period January and December (Figure 8).
In addition, the greater activities determined during April are consistent with the increment of oxygen (Figure 5) and ammonium concentration in bottom waters (Figure 8). Nitrospina-like was the most active nitrifying microbial group followed by Nitrosupumilus-like and then βAOB, as observed in the time series upwelling area off Concepción in the ESP [18,44]. Nitrospina spp. was considered as a key marine microbial group usually associated with putative ammonia oxidizing archaea in network analyses in the coastal ocean water column, such as Monterey Bay [66,67]. Moreover, both functional groups are known to be active at extremely low oxygen concentration in deep waters of the ESP upwelling area off Concepción [68].
Besides the biogeochemical contribution of specific microbial taxa, the benthic boundary layer microbial communities have a relevant ecological interaction with benthic fauna, such as meiofauna (>18 µm and <1 mm), which are widespread in marine sediments around the world [69]. Meiofauna are dominated by free-living nematodes usually grazing on microorganisms and reported to influence organic matter remineralization processes and benthic bacteria composition [70]. These communities have been reported in high abundances in the study area [25], showing a variability controlled by organic matter content and oxygen availability [19]. Bioturbation by meiofauna and macrofauna could drive benthic microbial processes changes associated with nitrification, denitrification, and the contribution of greenhouse gas production [71]. Oxygenation could have profound changes in the benthic boundary layer conditions and benthic fauna responses.
The influence of environmental conditions on the active bottom water microbial community structure were explored using Principal Coordinated Analyses (PCoA, Figure 9).
The PCoA analyses indicate that the bottom water active microbial community variability at OTU level was differentiated during our sampling months. This is evident in the PCO1 axes, accounting for 57.6% of the variability. Bottom water temperature and δ15N signature in the sediment were the variables having a greater correlation with the microbial community variability represented by the PCO1 and PCO2 axes, respectively (Table S6). Moreover, temperature was a significant (p = 0.04) explanatory variable of the variability based on DistLM (Table S7). Other variables showing correlation with changes in the microbial community structure, were organic matter composition and remineralization indicator parameters, such as organic matter % and chlorophyll in the sediments, particulate organic carbon in the water, and remineralization conditions such as redox (Table S5). Our results are consistent with previously published results indicating that temperature was a predominant explanatory variable influencing microbial community structure [60].

4. Conclusions

The coastal area of the eastern South Pacific presented highly dynamic oceanographic conditions that influenced the water column and sediment biogeochemistry during El Niño 2015. Benthic boundary layer microbial communities and their contribution to organic matter remineralization were seasonally variable, favoring aerobic groups such as nitrifying assemblages during fall and winter, related to positive redox conditions. The stimulation of nitrification could also be evidenced in the water column resulting in the accumulation of nitrous oxide, a potent greenhouse gas. Further studies are needed in coastal areas to determine regulatory factors of marine microbiome biodiversity and their resulting contribution to biogeochemical cycles and benthic ecology during warm and cold phases of El Niño.

Supplementary Materials

The following are available online at https://www.mdpi.com/2073-4441/13/2/180/s1, Figure S1. Map of the study area., Figure S2: Sea surface temperature (SST) plotted together with the Oceanic Niño Index (ONI), Figure S3: Chlorophyll-a analyses based on satellite images and detected biomass in-situ during our time series, Figure S4: Aconcagua river discharge monthly average, Figure S5: Greenhouse gases distribution in the water column, Figure S6: (A) Rarefaction curves determined for the different biomes and sampling periods. (B) Venn Diagrams showing the core microbial community based on OTUs predominant in both the sediment and water, Figure S7: (A) Heatmap analyses showing specific Proteobacteria phyla. (B) Boxplot showing OTUs shifts in their contribution to the different biomes, considering different samplings as replicates. Figure S8: Specific boxplot analyses associated with the contribution of known nitrogen cycling microorganisms. Supplementary Material (Table S1: General conditions in the water column and biogeochemical conditions at the surface and bottom waters, Table S2: Spearman rank correlation analyses of the environmental variables. Significant correlations (p < 0.05) were depicted (pink positive, green negative), Table S3: Specific analyses associated with sediment conditions studied during 2015., Table S4: Table S4. Alpha diversity analyses associated with the 16S rRNA sequencing reads, ENA experiment ID and Archaea and Bacteria phyla (% associated with each domain)., Table S5: Similarity Percentages-species contributions (SIMPER) analyses associated with the 16S rRNA gene iTag sequencing reads using different categorical factors, Table S6: Variables correlations (Pearson) associated with the first axes of the Principal Coordinate Analyses derived from OTUs Bray Curtis similarity, Table S7: Distance based linear models (DistLM) results based on pelagic microbial community OTUs).

Author Contributions

Conceptualization, V.M., M.C.-D. and E.H.S.; methodology, E.Q., G.A., D.S., N.S. and C.A.; writing—original draft preparation, V.M., and M.C.-D.; writing—review and editing, E.H.S. and E.Q.; funding acquisition, V.M., M.C.-D. and E.H.S. All authors have read and agreed to the published version of the manuscript.

Funding

This research was funded by the following grants Project PIA 037.474/2015 (PUCV), FONDECYT 11121487, FONDECYT 1171324, FONDECYT 11130418.

Institutional Review Board Statement

Not applicable.

Informed Consent Statement

Not applicable.

Data Availability Statement

The data presented in this study are available in the Supplementary Materials listed above and on request from the corresponding author.

Acknowledgments

We are grateful for the Normita II crew and Francisco Gallardo for their help during sampling and field work support. We acknowledge the lab assistance of Carlos Pineda for CTD data processing, Hermann Peña for molecular analyses, Fernando Jimenez for grain size processing and Paola Reinoso for nutrient determinations.

Conflicts of Interest

The authors declare no conflict of interest. The funders had no role in the design of the study; in the collection, analyses, or interpretation of data; in the writing of the manuscript, or in the decision to publish the results.

References

  1. Strub, P.T.; Mesías, I.; Montecino, V.; Rutllant, I.; Salinas, S. Coastal circulation off western South America. In The Sea; Robinson, A.R., Brink, K.H., Eds.; Wiley: New York, NY, USA, 1998. [Google Scholar]
  2. Bertagnolli, A.D.; Stewart, F.J. Microbial niches in marine oxygen minimum zones. Nat. Rev. Microbiol. 2018, 16, 723–729. [Google Scholar] [CrossRef] [PubMed]
  3. Cornejo, M.; Farías, L.; Gallegos, M. Seasonal cycle of N2O vertical distribution and air–sea fluxes over the continental shelf waters off central Chile (∼36° S). Prog. Oceanogr. 2007, 75, 383–395. [Google Scholar] [CrossRef]
  4. Farías, L.; Besoain, V.; García, L.S. Presence of nitrous oxide hotspots in the coastal upwelling area off central Chile: An analysis of temporal variability based on ten years of a biogeochemical time series. Environ. Res. Lett. 2015, 10, 044017. [Google Scholar]
  5. Oerder, V.; Bento, J.P.; Morales, C.E.; Hormazabal, S.; Pizarro, O. Coastal Upwelling Front Detection off Central Chile (36.5–37° S) and Spatio-Temporal Variability of Frontal Characteristics. Remote Sens. 2018, 10, 690. [Google Scholar] [CrossRef] [Green Version]
  6. Fuenzalida, R.; Schneider, W.; Garcés-Vargas, J.; Bravo, L.; Lange, C. Vertical and horizontal extension of the oxygen minimum zone in the eastern South Pacific Ocean. Deep Sea Res. Part II Top. Stud. Oceanogr. 2009, 56, 992–1003. [Google Scholar] [CrossRef]
  7. Ulloa, O.; Escribano, R.; Hormazabal, S.; Quiñones, R.A.; González, R.R.; Ramos, M. Evolution and biological effects of the 1997–98 El Niño in the upwelling ecosystem off northern Chile. Geophys. Res. Lett. 2001, 28, 1591–1594. [Google Scholar] [CrossRef]
  8. Santoso, A.; Phaden, M.J.; Cai, W. The Defining Characteristics of ENSO Extremes and the Strong 2015/2016 El Niño. Rev. Geophys. 2017, 55, 1079–1129. [Google Scholar] [CrossRef]
  9. Graco, M.; Correa, D.; García, W.; Sarmiento, M. Impactos del ENSO en la biogeoquímica del sistema de afloramiento frente a Perú central, febrero 2013-diciembre 2015. In Boletin Trimestral Oceanografico; Instituto del Mar del Perú: Callao District, Peru, 2016; Volume 2, pp. 2–6. [Google Scholar]
  10. Anabalón, V.; Morales, C.E.; González, H.E.; Menschel, E.; Schneider, W.; Hormazabal, S.; Valencia, L.; Escribano, R. Micro-phytoplankton community structure in the coastal upwelling zone off Concepción (central Chile): Annual and inter-annual fluctuations in a highly dynamic environment. Prog. Oceanogr. 2016, 149, 174–188. [Google Scholar] [CrossRef] [Green Version]
  11. Aparicio, R.P.; Masotti, I. Inter-annual variability of oceanographic conditions and phytoplankton in Valparaíso Bay (~33°S), central Chile. Rev. Biol. Mar. Oceanogr. 2019, 54, 70–81. [Google Scholar] [CrossRef] [Green Version]
  12. Iriarte, J.L.; González, H.E. Primary Productivity and Biomass of Size-Fractionated Phytoplankton in an Upwelling Area, Bahía de Mejillones (23° S, Chile), during and after the 1997–1998 El Niño. Investig. Mar. 2002, 30, 114–115. [Google Scholar] [CrossRef]
  13. Löscher, C.R.; Kock, A.; Könneke, M.; LaRoche, J.; Bange, H.W.; Schmitz, R.A. Production of oceanic nitrous oxide by ammonia-oxidizing archaea. Biogeosciences 2012, 9, 2419–2429. [Google Scholar] [CrossRef] [Green Version]
  14. Santoro, A.E.; Buchwald, C.; Knapp, A.N.; Berelson, W.M.; Capone, D.G.; Casciotti, K.L. Nitrification and nitrous oxide production in the offshore waters of the Eastern Tropical South Pacific. Earth Space Sci. Open Arch. 2020, 35, e2020GB006716. [Google Scholar] [CrossRef]
  15. Frey, C.; Bange, H.W.; Achterberg, E.P.; Jayakumar, A.; Löscher, C.R.; Arévalo-Martínez, D.L.; León-Palmero, E.; Sun, M.; Sun, X.; Xie, R.C.; et al. Regulation of nitrous oxide production in low-oxygen waters off the coast of Peru. Biogeosciences 2020, 17, 2263–2287. [Google Scholar] [CrossRef] [Green Version]
  16. Aldunate, M.; De la Iglesia, R.; Bertagnolli, A.D.; Ulloa, O. Oxygen modulates bacterial community composition in the coastal upwelling waters off central Chile. Deep Sea Res. Part II Top. Stud. Oceanogr. 2018, 156, 68–79. [Google Scholar] [CrossRef]
  17. Galán, A.; Molina, V.; Belmar, L.; Ulloa, O. Temporal variability and phylogenetic characterization of planktonic anammox bacteria in the coastal upwelling ecosystem off central Chile. Prog. Oceanogr. 2012, 92, 110–120. [Google Scholar] [CrossRef]
  18. Molina, V.; Belmar, L.; Levipan, H.A.; Ramírez-Flandes, S.; Anguita, C.; Galán, A.; Montes, I.; Ulloa, O. Spatiotemporal Distribution of Key Pelagic Microbes in a Seasonal Oxygen-Deficient Coastal Upwelling System of the Eastern South Pacific Ocean. Front. Mar. Sci. 2020, 7, 795. [Google Scholar] [CrossRef]
  19. Neira, C.; Sellanes, J.; Soto, A.; Gutiérrez, D.; Gallardo, V.A. Meiofauna and sedimentary organic matter off Central Chile: Response to changes caused by the 1997–1998 El Niño. Oceanol. Acta 2001, 24, 313–328. [Google Scholar] [CrossRef] [Green Version]
  20. Sellanes, J.; Quiroga, E.; Neira, C.; Gutiérrez, D. Changes of macrobenthos composition under different ENSO cycle conditions on the continental shelf off central Chile. Cont. Shelf Res. 2007, 27, 1002–1016. [Google Scholar] [CrossRef]
  21. Schulz, H.N.; Strotmann, B.; Gallardo, V.A.; Jørgensen, B.B. Population study of the filamentous sulfur bacteria Thioploca spp. off the Bay of Concepción, Chile. Mar. Ecol. Prog. Ser. 2000, 200, 117–126. [Google Scholar] [CrossRef]
  22. Contreras, S.; Pantoja, S.; Neira, C.; Lange, C.B. Biogeochemistry of surface sediments off Concepción (∼36° S), Chile: El Niño vs. non-El Niño conditions. Prog. Oceanogr. 2007, 75, 576–585. [Google Scholar] [CrossRef]
  23. Srain, B.M.; Sobarzo, M.; Daneri, G.; González, H.E.; Testa, G.; Farías, L.; Schwarz, A.; Pérez, N.; Pantoja-Gutiérrez, S. Fermentation and Anaerobic Oxidation of Organic Carbon in the Oxygen Minimum Zone of the Upwelling Ecosystem Off Concepción, in Central Chile. Front. Mar. Sci. 2020, 7, 533. [Google Scholar] [CrossRef]
  24. Silva, N.; Rojas, N.; Fedele, A. Water masses in the Humboldt Current System: Properties, distribution, and the nitrate deficit as a chemical water mass tracer for Equatorial Subsurface Water off Chile. Deep Sea Res. Part II Top. Stud. Oceanogr. 2009, 56, 1004–1020. [Google Scholar] [CrossRef]
  25. Soto, E.; Caballero, W.; Quiroga, E. Composition and vertical distribution of metazoan meiofauna assemblages on the continental shelf off central Chile. Lat. Am. J. Aquat. Res. 2015, 43, 922–935. [Google Scholar]
  26. Soto, E.; Quiroga, E.; Ganga, B.; Alarcón, G. Influence of organic matter inputs and grain size on soft-bottom macrobenthic biodiversity in the upwelling ecosystem of central Chile. Mar. Biodivers. 2017, 47, 433–450. [Google Scholar] [CrossRef]
  27. Carpenter, J.H. The accuracy of the Winkler method for dissolved oxygen analysis. Limnol. Oceanogr. 1965, 10, 135–140. [Google Scholar] [CrossRef]
  28. Holmes, R.M.; Aminot, A.; Krouel, R.; Hooker, B.A.; Peterson, B.J. A simple and precise method for measuring ammonium in marine and freshwater ecosystems. Can. J. Fish. Aquat. Sci. 1999, 56, 1801–1808. [Google Scholar] [CrossRef]
  29. Knap, A.; Michaels, A.; Dow, R.L.; Johnson, R.; Gundersen, K.; Sorensen, J.; Close, A.; Howse, F.; Hammer, M.; Bates, N.R.; et al. Bermuda Atlantic Times-series Studies Methods Manual (Version 3). In Bermuda Biological Station for Research; US JGOFS Inc.: Woods Hole, MA, USA, 1993; Volume 108. [Google Scholar]
  30. Atlas, E.L. A Practical Manual for Use of the Technicon AutoAnalyzer in Seawater Nutrient Analyses; Department of Oceanography, Technical Report; Oregon State University: Oregon, OR, USA, 1971; Volume 215. [Google Scholar]
  31. Holm-Hansen, O.; Lorenzen, C.J.; Holmes, R.W.; Strickland, J.D.H. Fluorometric Determination of Chlorophyll. ICES J. Mar. Sci. 1965, 30, 3–15. [Google Scholar] [CrossRef]
  32. McAuliffe, C. Gas Chromatographic Determination of Solutes by Multiple Phase Equilibrium. Chem. Technol. 1971, 1, 46–51. [Google Scholar]
  33. Byers, S.C.; Mills, E.L.; Stewart, P.L. A comparison of methods of determining organic carbon in marine sediments, with suggestions for a standard method. Hydrobiologia 1978, 58, 43–47. [Google Scholar] [CrossRef]
  34. Gutiérrez, D.; Gallardo, V.A.; Mayor, S.; Neira, C.; Vásquez, C.; Sellanes, J.; Rivas, M.; Soto, A.; Carrasco, F.; Baltazar, M. Effects of dissolved oxygen and fresh organic matter on the bioturbation potential of macrofauna in sublittoral sediments off Central Chile during the 1997/1998 El Niño. Mar. Ecol. Prog. Ser. 2000, 202, 81–99. [Google Scholar] [CrossRef] [Green Version]
  35. Cline, J.D. Spectrophotometric determination of hydrogen sulfide in natural waters. Limnol. Oceanogr. 1969, 14, 454–458. [Google Scholar] [CrossRef]
  36. Schloss, P.D.; Westcott, S.L.; Ryabin, T.; Hall, R.J.; Hartmann, M.; Hollister, E.B.; Lesniewski, R.A.; Oakley, B.B.; Parks, D.H.; Robinson, C.J. Introducing mothur: Open-Source, Platform-Independent, Community-Supported Software for Describing and Comparing Microbial Communities. Appl. Environ. Microbiol. 2009, 75, 7537–7541. [Google Scholar] [CrossRef] [PubMed] [Green Version]
  37. Edgar, R.C.; Haas, B.J.; Clemente, J.C.; Quince, C.; Knight, R. UCHIME improves sensitivity and speed of chimera detection. Bioinformatics 2011, 27, 2194–2200. [Google Scholar] [CrossRef] [PubMed] [Green Version]
  38. Quast, C.; Pruesse, E.; Yilmaz, P.; Gerken, J.; Schweer, T.; Yarza, P.; Peplies, J.; Glöckner, F.O. The SILVA ribosomal RNA gene database project: Improved data processing and web-based tools. Nucleic Acids Res. 2013, 41, D590–D596. [Google Scholar] [CrossRef] [PubMed]
  39. Anderson, M.J.; Gorley, R.N.; Clarke, R.K. PERMANOVA + for PRIMER: Guide to Software and Statistical Methods; PRIMER-E: Plymouth, UK, 2008; p. 214. [Google Scholar]
  40. Andersen, K.S.; Kirkegaard, R.H.; Karst, S.M.; Albertsen, M. Ampvis2: An R package to analyse and visualise 16S rRNA amplicon data. bioRxiv 2018, 299537. [Google Scholar] [CrossRef] [Green Version]
  41. Francis, C.A.; Roberts, K.J.; Beman, J.M.; Santoro, A.E.; Oakley, B.B. Ubiquity and diversity of ammonia-oxidizing archaea in water columns and sediments of the ocean. Proc. Natl. Acad. Sci. USA 2005, 102, 14683–14688. [Google Scholar] [CrossRef] [Green Version]
  42. Rotthauwe, J.H.; Witzel, K.P.; Liesack, W. The ammonia monooxygenase structural gene amoA as a functional marker: Molecular fine-scale analysis of natural ammonia-oxidizing populations. Appl. Environ. Microbiol. 1997, 63, 4704–4712. [Google Scholar] [CrossRef] [Green Version]
  43. Levipan, H.A.; Molina, V.; Fernandez, C. Nitrospina-like bacteria are the main drivers of nitrite oxidation in the seasonal upwelling area of the Eastern South Pacific (Central Chile ~36° S). Environ. Microbiol. Rep. 2014, 6, 565–573. [Google Scholar] [CrossRef]
  44. Levipan, H.A.; Molina, V.; Anguita, C.; Rain-Franco, A.; Belmar, L.; Fernandez, C. Variability of nitrifying communities in surface coastal waters of the Eastern South Pacific (∼36° S). Environ. Microbiol. Rep. 2016, 8, 851–864. [Google Scholar] [CrossRef]
  45. Carvajal, M.; Contreras-López, M.; Winckler, P.; Sepúlveda, I. Meteotsunamis Occurring Along the Southwest Coast of South America During an Intense Storm. Pure Appl. Geophys. 2017, 174, 3313–3323. [Google Scholar] [CrossRef]
  46. Devol, A.H. Denitrification including Anammox. In Nitrogen in the Marine Environment; Capone, D.G., Bronk, D.A., Mulholland, M.R., Carpenter, E.J., Eds.; Academic Press: Cambridge, MA, USA, 2008; pp. 263–301. [Google Scholar]
  47. Devol, A.H. Denitrification, Anammox, and N2 Production in Marine Sediments. Annu. Rev. Mar. Sci. 2015, 7, 403–423. [Google Scholar] [CrossRef] [PubMed]
  48. Farías, L.; Castro-González, M.; Cornejo, M.; Charpentier, J.; Faúndez, J.; Boontanon, N.; Yoshida, N. Denitrification and nitrous oxide cycling within the upper oxycline of the eastern tropical South Pacific oxygen minimum zone. Limnol. Oceanogr. 2009, 54, 132–144. [Google Scholar] [CrossRef]
  49. Galán, A.; Faúndez, J.; Thamdrup, B.; Santibañez, J.F.; Farías, L. Temporal dynamics of nitrogen loss in the coastal upwelling ecosystem off central Chile: Evidence of autotrophic denitrification through sulfide oxidation. Limnol. Oceanogr. 2014, 59, 1865–1878. [Google Scholar] [CrossRef]
  50. Lam, P.; Lavik, G.; Jensen, M.M.; van de Vossenberg, J.; Schmid, M.; Woebken, D.; Gutiérrez, D.; Amann, R.; Jetten, M.S.M.; Kuypers, M.M.M. Revising the nitrogen cycle in the Peruvian oxygen minimum zone. Proc. Natl. Acad. Sci. USA 2009, 106, 4752–4757. [Google Scholar] [CrossRef] [Green Version]
  51. Codispoti, L.A. An oceanic fixed nitrogen sink exceeding 400 Tg N a−1 vs the concept of homeostasis in the fixed-nitrogen inventory. Biogeosciences 2007, 4, 233–253. [Google Scholar]
  52. Nevison, C.; Butler, J.H.; Elkins, J.W. Global distribution of N2O and the ΔN2O-AOU yield in the subsurface ocean. Glob. Biogeochem. Cycles 2003, 17, 1119. [Google Scholar] [CrossRef]
  53. Pastene, M.; Quiroga, E.; Hurtado, C.F. Stable isotopes and geochemical indicators in marine sediments as proxies for anthropogenic impact: A baseline for coastal environments of central Chile (33° S). Mar. Pollut. Bull. 2019, 142, 76–84. [Google Scholar] [CrossRef]
  54. Bui, V.H.; Bui, M.D.; Rutschmann, P. Advanced Numerical Modeling of Sediment Transport in Gravel-Bed Rivers. Water 2019, 11, 550. [Google Scholar]
  55. Pfannkuche, O.; Soltwedel, T. Pigments of sediment core M30/1_MC24, in supplement to: Pfannkuche, O.; Soltwedel, T: Small benthic size classes along the N.W. European Continental Margin: Spatial and temporal variability in activity and biomass. Prog. Oceanogr. 1998, 42, 189–207. [Google Scholar] [CrossRef]
  56. Jørgensen, B.B.; Findlay, A.J.; Pellerin, A. The Biogeochemical Sulfur Cycle of Marine Sediments. Front. Microbiol. 2019, 10, 849. [Google Scholar]
  57. Pereira, O.; Hochart, C.; Auguet, J.C.; Debroas, D.; Galand, P.E. Genomic ecology of Marine Group II, the most common marine planktonic Archaea across the surface ocean. Microbiologyopen 2019, 8, e00852. [Google Scholar] [CrossRef] [PubMed]
  58. Teeling, H.; Fuchs, B.M.; Bennke, C.M.; Krüger, K.; Chafee, M.; Kappelmann, L.; Reintjes, G.; Waldmann, J.; Quast, C.; Glöckner, F.O.; et al. Recurring patterns in bacterioplankton dynamics during coastal spring algae blooms. Elife 2016, 5, e11888. [Google Scholar] [CrossRef] [PubMed]
  59. Fuhrman, J.A.; Cram, J.A.; Needham, D.M. Marine microbial community dynamics and their ecological interpretation. Nat. Rev. Microbiol. 2015, 13, 133–146. [Google Scholar] [CrossRef] [PubMed]
  60. Parada, A.E.; Fuhrman, J.A. Marine archaeal dynamics and interactions with the microbial community over 5 years from surface to seafloor. ISME J. 2017, 11, 2510–2525. [Google Scholar] [CrossRef] [PubMed]
  61. Canfield, D.E.; Stweart, F.J.; Thamdrup, O.; De Brabandere, L.; Dalsgaard, T.; DeLong, E.G.; Revsbech, N.P.; Ulloa, O. A Cryptic Sulfur Cycle in Oxygen-Minimum–Zone Waters off the Chilean Coast. Science 2010, 330, 1375–1378. [Google Scholar] [CrossRef] [Green Version]
  62. Murillo, A.A.; Ramírez-Flandes, S.; DeLong, E.F.; Ulloa, O. Enhanced metabolic versatility of planktonic sulfur-oxidizing γ-proteobacteria in an oxygen-deficient coastal ecosystem. Front. Mar. Sci. 2014, 1, 18. [Google Scholar] [CrossRef] [Green Version]
  63. Dyksma, S.; Pjevac, P.; Ovaneson, K.; Mussmann, M. Evidence for H2 consumption by uncultured Desulfobacterales in coastal sediments. Environ. Microbiol. 2018, 20, 450–461. [Google Scholar] [CrossRef]
  64. Coskun, O.K.; Özen, V.; Wankel, S.D.; Orsi, W.D. Quantifying population-specific growth in benthic bacterial communities under low oxygen using H218O. ISME J. 2019, 13, 1546–1559. [Google Scholar] [CrossRef] [Green Version]
  65. Wang, H.-L.; Zhang, J.; Sun, Q.-L.; Lian, C.; Sun, L. A comparative study revealed first insights into the diversity and metabolisms of the microbial communities in the sediments of Pacmanus and Desmos hydrothermal fields. PLoS ONE 2017, 12, e0181048. [Google Scholar] [CrossRef] [Green Version]
  66. Reji, L.; Tolar, B.B.; Smith, J.M.; Chavez, F.P.; Francis, C.A. Differential co-occurrence relationships shaping ecotype diversification within Thaumarchaeota populations in the coastal ocean water column. ISME J. 2019, 13, 1144–1158. [Google Scholar] [CrossRef]
  67. Wilson, J.M.; Litvin, S.Y.; Beman, J.M. Microbial community networks associated with variations in community respiration rates during upwelling in nearshore Monterey Bay, California. Environ. Microbiol. Rep. 2018, 10, 272–282. [Google Scholar] [CrossRef]
  68. Bristow, L.A.; Dalsgaard, T.; Tiano, L.; Mills, D.B.; Bertagnolli, A.D.; Wright, J.J.; Hallam, S.J.; Ulloa, O.; Canfield, D.E.; Revsbech, N.P.; et al. Ammonium and nitrite oxidation at nanomolar oxygen concentrations in oxygen minimum zone waters. Proc. Natl. Acad. Sci. USA 2016, 113, 10601–10606. [Google Scholar] [CrossRef] [PubMed] [Green Version]
  69. Schratzberger, M.; Ingels, J. Meiofauna matters: The roles of meiofauna in benthic ecosystems. J. Exp. Mar. Biol. Ecol. 2018, 502, 12–25. [Google Scholar] [CrossRef]
  70. Nascimento, F.J.A.; Näslund, J.; Elmgren, R. Meiofauna enhances organic matter mineralization in soft sediment ecosystems. Limnol. Oceanogr. 2012, 57, 338–346. [Google Scholar] [CrossRef]
  71. Bonaglia, S.; Nascimento, F.J.A.; Bartoli, M.; Klawonn, I.; Bruchert, V. Meiofauna increases bacterial denitrification in marine sediments. Nat. Commun. 2014, 5, 5133. [Google Scholar] [CrossRef] [Green Version]
Figure 1. Temperature, salinity; density; and oxygen distribution in the water column from selected months during the 2014 and 2015 oceanographic campaigns.
Water 13 00180 g001
Figure 2. Temperature and salinity (T/S) diagram indicating the contribution from different water masses, i.e., sub-Antarctic Waters (SAAW), Equatorial Subsurface Waters (ESSW) and Subtropical Waters (STW).
Water 13 00180 g002
Figure 3. Biogeochemical conditions associated with Apparent Oxygen Utilization (AOU), nitrate, nitrite, ammonium, and phosphate distribution in the water column during the selected months sampled (June and October of 2014, January, April, August and December 2015).
Water 13 00180 g003
Figure 4. Relationships between: (A) nitrate and phosphate; (B) nitrate and Apparent Oxygen Utilization (AOU); (C) nitrous oxide and AOU; and (D) nitrous oxide and nitrate during the different sampling months.
Water 13 00180 g004
Figure 5. (A) Sediment organic matter content and potential quality indicators. (B) Sediment total sulfides concentration, redox and pH conditions in surface sediments and overlying water (benthic boundary layer).
Water 13 00180 g005
Figure 6. Heatmap showing the relative contribution of top representative phyla facet by biomes and sampling periods (January–December are upwelling periods). Orange versus light blue colors indicate a higher versus lower contribution, respectively.
Water 13 00180 g006
Figure 7. Operational taxonomic units (OTUs) contribution to the libraries in the different biomes Sediment and Water (S_ and W_) and sampling months.
Water 13 00180 g007
Figure 8. (A) Quantification of key nitrifying microbial functional groups in the bottom water, including ammonia oxidizing archaea (Nitrosupumilus-like), ammonia oxidizing bacteria (βAOB) and nitrite oxidizing bacteria (Nitrospina-like). (B) Nutrients associated with nitrification process from bottom waters.
Water 13 00180 g008
Figure 9. Principal coordinate Analyses showing the pelagic community structure variability associated with the different sampling seasons, and significant correlations with environmental studied variables.
Water 13 00180 g009
Publisher’s Note: MDPI stays neutral with regard to jurisdictional claims in published maps and institutional affiliations.

