1. Introduction
The global climate system has been undergoing a significant change in recent years, which, together with large-scale anthropogenic activities, is altering the hydrologic cycle, making the climate-driven hydrologic cycle more of a human–climate-driven hydrologic cycle [
1]. It has been found in the global hydrological cycle that the natural streamflow is gradually vanishing, and the artificial runoff is increasing under the influence of intensive human interference. There is ample observed evidence that streamflow during the past decades has been remarkably disturbed in multiple ways under the coupled influence of climate change and human activities [
2,
3]. It is implied that the new hydrological cycle within the coupled human–climate system is causing more complex hydrological alteration that is already complicated and making the attribution analysis of runoff change more difficult [
4]. However, runoff change and its influence on hydrological processes have been receiving considerable attention [
5]. The global science plan “Panta Rhei—Everything flows” argues that social and hydrological systems have been coupled in many parts of the world under the impacts of human activities and climate change [
6]. It emphasizes the need to understand the interactions of society and water, i.e., the interactions and feedbacks between the social system and the hydrological system.
The Wuding River, a tributary of the Yellow River, is located in the Loess Plateau, China. The Wuding River basin (WRB) is characterized by high evapotranspiration, sparse vegetation, severe soil erosion; it belongs to a water-limited, environmentally fragile area vulnerable to climate change [
7]. To control soil erosion and improve the eco-environment, a series of projects and measures have been implemented since the 1960s, including revegetation and check dam construction. For example, the “Grain for Green” Project on the Loess Plateau was carried out at the beginning of the 21st century in which >16,000 km
2 of sloping farmland was returned to forest or grassland, >5000 main check dams and >50,000 small and medium-sized check dams were built. The WRB, where more than 11,000 check dams were already working by 2011, was one of the project implementation areas [
8]. Although various soil and water conservation measures have played an important role in controlling sediment and restoring eco-environment, these projects and measures have also changed the environment of runoff production. Additionally, human activities, including surface water withdrawal and drainage and human-induced groundwater exploitation and recharge, also directly influence streamflow in the WRB. Such complex interactions occurring within and between the social system and the hydrological system present a great challenge to understanding the hydrological variability. Investigating the hydrological variability, or rather, determining the contributions of climate change, underlying surface change, and impact of direct human activities (e.g., surface water withdrawal and drainage and human-induced groundwater exploitation and recharge) to runoff is needed to guide catchment water resources management under the human–water-coupled environment.
A significant amount of research has been undertaken to quantify the relative contributions of social and climate factors to the hydrological system by employing various hydrological models [
9] and statistical methods [
10]. Hydrological models have an advantage in considering runoff generation mechanisms and separating the impacts of climate change and human activities on small timescales. However, hydrological models usually require massive amounts of observed data, which pose an enormous challenge for accurately describing the complex continuous interactions of the socio-hydrological system. Statistical methods are relatively simple but lack clear physical mechanisms in separating the impacts of interactions [
11].
Other studies related to changes in hydrological variables under the influences of climate change and human activities have also been conducted. Budyko’s (1974) equation describes the interaction of climate, hydrology, and catchment characteristics [
12], and this equation is a popular, useful tool to investigate the impacts of climate change and human interference on the hydrologic cycle over the long term [
13,
14,
15]. Based on this equation, several analytical equations were developed, such as the Turc–Pike equation [
16], Fu equation [
17], Choudhury equation [
18], Zhang equation [
19], and Wang-Tang equation [
20]. These equations are also called single, or one, parameter Budyko-type equations in which there is a parameter
n or
w reflecting the watershed characteristics and usually treated as a constant in the long term. Afterwards, a Budyko-type equation with time-varying parameter was proposed by Jiang et al. (2015) [
14], which provides a way to investigate gradual changes in the catchment due to the interaction of climate and human activities at the annual scale. However, the human impact was generally considered as a whole in Budyko-type equations in all previous studies, which led to insufficient understanding of the complex interactions occurring within and between social and hydrologic systems.
To provide more information about the contributions of climate change, underlying surface change, and direct human activities to runoff at the annual time scale and better serve the water resources management under the water–human-coupled environment in the WRB, a human-induced water–energy balance (HWEB) model on the basis of Budyko hypothesis is proposed. This research differs from all previous Budyko-based research in the WRB [
21], because direct human impact is considered in detail. Therein, a human-induced water balance equation (HWB), considering the direct human impact and human-induced energy balance equation (HEB) including water consumption by the society, are built. The decomposition method [
22] and an investigation approach are employed to measure the influences of climate change, direct human-induced water withdrawal, and underlying surface change on evapotranspiration and runoff in the WRB.
2. Materials and Methods
2.1. Study Area
The 491.2 km long Wuding River originates from the Ordos desert in northwest China, with an average slope of 1.97 [
23]. The 30,261 km
2 WRB is primarily distributed in the transitional zone from farmland and grassland to desert in the Loess Plateau, China (
Figure 1). The northwestern part of the basin is characterized by desert with a gentle undulating landscape, and the southern part contains steep hillslopes with incised channels [
24]. A temperate semi-arid monsoon climate is pronounced in the basin, with an average annual temperature ranging from 7.9–11.2 °C, annual precipitation varying from 350–500 mm with 75% falling in the flood season mainly as intense storms (
Figure 1), and the average annual potential evapotranspiration of 900–1400 mm. The average annual runoff depth is approximately 35 mm, and part of it is recharged by groundwater that accounts for 80–90% of river runoff in some reaches or sub-basins. The WRB is subject to serious soil erosion, and the mean annual soil erosion modulus is up to 7075 t/km
2/a. To control soil erosion, many check dams have been built, and soil and water conservation measures have been implemented. However, these have led to a decrease in streamflow. In addition, these human activities also result in the change in watershed hydrological processes, which are reflected in the observation data as the increase in temperature and vegetation coverage, the decrease in streamflow (
Figure 1), and the non-stationarity of hydrological parameters [
25].
2.2. Data
The data used in this study can be categorized as (1) daily meteorological and hydrological data, including observed precipitation, sunshine duration, relative humidity, wind speed, temperature, air pressure, and runoff depth; (2) surface water withdrawal records for industry, irrigation, afforestation and urban residents, and groundwater withdrawal records for industry and urban residents; (3) water quotas for rural residents and livestock; (4) social development data including rural population and livestock number; (5) water consumption coefficient (rates) in water use for industry, irrigation, and urban residents. Additionally, data on urban population, irrigation area, reproduction area, industrial production, reservoir number, and warping dams were collected for representing the changes in social conditions.
The observed meteorological records, including the data from 1975–2010 at 13 meteorological stations in or around the WRB, were provided by the National Climate Center of the China Meteorological Administration (
http://data.cma.cn/). The runoff data at Baijiachuan gauge (
Figure 1) covering the period of 1975–2010 were derived from hydrological manuals published by the Hydrological Bureau of the Yellow River Conservancy Commission (YRCC), China. In addition, the social development data, water quotas, and water consumption coefficients were obtained from the statistical publications of Yulin city, including Yulin Water Resources Bulletin, Yulin Statistical Yearbook, Shaanxi Water Statistical Yearbook, and the city coverages of almost all of industrial, irrigation, and afforestation areas and towns in the WRB. In the uncovered region, the water consumption was ignored due to very few rural residents and livestock living there.
Water consumption for rural residents and livestock is equal to groundwater use (rural population/livestock number * water quotas), and that in other sectors (e.g., industry, irrigation, afforestation, and urban residents) is equal to the water consumption coefficient multiplied by water withdrawal.
2.3. Preliminary Data Analysis
Table 1 lists the results of the Mann–Kendall trend test on above mentioned data and the potential change in precipitation (
P), evapotranspiration (
ET), and runoff (
R) in the hydrological cycle that could be triggered by the change in trend. Test results showed that these factors or indicators had different trend changes, representing the changing climatic, social, and hydrological conditions in the WRB. Thus, it is concluded that the WRB was subject to a coupled changing condition from 1975 to 2010, and that the change in the hydrological cycle in the WRB cannot be described accurately through the long-term water or energy balance alone, because climatic, social, and hydrological conditions are impacting the basin, leading to a time-varying hydrological cycle.
2.4. Methods
Hydrological processes in a catchment may change greatly at different stages under climate change and human interference [
26,
27,
28]. Nearly all hydrological processes have been disturbed by human activities, representing time-varying and nonstationary characteristics in the socio-hydrological systems [
29]. Therefore, the watershed water balance and energy balance under the changing environment should be established in the WRB over small time scales (such as annual scale) rather than longer-term scales. In this study, a Budyko-based HWEB model was developed to evaluate hydrological processes and perform attribution analysis at the annual time scale under the water–human-coupled environment.
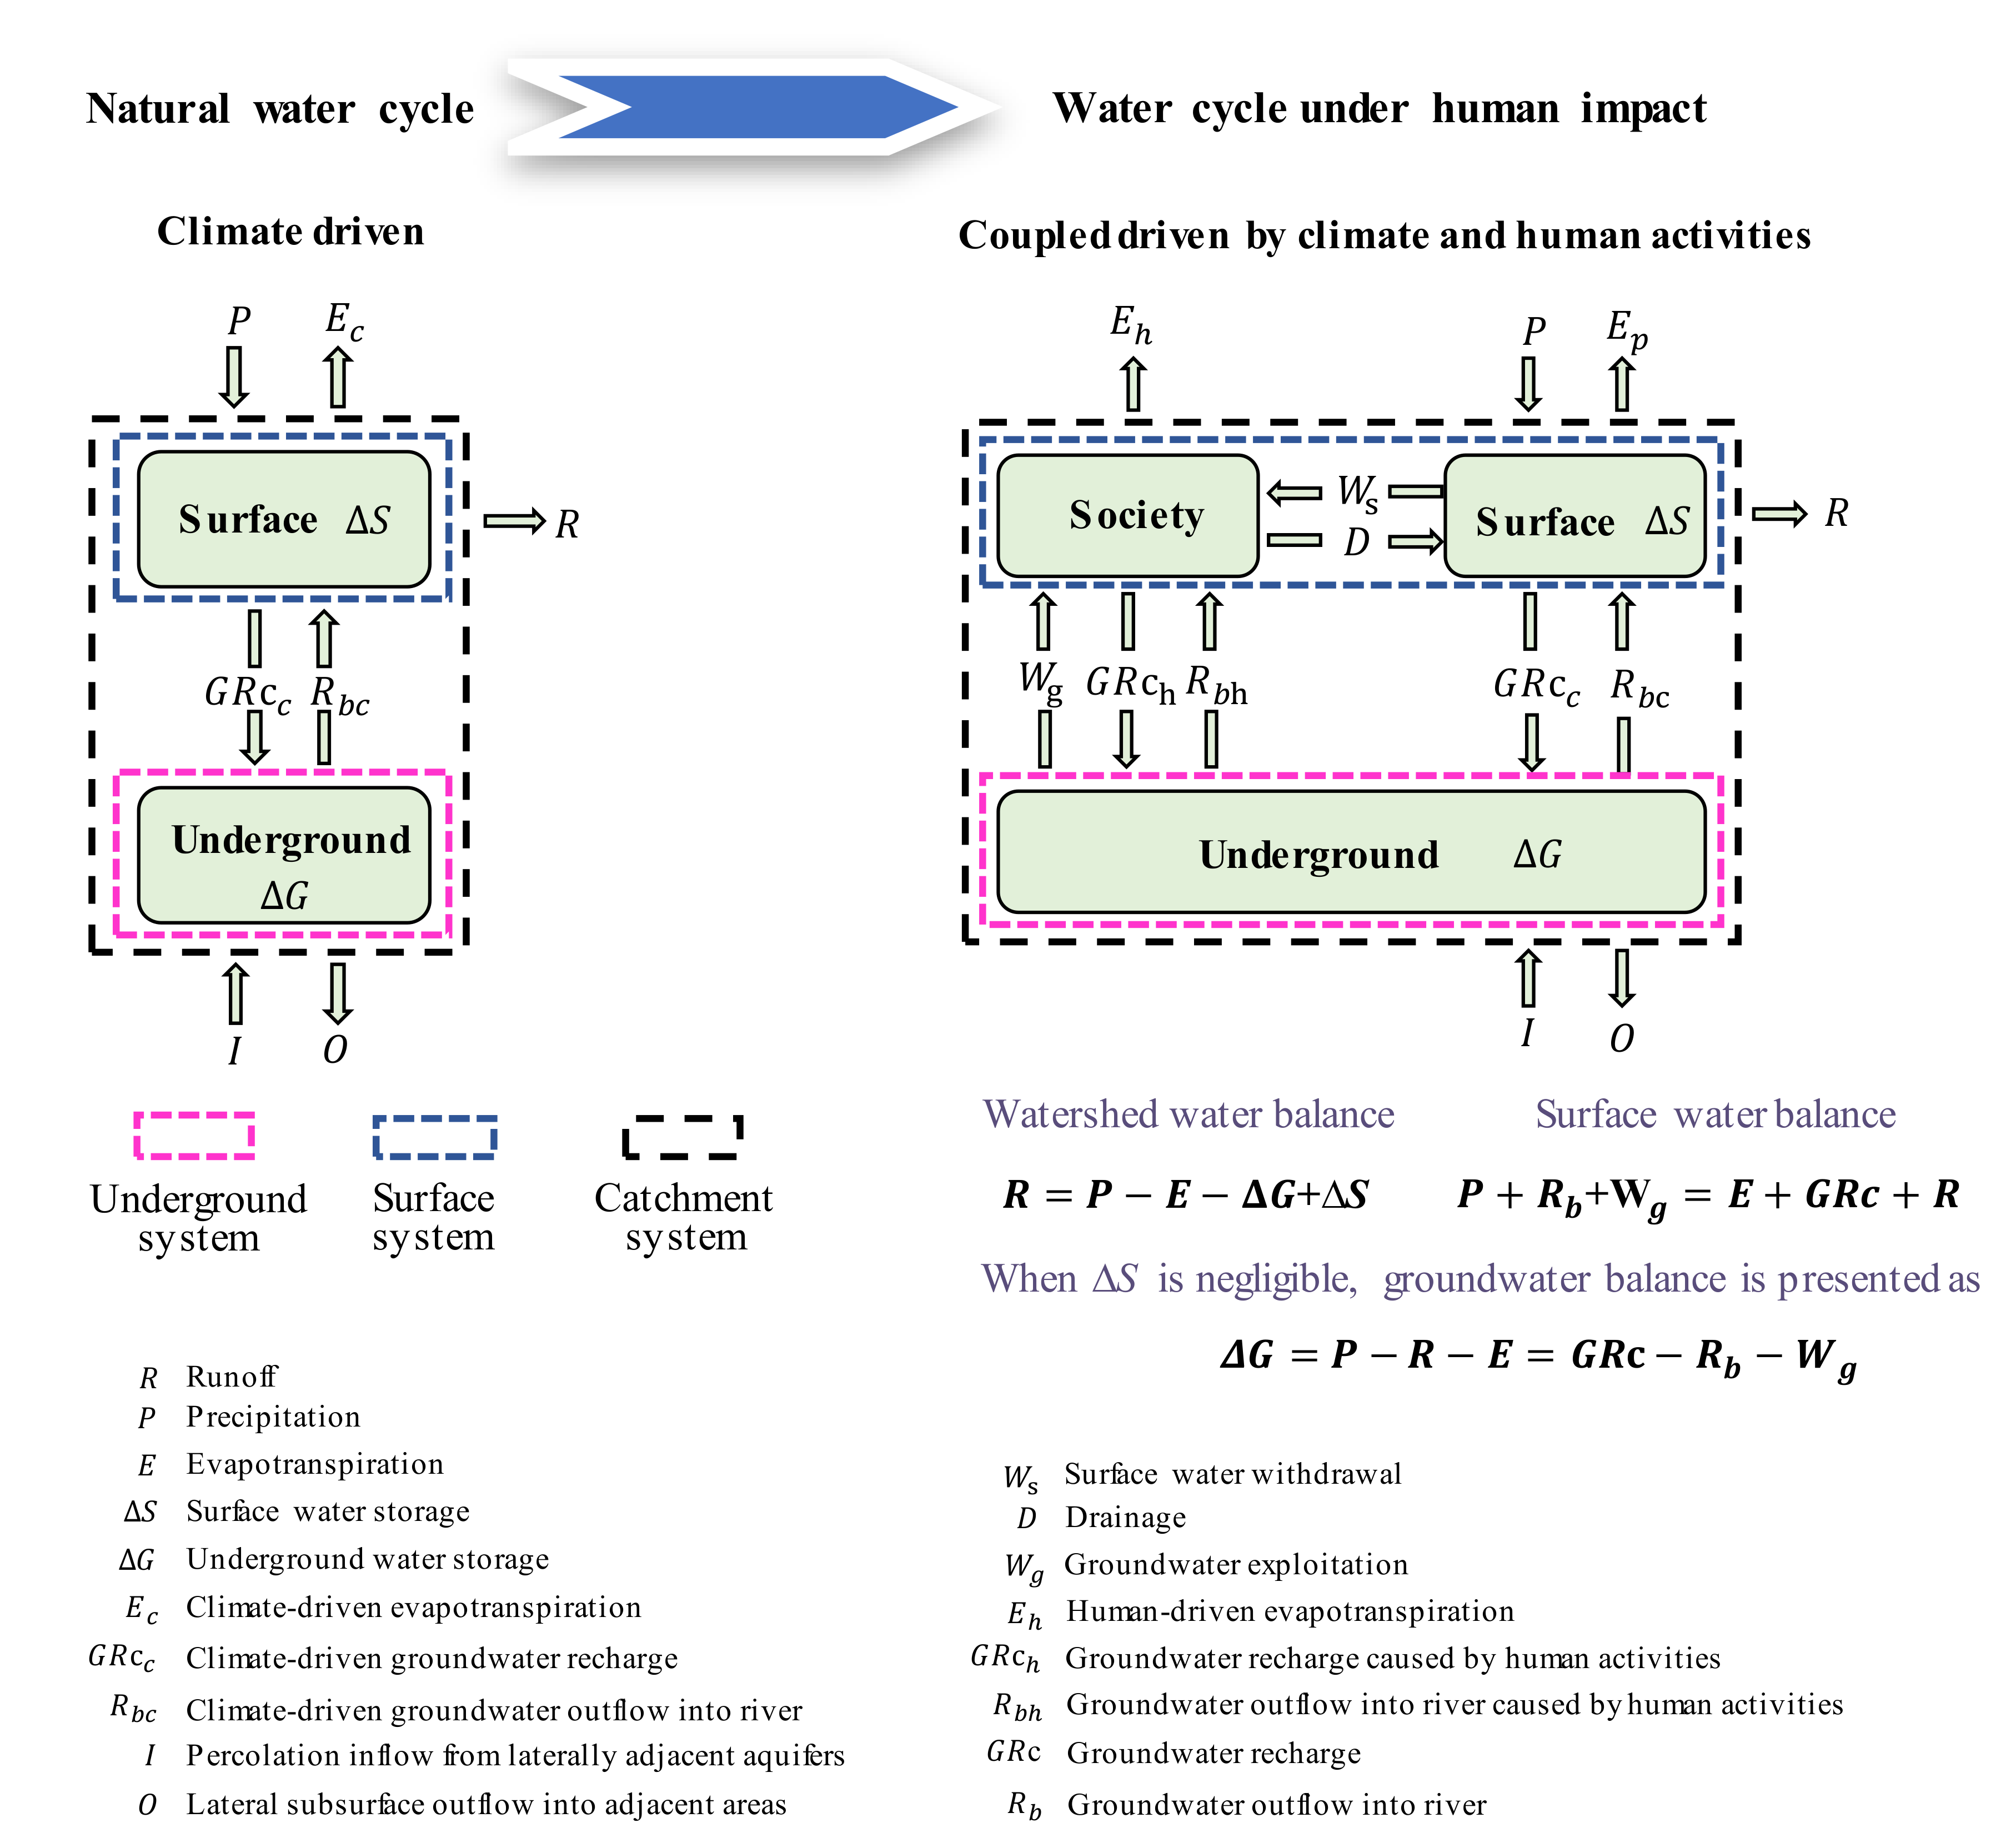
2.4.1. Human-Induced Water Balance Equation
The water balance equation for a basin in a given year can be described as:
where
R denotes the amount of runoff,
P denotes the precipitation,
E denotes the actual evapotranspiration, and ∆
S and ∆
G represent the changes of surface water storage and groundwater storage, respectively. In the long term, the surface and groundwater storage changes are negligible when the groundwater level is stationary, and ∆
S + ∆
G is assumed to be null [
30]. However, the ∆
G term must be considered in the equation if the groundwater level is fluctuating [
22].
Due to the absence of lakes and reservoirs with multi-year regulation ability in the WRB, ∆
S may be ignored at the annual scale, approximated to zero. Equation (1) can then be represented as:
Therein, ∆
G needs to be computed by the groundwater balance equation. Considering the human impact, the basin groundwater balance equation can be expressed (
Figure 2) as:
where
GRc denotes the groundwater recharge, including climate-driven groundwater recharge
GRcc (precipitation) and the additional percolation inflow
GRch due to human activities (such as irrigation and afforestation/reforestation).
Rb denotes the percolation outflow into streams, open water courses, and other water bodies that have water levels lower than the water table in the adjacent land and mainly presents the baseflow in the WRB. The baseflow can be divided into groundwater outflow into river caused by climate change
Rbc and by human activities
Rbh.
Wg denotes groundwater exploitation.
In the study, the recession-curve-displacement method proposed by Hall in 1968, as one of the most common baseflow recession curves [
31], was employed to estimate groundwater recharge
GRc. The Eckhardt filter method, proposed by Eckhardt [
32], was used to separate and calculate the baseflow
Rb. The investigation method [
33] was applied to compute the groundwater exploitation
Wg by accumulating all of the groundwater exploitation for various industries obtained through the investigation.
2.4.2. Budyko-Type Equation at the Annual Scale
The Budyko hypothesis (hereafter called BH) was postulated by a Russian climatologist, Mikhail Ivanovich Budyko, to analyze regional differences in long-term annual water and energy balance [
12]. It reports that the partition of precipitation (
P) between actual evapotranspiration (
E) and runoff (
R) is treated as a functional balance between the supply of water from the atmosphere (precipitation,
P) and the demand for water by the atmosphere (potential evapotranspiration or evapotranspiration capacity,
E0) [
34]. Thus, according to the precipitation (
P) and evapotranspiration capacity (
E0), the actual evapotranspiration (
E) can be calculated by the balance equation of the basin (namely Budyko equation), which couples the water balance equation and the energy balance equation. In recent decades, many studies attempted to improve, extend, and apply the Budyko equation [
14,
34,
35] and put forward a series of Budyko-type equations [
16,
17,
18,
19,
20].
In this study, the Budyko equation of the generalized form was employed [
36] as follows:
where
n denotes a catchment-specific parameter and modifies the partition of
P between
E and
R.
It is reported that parameter
n presents the underlying surface condition of the watershed, such as topography, vegetation coverage, and soil hydraulic property [
14], and that it always is regarded as a relatively stable value at multi-year scales with seasonal fluctuations. However, differing views suggest that
n may be time-varying over annual scale and presents a comprehensive impact of the underlying surface condition and human impacts in the basin. It can, however, be stated that many factors driving hydrological change were changing and the runoff representing the hydrological change was also time varying. Thus, the Budyko equation with time-varying parameter
n was used at the annual scale in this study.
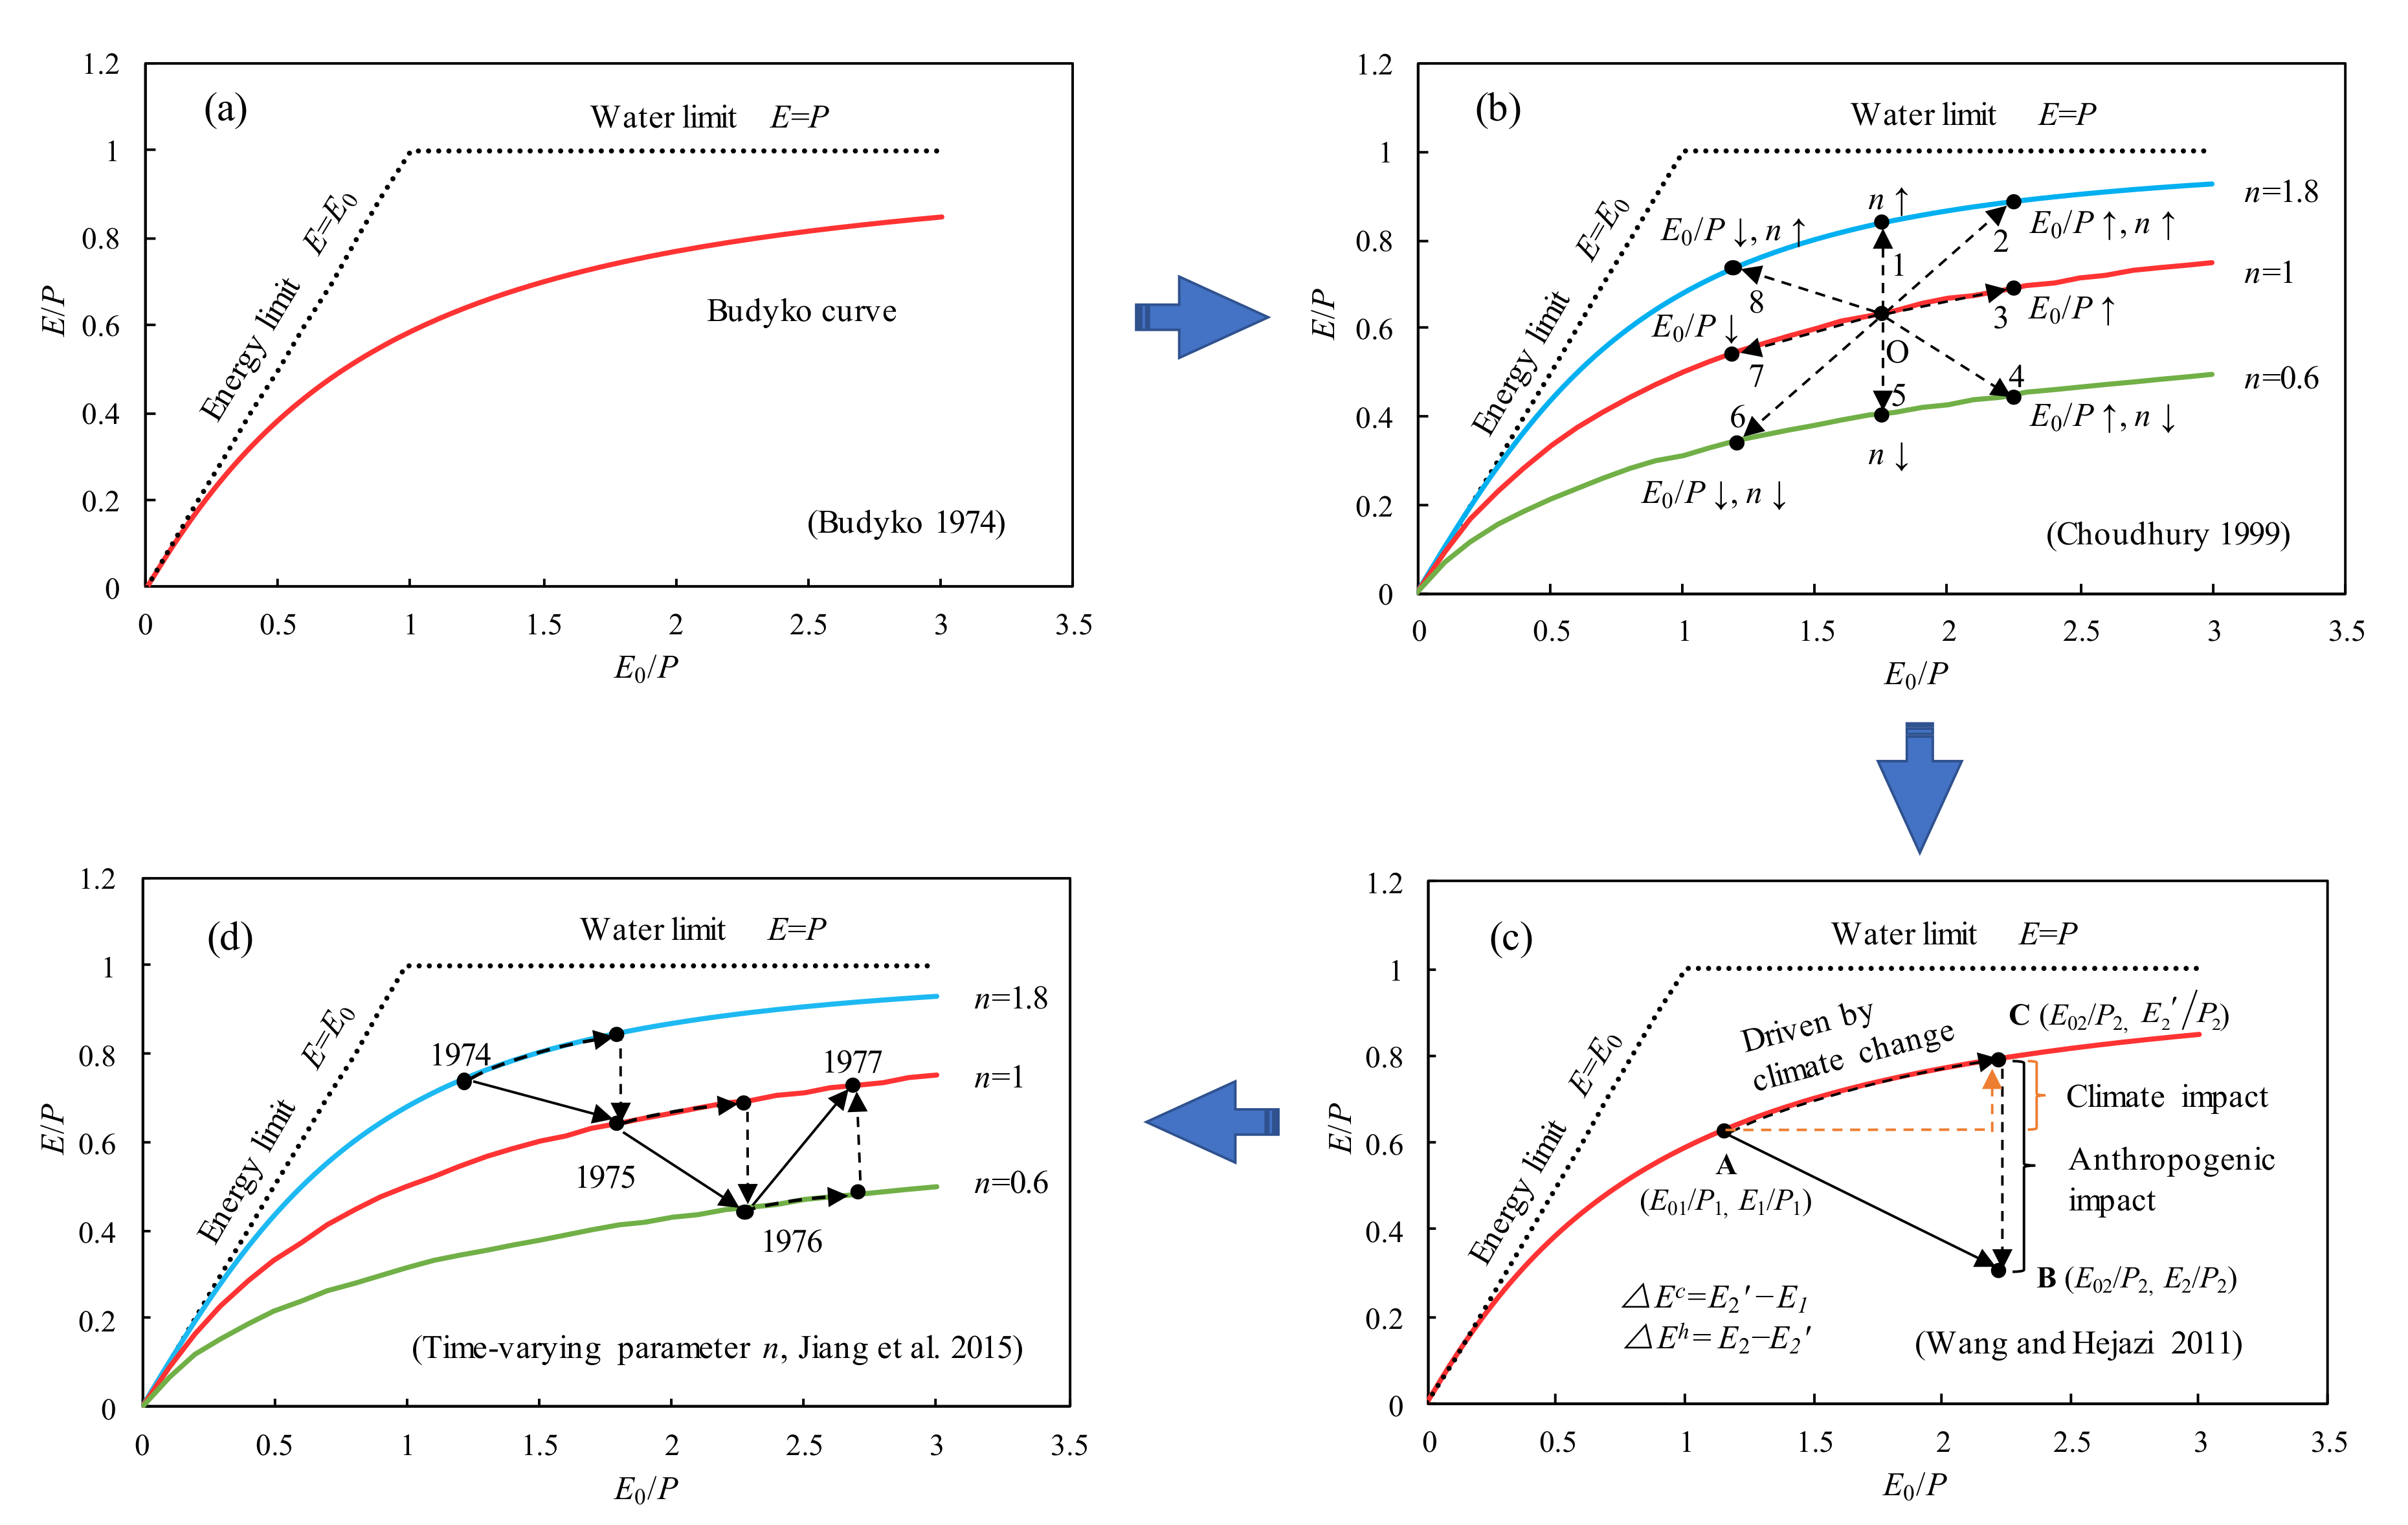
On the basis of the BH, the decomposition method proposed by Wang and Hejazi (2011) [
22] was introduced to separate and quantify the influence of climate change and human activities on the runoff change. The decomposition method demonstrates that the watershed state will evolve along the Budyko curve (
Figure 3a) if only climate change represents the contribution of mean annual potential evapotranspiration and precipitation to the runoff change. When the watershed is affected by climate change and human activities together, the watershed state may move in possibly eight directions to the next moment (
Figure 3b), where climate change still drives the state moving along the curve (Point A to Point C in
Figure 3c), but the human interferences will force the state to move in the vertical direction (Point C to Point B in
Figure 3c). At this point, the movement along the curve can be regarded as the climate-induced change, generating a vertical movement of
E′2/
P2−
E1/
P1 covering the entire impact of climate-driven environmental change, and the total vertical movement can be considered as the human-induced change, i.e.,
E2/
P2−
E′2/
P2. Connecting the movements of the watershed state on the annual timeline, the water and energy balance can be described by the Budyko-type equation with the time-varying parameter at the annual scale, as shown in
Figure 3d.
As seen in
Figure 3c, the change in the actual evapotranspiration driven by climate change and human impact in the basin can be denoted as follows:
where ∆
Ec denotes the change in actual evapotranspiration caused by climate change, and ∆
Eh denotes the change in actual evapotranspiration driven by human impact.
E1 and
E2 are the actual evapotranspiration values at points A and B, respectively;
E02 and
P2 represent the potential evapotranspiration and precipitation at point B. Therein, the catchment-specific parameter
n is time-varying at the annual scale. The potential evapotranspiration
E0 can be calculated by the FAO (Food and Agriculture Organization of the United Nations) Penman–Monteith equation, and actual evapotranspiration can be obtained by the watershed water balance equation.
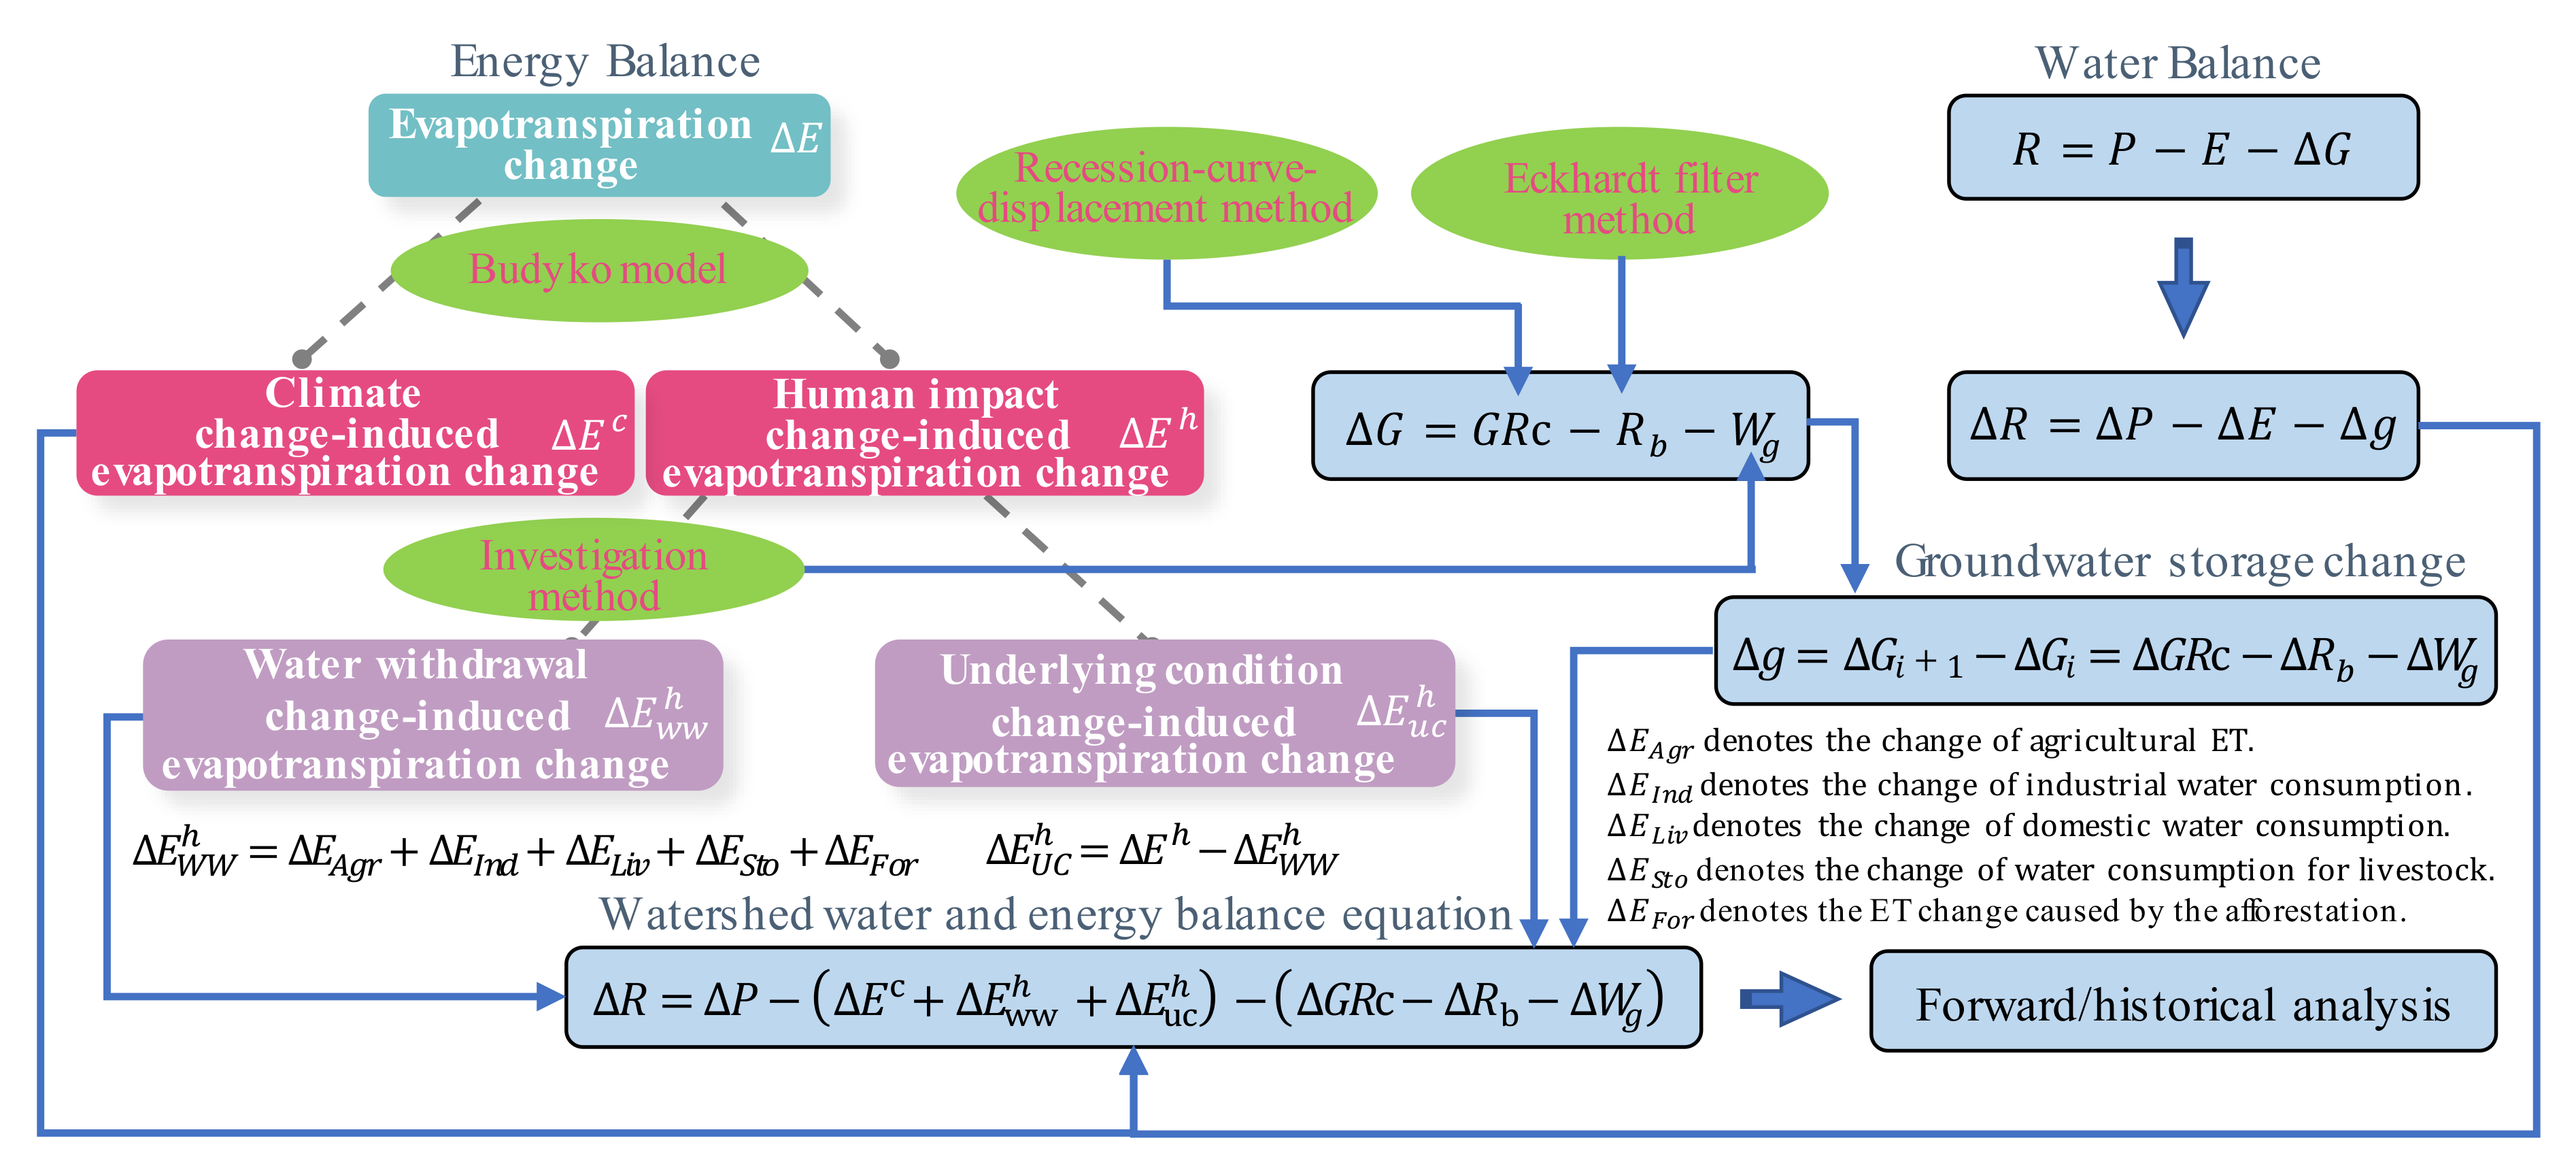
2.4.3. Budyko-Based HWEB for Hydrological Analysis under Human Impact
An attempt is made in this paper to categorize human impact change-induced evapotranspiration change (HICIEC) into water withdrawal change-induced evapotranspiration change (WWCIEC,
) and the underlying condition change-induced evapotranspiration change (UCCIEC,
). The WWCIEC can be computed by accumulating all the net surface and groundwater consumption (i.e., water use * water consumption coefficient) for different industries, such as industry, irrigation, residents, livestock, and afforestation through the investigation method [
33]. The UCCIEC is equal to the difference between HICIEC and WWCIEC (
Figure 4).
Combining the above energy balance with water balance, a Budyko-based HWEB model was established to measure the runoff change under human impact in the basin (
Figure 4). As seen in the figure, the annual runoff change ∆
R can be calculated by the following equation:
Additionally, the contribution of climate change, anthropogenic water withdrawal change (i.e., surface and groundwater withdrawal change), human-induced underlying condition change, and groundwater storage change to runoff variation can be measured by Equation (7), which provides an effective tool to understand watershed water resources change under the changing environment by forward or historical analysis and to further build suitable adaptation strategies for watershed environmental change.
Focusing on the change in basin runoff, the following balance equation mainly considering the influences from climate change, anthropogenic water withdrawal change, the underlying surface condition change, and groundwater change can be obtained:
where Δ
R denotes the runoff change;
denotes the contribution of climate change to runoff change,
;
denotes the contribution of anthropogenic water withdrawal change,
;
denotes the contribution of human-induced underlying surface condition change;
;
denotes the contribution of the groundwater change,
.
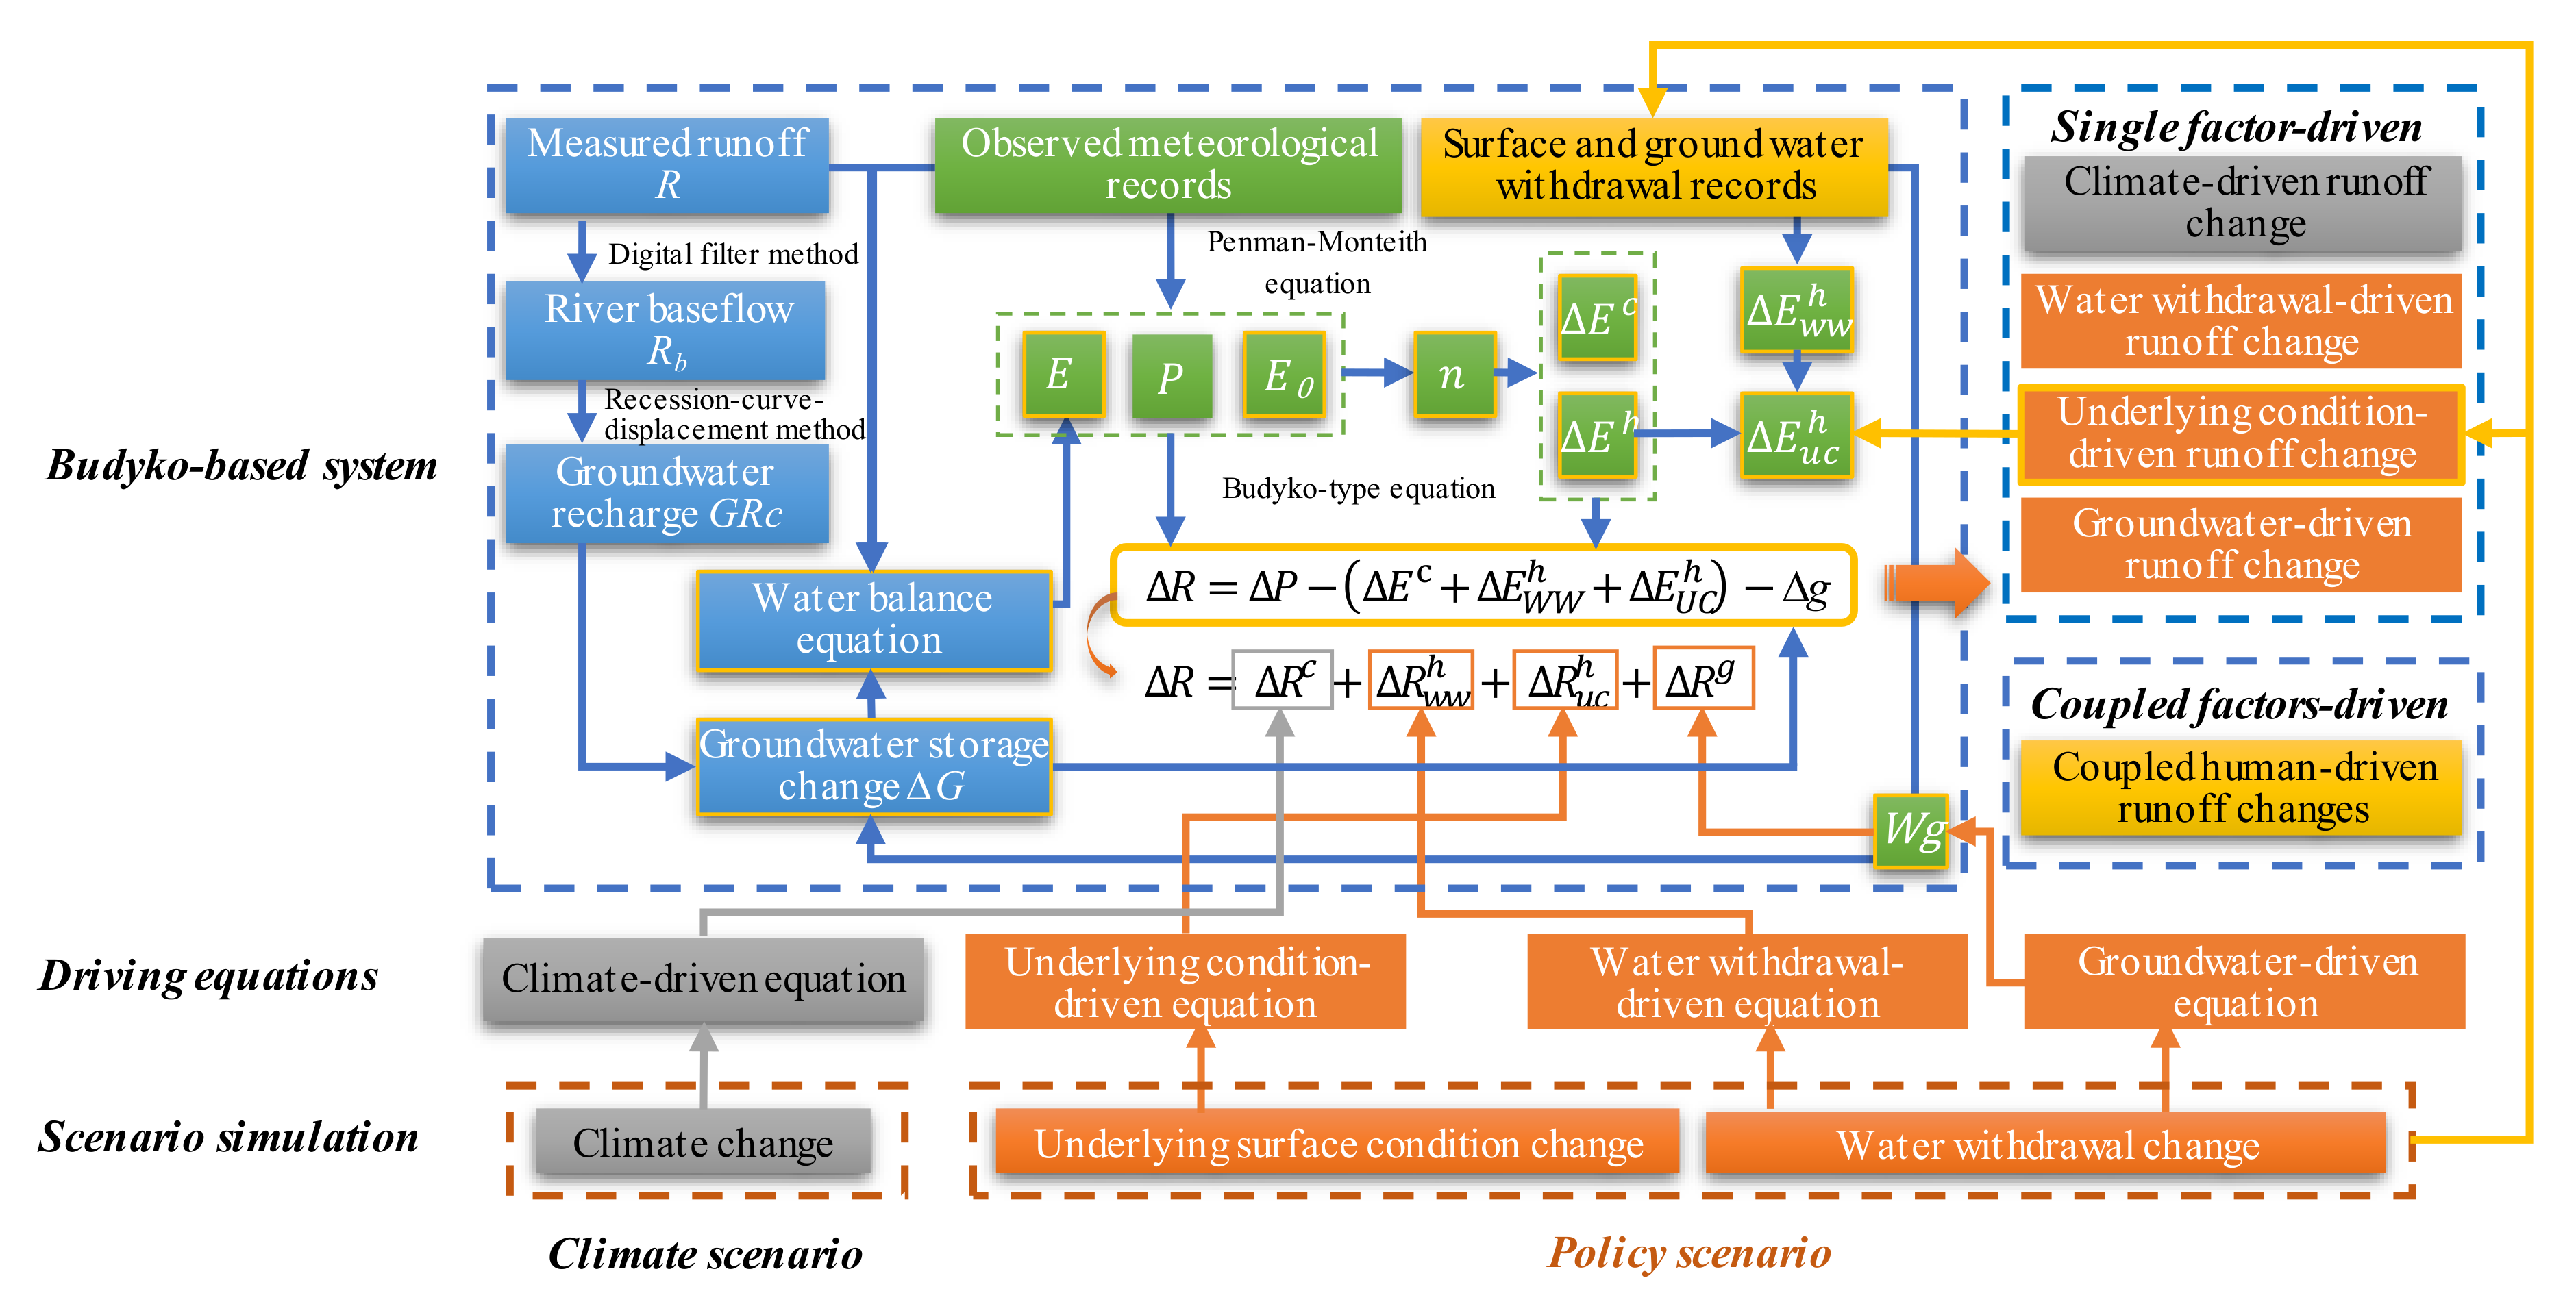
2.4.4. Simulation Framework
As shown above, the Budyko-based HWEB model can be implemented to measure the influences of climate change, anthropogenic water withdrawal, the underlying surface condition, and groundwater storage change on runoff and to build the relationships between each driving factor variation and runoff change through historical data in the study basin. To provide more valuable information for decision makers, a scenario simulation framework based on four equations obtained by the least square method, describing the above driving relationships and Budyko-based system (
Figure 5), is proposed in this study. The four equations include a climate-driven equation, underlying condition-driven equation, water withdrawal-driven equation, and groundwater-driven equation.
In this framework, the driving equations can be employed separately when calculating the single factor-driven runoff change, while these equations must be used together with the Budyko-based model when investigating the coupled changes. In terms of the framework, the decision maker can implement scenario simulation by inputting different social and hydrological data, including a climate scenario and a single anthropogenic policy scenario through the corresponding driving equations. It is worth mentioning that the framework can also simulate the potential or possible runoff variation caused by preliminary decisions or policies with coupled water withdrawal and underlying condition. In short, the framework can provide the necessary information and scientific guidelines for developing efficient policy measures for sustainable watershed management.
3. Results and Discussion
As previously stated, the data covering the period 1975–2010 observed meteorological data, runoff data, anthropogenic surface water, and groundwater withdrawal records for industry, irrigation, urban residents, afforestation, rural population, livestock number, water quotas for rural residents and livestock, and relevant water consumption coefficients; they were considered as inputs of the Budyko-based HWEB model to quantify the attributions of changes of evapotranspiration and runoff in the WRB at the annual scale.
3.1. Groundwater Storage Change
Groundwater outflow into river, namely river baseflow, was obtained by the Eckhardt filter method, and groundwater recharge was computed by the recession-curve-displacement method. The groundwater exploitation amount was achieved by investigating the groundwater consumption for different industries (including groundwater use for rural residents and livestock and groundwater withdrawal * water consumption coefficients for other industries). Hence, the change in groundwater storage Δ
G in the WRB was calculated by the groundwater balance equation (Equation (3)), as shown in
Figure 6 and
Figure 7.
As seen in
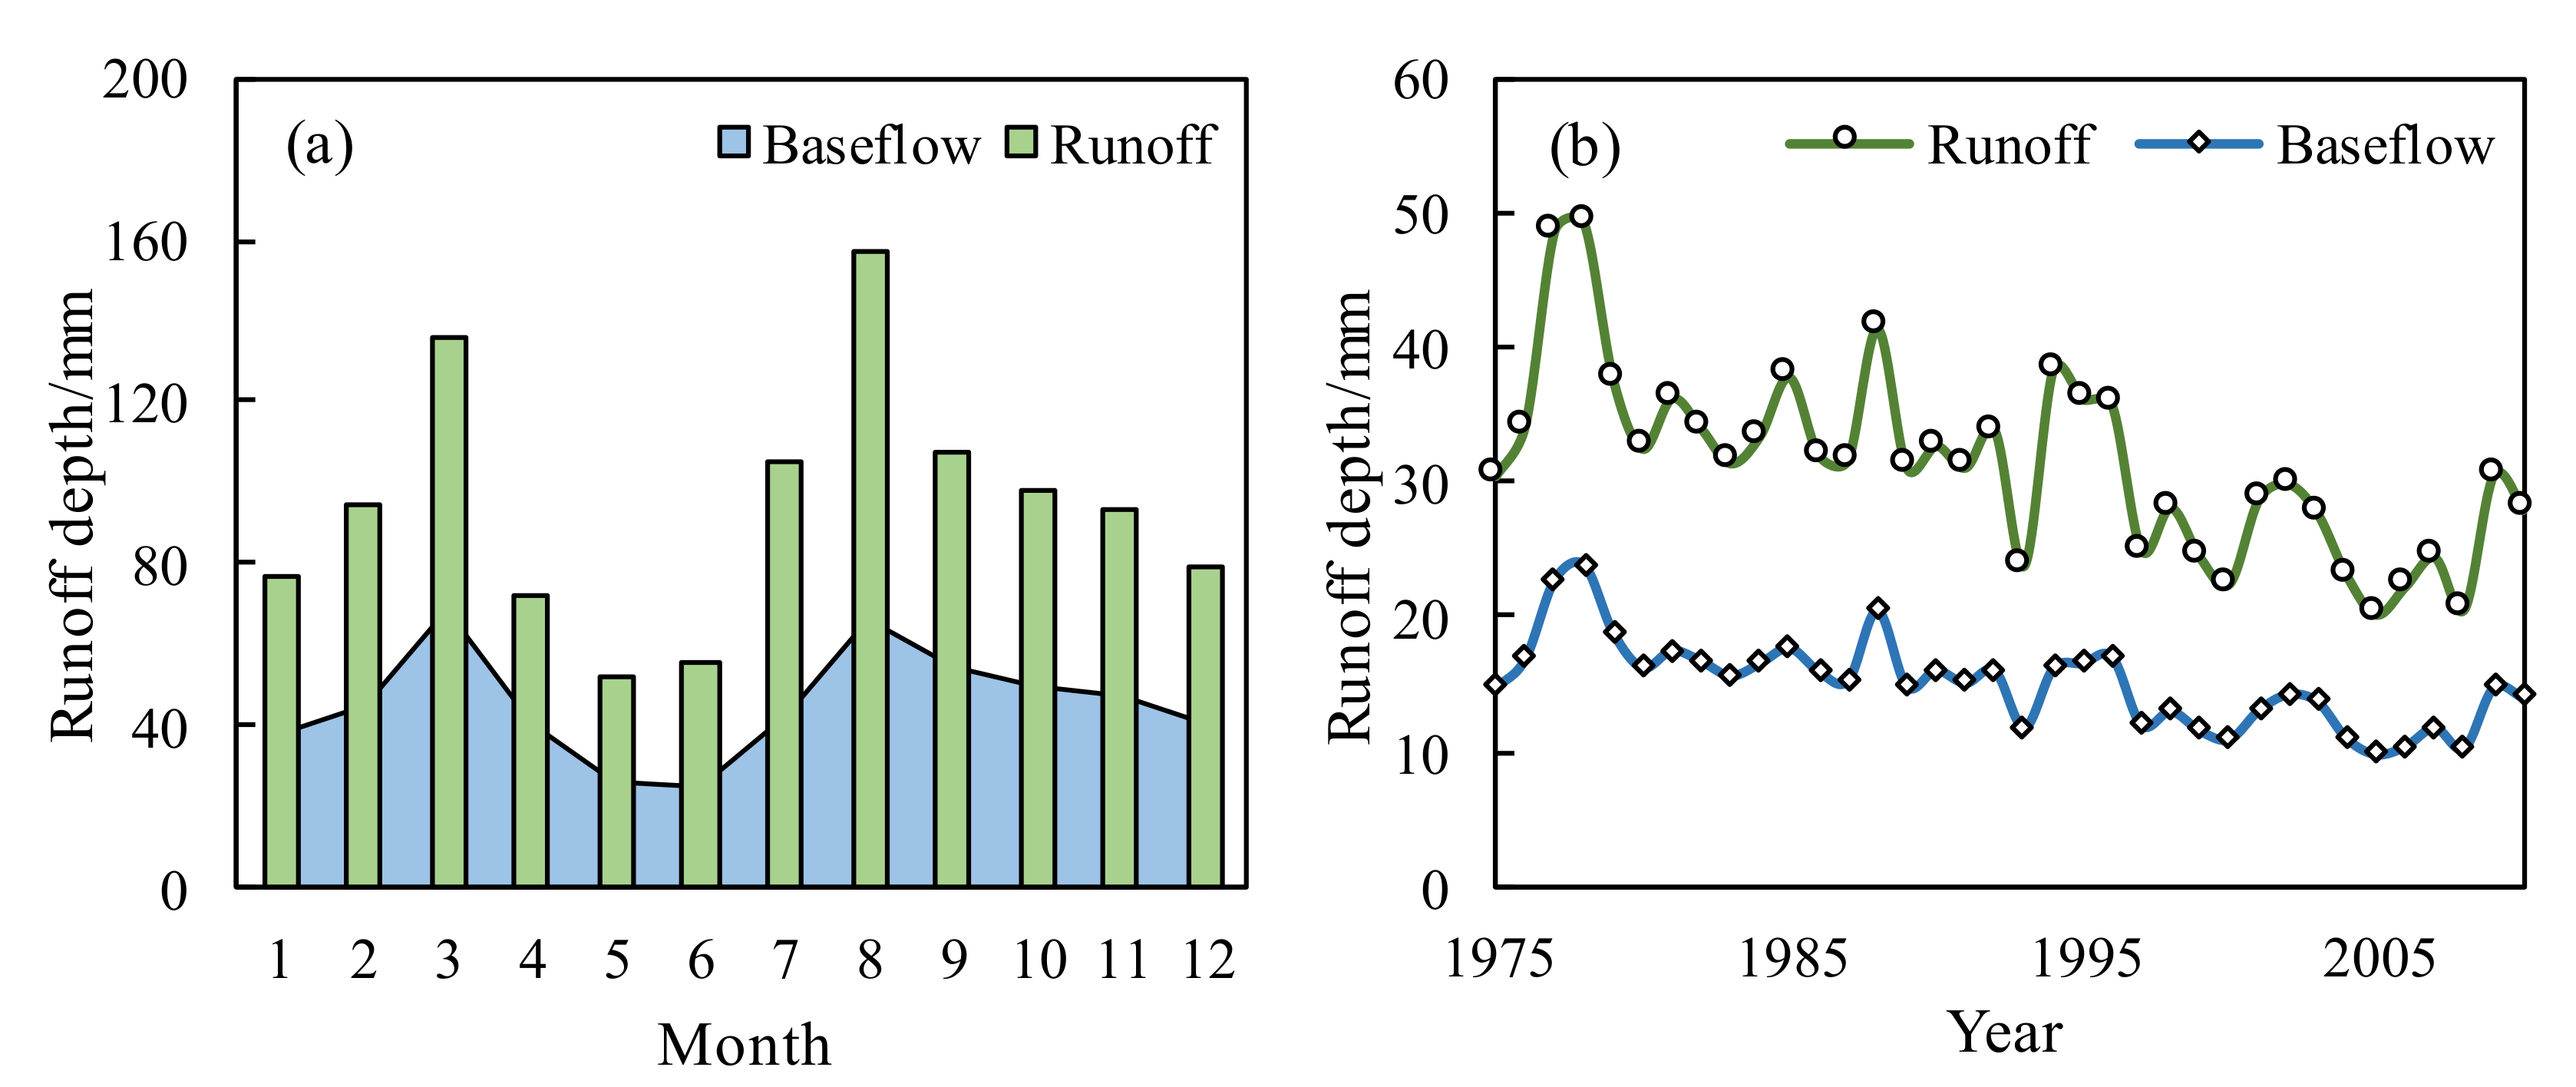
Figure 6, the interannual change in base flow was similar to that of runoff, showing a significant downward trend from 1975 to 2010 with a decreasing rate of 0.21 mm/a. Compared with seasonal runoff depth, the base flow in dry months accounted for most of the runoff, while it accounted for a smaller proportion of runoff in wet months. The ratio of mean annual base flow depth to runoff depth was 0.49, indicating that nearly half of the runoff in the WRB came from groundwater outflow.
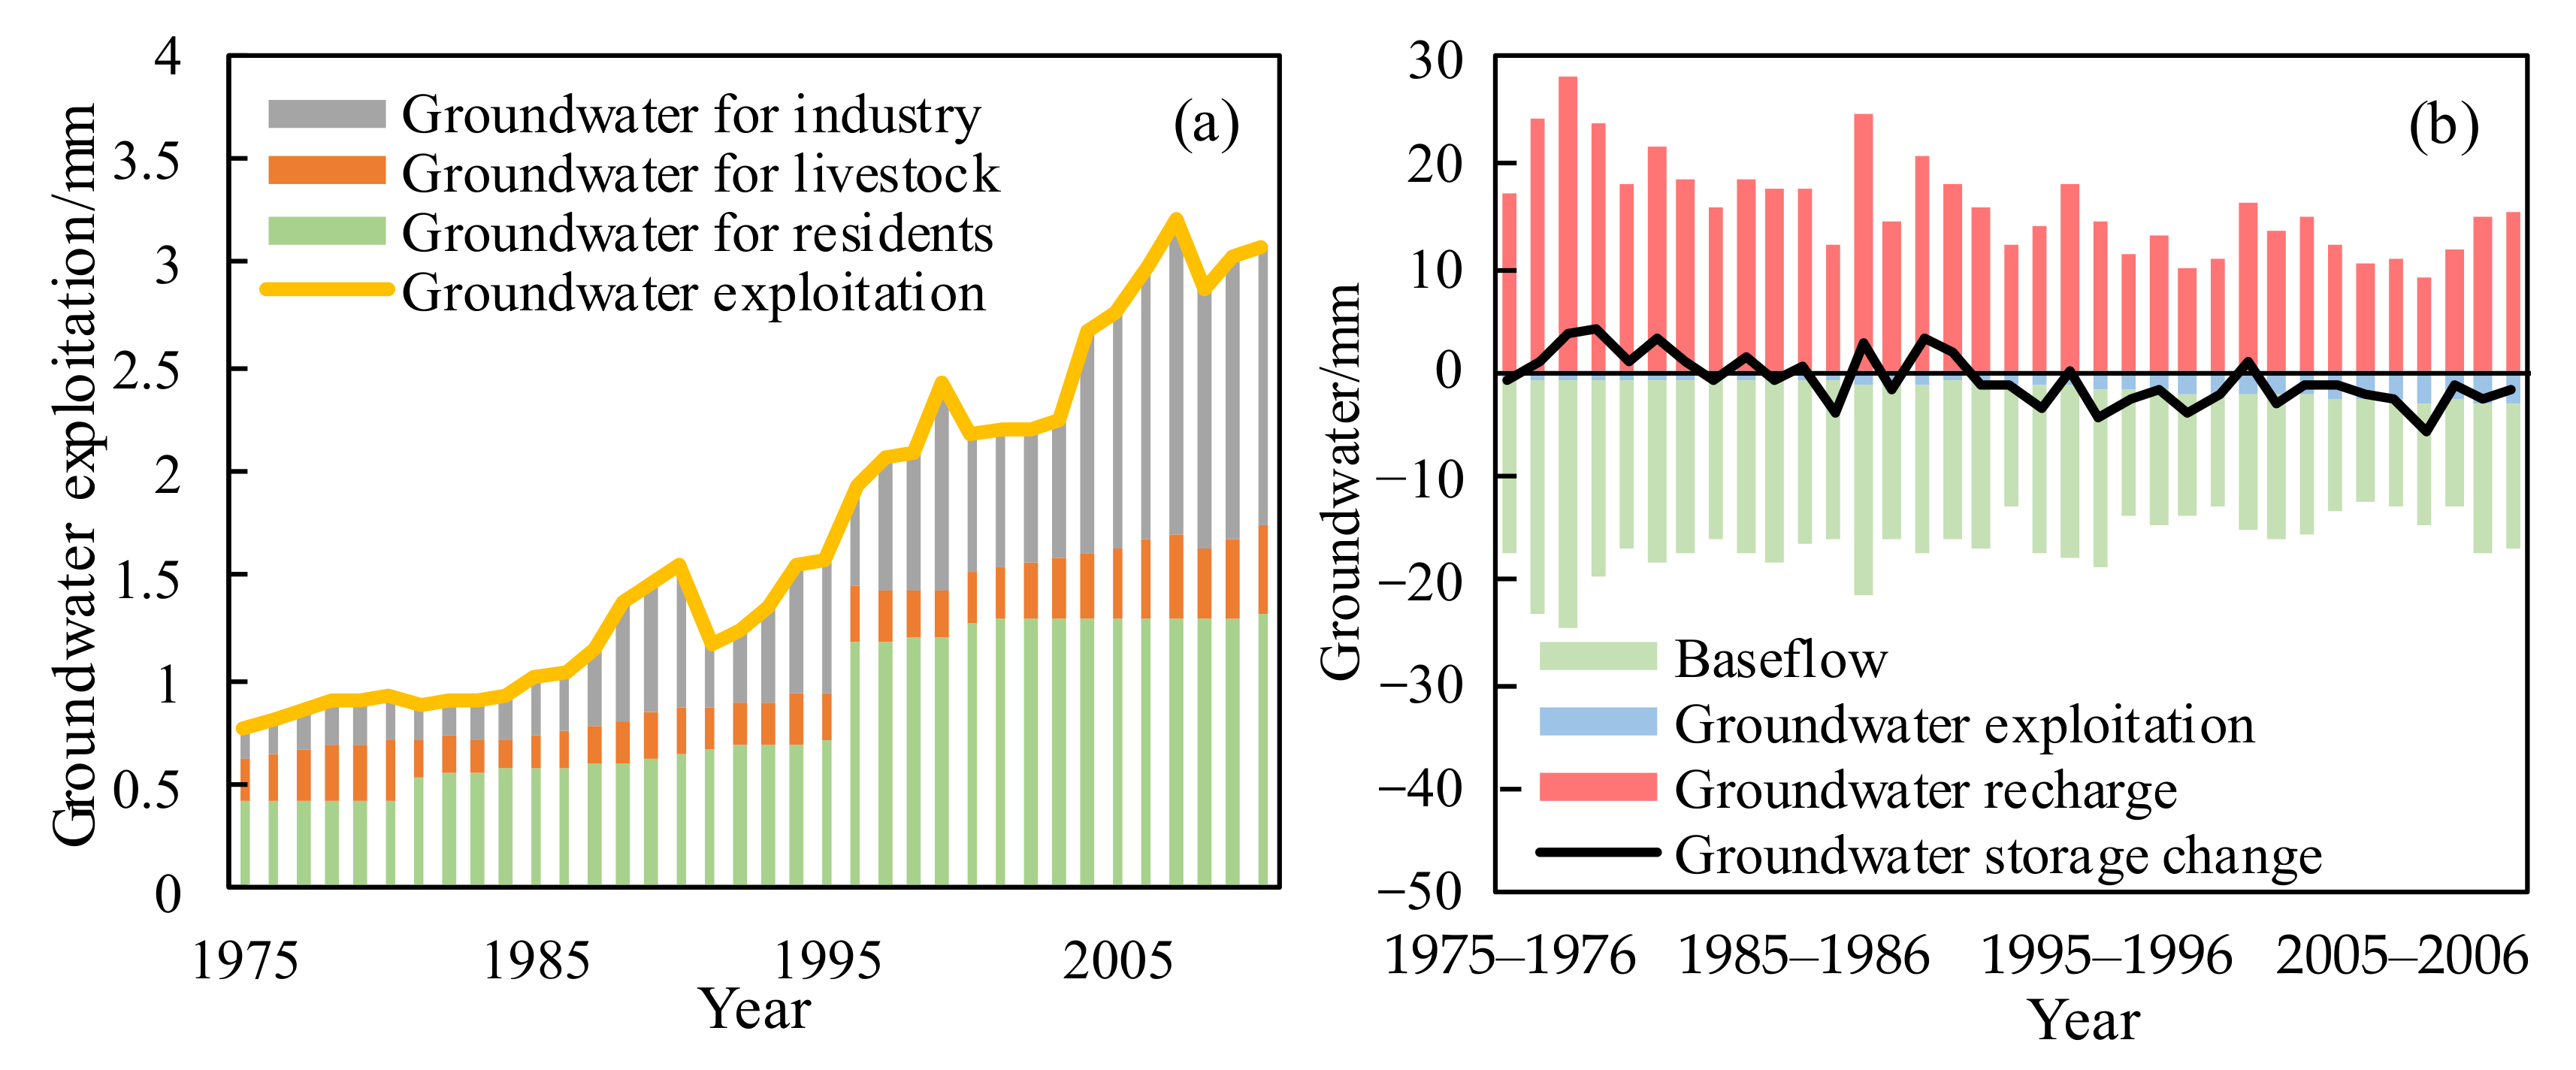
Figure 7a shows the interannual change in investigated groundwater exploitation in the WRB during the period of 1975–2010. It can be found that the groundwater withdrawals for industry, residents, and livestock showed an upward trend, and the total groundwater exploitation amount had an increasing trend with a rate of 0.07 mm/a. In particular, the amount of groundwater exploitation has increased significantly since the 1990s, and the groundwater exploitation in 2010 increased nearly twice of that in 1975. This increasing exploitation directly led to the decline of groundwater storage with the decreasing groundwater recharge driven by reducing precipitation and infiltration together, which further affected the baseflow change in the river basin (
Figure 7b).
From the entire change in groundwater storage over time (
Figure 7b), the groundwater change in the WRB can be roughly divided into two stages. Before the 1990s, the groundwater storage change Δ
G fluctuated around the zero value, which indicated that groundwater storage was at a relatively stable level. Afterward, the groundwater storage change was negative, demonstrating the outflow of the watershed groundwater system was always greater than the recharge of groundwater; hence, groundwater storage was continuing to decline. Combined with the above analysis, it was considered that the precipitation reduction and increasing groundwater exploitation in this period resulted in the continuous decrease in groundwater resources. Statistically, the average difference between the two adjacent groundwater storages was −1.07 mm, which means that the groundwater storage decreased by about 1.07 mm/a from 1975 to 2010, with the total groundwater storage reduction of 38.67 mm during the period.
3.2. Evapotranspiration Change
According to Equation (2), the actual evapotranspiration in WRB was computed by the observed data of rainfall and runoff and the calculated groundwater storage change Δ
G during 1975–2010. The potential evapotranspiration was estimated by the FAO Penman–Monteith equation using observed meteorological data, as shown in
Figure 8.
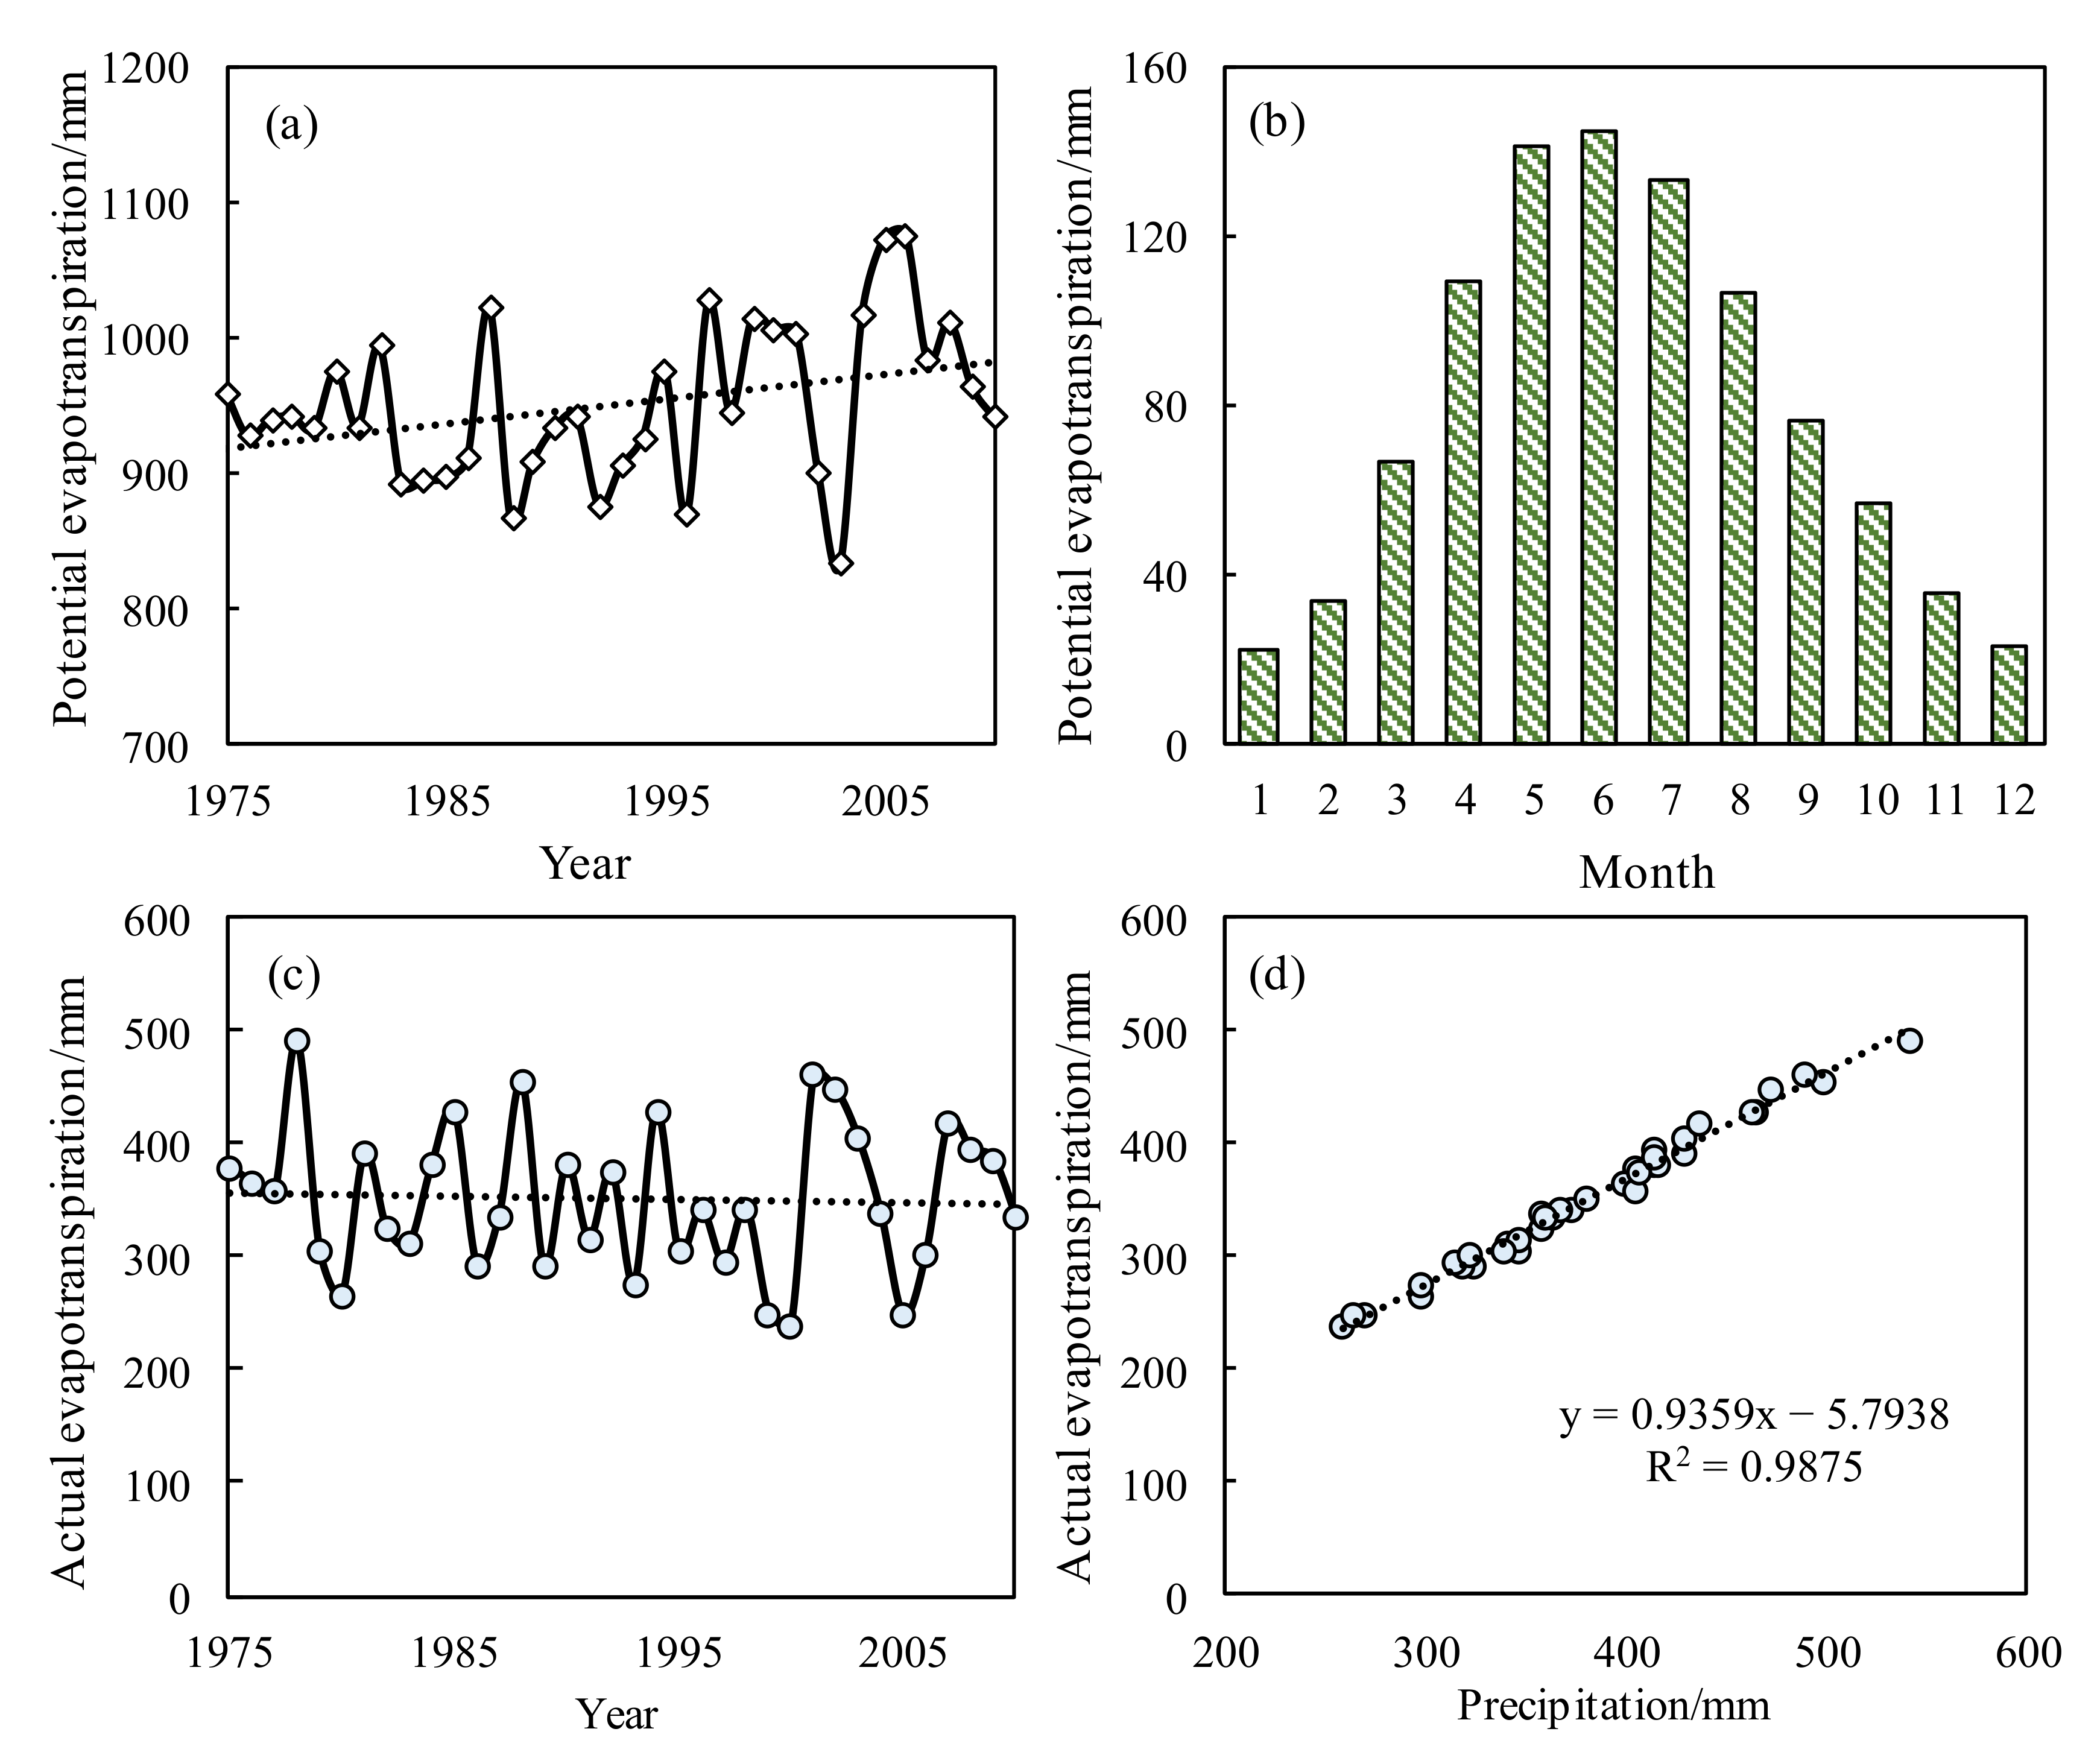
This figure demonstrates that potential evapotranspiration from April to August accounted for most of the annual total potential evapotranspiration, with an average annual evapotranspiration of 951 mm, much higher than the basin precipitation (
Figure 8a,b). It implied that the evapotranspiration capacity was very strong in the basin, and most precipitation may be consumed by evapotranspiration. Additionally, it can be found that the potential evapotranspiration in the WRB represented an insignificant trend from 1975 to 2010, with an increasing rate of 1.79 mm/a.
Figure 8c shows that the actual evapotranspiration in the WRB remained unchanged from 1975 to 2010, only showing a slowly decreasing trend with the rate of −0.53 mm/a, but the trend was not significant. The average annual evapotranspiration was 351.20 mm, accounting for more than 90% of the average annual precipitation (
Figure 8d). It indicated that the evapotranspiration in the WRB was strong, and less than 10% of precipitation was converted to runoff and water storage.
3.3. Attribution of Evapotranspiration Change
Parameter
n denotes a catchment-specific condition, and its change can modify the partition of precipitation between evapotranspiration and runoff. However, parameter
n cannot be measured directly. The calibration of parameter is implemented by Equation (4) based on measured rainfall, calculated potential evapotranspiration, and actual evapotranspiration, and the results are shown in
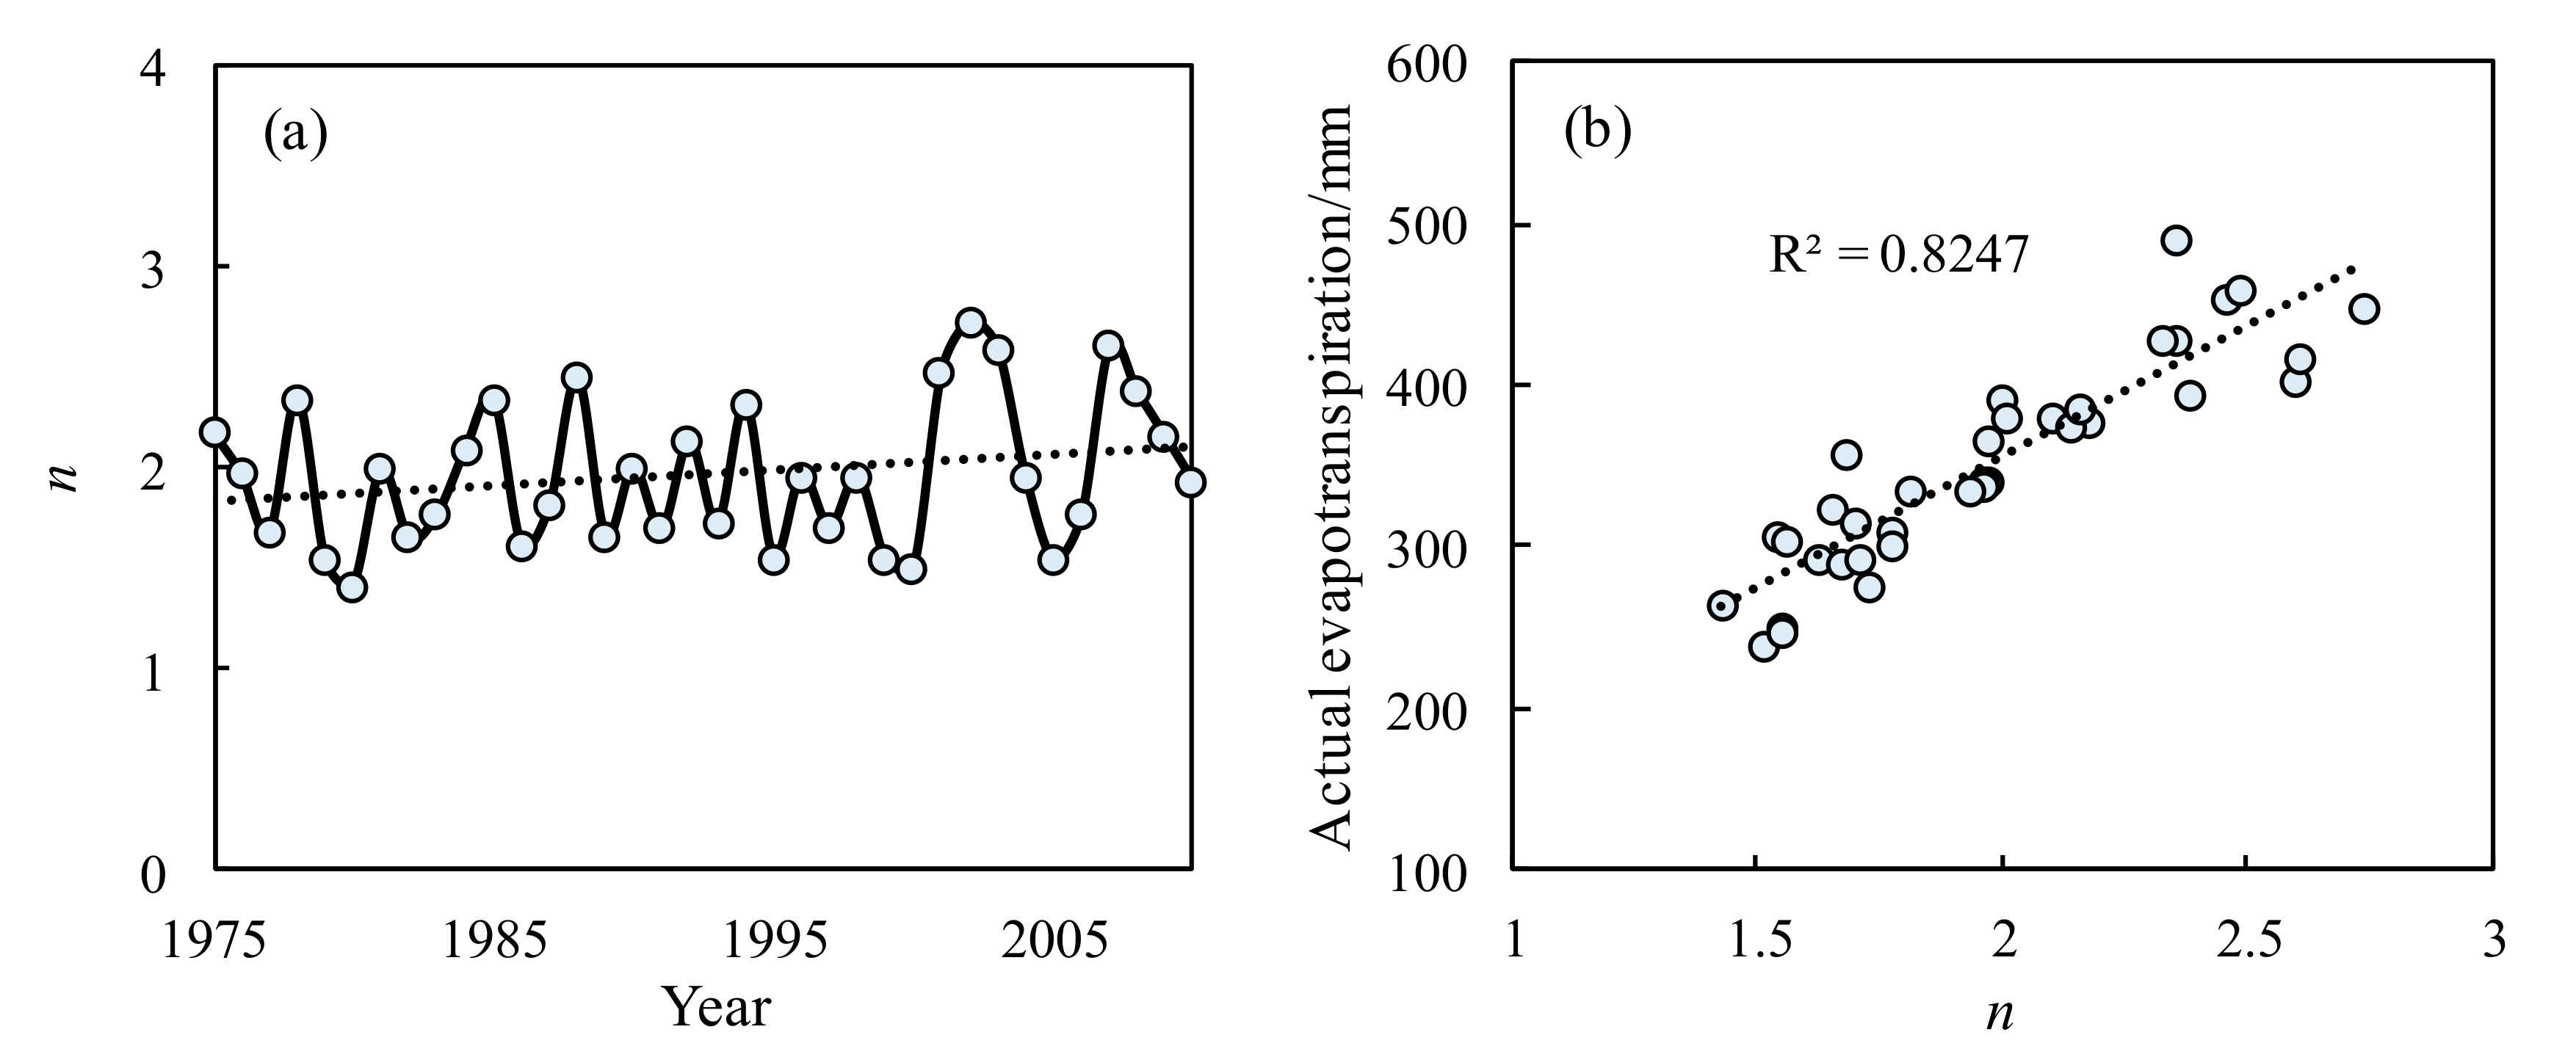
Figure 9.
Figure 9a illustrates that the interannual change in parameter
n represents a weak upward trend. It is known that the larger the
n value, the greater the influence of catchment-specific condition on evapotranspiration in the basin. Thus, the weak upward trend implied that the catchment-specific condition had an increasing impact on watershed evaporation. Additionally, it can be seen from
Figure 9a that the fluctuation of
n was relatively large, ranging between 1.4 and 2.8, indicating that the influence of catchment-specific condition was not consistent over time, and it verified the previous assumption that parameter
n was time-varying. In addition, the other issue found here was that the actual evapotranspiration in the basin exhibited a significant linear relationship with parameter
n (
Figure 9b), which implies that the change in actual evapotranspiration may be greatly impacted by the catchment-specific condition except for precipitation, such as topography, vegetation coverage, and soil hydraulic property.
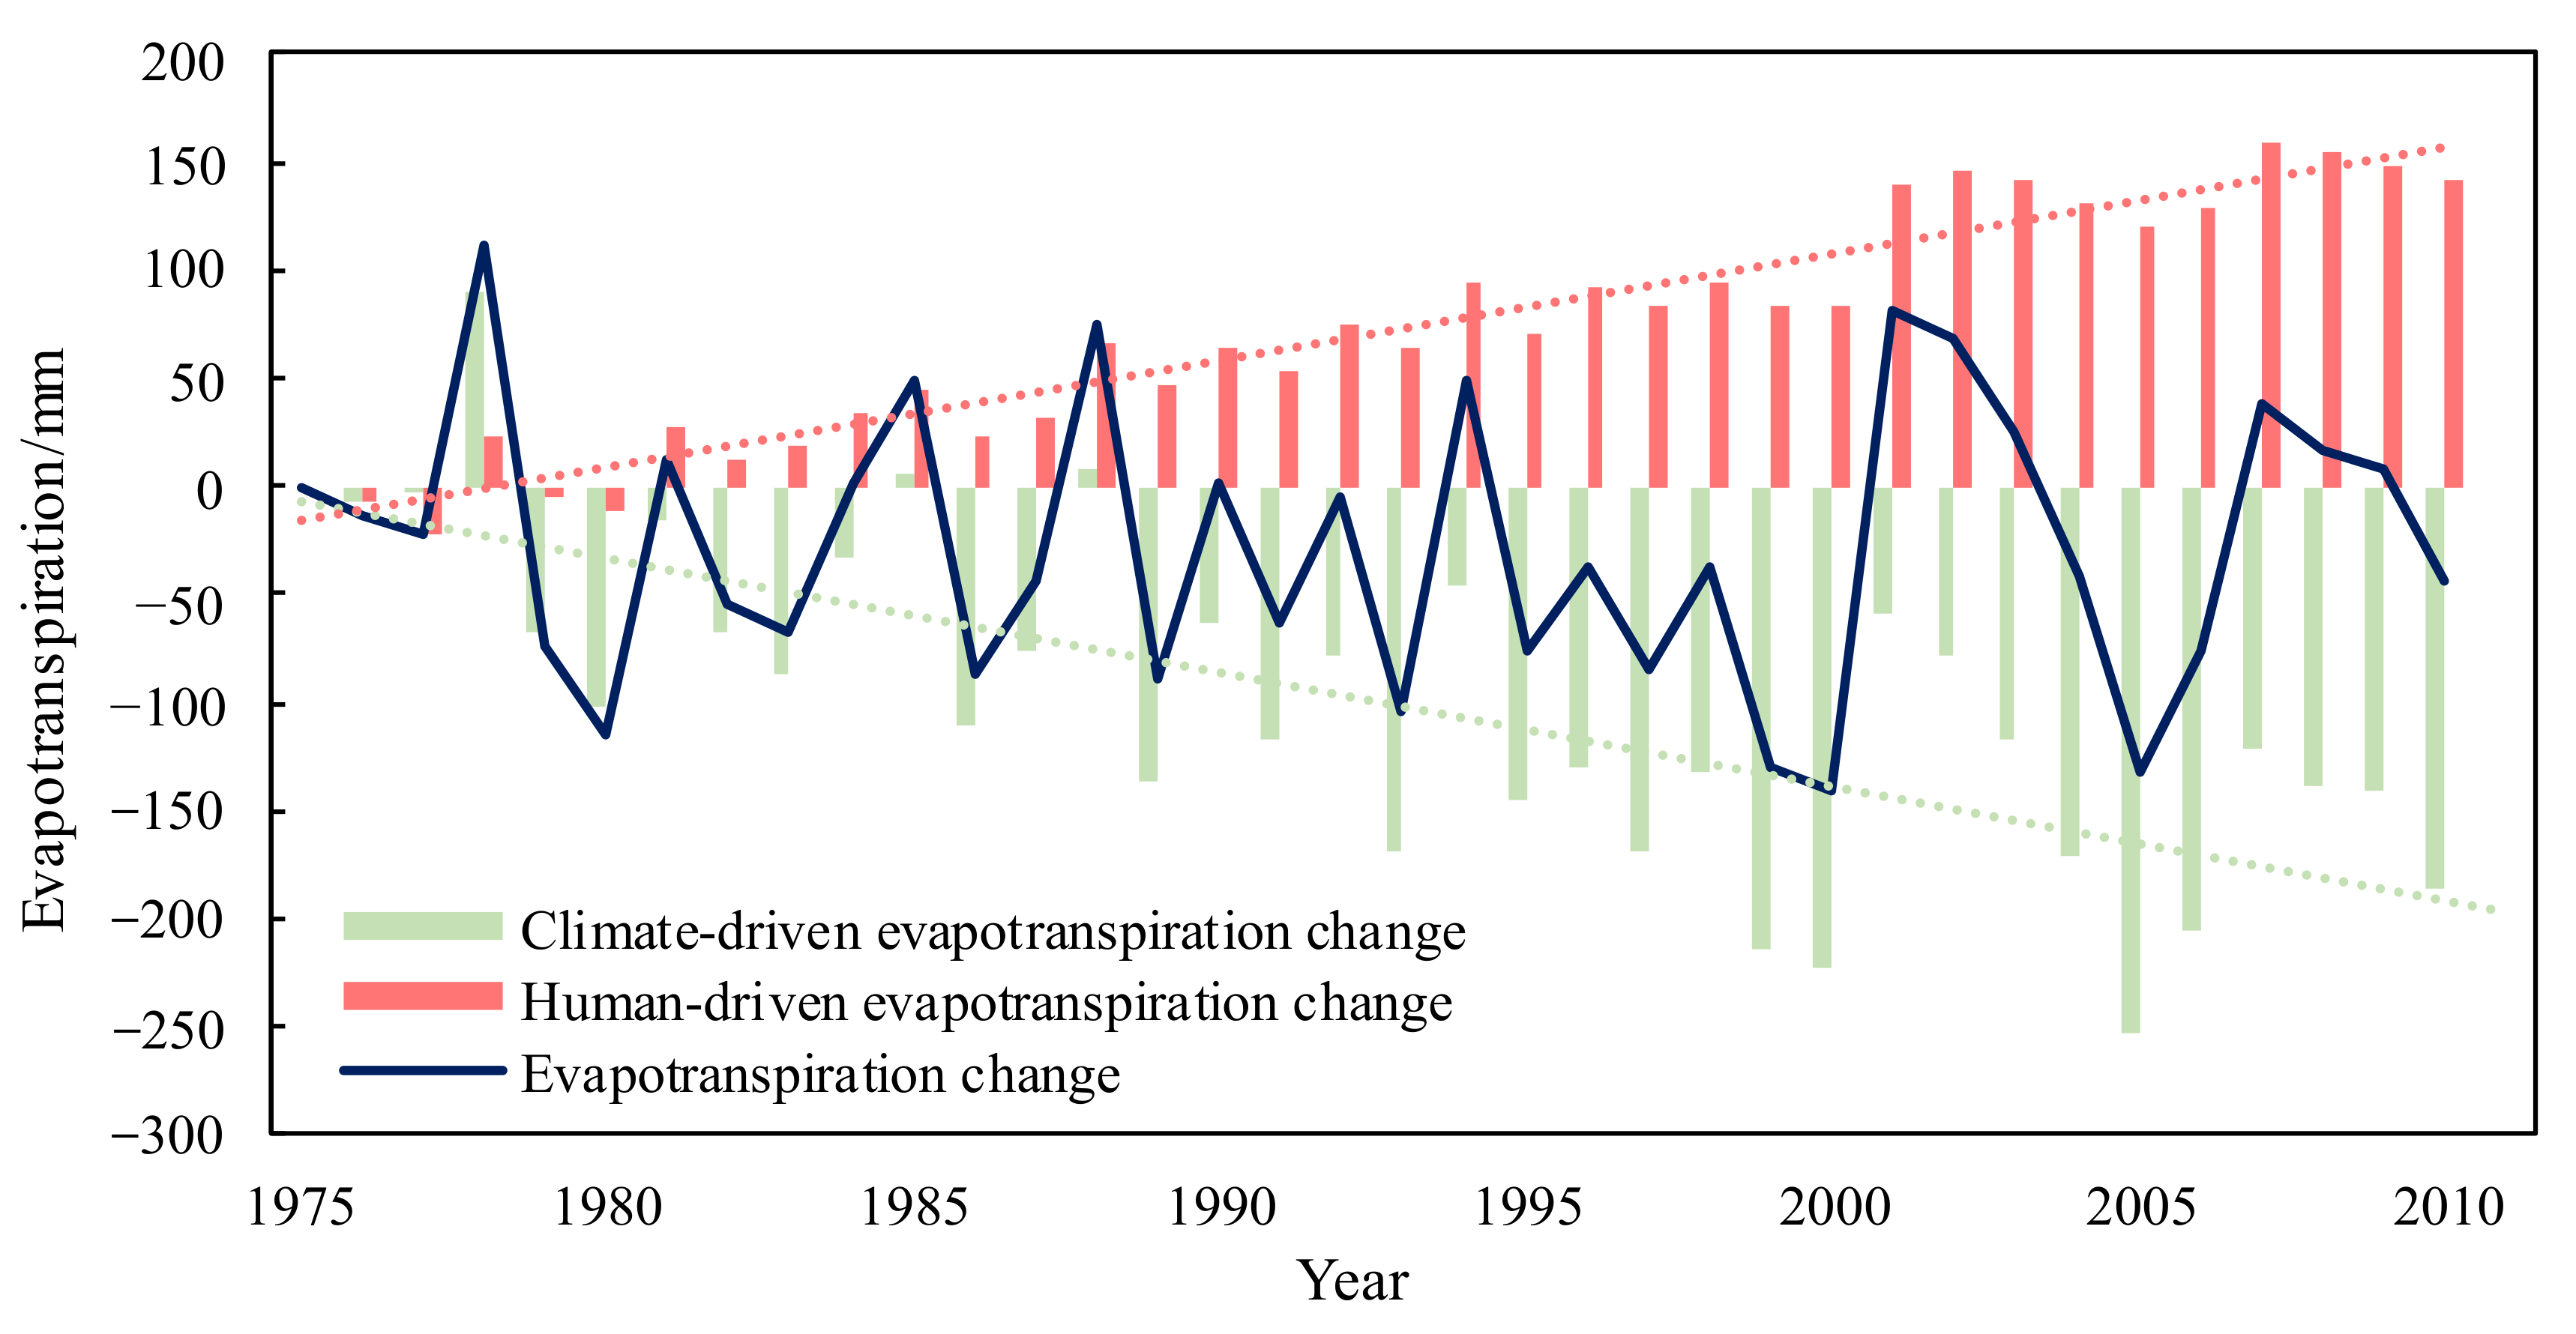
To further explore the driving mechanism of the change in evapotranspiration in the WRB, the decomposition method was employed to quantitatively distinguish the impact of climate change from the impact of human activity on the evapotranspiration change, as shown in
Figure 10. It can be found from the figure that climate change and human activity change drove the evapotranspiration change in the basin simultaneously, of which the climate change as the dominant factor drove the decrease in evapotranspiration, and human activities drove the increase in evapotranspiration. Under the coupled influence of both, the actual evapotranspiration showed a weak downward trend. In terms of time, their impacts were more intense, causing the evapotranspiration change to continuously present increasing fluctuations.
For further exploring the influence of human activities on the evapotranspiration change, the contributions of water withdrawal
and underlying surface condition
were calculated according to the equations described in
Figure 4, and the results are shown in
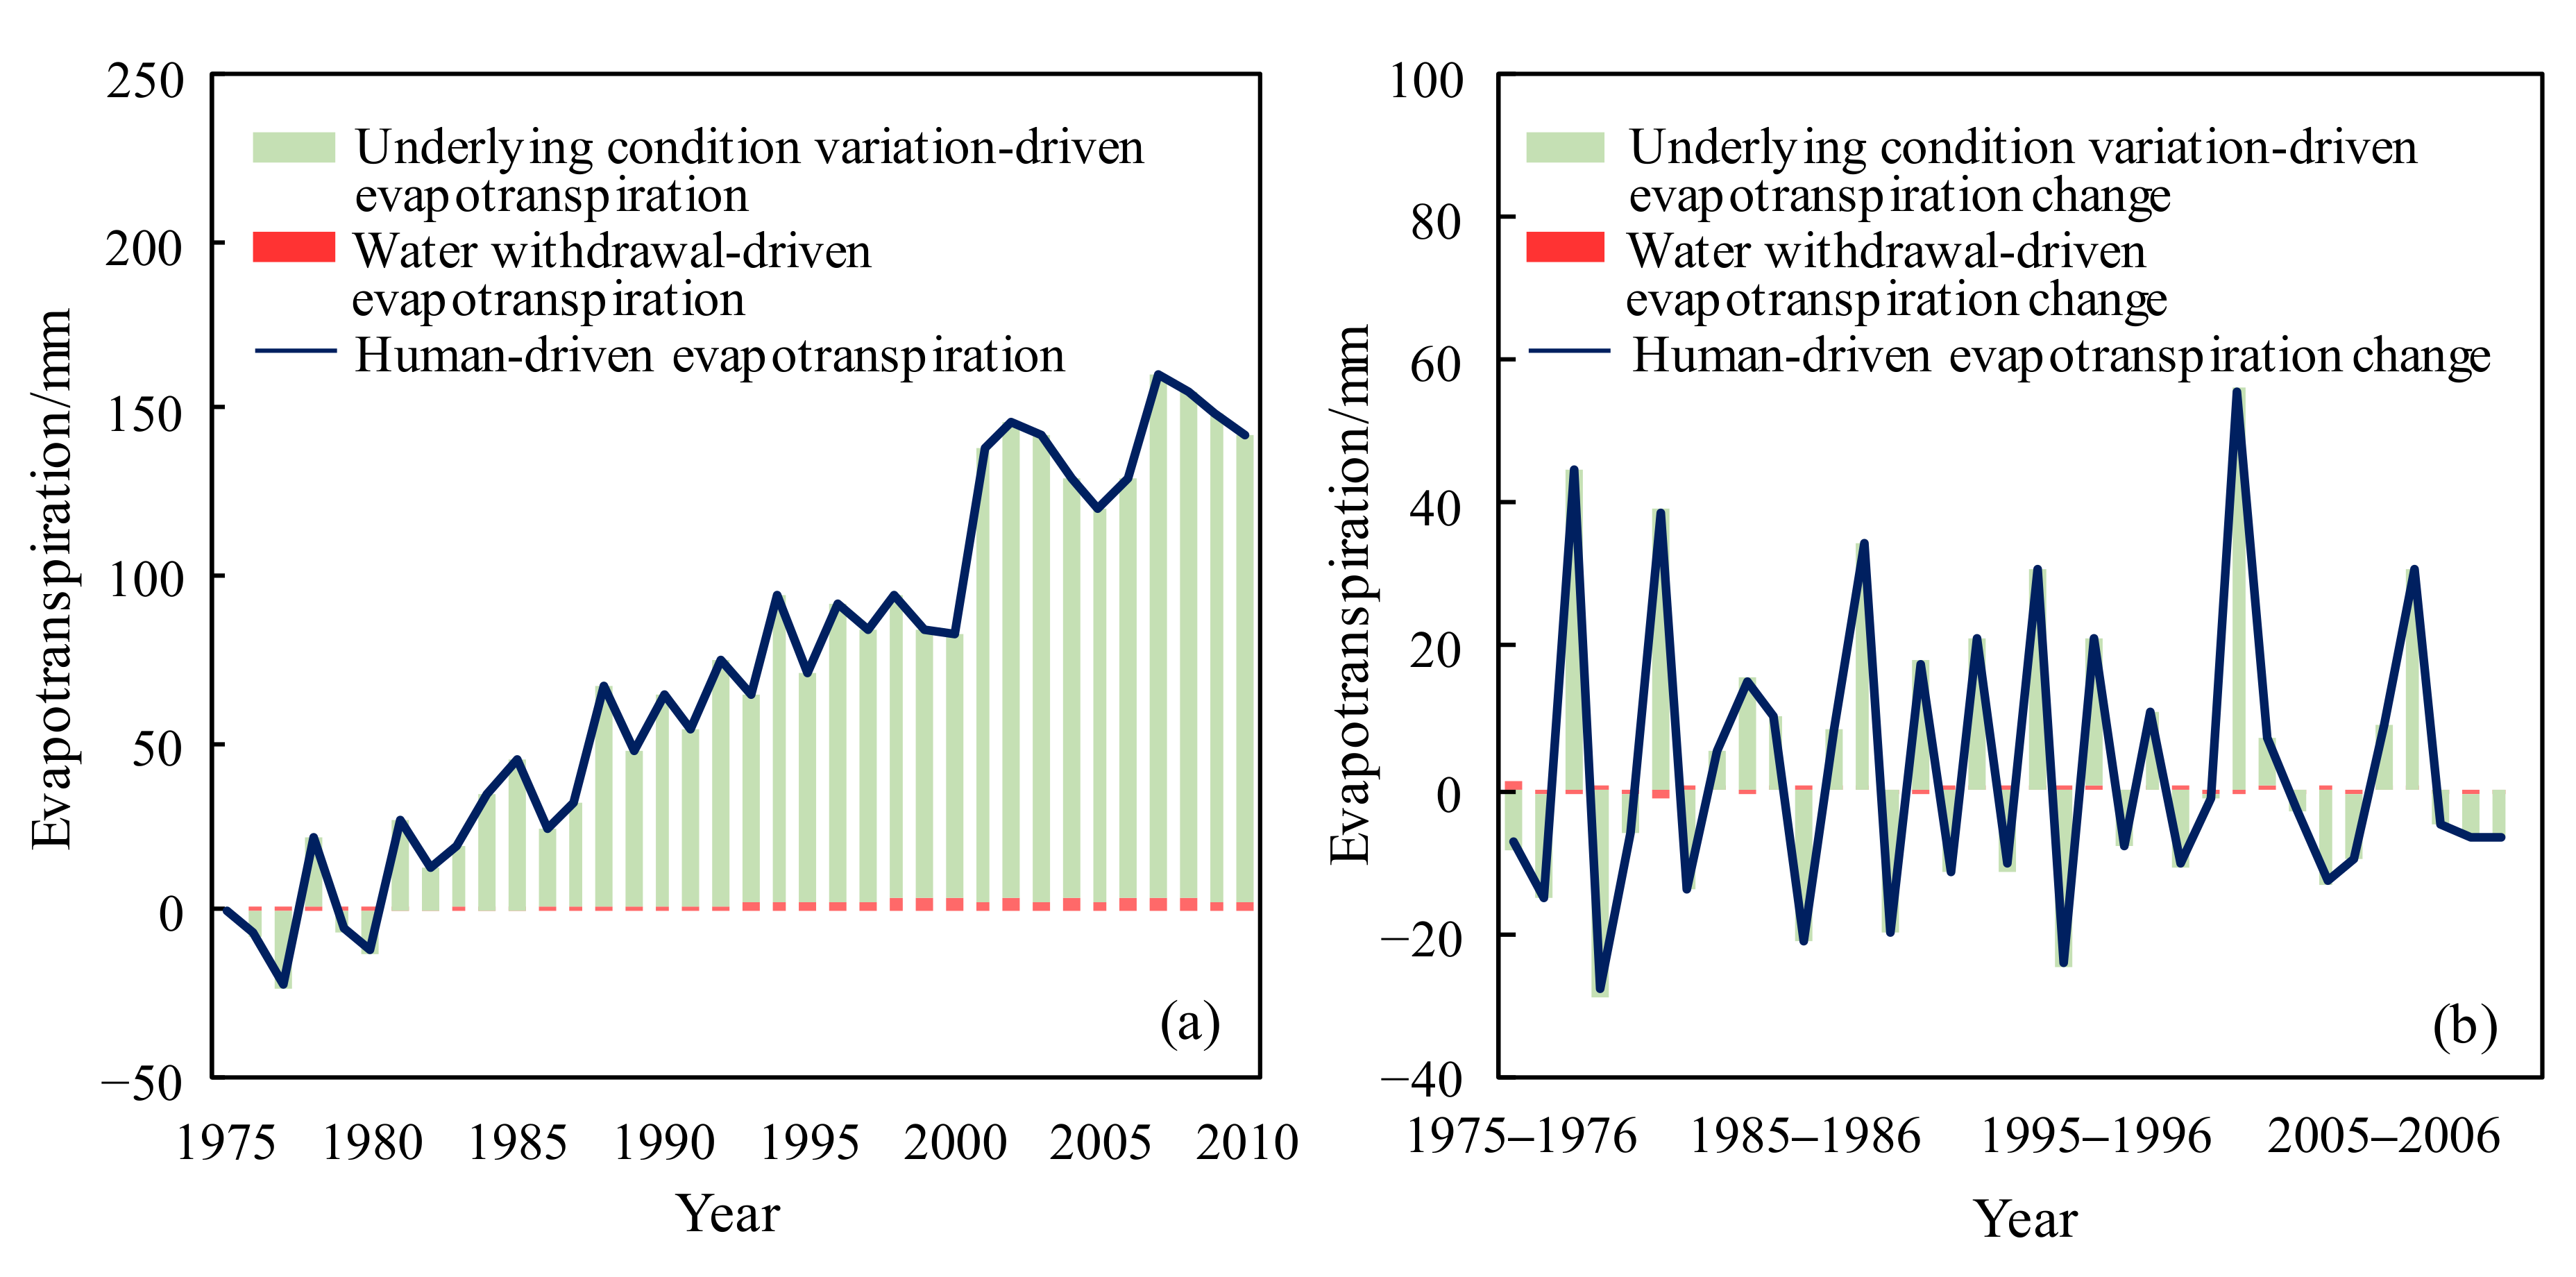
Figure 11.
The figure shows that the contribution of the underlying surface condition change to evaporation was absolutely dominant (
Figure 11a), and the magnitude of contribution of anthropogenic water withdrawal to evaporation was very small, only accounting for 2%, although the water withdrawal was weakly rising, which illustrated that the impact of human activities on the evaporation change was mainly imposed through human-induced underlying condition alteration (
Figure 11b).
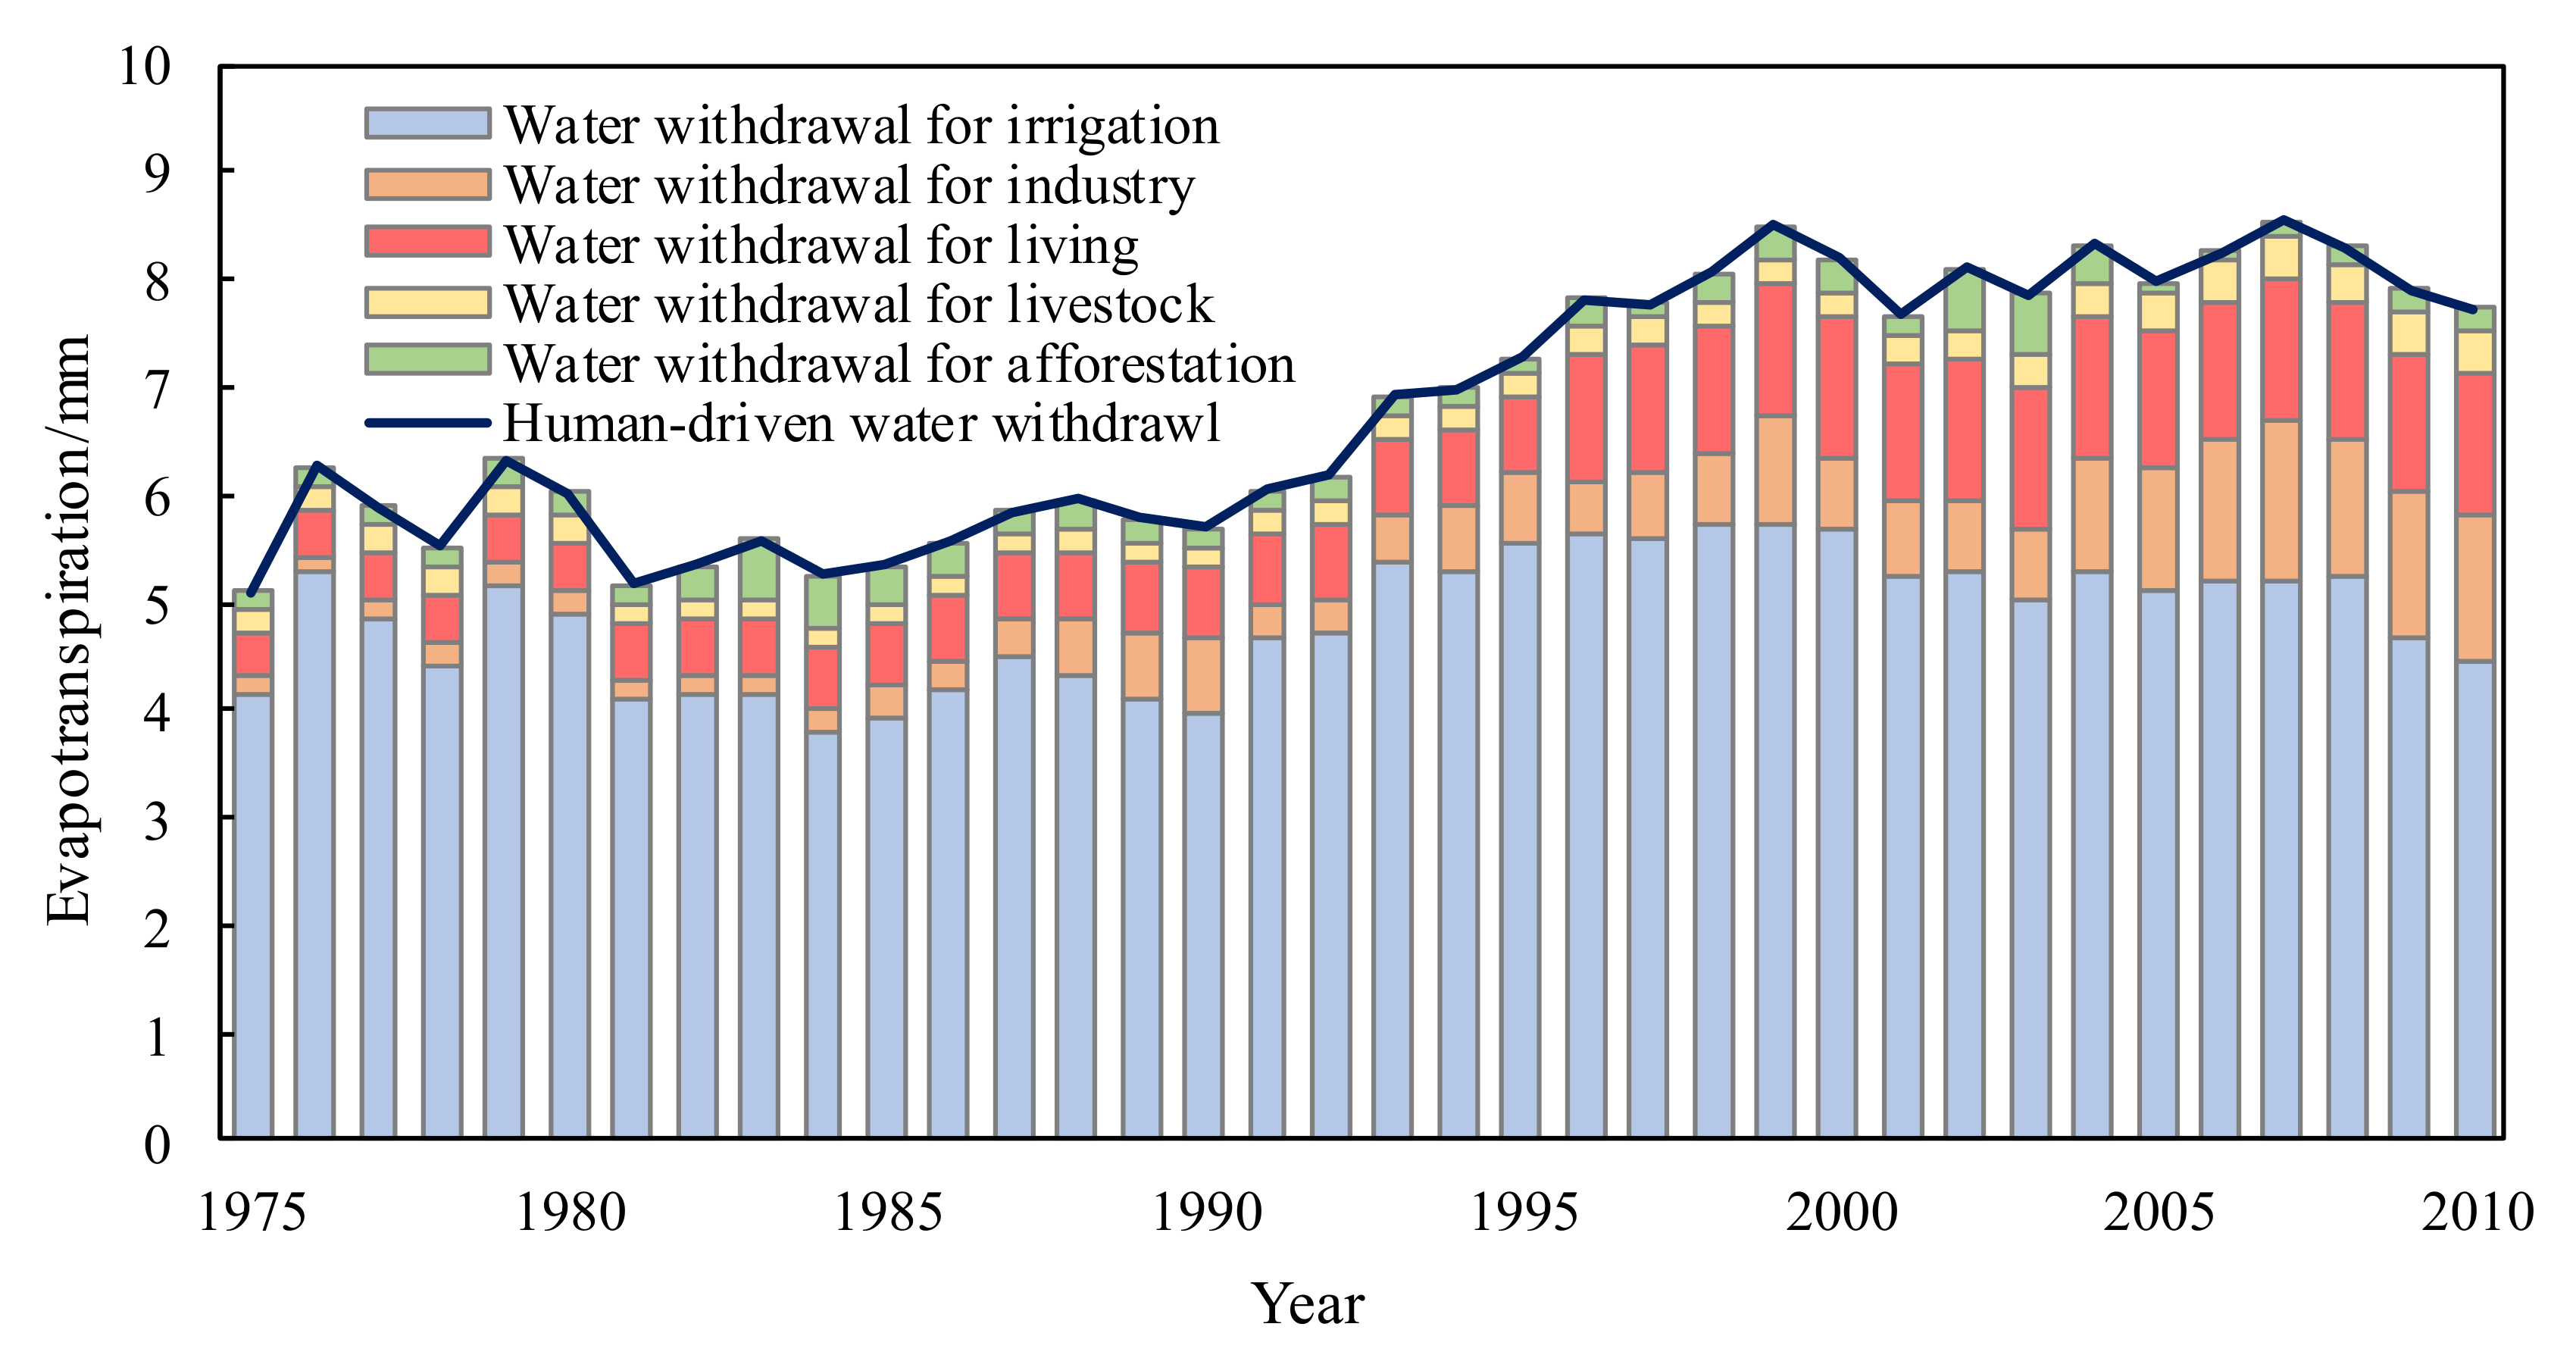
Having a close-up view of the contribution of anthropogenic water withdrawal (
Figure 12), it was easy to find that the change in water withdrawal was relatively stable, fluctuating at the level of 5.66 mm/a before 1990. Afterward, i.e., after 2000, it increased significantly and reached an annual average of 8.08 mm. Additionally, it can be seen that the contribution of anthropogenic water withdrawal to evapotranspiration increased significantly from 1975–2010, with an average change rate of 0.10 mm/a. Among all direct human activities, agricultural irrigation contributed the most to evapotranspiration in the WRB, accounting for 71%, and the average annual amount during 1975–2010 was 4.85 mm. The contribution of industrial, domestic, and livestock sectors to evapotranspiration was on the rise over time, and the contribution of afforestation initially showed an increasing trend and then a decreasing one in the time domain; their magnitudes, however, were small, so that the overall impact was not obvious.
3.4. Attribution Analysis on Runoff Change
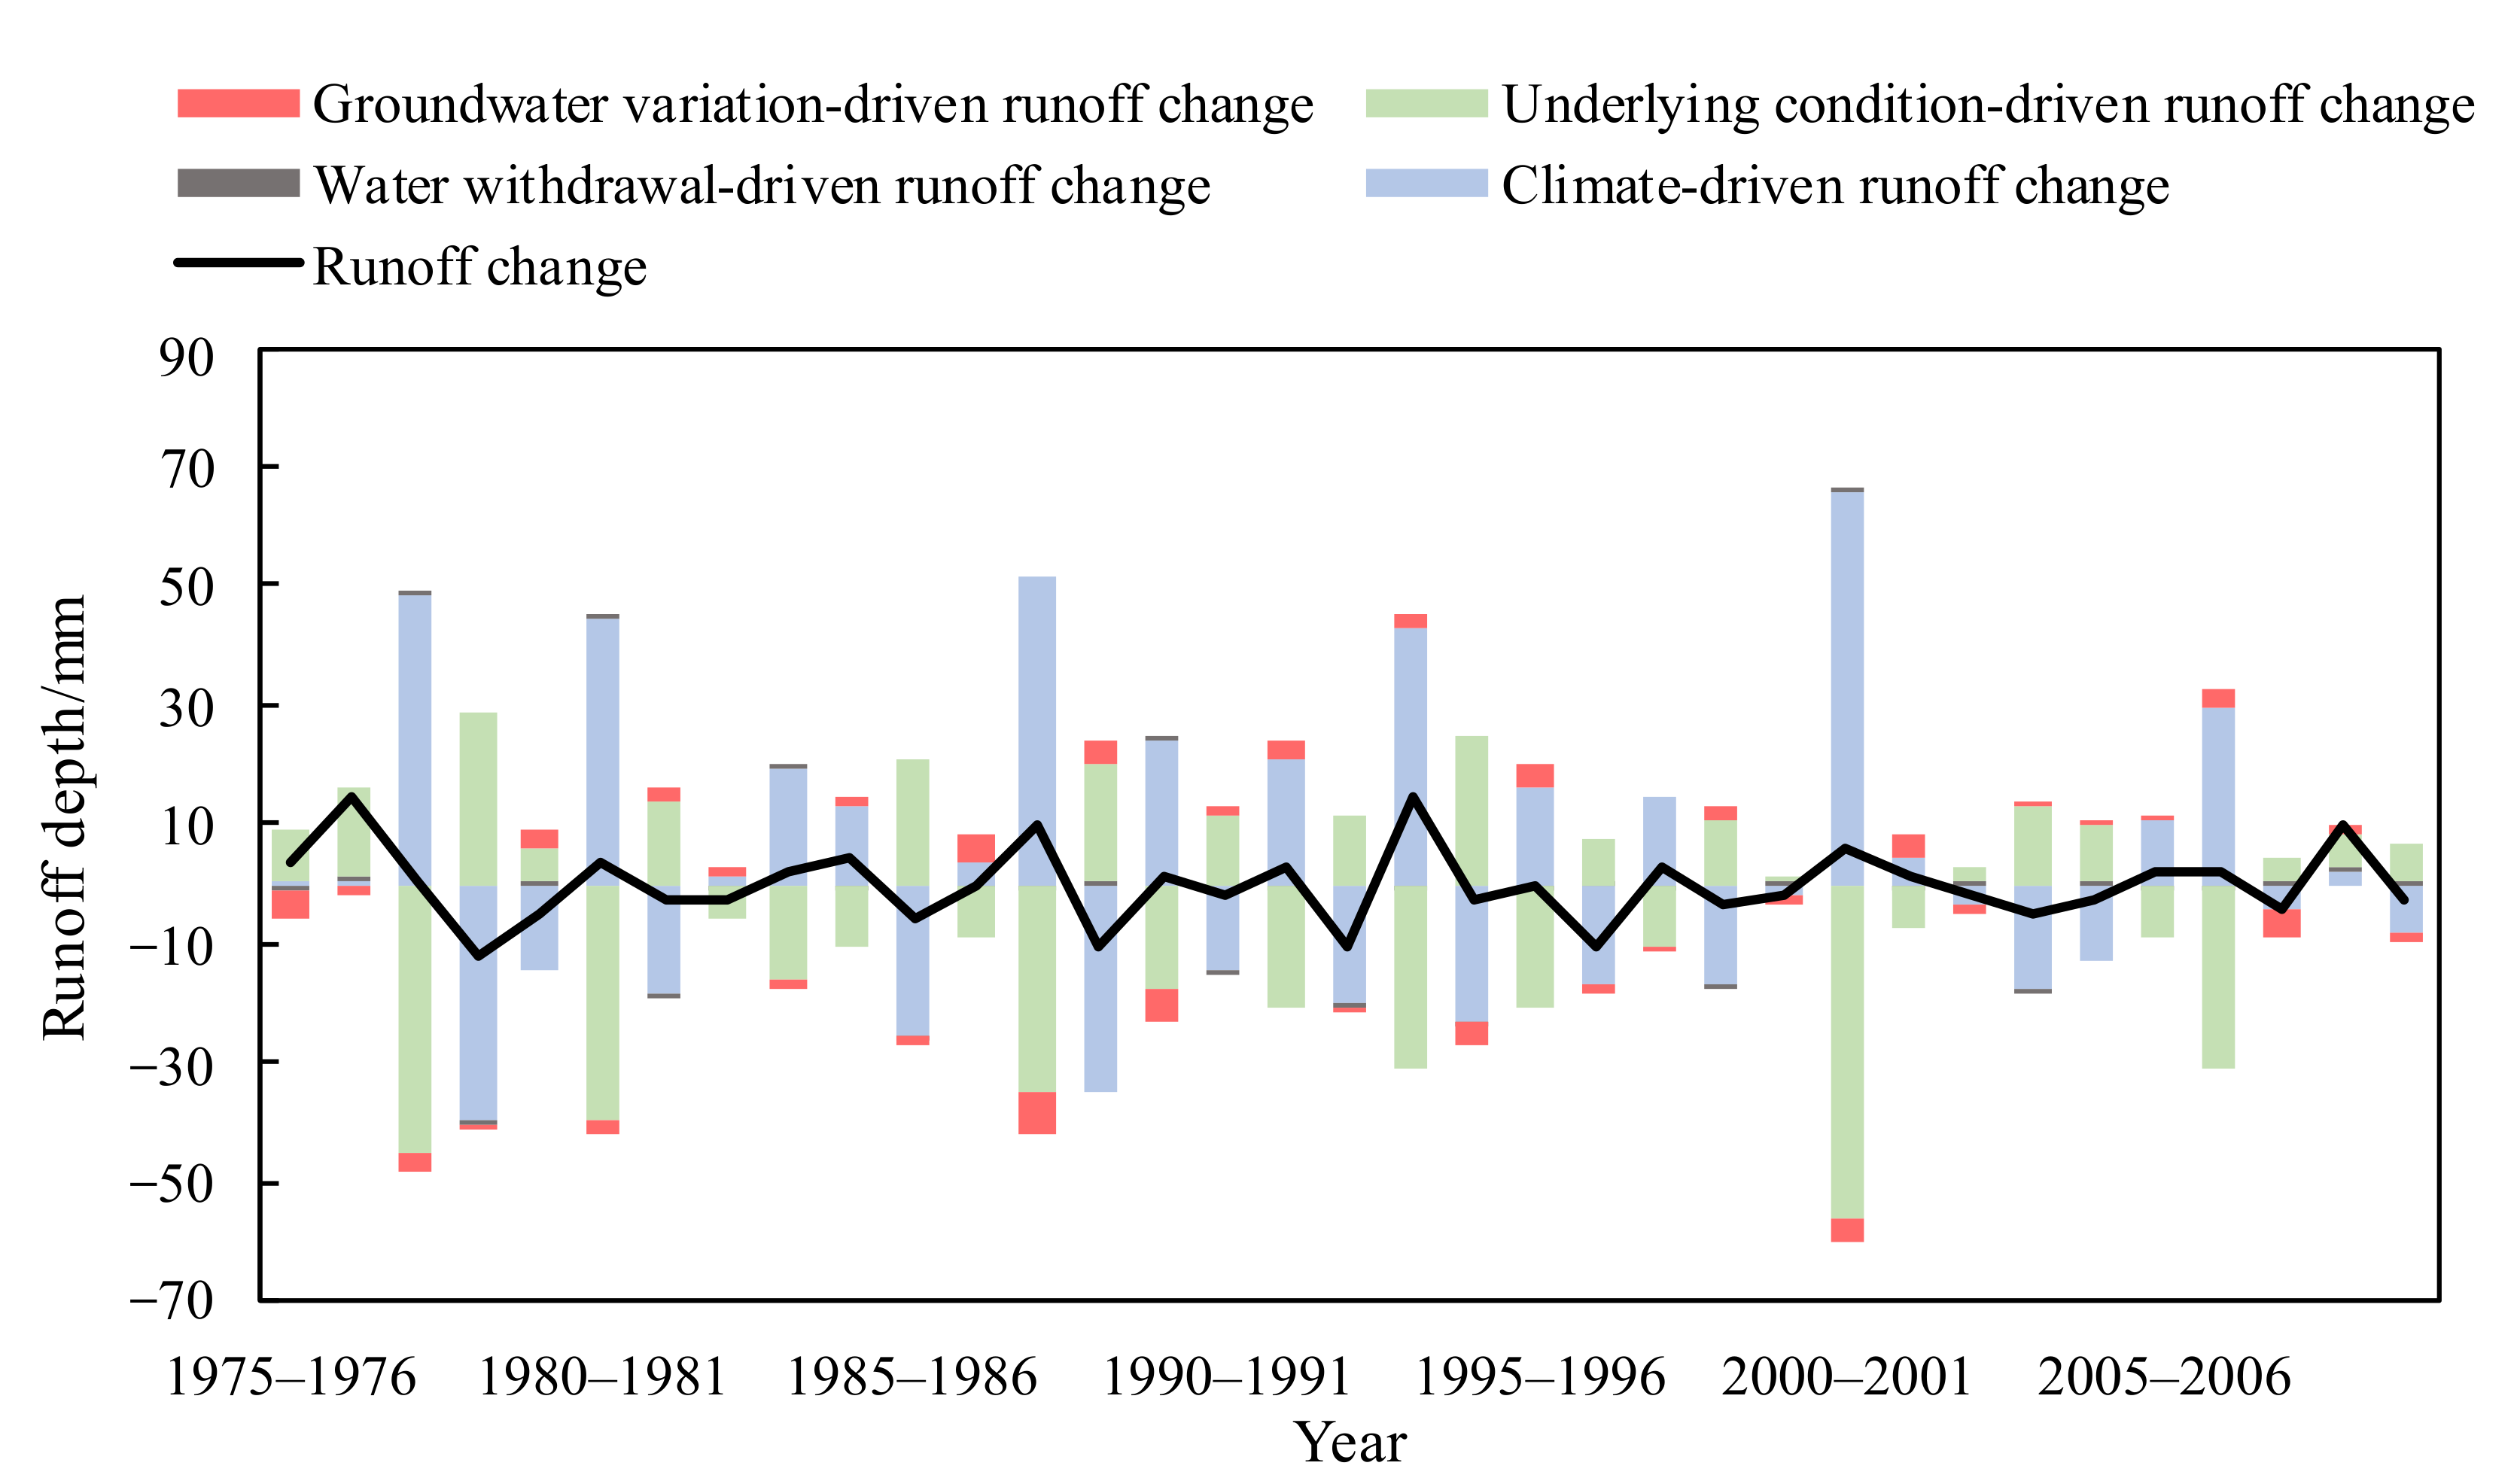
The attribution of runoff change was determined by Equation (8), and the results are shown in
Figure 13. It can be seen from the figure that the contributions of climate change and human-induced change in underlying surface condition to runoff change were much larger than the contributions of anthropogenic water withdrawal change and groundwater storage change, indicating that both climate and underlying surface condition played significant roles in the runoff change. Additionally, it was observed that the runoff fluctuation was positively correlated with climate change, namely driving the runoff increase, and negatively correlated with the change in underlying surface condition, namely leading to the runoff decrease.
The contributions of groundwater storage change and anthropogenic water withdrawal were relatively small, implying these factors were not the dominant factors impacting the runoff change, although contributions of these two factors were also rising (
Figure 13). Based on this analysis, it can be deduced that the human-induced impact on runoff change was imposed by the human-induced alteration of the underlying surface condition.
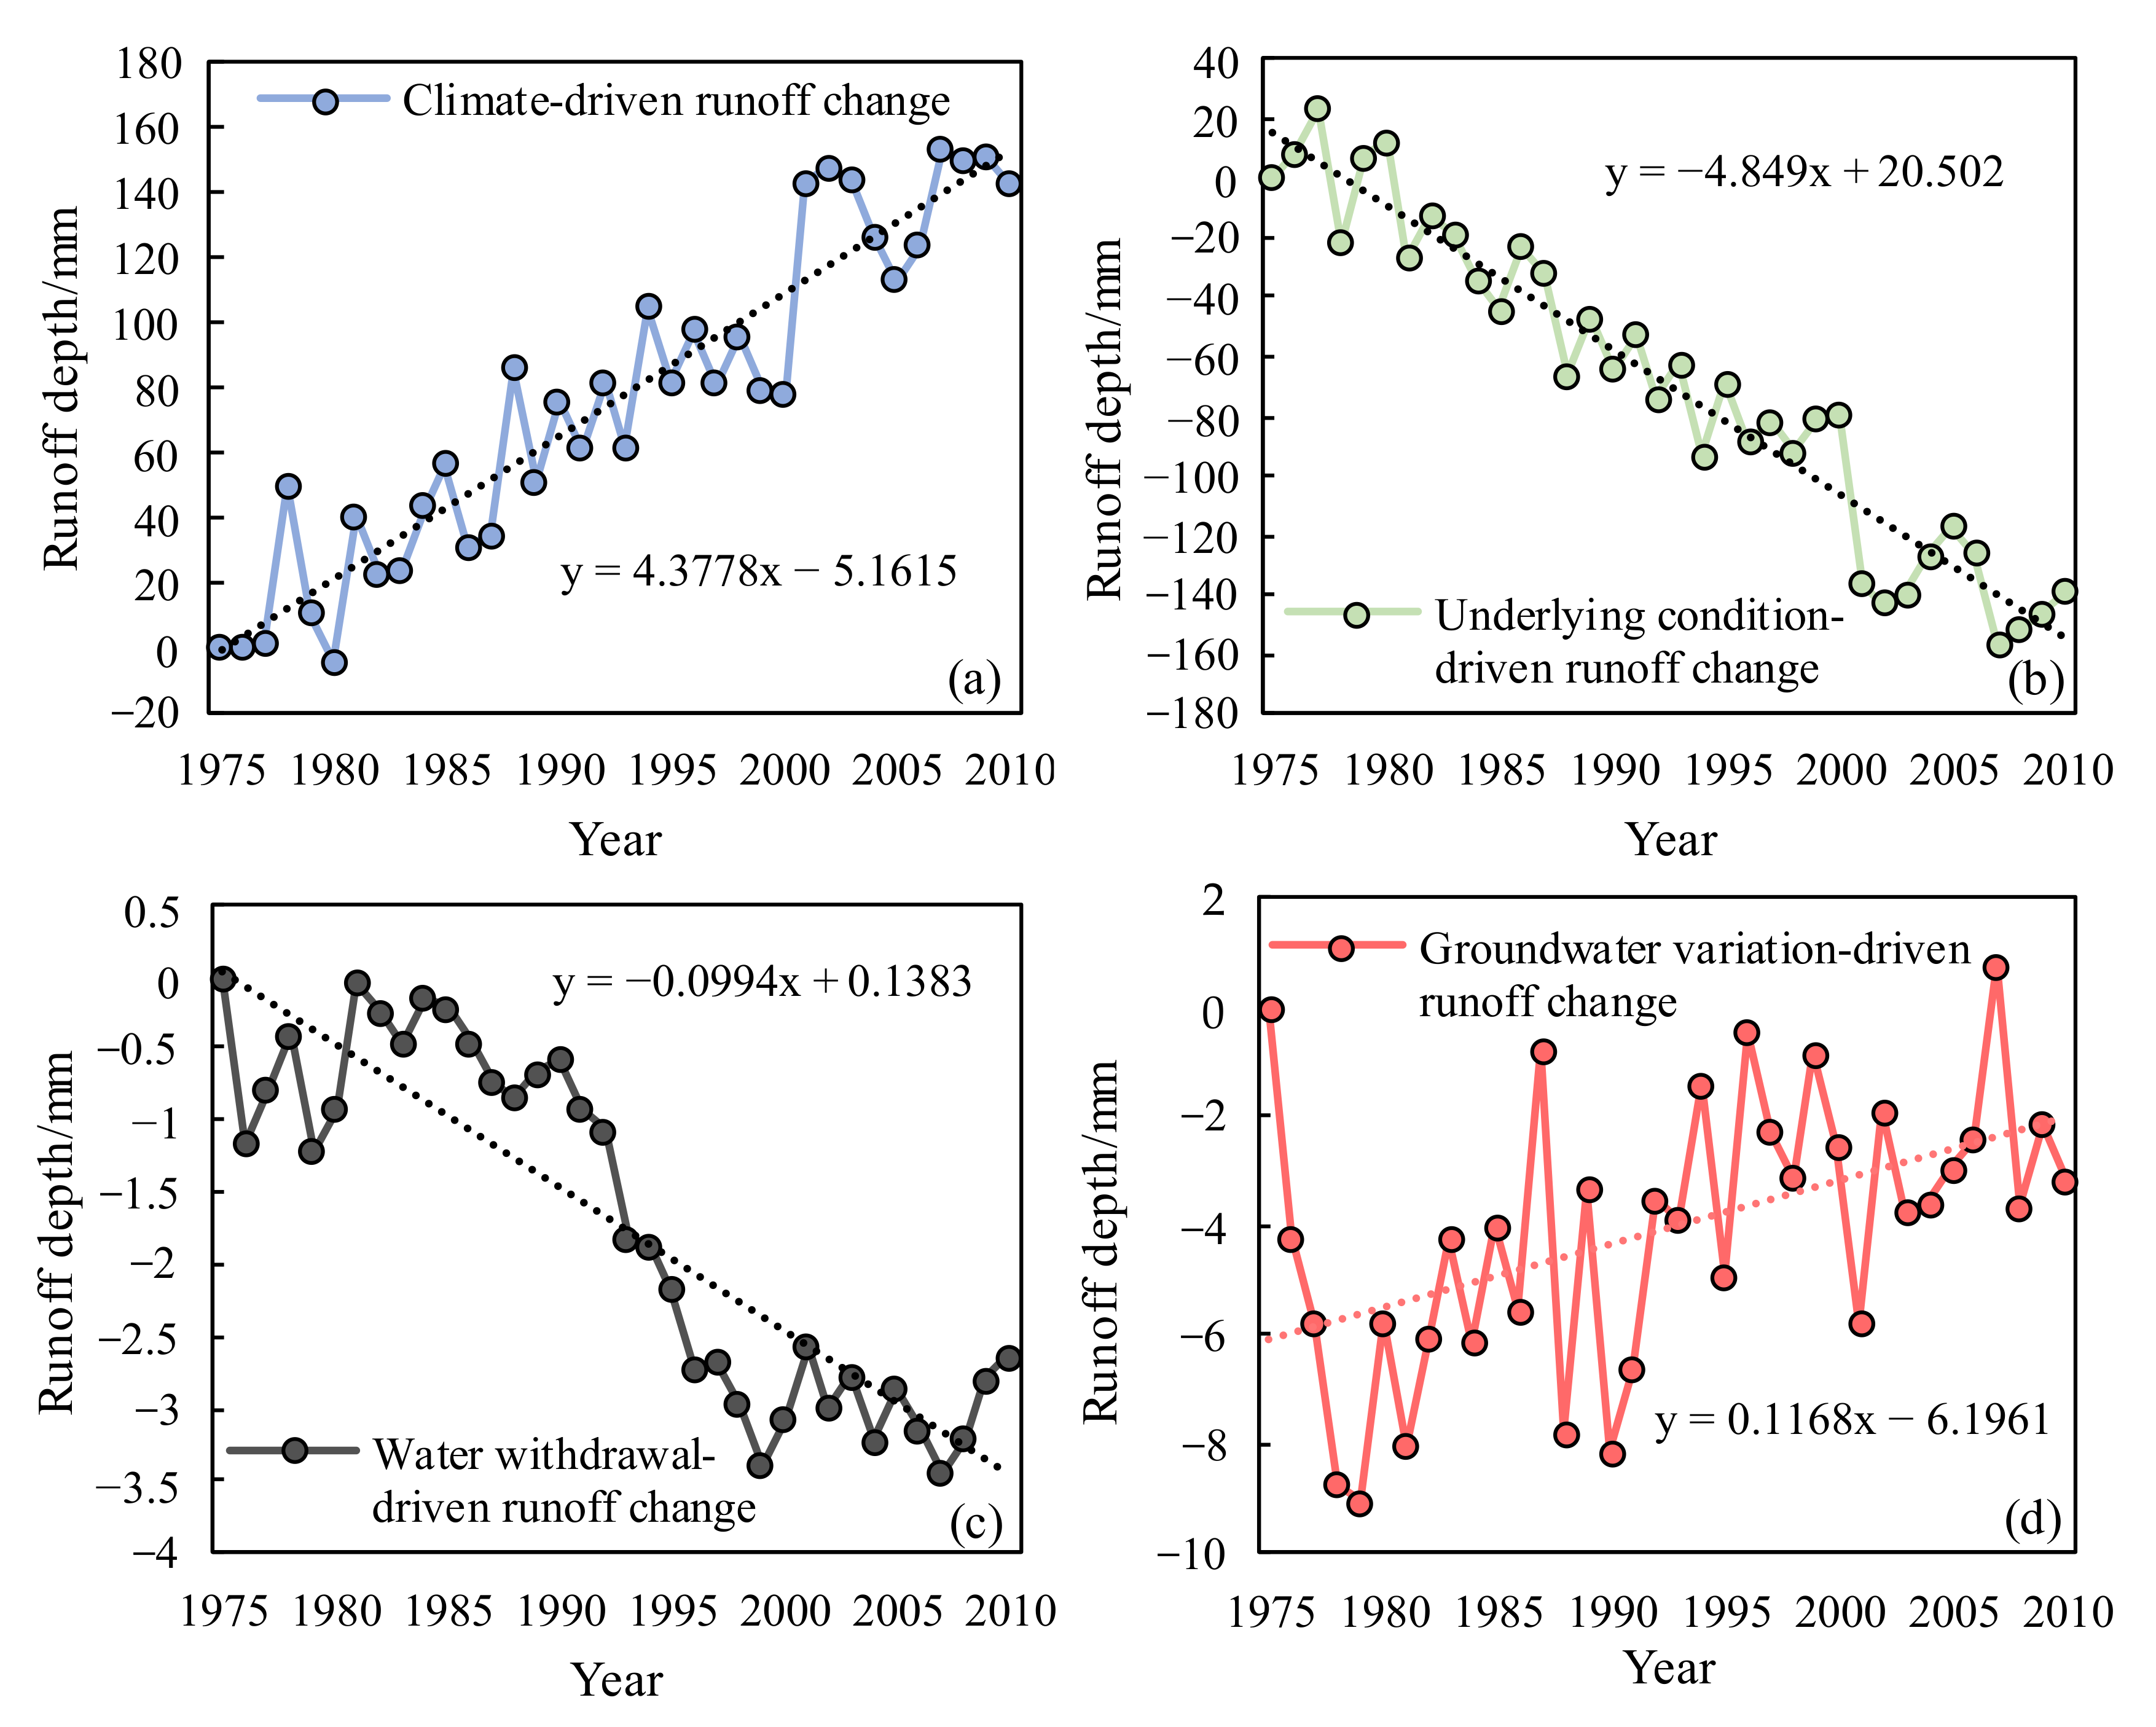
Figure 14 illustrates the interannual runoff change driven by climate change, anthropogenic water withdrawal change, underlying surface condition change, and groundwater storage change. It indicates that the climate change drove the runoff to increase significantly at the rate of 4.31 mm/a, and the underlying surface condition change and anthropogenic water withdrawal change made the runoff reduce at the rates of −4.84 mm/a and −0.10 mm/a, respectively. Groundwater storage change always prompted runoff to decline with fluctuation, representing a rate of 0.12 mm/a.
In short, climate change and the human-induced underlying surface change were the main factors influencing the runoff change. Specifically, climate change made the runoff increase, and the underlying surface change caused runoff to decrease. The runoff in the WRB continued to reduce (0.424 mm/a) under the coupled influence of climate change and human-induced underlying surface change as well as other changes.
3.5. Scenario Simulation
As shown in
Figure 14, four driving equations were achieved by the least square method to describe the relationships of basin runoff change with climate change, anthropogenic water withdrawal change, underlying surface condition change, and groundwater storage change, respectively. Depending on these equations, the simulation framework can be built for analyzing the runoff variation under different scenarios. In this section, a coupled driven scenario is set, representing the changes in water withdrawal and underlying condition caused by policy measures, real climate condition in the next year after the reference year, and groundwater varying with policy measures, to reveal policy implications for catchment water management. The simulation was implemented under four different scenarios regarding 2010 as the reference year with a calculation period of one year and considering climate change with Δ
P = 104.08 mm and Δ
E0 = 5.12 mm, and the results are shown in
Figure 15.
The results in
Figure 15 indicate that the runoff depth in the basin will increase by 11.37 mm and groundwater storage will decrease by 4.21 mm under the present condition, which demonstrates that the contribution of precipitation growth is very limited to the runoff increase due to high evapotranspiration in the WRB, and that groundwater exploitation will still result in the continuing groundwater deficit, because the additional groundwater recharge generated by precipitation growth was not enough to offset groundwater extraction. Additionally, it can be found by comparing the simulation results of different scenarios that the underlying condition change played a significant role in runoff reduction, causing the runoff to decrease with nearly 5 mm, while a 10% increase in water withdrawal only led to a slight decline with 0.28 mm, verifying the conclusion consistent with that above-mentioned that the human-induced underlying surface change was the main factor influencing the runoff change. Thus, two suggestions are given in this study to help managers or policy makers make decisions for sustainable development, which is to reduce the invalid evapotranspiration resulting from the development of crop and vegetation and to control groundwater exploitation in the WRB and the Loess Plateau.
4. Conclusions
Depending on the Budyko-based human-induced water–energy balance (HWEB) model proposed in this paper, hydrological variability under human influence at the annual scale in the Wuding River basin (WRB) was investigated. Specifically, the interannual changes of watershed groundwater storage, evapotranspiration, and runoff from 1975 to 2010 in the coupled socio-hydrologic system were analyzed quantitatively, and the attribution analysis of the actual evapotranspiration and measured runoff changes occurring in the basin was conducted. The main conclusions about the WRB are as follows:
- (1)
Precipitation reduction and increasing groundwater exploitation from 1975 to 2010 resulted in the continuous decrease in groundwater resources in the WRB, with the groundwater storage decreasing by about 1.07 mm per year and 38.67 mm during the entire period.
- (2)
Actual evapotranspiration in the WRB remained unchanged from 1975 to 2010 with average annual evapotranspiration of 351.20 mm accounting for more than 90% of the average annual precipitation, only showing an insignificant decreasing trend with the rate of 0.53 mm/a. It implies that evapotranspiration in the WRB was strong, and only less than 10% of the precipitation was converted to runoff and water storage.
- (3)
Climate change and human activities simultaneously drive the evapotranspiration change in the basin of which the climate as the dominant factor drives the evapotranspiration decrease, and human activities drive its increase. Under the coupled influence of both, the actual evapotranspiration showed a weak downward trend. It should be noted that their impacts are more and more intense over time, causing the evapotranspiration change to continuously increase with fluctuation. Among human impacts, the contribution of human-induced change in underlying surface condition on evaporation change was absolutely dominant, and the magnitude of contribution of anthropogenic water withdrawal was very small, only accounting for 2%, which illustrated the human impact on the evapotranspiration change was mainly imposed through human-induced underlying condition alteration.
- (4)
Runoff change mainly resulted from climate change and the human-induced underlying surface change of which climate change caused the runoff increase, underlying surface change caused it to decrease, and the coupled influences drove the basin runoff to continuously reduce at a rate of 0.424 mm/a with other changes.
According to the above analysis, it can be found that HWEB model is effective in understanding hydrological processes under human impact and can provide more information for climate change adaptation and sustainable water resources development in detail. Additionally, depending on our findings and results of scenario simulation, it is suggested that reducing the invalid evapotranspiration resulting from the development of crop and vegetation in the WRB and other areas in Loess Plateau should be paid more attention as an important policy in the watershed management in the future, because the watershed invalid evapotranspiration will cause runoff reduction and increase watershed water stress greatly. Thus, measures, such as land use and plant species adjustment, should be considered to prevent the ineffective evapotranspiration in the basin, besides controlling the water quota in different sectors. Additionally, groundwater exploitation should be limited or displaced by surface water by adding some surface water storage projects such as reservoirs.


