Variability of Currents and Water Column Structure in a Temperate Estuarine System (Sado Estuary, Portugal)


1
MARE—Marine and Environmental Sciences Centre, Faculdade de Ciências, Universidade de Lisboa, 1749-016 Lisboa, Portugal
2
Departamento de Engenharia Geográfica, Geofísica e Energia (DEGGE), Faculdade de Ciências, Universidade de Lisboa, 1749-016 Lisboa, Portugal
3
Departamento de Biologia Vegetal, Faculdade de Ciências, Universidade de Lisboa, 1749-016 Lisboa, Portugal
*
Author to whom correspondence should be addressed.
Water 2021, 13(2), 187; https://doi.org/10.3390/w13020187
Submission received: 8 December 2020
/
Revised: 9 January 2021
/
Accepted: 11 January 2021
/
Published: 14 January 2021
(This article belongs to the Special Issue Hydrodynamics in Estuaries and Coast: Analysis and Modeling)
Abstract
:The circulation in estuaries promotes the transport of organisms, nutrients, oxygen and sediments. Simultaneously, the mixture of fresh and salt water leads to variations of the physicochemical and biological components of the region. Therefore, it is important to further understand the hydrodynamic patterns of an estuary as one of the bases to understand the whole dynamic of these systems, ecologically important regions that must be preserved. However, little is known about the hydrodynamics of some estuarine systems. In order to bridge the knowledge gap about the Sado estuary, sampling was conducted with the purpose of evaluating some circulation patterns of the estuary and classifying it according to the stratification of the water column. The campaigns were conducted to collect monthly data on the intensity and direction of the currents, and on the temperature and salinity of the water column, between September 2018 and September 2019. The data indicated that water circulation in the Sado estuary, occurred through the two main navigation channels (North and South), according to the tidal regime. Both the temperature and the salinity were homogeneous along the water column, revealing little stratification. The analysis suggests possible hydrodynamic changes of the estuary in the past years.
1. Introduction
Over the years, the definition of an estuary has been refined. However, it is the definition of Cameron and Pritchard [1] that is most widely accepted. According to them, an estuary is a semi-enclosed and coastal body of water with free communication to the ocean and where ocean water is diluted by fresh water derived from land [2]. Essentially, estuaries represent the interface between land and ocean, where river water mixes with salt water [3]. Although there are several approaches for classifying estuaries, traditional approaches consider the origin or geomorphology, the water balance, the competition between tidal flow and river discharge, and the stratification and water circulation characteristics of the system [4]. It is on this last topic, stratification and water circulation, that the present study is focused on, particularly in a temperate estuarine system, the Sado estuary.
In relation to stratification, an estuary can be classified as salt-wedge (fresh water overlaps salt water), as partially-mixed (longitudinal and vertical salinity gradients) or as a well-mixed estuary (relevant longitudinal, but relatively small vertical salinity gradients) [3]. This stratification or mixing along the water column in the estuaries is dependent on several factors: (i) tidal regime, (ii) river flow, (iii) currents, induced by the difference in density between fresh water and sea water, active in maintaining the distribution of salinity in the estuaries [5], (iv) morphology and (v) climatic conditions. The river flow and the currents are mainly responsible for the non-tidal circulation in an estuary [5]. A salt-wedge estuary, the least mixed, is characterized by a high river flow and weak tidal currents. As there is more fresh water to be transported out of the estuary than salt water entering in the system, the river water flows over the salt water, as it is lighter. In partially-mixed estuaries, mixing occurs along the water column but the water at the bottom remains the saltiest. Spatially, salinity decreases upstream. In well-mixed estuaries, the tidal intensity tends to be higher and the river flow is low. In this case, salinity is determined by the variation of the tide and is homogeneous along the water column [6]. Mean flows are usually unidirectional with depth [2]. According to Valle-Levinson [2], Hansen and Rattray [7] proposed the most acceptable scheme to classify estuaries in terms of their hydrodynamics. They used a circulation parameter—the ratio between the surface flow and the sectionally averaged flow—and a stratification parameter—the ratio between the top-to-bottom salinity difference and the mean salinity over an estuarine cross section. Both parameters were non-dimensional and tidally and cross-sectionally averaged variables [2].
The oceanic water is believed to influence the entire Sado estuary, as high salinity values were previously observed throughout the whole estuarine area [8]. Sousa and Lourenço [8] observed that the salinity was vertically heterogeneous, so they referred that the Sado estuary was partially-mixed. However, mean salinity values (tidal and vertical averages) were used together with data on the currents, to calculate the stratification and circulation parameters defined by Hansen and Rattray [7], and according to this criterion, the estuary was classified as having a low stratification [9]. Following this classification, the circulation in the estuary would tend to be dominated by the tide and have mean flows usually unidirectional along the water column. The Sado river is characterized by having a low flow rate and for a low displacement of water, as it is under the influence of arid climate and does not suffer great differences of altitude during its course to reach the estuary [8].
Although the dynamics of an estuary can be described in a very generalized way, estuaries are characterized as much by similarities as by differences [10]. The Sado estuary is an example of that, having distinctive properties. The first oceanographic studies carried out in the Sado estuary occurred throughout the 1970s. In terms of the circulation regime in the Sado estuary, Sousa and Lourenço [8] reported that the entrance of water was made mainly through the North navigation channel, being the South navigation channel the focal area of water outflow. The estuary was described by showing a pronounced asymmetry in both tidal regimes between the North and South channels, not only in the intensity of the current (higher values were observed along the South channel), but also in the ebb-flood reversing time (North channel with a faster response to the change of the tide). Also, the residual current was observed to be directed to the northern channel while the southern channel showed a classical net estuarine circulation—the vertically integrated residual flow was seaward although the deep layers moved up-estuary and the surface layers moved towards the sea [9].
More recently, few oceanographic studies have been conducted in the estuary. Nevertheless, the application of the MOHID 2000 model in Sado estuary is worth to be mentioned. MOHID is a water modeling system initially developed to study the circulation in coastal and oceanic areas [11]. It was applied in the Sado estuary for a hydrodynamic analysis, in order to evaluate its trophic level, as well as to identify the most important factors that influenced it [12]. The circulation regime obtained using MOHID for the estuary presented results in agreement with previous studies.
Estuarine margins along the Sado estuary have slowly been modified as human settlement led to the artificialization of the coast throughout time. Furthermore, they motivate frequent dredging works in the navigation channels, in order to maintain the navigability of the estuary. All these human influences lead to the destruction of intertidal zones, to the introduction of polluting sources within the estuary (from industrial units and ship movements) and influences the circulation in the estuary [13]. A scientific understanding of an estuary is of great practical importance [14]. Knowing in depth the hydrodynamics of an estuary is needed to give scientific support to large-scale works, such as dredging operations, to ensure safe navigability conditions or to predict how coastal structures are affected by the estuarine dynamic, among others features. It is the basis for a correct regional management. An example of this is the work of Ysebaert et al. [15], whose results on hydrodynamic modeling applications in analyzing the consequences of some management options in the Southwest Delta (The Netherlands) were discussed with the different regional authorities, who adopted some of the recommendations and used the study to define some local procedures.
The present study aimed to investigate circulation patterns and the existence of stratification of the water column in the outermost area of the Sado estuary, as well as to understand how these parameters could be defined throughout time and space. Little is known about the hydrodynamics of the Sado estuary, where most of the studies were conducted a long time ago. Recognizing the great value of having this in situ dataset, scarce at a regional, but also at a global level, the full dataset is also provided as Supplementary Materials, available for future applications (see Supplementary Materials). Therefore, this study is a solid contribution for studies on climate change, numerical modeling or satellite remote sensing (e.g., for the development of standard algorithms to apply in coastal waters).
2. Materials and Methods
2.1. Sado Estuary
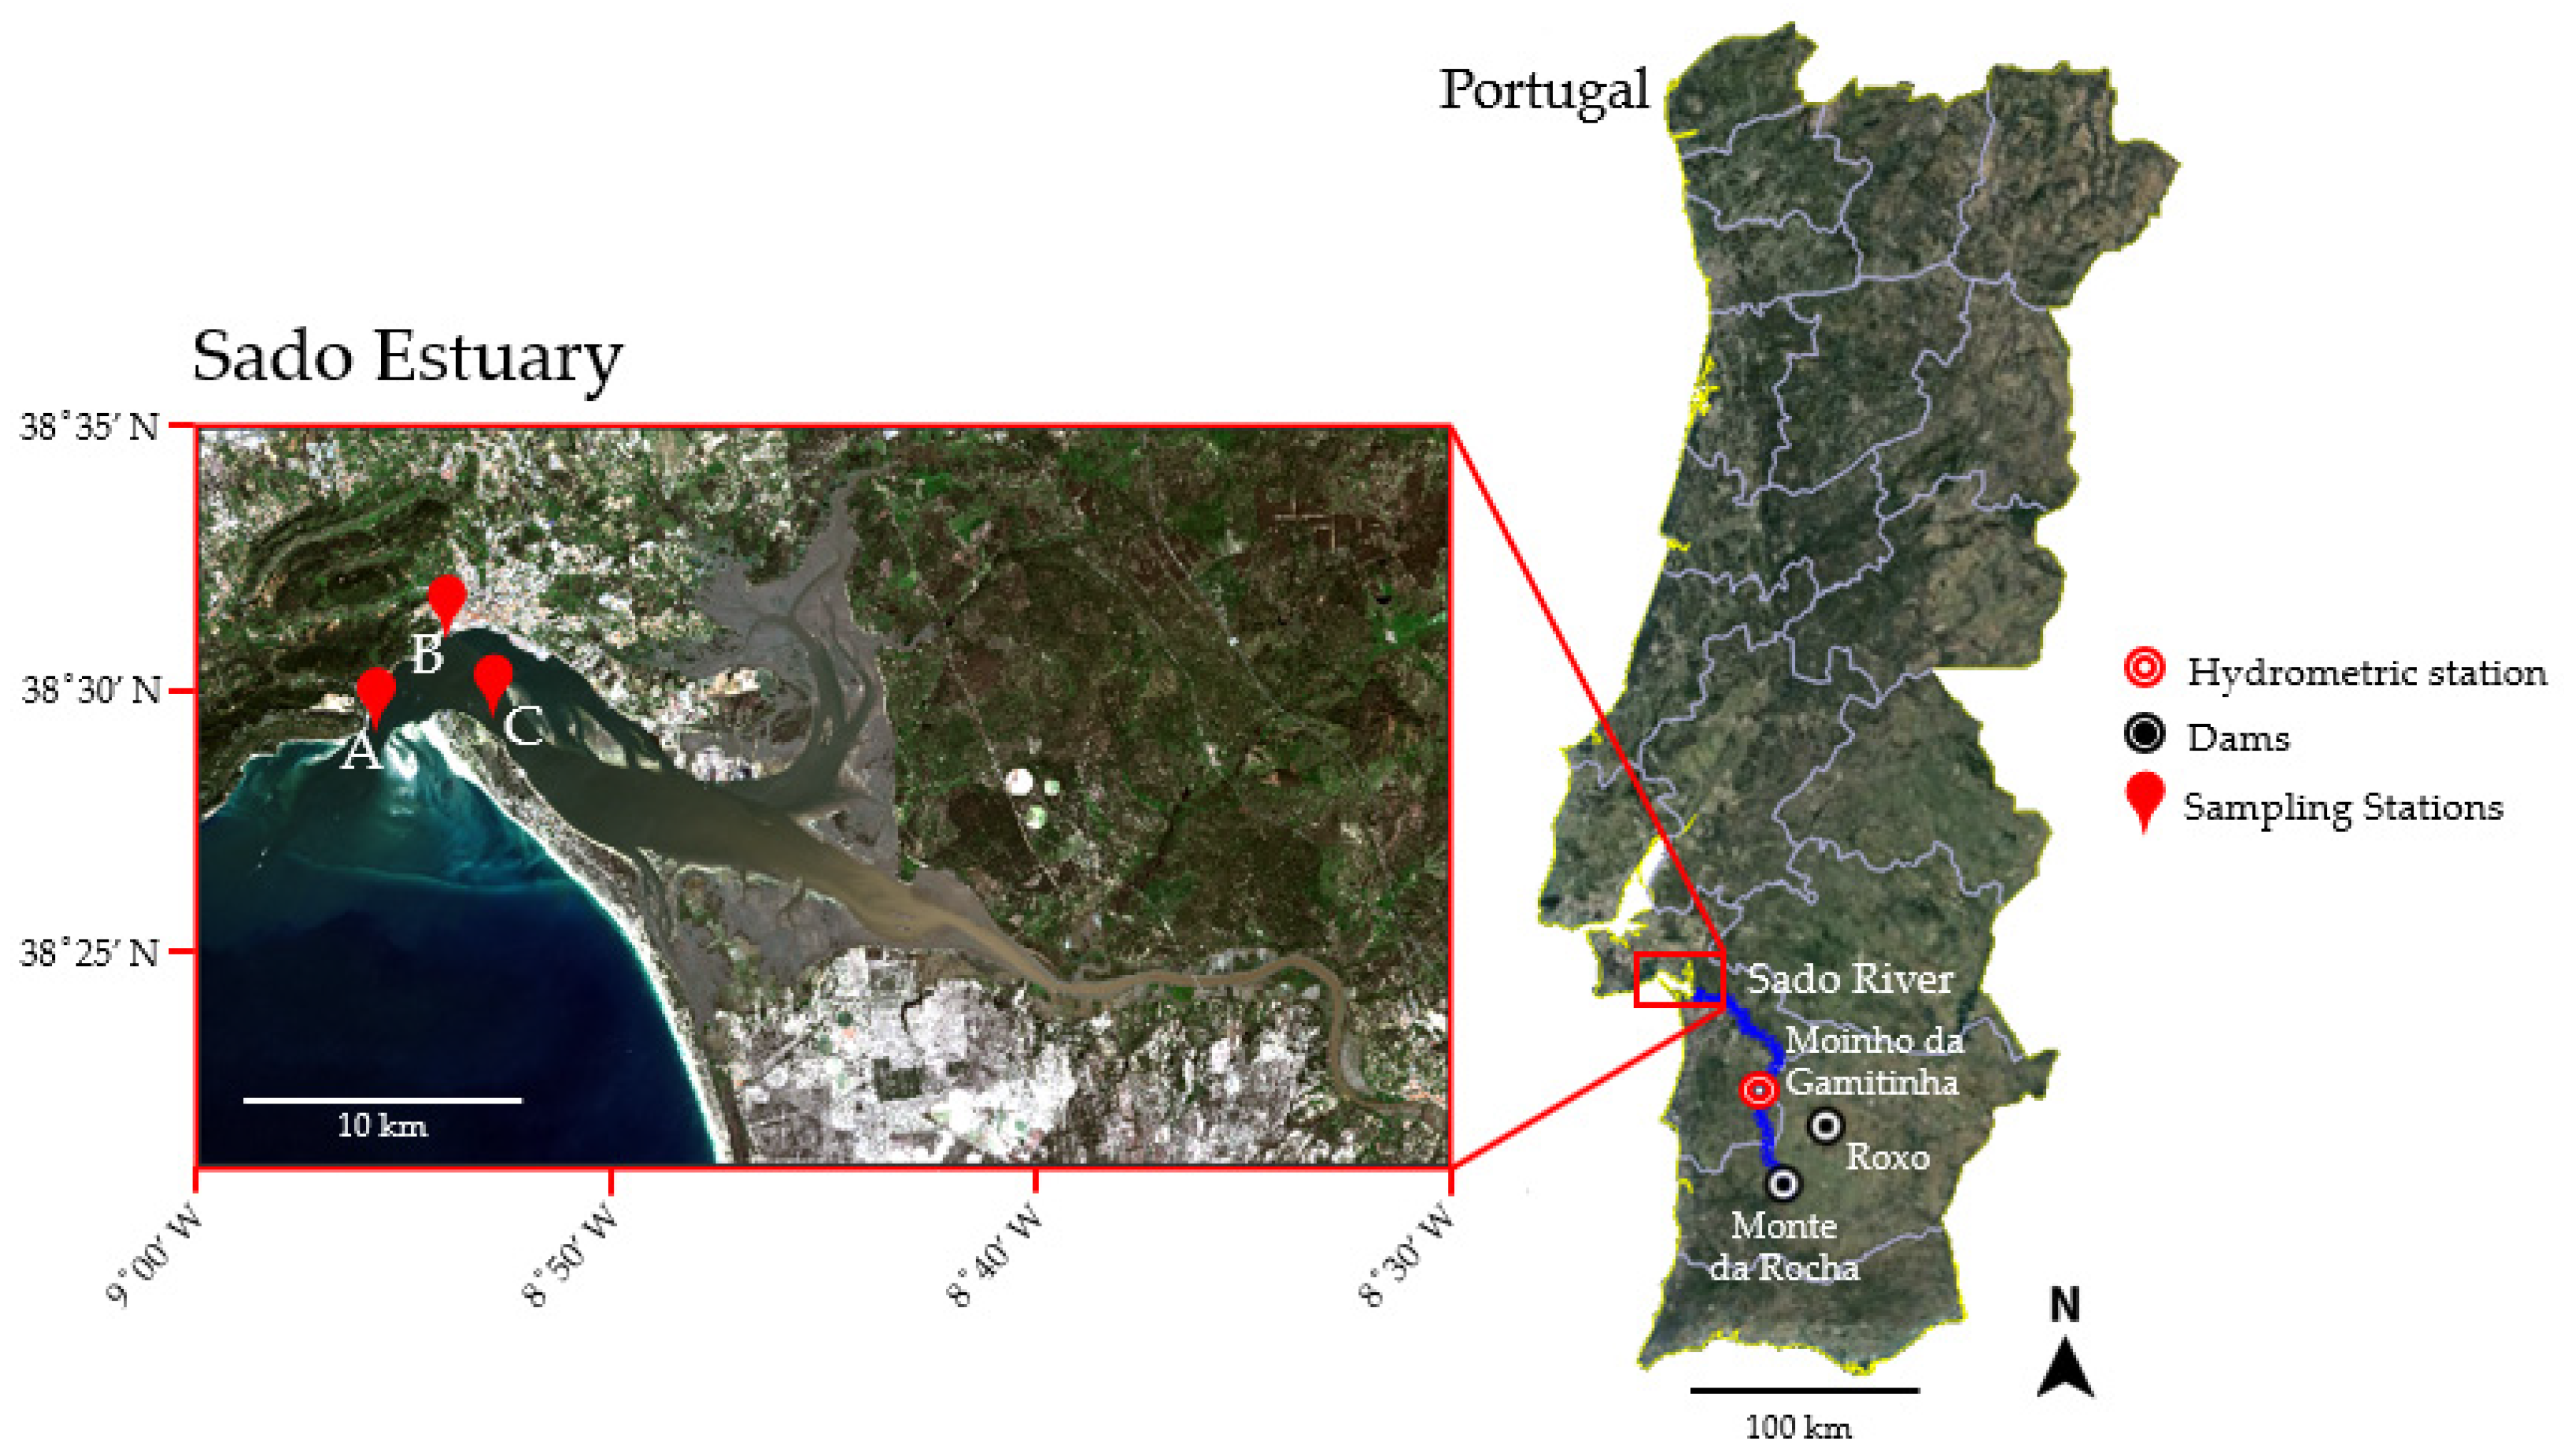
The Sado estuary is the second largest Portuguese estuary and one of the largest in Europe (total area of 212.4 km2 [16]) (Figure 1). Setúbal, a city with ≈ 120 × 103 inhabitants, is located on the northern margin of the estuary [17]. In order to maintain the estuary’s natural vocation, the development of activities compatible with the balance of the estuarine ecosystem, the correct exploitation of resources and the defense of the cultural and scientific values, the estuary was classified as a Natural Reserve in 1980, becoming a protected area since then [18]. The Sado estuary could be considered a coastal plain estuary, as it is long, shallow and with shoals, resulting from the subsidence of the Sado basin [8]. The outermost area of the estuary has an average depth of 10 m, with a seabed mainly composed of sand. The contact between the ocean and the estuary mouth occurs through an embouchure of approximately 1.5 km [19]. The entrance in the estuary is divided into two different courses separated by intertidal shoals, the North channel, which allows access to the Port of Setúbal (one of the main ports in Portugal), and the South channel.
The climate of Setúbal peninsula is dry sub-humid Mediterranean type, with a humid period running from October to March and a dry period covering the months April through September. The average annual air temperature and precipitation is ≈ 16.0 °C and 653.0 mm, respectively [20]. In particular, for the period under analysis, September 2018 to September 2019, only data for the entire territory of mainland Portugal were available. Autumn of 2018 was warm regarding the air temperature (17.2 °C) and average regarding to precipitation (256.5 mm). Winter of 2018/19 was ranked as hot (average 9.9 °C) and extremely dry (total of 145.7 mm). Spring of 2019 had an average air temperature above normal and precipitation values below normal. Summer of 2019 was classified as cold (21.0 °C) and dry (45.9 mm). The Portuguese Institute for Sea and Atmosphere (IPMA) reported that during practically the entire period between September 2018 and September 2019, the Sado hydrographic basin was under meteorological drought conditions [21].
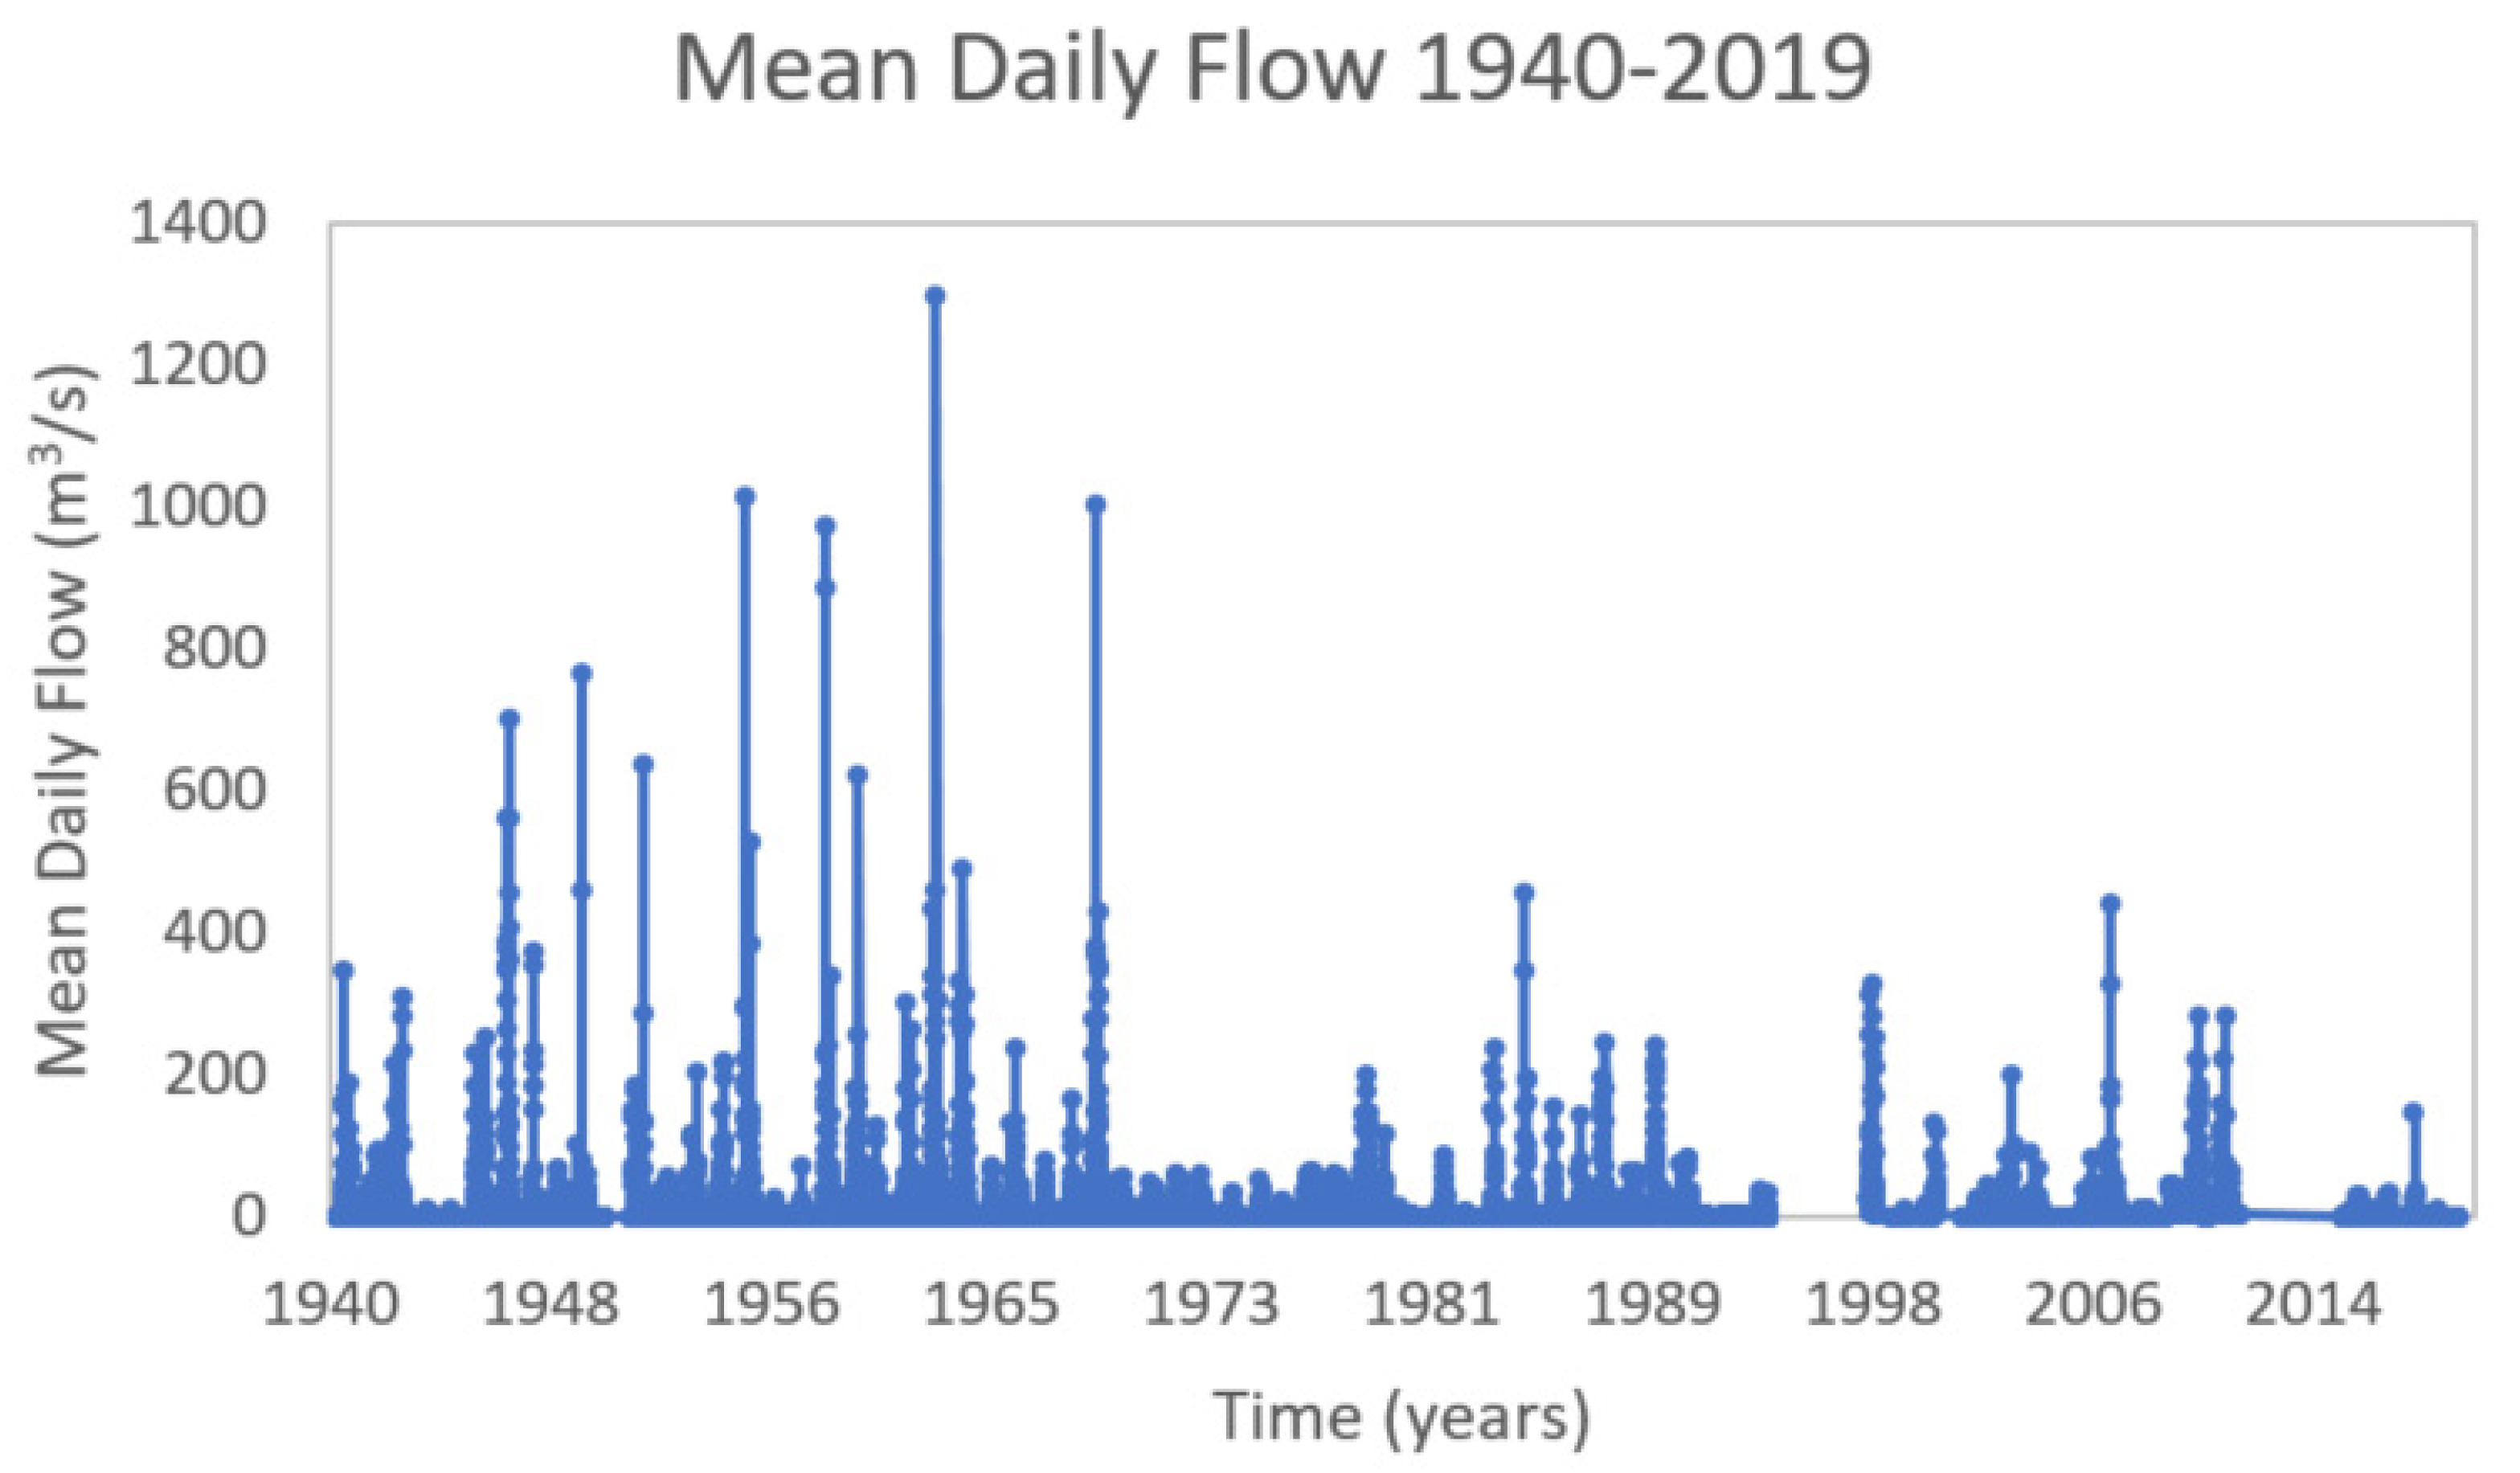
The Sado river is characterized by having a low flow rate, with an evident seasonal variability. The flow of the Sado river varied in the past years. Considering the period from 1940 onwards, it is possible to highlight two distinct periods (Figure 2). The first one, from 1940 until 1969, shows peaks with high daily outflows, frequently exceeding 500 m3/s (9.6 m3/s mean outflow). The second period, from 1969 onwards, presents much lower outflows (5.6 m3/s mean outflow) and, in particular, between 1969 and 1978, there were no values higher than 100 m3/s. This change in the flow regime could be related with the construction of dams along the river course, between the river spring and Moinho da Gamitinha station: Roxo dam was built in 1967, ≈ 80 km from the estuary and Monte da Rocha dam was built in 1972, ≈ 90 km from the estuary (see Figure 1) [22]. Figure 2 shows the daily average outflow of the Sado river since 1940 at the station Moinho da Gamitinha (data provided by Sistema Nacional de Informação de Recursos Hídricos—SNIRH; https://snirh.apambiente.pt/). According to SNIRH, Moinho da Gamitinha, located ≈ 45 km upstream the estuary, was the most suitable station for this study. In general terms, there is a strong influence of the tide on the circulation in the estuary [8].
2.2. General Sampling Strategy
Monthly campaigns were conducted in the period between September 2018 and September 2019 to collect data on currents (intensity and direction) and hydrological data (temperature and salinity), at three sampling stations, stns. A, B and C, located at the mouth of the estuary, in the North channel and in the South channel, respectively (see Figure 1 and Table 1). The monthly time step guaranteed regular measurements, allowing a robust temporal and seasonal analysis, as intended. The depths of the stns. A, B and C, were ≈ 38, 8 and 20 m, respectively.
Data collection always started at stn. A just before high water (HW), in all the monthly campaigns. Therefore, measurements were gathered during slack water in stn. A, and one or two hours after high water in stn. B and C. For logistical reasons, it was not possible to obtain data every month in all stations.
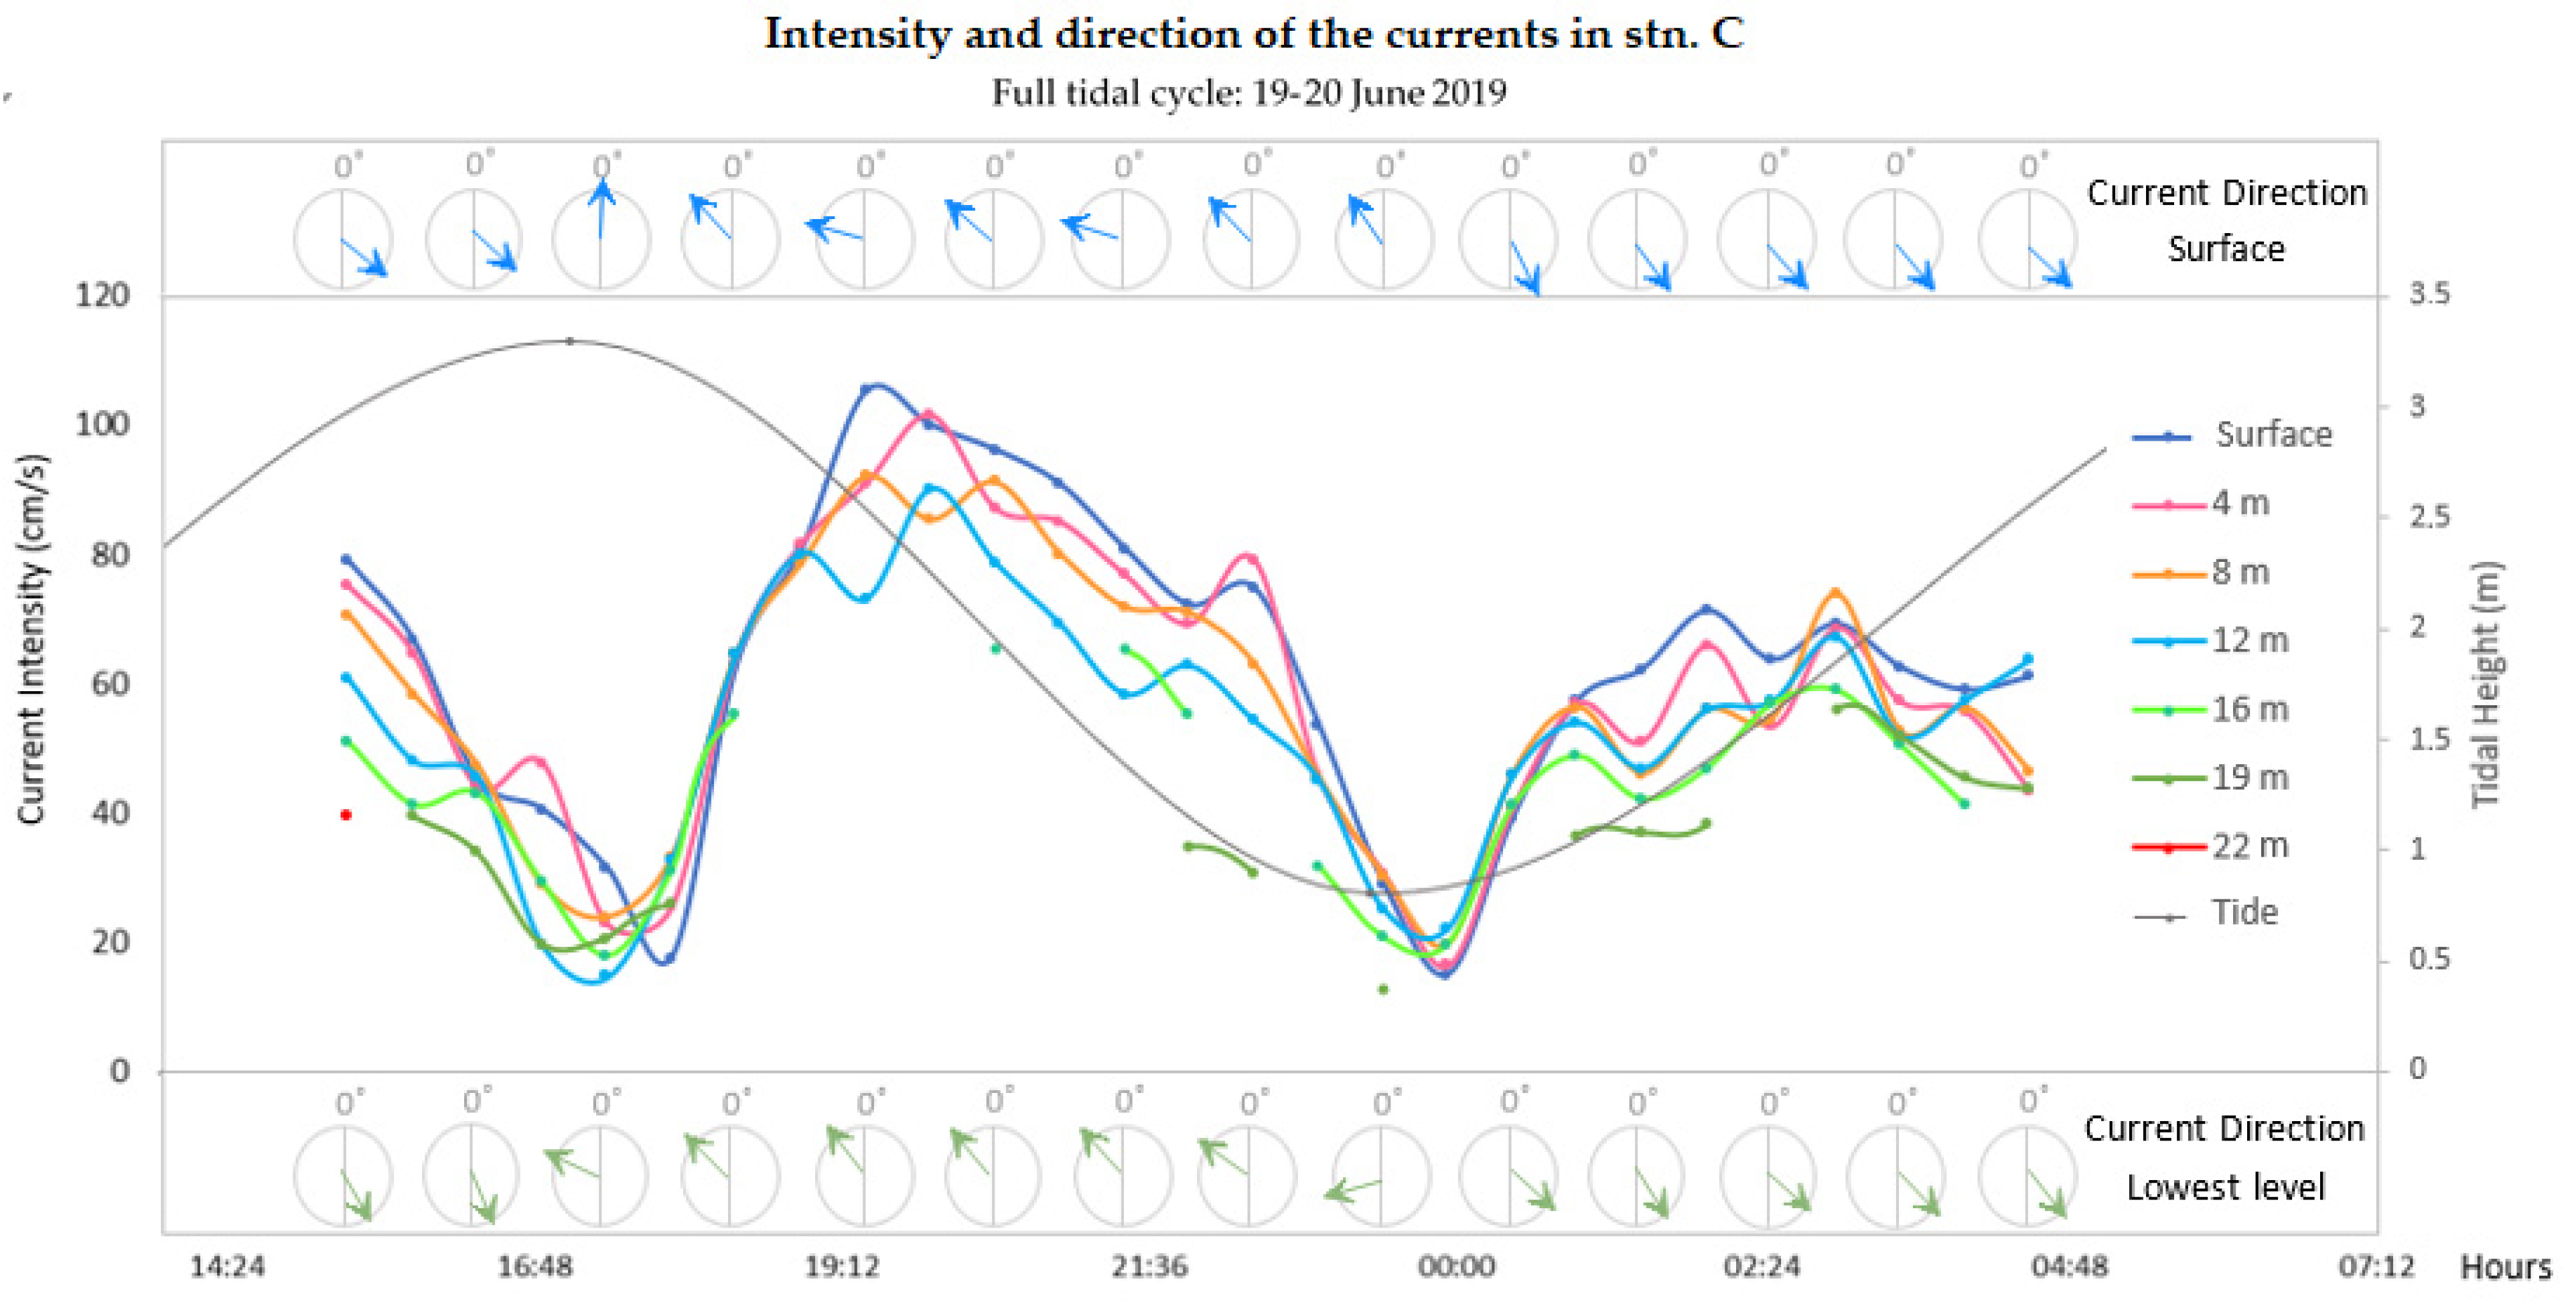
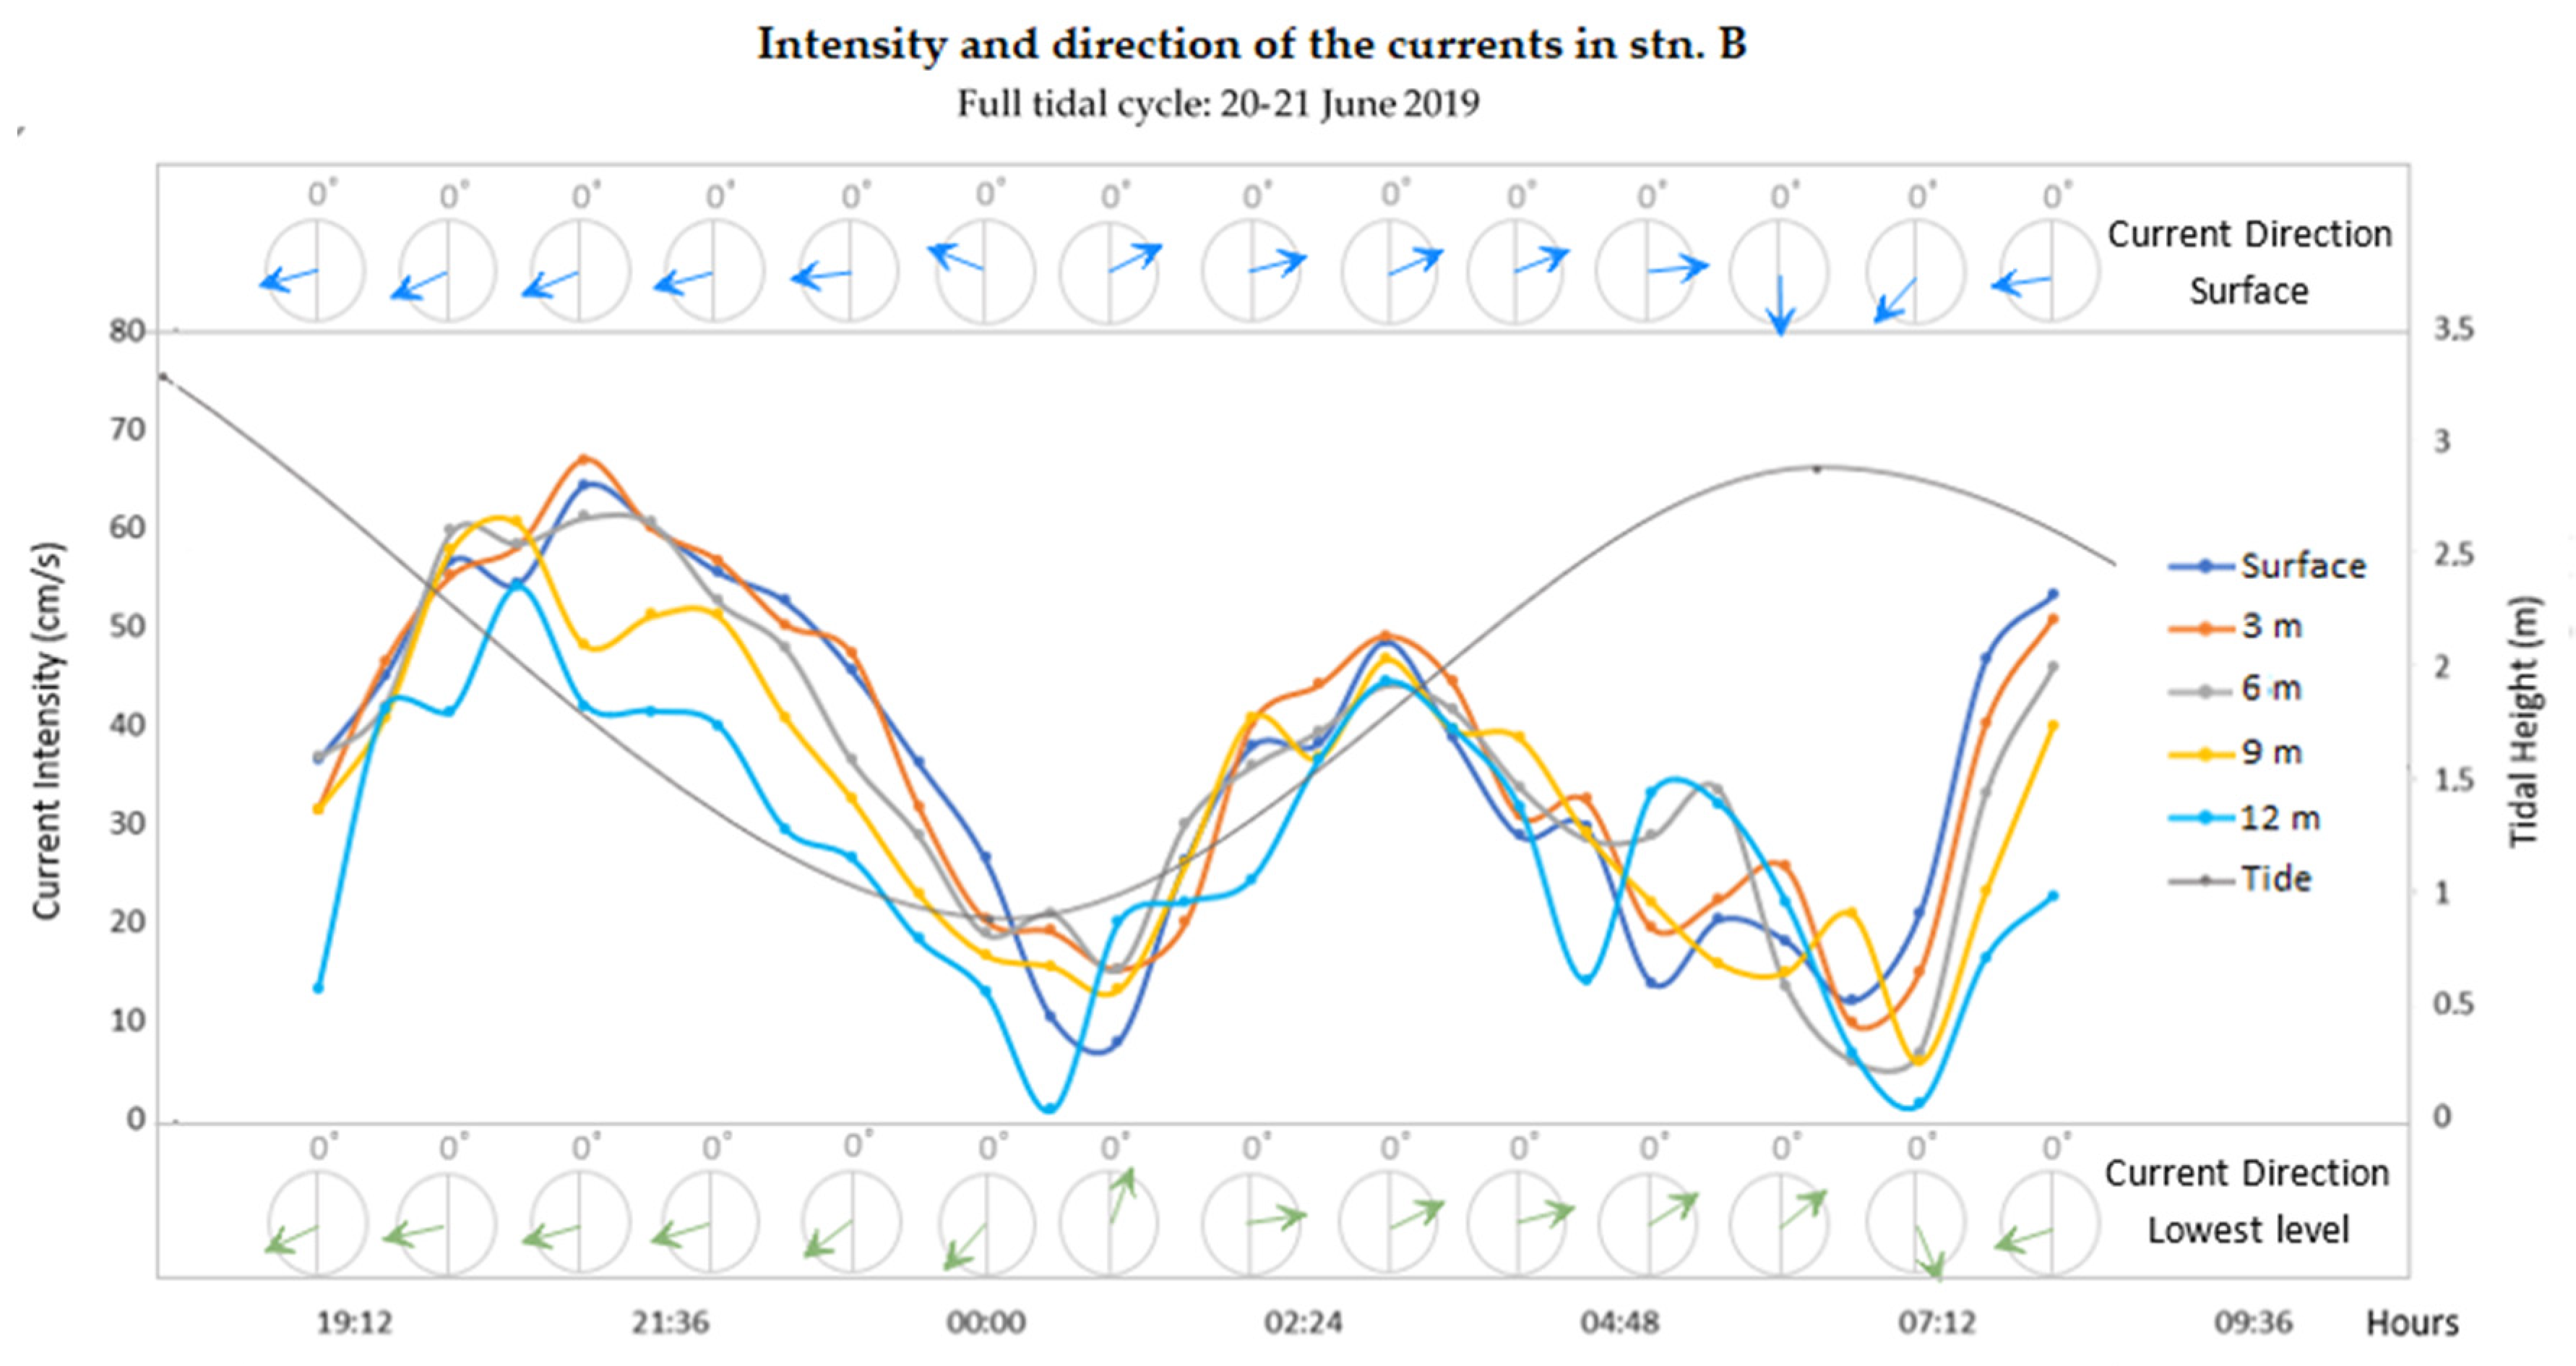
Due to the high variability of the current data observed during the monthly campaigns, it was also decided to sample during whole tidal cycles, in order to better understand the circulation in the estuary. Therefore, two more campaigns were carried out in stns. B and C, in 20–21 June 2019 and 19–20 June 2019, respectively, to cover a full tidal cycle (13 h), under spring tide conditions. Sampling was not made exactly at stn. B, but closer to the navigation channel, to avoid land interference (exact coordinates—38.51766° N 008.89875° W).
2.3. In Situ Observations
2.3.1. Intensity and Direction of the Currents
A Doppler Current Sensor (model 4100 from Aanderaa, Norway) was used in the collection of data on the intensity and direction of the currents. At each station, the sensor was stabilized for about 2 min at each depth level. During the monthly campaigns, the measurements were made every 5, 2 and 4 m in the water column, in stns. A, B and C, respectively.
During the campaigns covering the whole tidal cycle (20–21 June 2019 and 19–20 June 2019), measurements were taken every 30 min, at several depths: every 4 m at stn. B and every 3 m depth at stn. C. The boat was anchored during the whole sampling period.
Regarding the data processing, pressure values (p in kPa) were first converted into depth values (D in m) using the equation:
D = (p − 100)/10
The direction of the currents was also corrected. As the data were collected in degrees relative to the magnetic north, it was necessary to convert them into degrees relative to the geographic north. The magnetic declination of each one of the stations at the time of the measurements was the following:
- Stn. A: 2° 6′ W
- Stn. B: 2° 5′ W
- Stn. C: 2° 5′ W
Since the declination values were negative (degrees west), they were subtracted from the values measured with the current meter, to obtain the direction of the current relative to the geographic north, as intended.
2.3.2. Temperature and Salinity Data
In situ observations were carried out using a NXIC (Non-eXternal Inductive Conductivity) CTD for conductivity (C), temperature (T) and depth (D), from the former Falmouth Scientific Inc. (FSI; Pocasset, MA, USA).
During the observations, the CTD was kept at the surface for stabilization during 2 min, before data were recorded. Only downcast data were used. The data recorded in the first meter of the water column were discarded due to the dimensions of the CTD. The CTD collected temperature and conductivity data every ≈ 0.1 m. From these parameters, the practical salinity was calculated.
The practical salinity (PSS-78) was calculated using the Gibbs-SeaWater (GSW) Oceanographic Toolbox, software package of the Thermodynamic Equation of Sea-Water 2010 (TEOS-10), with the function gsw_SP_from_C (Practical Salinity from conductivity) [23] using MATLAB. TEOS-10 was adopted by the Intergovernmental Oceanographic Commission (IOC), with the endorsement of the Scientific Committee on Oceanic Research (SCOR) and the International Association for the Physical Sciences of the Oceans (IAPSO).
3. Results
3.1. Intensity and Direction of the Currents
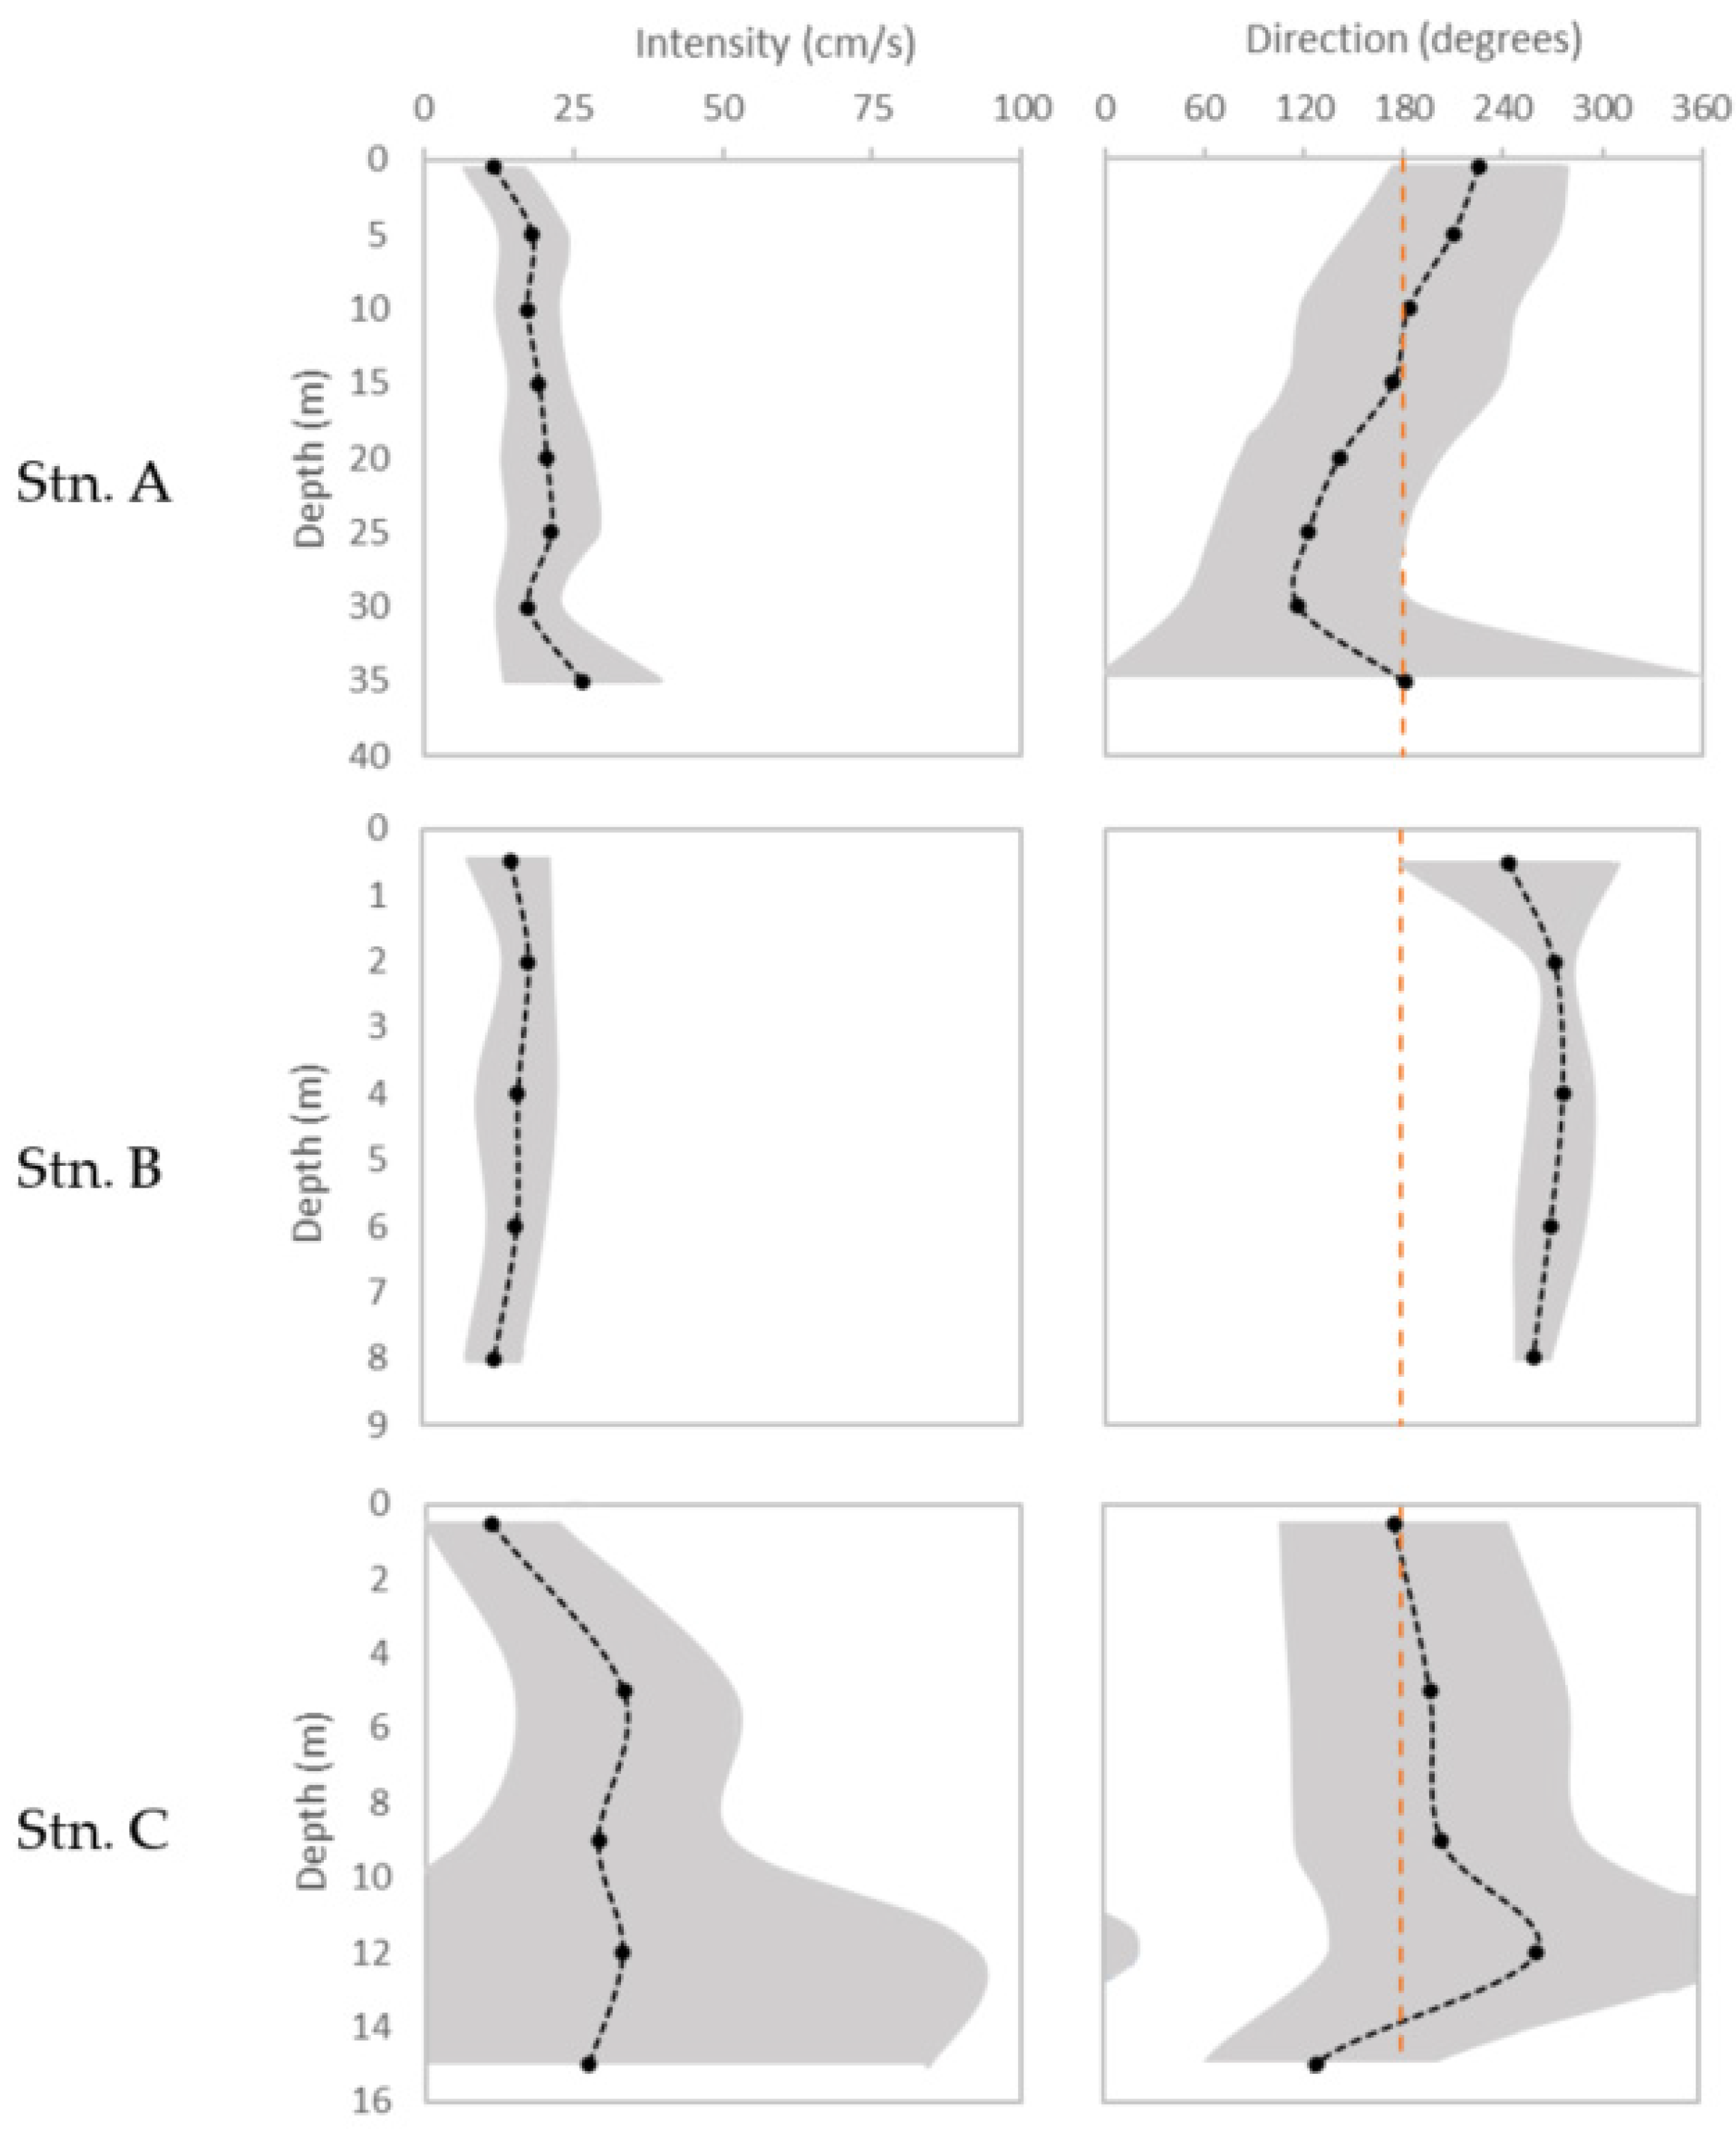
The data collected during the monthly campaigns were time averaged for each level of measurement, resulting in an average profile per station for each parameter, with the respective framing in a 95% confidence interval (Figure 3). When data were occasionally missing, the mean between the values of the adjacent depths was assumed as the missing value.
The profile of the direction of the currents obtained in stn. A showed two distinct flows: one oceanward (the first 15 m of the water column) and the other towards the interior of the estuary (Figure 3). The estuarine flow showed a greater variability (42–104% around the average values) compared with the oceanward flow (23–36% around the average values). In stn. B, the direction of the currents was consistent with the tidal regime. Measurements were conducted during ebb and currents showed a strong west component (180–360°) along the water column and the sampling period, thus indicating water exiting the estuary (95% interval with a maximum variation of 7% on the average value, except for the surface). Both stns. A and B showed no major variations in the intensity of the currents with depth (Figure 3). Stn. C was the one with the highest uncertainties associated to the average values, due to the inclusion of data sample with high variability: intensity and direction of the currents, varying between 54–208% and 38–52% around the average values, respectively. The results obtained during the full tidal cycles, in stns. B and C, gave robustness to those obtained in the monthly campaigns, allowing a better and clear description of some circulation patterns in the estuary. Observations were collected in 19–20 June 2019 in stn. C (Figure 4), and in 20–21 June 2019, in stn. B (Figure 5).
In both stations (C and B), the direction of the current at the surface and at the deepest level, was coincident (blue and green arrows in Figure 4 and Figure 5). In addition, the direction of the current agreed with the tidal regime: currents towards the mouth of the estuary (outflow) were observed during ebb, and the opposite (inflow) during flood. The intensity of the current decreased along the water column, with stronger currents occurring at the surface. In both stations, more intense currents were observed during ebb than during flood. During slack water, the currents reached minimum values in both stations, as expected (Figure 4 and Figure 5). It was also observed that the change of the tide in the two stations occurred at different times. In addition, during high water, both stations showed currents towards the interior of the estuary. The opposite also occurred during low water, with currents towards land (except at the surface in stn. C). These data seem to indicate that the circulation in the estuary occurs in the two navigation channels, with higher intensities in the South channel, which is the deepest one.
3.2. Temperature and Salinity Data
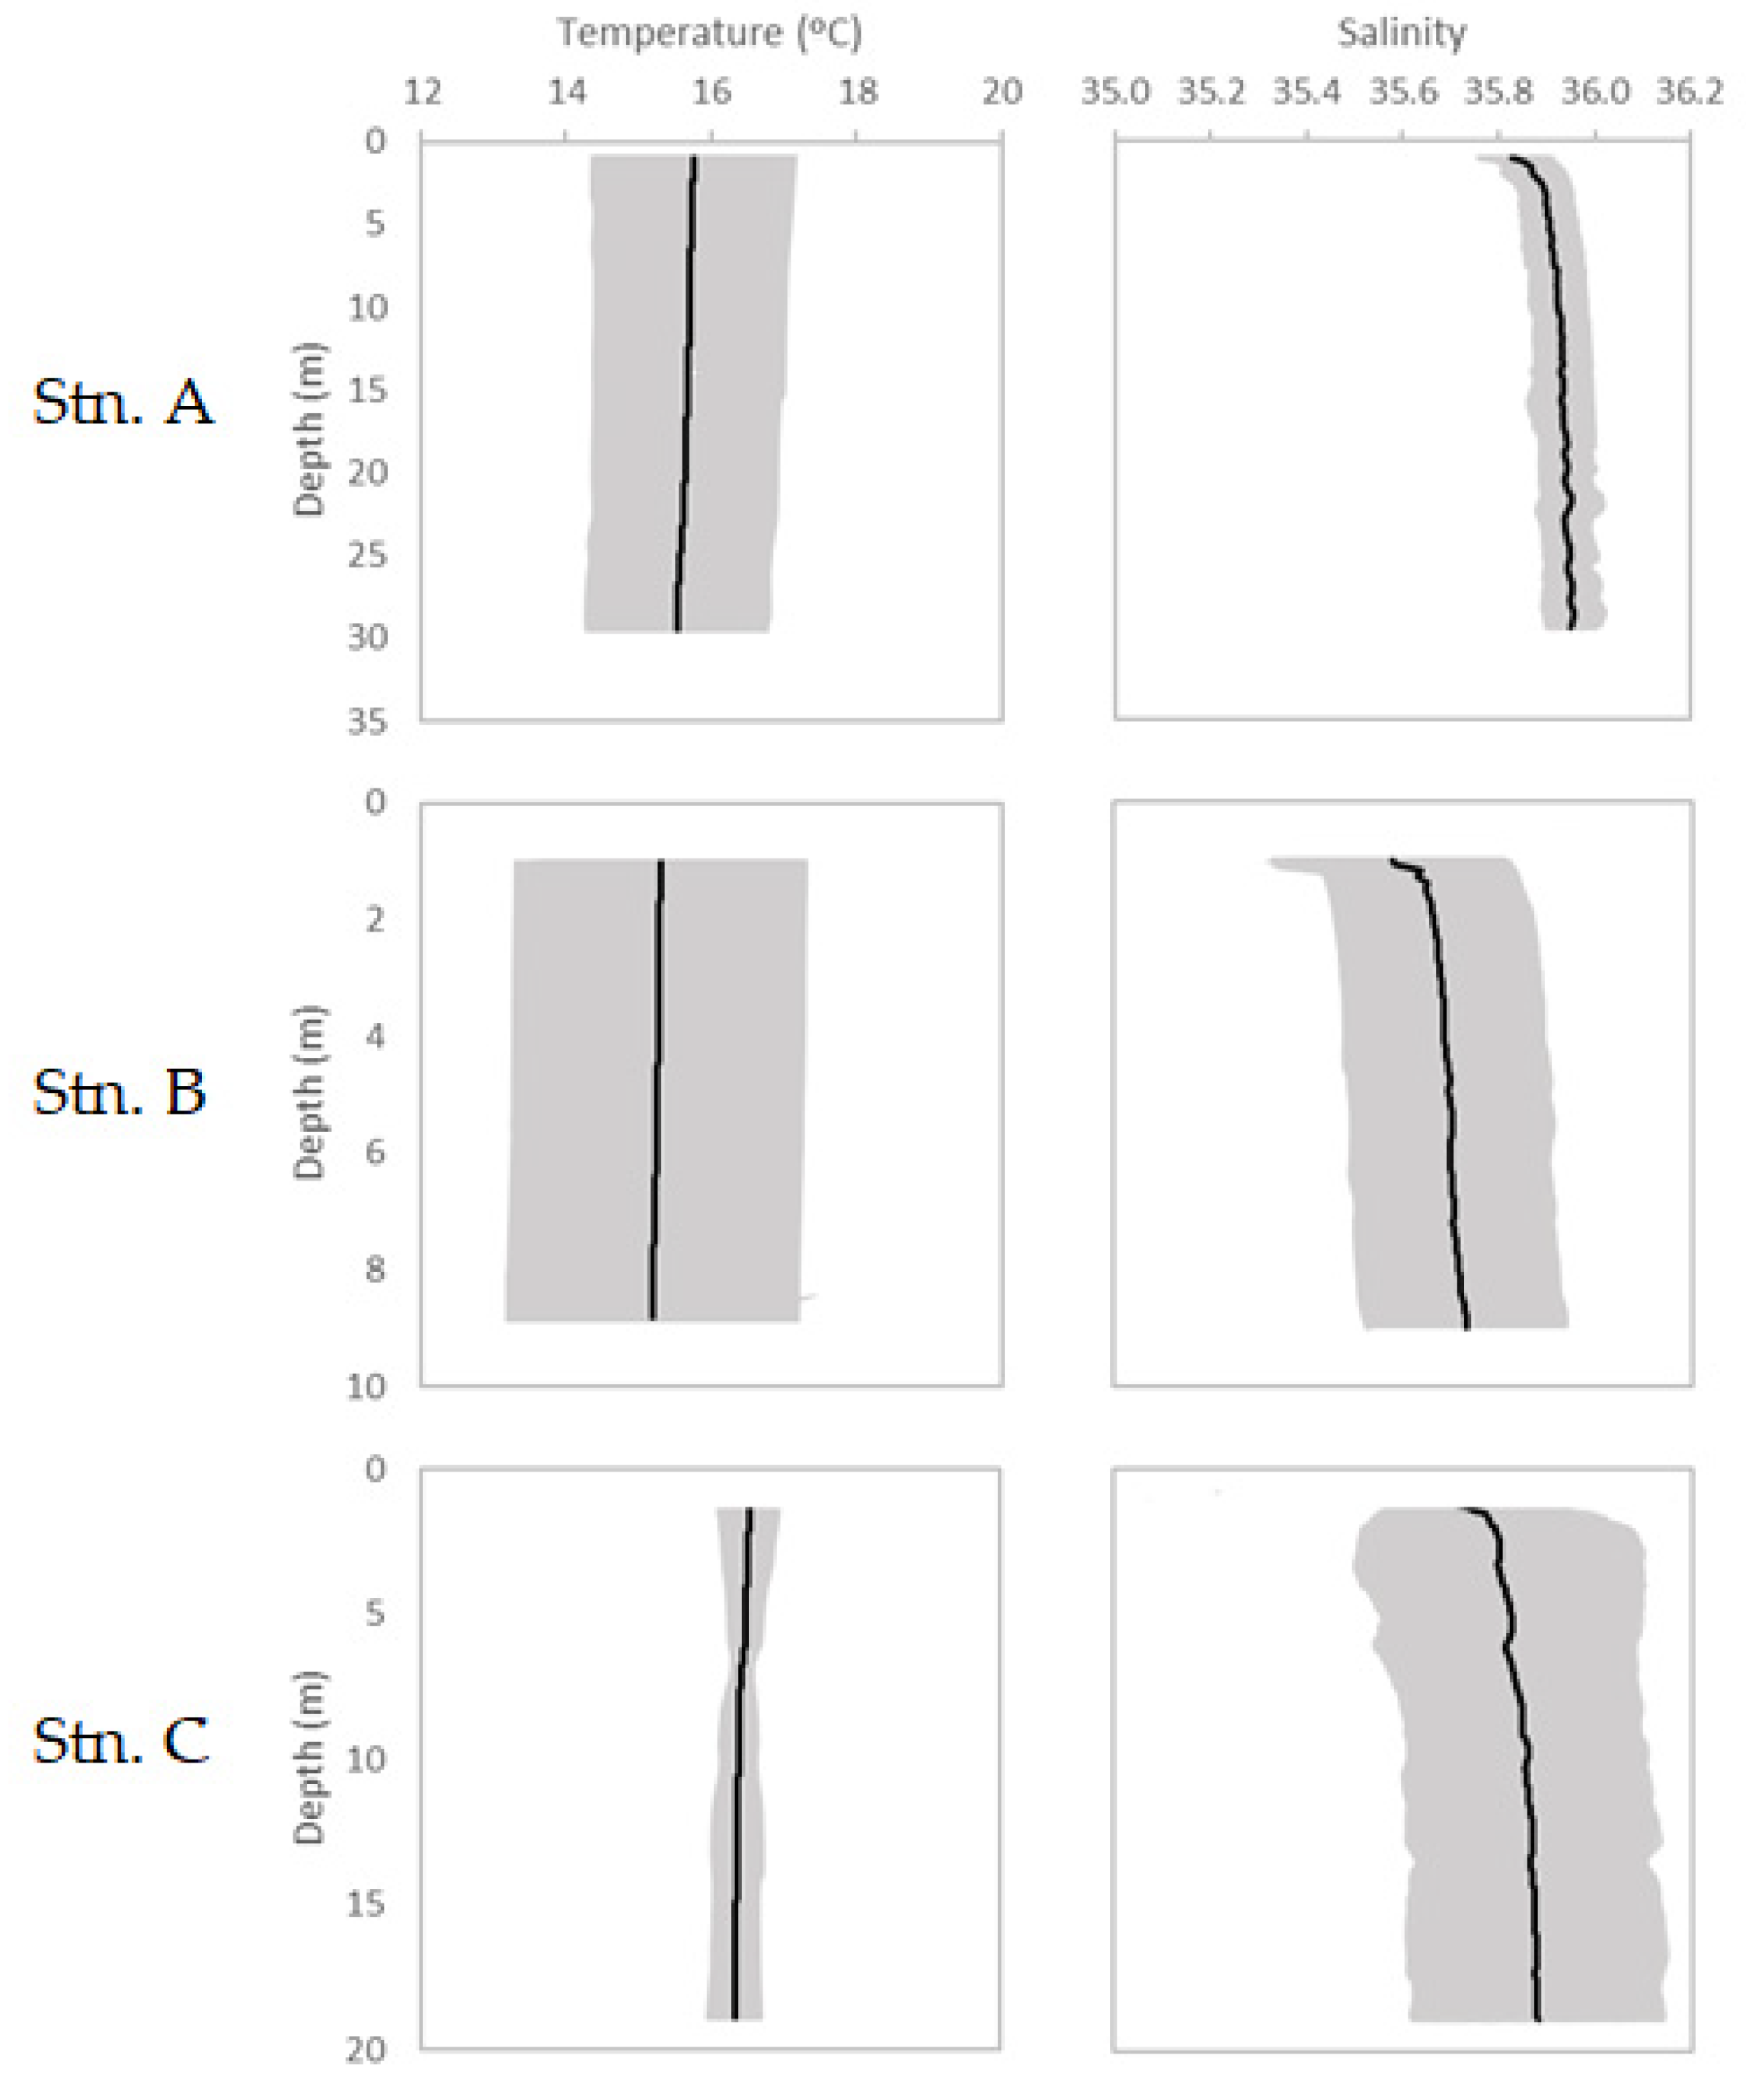
Regarding temperature and salinity data, no relevant variations along the water column were observed in any of the stations (Figure 6). This suggests well-mixed water columns during sampling.
A thermal seasonal variation was observed in all stations, with lowest temperatures obtained in winter and the highest values obtained in summer. The greatest range of temperatures along the sampling period occurred in stn. B, possibly due to its shallowest water column and, therefore, to the highest sensitivity to the atmospheric seasonality (95% confidence interval with variations of ≈ 15% around the average values). Salinity did not show an evident seasonal variability along the outermost area of the estuary. However, particularly in stn. B, lower values of salinity seemed to be associated with winter months (most common seasonal behavior). Stn. A, at the mouth of the estuary, presented higher salinity values than the ones observed in stn. B, but similar temperatures. In general terms, the temporal variability of the salinity was low in stns. A and B (variations of ≈ 0.2% and ≈ 0.6% around the average values, respectively, within 95% confidence interval). Stn. C, despite having few data available, not allowing an adequate seasonal analysis, also showed a well-mixed water column.
4. Discussion
The results indicate that the South channel is the most relevant route for water exchange in the Sado estuary, showing agreement with the conclusions of Ambar et al. [9]. Intensities of the currents similar to the ones observed in this study (between 50 and 100 cm/s), were recorded for the same area by Maretec [12]. Ambar et al. [9] referred the existence of a two-layer flow in the South channel (towards the interior of the estuary near the bottom and seaward at the surface) and currents mainly directed towards the interior of the estuary in the North channel, which is the opposite to what was observed in the present study. Ambar et al. [9] and Maretec [12] also mentioned a circulation model in which water entered the estuary predominantly through the North channel, leaving the estuary mainly through the South channel. This was not verified in the present study. Therefore, there may have been changes in some circulation patterns of the estuary lately. This could be possibly due to changes of the river flow (natural or anthropogenic), whose effects are important to be monitored, in order to protect the marine environment and avoid variations in the water chemistry, sediments, habitats and marine flora and fauna [24]. It is accepted that the Sado river flow decreased in the recent years, possibly due to the construction of dams along the river course [22]. A good example of these kind of modifications happened in San Francisco Bay (USA), where 50% of the freshwater flow from the bay was diverted for human use, resulting in a modification of the salinity regime and in alterations in the biotic communities of the region [25]. Another possible explanation for changes of the circulation patterns in the Sado estuary could be anthropogenic modifications of the seabed in the past years. The Sado estuary is currently being dredged, as it was in the past, in order to improve the access of large ships to the port of Setúbal, and these works have been removing large amounts of sand from the North navigation channel. Such works can lead indeed to changes in the circulation of the estuary [26,27]. Liria et al. [28] detected changes in the circulation in the Oka estuary (Spain) due to dredging activities. Another example is the Pearl River estuary, in China, where the dredging works in the recent years led to changes in the circulation at the river mouth, modifying, as a consequence, the saltwater intrusion [29]. Besides the changes in the circulation, dredged material disposal has an impact on biotic communities [25]. Therefore, it would be interesting to conduct a monitoring program in the Sado estuary to study future dredging works, to see if there would be anthropogenic changes in the system, and if so, what kind of repercussions they could have on the future of the estuary. Nevertheless, further studies are needed to fully understand the possible modifications observed in the estuary, comparing with previous studies. More observations would be needed, during full tidal cycles, over the year (to resolve the seasonality) and with more stations located along the estuary, to overcome the lack of measurements, mainly, from its interior part.
The direction of the currents, observed during the monthly campaigns, suggested that the mouth of the estuary had more complex circulation patterns than the navigation channels. This could indicate an occasional mixing in the water column in that area [30], but that was not corroborated with the average temperature and salinity profiles. However, the single profiles showed a potential stratification in the water column at the mouth of the estuary during summer. As the water exchanges take place in that area, its behavior is like a coastal oceanic region. There were no relevant variations of temperature and salinity with depth, indicating well-mixed waters, with very little stratification and a relatively high vertical homogeneity. These results are in agreement with the conclusions of Ambar et al. [9], Coutinho [20] and Ferreira et al. [31]. The variations observed in depth could be justified by atmospheric and anthropogenic forcing (land discharges) or by variations of the river flow. The current meter data showed that the circulation in the estuary was strongly dependent on the variation of the tide [8]. Sado estuary can be considered a well-mixed estuary, with strong tidal forcing, like the majority of the main estuaries in the United Kingdom [32] and in Australia [33]. Despite the punctual influence of the river in some of the profiles analyzed (lower salinity values at the surface), the outermost area of the estuary presented a mean salinity of 35.8, which is in agreement with the values observed in the coastal ocean of Portugal [34].
Sousa and Lourenço [8] observed, in the outermost area of the estuary, salinities between 32.0 and 34.0 during winter, and salinities ranging between 35.0 and 35.7 during summertime. In the present study, the profiles obtained during winter showed salinities higher in about 2.0. It seems that, during the sampling period of the present work, the influence of the river flow at the mouth of the estuary was less than before. Those authors [8] observed temperatures of 13–14 °C in the area during winter, and summer temperatures ranging between 16 and 18 °C. Apparently, during the sampling period of the present work, there was a higher thermal amplitude throughout the year, with temperatures reaching higher values. These differences detected in salinity and temperature could be occasional or result from changes in the estuary in recent years. They could be due to climate change or different circulation patterns, which, as previously indicated, may have occurred in the estuary in recent years, or induced by variations of the river flow [22]. Worldwide, estuaries have been undergoing through changes in their hydrodynamic and physical properties, as a result of the effect of climate change on coastal regions; for example, climate change has been rapidly warming the Australian estuaries [33]. The Sado estuary may be no exception and it would be interesting to assess the possible impact of climate change in the properties of this system.
5. Conclusions
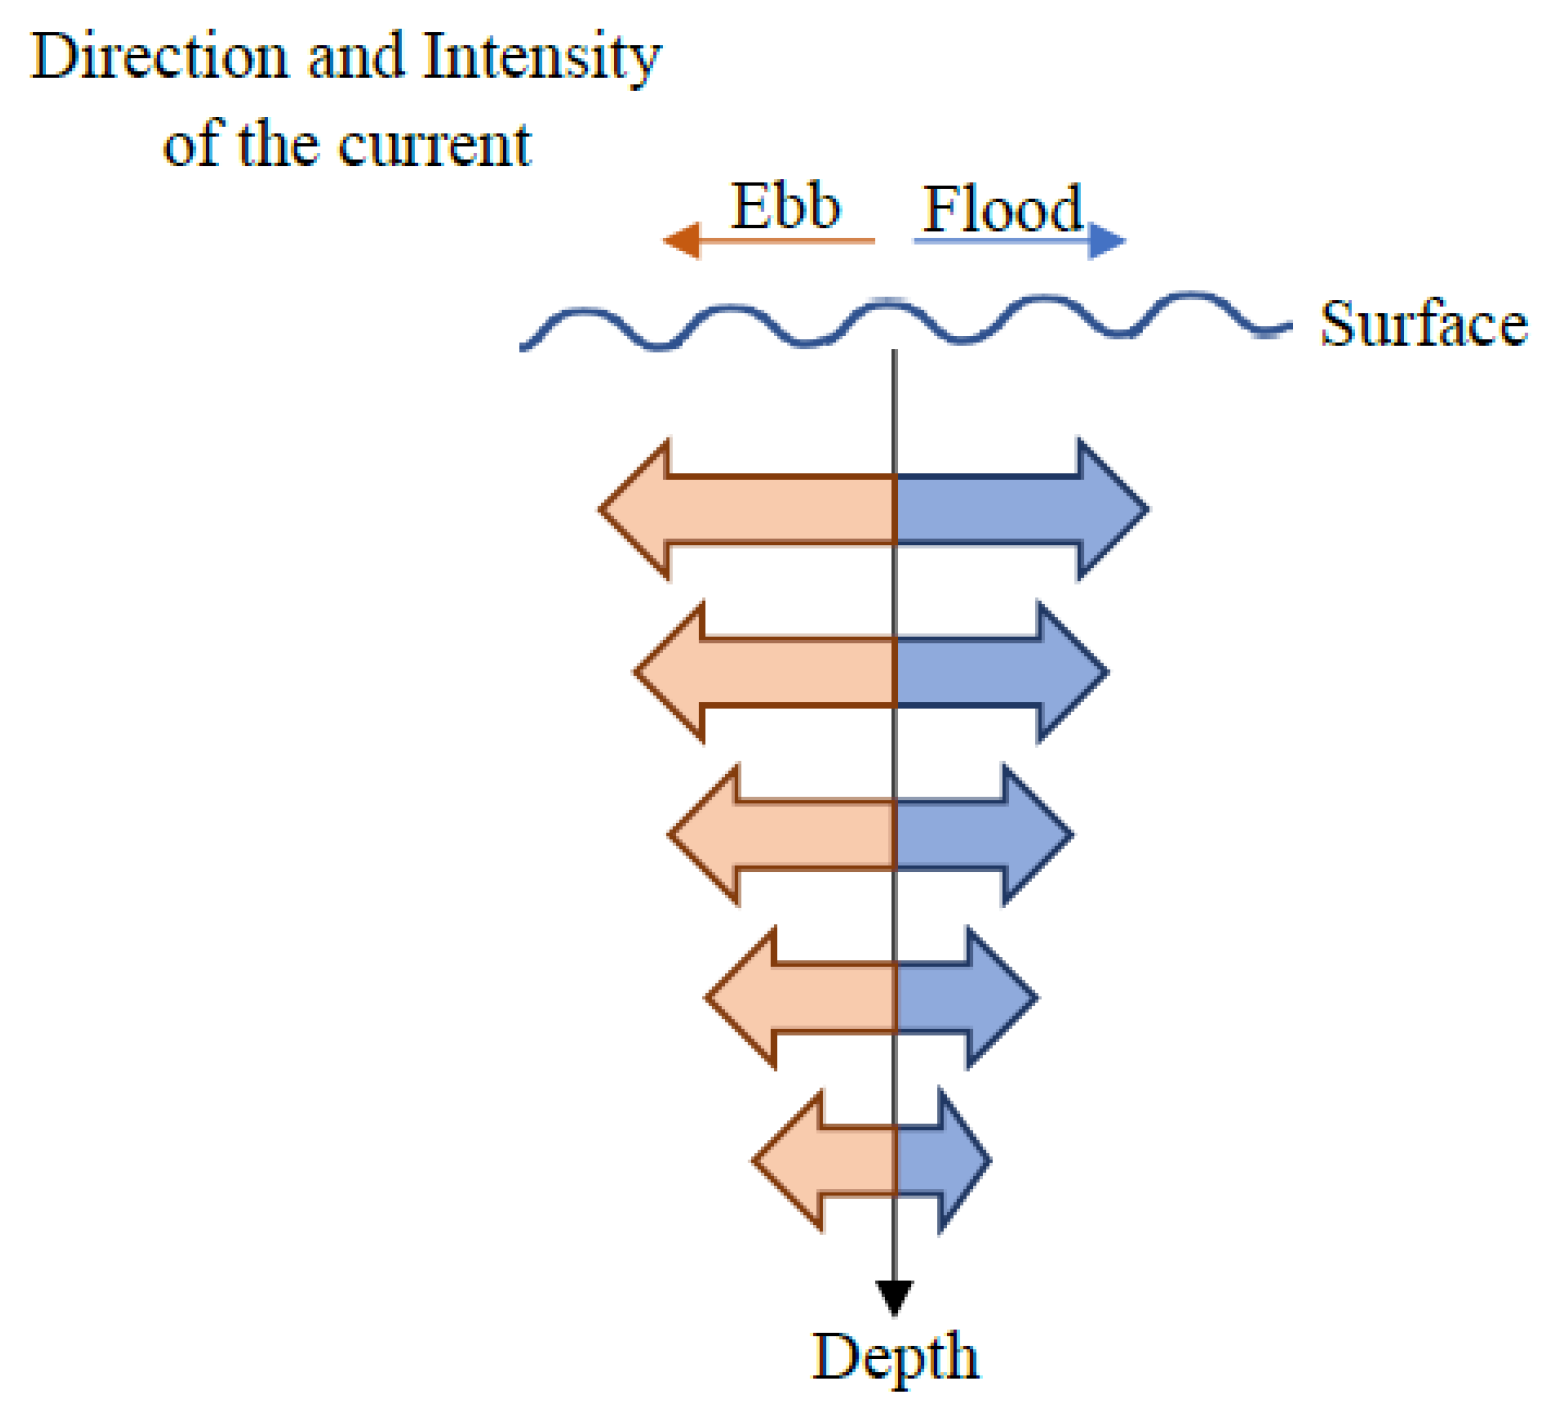
In conclusion, the circulation in the Sado estuary occurs through the two navigation channels, being the South channel the main route for water exchange. The intensity of the current decreased in depth, with more intense currents during ebb, and the direction was similar along the water column, changing with the tidal regime (see the schematic representation in Figure 7). At the mouth of the estuary, the circulation patterns appear to be more complex.
Based on the data collected during the sampling campaigns, the outermost area of the estuary can be described as spatially and vertically homogeneous. The Sado estuary may be classified as well-mixed. However, by comparing the results presented in this study with the conclusions of previous research works, changes in the circulation patterns may have occurred in the recent years. In addition, it seems that the influence of the river flow in the mouth of the estuary has been decreasing over the past few years, as typically oceanic salinity values were observed during the whole sampling period. Higher temperatures have also been observed.
The present study reveals the need to implement continuous monitoring plans in order to evaluate possible anthropogenic impacts over time. This highlights the importance of the cooperation between decision makers and the scientific community. In the future, it is intended to implement a broader time series analysis to assess potential effects of climate change. Efforts are being made to obtain remote sensing products to apply into this specific topic. This analysis is, thus, a relevant contribution, not only for estuarine hydrodynamics, but also for studies focused on climate change, numerical modeling and satellite remote sensing.
Supplementary Materials
The following are available online at https://www.mdpi.com/2073-4441/13/2/187/s1, Table S1: Dataset on profile measurements of intensity and direction of the currents collected during the sampling period in stn. A, Table S2: Dataset on temperature (T) and salinity (S) profile measurements collected during the sampling period in stn. A. The values which were not collected at those particular depths and were computed as the average between the respective upper and lower values are represented in red, Table S3: Dataset on profile measurements of intensity and direction of the currents collected during the sampling period in stn. B, Table S4: Dataset on temperature (T) and salinity (S) profile measurements collected during the sampling period in stn. B The values which were not collected at those particular depths and were computed as the average between the respective upper and lower values are represented in red, Table S5: Dataset on profile measurements of intensity and direction of the currents collected during the sampling period in stn. C, Table S6: Dataset on temperature (T) and salinity (S) profile measurements collected during the sampling period in stn. C. The values which were not collected at those particular depths and were computed as the average between the respective upper and lower values are represented in red.
Author Contributions
Conceptualization, A.C.B., F.S. and B.B.; methodology, A.C.B., F.S., B.B.; data analysis: A.C.B., F.S.; writing—original draft preparation, B.B.; writing—review and editing, A.C.B., F.S.; visualization, A.C.B., F.S.; supervision, A.C.B., F.S.; project administration, A.C.B.; funding acquisition, A.C.B. All authors have read and agreed to the published version of the manuscript.
Funding
This research was developed in the framework of the AQUASADO-Promover a Aquacultura Sustentável no Estuário do Sado project (MAR-02.01.91-FEAMP-0051REF), funded by the Operational Program Mar2020. A.C. Brito was funded by the Fundação para a Ciência e a Tecnologia (FCT), through the Scientific Employment Stimulus Programme (CEECIND/0095/2017). It also received further support from Fundação para a Ciência e a Tecnologia, through the strategic project (UID/MAR/04292/2020) granted to MARE.
Institutional Review Board Statement
Not applicable.
Informed Consent Statement
Not applicable.
Data Availability Statement
The data presented in this study are available in Supplementary Materials.
Acknowledgments
The authors wish to acknowledge all colleagues from MARE and IH for fieldwork support. A note of gratitude also to Carolina Sá for her guidance. The authors also acknowledge the support of CoastNet Infrastructure (PINFRA/22128/2016). In addition, special thanks to Artur Costa and João Casal for the logistical support in some of the campaigns. The authors also want to thank the reviewers for their appreciation and the comments/suggestions made to the manuscript.
Conflicts of Interest
The authors declare no conflict of interest
References
- Cameron, W.; Pritchard, D. Estuaries. In The Sea; Hill, M., Ed.; John Wiley & Sons: New York, NY, USA, 1963; Volume 2, pp. 306–324. [Google Scholar]
- Valle-Levinson, A. Contemporary Issues in Estuarine Physics; Cambridge University Press: New York, NY, USA, 2010. [Google Scholar]
- Dyer, K. Estuarine Circulation. In Encyclopedia of Ocean Sciences, 3rd ed.; Cochran, J., Bokuniewicz, H., Yager, P., Eds.; Academic Press: Cambridge, MA, USA, 2019; pp. 67–73. [Google Scholar]
- Valle-Levinson, A. Classification of Estuarine Circulation. In Treatise on Estuarine and Coastal Science; Elsevier Inc.: Amsterdam, The Netherlands, 2012; Volume 1, pp. 75–86. [Google Scholar]
- Hansen, D.; Rattray, M. Gravitational Circulation in Straits and Estuaries. J. Mar. Res. 1965, 23, 104–122. [Google Scholar]
- Classifying Estuaries: By Water Circulation. Available online: https://oceanservice.noaa.gov/education/tutorial_estuaries/est05_circulation.html (accessed on 20 November 2020).
- Hansen, D.; Rattray, M. New dimensions in estuary classifications. Limnol. Oceanogr. 1966, XI, 319–326. [Google Scholar] [CrossRef]
- Sousa, F.; Lourenço, I. Oceanografia Física do Estuário do Sado; Universidade de Lisboa: Lisbon, Portugal, 1980. [Google Scholar]
- Ambar, I.; Fiúza, A.; Sousa, F.; Lourenço, I. General circulation in the lower Sado River estuary under drougth conditions. Proc. Actual Probl. Oceanogr. Port. 1982, 97–107. [Google Scholar]
- Day, J.; Yáñez-Arancibia, A.; Kemp, W.; Crump, B. Introduction to Estuarine Ecology. In Estuarine Ecology, 2nd ed.; John Wiley and Sons: Hoboken, NJ, USA, 2012; pp. 1–18. [Google Scholar]
- Neves, R.; Chambel-Leitão, P.; Leitão, P. Modelação numérica da circulação da água no solo—O modelo MOHID. Pedologia 2000, 28, 46–55. [Google Scholar]
- Water Quality in Portuguese Estuaries Tejo—Sado—Mondego. Available online: http://maretec.mohid.com/PortugueseEstuaries/Reports/Portuguese_EUDirectives.pdf (accessed on 13 January 2021).
- Sousa, M. Contribuição Para a Caracterização Geoambiental dos Sapais do Estuário do Sado—Aplicação Experimental no Ensino da Geologia. Master’s Thesis, Faculdade de Ciências e Tecnologia, Universidade Nova de Lisboa, Lisbon, Portugal, 2006. [Google Scholar]
- Wolanski, E.; Andutta, F.; Delhez, E. Estuarine hydrology. In Encyclopedia of Lakes and Reservoirs. Encyclopedia of Earth Sciences Series; Springer: Dordrecht, The Netherlands, 2013; pp. 238–249. [Google Scholar]
- Ysebaert, T.; van der Hoek, D.; Wortelboer, R.; Wijsman, J.; Tangelder, M.; Nolte, A. Management options for restoring estuarine dynamics and implications for ecosystems: A quantitative approach for the Southwest Delta in the Netherlands. Ocean Coast. Manag. 2016, 121, 33–48. [Google Scholar] [CrossRef] [Green Version]
- Neto, J.; Caçador, I.; Caetano, M.; Chaínho, P.; Costa, L.; Gonçalves, A.; Pereira, L.; Pinto, L.; Ramos, J.; Seixas, S. Estuários (Capítulo 16). In Rios de Portugal—Comunidades, Processos e Alterações; Coimbra University Press: Coimbra, Portugal, 2019; pp. 381–421. [Google Scholar]
- Localização e Características. Available online: https://www.mun-setubal.pt/localizacao-e-caracteristicas/CamaraMunicipaldeSetúbal (accessed on 30 December 2020).
- Reserva Natural do Estuário do Sado—Informação. Available online: http://www2.icnf.pt/portal/ap/resource/ap/rnes/rnes-net-final.pdf (accessed on 26 November 2020).
- Brito, P.; Amorim, A.; Andrade, C.; Freitas, M.C.; Monteiro, J. Assessment of morphological change in estuarine systems—A tool to evaluate responses to future sea level rise. The case of the Sado Estuary (Portugal). In Proceedings of the II Congresso sobre Planejamento e Gestão da Zonas Costeiras dos Países de Expressão Portuguesa, Recife, Brasil, 12–19 April 2003. [Google Scholar]
- Coutinho, M. Comunidade Fitoplanctónica do Estuário do Sado; Estrutura, Dinâmica e Aspectos Ecológicos; Instituto Nacional de Investigação Agrária e das Pescas IPIMAR: Lisbon, Portugal, 2003. [Google Scholar]
- Publicações IPMA. Available online: http://www.ipma.pt/pt/publicacoes/boletins.jsp?cmbDep=cli&cmbTema=pcl&cmbAno=2018&idDep=cli&idTema=pcl&curAno=2018 (accessed on 30 December 2020).
- Sales, S. Determinação do Efeito do Regime Hidrológico e da Regularização do Caudal na Ecologia Trófica do Barbo do Norte (Luciobarbus Bocagei Streindachner 1864). Master’s Thesis, Universidade de Évora, Évora, Portugal, 2015. [Google Scholar]
- McDougall, T.; Barker, P. Getting started with TEOS-10 and the Gibbs Seawater (GSW) Oceanographic Toolbox. SCOR/IAPSO W 2011, 127, 1–28. [Google Scholar]
- Gillanders, B.; Kingsford, M. Impact of Changes in Flow of Freshwater on Estuarine and Open Coastal Habitats and the Associated Organisms. Oceanogr. Mar. Biol. Annu. Rev. 2002, 40, 223–309. [Google Scholar]
- Kennish, M. Anthropogenic Impacts. In Encyclopedia of Estuaries; Kennish, M., Ed.; Springer: Amsterdam, The Netherlands, 2016; pp. 29–34. [Google Scholar]
- Van Maren, D.; van Kessel, T.; Cronin, K.; Sittoni, L. The impact of channel deepening and dredging on estuarine sediment concentration. Cont. Shelf Res. 2015, 95, 1–14. [Google Scholar] [CrossRef] [Green Version]
- Conceição, R. Gestão de Dragagens Portuárias—Alguns Aspectos Geotécnicos e Geoambientais. Master’s Thesis, Faculdade de Ciências e Tecnologia, Universidade Nova de Lisboa, Lisbon, Portugal, 2016. [Google Scholar]
- Liria, P.; Garel, E.; Uriarte, A. The effects of dredging operations on the hydrodynamics of an ebb tidal delta: Oka Estuary, northern Spain. Cont. Shelf Res. 2009, 29, 1983–1994. [Google Scholar] [CrossRef]
- Yuan, R.; Zhu, J. The Effects of Dredging on Tidal Range and Saltwater Intrusion in the Pearl River Estuary. J. Coast. Res. 2015, 31, 1357–1362. [Google Scholar] [CrossRef]
- Dolgopolova, E.; Isupova, M. Classification of estuaries by hydrodynamic processes. Water Resour. 2010, 37, 268–284. [Google Scholar] [CrossRef]
- Ferreira, J.; Bettencourt, A.; Bricker, S.; Marques, J.; Newton, A.; Nobre, A.; Salas, F.; Silva, M.; Simas, T.; Soares, C.; et al. Water Framework Directive—Transitional and Coastal Waters Proposal for the Definition of Water Bodies. MONAE. 2005. Available online: http://www.ecowin.org/ticor/documents/MONAE%20book.pdf (accessed on 13 January 2021).
- Robins, P.; Skov, M.; Lewis, M.; Giménez, L.; Davies, A.; Malham, S.; Neill, S.; McDonald, J.; Whitton, T.; Jackson, S.; et al. Impact of climate change on UK estuaries: A review of past trends and potential projections. Estuar. Coast. Shelf Sci. 2016, 169, 119–135. [Google Scholar] [CrossRef] [Green Version]
- Scanes, E.; Scanes, P.; Ross, P. Climate change rapidly warms and acidifies Australian estuaries. Nat. Commun. 2020, 11, 1–11. [Google Scholar] [CrossRef] [PubMed] [Green Version]
- Marques, N. Dinâmica Oceânica no Espaço Marítimo Português: Caracterização de Massas de Água e Circulação Oceânica. Master’s Thesis, Marinha Portuguesa, Lisbon, Portugal, 2017. [Google Scholar]
Figure 1.
Location of the Sado estuary, within the Portuguese territory, and of the 3 sampling stations presented in this study. Representation of the main Sado river course in blue, as well as Moinho da Gamitinha station and Monte da Rocha and Roxo dams.
Figure 1.
Location of the Sado estuary, within the Portuguese territory, and of the 3 sampling stations presented in this study. Representation of the main Sado river course in blue, as well as Moinho da Gamitinha station and Monte da Rocha and Roxo dams.

Figure 2.
Daily average outflow of the Sado river, in the period between 16 October 1940 and 31 December 2019, measured at the Moinho da Gamitinha station (from SNIRH; https://snirh.apambiente.pt/).
Figure 2.
Daily average outflow of the Sado river, in the period between 16 October 1940 and 31 December 2019, measured at the Moinho da Gamitinha station (from SNIRH; https://snirh.apambiente.pt/).

Figure 3.
Average profiles of the intensity and direction of the currents obtained with data collected during the monthly campaigns and their inclusion in a 95% confidence interval.
Figure 3.
Average profiles of the intensity and direction of the currents obtained with data collected during the monthly campaigns and their inclusion in a 95% confidence interval.

Figure 4.
Intensity of the current at every depth level, in stn. C. Direction of the current at the surface and at the deepest level represented in blue and green arrows, respectively.
Figure 4.
Intensity of the current at every depth level, in stn. C. Direction of the current at the surface and at the deepest level represented in blue and green arrows, respectively.

Figure 5.
Intensity of the current at every depth level, in stn. B. Direction of the current at the surface and at the deepest level represented in blue and green arrows, respectively.
Figure 5.
Intensity of the current at every depth level, in stn. B. Direction of the current at the surface and at the deepest level represented in blue and green arrows, respectively.

Figure 6.
Average temperature and salinity profiles obtained with the data collected during the monthly campaigns and their inclusion in a 95% confidence interval.
Figure 6.
Average temperature and salinity profiles obtained with the data collected during the monthly campaigns and their inclusion in a 95% confidence interval.

Figure 7.
Schematic representation of the direction and intensity of the currents (not to scale) in the two navigation channels, during flood and ebb.
Figure 7.
Schematic representation of the direction and intensity of the currents (not to scale) in the two navigation channels, during flood and ebb.


Table 1.
Sampling stations: designation and geographical coordinates.
| Station (Stn.) | Designation | Coordinates | |
|---|---|---|---|
| Latitude (° N) | Longitude (° W) | ||
| A | Outão | 38.48667 | 008.93000 |
| B | Setúbal | 38.51809 | 008.89838 |
| C | Troia | 38.49278 | 008.88167 |
Publisher’s Note: MDPI stays neutral with regard to jurisdictional claims in published maps and institutional affiliations. |
© 2021 by the authors. Licensee MDPI, Basel, Switzerland. This article is an open access article distributed under the terms and conditions of the Creative Commons Attribution (CC BY) license (http://creativecommons.org/licenses/by/4.0/).
Share and Cite
MDPI and ACS Style
Biguino, B.; Sousa, F.; Brito, A.C. Variability of Currents and Water Column Structure in a Temperate Estuarine System (Sado Estuary, Portugal). Water 2021, 13, 187. https://doi.org/10.3390/w13020187
AMA Style
Biguino B, Sousa F, Brito AC. Variability of Currents and Water Column Structure in a Temperate Estuarine System (Sado Estuary, Portugal). Water. 2021; 13(2):187. https://doi.org/10.3390/w13020187
Chicago/Turabian StyleBiguino, Beatriz, Fátima Sousa, and Ana C. Brito. 2021. "Variability of Currents and Water Column Structure in a Temperate Estuarine System (Sado Estuary, Portugal)" Water 13, no. 2: 187. https://doi.org/10.3390/w13020187
Note that from the first issue of 2016, this journal uses article numbers instead of page numbers. See further details here.