Riparian Vegetation Structure Influences Terrestrial Invertebrate Communities in an Agricultural Landscape

 , , ,
, , ,  , , , and
Abstract
:1. Introduction
2. Materials and Methods
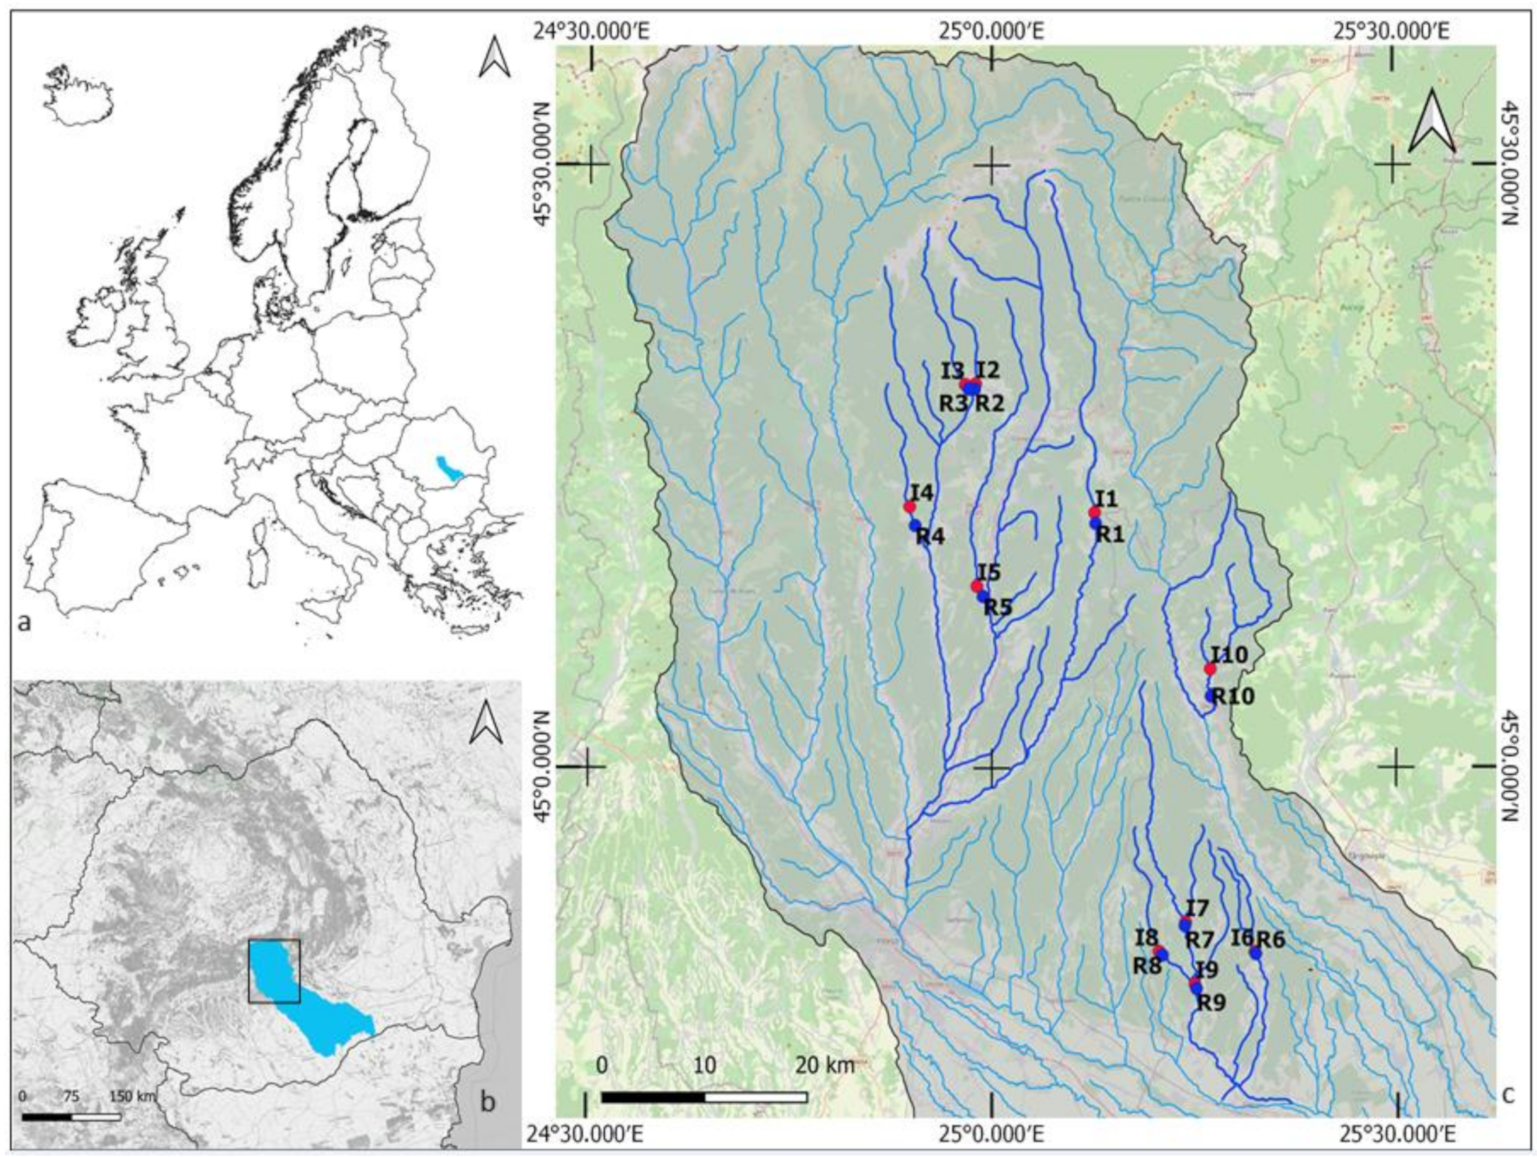
2.1. Study Area and Site Selection
2.2. Sampling Design and Methods
2.2.1. Environmental Variables
2.2.2. Riparian Invertebrates
2.3. Data Analysis
2.3.1. Environmental Variables
2.3.2. Patterns in Invertebrate Community Structure
2.3.3. Influence of Selected Environmental Variables on Invertebrate Community Structure
2.3.4. The Effect of Forested Riparian Buffers on Riparian Invertebrate Community Structure
3. Results
3.1. Environmental Differences between Site Types
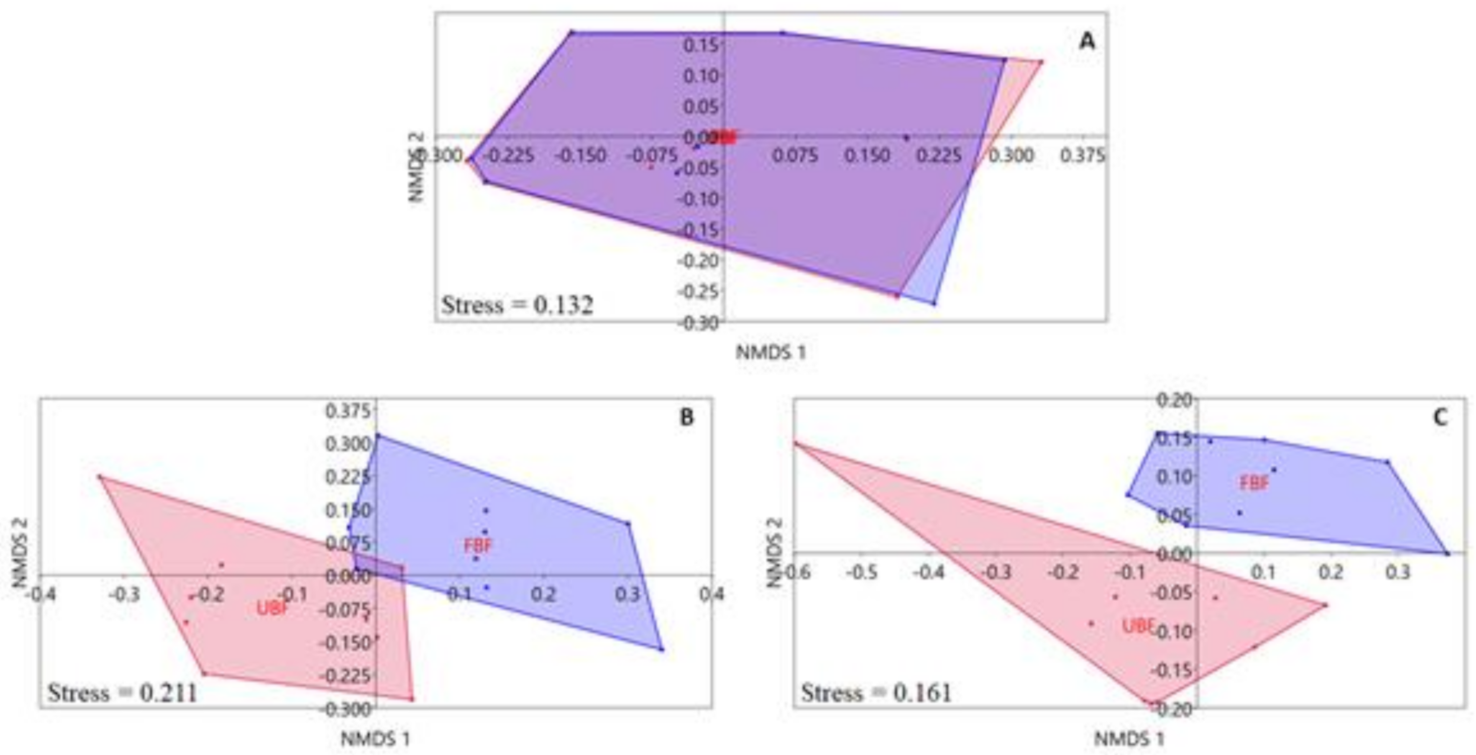
3.2. Patterns in Invertebrate Community Structure
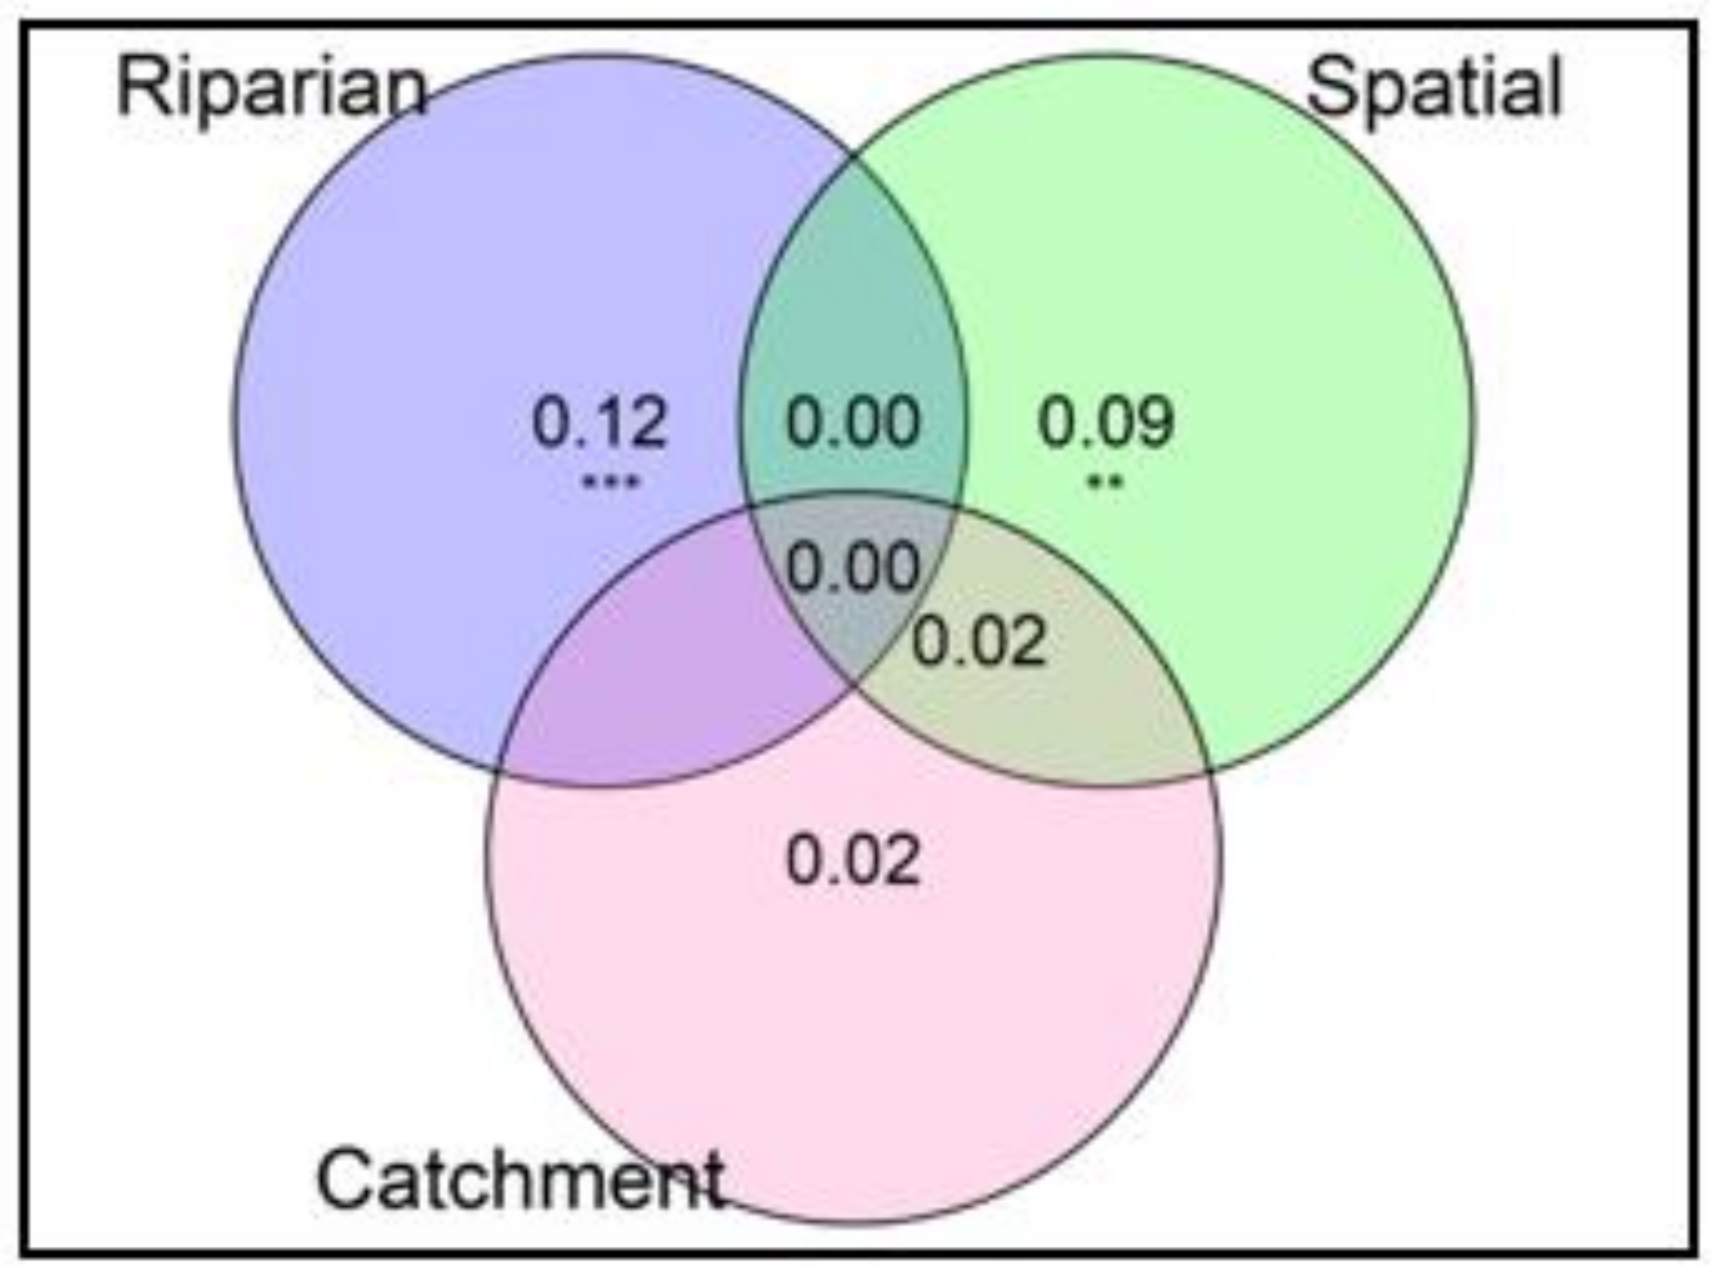
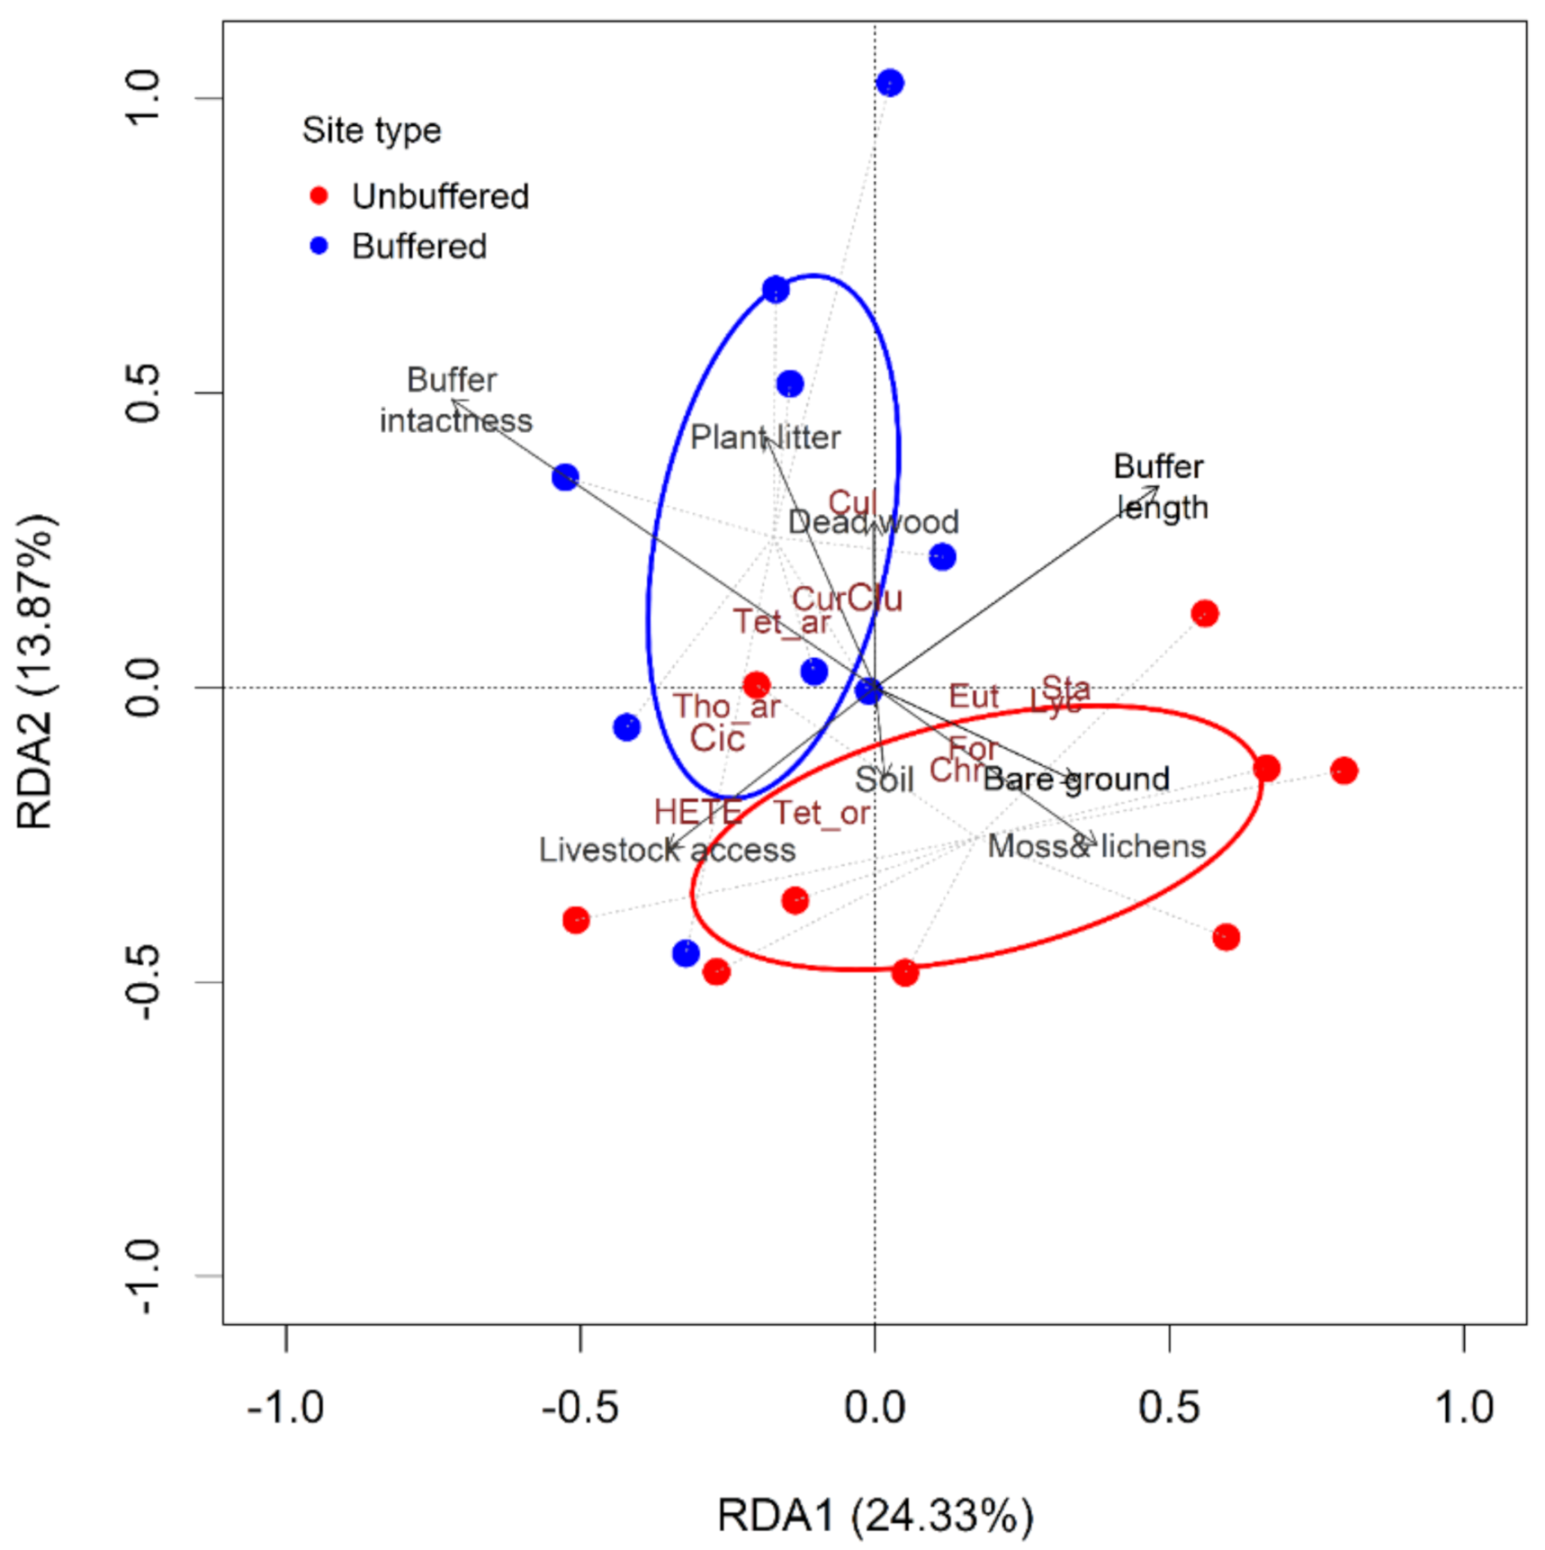
3.3. Effects of Selected Environmental Variables on Riparian Invertebrate Community Structure
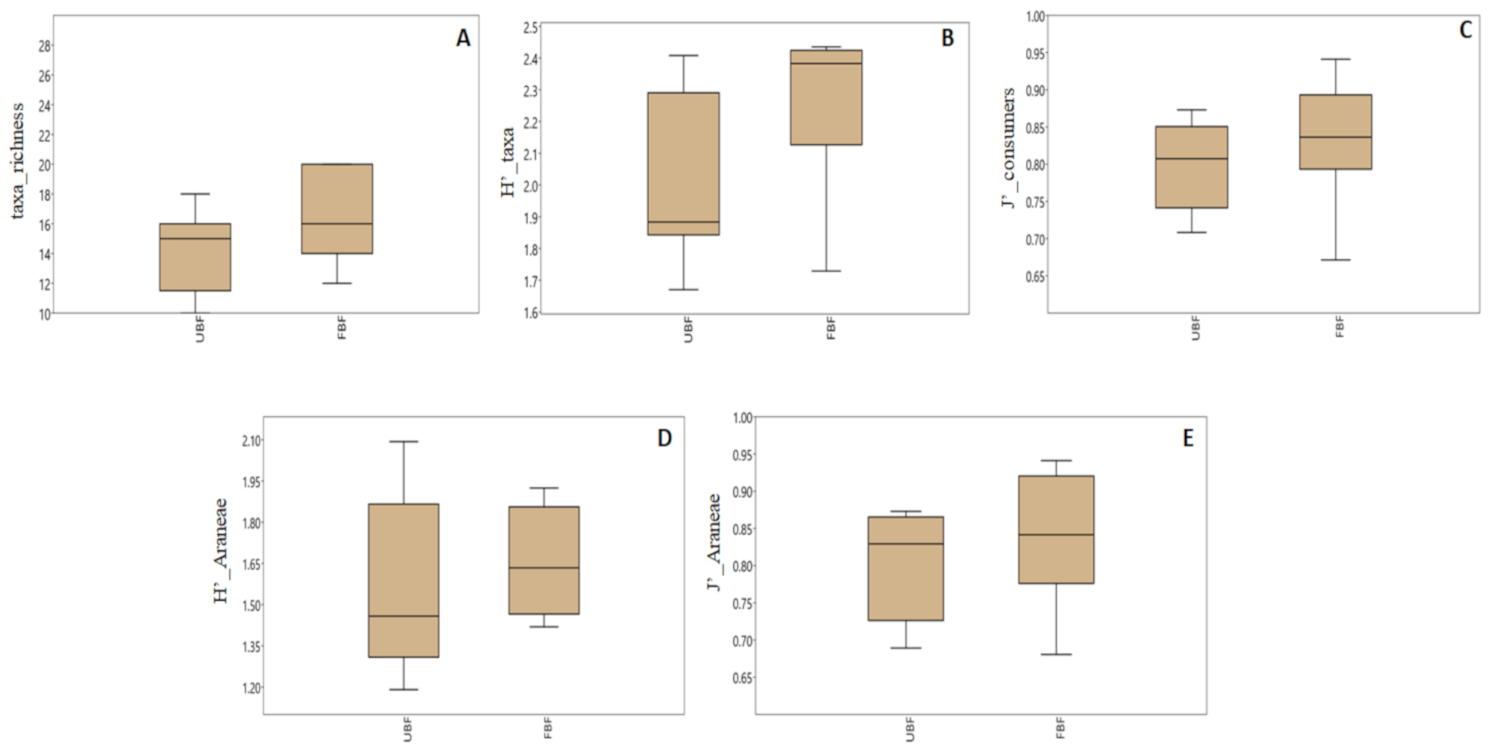
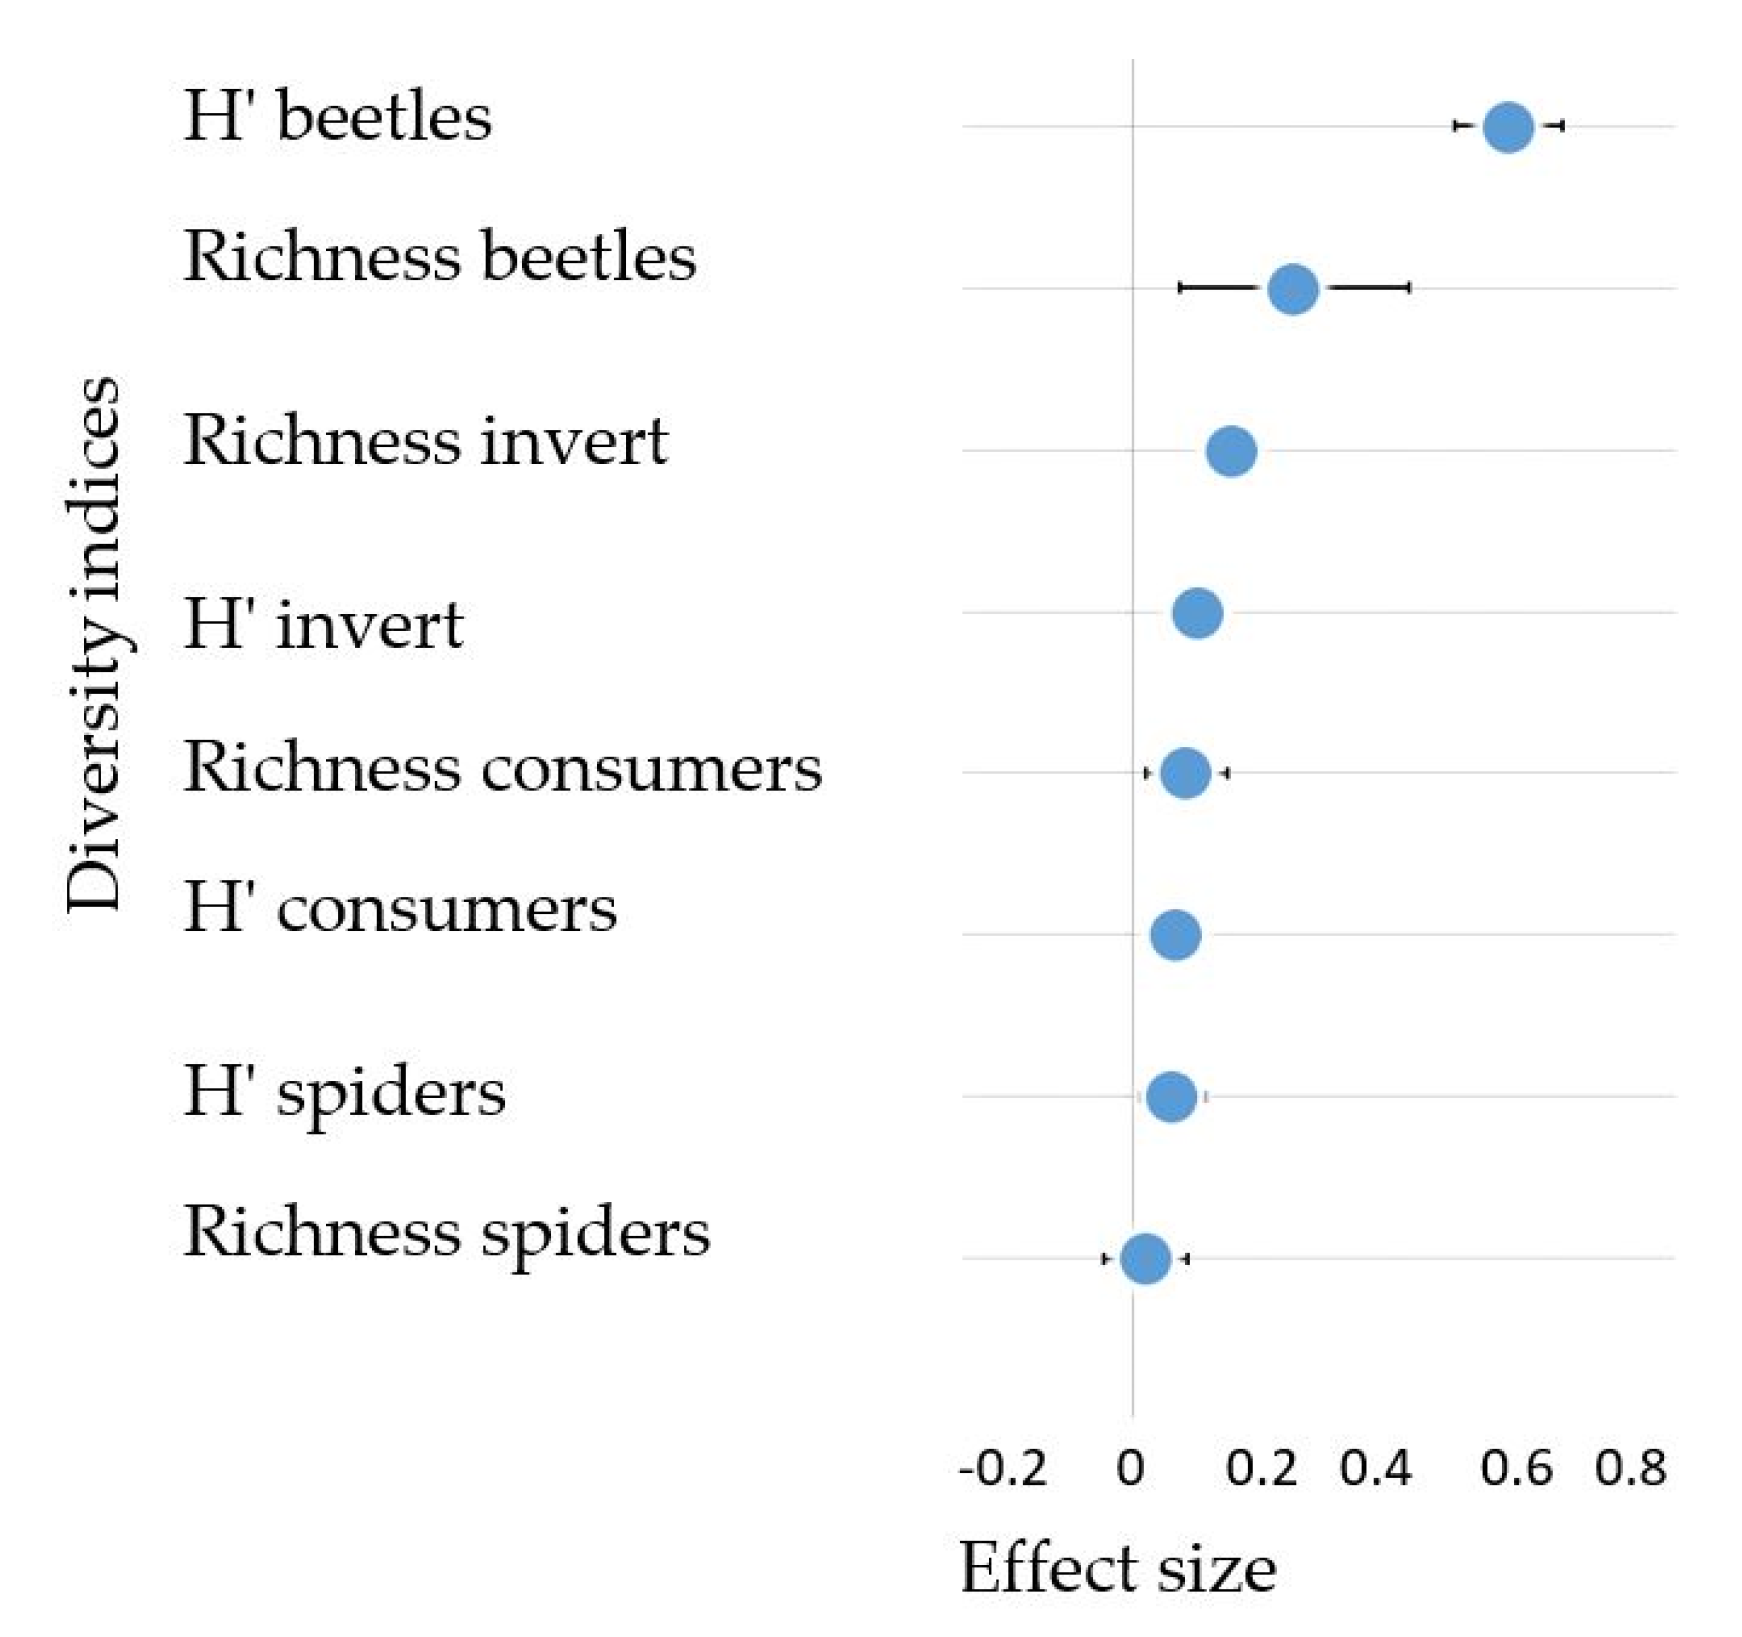
3.4. The Effect of Forested Riparian Buffers on Riparian Invertebrate Community Structure
4. Discussion
4.1. Patterns in Invertebrate Community Structure
4.2. The Effects of Environmental Variables and the Role of Forested Riparian Buffers
4.3. Management Implications
5. Conclusions
Supplementary Materials
Author Contributions
Funding
Institutional Review Board Statement
Informed Consent Statement
Data Availability Statement
Acknowledgments
Conflicts of Interest
References
- Rykken, J.J.; Moldenke, A.R.; Olson, D.H. Headwater riparian forest-floor invertebrate communities associated with alternative forest management practices. Ecol. Appl. 2007, 17, 1168–1183. [Google Scholar] [CrossRef]
- Ramey, T.L.; Richardson, J.S. Terrestrial Invertebrates in the Riparian Zone: Mechanisms Underlying Their Unique Diversity. Bioscience 2017, 67, 808–819. [Google Scholar] [CrossRef] [Green Version]
- Raitif, J.; Plantegenest, M.; Roussel, J.M. From stream to land: Ecosystem services provided by stream insects to agriculture. Agric. Ecosyst. Environ. 2019, 270–271, 32–40. [Google Scholar] [CrossRef] [Green Version]
- Ramberg, E.; Burdon, F.J.; Sargac, J.; Kupilas, B.; Rîsnoveanu, G.; Lau, D.C.P.; Johnson, R.K.; McKie, B.G. The Structure of Riparian Vegetation in Agricultural Aquatic-Terrestrial Linkages. Water 2020, 12, 2855. [Google Scholar] [CrossRef]
- Burdon, F.J.; McIntosh, A.R.; Harding, J.S. Habitat loss drives threshold response of benthic invertebrate communities to deposited sediment in agricultural streams. Ecol. Appl. 2013, 23, 1036–1047. [Google Scholar] [CrossRef]
- Burdon, F.J.; Ramberg, E.; Sargac, J.; Forio, M.A.E.; de Saeyer, N.; Mutinova, P.T.; Moe, T.F.; Pavelescu, M.O.; Dinu, V.; Cazacu, C.; et al. Assessing the benefits of forested riparian zones: A qualitative index of riparian integrity is positively associated with ecological status in European streams. Water 2020, 12, 1178. [Google Scholar] [CrossRef] [Green Version]
- Hefting, M.M.; Clement, J.C.; Bienkowski, P.; Dowrick, D.; Guenat, C.; Butturini, A.; Topa, S.; Pinay, G.; Verhoeven, J.T.A. The role of vegetation and litter in the nitrogen dynamics of riparian buffer zones in Europe. Ecol. Eng. 2005, 24, 465–482. [Google Scholar] [CrossRef]
- Buckley, C.; Hynes, S.; Mechan, S. Supply of an ecosystem service-Farmers’ willingness to adopt riparian buffer zones in agricultural catchments. Environ. Sci. Policy 2012, 24, 101–109. [Google Scholar] [CrossRef] [Green Version]
- Cole, L.J.; Stockan, J.; Helliwell, R. Managing riparian buffer strips to optimise ecosystem services: A review. Agric. Ecosyst. Environ. 2020, 296, 106891. [Google Scholar] [CrossRef]
- Forio, M.A.E.; De Troyer, N.; Lock, K.; Witing, F.; Baert, L.; De Saeyer, N.; Rîșnoveanu, G.; Popescu, C.; Burdon, F.J.; Kupilas, B.; et al. Small Patches of Riparian Woody Vegetation Enhance Biodiversity of Invertebrates. Water 2020, 12, 3070. [Google Scholar] [CrossRef]
- Iñiguez-Armijos, C.; Hampel, H.; Breuer, L. Land-use effects on structural and functional composition of benthic and leaf-associated macroinvertebrates in four Andean streams. Aquat. Ecol. 2018, 52, 77–92. [Google Scholar] [CrossRef] [Green Version]
- Fierro, P.; Bertrán, C.; Tapia, J.; Hauenstein, E.; Peña-Cortés, F.; Vergara, C.; Cerna, C.; Vargas-Chacoff, L. Effects of local land-use on riparian vegetation, water quality, and the functional organization of macroinvertebrate assemblages. Sci. Total Environ. 2017, 609, 724–734. [Google Scholar] [CrossRef] [PubMed]
- Silva-Araújo, M.; Silva-Junior, E.F.; Neres-Lima, V.; Feijó-Lima, R.; Tromboni, F.; Lourenço-Amorim, C.; Thomas, S.A.; Moulton, T.P.; Zandonà, E. Effects of riparian deforestation on benthic invertebrate community and leaf processing in Atlantic forest streams. Perspect. Ecol. Conserv. 2020, 18, 277–282. [Google Scholar] [CrossRef]
- Ssymank, A.; Kearns, C.A.; Pape, T.; Thompson, F.C.; Ssymank, A.; Kearns, C.A.; Pape, T.; Thompson, F.C. Plant diversity and agricultural production Pollinating Flies (Diptera): A major contribution to plant diversity and agricultural production. Biodiversity 2011, 86–89. [Google Scholar]
- Qodri, A.; Raffiudin, R.; Noerdjito, W.A. Diversity and Abundance of Carabidae and Staphylinidae (Insecta: Coleoptera) in Four Montane Habitat Types on Mt. Bawakaraeng, South Sulawesi. HAYATI J. Biosci. 2016, 23, 22–28. [Google Scholar] [CrossRef] [Green Version]
- Bartholomée, O.; Aullo, A.; Becquet, J.; Vannier, C.; Lavorel, S. Pollinator presence in orchards depends on landscape-scale habitats more than in-field flower resources. Agric. Ecosyst. Environ. 2020, 293, 106806. [Google Scholar] [CrossRef]
- Stutter, M.I.; Chardon, W.J.; Kronvang, B. Riparian Buffer Strips as a Multifunctional Management Tool in Agricultural Landscapes: Introduction. J. Environ. Qual. 2012, 41, 297–303. [Google Scholar] [CrossRef] [Green Version]
- Burdon, F. Agriculture and Mining Contamination Contribute to a Productivity Gradient Driving Cross-Ecosystem Associations between Stream Insects and Riparian Arachnids. In Contaminants and Ecological Subsidies; Kraus, J.M., Walters, D.M., Mills, M.A., Eds.; Springer: Cham, Switzerland, 2020; pp. 61–90. [Google Scholar] [CrossRef]
- Williamson, J.; Slade, E.M.; Luke, S.H.; Swinfield, T.; Chung, A.Y.C.; Coomes, D.A.; Heroin, H.; Jucker, T.; Lewis, O.T.; Vairappan, C.S.; et al. Riparian buffers act as microclimatic refugia in oil palm landscapes. J. Appl. Ecol. 2020, 1–12. [Google Scholar] [CrossRef]
- Nsor, C.A.; Oppong, S.K.; Danquah, E.; Ochem, M.; Antobre, O.O. Spatiotemporal dynamics of terrestrial invertebrate assemblages in the riparian zone of the Wewe river, Ashanti region, Ghana. Open Life Sci. 2020, 15, 331–345. [Google Scholar] [CrossRef]
- Domnişoru, A. Long Term Effects of Climate Change on Europe’s Water Resources Case Study: Arges, Romania; Kiwa N.V.: Nieuwegein, The Netherlands, 2006; pp. 40–72. [Google Scholar]
- Strahler, A.N. Quantitative analysis of watershed geomorphology. EOS Trans. Am. Geophys. Union 1957, 38, 913–920. [Google Scholar] [CrossRef] [Green Version]
- Harding, J.; Clapcott, J.; Quinn, J.; Hayes, J.; Joy, M.; Storey, R.; Greig, H.; Hay, J.; James, T.; Beech, M.; et al. Stream Habitat Assessment Protocols for wadable rivers and streams of New Zealand; School of Biological Sciences, University of Canterbury: Christchurch, New Zealand, 2009. [Google Scholar]
- Anderson, J.T.; Davis, C.A. Wetland Techniques Volume 2: Organisms; Wetland Techniques; Springer: Drodrecht, The Netherlands, 2013; Volume 2, pp. 1–332. [Google Scholar]
- Makarov, K. A key to the genera of the Ground-beetle larvae (Coleoptera, Carabidae) of the Paleartic region. Boll. Mus. Reg. Sci. Nat. Torino 1994, 12, 221–254. [Google Scholar]
- Klimaszewski, J.; Watt, J.C. Coleoptera: Family-group review and keys to identification. Fauna N. Zeal. 1997, 37, 1–199. [Google Scholar]
- Key to Adult Insects. Available online: https://www.amentsoc.org/insects/what-bug-is-this/adult-key.html (accessed on 30 June 2020).
- Insect Identification Key. Available online: http://www.knowyourinsects.org/ (accessed on 30 June 2020).
- Insect Identification Key. Available online: https://www.insectidentification.org/insect-key.asp (accessed on 30 June 2020).
- Canedoli, C.; Ferrè, C.; Abu El Khair, D.; Comolli, R.; Liga, C.; Mazzucchelli, F.; Proietto, A.; Rota, N.; Colombo, G.; Bassano, B.; et al. Evaluation of ecosystem services in a protected mountain area: Soil organic carbon stock and biodiversity in alpine forests and grasslands. Ecosyst. Serv. 2020, 44, 101135. [Google Scholar] [CrossRef]
- Michaels, K.F. Using staphylinid and tenebrionid beetles as indicators of sustainable landscape management in Australia: A review. Aust. J. Exp. Agric. 2007, 47, 435–449. [Google Scholar] [CrossRef]
- Gerlach, J.; Samways, M.; Pryke, J. Terrestrial invertebrates as bioindicators: An overview of available taxonomic groups. J. Insect Conserv. 2013, 17, 831–850. [Google Scholar] [CrossRef]
- Johan Kotze, D.; Brandmayr, P.; Casale, A.; Dauffy-Richard, E.; Dekoninck, W.; Koivula, M.J.; Lövei, G.L.; Mossakowski, D.; Noordijk, J.; Paarmann, W.; et al. Forty years of carabid beetle research in Europe—From taxonomy, biology, ecology and population studies to bioindication, habitat assessment and conservation. Zookeys 2011, 100, 55–148. [Google Scholar] [CrossRef] [PubMed]
- Gao, T.; Nielsen, A.B.; Hedblom, M. Reviewing the strength of evidence of biodiversity indicators for forest ecosystems in Europe. Ecol. Indic. 2015, 57, 420–434. [Google Scholar] [CrossRef]
- Soliveres, S.; Van Der Plas, F.; Manning, P.; Prati, D.; Gossner, M.M.; Renner, S.C.; Alt, F.; Arndt, H.; Baumgartner, V.; Binkenstein, J.; et al. Biodiversity at multiple trophic levels is needed for ecosystem multifunctionality. Nature 2016, 536, 456–459. [Google Scholar] [CrossRef]
- Hammer, O.; Harper, D.; Ryan, P. PAST: Paleontological Statistics Software Package for Education and Data Analysis. Palaeontol. Electron. 2001, 4, 1–9. [Google Scholar]
- Anderson, M.J. A new method for non-parametric multivariate analysis of variance. Austral Ecol. 2001, 26, 32–46. [Google Scholar] [CrossRef]
- Legendre, P.; Gallagher, E.D. Ecologically meaningful transformations for ordination of species data. Oecologia 2001, 129, 271–280. [Google Scholar] [CrossRef] [PubMed]
- Blanchet, F.G.; Legendre, P.; Borcard, D. Forward selection of explanatory variables. Ecology 2008, 89, 2623–2632. [Google Scholar] [CrossRef] [PubMed]
- Borcard, D.; Legendre, P. All-scale spatial analysis of ecological data by means of principal coordinates of neighbour matrices. Ecol. Model. 2002, 153, 51–68. [Google Scholar] [CrossRef]
- Borcard, D.; Legendre, P. Environmental control and spatial structure in ecological communities: An example using oribatid mites (Acari, Oribatei). Environ. Ecol. Stat. 1994, 1, 37–61. [Google Scholar] [CrossRef]
- Krell, B.; Röder, N.; Link, M.; Gergs, R.; Entling, M.H.; Schäfer, R.B. Aquatic prey subsidies to riparian spiders in a stream with different land use types. Limnologica 2015, 51, 1–7. [Google Scholar] [CrossRef]
- Tourinho, A.L.; Benchimol, M.; Porto, W.; Peres, C.A.; Storck-Tonon, D. Marked compositional changes in harvestmen assemblages in Amazonian forest islands induced by a mega dam. Insect Conserv. Divers. 2020, 13, 432–444. [Google Scholar] [CrossRef]
- Marczak, L.B.; Richardson, J.S. Spiders and subsidies: Results from the riparian zone of a coastal temperate rainforest. J. Anim. Ecol. 2007, 76, 687–694. [Google Scholar] [CrossRef]
- Burdon, F.J.; Harding, J.S. The linkage between riparian predators and aquatic insects across a stream-resource spectrum. Freshw. Biol. 2008, 53, 330–346. [Google Scholar] [CrossRef]
- Leslie Hayes, J.; Lockley, T.C. Prey and nocturnal activity of Wolf spiders (Araneae: Lycosidae) in cotton fields in the Delta Region of Mississippi. Environ. Entomol. 1990, 19, 1512–1518. [Google Scholar] [CrossRef] [Green Version]
- Hunt, J.L.; Paterson, H.; Close, P.; Pettit, N.E. Riparian condition influences spider community structure and the contribution of aquatic carbon subsidies to terrestrial habitats. Sci. Total Environ. 2020, 746, 141109. [Google Scholar] [CrossRef]
- Jennings, D.T. Crab spiders (Araneae: Thomisidae) preying on scarab beetles (Coleoptera: Scarabaeidae). Coleopterists’ Bull. 1974, 41–43. [Google Scholar]
- Török, E.; Kolcsár, L.P.; Popescu, O.; Keresztes, L. Faunistic survey on Culicidae (Diptera) and their arboviruses in the area of a metropolis Cluj-Napoca, Romania. North West. J. Zool. 2019, 15, 24–29. [Google Scholar]
- Bradshaw, M.E.; Holzapfel, C.M. Resource limitation, habitat segregation, and species interactions of british tree-hole mosquitoes in nature. Oecologia 1992, 90, 227–237. [Google Scholar] [CrossRef] [PubMed]
- Zamanian, H.; Mehdipour, M.; Ghaemi, N. The study and analysis of the mating behavior and sound production of male cicada Psalmocharias alhageos (Kol.) (Homoptera:Cicadidae) to make disruption in mating. Pakistan J. Biol. Sci. PJBS 2008, 11, 2062–2072. [Google Scholar] [CrossRef] [Green Version]
- Anderson, R.S. CURCULIONIDAE Latreille, 1802. In American Beetles; Arnett, R.H., Jr., Thomas, M.C., Skelley, P.E., Frank, J.H., Eds.; CRC Press: Boca Raton, FL, USA, 2002; pp. 722–815. [Google Scholar]
- Olivier, R.; Aranda, R.; Godoi, M.; Vilalva, A. Habitat structure in the composition of leaf-litter insects in mosaic environment. Acta Biológica Parana. 2015, 44, 71–87. [Google Scholar] [CrossRef] [Green Version]
- Riis, T.; Kelly-Quinn, M.; Aguiar, F.C.; Manolaki, P.; Bruno, D.; Bejarano, M.D.; Clerici, N.; Fernandes, M.R.; Franco, J.C.; Pettit, N.; et al. Global overview of ecosystem services provided by riparian vegetation. Bioscience 2020, 70, 501–514. [Google Scholar] [CrossRef]
- Stockan, J.A.; Baird, J.; Langan, S.J.; Young, M.R.; Iason, G.R. Effects of riparian buffer strips on ground beetles (Coleoptera, Carabidae) within an agricultural landscape. Insect Conserv. Divers. 2014, 7, 172–184. [Google Scholar] [CrossRef]
- Bennewicz, J.; Barczak, T. Ground beetles (Carabidae) of field margin habitats. Biologia 2020, 75, 1631–1641. [Google Scholar] [CrossRef]
- Caballero, U.; León-Cortés, J.L.; Morón-Ríos, A. Response of rove beetles (Staphylinidae) to various habitat types and change in Southern Mexico. J. Insect Conserv. 2009, 13, 67–75. [Google Scholar] [CrossRef]
- Vásquez-Vélez, L.M.; Bermúdez, C.; Chacón, P.; Lozano-Zambrano, F.H. Analysis of the richness of Staphylinidae (Coleoptera) on different scales of a sub-Andean rural landscape in Colombia. Biodivers. Conserv. 2010, 19, 1917–1931. [Google Scholar] [CrossRef]
- Hoffmann, H.; Michalik, P.; Görn, S.; Fischer, K. Effects of fen management and habitat parameters on staphylinid beetle (Coleoptera: Staphylinidae) assemblages in north-eastern Germany. J. Insect Conserv. 2016, 20, 129–139. [Google Scholar] [CrossRef]
- Klimaszewski, J.; Brunke, A.J.; Work, T.T.; Venier, L. Rove Beetles (Coleoptera, Staphylinidae) as Bioindicators of Change in Boreal Forests and Their Biological Control Services in Agroecosystems: Canadian Case Studies BT—Biology of Rove Beetles (Staphylinidae): Life History, Evolution, Ecology and Distri; Betz, O., Irmler, U., Klimaszewski, J., Eds.; Springer: Cham, Switzerland, 2018; pp. 161–181. [Google Scholar] [CrossRef]
- Hebert, P.D.N.; Penton, E.H.; Burns, J.M.; Janzen, D.H.; Hallwachs, W. Ten species in one: DNA barcoding reveals cryptic species in the neotropical skipper butterfly Astraptes fulgerator. Proc. Natl. Acad. Sci. USA 2004, 101, 14812–14817. [Google Scholar] [CrossRef] [PubMed] [Green Version]
- De Oliveira, S.S.; Ortega, J.C.G.; dos Santos Ribas, L.G.; Lopes, V.G.; Bini, L.M. Higher taxa are sufficient to represent biodiversity patterns. Ecol. Indic. 2020, 111, 105994. [Google Scholar] [CrossRef]
- Timms, L.L.; Bowden, J.J.; Summerville, K.S.; Buddle, C.M. Does species-level resolution matter? Taxonomic sufficiency in terrestrial arthropod biodiversity studies. Insect Conserv. Divers. 2013, 6, 453–462. [Google Scholar] [CrossRef]
- Allan, J.D.; Erickson, D.L.; Fay, J. The influence of catchment land use on stream integrity across multiple spatial scales. Freshw. Biol. 1997, 37, 149–161. [Google Scholar] [CrossRef] [Green Version]
- Feld, C.K.; Fernandes, M.R.; Ferreira, M.T.; Hering, D.; Ormerod, S.J.; Venohr, M.; Gutiérrez-Cánovas, C. Evaluating riparian solutions to multiple stressor problems in river ecosystems—A conceptual study. Water Res. 2018, 139, 381–394. [Google Scholar] [CrossRef]
- Brosse, S.; Arbuckle, C.J.; Townsend, C.R. Habitat scale and biodiversity: Influence of catchment, stream reach and bedform scales on local invertebrate diversity. Biodivers. Conserv. 2003, 12, 2057–2075. [Google Scholar] [CrossRef]
- Rodrigues, E.N.L.; Mendonça, M.D.S.; Costa-Schmidt, L.E. Spider diversity responds strongly to edge effects but weakly to vegetation structure in riparian forests of Southern Brazil. Arthropod Plant Interact. 2014, 8, 123–133. [Google Scholar] [CrossRef]
- Zermeño-Hernández, I.; Benítez-Malvido, J.; Suazo-Ortuño, I.; Méndez-Toribio, M. Impact of adjacent land use on the ecological condition of riparian habitats: The relation between condition and vegetation properties. Appl. Veg. Sci. 2020, 23, 610–621. [Google Scholar] [CrossRef]
- Sigsgaard, L. Early season natural biological control of insect pests in rice by spiders—And some factors in the management of the cropping system that may affect this control. Eur. Arachnol. 2000, 2000, 57–64. [Google Scholar]
- Freiberg, J.A.; de Sales Dambros, C.; Rodrigues, E.N.L.; Teixeira, R.A.; Vieira, Â.D.H.N.; de Almeida, H.S.; de Faccio Carvalho, P.C.; Jacques, R.J.S. Increased grazing intensity in pastures reduces the abundance and richness of ground spiders in an integrated crop-livestock system. Agron. Sustain. Dev. 2020, 40. [Google Scholar] [CrossRef]
- Bakken, L.R.; Børresen, T.; Njøs, A. Effect of soil compaction by tractor traffic on soil structure, denitrification, and yield of wheat (Triticum aestivum L.). J. Soil Sci. 1987, 38, 541–552. [Google Scholar] [CrossRef]
- Bhandral, R.; Saggar, S.; Bolan, N.; Hedley, M.J. Nitrous oxide fluxes in soil as influenced by compaction. Proc. N. Zeal. Grassl. Assoc. 2003, 265–271. [Google Scholar] [CrossRef]
- Thomas, S.M.; Fraser, P.M.; Hu, W.; Clough, T.J.; Van Der Klei, G.; Wilson, S.; Tregurtha, R.; Baird, D. Tillage, compaction and wetting effects on NO3, N2O and N2 losses. Soil Res. 2019, 57, 670–688. [Google Scholar] [CrossRef]
- Sgouridis, F.; Ullah, S. Denitrification potential of organic, forest and grassland soils in the Ribble-Wyre and Conwy River catchments, UK. Environ. Sci. Process. Impacts 2014, 16. [Google Scholar] [CrossRef]
- Johnson, A.D. Denitrification and Organic Carbon in a Series of Riparian Buffers in the Bear Creek National Demonstration Watershed; Iowa State University: Ames, IA, USA, 2003; p. 78. [Google Scholar]
- Rana, H.; Khan, M.F.; Fahim, M.; Tariq, S.A. Abundance and Comparative Population Fluctuation of Rove Beetles (Paederus Littoralis and Paederus Fuscipes) in Sindh, Pakistan. Int. J. Biol. Biotechnol. 2013, 10, 271–274. [Google Scholar]
- Irmler, U.; Lipkow, E. Effect of environmental conditions on distribution patterns of rove beetles. In Biology of Rove Beetles (Staphylinidae); Betz, O., Irmler, U., Klimaszewski, J., Eds.; Springer: Cham, Switzerland, 2018; pp. 117–144. ISBN 9783319702551. [Google Scholar]
- Walsh, C.J.; Waller, K.A.; Gehling, J.; Mac Nally, R. Riverine invertebrate assemblages are degraded more by catchment urbanisation than by riparian deforestation. Freshw. Biol. 2007, 52, 574–587. [Google Scholar] [CrossRef]
- Didham, R.K.; Barker, G.M.; Bartlam, S.; Deakin, E.L.; Denmead, L.H.; Fisk, L.M.; Peters, J.M.R.; Tylianakis, J.M.; Wright, H.R.; Schipper, L.A. Agricultural intensification exacerbates spillover effects on soil biogeochemistry in adjacent forest remnants. PLoS ONE 2015, 10, 1–32. [Google Scholar] [CrossRef] [Green Version]
- Batáry, P.; Báldi, A.; Samu, F.; Szuts, T.; Erdos, S. Are spiders reacting to local or landscape scale effects in Hungarian pastures? Biol. Conserv. 2008, 141, 2062–2070. [Google Scholar] [CrossRef]
- Dassou, A.G.; Dépigny, S.; Canard, E.; Vinatier, F.; Carval, D.; Tixier, P. Contrasting effects of plant diversity across arthropod trophic groups in plantain-based agroecosystems. Basic Appl. Ecol. 2016, 17, 11–20. [Google Scholar] [CrossRef]
- Maisonneuve, C.; Rioux, S. Importance of riparian habitats for small mammal and herpetofaunal communities in agricultural landscapes of southern Québec. Agric. Ecosyst. Environ. 2001, 83, 165–175. [Google Scholar] [CrossRef]
- Eyre, M.D.; Lott, D.A.; Garside, A. Assessing the potential for environmental monitoring using ground beetles (Coleoptera: Carabidae) with riverside and Scottish data. Ann. Zool. Fennici 1996, 33, 157–163. [Google Scholar]
- Eyre, M.D.; Luff, M.L.; Lott, D.A. The importance of exposed riverine sediments for phytophagous beetles (Coleoptera) in Scotland and Northern England. Aquat. Conserv. Mar. Freshw. Ecosyst. 2002, 12, 553–566. [Google Scholar] [CrossRef]
- Andersen, J.; Hanssen, O. Riparian Beetles, a Unique, but Vulnerable Element in the Fauna of Fennoscandia. Biodivers. Conserv. 2005, 14, 3497–3524. [Google Scholar] [CrossRef]
- Lambeets, K.; Vandegehuchte, M.L.; Maelfait, J.P.; Bonte, D. Integrating environmental conditions and functional life-history traits for riparian arthropod conservation planning. Biol. Conserv. 2009, 142, 625–637. [Google Scholar] [CrossRef] [Green Version]
- Haddaway, N.R.; Brown, C.; Eales, J.; Eggers, S.; Josefsson, J.; Kronvang, B.; Randall, N.P.; Uusi-Kämppä, J. The multifunctional roles of vegetated strips around and within agricultural fields. Environ. Evid. 2018, 7, 1–43. [Google Scholar] [CrossRef] [Green Version]
- Bonn, A.; Hagen, K.; Wohlgemuth-Von Reiche, D. The significance of flood regimes for Carabid beetle and spider communities in riparian habitats—A comparison of three major rivers in Germany. River Res. Appl. 2002, 18, 43–64. [Google Scholar] [CrossRef]
- Cole, L.J.; Brocklehurst, S.; Robertson, D.; Harrison, W.; McCracken, D.I. Riparian buffer strips: Their role in the conservation of insect pollinators in intensive grassland systems. Agric. Ecosyst. Environ. 2015, 211, 207–220. [Google Scholar] [CrossRef]
- Halaj, J.; Cady, A.B.; Uetz, G.W. Modular habitat refugia enhance generalist predators and lower plant damage in soybeans. Environ. Entomol. 2000, 29, 383–393. [Google Scholar] [CrossRef]
- Aldebron, C.; Jones, M.S.; Snyder, W.E.; Blubaugh, C.K. Soil organic matter links organic farming to enhanced predator evenness. Biol. Control 2020, 146, 104278. [Google Scholar] [CrossRef]
- Baba, Y.G.; Tanaka, K. Factors affecting abundance and species composition of generalist predators (Tetragnatha spiders) in agricultural ditches adjacent to rice paddy fields. Biol. Control 2016, 103, 147–153. [Google Scholar] [CrossRef]
- Nyffeler, M.; Breene, R.G. Spiders associated with selected European hay meadows, and the effects of habitat disturbance, with the predation ecology of the crab spiders, Xysticus spp. (Araneae, Thomisidae). J. Appl. Entomol. 1990, 110, 149–159. [Google Scholar] [CrossRef]
- Lahondère, C.; Vinauger, C.; Okubo, R.P.; Wolff, G.H.; Chan, J.K.; Akbari, O.S.; Riffell, J.A. The olfactory basis of orchid pollination by mosquitoes. Proc. Natl. Acad. Sci. USA 2020, 117, 708–716. [Google Scholar] [CrossRef] [PubMed] [Green Version]
- Peach, D.A.H.; Carroll, C.; Meraj, S.; Gomes, S.; Galloway, E.; Balcita, A.; Coatsworth, H.; Young, N.; Uriel, Y.; Gries, R.; et al. Nectar-dwelling microbes of common tansy are attractive to its mosquito pollinator, Culex pipiens L. bioRxiv 2020, 1–9. [Google Scholar] [CrossRef]
- van Looy, K.; Vanacker, S.; Jochems, H.; De Blust, G.; Dufrêne, M. Ground beetle habitat templets and riverbank integrity. River Res. Appl. 2005, 21, 1133–1146. [Google Scholar] [CrossRef]
- Januschke, K.; Verdonschot, R.C.M. Effects of river restoration on riparian ground beetles (Coleoptera: Carabidae) in Europe. Hydrobiologia 2016, 769, 93–104. [Google Scholar] [CrossRef]
- Šustek, Z. Impact of water management on a carabid community (Insecta, Coleoptera) in a central European floodplain forest. Quad. Staz. Ecol. Civ. Mus. St. Nat. Ferrara 1994, 6, 293–313. [Google Scholar]
- Skalsk, T.; Kedzior, R.; Radecki-Pawlik, A. Riverine ground beetles as indicators of inundation frequency of mountain stream: A case study of the ochotnica stream, southern Poland. Balt. J. Coleopterol. 2012, 12, 117–126. [Google Scholar]
- Jähnig, S.C.; Brunzel, S.; Gacek, S.; Lorenz, A.W.; Hering, D. Effects of re-braiding measures on hydromorphology, floodplain vegetation, ground beetles and benthic invertebrates in mountain rivers. J. Appl. Ecol. 2009, 46, 406–416. [Google Scholar] [CrossRef]
- Greenwood, M.T.; Bickerton, M.A.; Petts, G.E. Patial distribution of spiders on the floodplain of the river trent, UK: The role of hydrological setting. Regul. Rivers Res. Manag. 1995, 10, 303–313. [Google Scholar] [CrossRef]
- Ng, K.; Barton, P.S.; Blanchard, W.; Evans, M.J.; Lindenmayer, D.B.; Macfadyen, S.; McIntyre, S.; Driscoll, D.A. Disentangling the effects of farmland use, habitat edges, and vegetation structure on ground beetle morphological traits. Oecologia 2018, 188, 645–657. [Google Scholar] [CrossRef] [PubMed]
- Eyre, M.D.; Luff, M.L. The use of ground beetles (Coleoptera: Carabidae) in conservation assessments of exposed riverine sediment habitats in Scotland and northern England. J. Insect Conserv. 2002, 6, 25–38. [Google Scholar] [CrossRef]
- Latty, E.F.; Werner, S.M.; Mladenoff, D.J.; Raffa, K.F.; Sickley, T.A. Response of ground beetle (Carabidae) assemblages to logging history in northern hardwood-hemlock forests. For. Ecol. Manag. 2006, 222, 335–347. [Google Scholar] [CrossRef]
- Cole, L.J.; Brocklehurst, S.; Elston, D.A.; McCracken, D.I. Riparian field margins: Can they enhance the functional structure of ground beetle (Coleoptera: Carabidae) assemblages in intensively managed grassland landscapes? J. Appl. Ecol. 2012, 49, 1384–1395. [Google Scholar] [CrossRef]
- Madra, A.; Konwerski, S.; Matuszewski, S. Necrophilous Staphylininae (Coleoptera: Staphylinidae) as indicators of season of death and corpse relocation. Forensic Sci. Int. 2014, 242, 32–37. [Google Scholar] [CrossRef]
- Tomlin, A.D.; McLeod, D.G.R.; Moore, L.V.; Whistlecraft, J.W.; Miller, J.J.; Tolman, J.H. Dispersal of Aleochara bilineata [Col.: Staphylinidae] following inundative releases in urban gardens. Entomophaga 1992, 37, 55–63. [Google Scholar] [CrossRef]
- Parker, J. Staphylinids. Curr. Biol. 2017, 27, R49–R51. [Google Scholar] [CrossRef] [Green Version]
- Hoffmann, H.; Kleeberg, A.; Görn, S.; Fischer, K. Riverine fen restoration provides secondary habitat for endangered and stenotopic rove beetles (Coleoptera: Staphylinidae). Insect Conserv. Divers. 2018, 11, 194–203. [Google Scholar] [CrossRef]
- Foster, W.A. Mosquito sugar feeding and reproductive energetics. Annu. Rev. Entomol. 1995, 40, 443–474. [Google Scholar] [CrossRef]
- Baniţã, E.; Cantoreanu, M.J.A. Contribution to the study of Cicada (Homoptera-Aucheenarrhyncha) populations from winter wheat crops in Oltenia Plain. Rom. Agric. Res. 1996, 5–6, 87–93. [Google Scholar]
- Bidau, C.J. Patterns in Orthoptera biodiversity. I. Adaptations in ecological and evolutionary contexts. J. Insect Biodivers. 2014, 2, 1. [Google Scholar] [CrossRef]
- Faiz, A.U.H.; Hassan, M.U.; Bagaturov, M.F.; Mahmood, M.; Faiz, L.Z.; Tariq, G. Insect Diversity and Association with Plants: A Case Study in Rural Areas of Dhirkot, Azad Kashmir Pakistan. J. Bioresour. Manag. 2020, 7, 21–32. [Google Scholar] [CrossRef]
- Steinger, T.; Klötzli, F.; Ramseier, H. Experimental Assessment of the Economic Injury Level of the Cereal Leaf Beetle (Coleoptera: Chrysomelidae) in Winter Wheat. J. Econ. Entomol. 2020, 113, 1823–1830. [Google Scholar] [CrossRef] [PubMed]
- Pearce, J.L.; Venier, L.A. The use of ground beetles (Coleoptera: Carabidae) and spiders (Araneae) as bioindicators of sustainable forest management: A review. Ecol. Indic. 2006, 6, 780–793. [Google Scholar] [CrossRef]
- Buchholz, S. Ground spider assemblages as indicators for habitat structure in inland sand ecosystems. Biodivers. Conserv. 2010, 19, 2565–2595. [Google Scholar] [CrossRef]
- Cobbold, S.M.; Supp, S.R. Patch shape alters spider community structure: Links between microhabitat choice and sensitivity to increased edge habitat. J. Insect Conserv. 2012, 16, 581–589. [Google Scholar] [CrossRef]
- Imbert, C.; Papaïx, J.; Husson, L.; Warlop, F.; Lavigne, C. Pests, but not predators, increase in mixed fruit tree–vegetable plots compared to control vegetable plots in a Mediterranean climate. Agrofor. Syst. 2020, 94, 627–638. [Google Scholar] [CrossRef]
- Jonsson, M.; Stenroth, K. True autochthony and allochthony in aquatic—Terrestrial resource fluxes along a landuse gradient. Freshw. Sci. 2016, 35, 882–894. [Google Scholar] [CrossRef]
- Luke, S.H.; Slade, E.M.; Gray, C.L.; Annammala, K.V.; Drewer, J.; Williamson, J.; Agama, A.L.; Ationg, M.; Mitchell, S.L.; Vairappan, C.S.; et al. Riparian buffers in tropical agriculture: Scientific support, effectiveness and directions for policy. J. Appl. Ecol. 2019, 56, 85–92. [Google Scholar] [CrossRef]


| No | Category | Data Source | Variables |
|---|---|---|---|
| 0. | Site location | Geographical Information System (GIS) data | Latitude |
| GIS data | Longitude | ||
| spectral decomposition of the spatial relationships among the study sites | Principal Coordinates of Neighborhoods Matrix (PCNM) | ||
| 1. | Catchments properties | GIS data: Digital Elevation Model (DEM) | Elevation |
| GIS data | Upstream catchment area (m2) | ||
| Corine Land Cover (level 2) | Forest: broad-leafed, coniferous, and mixed (%) | ||
| Heterogeneous agricultural land (%) | |||
| Arable crops (%) | |||
| Pasture (%) | |||
| Herbaceous vegetation associations (Natural grassland) (%) | |||
| Permanent crops (Orchards and Vineyards) (%) | |||
| Urban and Industrial (%) | |||
| Other (%) | |||
| Distance to the next 100 m riparian forested buffer block, upstream the site (m) | |||
| 2. | Riparian habitat characteristics (30 m sampling reach) | Field data (quantitative assessment) | Canopy cover (%) |
| Unmanaged grass: long grasses including rushes and sedges (%) | |||
| Managed short grasses (e.g., grazed or mown) (%) | |||
| Herbs, herbaceous vegetation including forbs (%) | |||
| Moss and lichens growing on the ground (%) | |||
| Small trees and shrubs (diameter at breast height (DBH) < 5 cm) (%) | |||
| Trees (DBH) > 5 cm) (%) | |||
| Rocks and bedrock (%) | |||
| Plant litter including leaves (%) | |||
| Bare ground (%) | |||
| Deadwood volume | |||
| Deadwood (no of fragments) | |||
| Tree species richness | |||
| Habitats’ richness | |||
| GIS data | Riparian buffer length (m) | ||
| Riparian buffer width (m) | |||
| 3. | Riparian integrity condition scores (ranging from 1 to 5, according to [6,23]) | Field data (quick assessment) | Adjacent ground |
| Adjacent vegetation | |||
| Bank stability | |||
| Buffer ground | |||
| Buffer intactness | |||
| Buffer vegetation | |||
| Buffer width | |||
| Land slope | |||
| Livestock access | |||
| Rills and channels | |||
| Riparian soil denitrification potential | |||
| Shading | |||
| Soil drainage |
| Diversity Index | Num df | Den df | F | p (same) |
|---|---|---|---|---|
| Taxa_richness | 1 | 8 | 6.35 | 0.0358 * |
| Taxa_H′ | 1 | 16 | 3.69 | 0.0728 · |
| Consumer_J | 1 | 16 | 3.68 | 0.073 · |
| Araneae_H′ | 1 | 16 | 3.39 | 0.084 · |
| Araneae_J′ | 1 | 8 | 7.32 | 0.015 * |
| Category of Explanatory Variables | Significant Variables | R2 Adjusted Cumm | F | alpha |
|---|---|---|---|---|
| Spatial structure | PCNM1 PCNM2 | 0.07 0.11 | 2.18 1.89 | 0.017 * 0.044 * |
| Catchment properties | Pasture | 0.03 | 1.58 | 0.083 . |
| Riparian habitat characteristics | %Trees (DBH > 5 cm) Buffer length No dead wood elements %Bare ground | 0.09 0.16 0.22 0.26 | 2.62 2.34 2.13 1.73 | 0.004 ** 0.002 ** 0.008 ** 0.035 * |
| Riparian condition scores | Buffer intactness Shading | 0.12 0.18 | 3.22 2.18 | 0.002 ** 0.008 ** |
Publisher’s Note: MDPI stays neutral with regard to jurisdictional claims in published maps and institutional affiliations. |
© 2021 by the authors. Licensee MDPI, Basel, Switzerland. This article is an open access article distributed under the terms and conditions of the Creative Commons Attribution (CC BY) license (http://creativecommons.org/licenses/by/4.0/).
Share and Cite
Popescu, C.; Oprina-Pavelescu, M.; Dinu, V.; Cazacu, C.; Burdon, F.J.; Forio, M.A.E.; Kupilas, B.; Friberg, N.; Goethals, P.; McKie, B.G.; et al. Riparian Vegetation Structure Influences Terrestrial Invertebrate Communities in an Agricultural Landscape. Water 2021, 13, 188. https://doi.org/10.3390/w13020188
Popescu C, Oprina-Pavelescu M, Dinu V, Cazacu C, Burdon FJ, Forio MAE, Kupilas B, Friberg N, Goethals P, McKie BG, et al. Riparian Vegetation Structure Influences Terrestrial Invertebrate Communities in an Agricultural Landscape. Water. 2021; 13(2):188. https://doi.org/10.3390/w13020188
Chicago/Turabian StylePopescu, Cristina, Mihaela Oprina-Pavelescu, Valentin Dinu, Constantin Cazacu, Francis J. Burdon, Marie Anne Eurie Forio, Benjamin Kupilas, Nikolai Friberg, Peter Goethals, Brendan G. McKie, and et al. 2021. "Riparian Vegetation Structure Influences Terrestrial Invertebrate Communities in an Agricultural Landscape" Water 13, no. 2: 188. https://doi.org/10.3390/w13020188