Article

Modeling Insights into Precipitation Deuterium Excess as an Indicator of Raindrop Evaporation in Lanzhou, China

1
College of Geography and Environmental Science, Northwest Normal University, Lanzhou 730070, China
2
Laboratory of Atmospheric Physics, Department of Physics, University of Patras, GR-265 00 Patras, Greece
*
Author to whom correspondence should be addressed.
Water 2021, 13(2), 193; https://doi.org/10.3390/w13020193
Submission received: 26 November 2020 / Revised: 31 December 2020 / Accepted: 13 January 2021 / Published: 15 January 2021
(This article belongs to the Section Hydrology)

Abstract

:
The deuterium excess in precipitation is an effective indicator to assess the existence of sub-cloud evaporation of raindrops. Based on the synchronous measurements of stable isotopes of hydrogen and oxygen (δ2H and δ18O) in precipitation for several sites in Lanzhou, western China, spanning for approximately four years, the variations of deuterium excess between the ground and the cloud base are evaluated by using a one-box Stewart model. The deuterium excess difference below the cloud base during summer (−17.82‰ in Anning, −11.76‰ in Yuzhong, −21.18‰ in Gaolan and −12.41‰ in Yongdeng) is greater than that in other seasons, and difference in winter is weak due to the low temperature. The variations of deuterium excess in precipitation due to below-cloud evaporation are examined for each sampling site and year. The results are useful to understand the modification of raindrop isotope composition below the cloud base at a city scale, and the quantitative methods provide a case study for a semi-arid region at the monsoon margin.

1. Introduction

The sub-cloud evaporation refers to the evaporation of the raindrops during their trip through the unsaturated atmosphere from the cloud base to the land. The influence of below-cloud evaporation on the isotopic signatures of rain depends on the meteorological environment (such as air temperature and relative humidity) in the atmosphere, on the original drop radius in the cloud as well as on the stable isotopes of the surrounding moisture where the drop travels [1,2]. For the isotopic ratios when the raindrop forms at the early stage, the raindrops usually tend to attain an equilibrium condition with the ambient moisture [3]. Light isotopes are depleted in advance while heavy isotopes in raindrops are enriched [4,5,6], showing that there has been a decrease in the deuterium excess or d which equals δ2H − 8 × δ18O [7]. The evaporation and condensation are impacted by the different climate parameters [8,9], and the deuterium excess in meteoric water is also sensitive to these climate conditions [10,11,12], causing that the deuterium excess can be a useful indicator to trace the source of water vapor and assess the potential existence of the sub-cloud evaporation [13,14,15,16].
Regarding the assessment of below-cloud evaporation associate to deuterium excess, the Stewart model has been widely used. Applying the droplet evaporation model under laboratory conditions, Stewart [1] investigated the relationship between isotope fractionation and proportions of evaporation at varied backgrounds. Froehlich et al. [17] modified the Stewart model and then presented a simple frame to assess the change in deuterium excess due to evaporation. However, a few parameters used in the model [17] are not well-defined, and clearer parameterization is still needed [18]. For example, Wang et al. [19] used a sphere-based method to estimate the raindrop remaining fraction, which shows a wide range of raindrop remaining fraction in the arid climate setting and may be more suitable for arid and semi-arid regions. These modified Stewart models are applied to other different regions [20,21,22].
At a small spatial scale, the influence of deuterium excess on precipitation greatly depends on the topography as well as the meteorological conditions with the region, so a detailed understanding of the below-cloud evaporation needs synchronous observations for surrounding sites. Here we focused on a city-scale measurement in Lanzhou at the margin of the Asian monsoon. This region has been examined for the precipitation isotopes in recent years [23,24,25,26]. However, a Stewart model-based quantitative assessment about the isotopic modification below cloud base is still limited in Lanzhou, and the details about inter-annual variability and spatial incoherence of raindrop evaporation are not clear for this region. The objective of this study is (1) to assess the deuterium excess variation in precipitation from the cloud base to the land surface; (2) to discuss the influence of main parameters on the deuterium excess difference; and (3) to clarify the linkage between the remaining fraction of raindrop and variation of deuterium excess.

2. Data and Method

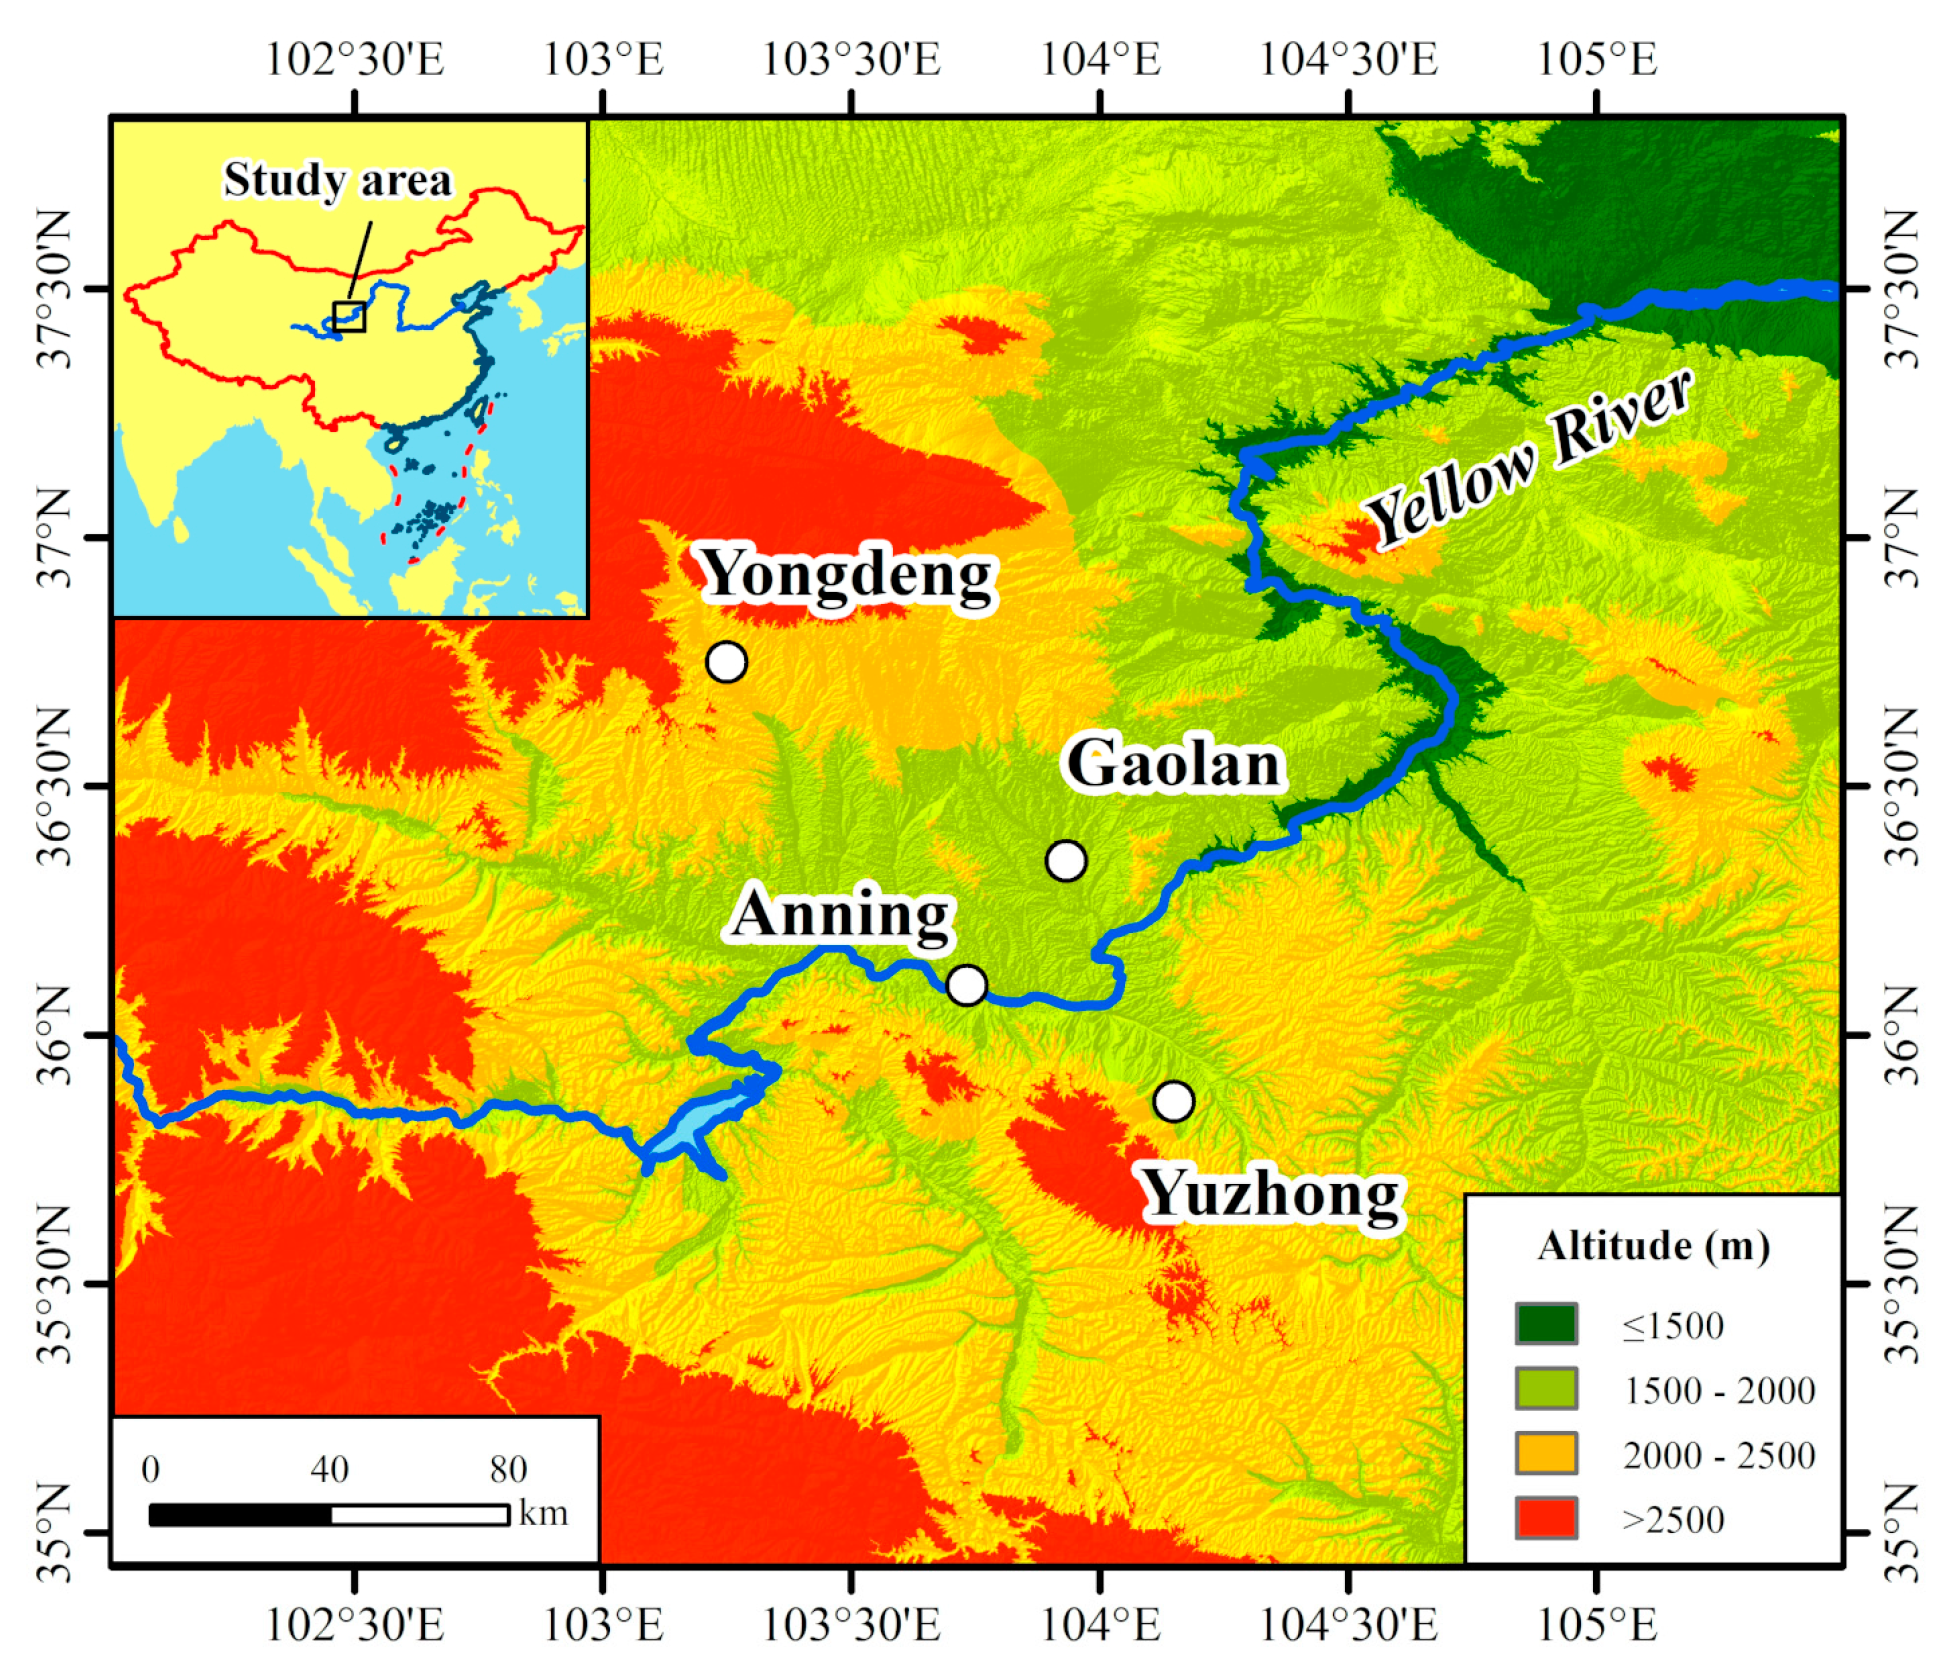
2.1. Sample Collecting

The Lanzhou City, capital of the Gansu Province of China, is located at the western part of the Chinese Loess Plateau (Figure 1). To understand the isotope hydrology at the monsoon marginal region, the Northwest Normal University (NWNU) set up in 2011 an observation network of isotopes in precipitation [24]. Within this framework, four sampling stations cover the central urban area (Anning) and also three surrounding counties (i.e., Yuzhong, Gaolan and Yongdeng). The liquid samples were collected in time after the end of each rain or snow event; some large amount events were collected repeatedly considering fixed time intervals. The samples were placed in HDPE bottles with seals and stored in a refrigerator. Solid samples (such as snow or hail) were not filled until they were melted at the room temperature inside the LDPE bags. The water samples were isotopically analyzed using a liquid water isotope analyzer (DLT-100, Los Gatos Research, Inc., Mountain View, CA, USA) in the College of Geography and Environmental Science, NWNU, with a precision of ±0.2‰ and ±0.6‰, for δ18O and δ2H (delta notation relative to VSMOW), respectively [24]. In this study, the period from April 2011 to October 2014 previously analyzed [24] was reexamined; see Chen et al. [24] for the basic characteristics of precipitation isotopes in Lanzhou during this period.

2.2. Methods

According to previous studies [1,17], the difference of deuterium excess during the falling duration, i.e., Δd, is caused by evaporation according to the formula:
Δ d = ( 1 γ 2 α 2 ) ( f β 2 1 ) 8 ( 1 γ 18 α 18 ) ( f β 18 1 )
with 2α and 18α the kinetic fraction factors [27,28] expressed as:
α 2 = exp ( 24.844 × 10 3 T 2 76.248 T + 52.612 × 10 3 )
α 18 = exp ( 1.137 × 10 3 T 2 0.4156 T 2.0667 × 10 3 )
where T is the condensation temperature (K), and f is the remaining fraction of mass. The values of 2γ, 18γ, 2β and 18β [1] are defined as:
γ 2 = α 2 R H 1 α 2 ( D 2 / D 2 ) n ( 1 R H )
γ 18 = α 18 R H 1 α 18 ( D 18 / D 18 ) n ( 1 R H )
β 2 = 1 α 2 ( D 2 / D 2 ) n ( 1 R H ) α 2 ( D 2 / D 2 ) n ( 1 R H )
β 18 = 1 α 18 ( D 18 / D 18 ) n ( 1 R H ) α 18 ( D 18 / D 18 ) n ( 1 R H )
with RH the relative humidity. 2D/2D′ and 18D/18D′ equal to 1.024 and 1.0289, respectively [1,29], and n is 0.58.
The raindrop is treated as a spheroid, and the remaining fraction can be expressed as in Wang et al. [19]:
f = m end m end + m ev
with mend and mev the mass touching the land surface and evaporated raindrop mass, respectively; mev is expressed as product of the evaporation intensity and the time required to drop to cover the distance from the cloud base. The fall time is estimated using the cloud base height and the falling velocity when a constant motion is assumed. The terminal velocity of a raindrop with drop diameter and cloud base height can be calculated based on Best [30]. The altitude of cloud base is calculated using lifting condensation level (LCL) [19,31,32].
Evaporation intensity of a raindrop can be expressed to be a product using Q1 (in cm) and Q2 (in g cm−1 s−1); here Q1 is a function of the temperature and raindrop size, and Q2 is of the temperature and relative humidity [33]. Based on the experimental data by Kinzer and Gunn [33], the values of Q1 and Q2 at actual conditions are acquired using a bilinear interpolation as suggested by Wang et al. [19]. The median diameter of the raindrop is estimated using precipitation intensity [34]. Here we calculated that the median diameters of raindrops at Anning range from 0.4 to 1.7 mm, at Yuzhong from 0.4 to 1.9 mm, at Gaolan from 0.4 to 1.6 mm and at Yongdeng from 0.4 to 2.0 mm, respectively.
A raindrop is usually assumed to be a sphere, so mend can be expressed as:
m end = 4 3 π r end 3 ρ
with rend the radius of the raindrop touching the land surface and ρ and the density of water.

3. Results and Discussion

3.1. Raindrop Diameter, Velocity and Evaporation Intensity

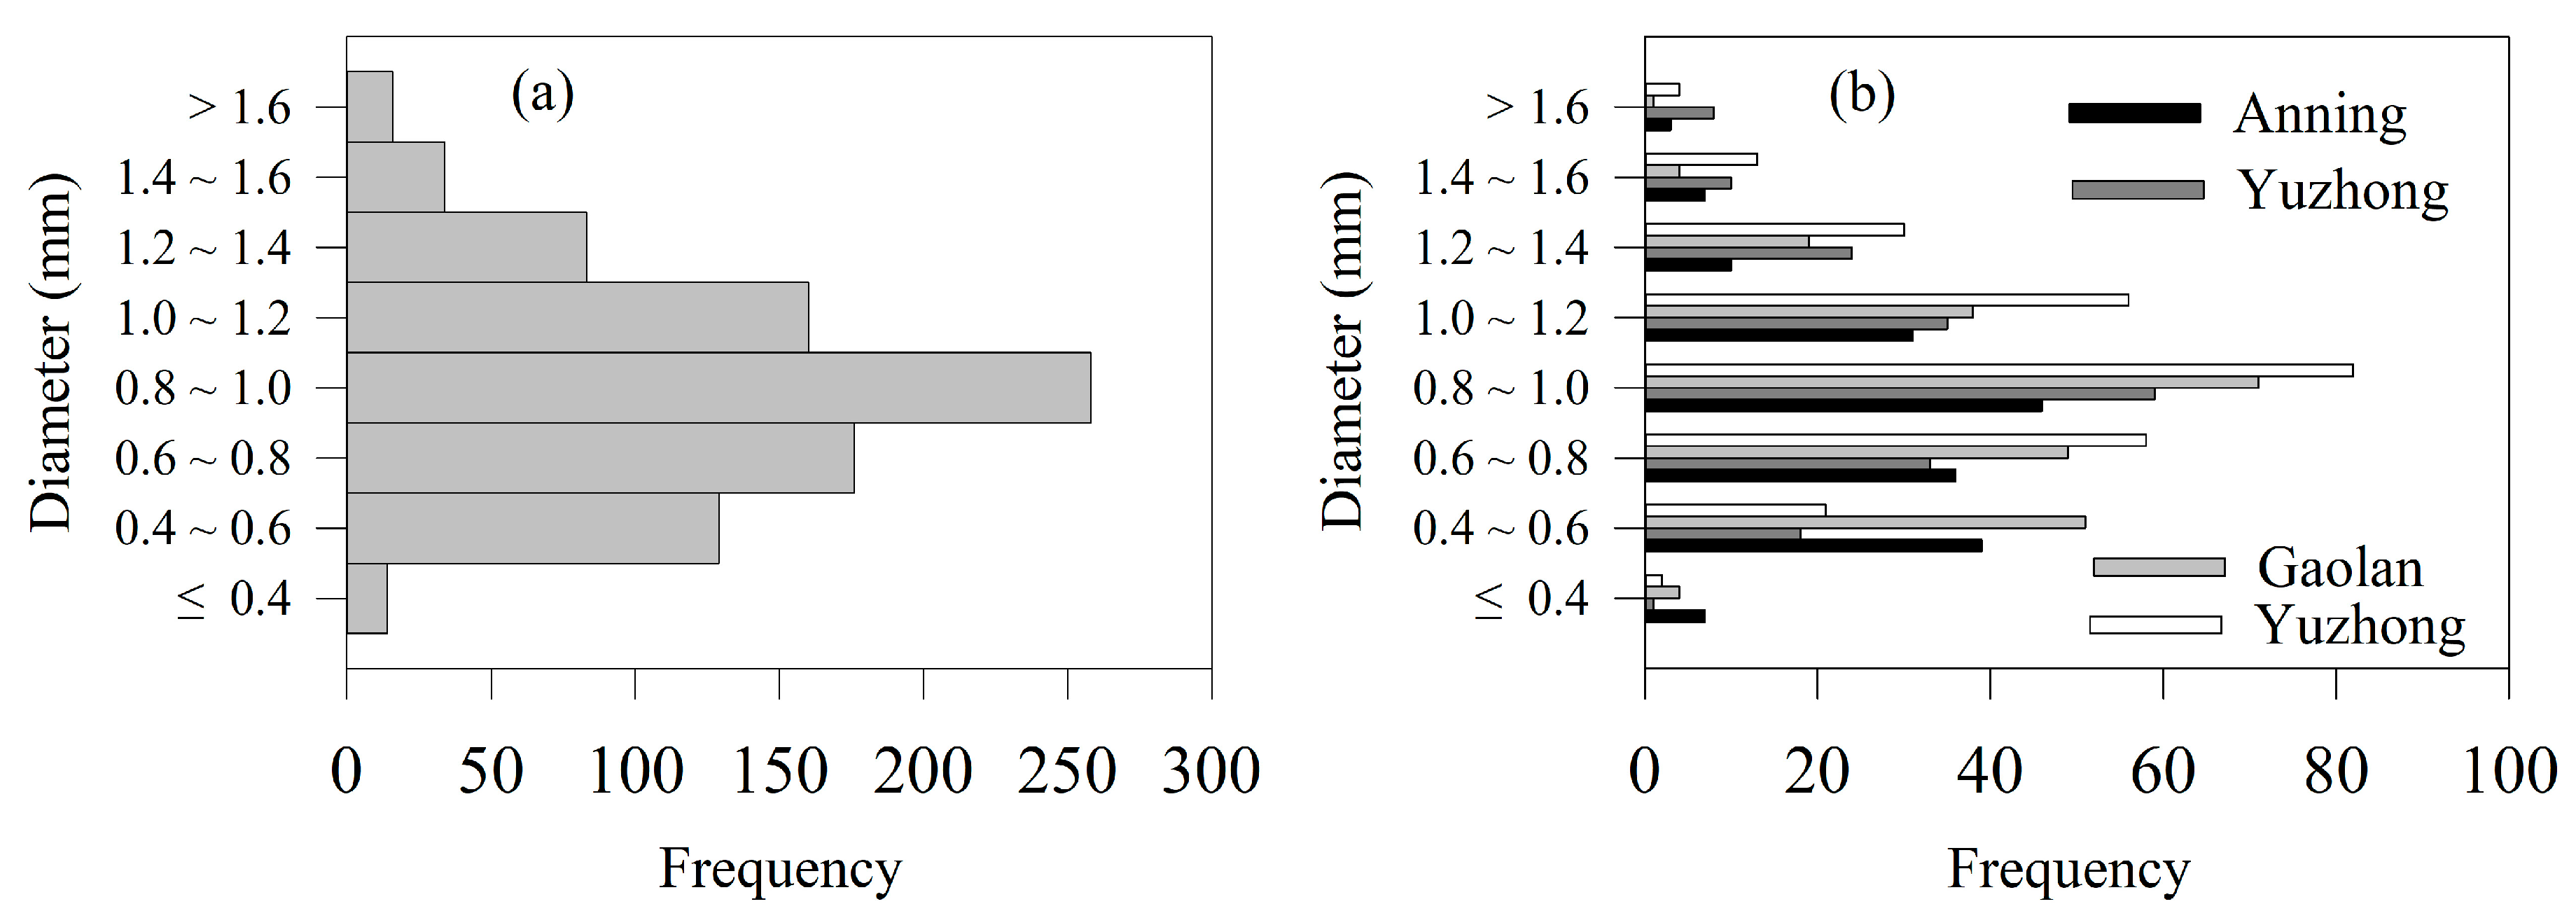
3.1.1. Raindrop Diameter

Figure 2 shows the frequency of precipitation events for different raindrop diameters in Lanzhou from April 2011 to October 2014, when the temperature above zero. Raindrops are mainly distributed in the range from 0.4 to 1.2 mm. The arithmetic mean and the median equal both 1.0 mm; events with a raindrop diameter less than 1 mm account for the 51.6% of the total number of precipitation events. At the four sites, raindrop diameters range between 0.4 and 1.7 mm at Anning, between 0.4 and 1.9 mm at Yuzhong, between 0.4 and 1.6 mm at Gaolan and between 0.4 to 2.0 mm at Yongdeng, respectively.

3.1.2. Raindrop Velocity

The size distribution of the above-mentioned raindrop diameters defines the value of the terminal velocity. Figure 3 shows the frequency of rain events for different terminal velocity values in Lanzhou from April 2011 to October 2014. The terminal velocity of all rainfall events varies from 2.1 to 6.9 m/s; the most frequent rainfall events have terminal velocities between 3 and 5 m/s. The number of rainfall events with terminal velocity values between 2.5 and 4.5m/s is 123 at Anning (69.9% of the total), 123 (65.4% of the total) at Yuzhong, 174 (73.4% of the total) at Gaolan and 189 (70.8% of the total) at Yongdeng.

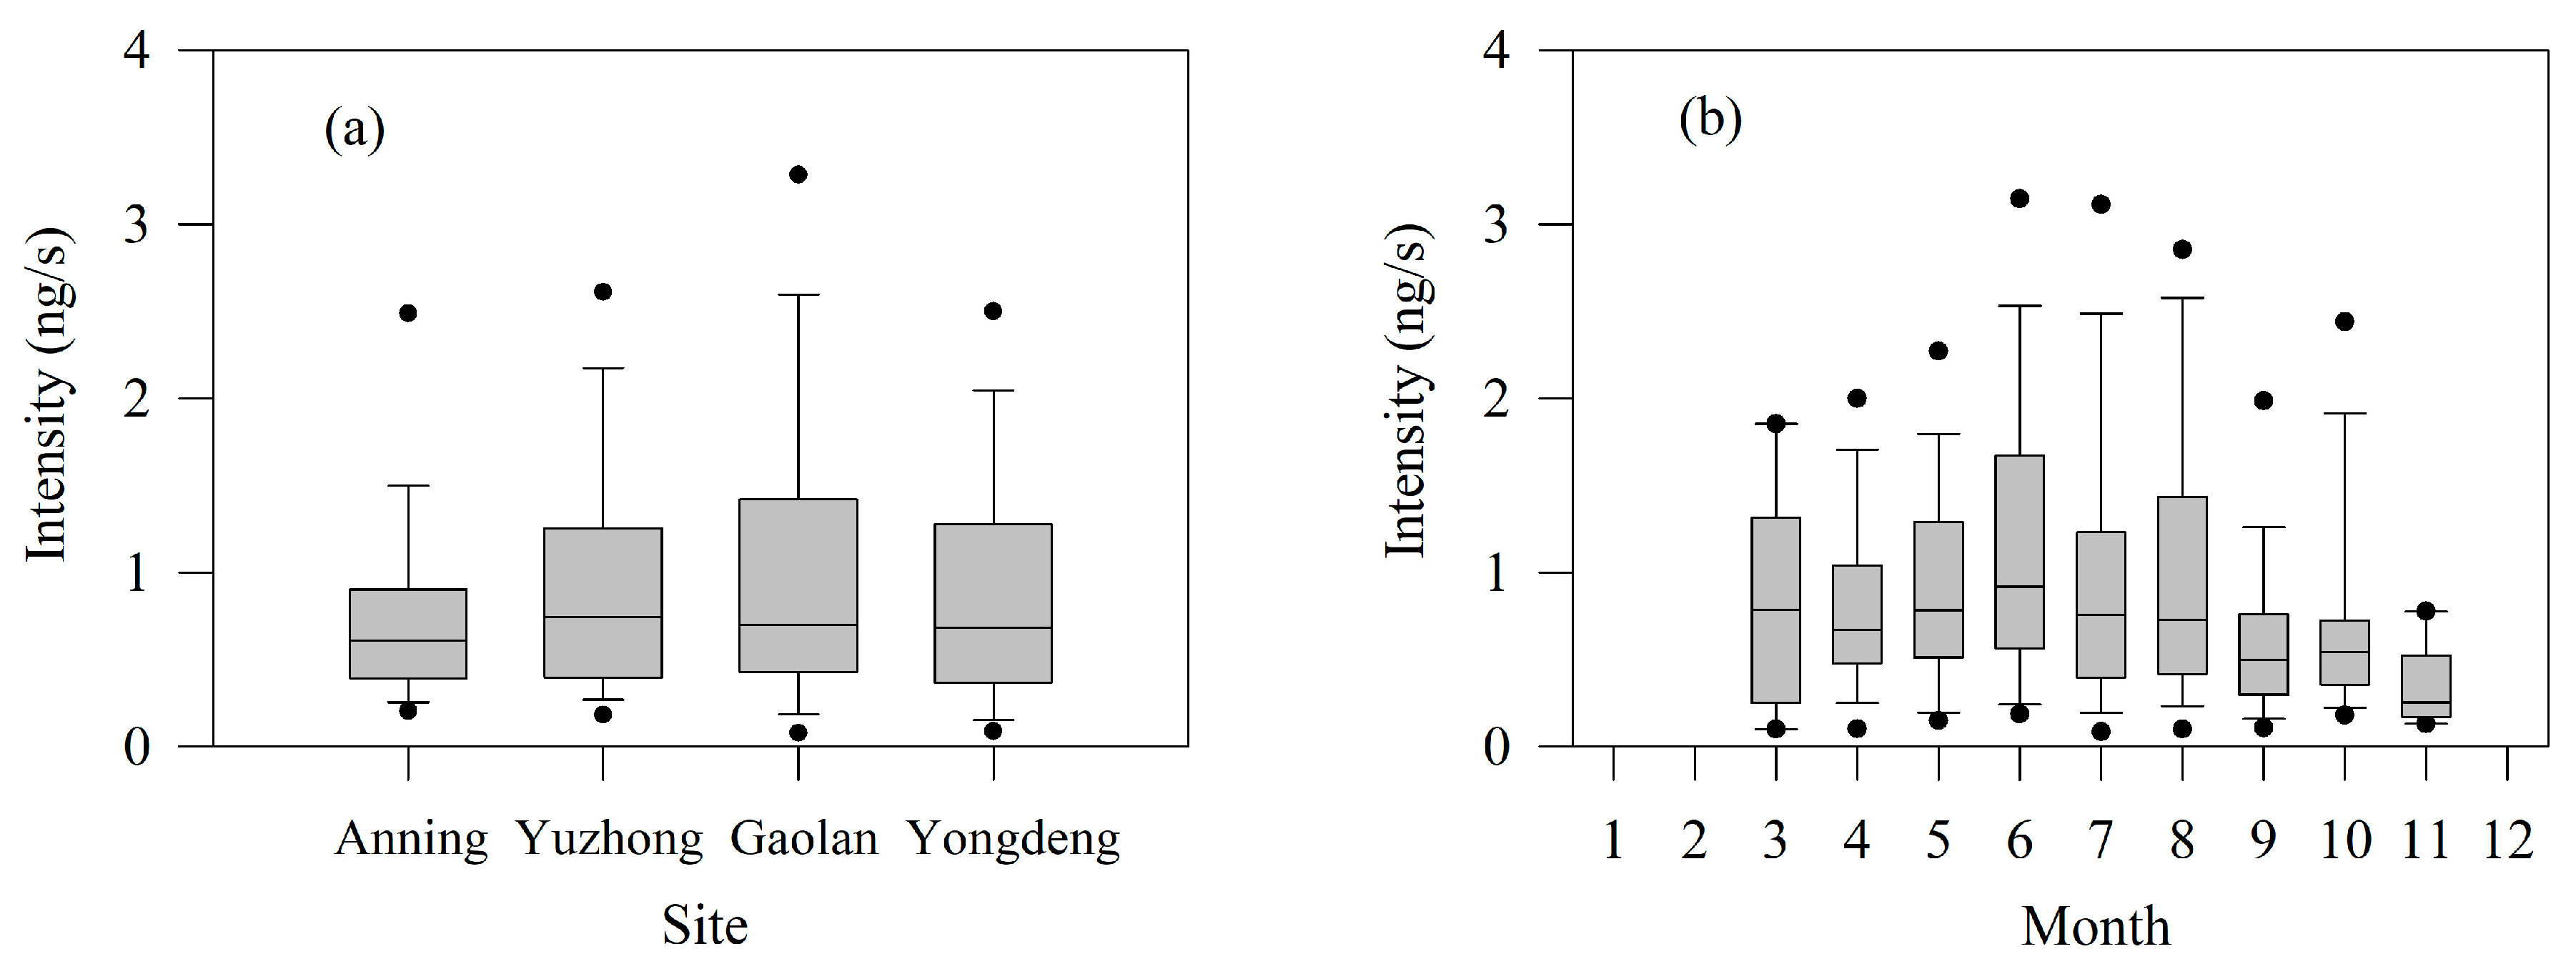
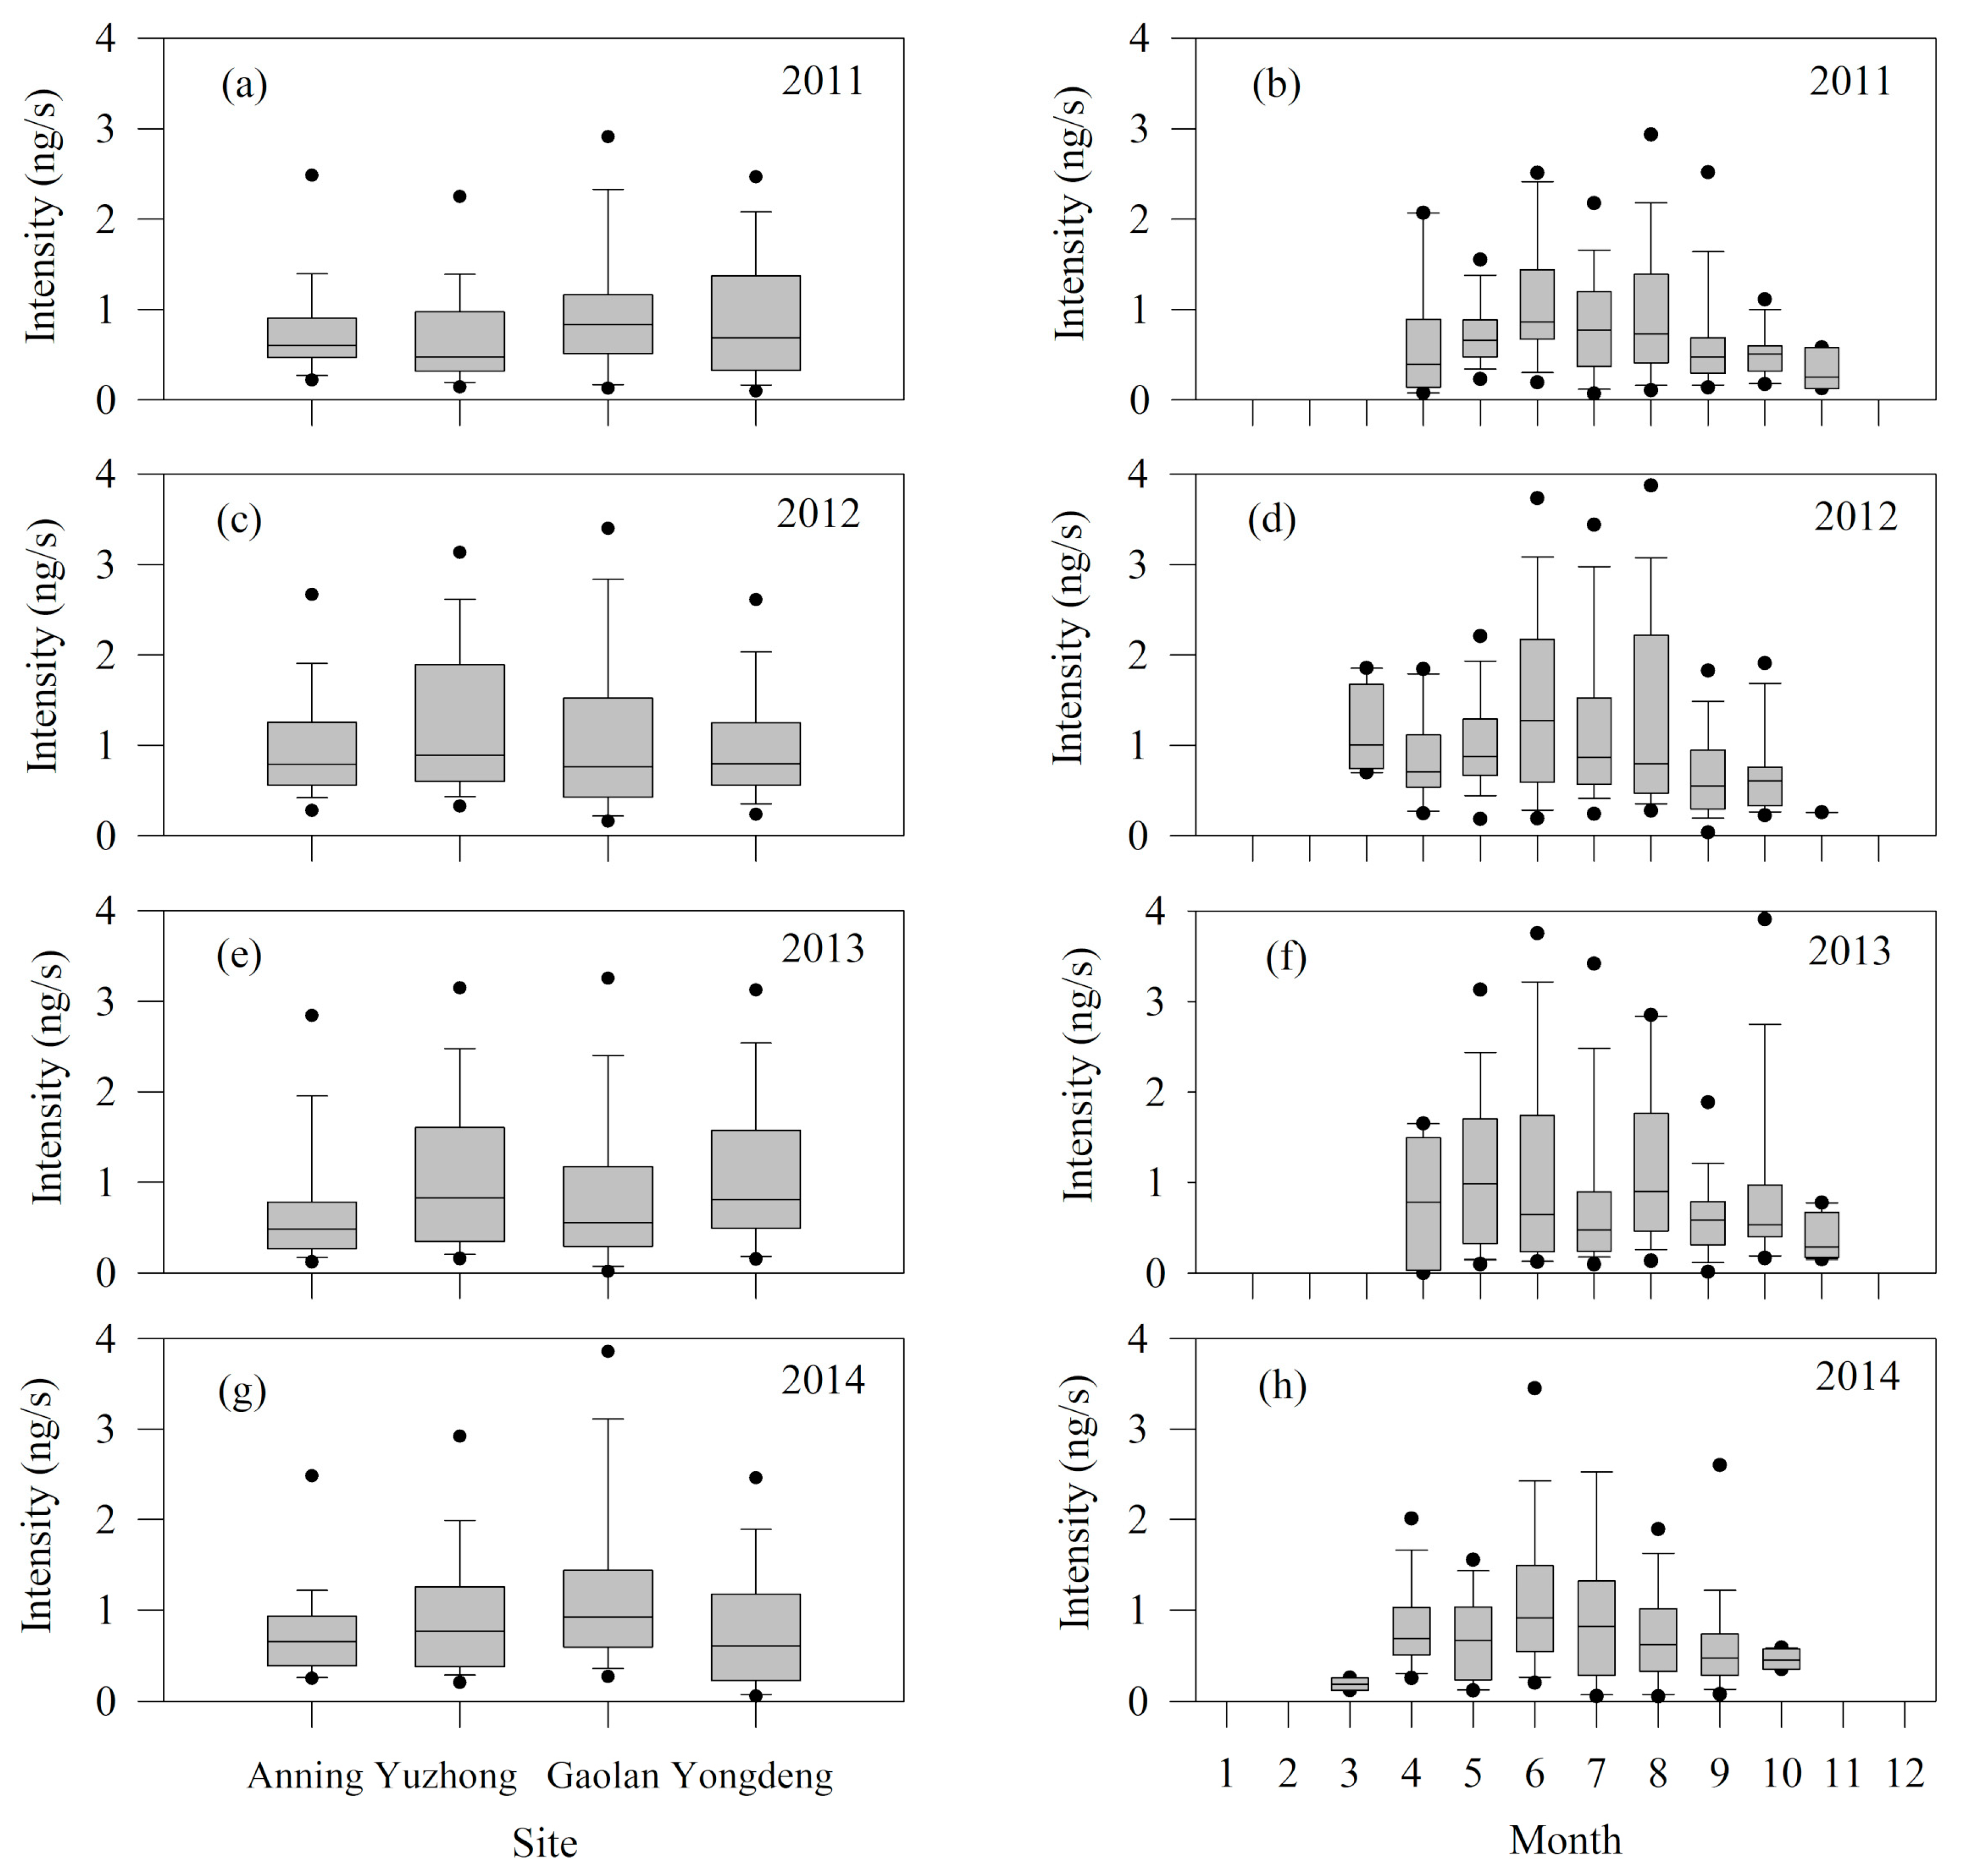
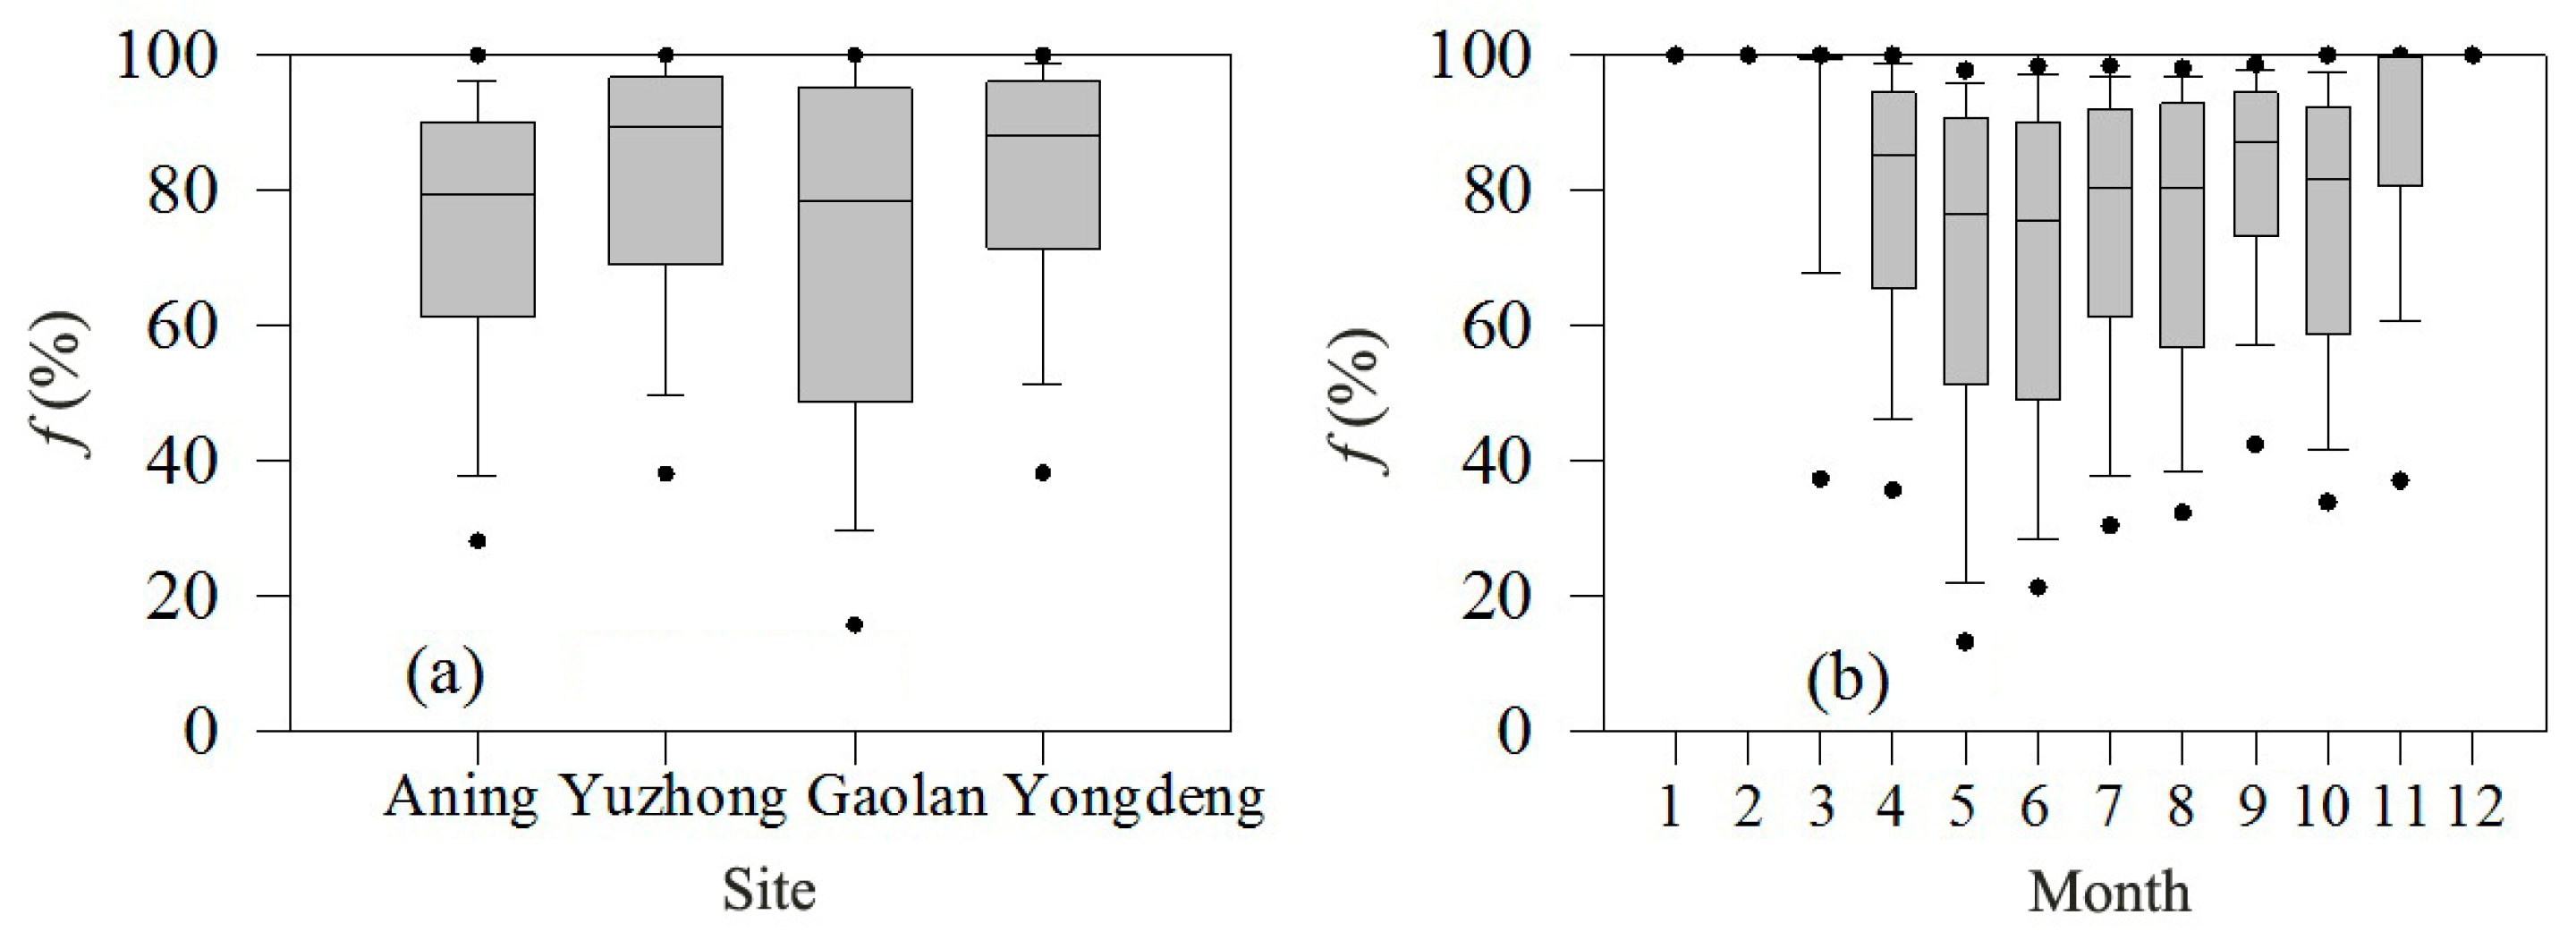
3.1.3. Raindrop Evaporation Intensity

Figure 4 and Figure 5 illustrate the regional and monthly variation of raindrop evaporation intensity in the study region. The range of evaporation intensity in precipitation is large; the minimum is 0.026 ng/s and the maximum 4.9 ng/s. The evaporation rate changes obviously with season, but its spatial difference is smaller, and the median is less than 1.0 ng/s among the four sites. On a monthly basis, as air temperature increases in summer, evaporation rate presents a rising trend; it is relatively high from May to September and starts to decrease after October. As shown in Figure 5, the change of evaporation rate during the different years is generally similar.

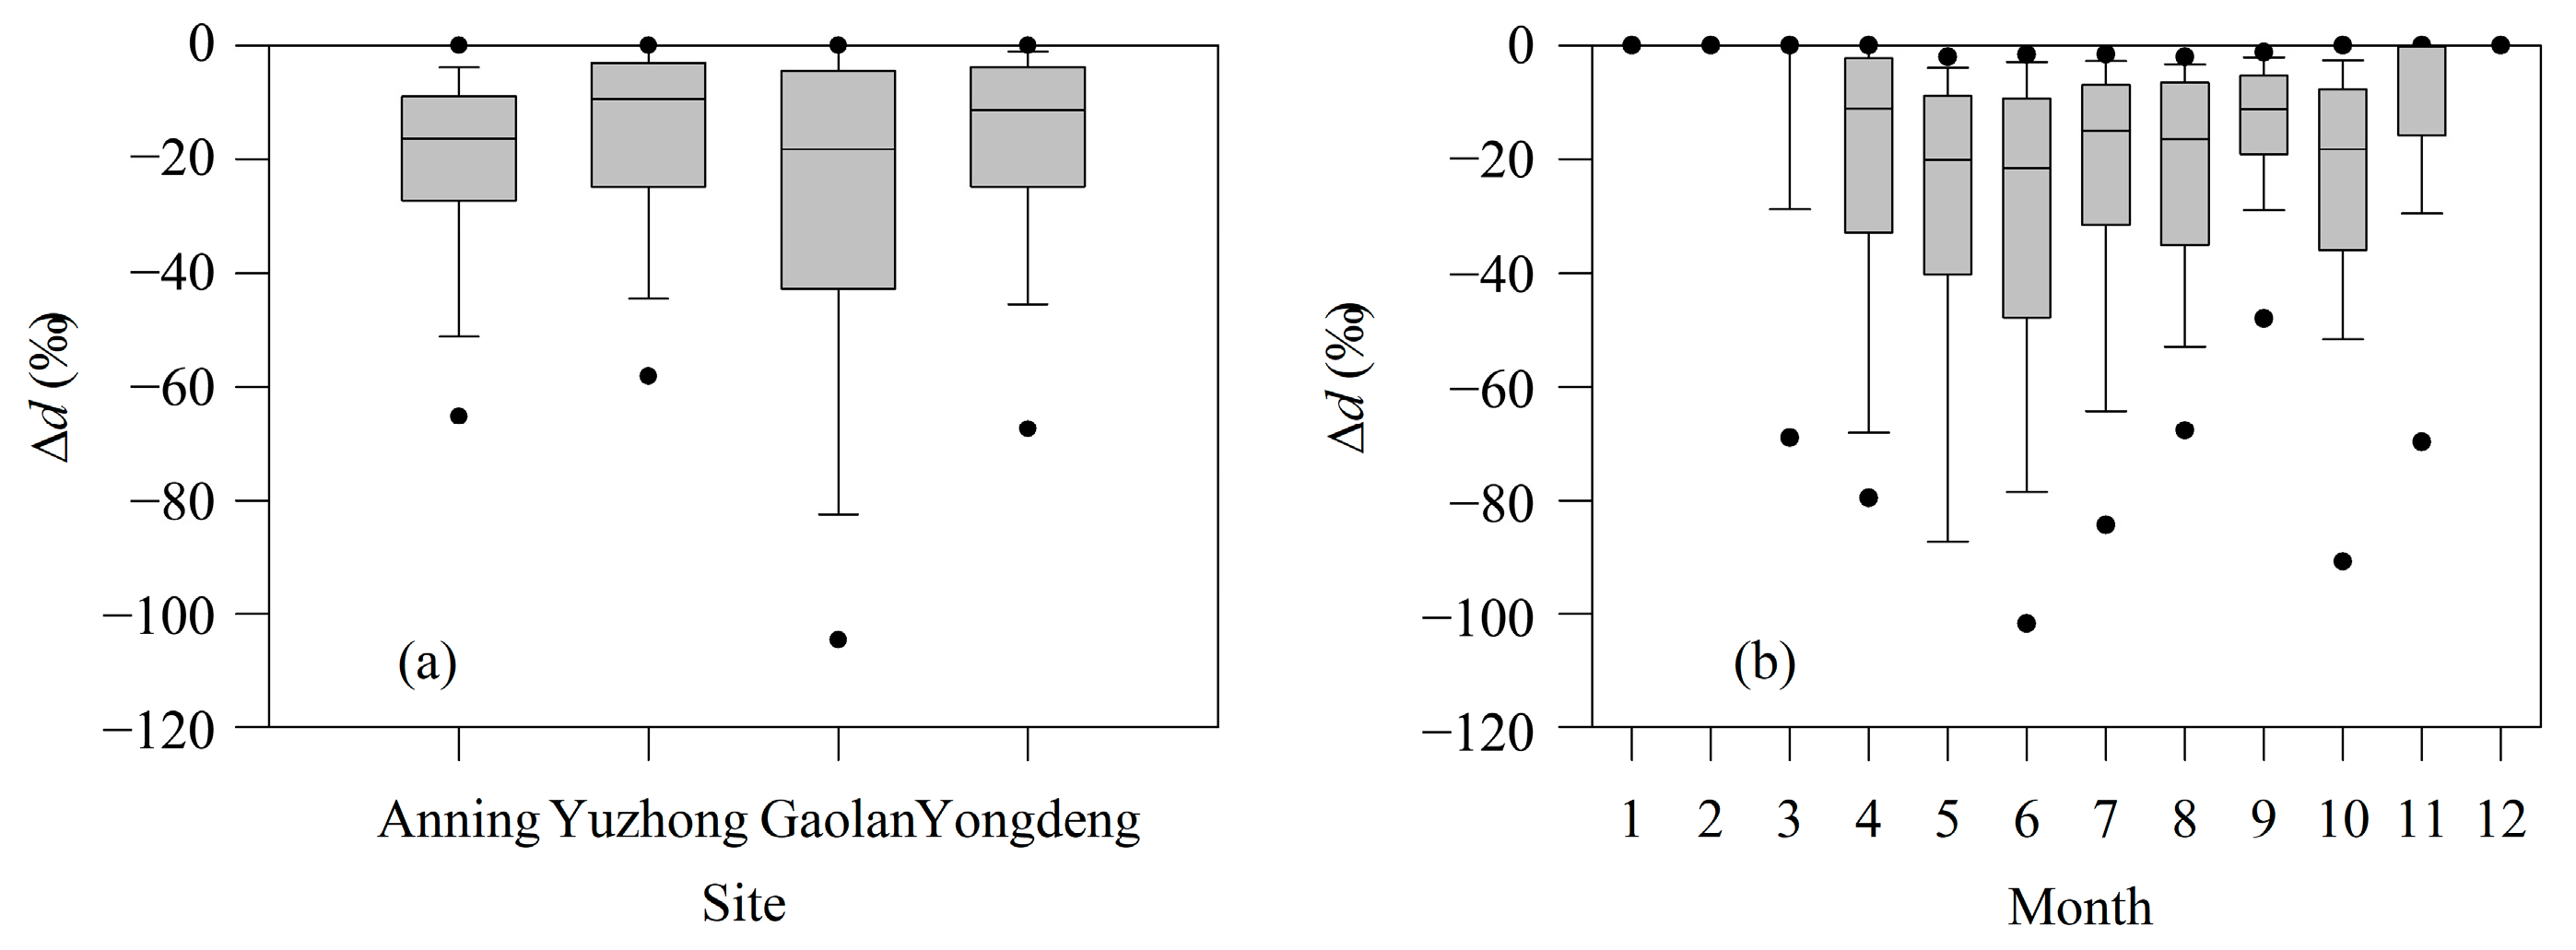
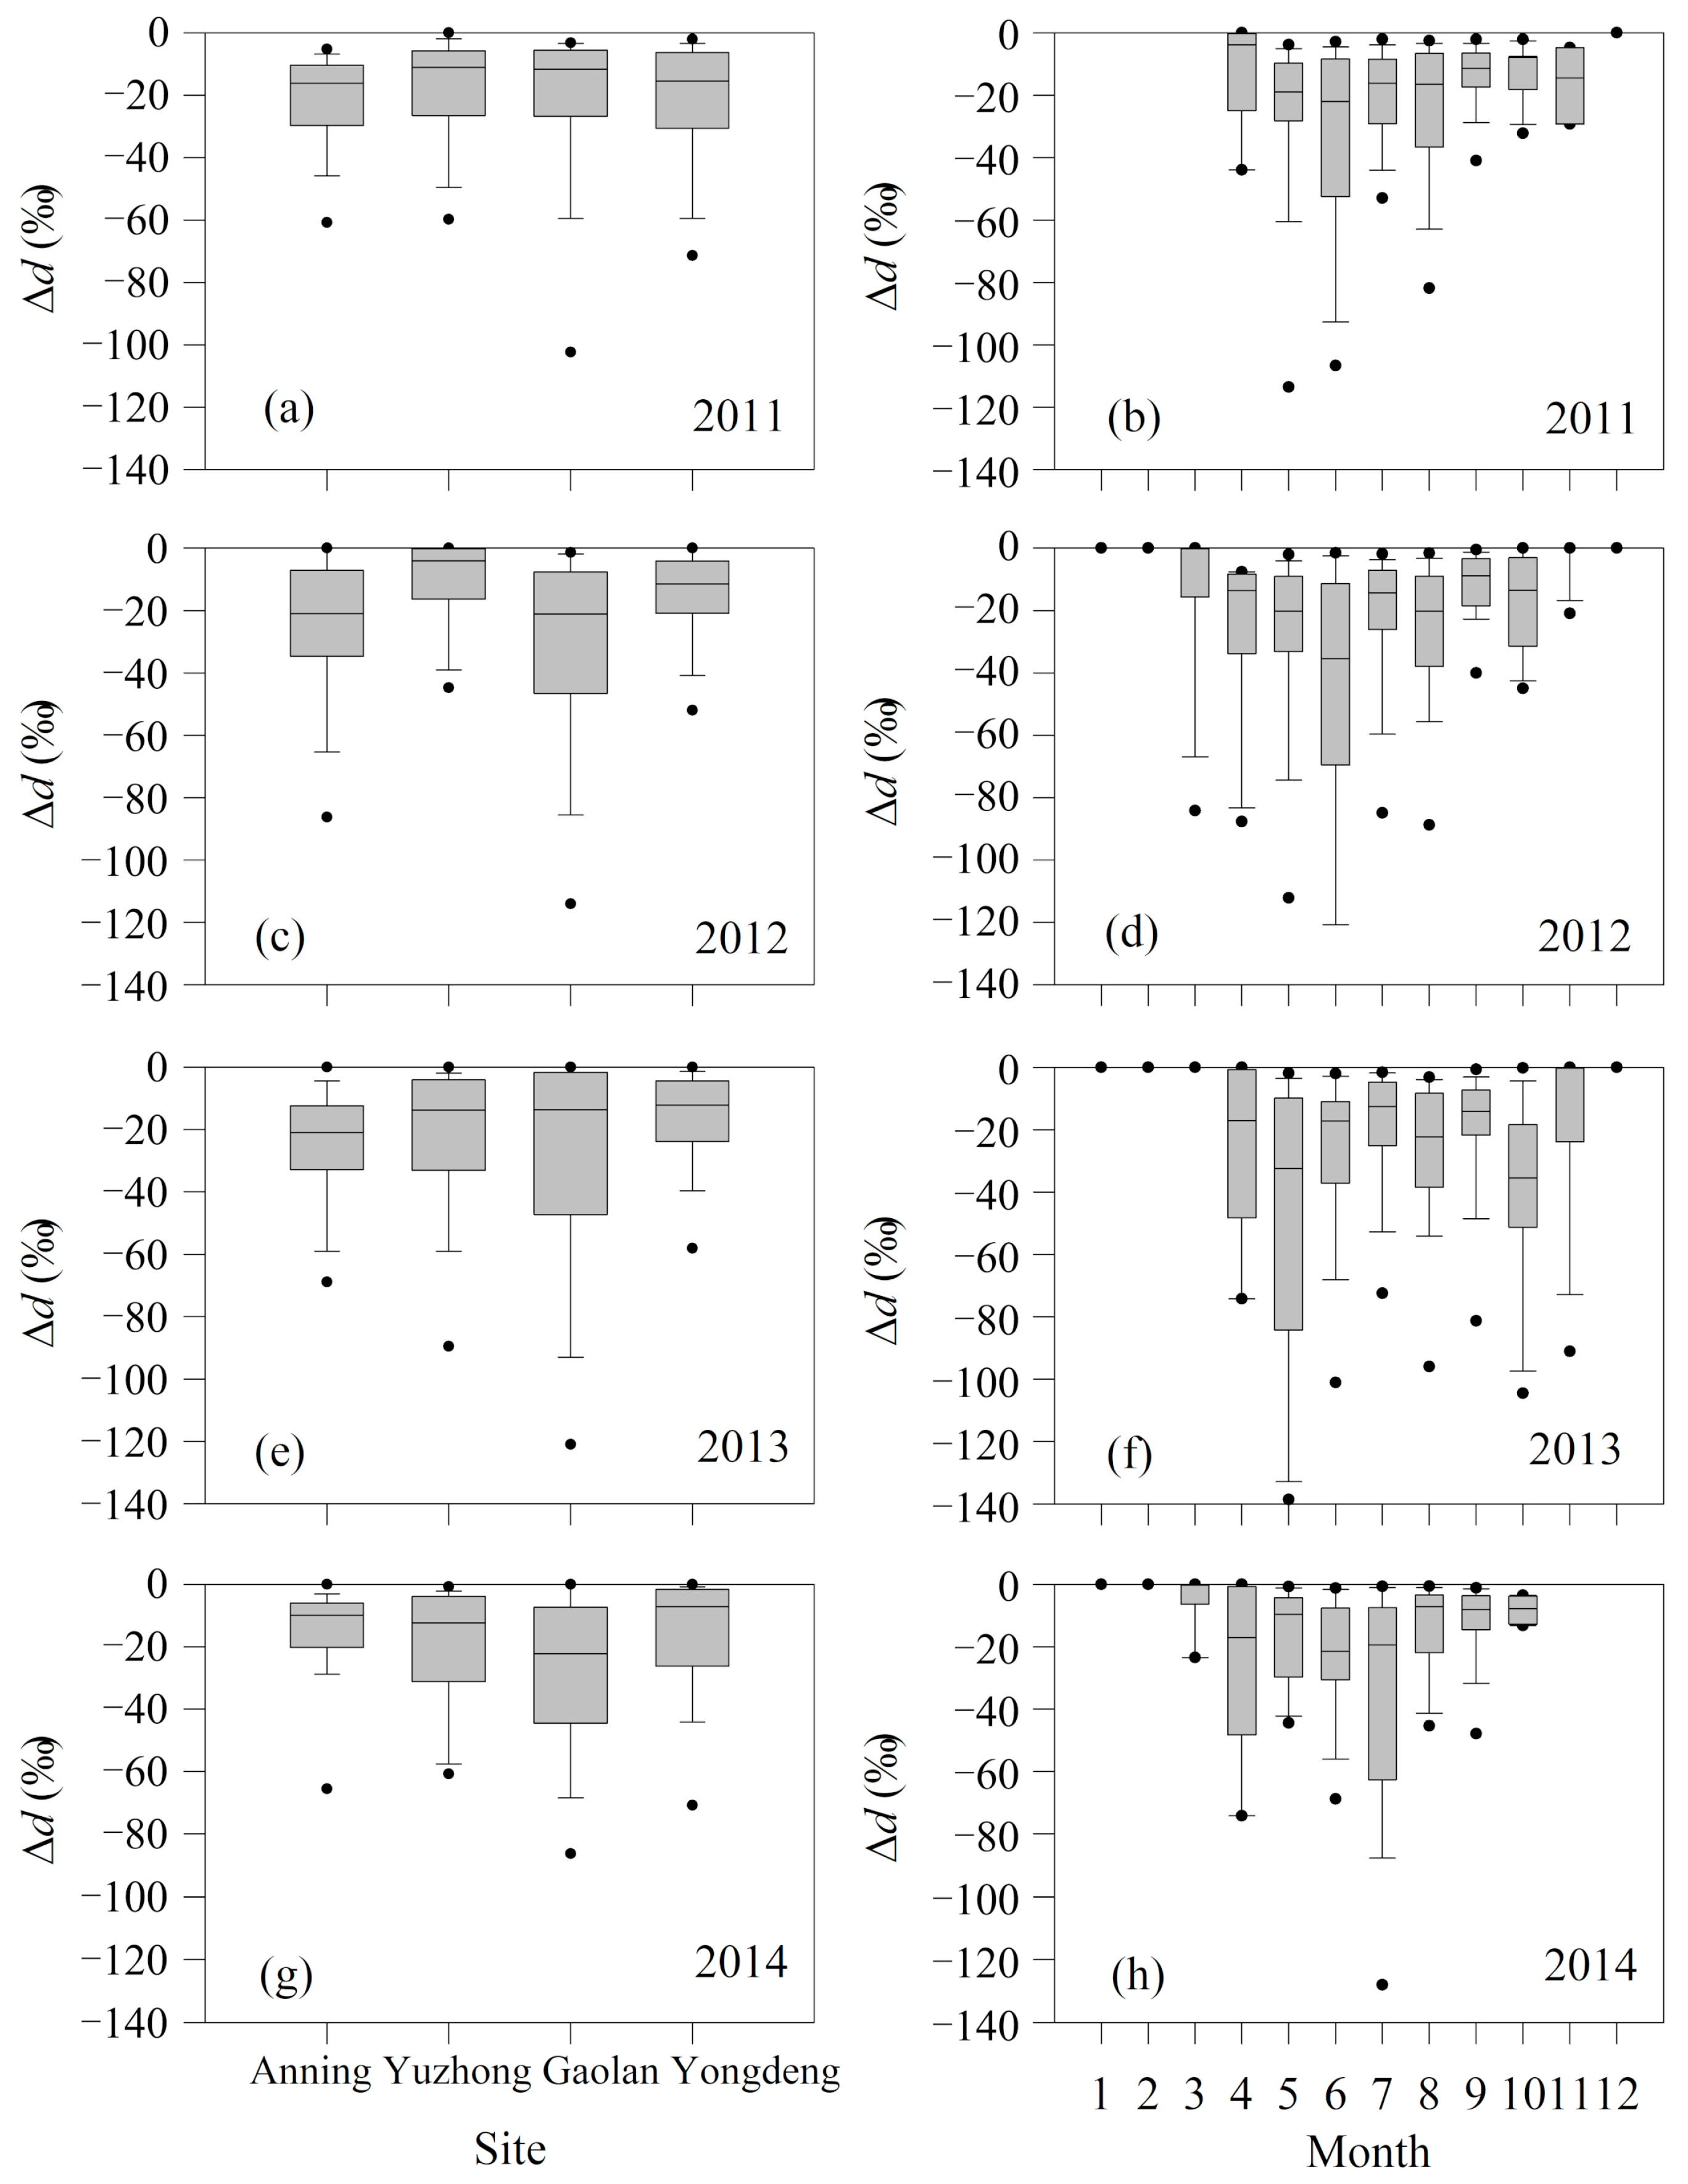
3.2. Deuterium Excess Difference for Each Site and Year

As shown in Figure 6 and Figure 7, Δd varies depending on the spatial and seasonal patterns, similarly to the variation of f. The deuterium excess difference differs depending on the site and on the season. According to the values of the median, the variation of Δd in precipitation is relatively smaller (more than 20‰) for the study region. During the winter months, there is no variation of deuterium excess for some months. During the summer months, variation of deuterium excess is much greater in the recent four years. Figure 7 shows that the variations of Δd during the four years at the four sites are consistent with the total changes shown in Figure 6. The variations of Δd in precipitation for each site and year reflect the climate background at different spatial and temporal scales.
Table 1 exhibits the values for each sampling site in this study. The annual weighted mean Δd value varies from −17.84‰ (Gaolan) to −10.55‰ (Yuzhong); the four-year arithmetic mean is −13.81‰; however, the lowest Δd values were observed at Anning in 2013 (−24.39‰), and the highest Δd value observed at Anning is −8.53‰ in 2014. On a seasonal basis (Table 2), the annual weighted mean Δd ranges from −17.50‰ to −10.30‰ during spring, between −21.18‰ and −11.76‰ during summer and between −12.48‰ and -8.50‰ during autumn, respectively. Overall, the deuterium excess difference below the cloud base during summer (−17.82‰ in Anning, −11.76‰ in Yuzhong, −21.18‰ in Gaolan and −12.41‰ in Yongdeng) is greater than that in spring and autumn; in addition, the amplitude of variation of Δd between the land surface and the cloud base during summer is greater than in spring and autumn. The results in Table 2 are consistent with seasonal variations shown in Figure 6 and Figure 7.

3.3. Climate Parameters and Deuterium Excess Difference

In Figure 8a, when the air temperature is very low, there is no liquid raindrop and the sub-cloud evaporation can be neglected for the cold environment. In Figure 8b, small precipitation can be widely seen, although larger precipitation corresponds the low evaporation. For the relative humidity in Figure 8c, high humidity usually means low below-cloud evaporation. In Figure 8d, very large raindrop may result in low evaporation. Although the amplitude of the variation of deuterium excess is close to −200‰ during individual precipitation events, these correspond to the minimal rainfall intensity and amount. If precipitation is weighted, this phenomenon may not appear. The results about the climate parameters are of help to understand the raindrop evaporation and deuterium excess difference especially in the semi-arid regions.

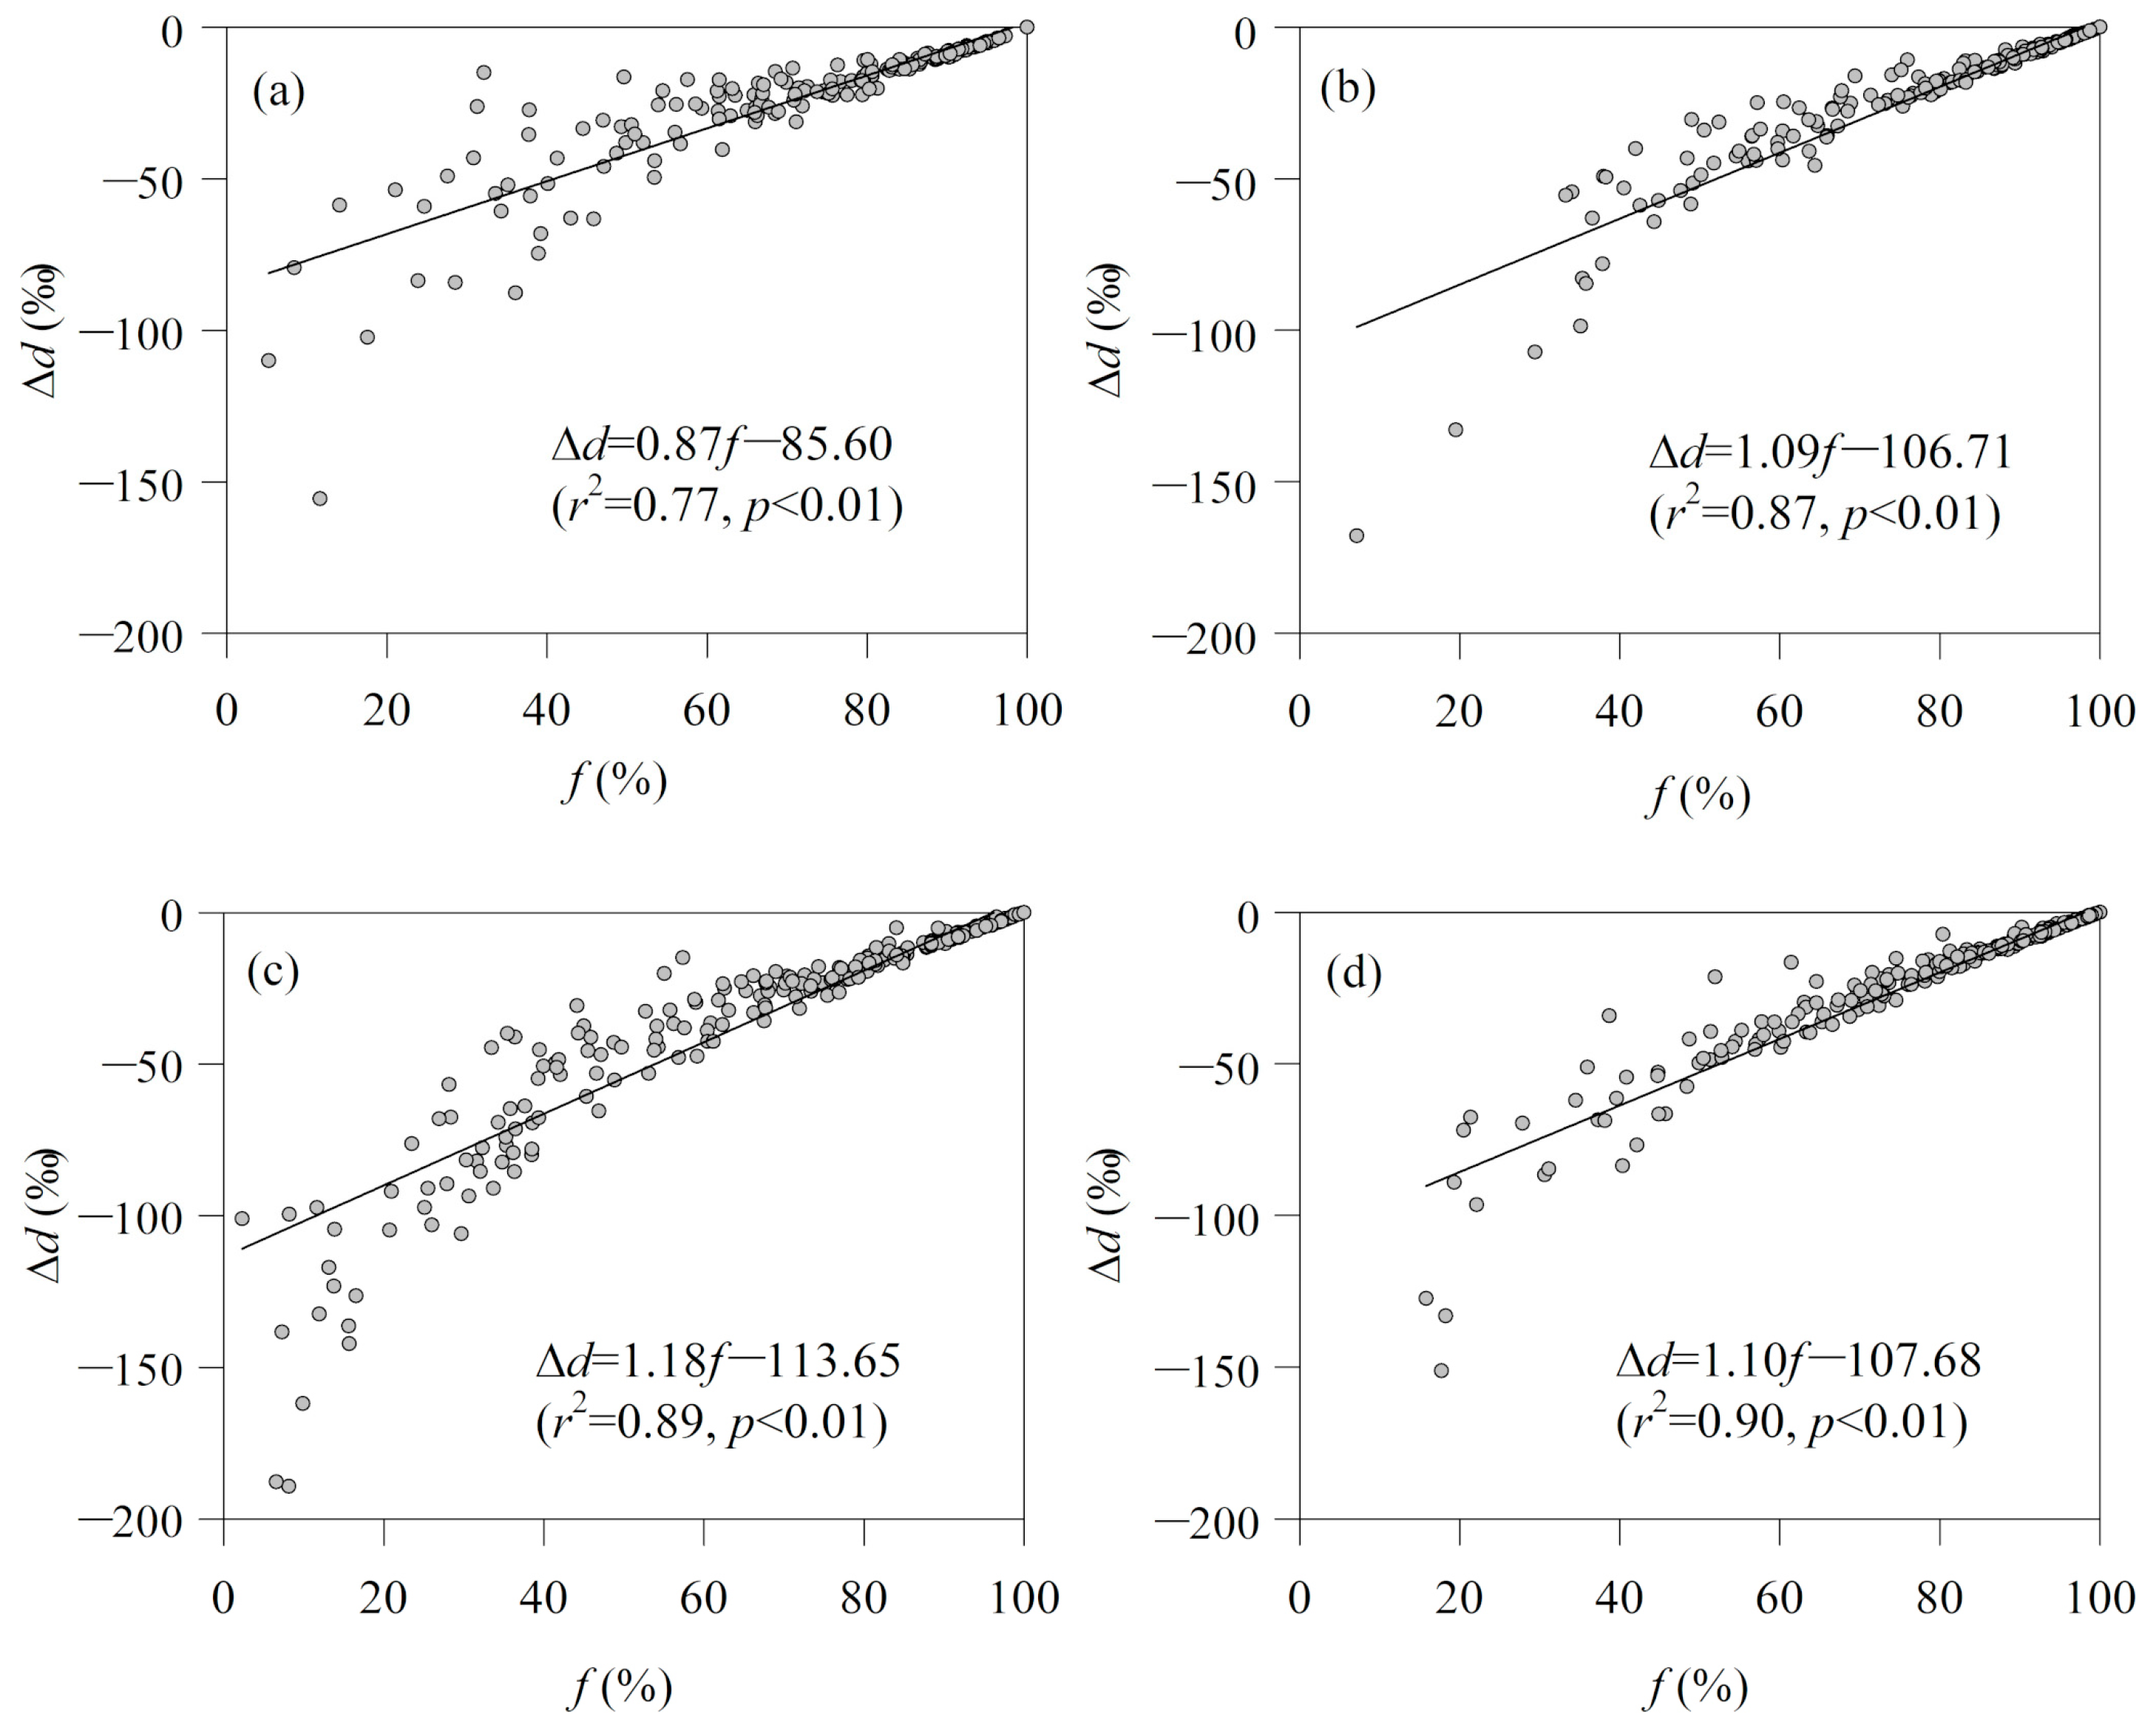
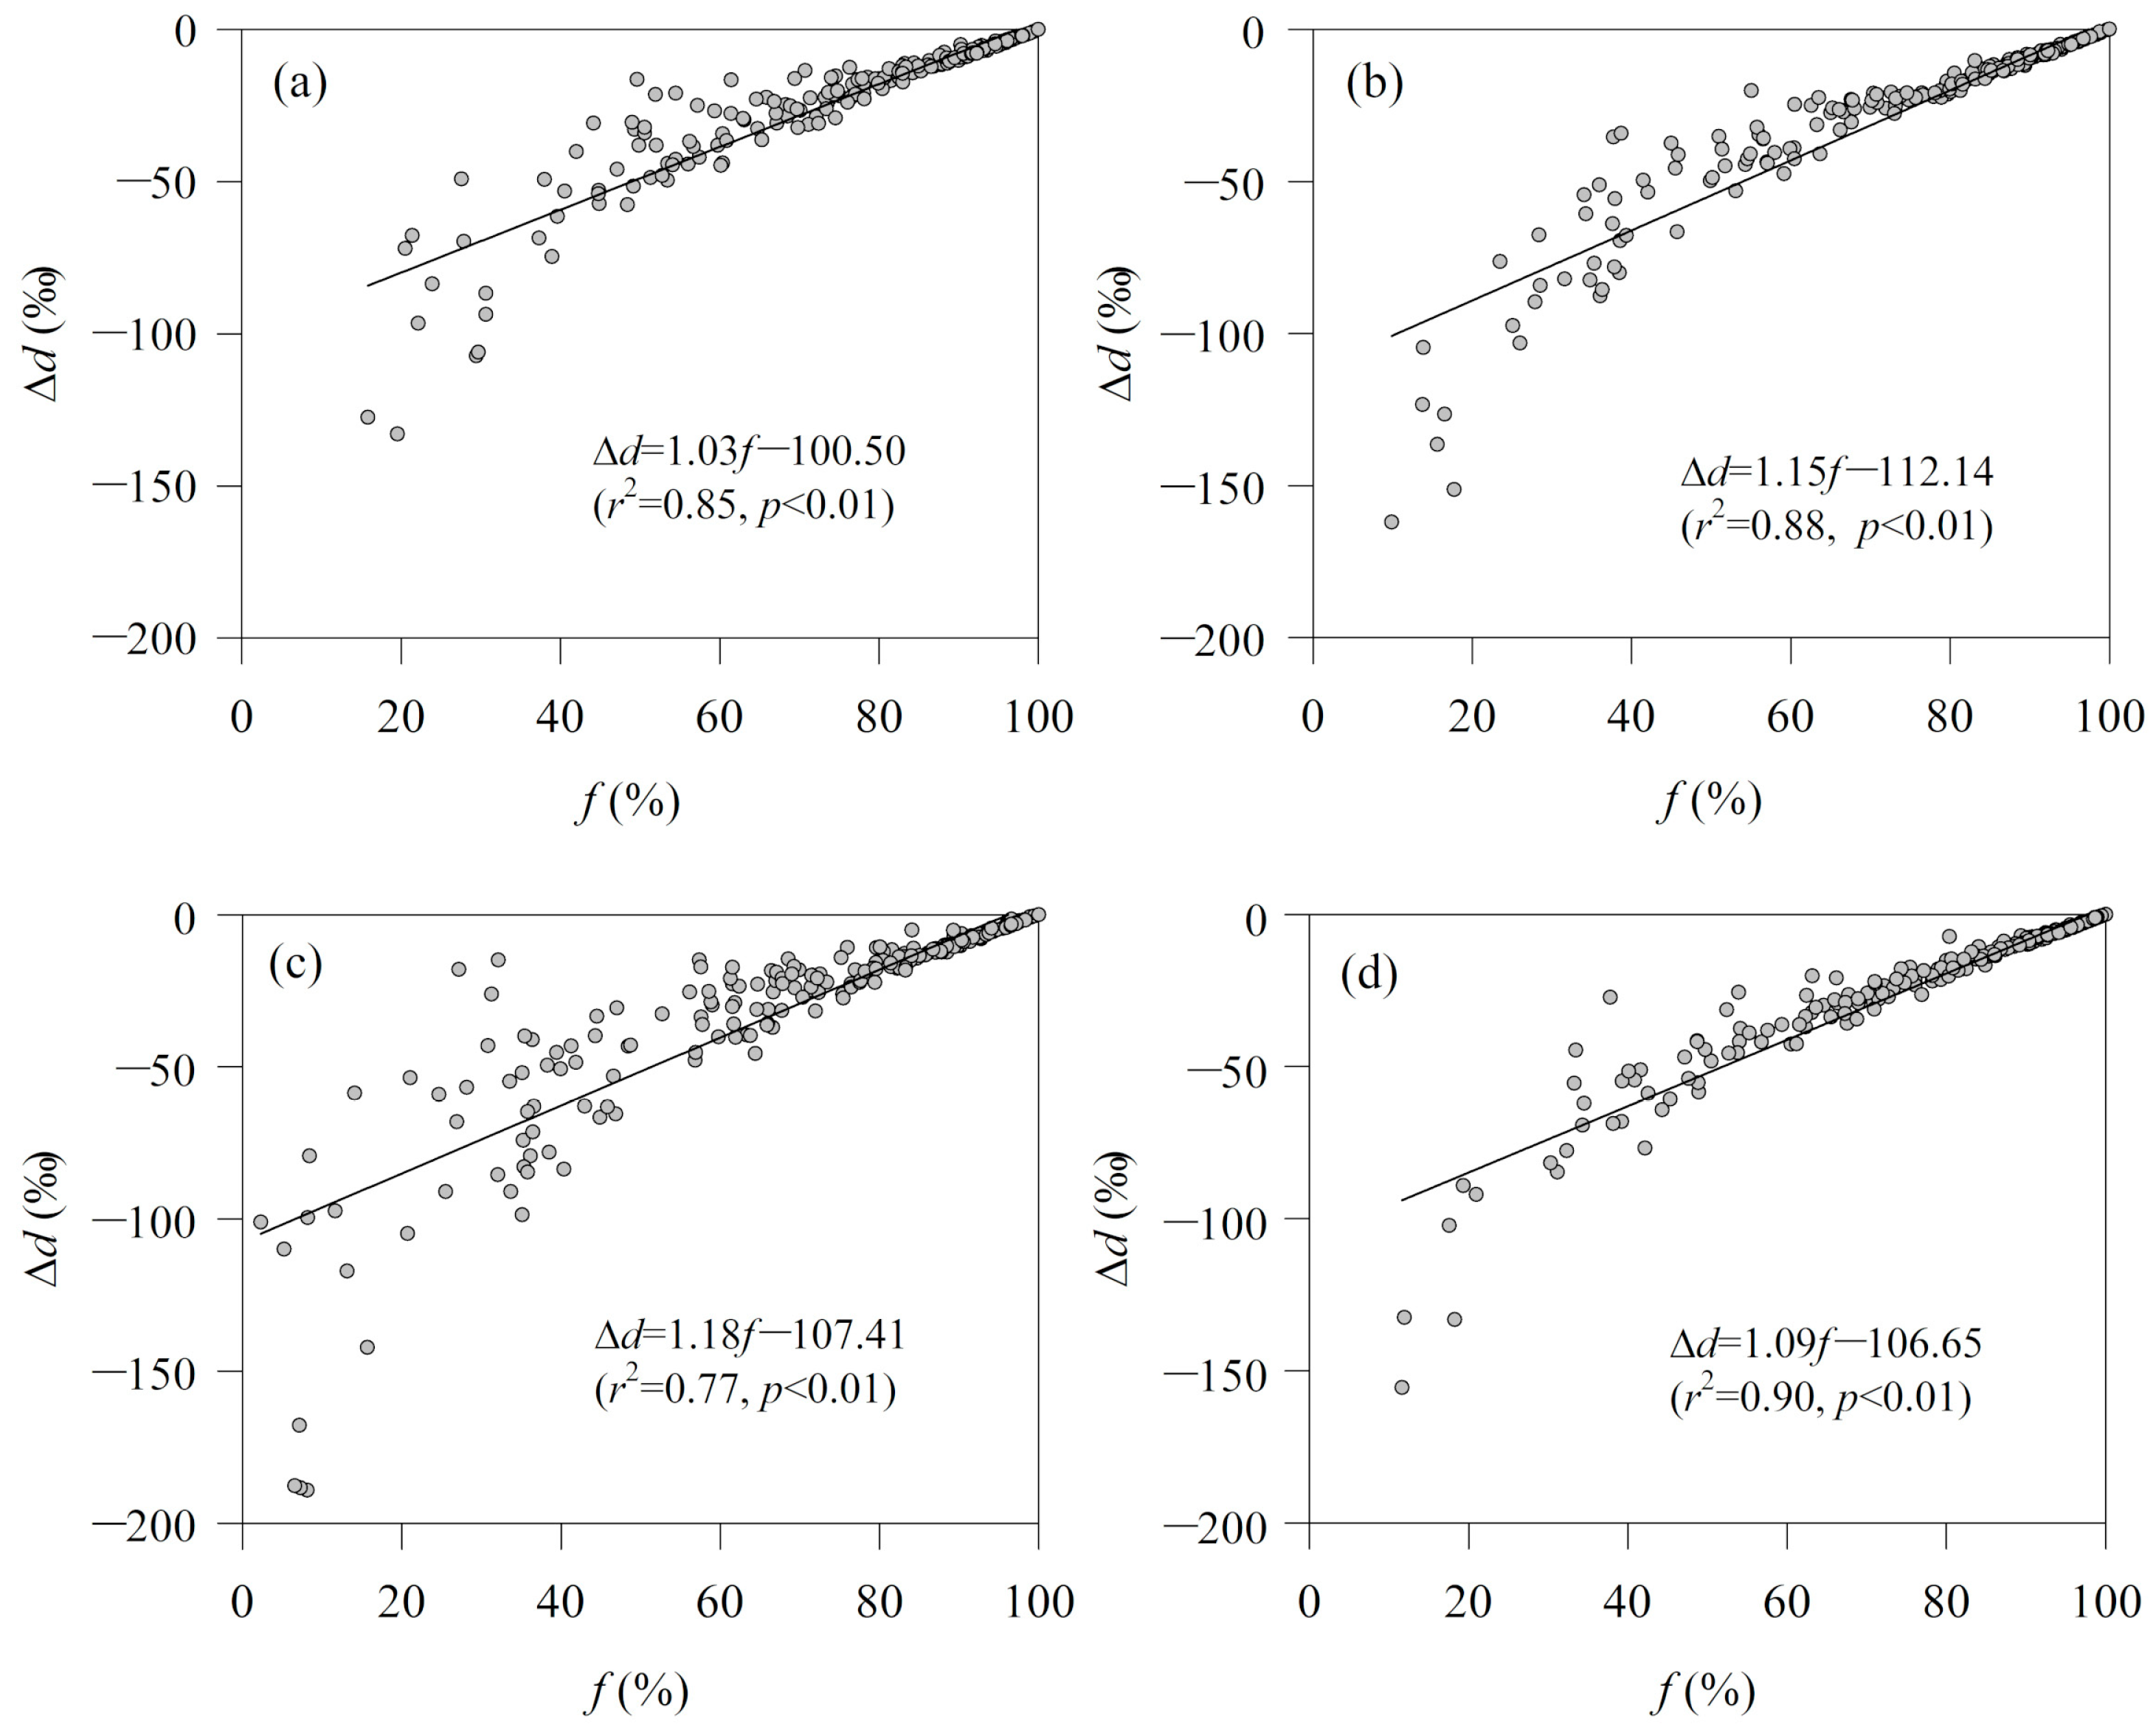
3.4. Raindrop Evaporation and Deuterium Excess Difference

The remaining fraction varies depending on the specific site and the time period, and it ranges from 2% to 100% (Figure 9). Considering the very weak below-cloud evaporation in cold period, the winter evaporation remaining fraction are usually close to 100%. The medians of f at the four sites all exceed 70%. Figure 10 illustrates the intra-annual variation of f at the four sites in Lanzhou, indicating that the basic patterns are consistent to Figure 9.
In many case studies, the Δd and f have a good correlation [17,18,19], which is generally consistent with this study (Figure 11 and Figure 12), i.e., a 1% increase of evaporation may cause deuterium excess in raindrop to reduce by approximately 1‰ (1.1‰ per 1% in this study). Under conditions of low remaining fraction, the relationship is usually weak [19]. In Anning, Yuzhong, Gaolan and Yongdeng, the regression coefficients are 0.87‰, 1.09‰, 1.18‰ and 1.10‰ per 1%, respectively (Figure 11). In 2011, 2012, 2013 and 2014, the regression coefficients are 1.03‰, 1.15‰, 1.18‰ and 1.09‰ per 1%, respectively (Figure 12). The results in the study region are generally consistent with the previous findings, and the inter-annual variations do exist during the sampling period. In addition, the spatial diversity of this regression slopes can also be seen in such a small area.

4. Conclusions

In this study, the difference of deuterium excess of raindrops from the cloud base to the land surface is evaluated by using a model in order to discuss the influence of below-cloud evaporation in Lanzhou, China, at the monsoon margin. The changes in deuterium excess in summer are greater than in other seasons, and changes in winter are close to zero due to the low temperature. Here we focus on the below-cloud evaporation effect on raindrop stable isotopes in a city scale where the sampling sites are located closely, and the variations of deuterium excess are examined for each sampling site and year. In this study, different isotopic characteristics due to below-cloud evaporation can be seen due to the meteorological controls. The results are useful to understand the modification of raindrop isotope composition below the cloud base at a city scale, and the quantitative methods used here provide a case study for raindrop evaporation assessment for a semi-arid region at the monsoon margin.

Author Contributions

Conceptualization, M.Z. and S.W.; Software, F.C.; Validation, F.C.; Formal analysis, F.C.; Investigation, F.C.; Methodology, S.W. and A.A.A.; Resources, Q.M., X.Z., X.W. and J.C.; Data curation, F.C.; Writing—original draft preparation, F.C.; Writing—review and editing, F.C., M.Z. and S.W.; Supervision, M.Z.; Funding acquisition, M.Z. and S.W. All authors have read and agreed to the published version of the manuscript.

Funding

The research is supported by the National Natural Science Foundation of China (No. 42071047 and 41771035), the Foundation for Distinguished Young Scholars of Gansu Province (No. 20JR10RA112) and the Scientific Research Program of Higher Education Institutions of Gansu Province (No. 2018C-02).

Institutional Review Board Statement

Not applicable.

Informed Consent Statement

Not applicable.

Data Availability Statement

The data used in this paper are available from M.Z. ([email protected]) upon request.

Acknowledgments

The authors thank the meteorological bureaus for their help in sampling.

Conflicts of Interest

The authors declare no conflict of interest. The work described here has not been submitted elsewhere for publication, in whole or in part, and all the authors listed have approved the manuscript that is enclosed.

References

  1. Stewart, M.K. Stable isotope fractionation due to evaporation and isotopic exchange of falling water drops: Applications to atmospheric processes and evaporation of lakes. J. Geophys. Res. 1975, 80, 1133–1146. [Google Scholar] [CrossRef]
  2. Salamalikis, V.; Argiriou, A.A.; Dotsika, E. Isotopic modeling of the sub-cloud evaporation effect in precipitation. Sci. Total Environ. 2016, 544, 1059–1072. [Google Scholar] [CrossRef]
  3. Lee, J.E.; Fung, I. “Amount effect” of water isotopes and quantitative analysis of post-condensation processes. Hydrol. Process. 2008, 22, 1–8. [Google Scholar] [CrossRef]
  4. Peng, H.; Mayer, B.; Harris, S. The influence of below-cloud secondary effects on the stable isotope composition of hydrogen and oxygen in precipitation at Calgary, Alberta, Canada. Tellus B 2007, 59, 698–704. [Google Scholar] [CrossRef]
  5. Kostrova, S.S.; Meyer, H.; Fernandoy, F.; Werner, M.; Tarasov, P.E. Moisture origin and stable isotope characteristics of precipitation in southeast Siberia. Hydrol. Process. 2020, 34, 51–67. [Google Scholar] [CrossRef] [Green Version]
  6. Adhikari, N.; Gao, J.; Yao, T.; Yang, Y.; Dai, D. The main controls of the precipitation stable isotopes at Kathmandu, Nepal. Tellus B 2020, 72, 1–17. [Google Scholar] [CrossRef] [Green Version]
  7. Dansgaard, W. Stable isotopes in precipitation. Tellus 1964, 16, 436–468. [Google Scholar] [CrossRef]
  8. Valipour, M.; Bateni, S.M.; Gholami Sefidkouhi, M.A.; Raeini-Sarjaz, M.; Singh, V.P. Complexity of forces driving trend of reference evapotranspiration and signals of climate change. Atmosphere 2020, 11, 1081. [Google Scholar] [CrossRef]
  9. Le, T.; Bae, D.H. Response of global evaporation to major climate modes in historical and future Coupled Model Intercomparison Project Phase 5 simulations. Hydrol. Earth Syst. Sci. 2020, 24, 1131–1143. [Google Scholar] [CrossRef] [Green Version]
  10. Pfahl, S.; Sodemann, H. What controls deuterium excess in global precipitation. Clim. Past. 2014, 10, 771–781. [Google Scholar] [CrossRef] [Green Version]
  11. Bershaw, J. Controls on deuterium excess across Asia. Geosciences 2018, 8, 257. [Google Scholar] [CrossRef] [Green Version]
  12. Kopec, B.G.; Feng, X.; Posmentier, E.S.; Sonder, L. Seasonal deuterium excess variations of precipitation at Summit, Greenland, and their climatological significance. J. Geophys. Res. Atmos. 2019, 124, 72–91. [Google Scholar] [CrossRef] [Green Version]
  13. Yamanaka, T.; Shimada, J.; Miyaoka, K. Footprint analysis using event-based isotope data for identifying source area of precipitated water. J. Geophys. Res. Atmos. 2002, 107, 4624. [Google Scholar] [CrossRef]
  14. Tian, L.; Yao, T.; Sun, W.; Stievenard, M. Relationship between δD and δ18O in precipitation on north and south of the Tibetan Plateau and moisture recycling. Sci. China Ser. D 2001, 44, 789–796. [Google Scholar] [CrossRef]
  15. Martínez, D.E.; Maenza, R.; Londono, O.M.Q. Atmospheric constraints on δ18O and d-excess in precipitation at the middle latitude in the southwestern Atlantic region. Isot. Environ. Healt. Stud. 2020, 56, 551–565. [Google Scholar] [CrossRef]
  16. Zhang, M.; Wang, S. Precipitation isotopes in the Tianshan Mountains as a key to water cycle in arid central Asia. Sci. Cold Arid Reg. 2018, 10, 27–37. [Google Scholar]
  17. Froehlich, K.; Kralik, M.; Papesch, W.; Rank, D. Deuterium excess in precipitation of Alpine regions—Moisture recycling. Isot. Environ. Healt. Stud. 2008, 44, 61–70. [Google Scholar] [CrossRef]
  18. Kong, Y.; Pang, Z.; Froehlich, K. Quantifying recycled moisture fraction in precipitation of an arid region using deuterium excess. Tellus B 2013, 65, 19251. [Google Scholar] [CrossRef]
  19. Wang, S.; Zhang, M.; Che, Y.; Zhu, X.; Liu, X. Influence of below-cloud evaporation on deuterium excess in precipitation of arid central Asia and its meteorological controls. J. Hydrometeorol. 2016, 17, 1973–1984. [Google Scholar] [CrossRef]
  20. Zhang, M.; Wang, S. A review of precipitation isotope studies in China: Basic pattern and hydrological process. J. Geogr. Sci. 2016, 26, 921–938. [Google Scholar] [CrossRef] [Green Version]
  21. Sun, C.; Chen, W.; Chen, Y.; Cai, Z. Stable isotopes of atmospheric precipitation and its environmental drivers in the Eastern Chinese Loess Plateau, China. J. Hydrol. 2020, 581, 124404. [Google Scholar] [CrossRef]
  22. Ma, X.; Jia, W.; Zhu, G.; Wang, S. Quantitative analysis of the sub-cloud evaporation of atmospheric precipitation and its controlling factors calculated by d-excess in an inland river basin of China. Water 2020, 12, 2798. [Google Scholar] [CrossRef]
  23. Chen, F.; Zhang, M.; Ma, Q.; Wang, S.; Li, X.; Zhu, X. Stable isotopic characteristics of precipitation in Lanzhou City and its surrounding areas, Northwest China. Environ. Earth Sci. 2015, 73, 4671–4680. [Google Scholar] [CrossRef]
  24. Chen, F.; Zhang, M.; Wang, S.; Qiu, X.; Du, M. Environmental controls on stable isotopes of precipitation in Lanzhou, China: An enhanced network at city scale. Sci. Total Environ. 2017, 609, 1013–1022. [Google Scholar] [CrossRef] [PubMed]
  25. Chen, F.; Zhang, M.; Wang, S.; Ma, Q.; Zhu, X.; Dong, L. Relationship between sub-cloud secondary evaporation and stable isotope in precipitation of Lanzhou and surrounding area. Quatern. Int. 2015, 380–381, 68–74. [Google Scholar] [CrossRef]
  26. Han, T.; Zhang, M.; Wang, S.; Qu, D.; Du, Q. Sub-hourly variability of stable isotopes in precipitation in the marginal zone of East Asian Monsoon. Water 2020, 12, 2145. [Google Scholar] [CrossRef]
  27. Friedman, I.; O’Neil, J.R. Compilation of stable isotope fractionation factors of geochemical interest. In Data of Geochemistry; Fleischer, M., Ed.; US Geological Survey: Washington, DC, USA, 1977. [Google Scholar]
  28. Criss, R.E. Principles of Stable Isotope Distribution; Oxford University: New York, NY, USA, 1999. [Google Scholar]
  29. Merlivat, L. Quantitative aspects of the study of water balances in lakes using the deuterium and oxygen-18 concentrations in the water. In Proceedings of the Symposium on Isotope Hydrology, Vienna, Austria, 9–13 March 1970; pp. 89–107. [Google Scholar]
  30. Best, A.C. Empirical formulae for the terminal velocity of water drops falling through the atmosphere. Q. J. Roy. Meteor. Soc. 1950, 76, 302–311. [Google Scholar] [CrossRef]
  31. Berberan-Santos, M.N.; Bodunov, E.N.; Pogliani, L. On the barometric formula. Am. J. Phys. 1997, 65, 404–412. [Google Scholar] [CrossRef]
  32. Barnes, S.L. An empirical shortcut to the calculation of temperature and pressure at the lifted condensation level. J. Appl. Meteorol. 1968, 7, 511. [Google Scholar] [CrossRef] [Green Version]
  33. Kinzer, G.D.; Gunn, R. The evaporation, temperature and thermal relaxation-time of freely falling waterdrops. J. Meteorol. 1951, 8, 71–83. [Google Scholar] [CrossRef] [Green Version]
  34. Best, A.C. The size distribution of raindrops. Q. J. Roy. Meteor. Soc. 1950, 76, 16–36. [Google Scholar] [CrossRef]
Figure 1. Spatial distribution of network in Lanzhou used in this study. Small map shows the study area in China.
Water 13 00193 g001
Figure 2. Frequency of precipitation events for different rain drop diameters: (a) Lanzhou and (b) four sampling sites.
Water 13 00193 g002
Figure 3. Frequency of precipitation events for different terminal velocities: (a) Lanzhou and (b) four sampling sites.
Water 13 00193 g003
Figure 4. Regional (a) and monthly (b) variations of raindrop evaporation intensity.
Water 13 00193 g004
Figure 5. Regional (a,c,e,g) and monthly (b,d,f,h) variations of raindrop evaporation intensity in 2011 (a,b), 2012 (c,d), 2013 (e,f) and 2014 (g,h).
Water 13 00193 g005
Figure 6. Regional (a) and monthly (b) variations of Δd in precipitation.
Water 13 00193 g006
Figure 7. Regional (a,c,e,g) and monthly (b,d,f,h) variations of Δd in 2011 (a,b), 2012 (c,d), 2013 (e,f) and 2014 (g,h).
Water 13 00193 g007
Figure 8. Relationship between meteorological parameters ((a). air temperature, (b). precipitation amount, (c). relative humidity, (d). raindrop diameter) and Δd in precipitation.
Water 13 00193 g008
Figure 9. Regional (a) and monthly (b) variations of f in precipitation.
Water 13 00193 g009
Figure 10. Regional (a,c,e,g) and monthly (b,d,f,h) variations of f in 2011 (a,b), 2012 (c,d), 2013 (e,f) and 2014 (g,h).
Water 13 00193 g010
Figure 11. Relationships between f and Δd in precipitation for each site (a). Anning, (b). Yuzhong, (c). Gaolan, (d). Yongdeng.
Water 13 00193 g011
Figure 12. Relationships between f and Δd in precipitation in 2011 (a), 2012 (b), 2013 (c) and 2014 (d).
Water 13 00193 g012
Table 1. Comparison of deuterium excess (d) in precipitation at land surface and cloud base for each year.
Sited (‰)
2011–20142011201220132014
GroundCloud BaseΔdGroundCloud BaseΔdGroundCloud BaseΔdGroundCloud BaseΔdGroundCloud BaseΔd
Anning9.3824.32−14.9411.1729.57−18.408.2322.93−14.705.6330.02−24.3910.2218.74−8.53
Yuzhong11.9622.51−10.5515.7024.43−8.7310.6019.22−8.6211.7624.24−12.4710.4524.12−13.68
Gaolan10.3928.23−17.8422.2638.30−16.047.2425.74−18.499.6024.88−15.289.0630.70−21.64
Yongdeng11.1923.09−11.9012.2825.46−13.199.8120.04−10.2211.4725.34−13.8711.4322.43−11.00
Table 2. Comparison of deuterium excess (d) in precipitation at land surface and cloud base for each season.
Sited (‰)
SpringSummerAutumnWinter
GroundCloud BaseΔdGroundCloud BaseΔdGroundCloud BaseΔdGroundCloud BaseΔd
Anning2011–201410.6125.82−15.218.1025.92−17.8210.8419.34−8.5013.2213.220.00
201112.0422.02−9.9810.0033.10−23.1013.4624.91−11.458.978.970.00
201210.9822.15−11.176.1023.91−17.818.2012.68−4.4811.6911.690.00
20135.6620.03−14.382.1425.14−23.0010.5619.12−8.5614.1014.100.00
201412.0918.51−6.429.8020.75−10.958.9615.19−6.23n.s.
Yuzhong2011–201414.0924.39−10.3011.7923.55−11.7611.0619.89−8.839.629.620.00
201119.5730.65−11.0816.6725.56−8.8913.1321.70−8.5710.9410.940.00
201212.2021.53−9.3310.7919.92−9.135.8911.04−5.156.036.030.00
201315.5630.11−14.5510.9722.93−11.9511.9824.72−12.74−0.92−0.920.00
201418.4441.87−23.4310.0427.62−17.5811.0918.87−7.78n.s.
Gaolan2011–201410.1427.64−17.509.4230.60−21.1814.5024.00−9.503.193.190.00
201126.9137.31−10.4021.1438.84−17.7025.2632.29−7.04n.s.
20129.4230.34−20.924.0825.50−21.4215.1221.25−6.13n.s.
201311.6137.55−25.946.8222.75−15.9313.5425.07−11.53n.s.
20147.3321.08−13.7411.7145.42−33.71n.s. n.s.
Yongdeng2011–201415.4925.79−10.308.4420.85−12.4114.3726.85−12.488.358.350.00
201115.0330.53−15.508.4224.12−15.7016.6526.04−9.3917.0617.060.00
201218.2228.78−10.566.1116.68−10.5713.2023.32−10.123.143.140.00
201312.8528.11−15.2610.2720.67−10.4013.7536.71−22.9613.0513.050.00
201414.6221.25−6.639.6622.86−13.2011.5123.19−11.68n.s.
n.s., no precipitation sample in this period.
Publisher’s Note: MDPI stays neutral with regard to jurisdictional claims in published maps and institutional affiliations.

