Article

Monetary Valuation of Flood Protection Ecosystem Service Based on Hydrological Modelling and Avoided Damage Costs. An Example from the Čierny Hron River Basin, Slovakia

Department of Applied Ecology, Faculty of Ecology and Environmental Sciences, Technical University in Zvolen, T.G. Masaryka 24, SK-960 01 Zvolen, Slovakia
*
Author to whom correspondence should be addressed.
Water 2021, 13(2), 198; https://doi.org/10.3390/w13020198
Submission received: 19 December 2020 / Revised: 4 January 2021 / Accepted: 12 January 2021 / Published: 15 January 2021

Abstract

:
Flood protection is considered one of the crucial regulating ecosystem services due to climate change and extreme weather events. As an ecosystem service, it combines the results of hydrological and ecosystem research and their implementation into land management and/or planning processes including several formally separated economic sectors. As managerial and economic interests often diverge, successful decision-making requires a common denominator in form of monetary valuation of competing trade-offs. In this paper, a methodical approach based on the monetary value of the ecosystem service provided by the ecosystem corresponding to its actual share in flood regulating processes and the value of the property protected by this service was developed and demonstrated based on an example of a medium size mountain basin (290 ha). Hydrological modelling methods (SWAT, HEC-RAS) were applied for assessing the extent of floods with different rainfalls and land uses. The rainfall threshold value that would cause flooding with the current land use but that would be safely drained if the basin was covered completely by forest was estimated. The cost of the flood protection ecosystem service was assessed by the method of non-market monetary value for estimating avoided damage costs of endangered infrastructure and calculated both for the current and hypothetical land use. The results identify areas that are crucial for water retention and that deserve greater attention in management. In addition, the monetary valuation of flood protection provided by the current but also by hypothetical land uses enables competent and well-formulated decision-making processes.

1. Introduction

Ecosystem services (ES), as the benefits people obtain from ecosystems [1], are outcomes of ecosystem properties—biophysical conditions, structures, and processes [2], which constitute ecosystem functions [3,4]. In addition, ecosystem services feature highly distinctive spatial and temporal patterns of distribution, quantity, and flows [5]. The importance of spatial relations between the ecosystems providing the services and the areas where those services are utilized is stressed by many authors [6,7,8]. Ecosystems do not exist in isolation but they compose whole complexes of ecosystems interacting with each other in the landscape [9]. Ecosystem services are usually provided within units that define processes such as watersheds, specific habitats, or other natural units [7,10]. Spatial relations are for certain ES so significant that several authors [11,12] call them landscape services. Spatial relations and the location of the ecosystem are important also for a monetary valuation of the ecosystem service [13,14,15]. In theory, two “identical” ecosystems protecting the nearby area from natural hazards such as landslides, erosion, or floods provide an identical supply of ecosystem service, but the value of each ES reflects the actual value of the respective protected infrastructure (human lives, property, city size etc.). Flood protection (regulation or mitigation) belongs among those ecosystem services, for which the spatial accent is of crucial importance. Flood protection ES supply addresses the ecosystem’s capacity to lower flood hazards caused by heavy precipitation events by reducing the runoff fraction [5]. This reduction corresponds to the damage-limiting efficiency of recent ecosystems compared to the maximum possible runoff.
The service capacity is an ecosystem’s potential to deliver services based on biophysical properties, social conditions, and ecological functions. Capacity responds to natural or anthropogenic changes over time and space [2,8,16,17]. River floods are the costliest and most frequent natural hazards both in Europe [18,19] and in the world [20,21,22]. Direct and indirect economic losses and threat to human lives are continuously growing due to increasing population density, the growth of infrastructure and the increasing frequency of heavy precipitation events due to climate change [23,24,25]. According to [26], flood protection ES consists of: supply—flood volume regulated by vegetation and soils; service—area of avoided flood damage due to regulation by vegetation or soil; and benefit—avoided costs due to loss of property or infrastructure.
The value of ecosystems and their services can be expressed in different ways as it has complex meaning with several dimensions [11,27,28]. There are three value domains: ecological (biophysical), socio-cultural and economic [1,29,30]. The assessment of an ecosystem’s capacity to provide flood protection ecosystem services is often based on biophysical methods [31,32], i.e., by employing hydrological models based on water retention functions of the vegetation and soil cover [15] or assessing storage capacity of floodplains [33]. There are several methods for the monetary valuation of ecosystem services [34,35,36,37]. Most methods for the monetary valuation of regulating services apply calculations of replacement costs and avoided damage costs [38,39]. Other methods valuate the benefits (in terms of increased economic welfare) resulting from reduced flooding as a consequence of reduced deforestation [40] or an economic valuation of the storage capacity of natural floodplain wetlands, as well as riparian forest, protecting nearby areas [41,42]. Similarly, a valuation of avoided flood damages for a floodplain’s conservation in comparison to a scenario of residential construction is presented by [22]. The expressed willingness to pay method was applied by [43,44] to demonstrate how much people were willing to pay for flood risk reduction.
Flood hazard is defined as the probability that a critical peak discharge is exceeded and which in a combination with the consequent economic damage generates flood risk [45]. As noted by [30], it is useful to apply risk assessment methods in the assessment of flood protection ES. Risk is a combination of hazard (potential source of harm) and vulnerability (magnitude of damage or danger to life) [46,47]. To estimate hazards, it is necessary to know: (a) what is the probability and frequency of the occurrence of each hazardous phenomenon at a given place; (b) the intensity required for them to happen; (c) to what extent their total effect would influence the landscape and/or vulnerability of the social-economic system. Disasters are better viewed as a result of the complex interaction between a potentially damaging physical event (i.e., floods, droughts, fire, earthquakes and storms) and the vulnerability of a society, its infrastructure, economy and environment, which are determined by human behavior [48,49]. Modelling software and geographical information systems (GIS) are highly recommended for assessing risk assessment, natural hazards, and ecosystem services [14,50]. The use of catchment-based hydrologic models provides the basis to reveal the varying importance of factors and processes responsible for the formation of river swellings as well as the capability of different land use types to retain part of the incoming water, which reveals their regulation capacity [31,51,52,53].
The aim of this article is to develop a method for the monetary valuation of flood protection ecosystem services. The approach is based on a hypothesis that a monetary value of the ecosystem service provided by the ecosystem corresponds to its actual share in flood regulating processes and the value of the property protected by this service. The value of the ES corresponds to the size of the benefit to the society, and it is expressed in the value of property (infrastructure) that is protected by an ecosystem. Since all ecosystems in the river basin (above the protected infrastructure) contribute to the protection of property, the contribution of each ecosystem to this protection was assessed and valuated according to the share of each ecosystem in reducing the total runoff.

2. Materials and Methods
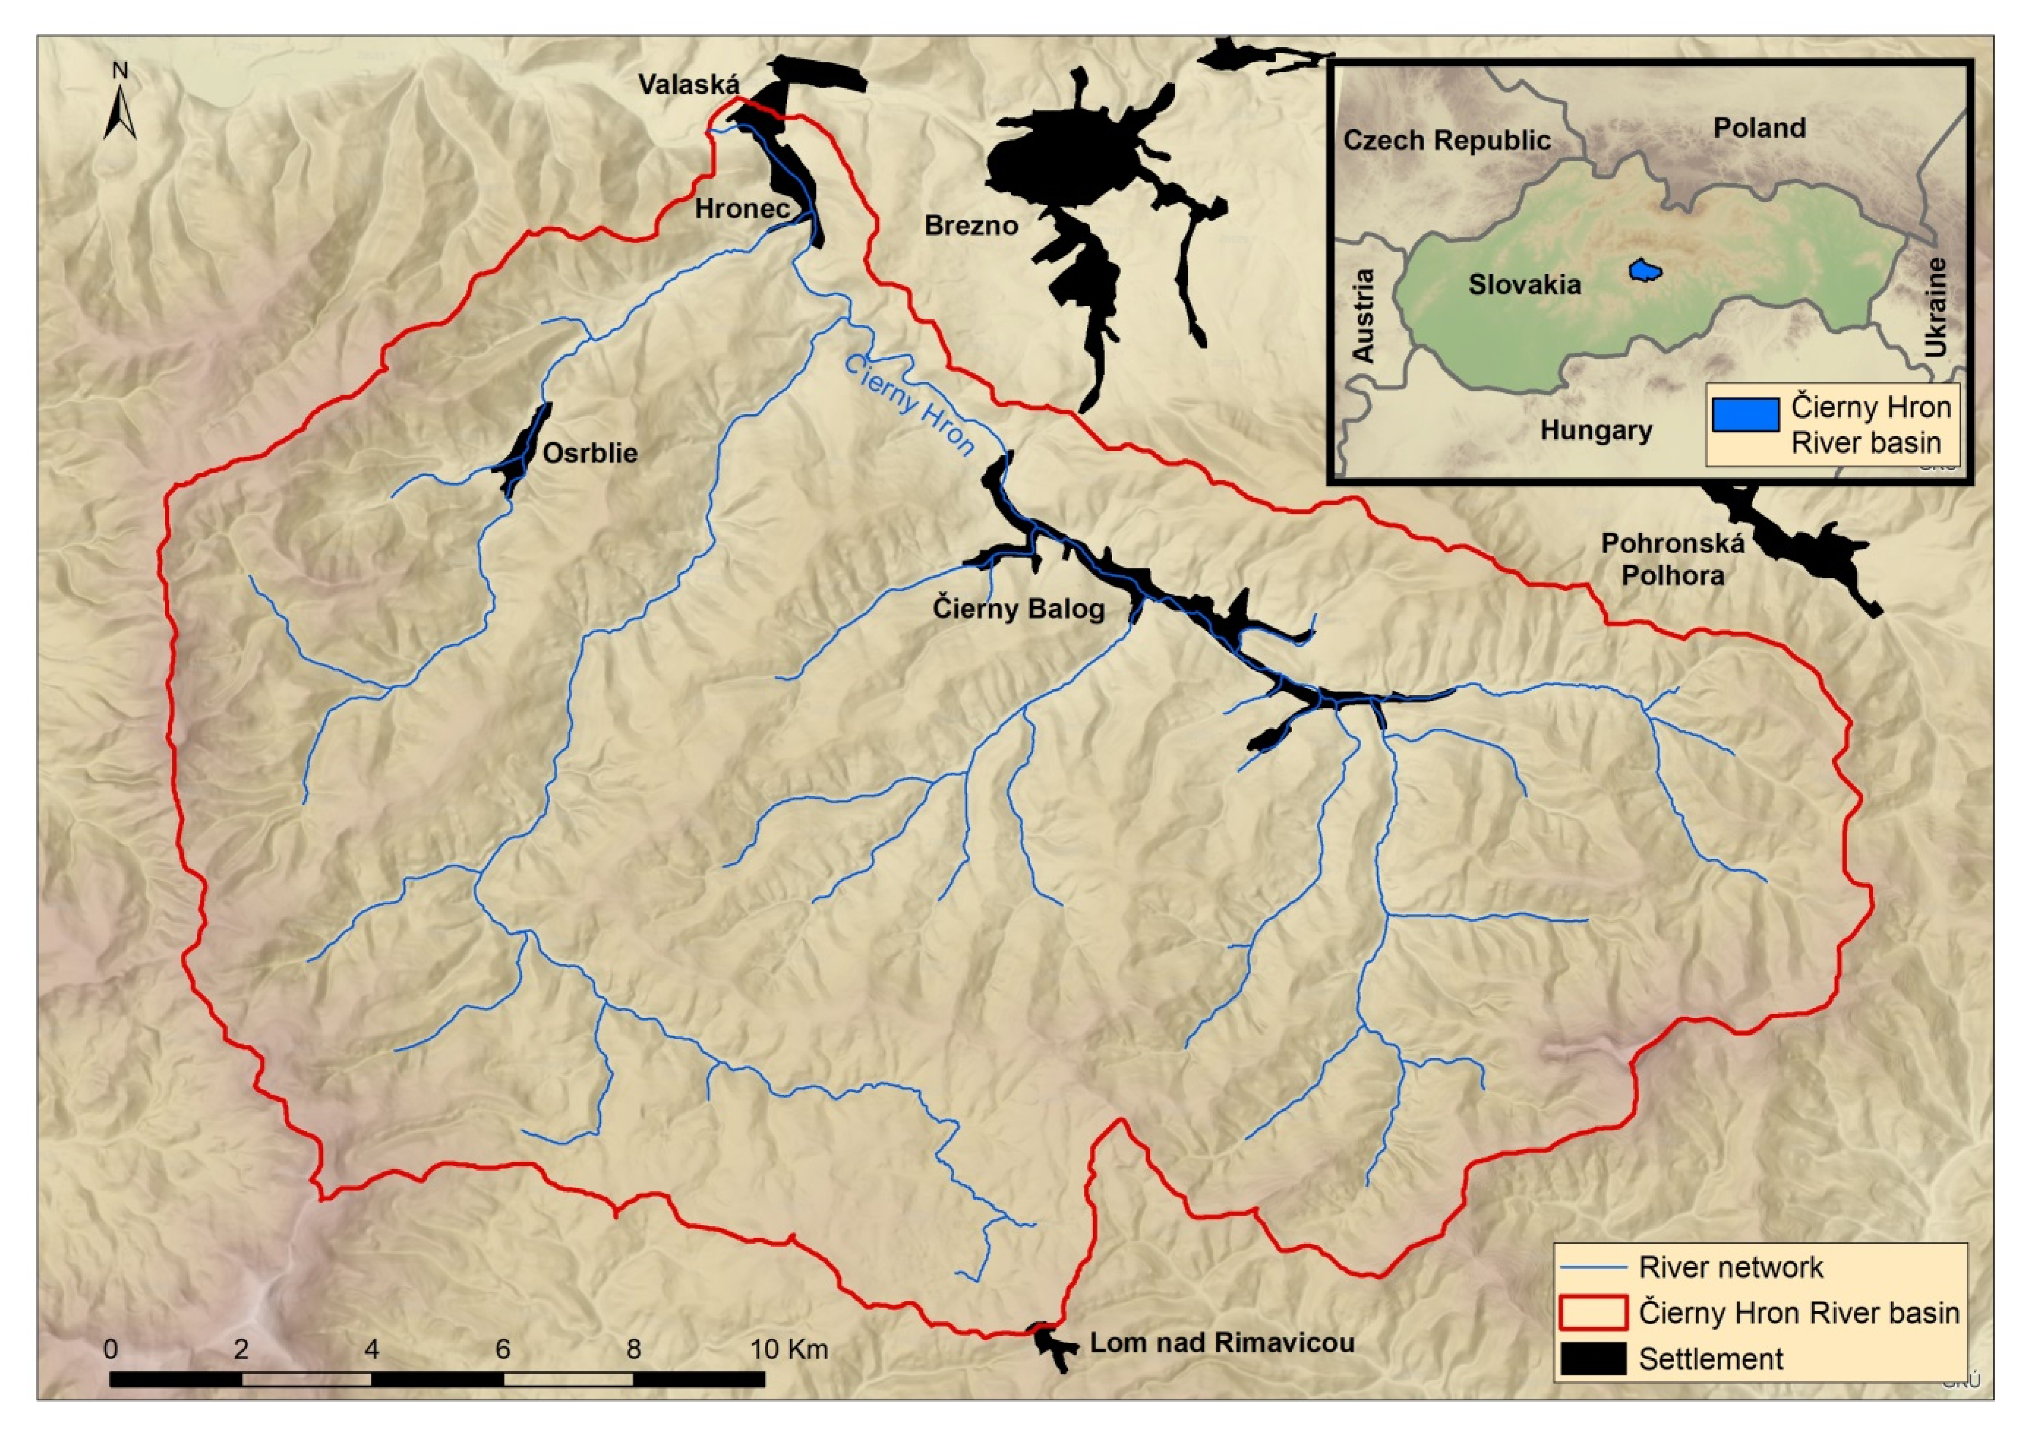
The methodical approach adopted is based on a combination of different bio-geophysical GIS data with terrain mapping and the results of hydrological modelling. The extent of the flooded area (flood hazard) was modelled according to different precipitation volumes and different land uses. The economic valuation of the flood protection ecosystem service was based on the estimated value of the endangered residential infrastructure.
Clarification note: the term “land use” applied in the hydrological analyses is considered, in a broad sense, equal to “ecosystem” in the parts dealing with ecosystem services assessment. The authors are fully aware of terminological difference but for the sake of simplification, these terms were used as synonyms.

2.1. Study Area

Flood regulation ecosystem service was estimated for the Čierny Hron River basin situated in central Slovakia in a mountainous region (Figure 1). This basin is rather specific, as in the years 1960–2017, 13 floods occurred in various locations within the study area [54]. Six of them were flash floods from intense summer precipitations. The total area of the basin is 291.7 ha, the minimum elevation of the basin is 461 m a.s.l., the maximum elevation is 1338 m a.s.l., and the mean elevation is 785 m a.s.l. The mean annual precipitation increases approximately from 780 to 1150 mm as the elevation increases [55]. The mean year one-day maximum precipitation is around 45 mm/day, but the absolute maximum recorded in the period 1981–2010 reached 70–80 mm/day. The mean temperature varies from −3.5 to −5.0 °C in the winter season and from 12 to 16 °C in summer. The dominant soils are loam and sandy loam Cambisols on Paleozoic granitic and metamorphic rocks from highlands to mountainous landscape. Regarding land use, 79% of the basin area is covered by forest, 9% by logging and regeneration logging area, 7% by grasslands, 3% by agricultural land and 2% by rural settlements. Most of the forests are mixed forests. Coniferous forests occupy the highest parts of the area and deciduous forests cover only the lowest part of the basin.

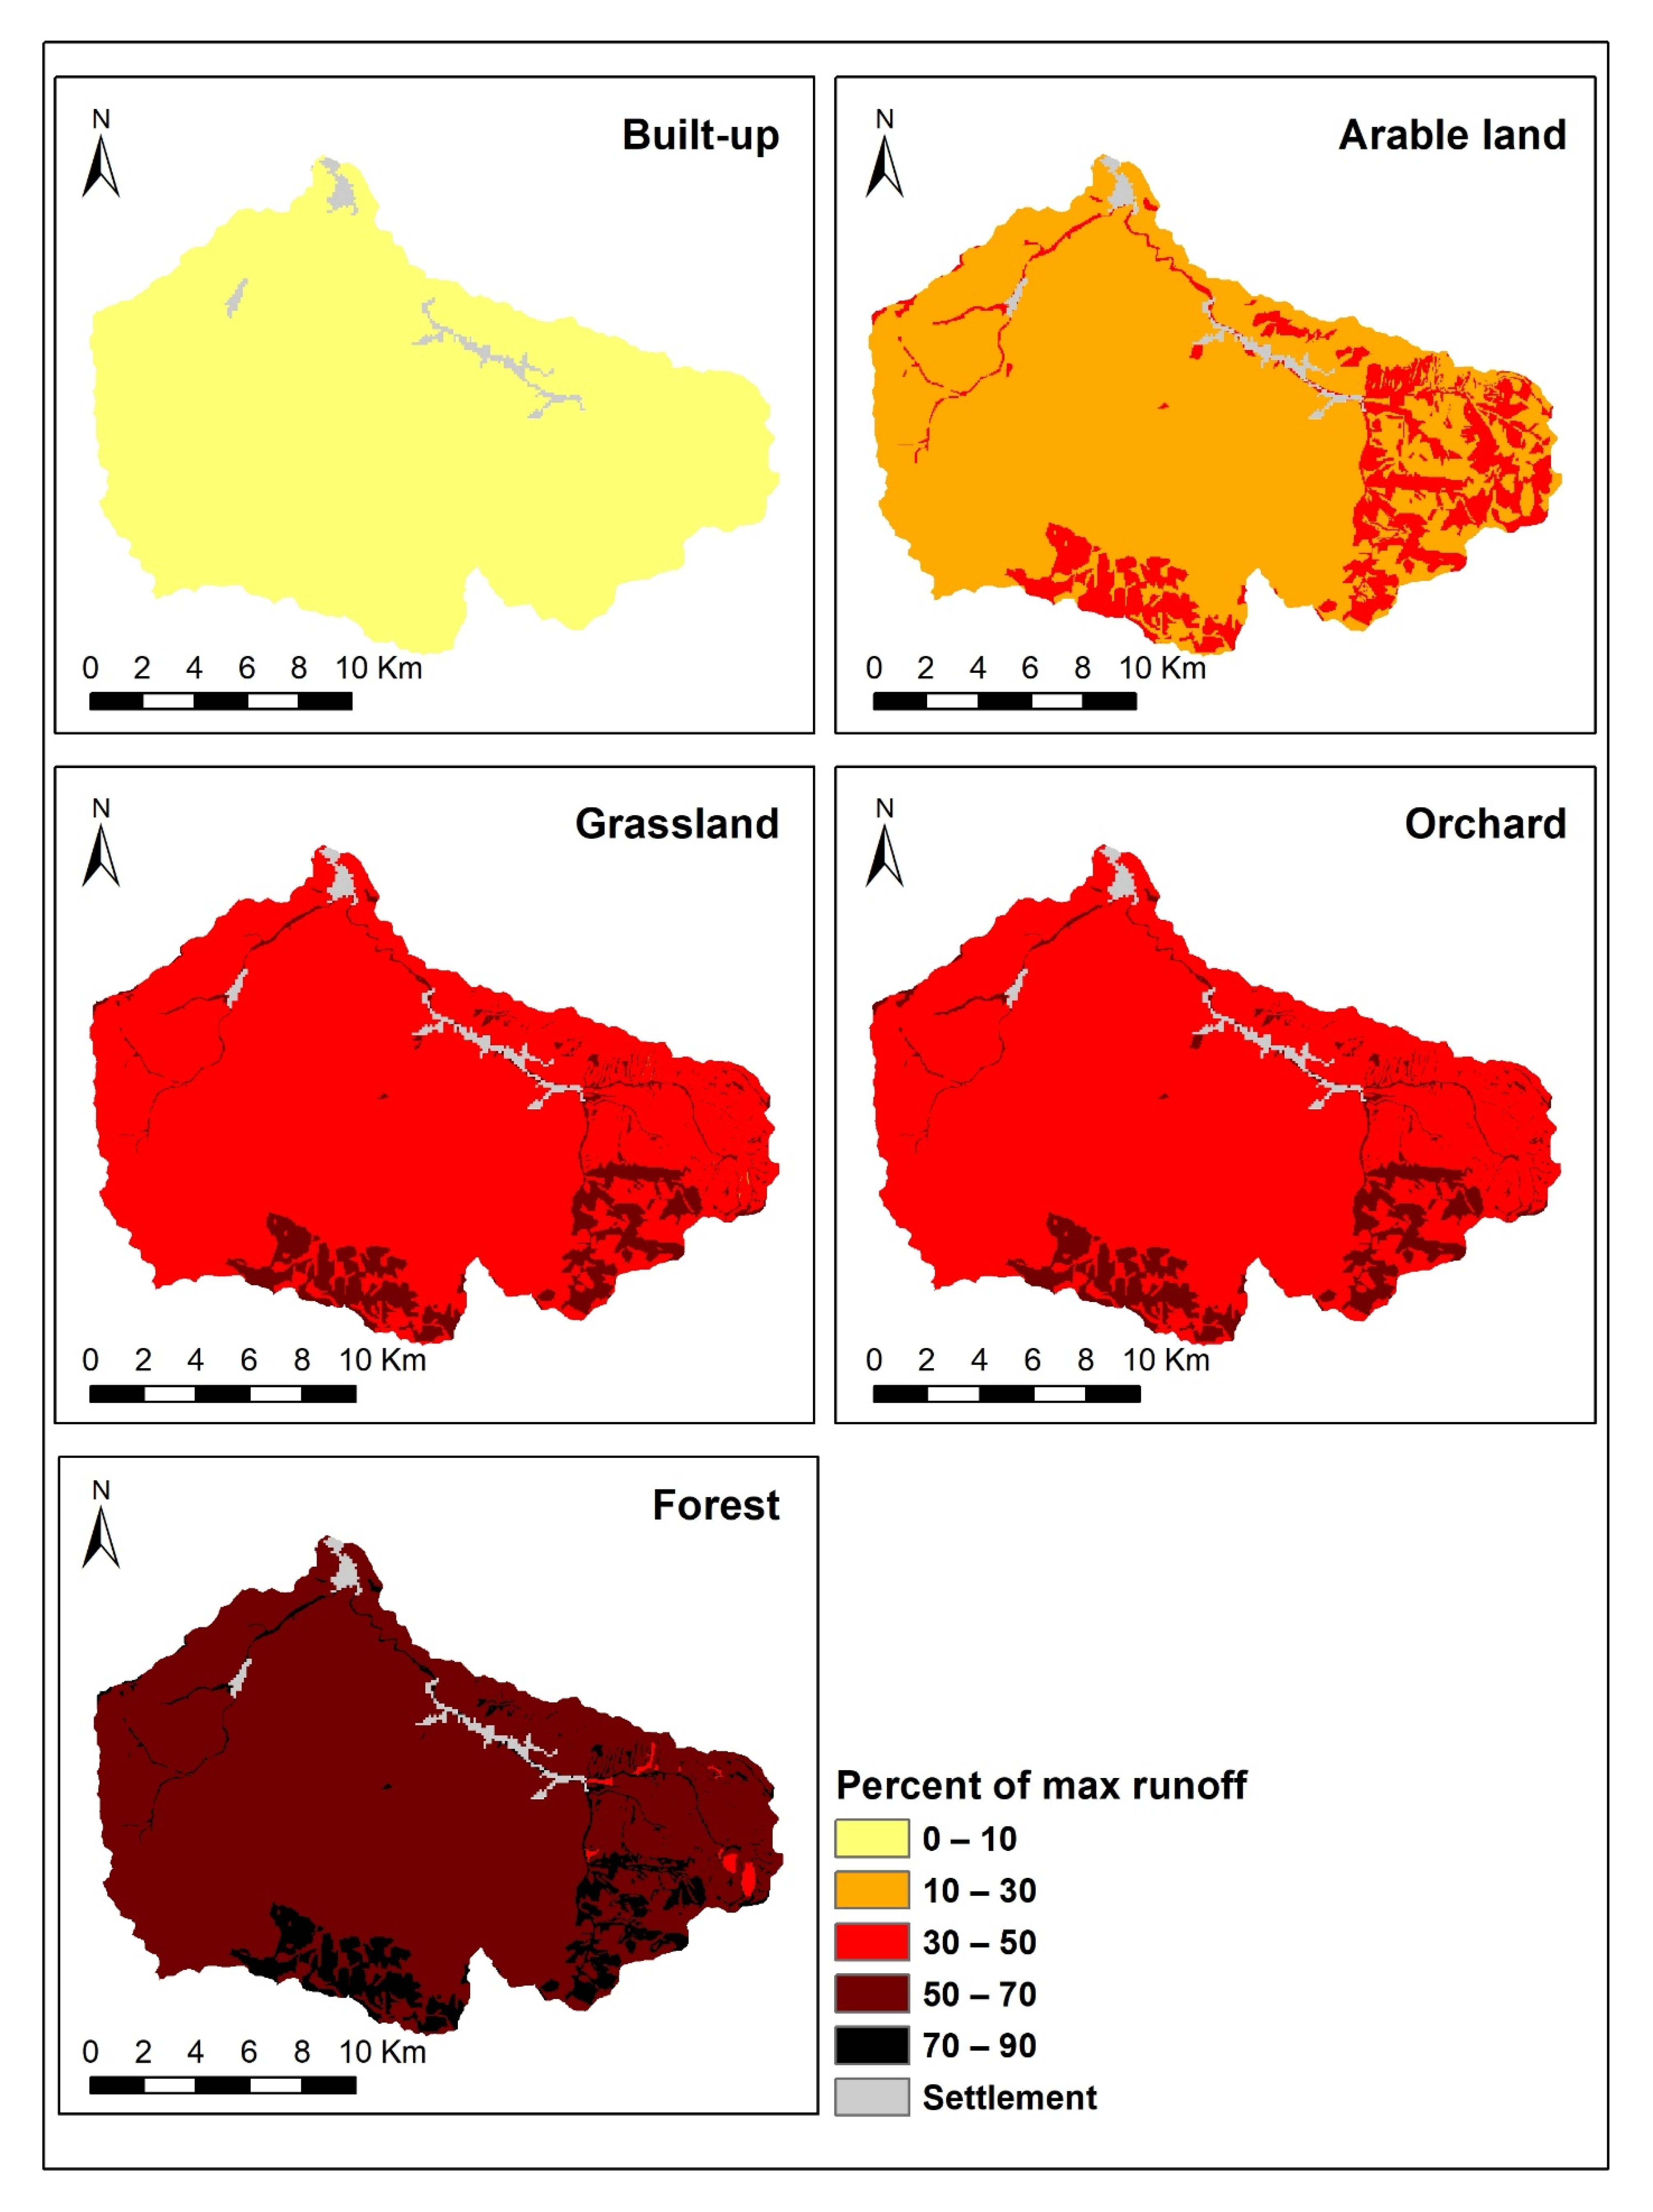
2.2. Modelling Surface Water Runoff

The volume of runoff water was modelled applying the SWAT model [56]. This model requires input parameters to describe soil properties, topography, land use, land management, and climate. It simulates watershed processes by first dividing the basin into sub-watersheds, and then further dividing the sub-watersheds into unique land use, soil, and slope combinations called hydrologic response units (HRUs). Modelled runoff (result of SWAT) served as an input into the HEC-RAS model [57] that showed whether the river channel safely discharges the modelled flow or if it is spilled from the banks. In the HEC-RAS modelling, steady flow analysis with mixed flow regime and critical deep boundary condition was applied. Subsequently, the extent of the flood was modelled using the HEC-GeoRAS extension of the ArcGIS software. The necessary inputs for modelling water runoff in the river channel and the subsequent extent of floods were (in addition to the above-mentioned): shape (channel geometry), capacity of the river channel (cross-sectional cut lines), and Manning’s roughness coefficients of surface for the channel and for the land use. A database and polygon layer were created in ArcGIS 10.3 software. Relief inputs into the applied models were derived from 10 m digital elevation mode (DEM 3.5) provided by the Geodesy, Cartography and Cadastre Authority of the Slovak Republic [58], and all analyses used 10 m resolution. Soil characteristics were derived from the soil databases provided by the National Forest Centre [59] for forest soil and the Soil Science and Conservation Research Institute [60] for agricultural soil. National soil databases were transformed accordingly to the FAO classes required by the SWAT model [61]. Climate data input into the SWAT model came from the SWAT Weather Database [62] and from the Slovak Hydrometeorological Institute [63]. River channel transverse profiles were derived from DEM and verified and refined by field measurements. Land use was derived from actual (2018) high-resolution (25 cm/px) orthophoto maps [58] and refined by field mapping. Spatial information about the location, size, and type of buildings and other infrastructure in the area was derived from several sources: Geodesy, Cartography and Cadastre Authority of the Slovak Republic [58], Slovak Road Administration [64], Slovak Environment Agency [65], and OpenStreetMap [66]. Precipitation and river discharge data were provided by the Slovak Hydrometeorological Institute [63] and the Slovak Water Management Enterprise [67].

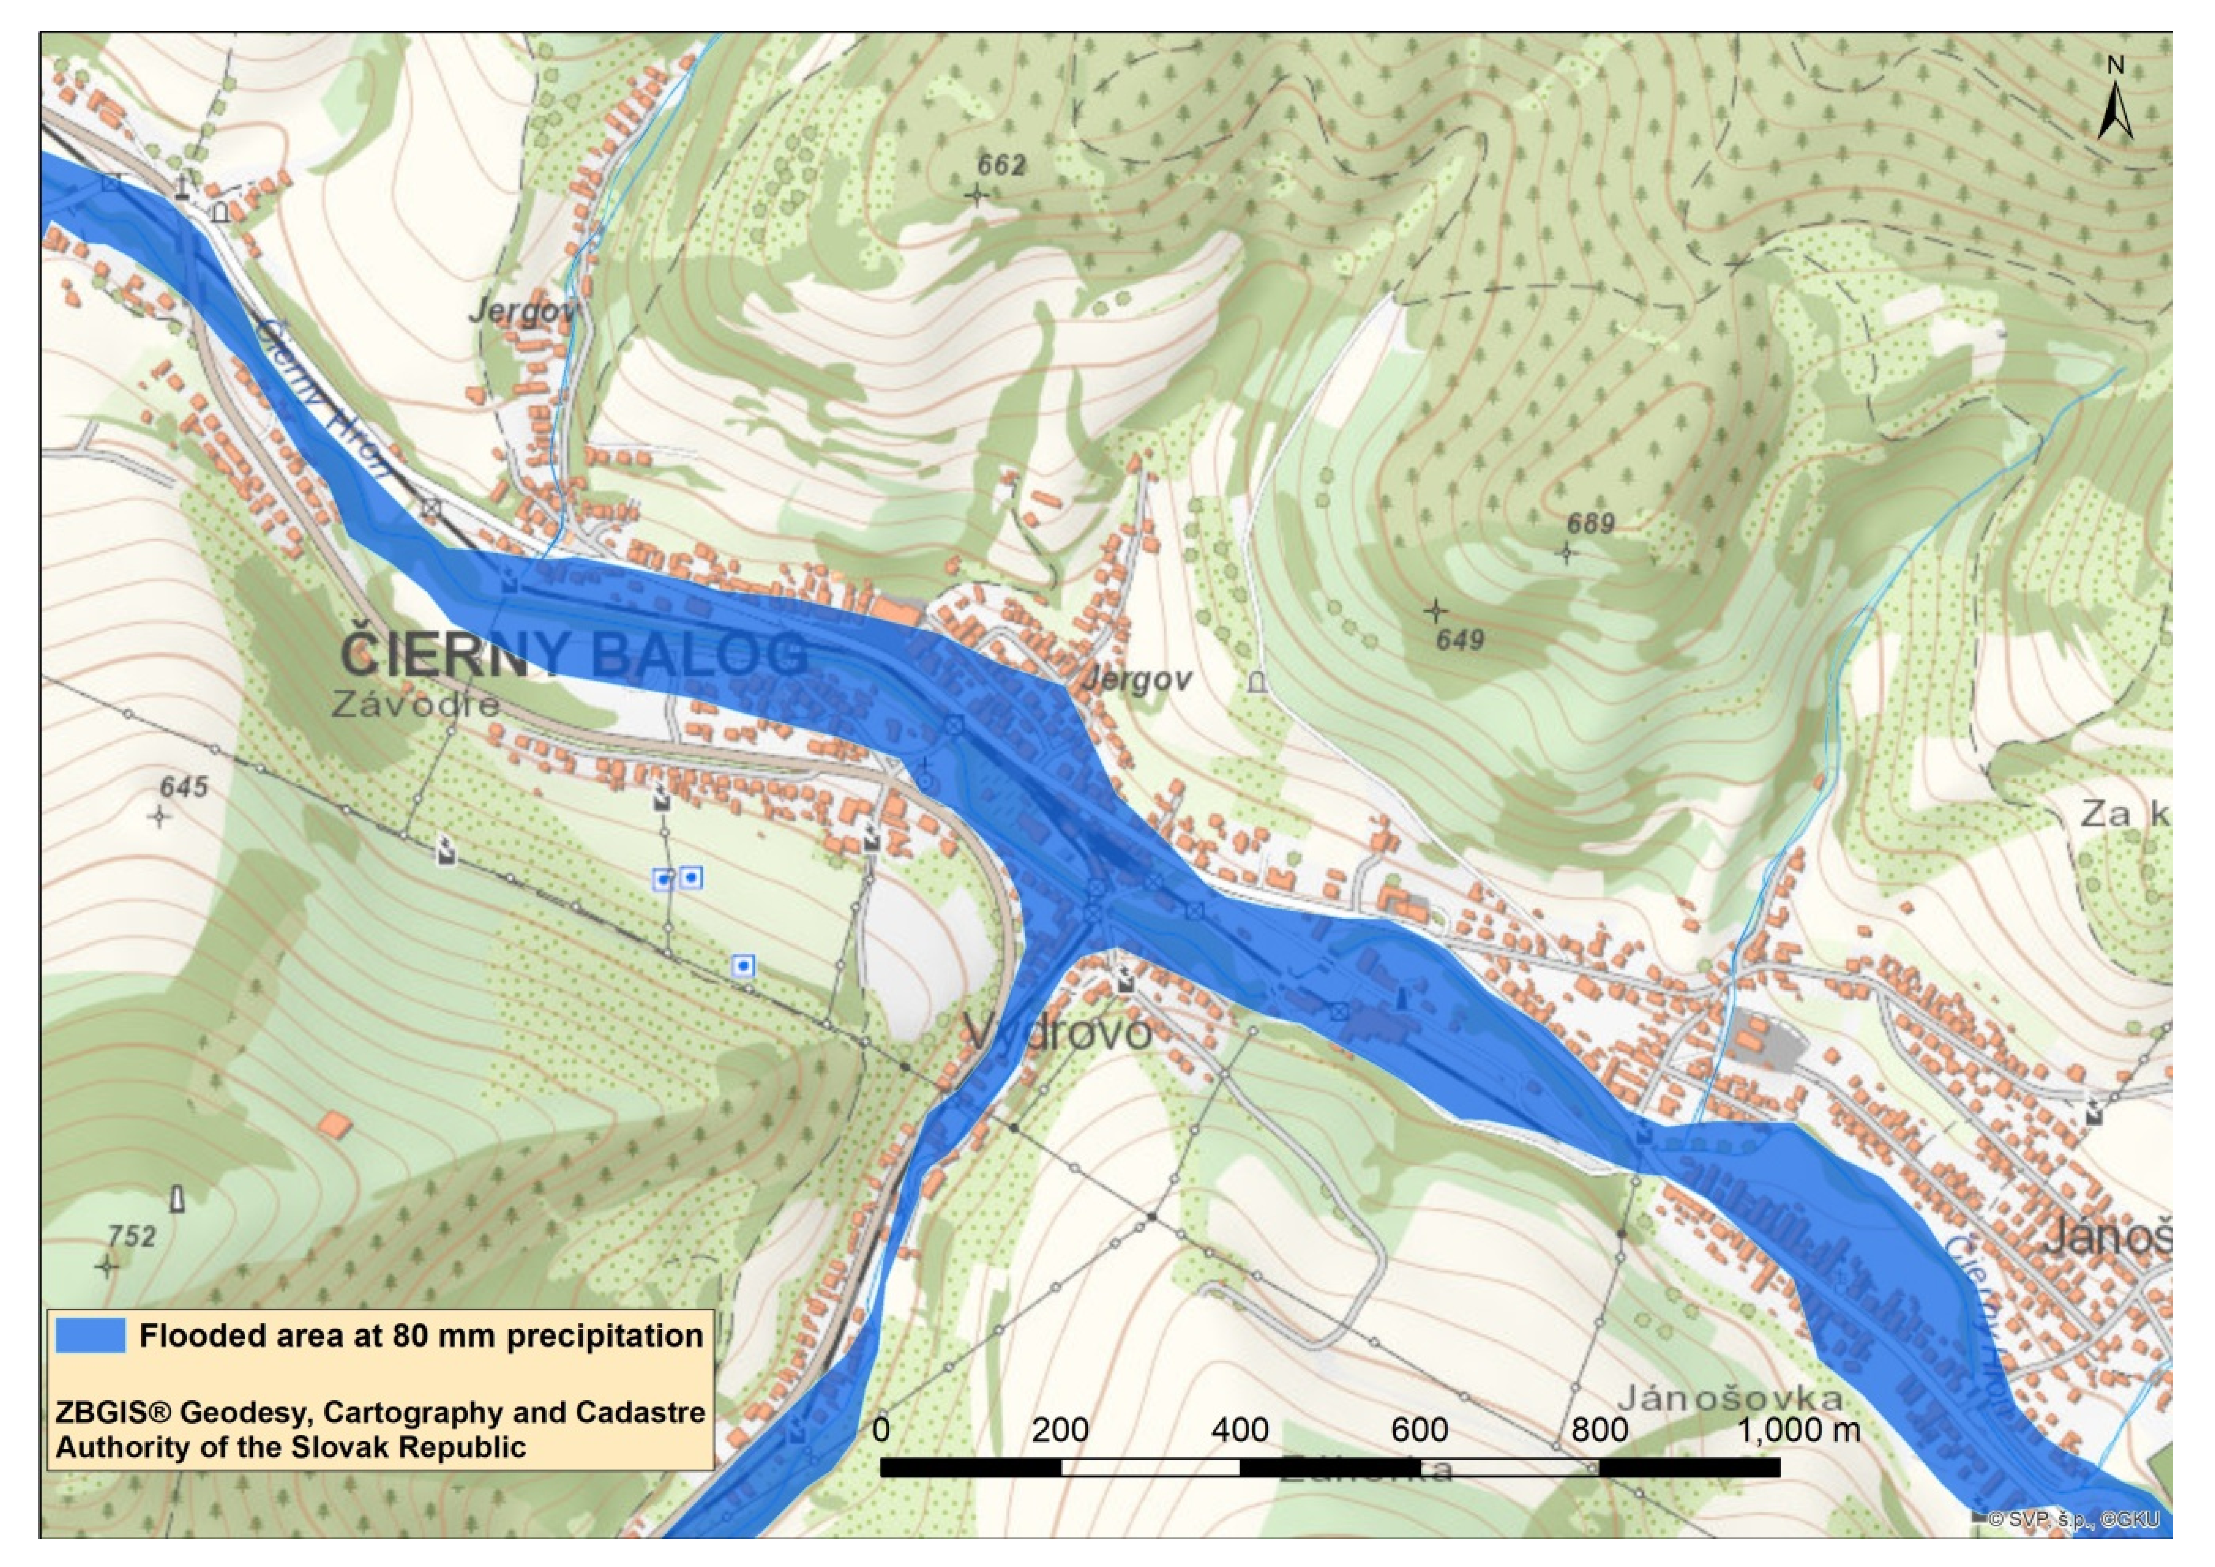
2.3. Determination of the Precipitation Amount Causing Floods with Different Land Uses

Since flood protection ES is a service protecting against natural hazards, it was necessary to determine the size of the threat—the extent of the endangered and potentially flooded area and the probability of the precipitation capable of causing floods. Based on the available climate data [55,63,68], it was deduced that for the study area, it is possible to count on the maximum daily amount of precipitation with a recurrence interval of 100 years with a value of 75–80 mm (for the whole river basin). Using the SWAT model, the SCS Curve Number Method [69,70] was applied to model runoff volume in the area and flows in the river channels for four levels of potential daily precipitation, which would evenly affect the entire basin, namely 60, 80, 100, and 120 mm with the current land use. For the same precipitation levels, runoff volume and flows were modelled also for the hypothetical land uses—when the whole river basin (except for existing built-up areas) was used in one way. Five different hypothetical land uses were modelled: forest, permanent grassland, arable land (“row crops/straight row good” in the SCS method), orchard, and built-up area (in the sense of discontinuous urban fabric consisting both of impervious surfaces and pervious green areas such as lawns or gardens). These considered land use types either already exist in the area or are feasible to plan for (i.e., fruit orchards) due to the local natural and socioeconomic conditions. Subsequently, the land use and the amount of precipitation at which the capacity of the river channel is exceeded were modelled in the HEC-RAS program. The corresponding extent of flooding was modelled using HEC-RAS (Figure 2).

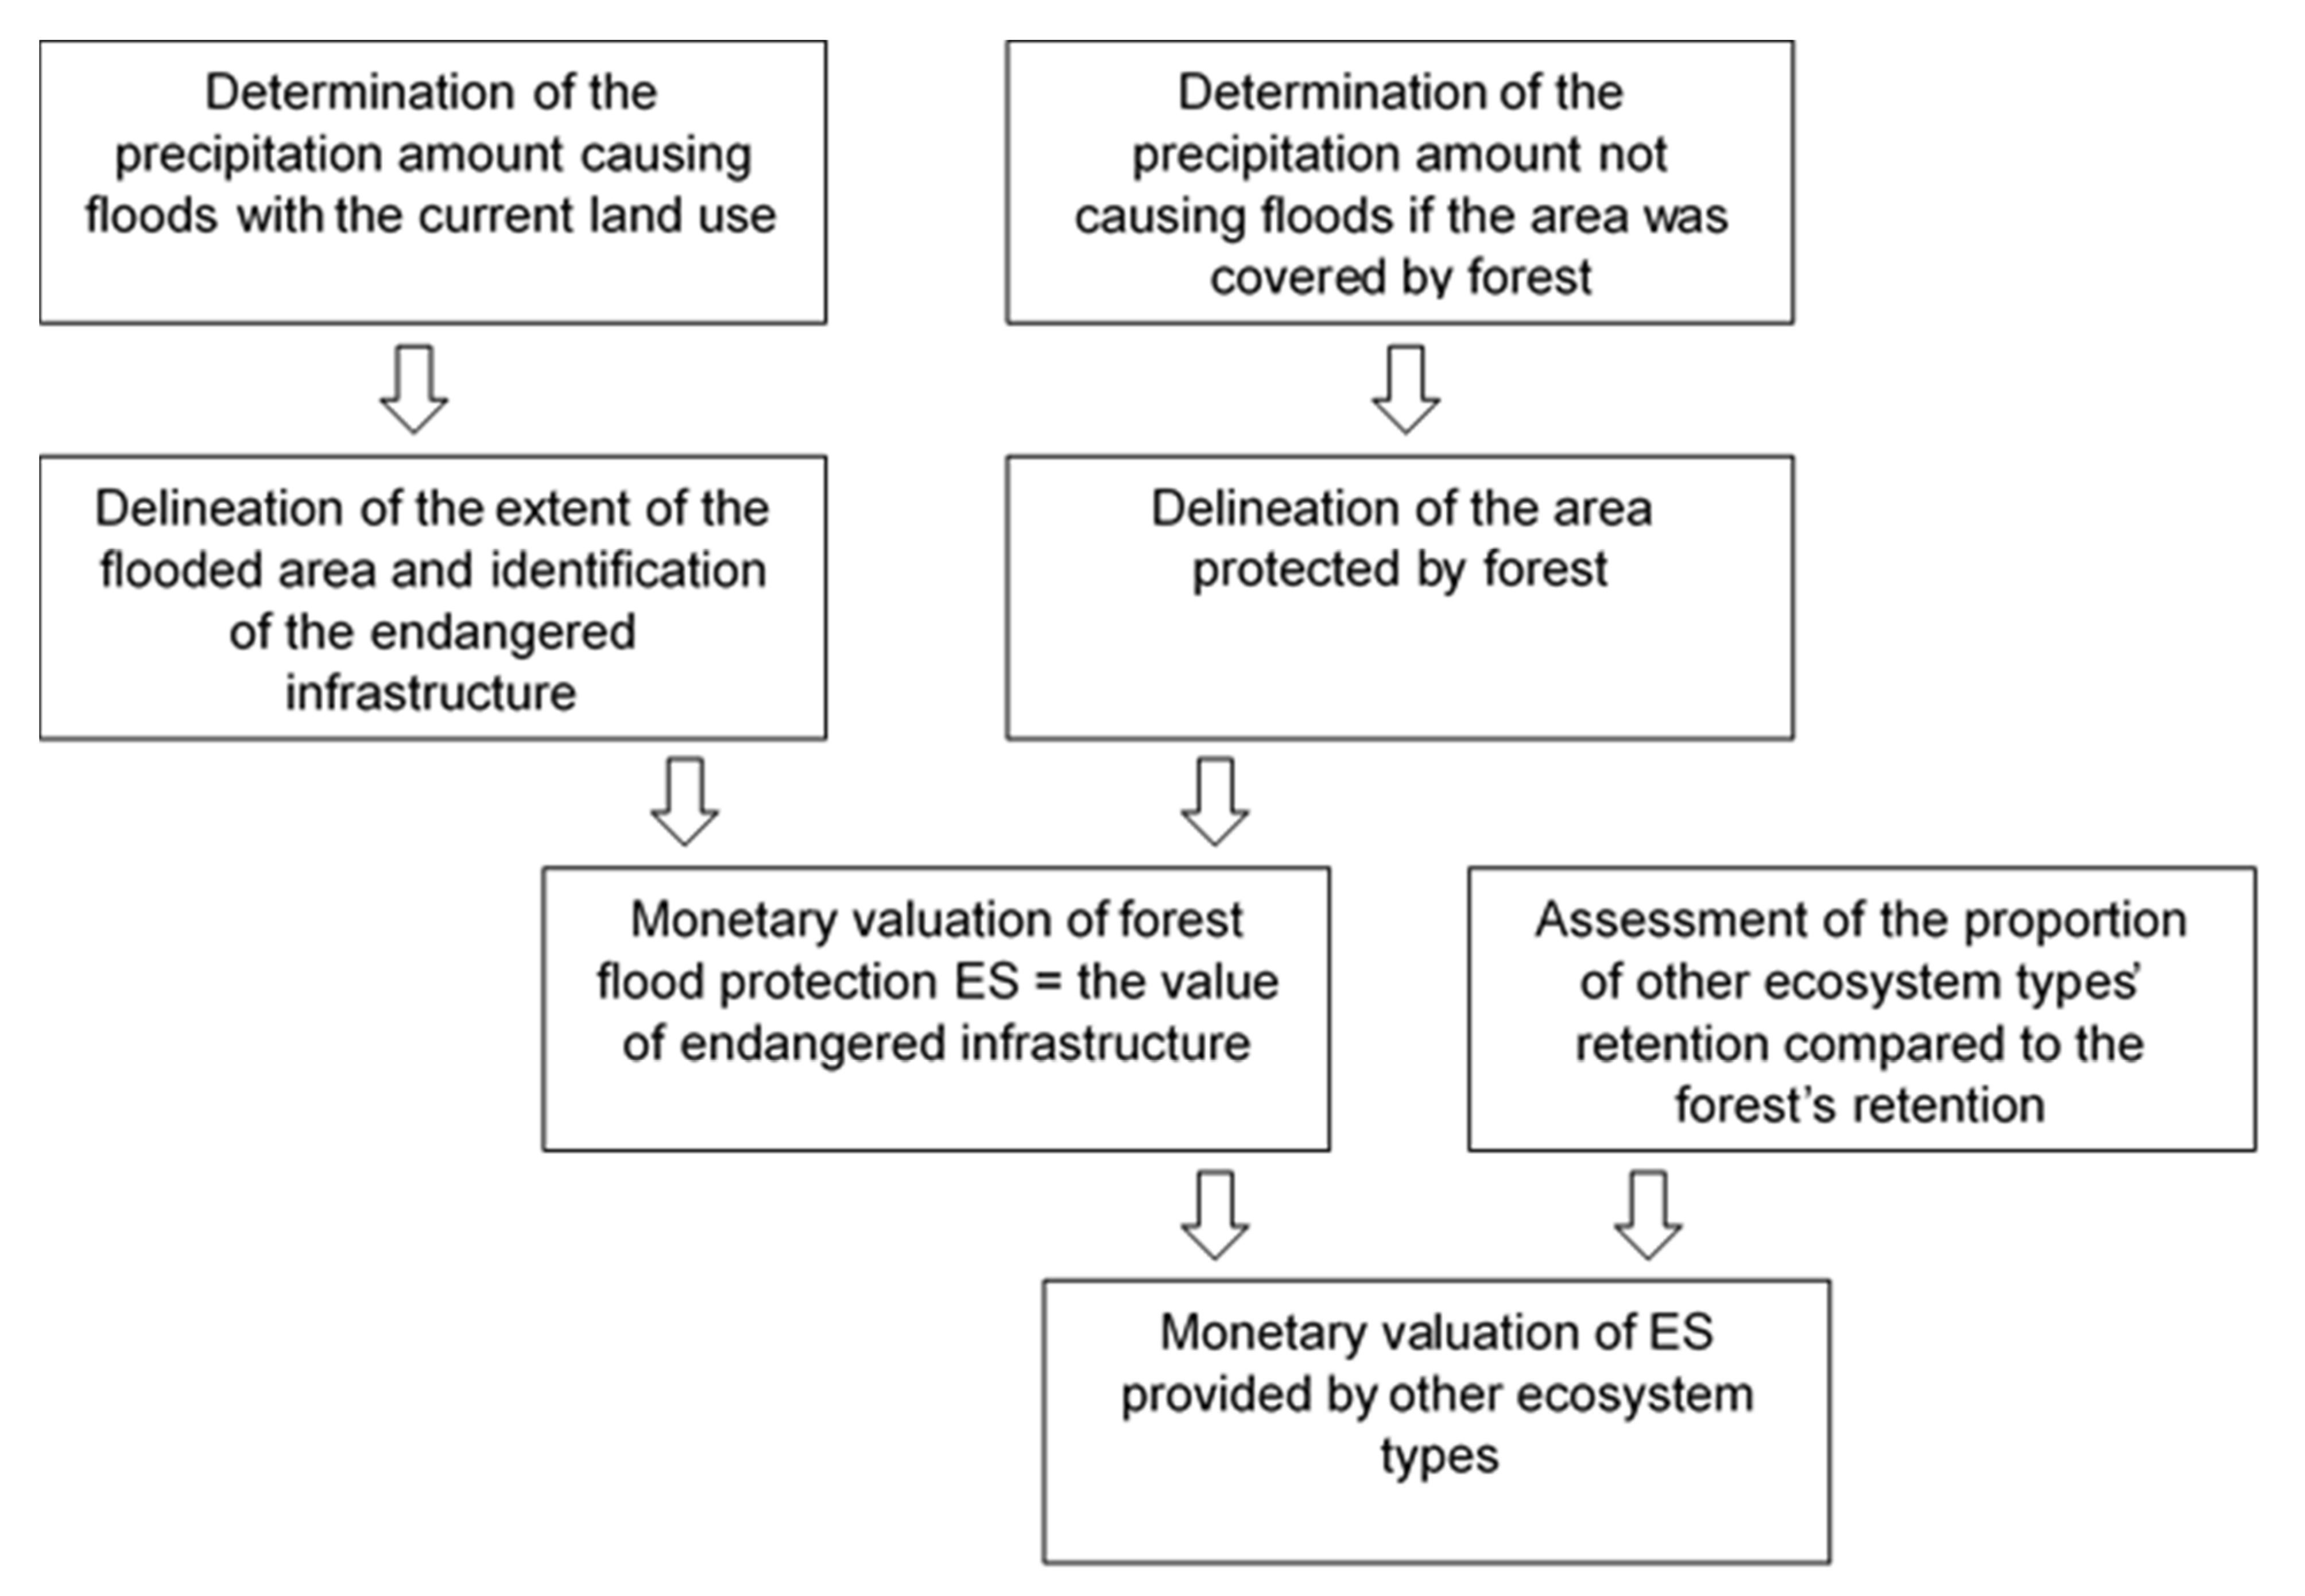
2.4. Monetary Valuation of Flood Protection Ecosystem Service

Considering forest as the ecosystem that provides the best flood protection service, it was assumed that the value of its protection is equal to the value of the infrastructure that would be flooded after the precipitation which is already causing a flood (with the current land use). On the other hand, hypothetically, if the whole area was covered by forest (except for existing settlements), this precipitation (runoff) would be safely drained by a river channel and would not cause floods. The cost of damage to the endangered infrastructure (residential buildings, farm and industrial buildings, road and railway network) was calculated according to the methodology for estimating the cost of flood damage caused by floods by the Water Research Institute of Slovakia [71]. This cost was considered as the total cost of the forest ecosystem service in the whole river basin (except for already built-up areas).
However, individual areas in the basin contribute to the total runoff in different proportions depending on the location, soil conditions and slope. Therefore, for each individual area (hydrology response unit—HRU), its share of the total runoff was determined. This also determined its share of the infrastructure protection, which represented the value of the forest ecosystem service in the area of the unit concerned (share of the total ES value of the forest in the whole river basin). Subsequently, the value of the ecosystem service was re-calculated to the cost per ha.
The cost of ecosystem services of other ecosystem types (in the sense of land use types) is lower than that of forest since their retention capacity is lower. The results of runoff modelling for different potential land uses of the whole area (grassland, arable land, orchard, built-up area) show how much higher the water runoff from each HRU was compared to if the HRU was covered by forest. In other words, how much less water the other ecosystem type retains compared to the forest. The cost of the ecosystem service of the given ecosystem is then lowered by the given ratio compared to the cost of the ES provided forest in the given area (Figure 3). The cost of the ecosystem service for each area in the territory of other ecosystems was calculated on the basis of the formula:
Cost ESOE = Cost ESF × ((Rmax − ROE)/(Rmax − RF))
Cost ESOE—cost of other ecosystem types
Cost ESF—cost of forest ecosystem service
Rmax—maximum runoff from impervious surface
ROE—runoff from other ecosystem types (different to forest)
RF—runoff from forest

3. Results

Modelling of runoff volume with different precipitation amounts and the current land use in the area and the subsequent modelling of flood threat in the basin (the capacity of the river channel to drain runoff safely) show that 60 mm precipitation per day (without cumulation with precipitation from previous days—antecedent moisture condition (AMC II)), would not cause flooding and the study area is able to deal with it. However, a higher rainfall would already cause a flood. The modelling results also show that if the whole area (except for existing built-up areas) was covered with forest, the flood would not occur, even at 80 mm precipitation. Nevertheless, floods would occur with higher precipitations (100 and 120 mm per day). For this reason, the value of 80 mm precipitation per day became the basis for determining the flood protection ecosystem service. Precipitation of this magnitude occurs in the study area with a probability of approximately once every 100 years [63,68]. Figure 4 shows the ratio of runoff reduction from a rainfall of 80 mm per day for the five considered land use types (types of ecosystems), if they covered the whole territory (except for existing settlements), compared to the maximum runoff (as from completely impervious surface). Based on the modelling results, forest in most of the evaluated area, depending on other natural conditions, retains from 60 to 90% of the theoretical maximum runoff. Orchards are capable of retaining approximately 40–70% on the runoff, and grasslands retain slightly less. They retain about 40–70% in the upper half of the territory, but only between 30 and 40% in the lower half of the territory. Arable land is capable of retaining only up to 20–40% of the maximum runoff, while built-up areas reduce runoff by only 2–5% compared to the completely impervious surface.
Modelling the extent of the flood (Figure 2), with the current land use and precipitation of 80 mm per day, identified the endangered infrastructure (buildings, roads, railways, etc.). The monetary value of the infrastructure was calculated as 20,365,400 euros. This value is the cost of the flood protection service of the forest in the whole territory, if it covers the entire area of the river basin (except for already existing settlements). The cost of a specific area of the forest ecosystem reflects its ability to retain water and it was determined as a share of the whole cost. This share represents a contribution of each HRU (Figure 5) to the total runoff (contribution to the protection of the area), which depends on HRU’s location, soil conditions, and slope.
As Figure 6 shows, the cost of this service per ha of the forest is in the range of 1626–1710 euros. Other types of ecosystems are able to retain less runoff water (Figure 4), therefore the cost of their flood protection service reflects this reduced capacity. When comparing water retention in the area for different types of ecosystems compared to the forest retention (Figure 7), orchards retain 72–82% of the amount of water retained by the forest. Grassland retains slightly less, 65–76%, and arable land between 42 and 56%. Built-up areas retain only 5–7% of the amount retained by the forest. These ratios express the share of other ecosystem types in flood protection in a specific place compared to the forest. As this value is lower, they do not fully protect the endangered infrastructure at a precipitation of 80 mm/day as the forests do, therefore the cost for this service is lowered according to this ratio. The resulting costs, calculated per ha of the basin area for each considered ecosystem (land use), are shown in Figure 6.
In the case of orchards, the cost per ha ranges from 1192 to 1378 euros depending on the conditions (location, natural conditions). Grasslands retain a little less rainwater compared to orchards, so the cost for flood protection ES is slightly lower and ranges from 1072 to 1280 euros. The magnitude of flood control on arable land depends on the crop grown and the management performed. Here, for the sake of simplicity, “row crops/straight row good” management (the SCS method) was considered. The calculated cost per ha is in the range of 700–950 euro. Compared to the previous land use types, the ability of residential areas to retain water is considerably reduced, as a large part is built-up and therefore impermeable. All existing settlements within the study area are characterized as discontinuous urban fabric, and the cost of their capability to reduce runoff ranges from 80 to 112 euro per ha. The costs for the flood protection ecosystem service shown in Figure 6 are hypothetical, valid for a specific area in the case of the existence of a given type of ecosystem in a given area. These values can also be used to compare the current situation and possible change to another type of use.
Figure 8 shows the costs of the flood protection ES with the current land use. Despite the fact that almost 80% of the area is covered by forest, and thus most of the area retains 60–90% of the maximum runoff, according to the modelling results, floods would still occur with a precipitation of 80 mm per day, even if there was good forest management. On the other hand, in the case of intense management (clear-cutting, dense road network), floods would occur even with lower precipitation. The cost of the flood protection ES of current ecosystems ranges from 300 euros for arable lands to 1710 euros for forest ecosystems.
Figure 9 presents the cost of the flood protection ES, which society would either gain or lose if the current ecosystem were changed into an alternative one. This comparison makes it possible to identify specific spots in the river basin that are most sensitive to change. In other words, areas where the change in the current land use to one of the five evaluated types would lead to the largest reduction in the performance of the ecosystem service, and to the largest increase in performance. Similarly, it is possible to identify areas whose change to another land use will cause the least loss of performance of the flood protection ES. If the current land use is changed to a forest ecosystem, the cost of ecosystems would remain the same in most areas, as 80% of the area is already covered by forest. Nevertheless, the ES value would increase from 200 to 1010 euros for the remaining 20%. On the other hand, changing to other land uses (besides forest) would reduce the size of the flood protection service in most areas.
Changing to an orchard in the areas that are currently covered by forest would reduce the value of the flood protection ES service by 200 to 600 euros per ha, depending on the location and abiotic characteristics of the area. On the other hand, changing to areas that are currently more intensively used to an orchard, especially in the immediate vicinity of settlements, would increase the value of the ecosystem service by up to 600 euros per ha. Deforestation and the consequent change into grasslands decrease the value of the ecosystem service by 200 to 600 euros per ha. However, changing current arable land into grasslands would increase the service value by up to 600 euros per ha. Changing the current land use into arable land would reduce the size of the service in 95% of the territory, and in monetary terms it would mean a reduction of 200 to 1000 euros per ha. Expansion of settlements would reduce the value of the ecosystem service throughout the territory, depending on the location and natural conditions, by 620 to 1630 euros per ha.

4. Discussion

Land use and land management influence the land system’s properties, processes and components, which are the basis of service provision. A change in land use management will therefore cause a change in service supply, not only for specific services but for the complete bundle of services provided by that ecosystem [11]. Our spatial approach followed this principle and it presented a way to quantify these potential changes in use and their impact of the flood protection ES provisioning. However, [72] called for caution in evaluating the results of modelling hydrological processes in relation to land use change, especially the sensitivity of the relationship between land use change and flood conditions with increasing return period of the simulated peak flow. In addition, [73] noted that the influence of land use conditions on storm runoff generation is only relevant for convective storms with high precipitation intensities, in contrast with long-lasting advective storms with low rain intensities.
According to [31], ecosystems affect water balance mainly through two processes: interception and infiltration. Interception depends on the structure of the ecosystem above ground (land cover), while infiltration is strongly determined by the soil properties. Surface runoff, which is the main factor for flood formation, also depends on abiotic factors such as bedrocks and topography. Ecosystems (i.e., forests) redirect or absorb parts of the incoming water (from rainfall), reducing the surface runoff and consequently the amount of river discharge. This ecosystem service plays its role before flood occurrence, and in some cases, it can even prevent it. Hence, flood protection ecosystem service assessments should conform to the biophysical characteristics and the likelihood of a flood in a particular area. [31,48] assessed the capacities of different ecosystems to regulate floods through investigations of water retention functions of the vegetation and soil cover. They applied the catchment-based hydrologic GIS model AGWA (and its constituent models KINEROS and SWAT) to express the capacity of the flood protection ES of individual types of land cover using biophysical methods (taking into account infiltration, surface runoff and peak flow). This biophysical assessment was then complemented with a comparison of regional supply–demand balances, with demand expressing the degree of vulnerability defined as “the characteristics and circumstances of a community, system or asset that make it susceptible to the damaging effects of a hazard”.
In the presented approach, the extent of the area and the amount of precipitation at which forest would be able to completely protect the area was determined. These results were applied in the estimation of the cost of the ecosystem service. For the practical use of the ES concept, it is necessary to express the value of the ecosystem service in a specific area (i.e., at the habitat level or topical dimension) with its specific properties with respect to the effect of surrounding ecosystems (choral dimension or landscape patterns and spatial relationships of ecosystems) and how this value changes when changing the use of area and/or changing any of the surrounding ecosystems [74,75]. The applied approach follows the SCS curve number method [61,70], which is based on the assumption that the forest performs flood protection (retention) best. As noted by [76,77], the impact of forest and increasing afforestation on hydrological regulations may not be clear, especially in areas with a lack of precipitation and in river basins above 1000 km2, where there is a great variability of factors (climatic conditions, urbanization, dam construction). However, this is not the case in the study area. In the Carpathian Mountains, many authors have confirmed that forests perform this service best and they are capable of retaining rainfall up to 50 mm [78,79,80]. This indicates that higher rainfalls will not be fully infiltrated and cause runoff. However, as shown by the modelled results, precipitations up to 80 mm will be drained safely by the existing river channels in the study area. On the other hand, the capacity of forests to provide ecosystem services strongly depends on the actual forest management [16], especially the size of the clearing area and the density of forest roads that could accelerate surface runoff. Nevertheless, none of the possible natural threats or anthropogenic pressures, i.e., negative impact of the intensive forest use, were included in the presented assessment. This might be the reason that, despite the high forest coverage, the study area has experienced numerous floods, resulting either from long-term precipitation or melting of snow, and flash floods triggered by intense summer precipitation in the past [54].
However, the impact of vegetation on water flow is very complex. For example, [81] presented a new procedure to assess drag forces and plant hydrodynamic bending as a function of the stem basal diameter and modulus of elasticity. They also presented other possibilities of calculating the surface roughness of the river channel (vegetation friction forces) for water flow depending on vegetation type (woody plants), its density (frontal projected area) or their elasticity. Other authors [82,83] used more detailed calculation models based on field measurements of flow velocity and morphological vegetation parameters (main morphometrical vegetation features) to determine global water flow resistance (i.e., stem diameters and heights, and bed surface density). [84] proposed an experimental methodology and their results demonstrate the reliability of the Keulegan equation in predicting the flow resistance. Based on the obtained results, a model to evaluate the Nikuradse equivalent of sand-grain roughness starting from the vegetation height and density was proposed and tested. Although these methods are more accurate, a simpler expression using Manning’s coefficient was applied in our approach, as it is required as an input by HEC-RAS. More precise methods may be used in the future to refine the modelling of the water flow in the river channel and the possible over bank spills. However, our approach does not aim to refine water flow models, but it focuses on using existing models to determine the value of flood protection ES. Obtaining more precise results on flood risks by using alternative modelling is welcomed but it would not change the proposed methodic steps for determining the ES.
Since regulation services produce or maintain desirable environmental conditions, societal demand should be expressed as the amount of regulation needed to meet a desired end condition [16]. In evaluating disasters and natural hazards, many authors emphasize the need to focus not only on determining the location (spatial distribution), intensity or period of recurrence of natural hazards, but also on determining vulnerability, which depends on the number of people, infrastructure, or ability to deal with the event psychologically or economically, etc. An excellent example of economic risk evaluation in relation to flood hazards was presented by [85,86]. Their basic concept is similar to our case study—to determine the extent of the threat of economic damage in floods with different return periods using hydrological modeling. Their determination of the extent applies probability methods using intensity–duration–frequency (IDF) curves of rainfall height for a return period (derived for the Apulia Region in Southern Italy), by expressing the probability of flood hazard occurrence as also applied by [87], using market costs (unit market values) in determining the economic value and other methods of quantitative risk assessment in terms of monetary values. Our approach focuses more on deriving the value of the ecosystem service for a specific ecosystem. In many ways, our methodic steps are simplified compared to these cited articles and our approach undoubtedly has some constraints related to many drivers, i.e., there are also newer methods in hydrological modelling [88,89]. Despite these limitations, our method makes it possible to express the value of the flood protection ES, and these more precise procedures will serve as inspiration for the further improvement of our approach.
In order to analyse trade-offs between competing ecosystem services, [90] compared the benefits of anti-erosion regulation service regulation water erosion of individual ecosystems versus benefits from crop production of these ecosystems. They evaluated the change in the resulting benefits for the whole area after proposing decreasing intensity of land use (on steep slopes, marginal sites, or habitat connectivity support) to 7% of the territory. It is a very beneficial concept that can be used in argumentation with stakeholders when discussing environmental management of the landscape [91,92]. Even more so, when managerial decisions regarding competing trade-off are based on a comparison of financial benefits or losses.

5. Conclusions

Despite flood protection being considered one of the crucial ecosystem services that builds on an extensive and robust hydrological research, there are still aspects that need further development. These aspects reflect the complex character of hydrological processes both affecting and affected by several economic sectors and a need for the implementation of flood assessment results to land management and planning. This is even more important in land management systems that deal with several formally separated sectoral management policies (spatial planning, agriculture, forestry, water management, and the environment). These sectors have a legal competency over the same territory; however, their managerial and economic interests often diverge, thus successful decision making processes require a common denominator in the form of a monetary valuation of competing trade-off.
In this paper, this challenge was addressed by combining hydrological modelling methods, the method of non-market monetary value for estimating avoided damage costs, and flood risk assessment methods into a rather simple, yet methodically robust, approach. The innovation of the method lies in the fact that on the basis of existing available hydrological models (for which relatively easily accessible data such as DEM, soil map, climatic data, or river channel profiles are required as inputs), it enables repeated operational determination of the extent of endangered property with the current land use, and when changing land use. The available hydrological models can be replaced by newer and more accurate models, depending on more detailed and accurate data being made available (i.e., LIDAR). At the same time, this method also makes it possible to determine the highest level of protection by natural ecosystems (i.e., forests in Slovakia) and, on the basis of this, comparison to determine the monetary value of the ecosystem service (and not just express it in biophysical units) can be performed.
The approach consists of independent and open modules enabling further fine-tuning in order to fit any local natural conditions or available underpinning data. A further development of the method could be the inclusion of forest management intensity or forest road networks as surface runoff accelerators. Although these phenomena were not addressed in the current state of our research presented in this article, the impact of forest management can be applied as a water retention parameter in the follow-up research. Monetary valuation based on damage avoided costs is only one of several feasible methods of estimating flood protection cost. This method was applied as it is an officially recognized method by the national authority. However, flood-related costs also cover prevention costs (construction or maintenance of water channel) and emergency costs or other site- or society-specific costs that could be applied in the assessment in future.
Climate change is leading to an increase in the frequency of extreme (very intense rainfall) storms, which alternate with ever-increasing periods of drought. Therefore, it is important to determine the capacity of ecosystems to retain water, both as protection against floods and, on the other hand, for mitigating drought in the periods between precipitation events. If this existing capacity is not enough in light of the forthcoming changes, it will then be necessary to propose changes in land use and various possible biotechnical measures to ensure sufficient capacity.
Land use management can significantly reduce flood flows in catchments, particularly within the localities where most of the runoff is generated. River and water resource managers or decision-makers should concentrate on enhancing the ability of ecosystems to infiltrate and retain precipitation. The optimal landscape structure, suitable management of natural resources, rational management of current and planned human activities, revitalization and re-naturalization of the landscape and river channels should be of interest for decision-making authorities. The proposed method allows the identification of areas (HRUs) that are more important regarding water retention due to their site conditions, thus deserving higher attention. This is particularly important in land management since it stresses the spatial relations of natural processes in landscape, which are often neglected in other sectoral policies. In addition, it has a strong potential also for building and/or maintaining green and blue infrastructure in the landscape. Information on the monetary values of flood protection provided by the existing and by the planned land uses allows competent and well-based decision-making processes (i.e., suitable forest management vs. reconstruction of channels).

Author Contributions

Conceptualization, I.G. and B.O.; methodology, I.G., B.O., Z.G., T.L.; data curation, field mapping, hydrological modelling and spatial analysis I.G. and Z.G.; writing—original draft preparation, I.G. and B.O.; writing—review and editing, Z.G. and T.L.; visualization, I.G. and B.O.; funding acquisition and project administration, T.L. All authors have read and agreed to the published version of the manuscript.

Funding

This research was funded by the Scientific Grant Agency of the Ministry of Education of the Slovak Republic, grant number 1/0104/19 “Wood pasture ecosystems of Slovakia”. The APC was funded by the Scientific Grant Agency of the Ministry of Education of the Slovak Republic, grant number 1/0104/19 “Wood pasture ecosystems of Slovakia”.

Institutional Review Board Statement

Not applicable.

Informed Consent Statement

Not applicable.

Data Availability Statement

Publicly available datasets were analyzed in this study. All used data sources are described in Materials and Methods and listed in References.

Acknowledgments

The authors wish to express their gratitude to Richard Charles Scott, B.Ed. for language editing of this manuscript.

Conflicts of Interest

The authors declare no conflict of interest. The funders had no role in the design of the study; in the collection, analyses, or interpretation of data; in the writing of the manuscript, or in the decision to publish the results.

References

  1. Millennium Ecosystem Assessment. Ecosystems and Human Well-Being: A Framework for Assessment; Island Press: Washington, DC, USA, 2005. [Google Scholar]
  2. van Oudenhoven, A.P.E.; Petz, K.; Alkemade, R.; Hein, L.; de Groot, R.S. Framework for systematic indicator selection to assess effects of land management on ecosystem services. Ecol. Indic. 2012, 21, 110–122. [Google Scholar] [CrossRef]
  3. Haines-Young, R.H.; Potschin, M.P. The links between biodiversity, ecosystem services and human well-being. In Ecosystem Ecology: A New Synthesis. BES Ecological Reviews Series; Raffaelli, D., Frid, C., Eds.; CUP: Cambridge, UK, 2010; pp. 110–139. [Google Scholar]
  4. Kandziora, M.; Burkhard, B.; Müller, F. Interaction of ecosystem properties, ecosystem integrity and ecosystem service indicators—A theoretical matrix exercise. Ecol. Indic. 2013, 28, 54–78. [Google Scholar] [CrossRef]
  5. Stürck, J.; Poortinga, A.; Verburg, P.H. Mapping ecosystem services: The supply and demand of floodregulation services in Europe. Ecol. Indic. 2014, 38, 198–211. [Google Scholar] [CrossRef]
  6. Fisher, B.; Turner, R.K.; Morling, P. Defining and classifying ecosystem services for decision making. Ecol. Econ. 2009, 68, 643–653. [Google Scholar] [CrossRef] [Green Version]
  7. Syrbe, R.U.; Walz, U. Spatial indicators for the assessment of ecosystem services: Providing, benefiting and connecting areas and landscape metrics. Ecol. Indic. 2012, 21, 80–88. [Google Scholar] [CrossRef]
  8. Burkhard, B.; Kandziora, M.; Hou, Y.; Müller, F. Ecosystem Service Potentials, Flows and Demands—Concepts for Spatial Localisation, Indication and Quantification. Landsc. Online 2014, 34, 1–32. [Google Scholar] [CrossRef]
  9. Blaschke, T. The role of the spatial dimension within the framework of sustainable landscapes and natural capital. Landsc. Urban Plan. 2006, 75, 198–226. [Google Scholar] [CrossRef]
  10. Pretty, J.; Brett, C.; Gee, D.; Hine, R.; Mason, C.; Morison, J.; Raven, H.; MD Rayment, M.D.; van der Bijlet, G. An assessment of the total external costs of UK agriculture. Agric. Syst. 2000, 65, 113–136. [Google Scholar] [CrossRef]
  11. de Groot, R.S.; Alkemade, R.; Braat, L.; Hein, L.; Willemen, L. Challenges in integrating the concept of ecosystem services and values in landscape planning, management and decision making. Ecol. Complex. 2010, 7, 260–272. [Google Scholar] [CrossRef]
  12. Bastian, O.; Grunewald, K.; Syrbe, R.U.; Walz, U.; Wende, W. Landscape services: The concept and its practical relevance. Landsc. Ecol. 2014, 29, 1463–1479. [Google Scholar] [CrossRef]
  13. Eade, J.D.O.; Moran, D. Spatial Economic Valuation: Benefits Transfer using Geographical Information Systems. J. Environ. Manage. 1996, 48, 97–110. [Google Scholar] [CrossRef] [Green Version]
  14. Bateman, I.J.; Jones, A.P.; Lovett, A.A.; Lake, I.R.; Day, B.H. Applying geographical information systems (GIS) to environmental and resource economics. Environ. Resour. Econ. 2002, 22, 219–269. [Google Scholar] [CrossRef]
  15. Nedkov, S.; Boyanova, K.; Burkhard, B. Quantifying, Modelling and Mapping Ecosystem Services in Watersheds. In Ecosystem Services and River Basin Ecohydrology; Chicharo, L., Müller, F., Fohrer, N., Eds.; Springer: Dordrecht, The Netherlands, 2015. [Google Scholar]
  16. Villamagna, A.M.; Angermeier, P.L.; Bennett, E.M. Capacity, pressure, demand, and flow: A conceptual framework for analyzing ecosystem service provision and delivery. Ecol. Complex. 2013, 15, 114–121. [Google Scholar] [CrossRef]
  17. Vargas, L.; Willemen, L.; Hein, L. Assessing the Capacity of Ecosystems to Supply Ecosystem Services Using Remote Sensing and An Ecosystem Accounting Approach. Environ. Manage. 2019, 63, 1–15. [Google Scholar] [CrossRef] [Green Version]
  18. Barredo, J. Major flood disasters in Europe: 1950–2005. Nat. Hazards 2007, 42, 125–148. [Google Scholar] [CrossRef]
  19. European Environment Agency. River Floods. Indicator Assessment/Data and Maps; Publications Office of the European Union: Luxembourg, 2019.
  20. Stromberg, D. Natural Disasters, Economic Development, and Humanitarian Aid. J. Econ. Perspect. 2007, 21, 199–222. [Google Scholar] [CrossRef]
  21. Smith, K.; Petley, D.N. Environmental Hazards. Assessing Risk and Reducing Disaster, 5th ed.; Routledge Taylor & Francis Group: New York, NY, USA, 2009. [Google Scholar]
  22. Kousky, C.; Walls, M. Floodplain conservation as a flood mitigation strategy: Examining costs and benefits. Ecol. Econ. 2014, 104, 119–128. [Google Scholar] [CrossRef]
  23. Ciscar, J.C.; Iglesias, A.; Feyen, L.; Szabó, L.; Van Regemorter, D.; Amelung, B.; Nicholls, R.; Watkiss, P.; Christensen, O.B.; Dankers, R.; et al. Physical and economic consequences of climate change in Europe. Proc. Natl. Acad. Sci. USA 2011, 108, 2678–2683. [Google Scholar] [CrossRef] [Green Version]
  24. Jongman, B.; Ward, P.J.; Aerts, J.C.J.H. Global exposure to river and coastal flooding: Long term trends and changes. Glob. Environ. Chang. 2012, 22, 823–835. [Google Scholar] [CrossRef]
  25. European Environment Agency. Economic Losses from Climate-Related Extremes in Europe Publications. Indicator Assessment/Data and Maps; Office of the European Union: Luxembourg, 2019.
  26. Tallis, H.; Mooney, H.; Andelman, S.; Balvanera, P.; Cramer, W.; Karp, D.; Polasky, S.; Reyers, B.; Ricketts, T.; Running, S.; et al. A Global System for Monitoring Ecosystem Service Change. BioScience 2012, 62, 977–986. [Google Scholar] [CrossRef] [Green Version]
  27. Goulder, L.; Kennedy, D. Valuing ecosystem services: Philosophical bases and empirical methods. In Nature’s Services: Societal Dependence on Natural Ecosystems; Daily, G.C., Ed.; Island Press: Washington, DC, USA, 1997. [Google Scholar]
  28. Costanza, R.; de Groot, R.S.; Braat, L.; Kubiszewski, I.; Fioramonti, L.; Sutton, P.; Farber, S.; Grasso, M. Twenty years of ecosystem services: How far have we come and how far do we still need to go? Ecosyst. Serv. 2017, 28, 1–16. [Google Scholar] [CrossRef]
  29. de Groot, R.S. Function-analysis and valuation as a tool to assess land use conflicts in planning for sustainable, multi-functional landscapes. Landsc. Urban Plan. 2006, 75, 175–186. [Google Scholar] [CrossRef]
  30. Burkhard, B.; Maes, J. (Eds.) Mapping Ecosystem Services; Pensoft Publishers: Sofia, Bulgaria, 2017. [Google Scholar]
  31. Nedkov, S.; Burkhard, B. Flood regulating ecosystem services—Mapping supply and demand, in the Etropole municipality, Bulgaria. Ecol. Indic. 2012, 21, 67–79. [Google Scholar] [CrossRef]
  32. Boyanova, K.; Nedkov, S.; Burkhard, B. Quantification and Mapping of Flood Regulating Ecosystem Services in Different Watersheds—Case Studies in Bulgaria and Arizona, USA. In Thematic Cartography for the Society. Lecture Notes in Geoinformation and Cartography; Bandrova, T., Konecny, M., Zlatanova, S., Eds.; Springer: Cham, Germany, 2014; pp. 237–255. [Google Scholar]
  33. Posthumus, H.; Rouquette, J.R.; Morris, J.; Gowing, D.J.G.; Hess, T.M. 2010. A framework for the assessment of ecosystem goods and services; a case study on lowland floodplains in England. Ecol. Econ. 2010, 69, 1510–1523. [Google Scholar] [CrossRef]
  34. Turner, R.K.; Pearce, D.; Bateman, I. Environmental Economics: An Elementary Introduction; Harvester Wheatsheaf: New York, NY, USA, 1994. [Google Scholar]
  35. Farber, S.C.; Constanza, R.; Wilson, M.A. Economic and ecological concepts for valuing ecosystem services. Ecol. Econ. 2002, 41, 375–392. [Google Scholar] [CrossRef]
  36. Christie, M.; Fazey, I.; Cooper, R.; Hyde, T.; Deri, A.; Hughes, L.; Bush, G.; Brander, L.; Nahman, A.; de Lange, W. An Evaluation of Economic and Non-Economic Techniques for Assessing the Importance of Biodiversity to People in Developing Countries; Defra: London, UK, 2008. [Google Scholar]
  37. Freeman III, A.M.; Herriges, J.A.; Kling, C.L. The Measurement of Environmental and Resource Values: Theory and Methods, 3rd ed.; RFF PRESS, Taylor & Francis: New York, NY, USA, 2014. [Google Scholar]
  38. de Groot, R.S.; Brander, L.; van der Ploeg, S.; Costanza, R.; Bernand, F.; Braat, L.; Christie, M.; Crossman, N.; Ghermandi, A.; Hein, L.; et al. Global estimates of the value of ecosystems and their services in monetary units. Ecosyst. Serv. 2012, 1, 50–61. [Google Scholar] [CrossRef]
  39. Crossman, N.D.; Nedkov, S.; Brander, L. Discussion Paper 7: Water Flow Regulation for Mitigating River and Coastal Flooding. Paper Submitted to the Expert Meeting on Advancing the Measurement of Ecosystem Services for Ecosystem Accounting, New York, 22–24 January 2019 and Subsequently Revised. Version of 1 April 2019. Available online: https://seea.un.org/events/expert-meeting-advancing-measurement-ecosystem-services-ecosystem-accounting (accessed on 15 September 2020).
  40. Kramer, R.A.; Richter, D.D.; Pattanayak, S.; Sharma, N.P. Ecological and Economic Analysis of Watershed Protection in Eastern Madagascar. J Environ. Manage. 1997, 49, 277–295. [Google Scholar] [CrossRef] [Green Version]
  41. Grygoruk, M.; Mirosław-Świątek, D.; Chrzanowska, W.; Ignar, S. How much for water? Economic assessment and mapping of floodplain water storage as a catchment-scale ecosystem service of Wetlands. Water 2013, 5, 1760–1779. [Google Scholar] [CrossRef] [Green Version]
  42. Barth, N.-C.; Döll, P. Assessing the ecosystem service flood protection of a riparian forest by applying a cascade approach. Ecosyst. Serv. 2016, 21, 39–52. [Google Scholar]
  43. Zhai, G.; Sato, T.; Fukuzono, T.; Ikeda, S.; Yoshida, K. Willingness to pay for flood risk reduction and its determinats in Japan. J. Am. Water Resour. Assoc. 2006, 42, 927–940. [Google Scholar] [CrossRef]
  44. Entorf, H.; Jensen, A. Willingness-to-pay for hazard safety—A case study on the valuation of flood risk reduction in Germany. Saf. Sci. 2020, 128, 104657. [Google Scholar] [CrossRef]
  45. O’Connell, P.; Ewen, J.G.; O’Donnell, G.; Quinn, P. Is there a link between agricultural land-use management and flooding? Hydrol. Earth Syst. Sci. 2007, 11, 96–107. [Google Scholar] [CrossRef] [Green Version]
  46. United Nations Department of Humanitarian Affairs. Internationally Agreed Glossary of Basic Terms Related to Disaster Management; DHA/93/36; UN: Geneva, Switzerland, 1992. [Google Scholar]
  47. Department for Environment, Food and Rural Affairs. Guidelines for Environmental Risk Assessment and Management; DEFRA: London, UK, 2000.
  48. Birkmann, J. Measuring vulnerability to promote disaster-resilient societies: Conceptual frameworks and definitions. Inst. Environ. Human Secur. J. 2006, 5, 7–54. [Google Scholar]
  49. Pamungkas, A.; Bekessy, S.A.; Lane, R. Vulnerability Modelling to Improve Assessment Process on Community Vulnerability. Procedia Soc. Behav. Sci. 2014, 135, 159–166. [Google Scholar] [CrossRef] [Green Version]
  50. Dunford, R.W.; Harrison, P.A.; Bagstad, K.J. Computer modelling for ecosystem service assessment. In Mapping Ecosystem Services; Burkhard, B., Maes, J., Eds.; Pensoft Publishers: Sofia, Bulgaria, 2017; pp. 126–137. [Google Scholar]
  51. Fohrer, N.; Haverkamp, S.; Frede, H.G. Assessment of the effects of land use patterns on hydrologic landscape functions: Development of sustainable land use concepts for low mountain range areas. Hydrol. Process. 2005, 19, 659–672. [Google Scholar] [CrossRef]
  52. Kubinský, D.; Weis, K.; Fuska, J.; Lehotský, M.; Petrovič, F. Changes in retention characteristics of 9 historical artificial water reservoirs near Banska Stiavnica, Slovakia. Open Geosci. 2015, 7, 880–887. [Google Scholar]
  53. Wałęga, A.; Młyński, D.; Wojkowski, J.; Radecki-Pawlik, A.; Lepeška, T. New Empirical Model Using Landscape Hydric Potential Method to Estimate Median Peak Discharges in Mountain Ungauged Catchments. Water 2020, 12, 983. [Google Scholar] [CrossRef] [Green Version]
  54. Ministerstvo Životného Prostredia SR. Predbežné Hodnotenie Povodňového Rizika v Čiastkovom Povodí Hrona—Aktualizácia 2018; MŽP SR, SVP SR: Bratislava, Slovakia, 2018; Available online: https://www.minzp.sk/files/sekcia-vod/hodnotenie-rizika-2018/hron/phpr-hron.pdf (accessed on 20 April 2020).
  55. Climatic Atlas of Slovakia. Available online: http://klimat.shmu.sk/kas/ (accessed on 20 April 2020).
  56. SWAT Model. Available online: https://swat.tamu.edu (accessed on 14 March 2020).
  57. HEC-RAS Model (US Army Corps of Engineers, Hydrologic Engineering Center, Davis). Available online: www.hec.usace.army.mil (accessed on 18 March 2020).
  58. Geodesy, Cartography and Cadastre Authority of the Slovak Republic. Geoportal. Available online: https://www.geoportal.sk/sk/zbgis_smd/na-stiahnutie/ (accessed on 20 March 2020).
  59. National Forest Centre, Slovakia. Forest GIS. Available online: http://gis.nlcsk.org/lgis/ (accessed on 20 March 2020).
  60. Soil Science and Conservation Research Institute, Slovakia. Soil Maps. Available online: http://www.podnemapy.sk (accessed on 21 March 2020).
  61. Neitsch, S.L.; Arnold, J.G.; Kiniry, J.R.; Williams, J.R. Soil and Water Assessment Tool Theoretical Documentation, Technical Report No. 406; Version 2009; Grassland, Soil and Water Research Laboratory—Agricultural Research Service Blackland Research Center—Texas AgriLife Research, Texas Water Resources Institute: Forney, TX, USA, 2011. [Google Scholar]
  62. Essenfelder, A.H. SWAT Weather Database: A Quick Guide; Version: V.0.16.06; 2016; Available online: https://www.google.com.hk/url?sa=t&rct=j&q=&esrc=s&source=web&cd=&ved=2ahUKEwjHm_PM_pzuAhURK6YKHS8bC1AQFjABegQIAhAC&url=https%3A%2F%2Fwww.researchgate.net%2Fprofile%2FArthur_Hrast_Essenfelder%2Fpublication%2F294535100_SWAT_Weather_Database%2Fdata%2F5756f68e08aef6cbe35f4e5b%2FWeatherDatabase-QuickGuide.pdf&usg=AOvVaw1R_TylSnZhwKtGjYkWZu63 (accessed on 22 March 2020).
  63. Slovak Hydrometeorological Institute. Available online: http://www.shmu.sk/en (accessed on 22 March 2020).
  64. Slovak Road Administration. Available online: www.ssc.sk/en/home.ssc (accessed on 22 March 2020).
  65. Slovak Environment Agency. Available online: www.sazp.sk/en (accessed on 22 March 2020).
  66. OpenStreetMap. Available online: www.openstreetmap.org (accessed on 22 March 2020).
  67. Slovak Water Management Enterprise. Available online: www.svp.sk/en (accessed on 22 March 2020).
  68. Gaál, L.; Lapin, M.; Faško, P. Maximálne viacdenné úhrny zrážok na Slovensku. In Extrémy Počasí a Podnebí, Proceedings of Seminar Extremes of Weather and Climate, Brno, Czech Republic, 11 March 2004; Rožnovský, J., Litschmann, T., Eds.; Český Hydrometeorologický Ústav: Brno, Czech Republic, 2004; ISBN 80-86690-12-1. [Google Scholar]
  69. Soil Conservation Service. National Engineering Handbook, Section 4, Hydrology; Department of Agriculture: Washington, DC, USA, 1964.
  70. United States Department of Agriculture. Module 104: Runoff Curve Number Computations. Study Guide. Hydrology Training Series; United States Department of Agriculture: Washington, DC, USA, 1989.
  71. Water Research Institute of Slovakia. Available online: http://www.vuvh.sk (accessed on 25 March 2020).
  72. Brath, A.; Montanari, A.; Moretti, G. Assessing the effect on flood frequency of land use change via hydrological simulation (with uncertainty). J. Hydrol. 2006, 324, 141–153. [Google Scholar] [CrossRef]
  73. Niehoff, D.; Fritsch, U.; Bronstert, A. Land-use impacts on storm runoff generation: Scenarios of land-use change and simulation of hydrological response in a meso-scale catchment in SW-Germany. J. Hydrol. 2002, 267, 80–93. [Google Scholar] [CrossRef]
  74. Boyd, J.; Banzhaf, S. What are ecosystem services? Ecol. Econ. 2007, 63, 616–626. [Google Scholar] [CrossRef] [Green Version]
  75. Nelson, E.; Mendoza, G.; Regetz, J.; Polasky, S.; Tallis, H.; Cameron, D.R.; Chan, K.M.A.; Daily, G.C.; Goldstein, J.; Kareiva, P.M.; et al. Modeling multiple ecosystem services, biodiversity conservation, commodity production, and tradeoffs at landscape scales. Front. Ecol. Environ. 2009, 7, 4–11. [Google Scholar] [CrossRef]
  76. Zhang, M.F.; Liu, N.; Harper, R.; Li, Q.; Liu, K.; Wei, X.; Ning, H.; Hou, Y.; Liu, S. A global review on hydrological responses to forest change across multiple spatial scales: Importance of scale, climate, forest type and hydrological regime. J. Hydrol. 2017, 546, 44–59. [Google Scholar] [CrossRef] [Green Version]
  77. Farooqi, T.J.A.; Li, X.; Yu, Z.; Liu, S.; Sun, O.J. Reconciliation of research on forest carbon sequestration and water conservation. J. For. Res. 2020. [CrossRef]
  78. Minďáš, J.; Škvarenina, J.; Střelcová, K. Význam lesa v hydrologickom režime krajiny. Zivotn. Prostr. 2001, 3, 146–150. [Google Scholar]
  79. Minďáš, J.; Čaboun, V. 2002: Influence of Vegetation on Catchment Runoff; Final Report of Project VTP 27-64 E0203; LVÚ: Zvolen, Slovakia, 2002. [Google Scholar]
  80. Bíba, M.; Oceánska, Z.; Vícha, Z.; Jařabáč, M. Forest-hydrological research in small experimental catchments in the Beskydy Mountains. J. Hydrol. Hydromech. 2006, 54, 113–122. [Google Scholar]
  81. Pasquino, V.; Saulino, L.; Pelosi, A.; Allevato, E.; Rita, A.; Todaro, L.; Saracino, A.; Chirico, G.B. Hydrodynamic behaviour of European black poplar (Populus nigra L.) under coppice management along Mediterranean river ecosystems. River Res. Appl. 2018, 34, 586–594. [Google Scholar] [CrossRef]
  82. Douglas, J.; Gasiorek, J.; Swaffield, J.; Jack, L. Fluid Mechanics, 5th ed.; Harlow: Pearson, UK, 2005. [Google Scholar]
  83. Lama, G.F.C.; Errico, A.; Francalanci, S.; Solari, L.; Preti, F.; Chirico, G.B. Evaluation of flow resistance models based on field experiments in a partly vegetated reclamation channel. Geosciences 2020, 10, 47. [Google Scholar] [CrossRef] [Green Version]
  84. Gualtieri, P.; Felice, S.D.; Pasquino, V.; Doria, G.P. Use of conventional flow resistance equations and a model for the Nikuradse roughness in vegetated flows at high submergence. J. Hydro. Hydromech. 2018, 66, 107–120. [Google Scholar] [CrossRef] [Green Version]
  85. Pellicani, R.; Parisi, A.; Iemmolo, G.; Apollonio, C. Economic Risk Evaluation in Urban Flooding and Instability-Prone Areas: The Case Study of San Giovanni Rotondo (Southern Italy). Geosciences 2018, 8, 112. [Google Scholar] [CrossRef] [Green Version]
  86. Apollonio, C.; Bruno, M.F.; Iemmolo, G.; Molfetta, M.G.; Pellicani, R. Flood Risk Evaluation in Ungauged Coastal Areas: The Case Study of Ippocampo (Southern Italy). Water 2020, 12, 1466. [Google Scholar] [CrossRef]
  87. Lamb, R.; Keef, C.; Tawn, J.A.; Laeger, S.; Meadowcroft, I.; Surendran, S.; Dunning, P.; Batstone, C. A new method to assess the risk of local and widespread flooding on rivers and coasts. J. Flood Risk Manag. 2010, 3, 323–336. [Google Scholar] [CrossRef]
  88. Grimaldi, S.; Petroselli, A.; Arcangeletti, E.; Nardi, F. Flood mapping in ungauged basins using fully continuous hydrologic–hydraulic modeling. J. Hydrol. 2013, 487, 39–47. [Google Scholar] [CrossRef]
  89. Teng, J.; Jakeman, A.; Vaze, J.; Croke, B.F.; Dutta, D.; Kim, S. Flood inundation modelling: A review of methods, recent advances and uncertainty analysis. Environ. Model. Softw. 2017, 90, 201–216. [Google Scholar] [CrossRef]
  90. Bastian, O.; Syrbe, R.U.; Rosenberg, M.; Rahe, D.; Grunewald, K. The five pillar EPPS framework for quantifying, mapping and managing ecosystem services. Ecosyst. Serv. 2013, 4, 15–24. [Google Scholar] [CrossRef]
  91. de Groot, R.S. Functions of Nature: Evaluation of Nature in Environmental Planning, Management and Decision Making; Wolters-Noordhoff BV: Groningen, The Netherlands, 1992. [Google Scholar]
  92. Izakovičová, Z.; Špulerová, J.; Petrovič, F. Integrated Approach to Sustainable Land Use Management. Environments 2018, 5, 37. [Google Scholar]
Figure 1. Study area.
Water 13 00198 g001
Figure 2. Extent of the modelled flooded area with the current land use and precipitation 80 mm/day in the HEC-RAS model.
Water 13 00198 g002
Figure 3. Methodical steps of the assessment.
Water 13 00198 g003
Figure 4. Proportion of maximum runoff retained (from 80 mm precipitation) if the whole area was covered by single land use.
Water 13 00198 g004
Figure 5. Contribution of the hydrologic response units (HRUs) to the total runoff.
Water 13 00198 g005
Figure 6. Monetary valuation of flood protection ecosystem service of different ecosystems (land use types).
Water 13 00198 g006
Figure 7. Water retention of different land use types compared to the forest retention (in %).
Water 13 00198 g007
Figure 8. Current land use and the assessment of its flood protection ecosystem service.
Water 13 00198 g008
Figure 9. Estimated changes in cost of the flood protection ecosystem services (ES) in the case of land use change.
Water 13 00198 g009
Publisher’s Note: MDPI stays neutral with regard to jurisdictional claims in published maps and institutional affiliations.

