Article

Spectral Characterization of Dissolved Organic Matter in Seawater and Sediment Pore Water from the Arctic Fjords (West Svalbard) in Summer

1
Department of Environment & Energy, Sejong University, Seoul 05006, Korea
2
Environmental Program, Guangdong Technion—Israel Institute of Technology, Shantou 515063, China
3
Petroleum and Marine Research Division, Korea Institute of Geoscience and Mineral Resources, 124 Gwahak-ro, Yuseong-gu, Daejeon 34132, Korea
4
Climate Change Mitigation and Sustainability Division, Korea Institute of Geoscience and Mineral Resources, 124 Gwahak-ro, Yuseong-gu, Daejeon 34132, Korea
5
Korea Polar Research Institute (KOPRI), Incheon 21990, Korea
*
Authors to whom correspondence should be addressed.
Water 2021, 13(2), 202; https://doi.org/10.3390/w13020202
Submission received: 1 December 2020 / Revised: 8 January 2021 / Accepted: 9 January 2021 / Published: 15 January 2021
(This article belongs to the Section Oceans and Coastal Zones)

Abstract

:
Fjords in the high Arctic, as aquatic critical zones at the interface of land-ocean continuum, are undergoing rapid changes due to glacier retreat and climate warming. Yet, little is known about the biogeochemical processes in the Arctic fjords. We measured the nutrients and the optical properties of dissolved organic matter (DOM) in both seawater and sediment pore water, along with the remote sensing data of the ocean surface, from three West Svalbard fjords. A cross-fjord comparison of fluorescence fingerprints together with downcore trends of salinity, Cl, and PO43− revealed higher impact of terrestrial inputs (fluorescence index: ~1.2–1.5 in seawaters) and glaciofluvial runoffs (salinity: ~31.4 ± 2.4 psu in pore waters) to the southern fjord of Hornsund as compared to the northern fjords of Isfjorden and Van Mijenfjorden, tallying with heavier annual runoff to the southern fjord of Hornsund. Extremely high levels of protein-like fluorescence (up to ~4.5 RU) were observed at the partially sea ice-covered fjords in summer, in line with near-ubiquity ice-edge blooms observed in the Arctic. The results reflect an ongoing or post-phytoplankton bloom, which is also supported by the higher levels of chlorophyll a fluorescence at the ocean surface, the very high apparent oxygen utilization through the water column, and the nutrient drawdown at the ocean surface. Meanwhile, a characteristic elongated fluorescence fingerprint was observed in the fjords, presumably produced by ice-edge blooms in the Arctic ecosystems. Furthermore, alkalinity and the humic-like peaks showed a general downcore accumulation trend, which implies the production of humic-like DOM via a biological pathway also in the glaciomarine sediments from the Arctic fjords.

1. Introduction

Fjords, carved by glacial process mainly in the mid- to high latitudes, are vulnerable to climate changes and anthropogenic activities [1,2,3,4,5]. In the West Svalbard area of the high Arctic, the surface air temperature has increased ~4 °C over the last four decades, and the bottom water temperature (at <500 m water depth) has risen by 1.5 °C over the last three decades [6,7]. The Svalbard glaciers (~33,000 km2) account for ~57% of the Svalbard land area and ~4.5% of the coverage area of the world’s land glaciers (~726,800 km2, excluding the Antarctic and Greenland ice sheets), which is equivalent to 17 mm of the sea level [8,9,10]. The glaciers in the area retreat at rates of 10–220 m yr−1 and peak in July [11], which explains an annual runoff increase >35% during the period of 1980–2015. In addition, as the warmest permafrost in the high Arctic, the active layer has deepened by 0.6–1.6 cm yr−1 since 2000 in some areas [3].
There are many stratified fjords in the Svalbard archipelago, which are at the nexus of the land and the ocean. These fjords are stratified due to the freshwater inputs that are primarily from the glacier runoff and the sea ice melting. Due to the rapid warming climate and conditions, the dissolved organic matter (DOM) in these fjords has diverse sources, which mainly include glacier melt water, glacier-fed riverine runoff, in situ primary productivity, coastal erosion, permafrost thawing, and marine inflow from the shelf of West Svalbard [2,12,13]. The estimated fluxes of dissolved organic carbon (DOC) and particulate organic carbon (POC) from the Svalbard glaciers were estimated to be 0.02 ± 0.01 and 0.06 ± 0.02 million tons (Mt) yr−1, respectively [14]. The glacier-derived DOM in other locations has been found to contain a high portion of bioavailable dissolved organic carbon (BDOC, up to ~66%), and it is positively correlated with the 14C age of the DOM [15,16]. In contrast, surface seawater BDOC is relatively low (≤1/3) in the nearby Fram Strait [17]. Primary production varies widely in different fjords, which range from ~20 to 220 g C m−2 yr−1 in the prior reports [18,19,20]. Closely connected to the land and the ocean, these Svalbard fjords serve as ideal spots to study the prompt responses of the ecosystem to the changes in marine, land, and atmospheric environments.
There were several reports regarding the DOM characteristics and dynamics. For seawater, the bulk DOC ranged from ~60 to 220 µM, and the concentrations generally increased along a horizontal trajectory leaving the fjord [12,21,22]. A study using fluorescence excitation emission matrix (EEM) revealed that the tyrosine-like fluorescence dominated the fluorescent DOM (FDOM) composition in spring, but the humic-like and the tryptophan-like fluorescence prevailed in autumn in the Kongsfjorden of Svalbard [22]. Another study, which utilized molecular formula fingerprints, found a rapid DOM turnover and ~1.8% of the dissolved black carbon in most of the West Svalbard fjords [21]. As for the sediment pore water, the total dissolved carbohydrate (TDCH) levels were found to likely be a considerable portion of the DOC (~15–50% or more) [23]. Corg/Norg and stable isotopic δ13Corg indicated the primary terrestrial source of the organic carbon in the sediments of the Hornsund and the Isfjorden (69–75% and 82–83%, respectively) as opposed to that in the Kongsfjorden in the upper part of West Svalbard, which was dominated by a marine origin (~61%) [12,24]. In contrast to the seawater, the Corg concentrations were higher in the innermost stations in the surface sediments, which suggests the inputs from the freshwater runoff [24]. It was previously reported that the organic carbon burial rates range from 5.7–38.6 g m−2 yr−1, and the burial efficiency was 28–98% in the sediments from the West Svalbard fjords [25,26].
Despite prior information provided by the reports that are mentioned above, understanding the DOM characteristics and the dynamics in the seawater and sediment pore water among the different Svalbard fjords are still very limited. Field investigation of DOM and nutrients are indispensable to advance understating and Earth biogeochemical models due to the expected wide spatiotemporal variations in the non-steady-state fjord ecosystems affected by both terrestrial and marine inputs. In particular, the comparative studies among different fjords and between the DOM in seawaters and sediment pore waters are very rare, which can provide direct information regarding the spatial variations and dynamics between overlying water column and the underlying sediments. Recently, there have been comparative studies that use high resolution Fourier Transform Ion Cyclotron Resonance mass spectrometry [27,28]. These type of comparative studies between the overlying water and the pore water would help to elucidate the DOM sources and the potential interactions between them. In this study, we aimed to provide a comparative study of the optical properties of the DOM in seawater versus in sediment pore water in the areas mentioned in this study. The objectives are threefold, which include (1) to investigate and compare the DOM sources and the characteristics from the different fjords and the sites using ultraviolet-visible (UV-Vis) spectroscopy and 3D fluorescence EEM, (2) to explore the down core trends of the salinity, nutrients, alkalinity, Cl, and DOM optical proxies, and (3) to compare the DOM optical properties between the overlying seawater and the underlying sediment pore water.

2. Materials and Methods

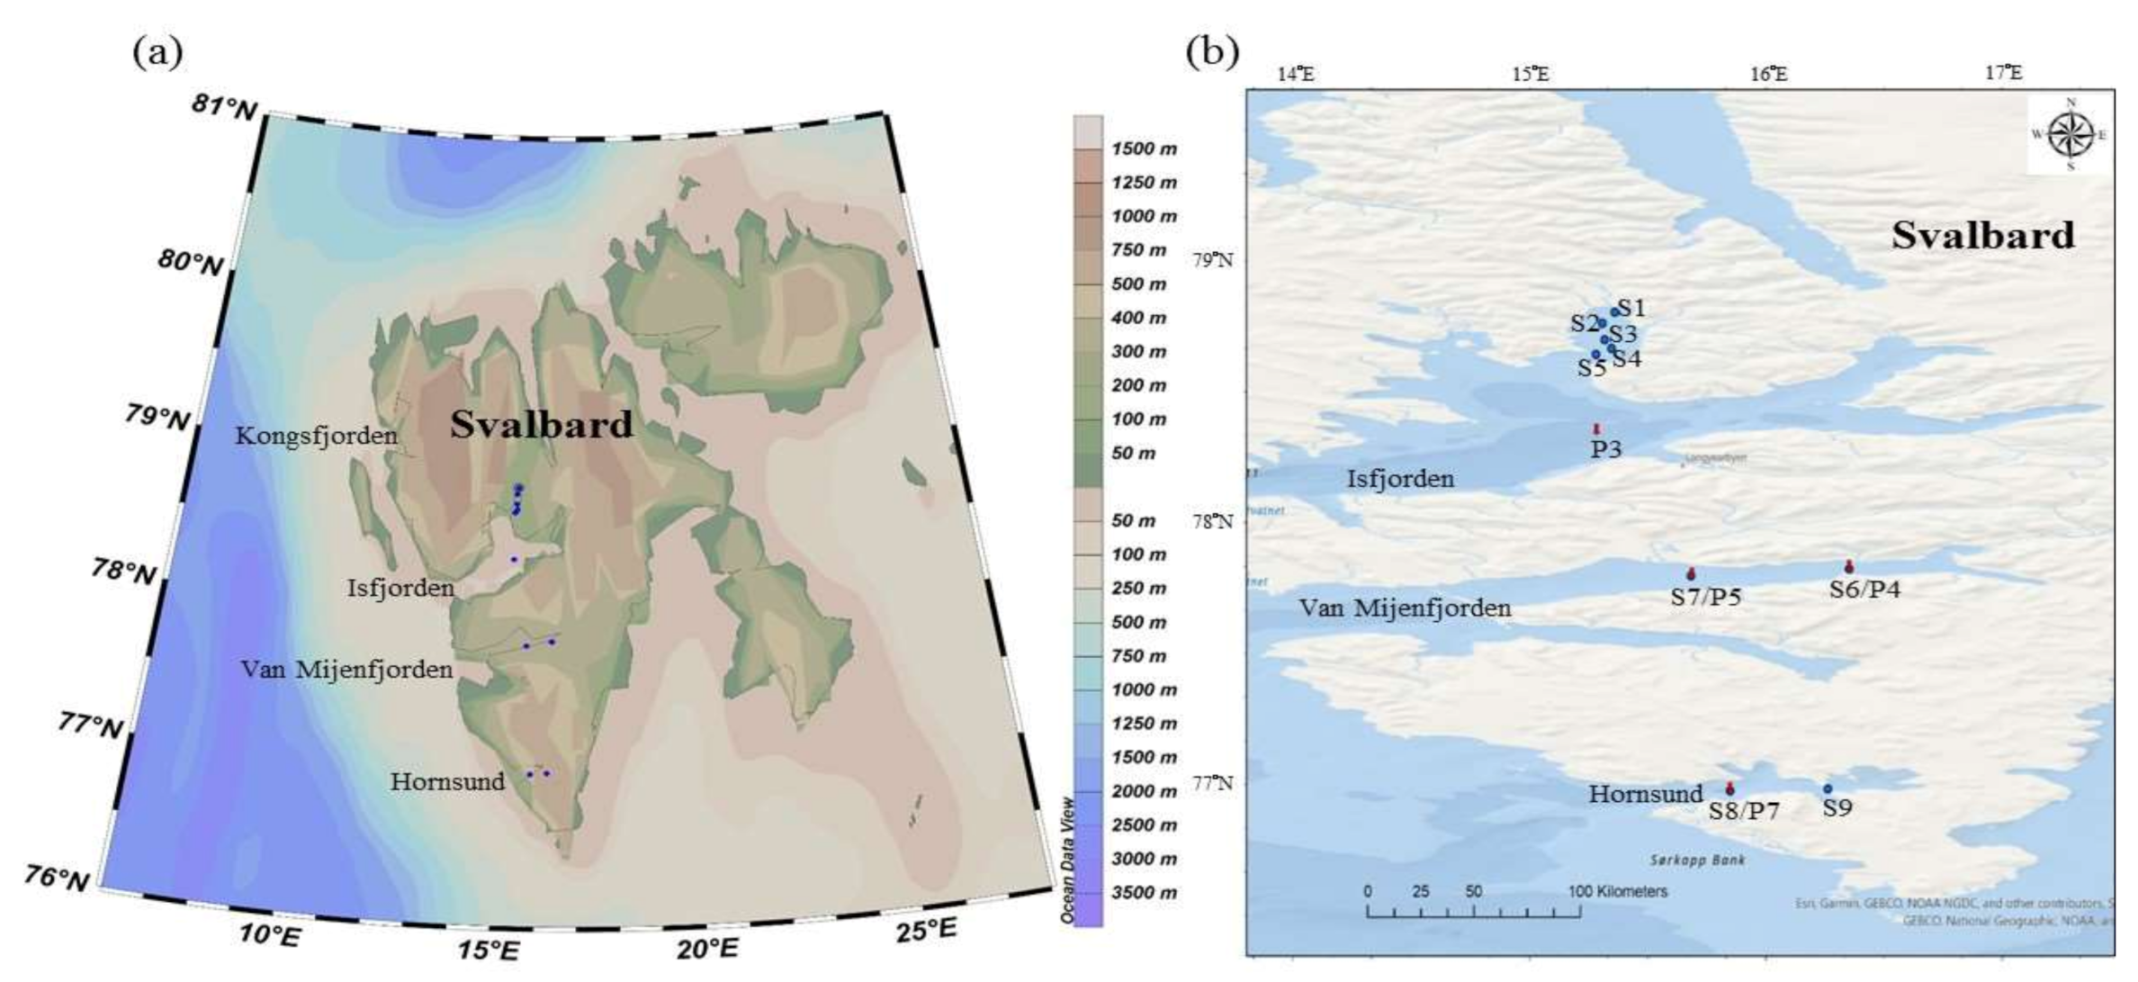
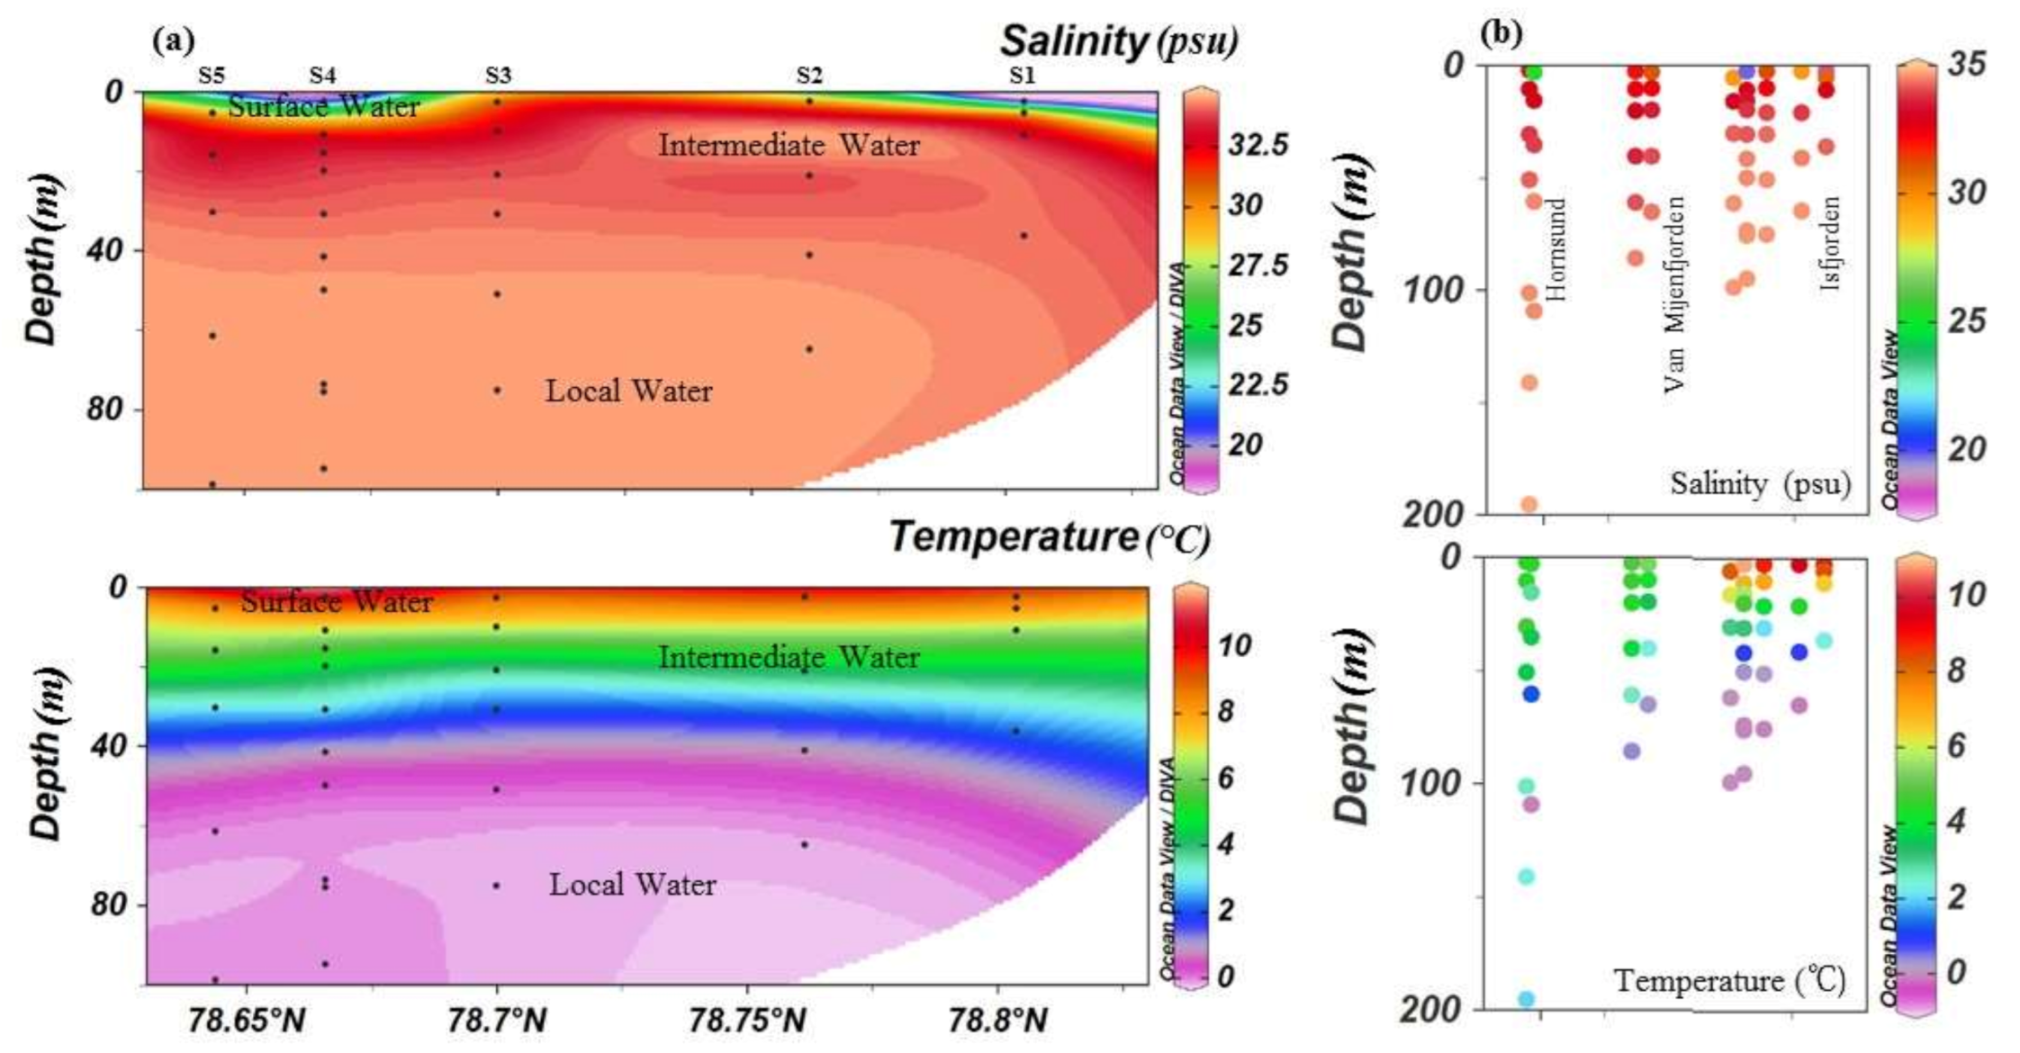
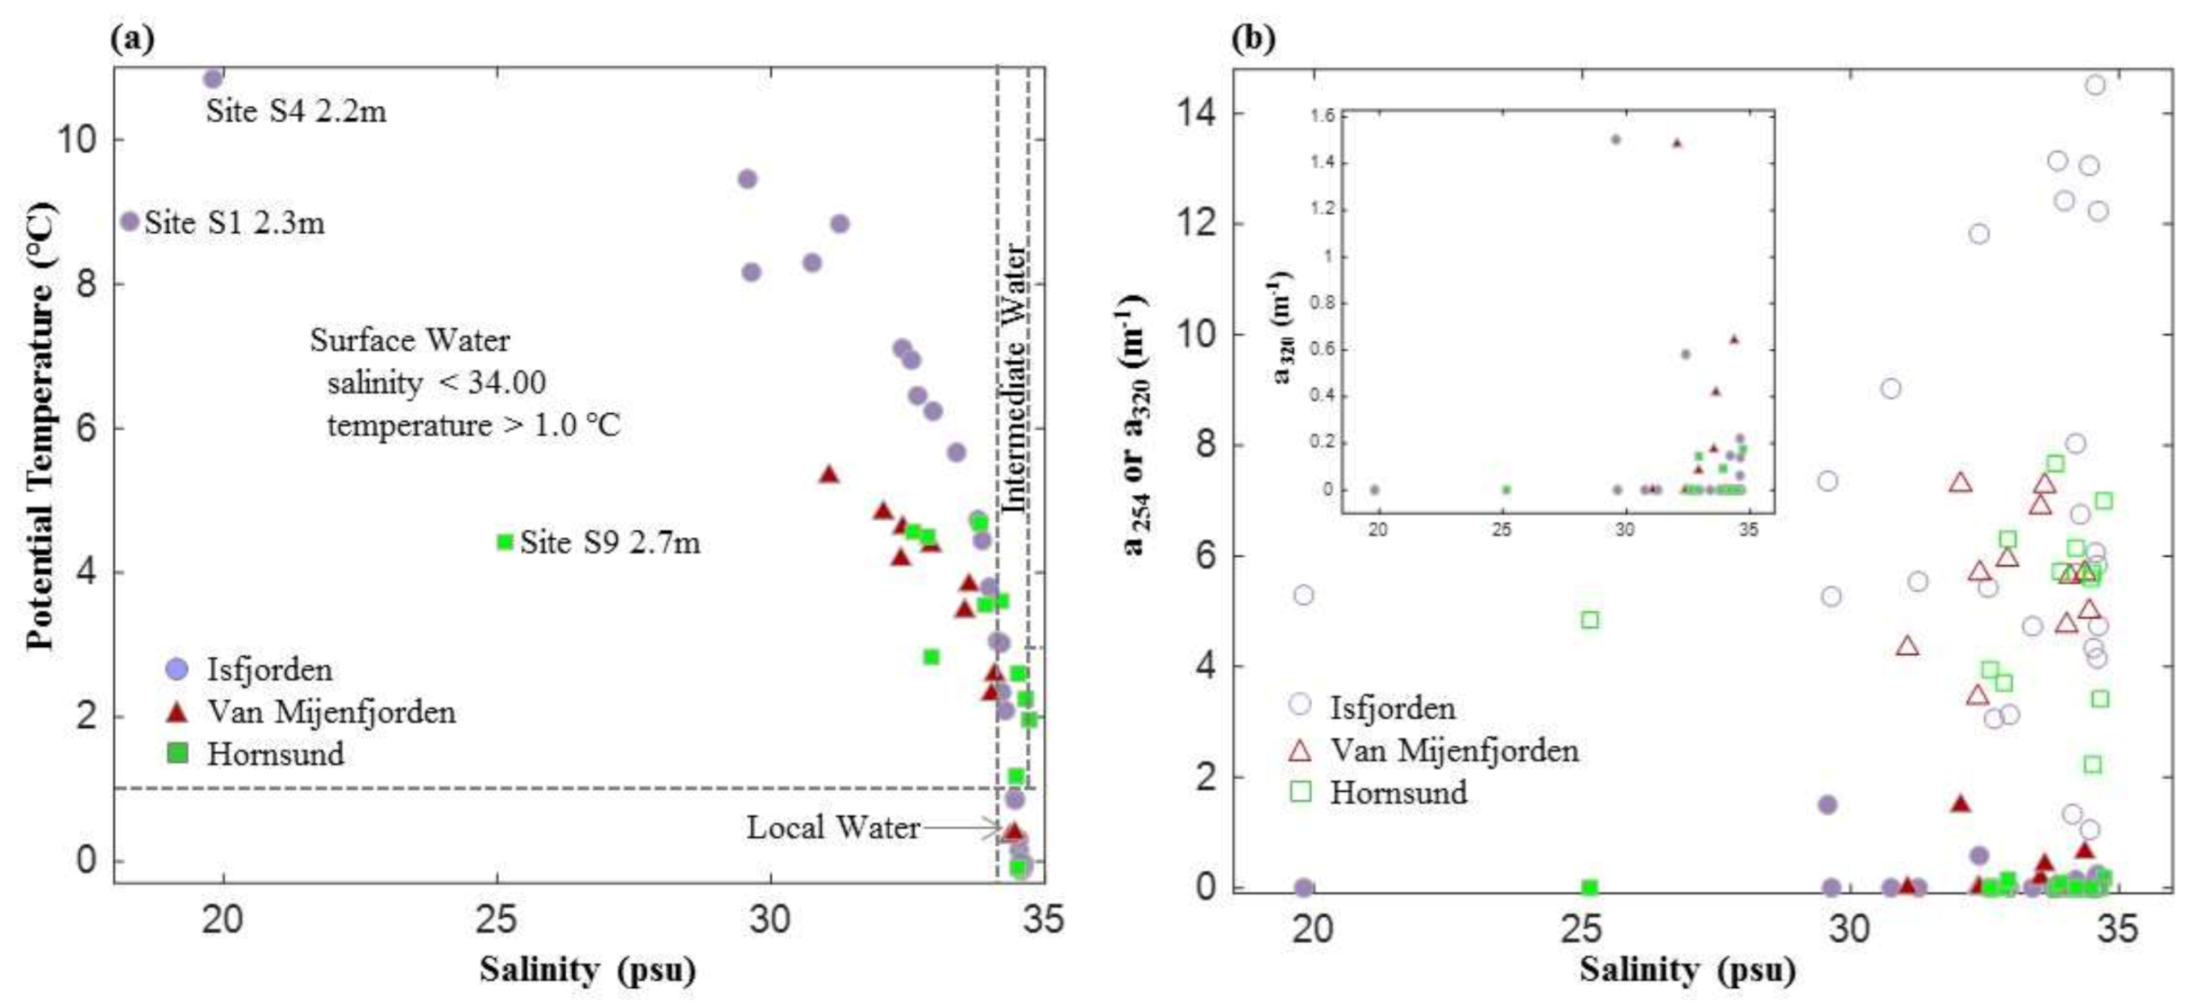
2.1. Sampling Sites and Water Mass Properties

Nine sites for seawater and four sites for sediment pore water were selected in three fjords from West Svalbard (between 74° to 81° N and 10° to 35° E), which included Isfjorden, Van Mijenfjorden, and Hornsund (Figure 1). The fjords were formed ~12,000 years ago [29] and they are located in the eastern edge of the Fram Strait, which is a main channel between the Arctic Ocean and the Atlantic Ocean. Svalbard occupies an area of about 61,000 km2, and ~57% of it is covered by glaciers [30,31]. Isfjorden is the largest fjord in West Svalbard with a shallow sill, and is open to shelf [32]. In contrast, Van Mijenfjorden has limited communication with the ocean, and it is heavily influenced by Fe-rich sandstone and red conglomerate bedrock [33]. The most southern part of Hornsund is relatively cold due to its separation from the warm Atlantic water by the East Spitsbergen Current [34]. The onset of the spring diatom bloom usually occurs from April to May when the ice cover starts to decrease. The sediments in the fjords are the glaciomarine type. The sediment accumulation rate at the glacial front, which is the inner part, was reported to be ~20 kg m−2 yr−1, and it is one order of magnitude lower at the central fjord and two orders of magnitude lower in the outer part [35]. There are usually high sedimentation rates in the fjords due to steep terrestrial loads and sheltered water by sills. In the Svalbard fjords, the sedimentation rate at the ice front was estimated to be >10 cm yr−1, and it was much lower (~0.12–0.41 cm yr−1) in the central and the outer parts of the fjords [12,25].
The water masses in the west Svalbard fjords are potentially influenced by (i) the turbid glacial melt water, which has a total surface runoff ~25 ± 5 km3 yr−1, [37], (ii) the warm Atlantic water (T > 3.0 °C, ~200–900 m) delivered by the pole-ward flowing Western Spitsbergen Current via the fjord-shelf exchanges, and (iii) the cold and relatively fresh coastal Arctic waters (1.0 °C > T > −1.5 °C) carried by the weaker Sorkapp Current [38]. The relative strengths of their influences depend on the season, the depth, and the exact location, which include the inner vs. the outer part of the fjords. The seawater stations are rather shallow with a maximum depth of 195.3 m at site S8 and a minimum depth of 36.1 m at site S1, which is indicative of no warm Atlantic water (Figure 2). There are three types of identified water masses that are shown in Figure 2, which include Surface Water (SW, S < 34.00, T > 1.0 °C), Intermediate Water (IW, 34.00 < S < 34.65, T > 1.0 °C), and Local Water (LW, 34.30 < S < 34.85, −0.5 < T < 1.0 °C) [39]. Most of the samples belong to the SW and the IW water masses (Figure 3a).

2.2. Sampling and the Onboard Analyses of Salinity, Cl, and Alkalinity

The seawater and the pore water from the sediment cores were obtained during a 2016 cruise on the R/V Helmer Hanssen from the Arctic University of Norway in Tromsø (UiT) from the 18th to the 23rd of July 2016 (Figure 1). The seawater sampling depth reached approximately 1–3 m above the seafloor. We selected the seawater samples considering the profiles of the salinity, the temperature, and the chlorophyll data at each site. For example, we collected the seawater samples with a CTD collector at the depth showing the maximum chlorophyll a (chl-a) data at each site and/or choose the samples at the two representative depths if the salinity and the temperature varied largely with the depth. Note that the CTD recorded the data while it went down to the seafloor. The seawater samples were collected while the CTD collector was on the upcast. The seawater properties, which included temperature, salinity, fluorescence, turbidity, and oxygen content, were collected solely using a CTD/rosette system as electronic data that holds twelve five-liter Niskin bottles (Seabird 911 Plus).
In addition, the four sediment cores were collected using a gravity corer (GC) with an inner diameter of 11 cm. The pore water was extracted using an attached Rhizon and 24 mL pre-washed HCI syringes by perforating holes in the core liner at 30–40 cm intervals. We did not collect the pore water samples from the sediment at the top of core, which was from 0 to 10 cm below seafloor, in order to avoid a potential disturbance at the surface sediment when the corer hit the seafloor. The collected seawater and the pore water samples were filtered through a 0.20 µm disposable polytetrafluoroethylene filter, and they were transferred into high-density prewashed polyethylene bottles for the anions and the nutrients (~3–5 mL) analyses and the optical measurements for UV-Vis and EEMs. The water samples for the anions and the nutrients were stored at 4 °C as in prior studies [40]. These samples were filtered with 0.20 µm filter so most of the bacteria were removed for better storage of samples. The samples for the DOM were frozen immediately for longer time storage before returning to the land-based laboratory. The frozen samples may potentially affect the FDOM fingerprints upon subsequent thawing [41]. Nevertheless, this has been widely used especially for polar sample collection when longer storage time is required [42,43,44,45]. Before the spectroscopic measurements, the samples, which included both the seawater and the pore water, were filtered again with 0.2 μm pore sized filters.
The salinity measurements for the sediment pore water were performed onboard using a hand-held temperature-compensated Fisher refractometer due to the limited volume of the extracted pore water, which was usually <24 mL. The International Association of Physical Sciences of the Oceans (IAPSO, 34.99 psu) standard was used for the calibration of the salinity. The salinity of deionized water (DI) and IAPSO was measured several times (at least 5) before starting the analysis. Usually the measured value of IAPSO (34.99 psu) by refractometer was 37 psu and that of DI was 0 psu. Thus, we estimated the correction factor (=34.99/(average of measured ISPO values). We measured the IAPSO every 10 samples. The measured IAPOS value was not significantly changed with a reproductivity of IAPSO <2%. The Cl concentration and the alkalinity were measured onboard during the expedition via titration with silver nitrate (AgNO3) and 0.02 N HCl. The reproducibility of the Cl and the alkalinity was tested with a repeated analysis of the IAPSO standard seawater, which was <2% and <0.5%. The sulfate (SO42−) was analyzed using ion chromatography (ICS-1100, Dionex, Sunnyvale, CA, USA) in the Korea Basic Science Institute. The PO43− were measured spectrophotometrically (Shimadzu UV-2450, Shimadzu, Kyoto, Japan) at 885 nm in the Korea Institute of Geoscience and Mineral Resources. We used the raw data obtained using in situ chlorophyll (chl) fluorometer (FLRTD, WET labs, Corvallis, OR, USA, ex/em: 470/695 nm) for comparison purpose only. The Chl-a sensor was properly calibrated by a technician prior to the cruise as did previously in the R/V Helmer Hanssen [46].

2.3. UV-Vis and EEMs Measurements and Data Handling

The 3D fluorescence EEMs were measured using a Hitachi F-7000 fluorospectrometer (Hitachi Inc., Tokyo, Japan) at excitation/emission (Ex/Em) wavelengths of 250–500/280–550 nm. The excitation and the emission scans were set at 5 nm and 1 nm steps. Identical integration times were used for the water Raman scans and for the DOM samples. The post-acquisition corrections were performed. Blank subtraction using Milli-Q water, inner filter effect correction using UV-Vis data, automatic instrument correction, and Raman Unit normalization (ex/em: 350/397 nm) were conducted to obtain FDOM data. The procedures for the Raman Unit (RU) normalization can be found in other studies [47]. The absorption spectra were obtained from 240 to 800 nm utilizing a Shimadzu 1800 UV-Vis spectrophotometer (Shimadzu Inc., Kyoto, Japan). The Napierian absorption coefficient aλ reported below is calculated with the equation below.
aλ = 2.303 × A/L
where A denotes the optical density, and L denotes the path length.
Due to the extremely high tyrosine-like fluorescence relative to the other FDOM components, which was more than one order of magnitude, the peak-picking method was adopted instead of a parallel factor analysis, which could ignore the much weaker signals related to the humic-like components in this study. The excitation/emission wavelengths used for the two protein-like and the three humic-like peaks were 280/310 nm (B), 280/340 nm (T), 260/420 nm (A), 315/400 nm (M), and 350/450 nm (C), respectively, which was used previously [48]. The associated optical indicators of the fluorescence index (FI), the biological index (BIX), and the humification index (HIX) were calculated as defined and described in other studies [49,50,51].

2.4. First-Order Kinetic Model for Alkalinity, Nutrients, Absorption Coefficients, and FDOM Accumulation with Depth

The first-order exponential increase of DOM has been commonly found in sediments [52]. In this study, a first-order exponential model (Equation (2)) was used to fit the down core trends of alkalinity, nutrients, and the DOM optical parameters as described in another study [53].
Cd = a × e(k×d) + b
where Cd is the total concentration at depth (d), e is the natural exponential constant, a and b are the constants, and k is the rate constant with depth for the first order reaction (Equation (2)).

2.5. Satellite Image Retrieval of Chl-a

Concentrations of near surface chl-a were estimated from the Moderate Resolution Imaging Spectroradiometer (MODIS)-Aqua imagery retrieved for 18–23 July 2016 (NASA Goddard Space Flight Center, Greenbelt, MD, USA, [54]). Methodologically, the satellite-based near-surface concentration of chlorophyll a is estimated using an empirical relationship derived from in situ measurements of chl-a and the surface reflectance in the visible spectrum (440 nm to 670 nm) of the satellite [55,56].

3. Results and Discussion

3.1. Salinity, Nutrients, Alkalinity, and the DOM Optical Properties of Seawater and Pore Water

The average salinity of seawaters ranged from 29.0 psu at site HH16-1181-CTD, which is called S1 for abbreviation, (refer to Table S1 for all the original site names) to 33.9 psu at site S8 (Table S2 and Figure 2), which suggests the influence of the freshwater inputs on the seawater especially those at the glacier front site S1. The average chlorinity ranged from 260 ± 176 mM to 531 ± 11 mM at site S1 and site S8, respectively. The alkalinity was the lowest at site S1 with the average values ranging from 1.7 to 2.8 mM. The average PO43− concentrations ranged from below detection at site S9 to 0.5 ± 0.3 µM at site S7 with generally lower levels at the ocean surface, which likely indicated nutrient drawdown during or after a phytoplankton bloom. The PO43− concentrations fell within the range of 0.06 to 3.10 µM, which was observed in Isfjorden and Hornsund in a prior study [13].
The average levels of the absorption coefficient of seawaters at 254 nm (a254) ranged from 3.6 m−1 at site S4 to 9.9 m−1 at site S2 (Table S2 and Figure 3b), which were comparable to those previously observed in the Arctic shelves [45,57]. The maximum levels of a254 usually appeared in the depth range of ~5–40 m, which were potentially related to the inputs from the glacier runoff and in situ phytoplankton productivity. These will be discussed in detail in Section 3.2 (Figure 3b and Figure 4). The absorption coefficient a320 ranged from 0.0 m−1 at site S1 to 1.5 m−1 at the surface water of sites S2 and S7, which are comparable to the levels observed north of Svalbard (0.16–0.28 m−1 for a330) [58]. The a320 showed more of the marine source since it reached almost zero at lower salinity (Figure 3b). The FI values at the southernmost sites S8 and S9 (1.2–1.3) were significantly lower than those at the remainder sites (1.4–1.7) with a maximum value (2.2) shown at the surface water at site S1. The average BIX values ranged from 0.8 to 1.0, while the HIX varied from 0.4 to 0.9. As for the FDOM, the average levels of the tyrosine-like peak B were surprisingly high, which ranged from 1.7 ± 0.1 RU at site S6 to 2.4 ± 1.0 RU at site S8. The tryptophan-like peak T was also high, which had average values that ranged from 0.21 ± 0.0.6 RU at site S6 to 0.50 ± 0.37 RU at site S8. The microbial humic-like peak M varied from 0.05 RU at site S1 to 0.16 RU at site S8. The terrestrial humic-like peaks A and C ranged from 0.09 RU at site S1 to 0.27 RU at site S8 and 0.03 at sites S1 and S2 to 0.10 RU at site S8. Hornsund, which is where site S8 is located and the maximum FDOM was observed, generally showed a high primary productivity in July (~14–87 g C m−2 h−1) [19]. In contrast, the glacier front sites S1 and S6 at the inner parts of Isfjorden and Van Mijenfjorden received turbid glacier melt water runoff in summer, which served to limit the light availability and the primary productivity. We will discuss the high protein-like FDOM below.
As for the relative distribution of the FDOM of the seawaters, the tyrosine-like peak B dominated in the seawater (67.2–80.8%) and accounted for 38.3–50.2% in the pore water. The relative abundance of the tyrosine-like fluorescence observed here is higher than those found in both the spring (58%) and the autumn (5.3%) seasons in a prior study in the Kongsfjorden of West Svalbard [22].
The lengths of the four sediment cores, which included P3, P4, P5, and P7, are 4.65, 2.03, 3.55, and 2.80 m below the sea floor (mbsf), respectively (Table S3). According to the aforementioned sedimentation rates, these cores correspond to decades in the glacier front sites and up to millennium at the central fjords (such as site P3). The average salinity of the pore water ranged from 31.4 ± 2.4 psu at site P7 to 34.8 ± 0.5 psu at site P3. The down core profile of the salinity at the glacier front sites P4 and P7 showed decreasing trends with the depth (Figure S1). Likewise, chlorinity, which ranged from 487 mM at site P7 to 551 mM at site P3, displayed similar trends as salinity, suggesting meteoric water discharge to these sites potentially caused by glacier melt and riverine runoff. The estimated runoff for Svalbard is ~600 mm yr−1 during 1971–2000 but it has increased by >35% since 1980 [3]. The average alkalinity ranged from 3.1 to 13.9 mM. The average values of PO43− varied widely from 6.0 µM at site P4 to 102 µM at site P3. However, the down core profile for PO43− showed different trends, which depended on the sites. Site P3 displayed an increasing trend with the depth. In contrast, the glacier front site P4 in a silled Van Mijenfjorden with limited communication with the ocean showed a decreasing trend with the depth, which implied the capture of PO43− by the reduced iron compounds [59]. These results are consistent with influence from Fe-rich sandstone in Van Mijenfjorden [33]. Likewise, the absorption coefficients such as a254 and a320 and the protein-like fluorescence peaks like B280/310 and T280/340 at site P4 also displayed general decreasing downcore trends (Figure S2). The remainder sites of P5 and P7 displayed a mixed trend, which suggested the dominance by either the glacio-sediments or the marine sediments with time as the sediments in the Svalbard fjords belong to the glaciomarine type [35].
The absorption coefficients a254 and a320 ranged from 57.8 m−1 at site P5 to 90.4 m−1 at site P4 and 22.0 m−1 at site P3 to 72.1 m−1 at site P4, which are comparable to those observed in the sediment pore water in the Arctic Ocean [60]. The FI value was 1.5 on average, which suggests a mixed source of terrestrial and microbial origins for fulvic acids. The BIX and HIX values ranged from 0.8 to 0.9 and from 1.4 to 3.5. The protein-like peak B and T were recorded from 6.0 to 8.1 RU and from 1.4 to 2.5 RU, respectively. The microbial humic-like peak M ranged from 1.2 to 2.7 RU. The terrestrial humic-like peak A and peak C varied from 2.3 to 5.4 RU and from 0.8 to 2.0 RU, respectively. Unlike the mixed trends for the absorption coefficients and the protein-like peaks B and T (Figure S2), the humic-like peaks C, M, and A generally featured an increasing down core trend except for site P7 (Figure S3).

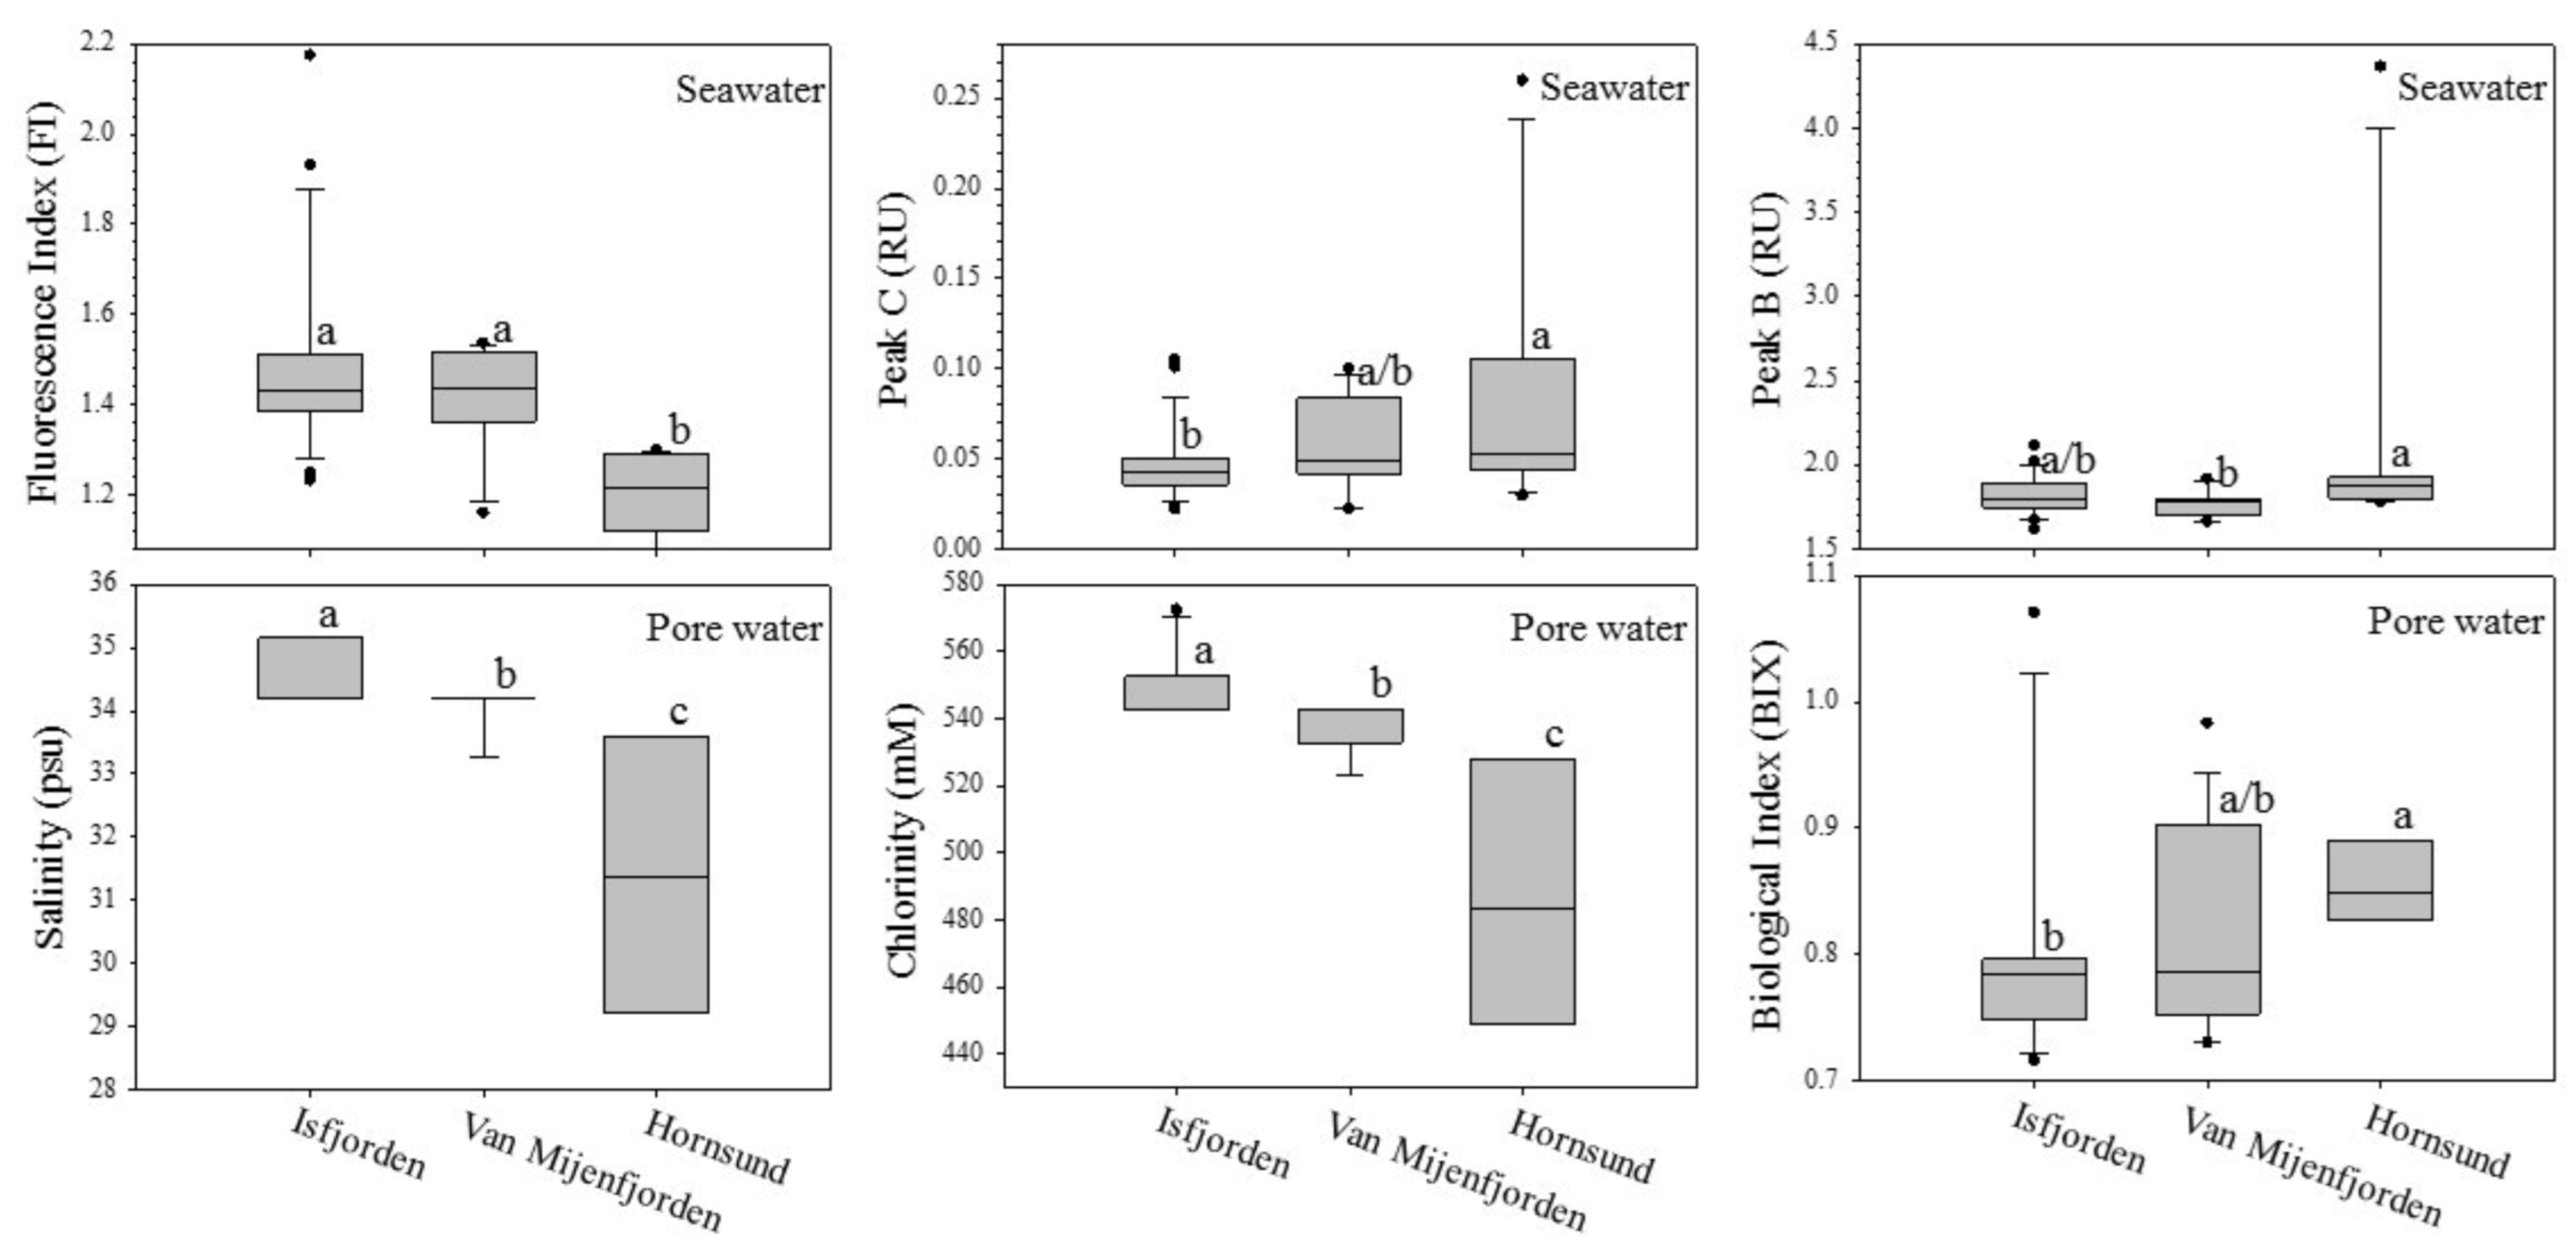
3.2. Cross-Fjord Comparison among the Fjords in the West Svalbard

While seasonal variations of DOM in a West Svalbard fjord were previously recognized [22], spatial variations of DOM and other geochemical parameters in these fjords are poorly understood. Sites S1 and S4 at Isfjorden showed a salinity of ~18 psu at the ocean surface, which is indicative of the glacier melt water and/or the freshwater discharge from a glacier fed river. Similarly, salinity of ~25 psu was seen at site S9 in Hornsund. The temperature is the highest at the surface ocean in Isfjorden (up to ~11 °C). Isfjorden and Hornsund displayed higher levels of chl-a fluorescence signals than Van Mijenfjorden. Cross-fjord comparison of seawater showed significantly lower fluorescence index (FI) in the southern Hornsund, concurrent with higher terrestrial humic-like peak C, implying higher terrestrial inputs to the Hornsund (Figure 4). Meanwhile, pore water displayed an increasing salinity and chlorinity from southern to northern fjords (Figure 4), suggesting higher freshwater flows (e.g., glaciofluvial runoffs) to the southern fjords, in line with higher annual runoff at the southern part of the West Svalbard (up to ~2000 mm yr−1, Figure S6) [3]. The glaciofluvial runoffs from land can carry permafrost- and/or glacier-derived DOM and nutrients to the fjords. Higher impact of terrestrial inputs is also aligned with the aforementioned downcore PO43− patterns (Figure S1), with southern fjords behaved more like that in freshwater sediments (i.e., decreasing downcore trend) as opposite to northern Isfjorden’s increasing downcore trend in typical marine sediments. In addition, higher tyrosine-like peak B in seawater and BIX in pore water at Hornsund were observed, presumably caused by high summer primary productivity. A further principal component analysis (PCA) revealed a wide variation of the DOM optical properties at site S4 and S8 with several outliers at different depths (Figure S7). The PCA graph also displayed a subtle order of Isfjorden → Van Mijenfjorden → Hornsund on the PC1 (58%) distribution from left to right, which showed a more CDOM → FDOM direction that is consistent with the high primary productivity and the FDOM in Hornsund, which was observed previously in summer [19]. The outliers of site S4 in Isfjorden featured the high spatial variability, with different strength of glacial, riverine, permafrost, in situ productivity inputs.

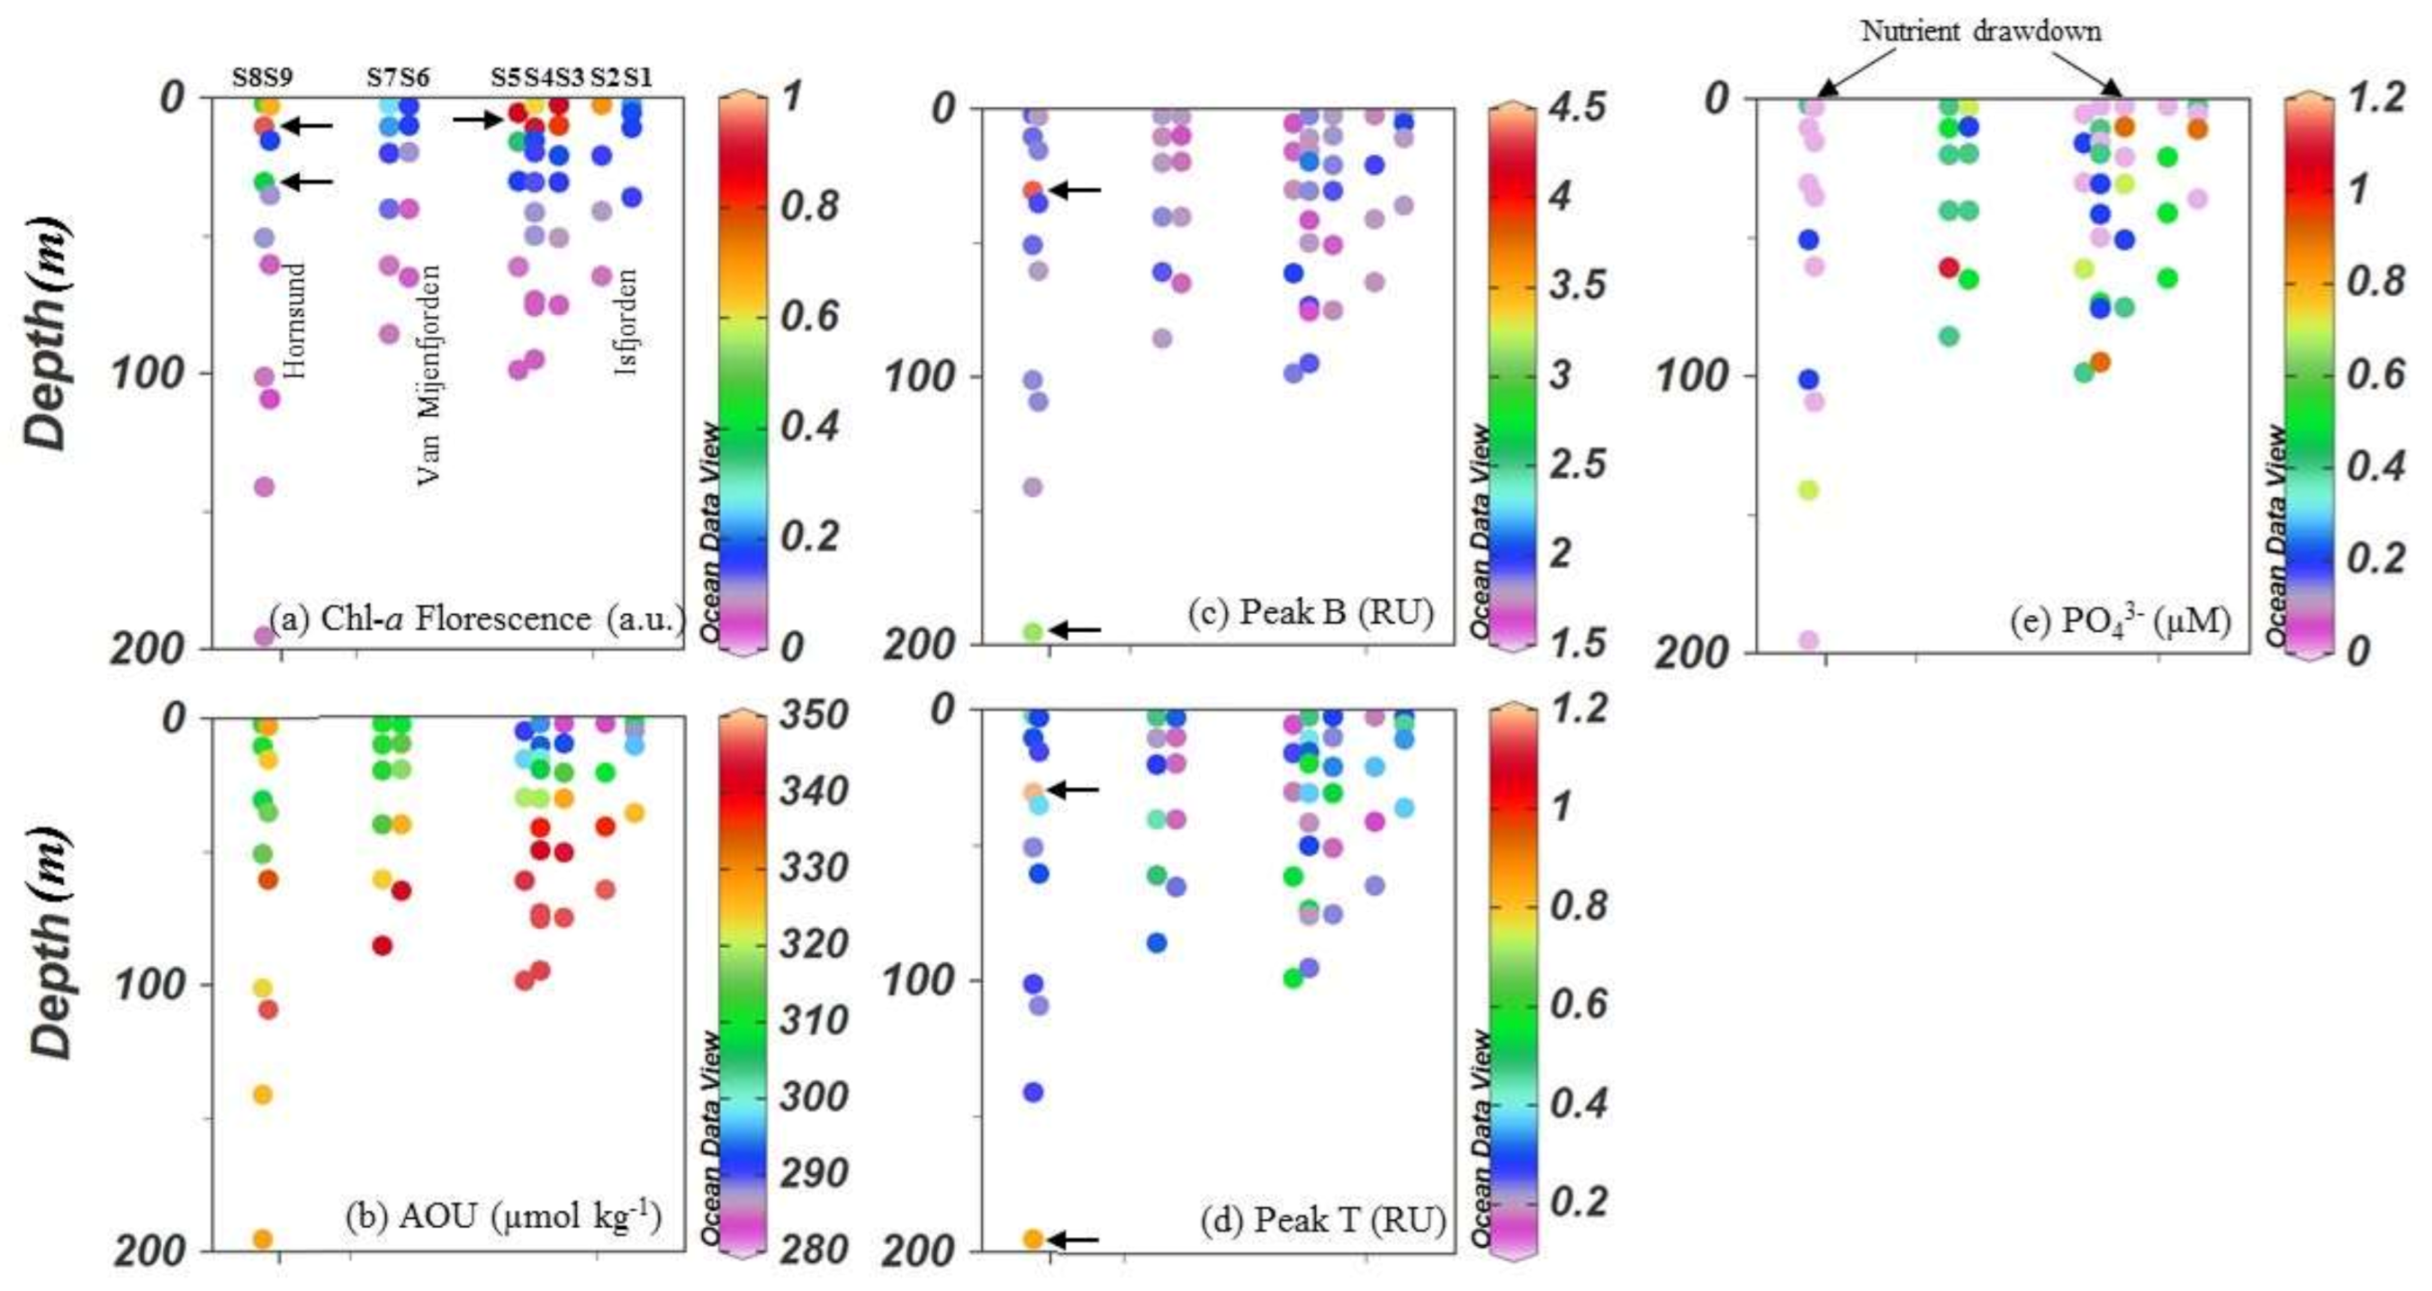
3.3. Extremely High Protein-Like Fluorescence and AOU in Water Column as Well as PO43− Drawdown and the Green Edges at the Surface Ocean: Evidence of a Summer Phytoplankton Bloom

The average values of the tyrosine-like peak B up to 2.4 ± 1.0 RU in the seawater are orders of magnitude higher than those observed in the Arctic Ocean [42,45,61,62]. It is even higher than those observed in the Arctic Ocean during a potential fall phytoplankton bloom (0.35 ± 0.40 RU) [48]. Nevertheless, the maximum values are comparable between the two areas, which were recorded as 4.4 RU at Hornsund of Svalbard vs. 2.0 RU at the East Siberian Sea. The tryptophan-like peak T was also as high as 0.50 ± 0.37 RU in this study. Even though the West Svalbard fjords receive inputs from terrestrial sources, which included glacier and riverine runoffs, the glaciers and the glacier-fed rivers usually exhibited very low DOC and FDOM levels. As such, the extremely high protein-like fluorescence strongly signified that a phytoplankton bloom was in progress or had just occurred. Indeed, such widespread phytoplankton blooms, especially near-ubiquity ice-edge blooms, have been observed and mentioned under a context of the warming climate in the high Arctic region [63,64,65]. The high chl-a concentration and the marine-derived high protein-like FDOM were also observed in the Arctic Ocean [66,67].
The primarily marine-derived high level of CDOM can also corroborate a phytoplankton bloom (Figure 3b). The higher values of the CDOM are associated with higher salinity instead of freshwater affected low salinity sites. Furthermore, the high AOU data through the water column (280 to 350 µmol kg−1) and much higher chl-a fluorometer signal at the surface ocean also support a phytoplankton (Figure 5). The AOU at Hornsund showed 311 and 328 µmol kg−1 even at the surface (2 m and 2.7 m in depth), which signifies fast microbial respiration probably caused by a phytoplankton bloom. The higher level of chl-a signals reached a depth of ~50 m at all sites, which are illustrated by the red circles in Figure 5. In addition, the nutrient drawdown at the surface ocean, especially at Isfjorden and Hornsund, provides further evidence of a phytoplankton bloom. The satellite remote sensing data of chl-a during the sampling period also featured green boundaries along the Svalbard fjords, but the data at some places could not be retrieved due to cloudiness (Figure 6a–f). Taken in conjunction, the multiple lines of evidence support the widespread algal blooms in the summertime at the Svalbard fjords. Furthermore, a characteristic elongated shape EEM fingerprint was observed (Figure 6h), presumably caused by ice algal bloom, which was also seen in Arctic ecosystem affected by ice-edge algal blooms in a prior study [48].

3.4. Production of Alkalinity, Nutrients, and Humic-Like FDOM with Depth in Pore Water Via Biological Diagenesis in Glaciomarine Sediments from Fjords

In this study, the general increasing down core trends were found for alkalinity and the humic-like FDOM above the sulfate-methane-transition-zone (SMTZ) as reported in the typical marine sediments without subsea permafrost (Figure 7, Figures S3 and S4) [52]. The particulate organic carbon sulfate reduction (POCSR: 2CH2O + SO42 → H2S + 2HCO3) can generate alkalinity and release nutrients and DOM, which was previously observed [52]. After fitting the data into a first-order kinetic model based on Equation (1), the production rate constant k and the square of the coefficient of the correlation were estimated (Table S4 and Figure S4). As a result, the longest core, which was 4.65 mbsf at site P3 in the central part of the shallow-silled Isfjorden, showed a first-order accumulation trend for alkalinity, PO43−, absorption coefficients, and all five of the FDOM peaks (R2 > 0.90 except for 0.81 for peak T). Site P3 also exhibited a generally higher production rate k compared to the other sites, which ranged from 0.12 RU m−1 for peak M to 0.55 RU m−1 for peak T.
A spatial comparison among different areas in the high Arctic showed that humic-like FDOM accumulation with depth is comparable to that in the highly productive Chukchi Sea (Table 1). Although the core lengths are generally shorter than those in the Chukchi Sea, the net increase of FDOM is up to 14 RU in the West Svalbard fjord, much higher than those in the Chukchi Sea except for site S1 there.

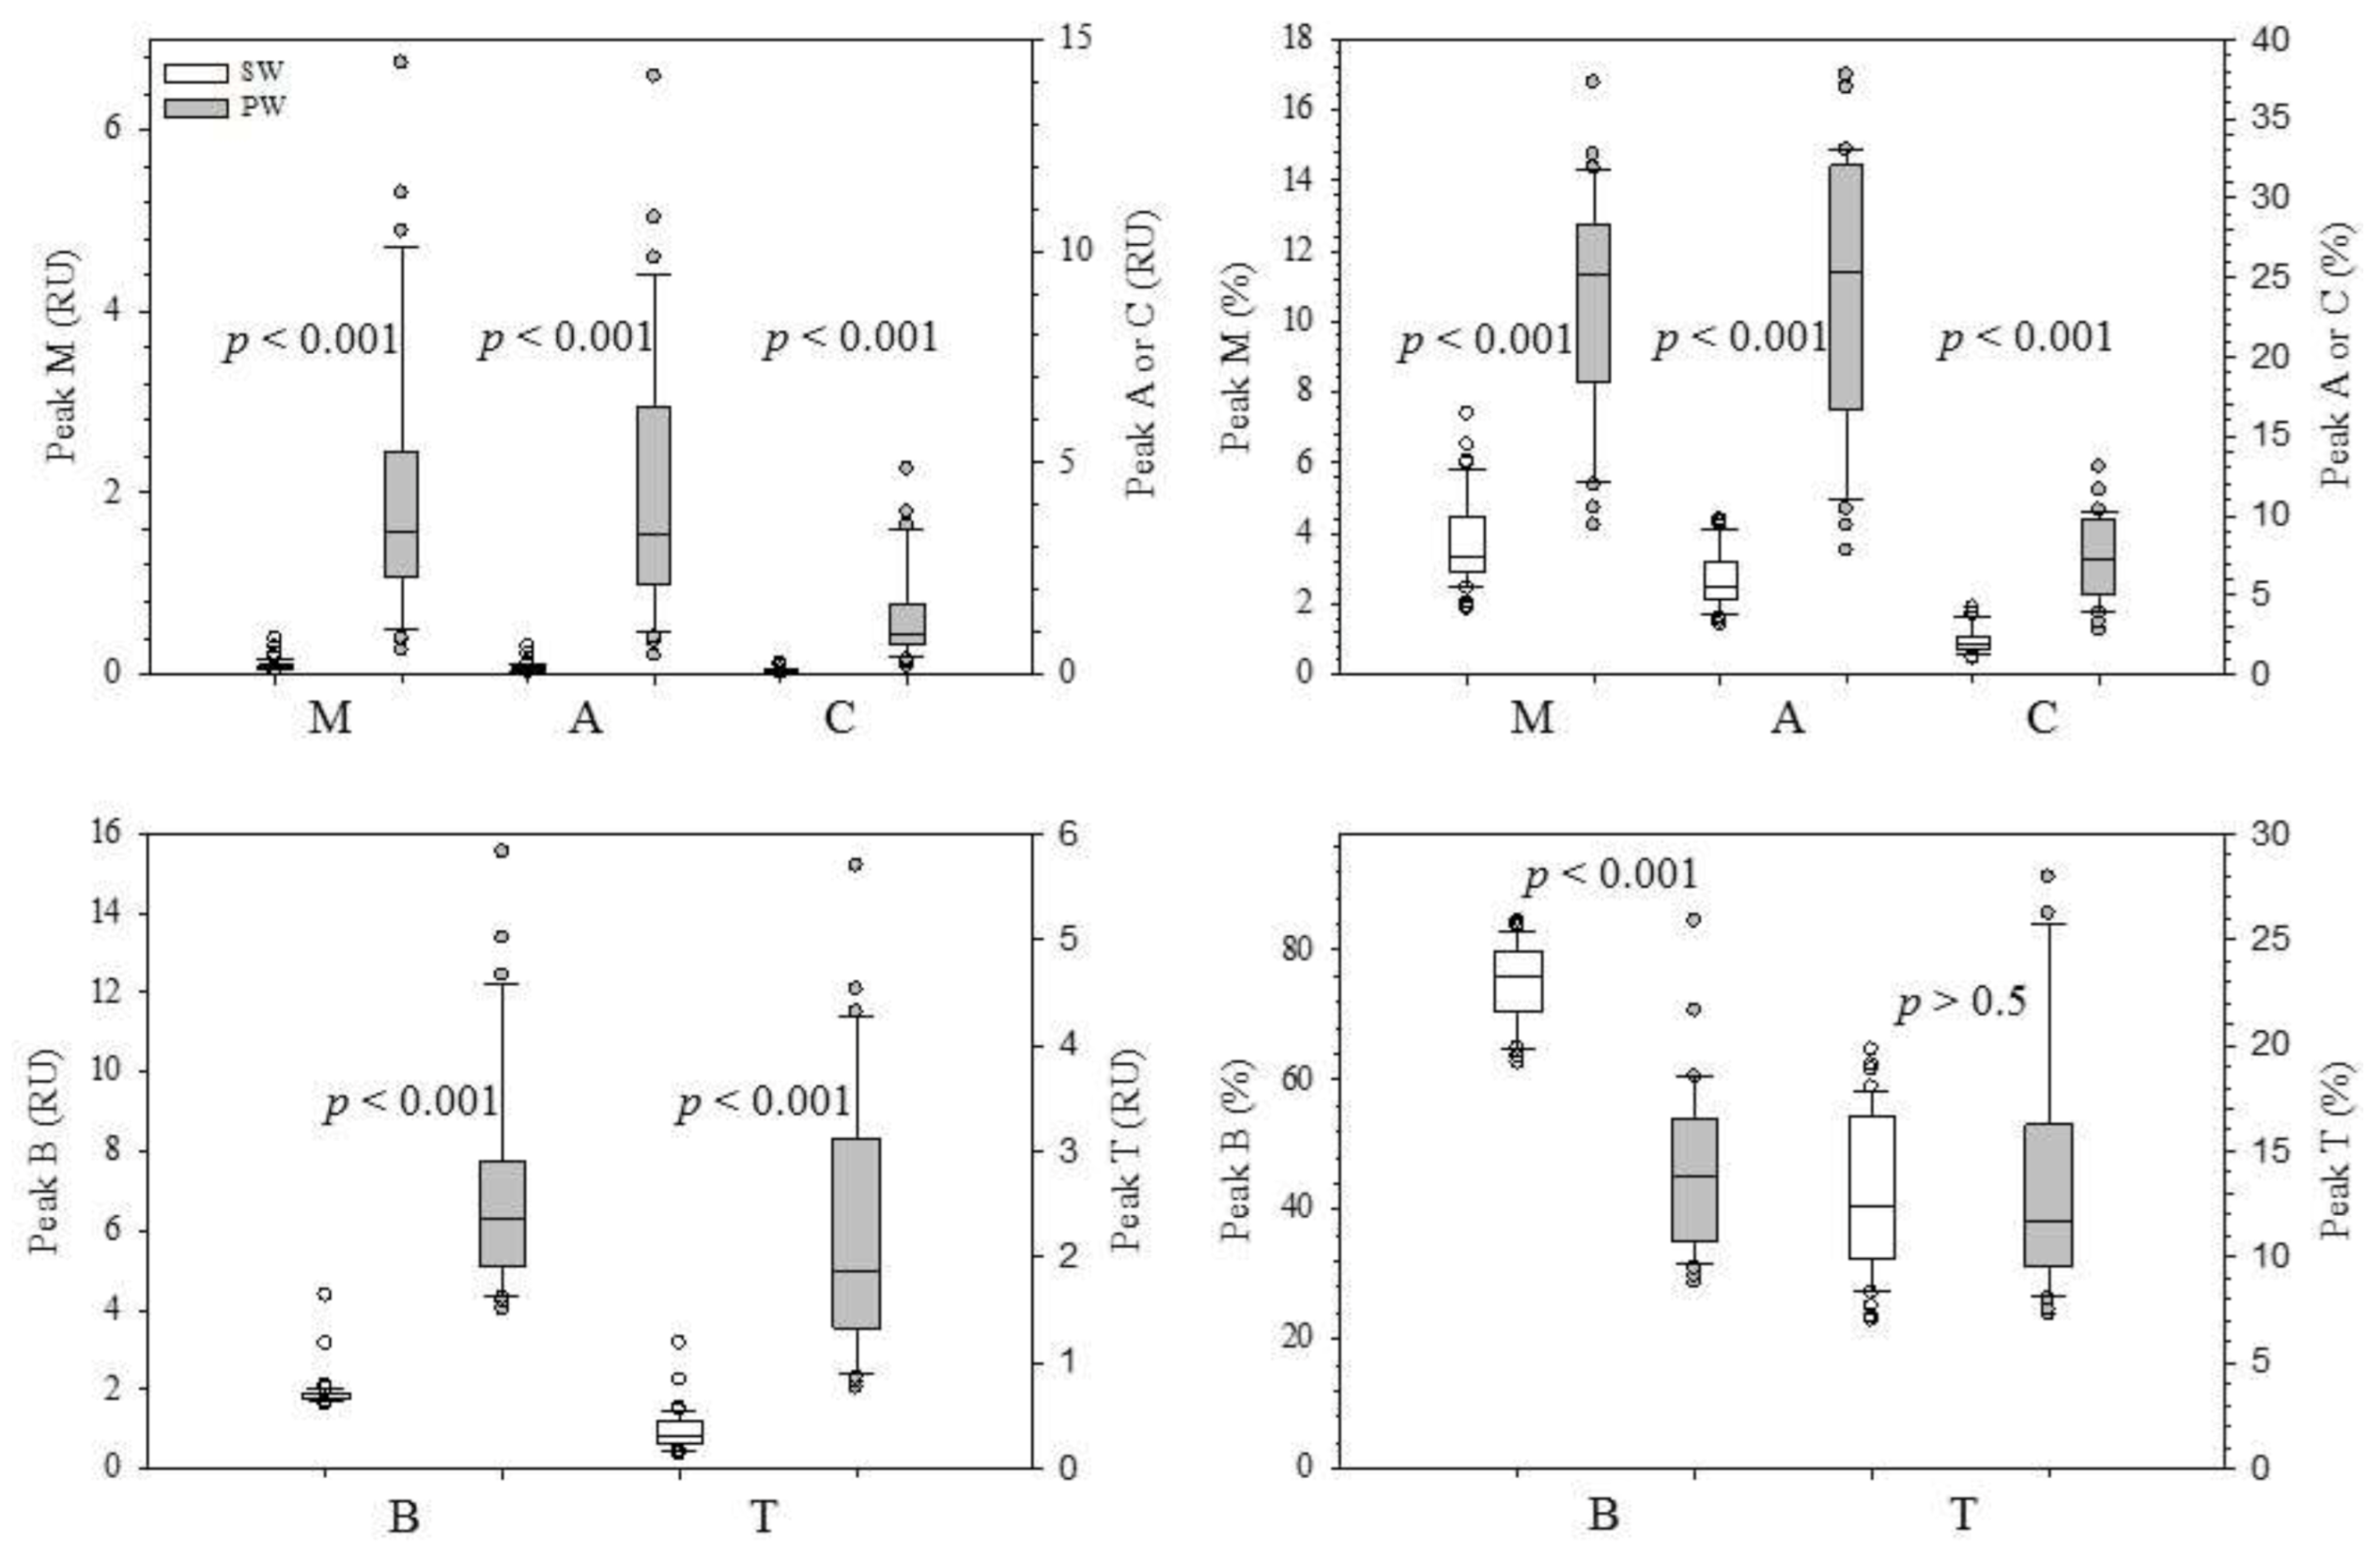
3.5. Comparison of FDOM between the Seawater and Pore Water

The box plots were generated to facilitate a comparison of the different properties between seawater and pore water (Figure 8 and Figure S5). The salinity of the seawater was significantly higher than that of the pore water, which was opposite to the chlorinity (p < 0.05). As expected, the PO43− was 1–3 orders of magnitude higher in the pore water, which were probably via the POCSR release in the anaerobic sediments (p < 0.001). Both absorption coefficients, which included a254 and a320, were much higher in the pore water than in the surface seawater (p < 0.001). The absorption coefficient was higher in the pore water than in the seawater by one order of magnitude for a254 and by 2–3 orders of magnitude higher for a320. The differences might be attributed to the fact that a254, which potentially encompasses more bio-labile proteins and amino acids at this shorter wavelength, can be produced via the primary productivity in the seawater. For the FDOM, the absolute abundance of all five peaks were much higher in the pore water (p < 0.001). Peak B was ~3 times higher in the pore waters, and peak T was about one order of magnitude higher in the pore water. The humic-like peaks M, C, and A were 1–2 orders of magnitude higher in the pore water. The findings here are generally consistent with the prior reports that sediments can serve as sources of the DOM and nutrients to the overlying water columns [52,60,69]. This is also confirmed from the high FDOM level at the seafloor, which is indicated by the arrows in Figure 5. For the relative abundances, which represents a FDOM composition, the tyrosine-like peak B displayed a higher abundance in the sea water than in the sediment pore water, but the tryptophan-like peak T showed insignificant differences. The humic-like peaks showed a similar trend than the absolute abundance. The relatively higher abundance of the tyrosine-like fluorescence in the seawater versus the sediment pore water was consistent with our previous inference of the potential phytoplankton bloom in the seawater.

4. Conclusions

A study of the salinity, nutrients, alkalinity, and the DOM optical properties in both the seawater and the pore water from the West Svalbard fjords revealed an obvious spatial variation among the fjords in the West Svalbard. The south most fjord of Hornsund is heavily affected by terrestrial glaciofluvial runoff in summer as signified by much lower fluorescence index and higher terrestrial humic-like peak C in the seawaters and much lower salinity, Cl in the pore waters, which is consistent with the much higher annual runoff to this fjord. As such, increasing runoff (>35% from 1980) are projected to carry more terrestrial-derived DOM in response to ongoing climate warming to the sensitive Arctic fjords and surrounding shelf ecosystems. Furthermore, we infer that a summer phytoplankton bloom was in progress, or it had just occurred in the high Arctic fjords with partial sea ice cover in summer. A special elongated fluorescent EEM fingerprint was presumed to be a proxy of ice algal bloom. In addition, different from the Arctic sediments underlain by subsea permafrost, the downcore production of humic-like fluorescence in the pore water implies the possibility of the glaciomarine sediments in the Svalbard fjords to serve as sources of DOM for water columns. While the absolute abundance of all the FDOM peaks are higher in the pore water than in the seawater, the opposite trend of the tyrosine-like peak B in its relative abundance was consistent with a phytoplankton bloom in the water column, which implied a relatively labile nature of this protein-like DOM in the sediments as well.
While optical measurements of DOM in this study have advantages of small sample volume required, high sensitivity, and high throughput, the analytical window can only capture the signals of chromophores and fluorophores in DOM. Other analytical methods, such as high resolution Fourier-transform ion cyclotron resonance mass spectrometry (FT-ICR MS) and nuclear magnetic resonance (NMR), can be used as complementary tools to investigate DOM characteristics and dynamics in the high Arctic fjords in the future. In addition, more long-term in situ observation combined with remote sensing are needed to effectively monitor responses of the Arctic fjords and coastal shelf areas to the increasing glaciofluvial runoff and sea ice shrinkage triggered by the ongoing climate warming, especially at the heavily affected southern fjords in the West Svalbard.

Supplementary Materials

The following are available online at https://www.mdpi.com/2073-4441/13/2/202/s1, Figure S1: Downcore profile of salinity, Cl, and PO43− in the pore waters from the west Svalbard fjords, Figure S2: Downcore profile of absorption coefficients and protein-like peaks in pore waters from the west Svalbard fjords, Figure S3: Examples of increasing downcore profile of the humic-like FDOM in pore waters from the west Svalbard fjords, Figure S4: Examples of first order production (Cd = a × e(k×d) + b) of nutrient, FDOM, and alkalinity (p < 0.05) with depth at site P3 for pore waters from the Svalbard Figure 4. k unit: m−1, Figure S5: Comparison of water chemistry and DOM parameters between surface and pore waters from the Svalbard fjords. p-values show beside each pair denote that they are significantly different when p < 0.05, Figure S6: Estimated annual runoff (unit: mm yr−1) in Svalbard. From http://www. miljodirektoratet.no/M1242, page 86, Figure S7: The principal component analysis (PCA) based on the optical parameters for the seawater (S) from the West Svalbard Fjord of the Arctic Ocean. The numbers beside the symbols are ordered with an increasing depth at each site, Table S1: Original site names during 2016 R/V cruise with Helmer Hanssen, Table S2: Summary of water chemistry and the DOM parameters for seawater in the West Svalbard fjords, Table S3: Summary of the water chemistry and the DOM parameters for pore waters in the West Svalbard fjords, Table S4: Comparison of first-order production rate constant k (m−1) with depth (Equation (2)) for DOM, PO43−, and alkalinity in the pore waters from the high Arctic (p < 0.05).

Author Contributions

M.C. wrote the first draft. J.-H.K. conduced sampling and onboard analyses. S.H. created the satellite images. Y.K.L. did experimental work for DOM analyses, M.H.K. did inorganic analyses. Y.K.J. planed the project. J.H. edited the manuscript. All authors have read and agreed to the published version of the manuscript.

Funding

This work was supported by the National Research Foundation of Korea (NRF) grant funded by the Korean government (MSIP) (No. 2020R1A4A2002823) and by the Korea Polar Research Institute Grants PM18050 and NP2018-022 (KIMST Grant 20160247). M.C. appreciates a key discipline fund in environmental science and engineering from Guangdong Province, China.

Institutional Review Board Statement

Not applicable.

Informed Consent Statement

Not applicable.

Data Availability Statement

Data is contained within the article and supplementary material. Further data and materials requests should be addressed to Jin Hur at [email protected] or Meilian Chen at [email protected].

Acknowledgments

The authors thank the science party and the captain and the crew of the R/V Helmer Hanssen for help with the coring processing during the Arctic expedition in 2016.

Conflicts of Interest

The authors declare no conflict of interest.

References

  1. Calleja, M.L.; Kerhervé, P.; Bourgeois, S.; Kędra, M.; Leynaert, A.; Devred, E.; Babin, M.; Morata, N. Effects of increase glacier discharge on phytoplankton bloom dynamics and pelagic geochemistry in a high Arctic fjord. Prog. Oceanogr. 2017, 159, 195–210. [Google Scholar] [CrossRef] [Green Version]
  2. Müller, O.; Seuthe, L.; Bratbak, G.; Paulsen, M.L. Bacterial Response to Permafrost Derived Organic Matter Input in an Arctic Fiord. Front. Mar. Sci. 2018, 5, 263. [Google Scholar] [CrossRef] [Green Version]
  3. Hanssen-Bauer, I.; Førland, E.J.; Hisdal, H.; Mayer, S.; Sandø, A.B.; Sorteberg, A. Climate in Svalbard 2100—A Knowledge Base for Climate Adaptation. Norwegian Environment Agency, 2019. Available online: http://www.miljodirektoratet.no/M1242 (accessed on 8 December 2019).
  4. Krajewska, M.; Szymczak-Żyła, M.; Tylmann, W.; Kowalewska, G. Climate change impact on primary production and phytoplankton taxonomy in Western Spitsbergen fjords based on pigments in sediments. Glob. Planet. Chang. 2020, 189, 103158. [Google Scholar] [CrossRef]
  5. Bianchi, T.S.; Arndt, S.; Austin, W.E.N.; Benn, D.I.; Bertrand, S.; Cui, X.; Faust, J.C.; Koziorowska-Makuch, K.; Moy, C.M.; Savage, C.; et al. Fjords as Aquatic Critical Zones (ACZs). Earth Sci. Rev. 2020, 203, 103145. [Google Scholar] [CrossRef]
  6. Ferré, B.; Mienert, J.; Feseker, T. Ocean temperature variability for the past 60 years on the Norwegian-Svalbard margin influences gas hydrate stability on human time scales. J. Geophys. Res. Ocean. 2012, 117, C10017. [Google Scholar] [CrossRef] [Green Version]
  7. Nordli, Ø.; Przybylak, R.; Ogilvie, A.E.J.; Isaksen, K. Long-term temperature trends and variability on Spitsbergen: The extended Svalbard Airport temperature series, 1898–2012. Polar Res. 2014, 33, 21349. [Google Scholar] [CrossRef] [Green Version]
  8. Nuth, C.; Kohler, J.; König, M.; von Deschwanden, A.; Hagen, J.O.; Kääb, A.; Moholdt, G.; Pettersson, R. Decadal changes from a multi-temporal glacier inventory of Svalbard. Cryosphere 2013, 7, 1603–1621. [Google Scholar] [CrossRef] [Green Version]
  9. Pfeffer, W.T.; Arendt, A.A.; Bliss, A.; Bolch, T.; Cogley, J.G.; Gardner, A.S.; Hagen, J.-O.; Hock, R.; Kaser, G.; Kienholz, C.; et al. The Randolph Glacier Inventory: A globally complete inventory of glaciers. J. Glaciol. 2014, 60, 537–552. [Google Scholar] [CrossRef] [Green Version]
  10. Martín-Español, A.; Navarro, F.J.; Otero, J.; Lapazaran, J.J.; Błaszczyk, M. Estimate of the total volume of Svalbard glaciers, and their potential contribution to sea-level rise, using new regionally based scaling relationships. J. Glaciol. 2015, 61, 29–41. [Google Scholar] [CrossRef] [Green Version]
  11. Rachlewicz, G.; Szczuciński, W.; Ewertowski, M. Post-“Little Ice Age” retreat rates of glaciers around Billefjorden in central Spitsbergen, Svalbard. Pol. Polar Res. 2007, 28, 159–186. [Google Scholar]
  12. Kim, J.-H.; Peterse, F.; Willmott, V.; Kristensen, D.K.; Baas, M.; Schouten, S.; Damsté, J.S.S. Large ancient organic matter contributions to Arctic marine sediments (Svalbard). Limnol. Oceanogr. 2011, 56, 1463–1474. [Google Scholar] [CrossRef] [Green Version]
  13. Holding, J.M.; Duarte, C.M.; Delgado-Huertas, A.; Soetaert, K.; Vonk, J.E.; Agustí, S.; Wassmann, P.; Middelburg, J.J. Autochthonous and allochthonous contributions of organic carbon to microbial food webs in Svalbard fjords. Limnol. Oceanogr. 2017, 62, 1307–1323. [Google Scholar] [CrossRef] [Green Version]
  14. Zhu, Z.Y.; Wu, Y.; Liu, S.M.; Wenger, F.; Hu, J.; Zhang, J.; Zhang, R.F. Organic carbon flux and particulate organic matter composition in Arctic valley glaciers: Examples from the Bayelva River and adjacent Kongsfjorden. Biogeosciences 2016, 13, 975–987. [Google Scholar] [CrossRef] [Green Version]
  15. Hood, E.; Fellman, J.; Spencer, R.G.M.; Hernes, P.J.; Edwards, R.; D’Amore, D.; Scott, D. Glaciers as a source of ancient and labile organic matter to the marine environment. Nature 2009, 462, 1044–1047. [Google Scholar] [CrossRef] [PubMed]
  16. Spencer, R.G.M.; Guo, W.D.; Raymond, P.A.; Dittmar, T.; Hood, E.; Fellman, J.; Stubbins, A. Source and biolability of ancient dissolved organic matter in glacier and lake ecosystems on the Tibetan Plateau. Geochim. Cosmochim. Acta 2014, 142, 64–74. [Google Scholar] [CrossRef]
  17. Jørgensen, L.; Stedmon, C.A.; Granskog, M.A.; Middelboe, M. Tracing the long-term microbial production of recalcitrant fluorescent dissolved organic matter in seawater. Geophys. Res. Lett. 2014, 41, 2481–2488. [Google Scholar] [CrossRef]
  18. Hop, H.; Pearson, T.; Hegseth, E.N.; Kovacs, K.M.; Wiencke, C.; Kwasniewski, S.; Eiane, K.; Mehlum, F.; Gulliksen, B.; Wlodarska-Kowalczuk, M.; et al. The marine ecosystem of Kongsfjorden, Svalbard. Polar Res. 2002, 21, 167–208. [Google Scholar] [CrossRef]
  19. Piwosz, K.; Walkusz, W.; Hapter, R.; Wieczorek, P.; Hop, H.; Wiktor, J. Comparison of productivity and phytoplankton in a warm (Kongsfjorden) and a cold (Hornsund) Spitsbergen fjord in mid-summer 2002. Polar Biol. 2009, 32, 549–559. [Google Scholar] [CrossRef]
  20. Zofia, T.S.; Tatarek, A.; Józef, M.W.; Józef, M.W., Jr.; Kubiszyn, A.; Jan, M.W. Primary producers and production in Hornsund and Kongsfjorden—Comparison of two fjord systems. Pol. Polar Res. 2017, 38, 351. [Google Scholar]
  21. Osterholz, H.; Dittmar, T.; Niggemann, J. Molecular evidence for rapid dissolved organic matter turnover in Arctic fjords. Mar. Chem. 2014, 160, 1–10. [Google Scholar] [CrossRef]
  22. Brogi, S.R.; Jung, J.Y.; Ha, S.-Y.; Hur, J. Seasonal differences in dissolved organic matter properties and sources in an Arctic fjord: Implications for future conditions. Sci. Total Environ. 2019, 694, 133740. [Google Scholar]
  23. Arnosti, C.; Jørgensen, B.B. Organic Carbon Degradation in Arctic Marine Sediments, Svalbard: A Comparison of Initial and Terminal Steps. Geomicrobiol. J. 2006, 23, 551–563. [Google Scholar] [CrossRef]
  24. Koziorowska, K.; Kuliński, K.; Pempkowiak, J. Sedimentary organic matter in two Spitsbergen fjords: Terrestrial and marine contributions based on carbon and nitrogen contents and stable isotopes composition. Cont. Shelf Res. 2016, 113, 38–46. [Google Scholar] [CrossRef]
  25. Koziorowska, K.; Kulinski, K.; Pempkowiak, J. Comparison of the burial rate estimation methods of organic and inorganic carbon and quantification of carbon burial in two high Arctic fjords. Oceanologia 2018, 60, 405–418. [Google Scholar] [CrossRef]
  26. Zaborska, A.; Włodarska-Kowalczuk, M.; Legeżyńska, J.; Jankowska, E.; Winogradow, A.; Deja, K. Sedimentary organic matter sources, benthic consumption and burial in west Spitsbergen fjords—Signs of maturing of Arctic fjordic systems? J. Mar. Syst. 2018, 180, 112–123. [Google Scholar] [CrossRef]
  27. Oni, O.E.; Schmidt, F.; Miyatake, T.; Kasten, S.; Witt, M.; Hinrichs, K.-U.; Friedrich, M.W. Microbial Communities and Organic Matter Composition in Surface and Subsurface Sediments of the Helgoland Mud Area, North Sea. Front. Microbiol. 2015, 6, 1290. [Google Scholar] [CrossRef]
  28. Valle, J.; Harir, M.; Gonsior, M.; Enrich-Prast, A.; Schmitt-Kopplin, P.; Bastviken, D.; Hertkorn, N. Molecular differences between water column and sediment pore water SPE-DOM in ten Swedish boreal lakes. Water Res. 2020, 170, 115320. [Google Scholar] [CrossRef]
  29. Syvitski, J.P.M.; Burrell, D.C.; Skei, J.M. Fjords. Processes and Products; Springer: New York, NY, USA, 1987. [Google Scholar]
  30. Hagen, J.O.; Liestøl, O.; Roland, E.; Jørgensen, T. Glacier Atlas of Svalbard and Jan Mayen; Norwegian Polar Institute: Oslo, Norway, 1993. [Google Scholar]
  31. König, M.; Nuth, C.; Kohler, J.; Moholdt, G.; Pettersen, R. A digital glacier database for Svalbard. In Global Land Ice Measurements from Space; Kargel, J.S., Leonard, G.J., Bishop, M.P., Kääb, A., Raup, B.H., Eds.; Springer: Berlin/Heidelberg, Germany, 2014. [Google Scholar]
  32. Cottier, F.R.; Nilsen, F.; Skogseth, R.; Tverberg, V.; Skarðhamar, J.; Svendsen, H. Arctic fjords: A review of the oceanographic environment and dominant physical processes. Geol. Soc. 2010, 344, 35–50. [Google Scholar] [CrossRef]
  33. Wehrmann, L.M.; Riedinger, N.; Brunner, B.; Kamyshny, A.; Hubert, C.R.J.; Herbert, L.C.; Bruchert, V.; Jorgensen, B.B.; Ferdelman, T.G.; Formolo, M.J. Iron-controlled oxidative sulfur cycling recorded in the distribution and isotopic composition of sulfur species in glacially influenced fjord sediments of west Svalbard. Chem. Geol. 2017, 466, 678–695. [Google Scholar] [CrossRef]
  34. Rudels, B.; Björk, G.; Nilsson, J.; Winsor, P.; Lake, I.; Nohr, C. The interaction between waters from the Arctic Ocean and the Nordic Seas north of Fram Strait and along the East Greenland Current: Results from the Arctic Ocean-02 Oden expedition. J. Mar. Syst. 2005, 55, 1–30. [Google Scholar] [CrossRef]
  35. Kumar, V.; Tiwari, M.; Rengarajan, R. Warming in the Arctic Captured by productivity variability at an Arctic Fjord over the past two centuries. PLoS ONE 2018, 13, e0201456. [Google Scholar] [CrossRef] [PubMed]
  36. Schlitzer, R. Ocean Data View. 2019. Available online: http://odv.awi.de (accessed on 8 December 2019).
  37. Hagen, J.O.; Kohler, J.; Melvold, K.; Winther, J.-G. Glaciers in Svalbard: Mass balance, runoff and freshwater flux. Polar Res. 2003, 22, 145–159. [Google Scholar] [CrossRef] [Green Version]
  38. Svendsen, H.; Beszczynska-Møller, A.; Hagen, J.O.; Lefauconnier, B.; Tverberg, V.; Gerland, S.; Ørbøk, J.B.; Bischof, K.; Papucci, C.; Zajaczkowski, M.; et al. The physical environment of Kongsfjorden–Krossfjorden, an Arctic fjord system in Svalbard. Polar Res. 2002, 21, 133–166. [Google Scholar]
  39. Cottier, F.; Tverberg, V.; Inall, M.; Svendsen, H.; Nilsen, F.; Griffiths, C. Water mass modification in an Arctic fjord through cross-shelf exchange: The seasonal hydrography of Kongsfjorden, Svalbard. J. Geophys. Res. Ocean. 2005, 110, C12005. [Google Scholar] [CrossRef] [Green Version]
  40. Van de Velde, S.; Lesven, L.; Burdorf, L.D.W.; Hidalgo-Martinez, S.; Geelhoed, J.S.; Van Rijswijk, P.; Gao, Y.; Meysman, F.J.R. The impact of electrogenic sulfur oxidation on the biogeochemistry of coastal sediments: A field study. Geochim. Cosmochim. Acta 2016, 194, 211–232. [Google Scholar] [CrossRef]
  41. Thieme, L.; Graeber, D.; Kaupenjohann, M.; Siemens, J. Fast-freezing with liquid nitrogen preserves bulk dissolved organic matter concentrations, but not its composition. Biogeosciences 2016, 13, 4697–4705. [Google Scholar] [CrossRef] [Green Version]
  42. Walker, S.A.; Amon, R.M.W.; Stedmon, C.; Duan, S.W.; Louchouarn, P. The use of PARAFAC modeling to trace terrestrial dissolved organic matter and fingerprint water masses in coastal Canadian Arctic surface waters. J. Geophys. Res. Biogeosci. 2009, 114, G00F06. [Google Scholar] [CrossRef]
  43. Stedmon, C.A.; Amon, R.M.W.; Rinehart, A.J.; Walker, S.A. The supply and characteristics of colored dissolved organic matter (CDOM) in the Arctic Ocean: Pan Arctic trends and differences. Mar. Chem. 2011, 124, 108–118. [Google Scholar] [CrossRef]
  44. Hancke, K.; Hovland, E.K.; Volent, Z.; Pettersen, R.; Johnsen, G.; Moline, M.; Sakshaug, E. Optical properties of CDOM across the Polar Front in the Barents Sea: Origin, distribution and significance. J. Mar. Syst. 2014, 130, 219–227. [Google Scholar] [CrossRef] [Green Version]
  45. Logvinova, C.L.; Frey, K.E.; Mann, P.J.; Stubbins, A.; Spencer, R.G.M. Assessing the potential impacts of declining Arctic sea ice cover on the photochemical degradation of dissolved organic matter in the Chukchi and Beaufort Seas. J. Geophys. Res. Biogeosci. 2015, 120, 2326–2344. [Google Scholar] [CrossRef] [Green Version]
  46. Johnsen, G.; Norli, M.; Moline, M.; Robbins, I.; von Quillfeldt, C.; Sørensen, K.; Cottier, F.; Berge, J. The advective origin of an under-ice spring bloom in the Arctic Ocean using multiple observational platforms. Polar Biol. 2018, 41, 1197–1216. [Google Scholar] [CrossRef] [PubMed] [Green Version]
  47. Lawaetz, A.J.; Stedmon, C.A. Fluorescence Intensity Calibration Using the Raman Scatter Peak of Water. Appl. Spectrosc. 2009, 63, 936–940. [Google Scholar] [CrossRef] [PubMed]
  48. Chen, M.; Nam, S.-I.; Kim, J.-H.; Kwon, Y.-J.; Hong, S.; Jung, J.; Shin, K.-H.; Hur, J. High abundance of protein-like fluorescence in the Amerasian Basin of Arctic Ocean: Potential implication of a fall phytoplankton bloom. Sci. Total Environ. 2017, 599–600, 355–363. [Google Scholar] [CrossRef] [PubMed]
  49. Zsolnay, A.; Baigar, E.; Jimenez, M.; Steinweg, B.; Saccomandi, F. Differentiating with fluorescence spectroscopy the sources of dissolved organic matter in soils subjected to drying. Chemosphere 1999, 38, 45–50. [Google Scholar] [CrossRef]
  50. McKnight, D.M.; Boyer, E.W.; Westerhoff, P.K.; Doran, P.T.; Kulbe, T.; Andersen, D.T. Spectrofluorometric characterization of dissolved organic matter for indication of precursor organic material and aromaticity. Limnol. Oceanogr. 2001, 46, 38–48. [Google Scholar] [CrossRef]
  51. Huguet, A.; Vacher, L.; Relexans, S.; Saubusse, S.; Froidefond, J.M.; Parlanti, E. Properties of fluorescent dissolved organic matter in the Gironde Estuary. Org. Geochem. 2009, 40, 706–719. [Google Scholar] [CrossRef]
  52. Burdige, D.J.; Komada, T. Sediment Pore Waters, 2nd ed.; Academic Press: Cambridge, MA, USA, 2015. [Google Scholar]
  53. Chen, M.; Kim, S.-H.; Jung, H.-J.; Hyun, J.-H.; Choi, J.H.; Lee, H.-J.; Huh, I.-A.; Hur, J. Dynamics of dissolved organic matter in riverine sediments affected by weir impoundments: Production, benthic flux, and environmental implications. Water Res. 2017, 121, 150–161. [Google Scholar] [CrossRef]
  54. NASA Goddard Space Flight Center; Ocean Ecology Laboratory; Ocean Biology Processing Group. MODIS—Aqua Ocean Color Data; NASA Ocean Biology Distibuted Active Archive Center: Greenbelt, MD, USA, 2014. [Google Scholar] [CrossRef]
  55. O’Reilly, J.E.; Maritorena, S.; Mitchell, B.G.; Siegel, D.A.; Carder, K.L.; Garver, S.A.; Kahru, M.; McClain, C.R. Ocean color chlorophyll algorithms for SeaWiFS. J. Geophys. Res. 1998, 103, 24937–24953. [Google Scholar] [CrossRef] [Green Version]
  56. Hu, C.; Lee, Z.; Franz, B. Chlorophyll a algorithms for oligotrophic oceans: A novel approach based on three-band reflectance difference. J. Geophys. Res. 2012, 117, C01011. [Google Scholar] [CrossRef] [Green Version]
  57. Pugach, S.P.; Pipko, I.I.; Semiletov, I.P.; Sergienko, V.I. Optical characteristics of the colored dissolved organic matter on the East Siberian shelf. Dokl. Earth Sci. 2015, 465, 1293–1296. [Google Scholar] [CrossRef]
  58. Kowalczuk, P.; Meler, J.; Kauko, H.M.; Pavlov, A.K.; Zabłocka, M.; Peeken, I.; Dybwad, C.; Castellani, G.; Granskog, M.A. Bio-optical properties of Arctic drift ice and surface waters north of Svalbard from winter to spring. J. Geophys. Res. Ocean. 2017, 122, 4634–4660. [Google Scholar] [CrossRef]
  59. Roden, E.E.; Edmonds, J.W. Phosphate mobilization in iron-rich anaerobic sediments: Microbial Fe(III) oxide reduction versus iron-sulfide formation. Arch. Hydrobiol. 1997, 139, 347–378. [Google Scholar] [CrossRef]
  60. Chen, M.; Kim, J.-H.; Nam, S.-I.; Niessen, F.; Hagen, W.-L.; Kang, M.-H.; Hur, J. Production of fluorescent dissolved organic matter in Arctic Ocean sediments. Sci. Rep. 2016, 6, 39213. [Google Scholar] [CrossRef] [PubMed] [Green Version]
  61. Guéguen, C.; Cuss, C.W.; Cassels, C.J.; Carmack, E.C. Absorption and fluorescence of dissolved organic matter in the waters of the Canadian Arctic Archipelago, Baffin Bay, and the Labrador Sea. J. Geophys. Res. Ocean. 2014, 119, 2034–2047. [Google Scholar] [CrossRef]
  62. Guéguen, C.; McLaughlin, F.A.; Carmack, E.C.; Itoh, M.; Narita, H.; Nishino, S. The nature of colored dissolved organic matter in the southern Canada Basin and East Siberian Sea. Deep Sea Res. Part II: Top. Stud. Oceanogr. 2012, 81, 102–113. [Google Scholar]
  63. Perrette, M.; Yool, A.; Quartly, G.D.; Popova, E.E. Near-ubiquity of ice-edge blooms in the Arctic. Biogeosciences 2011, 8, 515–524. [Google Scholar] [CrossRef] [Green Version]
  64. Ardyna, M.; Babin, M.; Gosselin, M.; Devred, E.; Rainville, L.; Tremblay, J.-É. Recent Arctic Ocean sea ice loss triggers novel fall phytoplankton blooms. Geophys. Res. Lett. 2014, 41, 6207–6212. [Google Scholar] [CrossRef]
  65. Uchimiya, M.; Motegi, C.; Nishino, S.; Kawaguchi, Y.; Inoue, J.; Ogawa, H.; Nagata, T. Coupled Response of Bacterial Production to a Wind-Induced Fall Phytoplankton Bloom and Sediment Resuspension in the Chukchi Sea Shelf, Western Arctic Ocean. Front. Mar. Sci. 2016, 3, 231. [Google Scholar] [CrossRef] [Green Version]
  66. Yamashita, Y.; Hashihama, F.; Saito, H.; Fukuda, H.; Ogawa, H. Factors controlling the geographical distribution of fluorescent dissolved organic matter in the surface waters of the Pacific Ocean. Limnol. Oceanogr. 2017, 62, 2360–2374. [Google Scholar] [CrossRef] [Green Version]
  67. Makarewicz, A.; Kowalczuk, P.; Sagan, S.; Granskog, M.A.; Pavlov, A.K.; Zdun, A.; Borzycka, K.; Zabłocka, M. Characteristics of chromophoric and fluorescent dissolved organic matter in the Nordic Seas. Ocean Sci. 2018, 14, 543–562. [Google Scholar] [CrossRef] [Green Version]
  68. Spreen, G.; Kaleschke, L.; Heygster, G. Sea ice remote sensing using AMSR-E 89-GHz channels. J. Geophys. Res. Ocean. 2008, 113, C02S03. [Google Scholar] [CrossRef] [Green Version]
  69. Burdige, D.J.; Berelson, W.M.; Coale, K.H.; McManus, J.; Johnson, K.S. Fluxes of dissolved organic carbon from California continental margin sediments. Geochim. Cosmochim. Acta 1999, 63, 1507–1515. [Google Scholar] [CrossRef]
Figure 1. Map of fjords in the West Svalbard (a). The sampling sites for seawater (S1–S9, blue circles in (b)) and pore waters (P3–P5 and P7, red pin which overlapped with blue circles in (b)) in the West Svalbard from the 18th to 23rd of July 2016. The original site names are available in Table S1. Figure 1a was produced with ODV software [36].
Water 13 00202 g001
Figure 2. The section plots of salinity and temperature for transect S1–S5 (a) and scatter plots of salinity and temperature for all the sea water samples (b). The water mass types identified based on Cottier et al. [39] include: Surface Water (SW), Intermediate Water (IW), and Local Water (LW).
Water 13 00202 g002
Figure 3. The property-property plot of θ-S of all the seawater samples (a) and the distribution of a254 (open symbols) and a320 (filled symbols) as a function of the salinity (b). The dotted frames in (a) classify water masses. An inlet for the salinity-a320 plot is shown in (b).
Water 13 00202 g003
Figure 4. Cross-fjord comparison of dissolved organic matter (DOM) parameters in seawater (upper row) and pore water (lower row). Boxes with different alphabet letters are significantly different (p < 0.05). Isfjorden is the north most and Hornsund is the south most among these three fjords.
Water 13 00202 g004
Figure 5. The scatter plots of the chl-a fluorescence (raw data), the apparent oxygen utilization (AOU), the protein-like fluorescence peak B and T, and the nutrient PO43− (ae) for the seawater samples from the West Svalbard fjords. The arrows in plots ad point out the higher levels.
Water 13 00202 g005
Figure 6. Satellite image (MODIS-Aqua) of chl-a concentration (af) and sea ice concentration (g) from 18–23 July 2016 around Svalbard fjords. A typical elongated EEM shape for pore water at P5 site which often observed in marine ecosystems affected by sea ice algal bloom (h). Chl-a data at the fjords cannot be retrieved directly due to cloudiness. The sea ice concentration was obtained from http://www.meereisportal.de (grant: REKLIM-2013-04) (Refer to Spreen et al. [68]).
Water 13 00202 g006
Figure 7. Examples of the increasing down core profiles of alkalinity and the humic-like fluorescent DOM (FDOM) (a,b) and positive linear correlations between the humic-like FDOM vs. alkalinity (c) for the sediment pore waters from the West Svalbard fjords of the high Arctic.
Water 13 00202 g007
Figure 8. The examples of the comparison of the FDOM peaks between the seawaters (SW) and the pore waters (PW) from the Svalbard Fjord of the Arctic Ocean. The p-values show beside each pair denote that they are significantly different when p < 0.05.
Water 13 00202 g008
Table 1. Net increase (positive) or decrease (negative) or DOM from surface sediment to depth in the high Arctic.
ItemCore Lengtha254a320M315/400A260/420C350/450B280/310T280/340
Unitmbsfm−1m−1RURURURURU
Svalbard fjords
P34.488466145125
P41.232600.740.5‒4−0.5
P53.0−8−32241.2−3−2
P71.619180.510.322
Chukchi Sea C320/410C265/422C275(370)/452C280/308
S14.12737026621824-
S23.539180.40.90.25-
S34.938182211-
S410.5−5−80.50.40.32-
The Chukchi Sea data from Chen et al. [60].
Publisher’s Note: MDPI stays neutral with regard to jurisdictional claims in published maps and institutional affiliations.

