Effects of Biochar Addition on Rice Growth and Yield under Water-Saving Irrigation


1
College of Agricultural Science and Engineering, Hohai University, Nanjing 210098, China
2
State Key Laboratory of Hydrology-Water Resources and Hydraulic Engineering, Hohai University, Nanjing 210098, China
3
Cooperative Innovation Center for Water Safety & Hydro Science, Hohai University, Nanjing 210098, China
*
Author to whom correspondence should be addressed.
Water 2021, 13(2), 209; https://doi.org/10.3390/w13020209
Submission received: 27 November 2020
/
Revised: 7 January 2021
/
Accepted: 12 January 2021
/
Published: 16 January 2021
(This article belongs to the Special Issue Water Saving in Agriculture)
Abstract
:To reveal the effect of biochar addition on rice growth and yield under water-saving irrigation, a 2-year field experiment was carried out to clarify the variations of rice tiller number, plant height, yield components, and irrigation water use efficiency with different biochar application amounts (0, 20, 40 t/ha) and irrigation management (flooding irrigation and water-saving irrigation). The results showed that the rice yield with biochar addition (20 and 40 t/ha) was 15.53% and 24.43% higher than that of non-biochar addition paddy fields under water-saving irrigation. The addition of biochar promoted the growth of tillers and plant height, improved the filled grain number, productive panicle number, and seed setting rate, thus affecting rice yield. Rice yield was raised with the increase in the biochar application amount. Under the condition of water-saving irrigation, water deficit had a certain negative effect on the rice growth indexes, resulting in a slight decrease in yield. However, irrigation water input was significantly decreased with water-saving irrigation compare to flooding irrigation. Under the comprehensive effect of water-saving irrigation and biochar application, the irrigation water use efficiency of a rice paddy field with high biochar application (40 t/ha) under water-saving irrigation was the highest, with an average increase of 91.05% compared to a paddy field with flooding irrigation. Therefore, the application of biochar in paddy fields with water-saving irrigation can substantially save irrigation water input, stably increase rice yield, and ultimately improve irrigation water productive efficiency.
1. Introduction
Rice is one of the three major food crops in the world and the most important food crop in China. It is the staple food for more than 65% of the population in China and the cornerstone of the country’s food security. China is also one of the countries with the largest rice planting area in the world, accounting for 22.7% of the world’s rice planting area and 37% of the world’s rice yield (NBSC, 2013). Chinese total grain output has stabilized at more than 600 million t since 2013. As a by-product in the process of grain production, the amount of straw is also increasing with the increase in grain output. With the adjustment of China’s rural industrial structure and the improvement of rural living conditions, straw has gradually appeared as a regional, seasonal, and industrial surplus, and the phenomenon of random discarding and open burning is serious [1]. The percentages of CO, CO2, and NOx of the total emissions were 13.9%, 15.3%, and 31.4% for rice straw burning [2], which would result in human health damage, air quality degradation, and waste of resources [3]. The large amount of CO2 emissions will aggravate the trend of global warming and lead to disasters. Straw carbonization technology, as one of the straw comprehensive utilization technologies, can not only alleviate the shortage of fertilizer and fuel in rural areas, but also protect the ecological environment, thus making the waste into valuable resources without secondary pollution.
Biochar refers to the solid byproduct derived from biological organic material (also known as biomass) pyrolysis in an anaerobic or hypoxic environment. The raw materials of biochar preparation include agricultural and forestry wastes (straw, rice husk, peanut shell, etc.), municipal solid organic wastes (sludge, domestic waste, etc.), and other wastes (algae, etc.) [4]. The rice straw biochar used in this study is the biochar prepared from rice straw through straw carbonization technology. It has strong adsorption ability and larger ion exchange capacity due to its distinctive characteristics, e.g., porosity, high specific surface area, and carboxyl groups [5]. As an efficient and environmentally friendly material, there has been significant interest in biochar in recent years [6,7,8]. Compared to other carbon management methods, such as returning straw to the field, the application of organic fertilizer, or the incorporation of rice husk [9], biochar had less labile carbon to drive carbon emissions. Many studies showed that biochar application in farmland can effectively increase soil organic carbon content, improve soil physical and chemical properties [10,11], and reduce greenhouse gas emissions [12,13,14]. Lots of studies focused on the effect of biochar application on dryland crop yield for tomatoes [15], corn [16,17], peanuts [18], and so on. For instance, in a farmer-led field experiment in sandy and acidic soils, a low dosage of 4 t/ha biochar combined with conservation farming can have a strong effect (30–40% yield increase in a sandy clay loam soil) on maize yield, and soil physical and chemical characteristics such as pH, cation exchange capacities, water-holding capacity, and organic carbon contents can be improved by the amendment of biochar [19]. There are also many studies about the effect of biochar application on paddy fields. Plot experiments conducted in the cities of Liaozhong and Beizhen, Liaoning Province of China showed that the application of biochar as a base fertilizer in paddy fields could obviously improve the crop growth character, such as the ratio of productive tiller, panicle number, grain number and 1000-grain weight, which led to an increase in rice yield [20]. Different biochar application methods all promoted the growth of rice to a certain extent, and increased the rice setting rate by 4.88–8.39% [21]. The use of biochar not only promoted the comprehensive utilization of straw resources, but also improved the yield of crops, which is instrumental in the sustainable and coordinated development of agriculture.
However, existing studies on the effect of biochar application rice growth were mainly concentrated on paddy fields with flooding irrigation. Facing the increasingly serious water shortage and water pollution problem in China, many rice water-saving irrigation technologies have been popularized and widely applied [22]. Those rice water-saving irrigation applications can maintain high rice yields and dramatically reduce irrigation water input. The common point of those rice water-saving irrigation technologies is non-flooding management or an unsaturated soil state during some growth periods or even most of the growth period of rice, which makes the field water condition of paddy fields different from the traditional flooding irrigation. These changes of field water condition of paddy fields under water-saving irrigation are bound to influence the effect of biochar application on rice yields. However, relative studies are rare. Thus, a two-year field experiment was conducted to study the effects of biochar on the tiller number, plant height, rice yield, and its components under water-saving irrigation. The research can provide a scientific basis for the realization of saving water and high yield in paddy fields.
2. Materials and Methods
2.1. Experimental Site
The study was conducted in 2016 and 2017 at the Kunshan Irrigation and Drainage Experiment Station in the Taihu Lake region of China (34°63′21″ N, 121°05′22″ E). The study area has a subtropical monsoon climate with an annual average temperature of 15.5 °C, annual precipitation of 1091.1 mm, annual evaporation of 1365.9 mm, sunshine duration of 2085.9 h, and an average frost-free period of 234 d. A rice and wheat rotation cropping system is used in the local area. The experimental site soil is a clay-textured hydragric anthrosol (75.0% clay, 16.2% silt, and 8.8% sand), with 21.71 g/kg organic matter, 1.79 g/kg total nitrogen, 1.4 g/kg total phosphorus, 20.86 g/kg total potassium, and a pH of 7.4.
2.2. Experimental Method
There were four treatments in triplicate: 0, 20, and 40 t/ha rice straw biochar addition under controlled irrigation (CI) and 40 t/ha biochar addition under flooding irrigation (FI), named C0, C20, C40, and F40, respectively. The experiment was carried out in lysimeters and the area of each lysimeter was 5 m2 (2.5 m × 2 m). Each lysimeter was individually irrigated using a tube equipped with a water meter and independently drained into the underground gallery by a pipeline. For the CI treatment, a 5–25 mm layer of water was only maintained in the re-greening stage. The rice re-greening stage refers to the period after rice transplanting to the beginning of the rice turning green, which generally lasts for 5–7 days. During this period, rice plants will generally turn from green to yellow, then turn from yellow to green and gradually resume growth. No water layer was established in other stages, except during periods of pesticide and fertilizer applications. The soil moisture of root layer was used as an irrigation control indicator at different growth stages, with a lower limit of 60–80% of soil saturated moisture content and the upper limit of soil saturated moisture content [23]. For the FI treatment, 30–50 mm of standing water was maintained in the paddy field except during mid-drainage in the late tillering stage and was naturally dried in the yellow ripening stage.
The variety of experimental rice is Nanjing 46 with hill spacing of 13 cm × 25 cm. For the two years, rice was transplanted on June 30th and harvested on November 3rd. Rice straw biochar was applied in soil manually once before rice transplanting in 2016, with an incorporation depth of 20 cm in the soil. The biochar used in this experiment was provided by the Zhejiang Biochar Engineering Technology Research Center. The pH, organic carbon content, and nitrogen content of the biochar were 10.1, 42.6%, and 0.75%. The amount and the time of chemical fertilization were carried out according to local farmers’ habits (Table 1). The chemical nitrogen fertilizer inputs were 273.0 and 292.8 kg⋅ha−1 in 2016 and 2017. The same phosphorus and potassium fertilizers were applied to all the treatments (54.0 kg P2O5 ha−1 and 76.5 kg K2O ha−1 in 2016, 63.0 kg P2O5 ha−1 and 89.25 kg K2O ha−1 in 2017).
2.3. Field Measurement and Sampling
Ten points were designated for each plot, and the rice tiller number and the plant height were observed every 5–7 days in every plot during the whole rice growth stage. After harvesting, rice yield and yield components (as productive panicle number, grain number, filled grain number) were measured for every plot in accordance with the literature [24]. In general, five representative points were selected from each plot. The number of productive panicles (panicle with more than 10 grains) in each plot was recorded first, and the average number of productive panicles in each plot was calculated. Then the total number of rice grains and filled grains per point was recorded, the quotient of total grain per point and productive panicle per point was grain number per panicle, and the quotient of filled grain per point and productive panicle per point was filled grain number per panicle. Seed setting rate refers to the ratio of filled grain number per panicle to grain number per panicle, which is a key factor of rice yield. The 1000-grain weight was the air-dried weight of 1000 random filled grains. The theoretical yield of rice was calculated by the above yield components, and the actual yield (quadrat yield) was measured by sample plot.
The irrigation amount was read according to the water meter. The irrigation water use efficiency (YWURir) represented the productivity of the unit amount of irrigation water, which was calculated by Equation (1).
where Y is the rice yield (kg/ha); IR is the irrigation amount (mm).
YWURir (kg/m3) = Y/(IR⋅10)
2.4. Statistical Analysis
Statistical analyses were performed using standard procedures for a randomized plot design (SPSS 13.0, SPSS Inc., Chicago, IL, USA). Significance was calculated using F-tests, and least significant differences (LSDs) were measured at the 0.05 probability level.
3. Results
3.1. Effects of Biochar on the Tiller Number of Rice under Water-Saving Irrigation
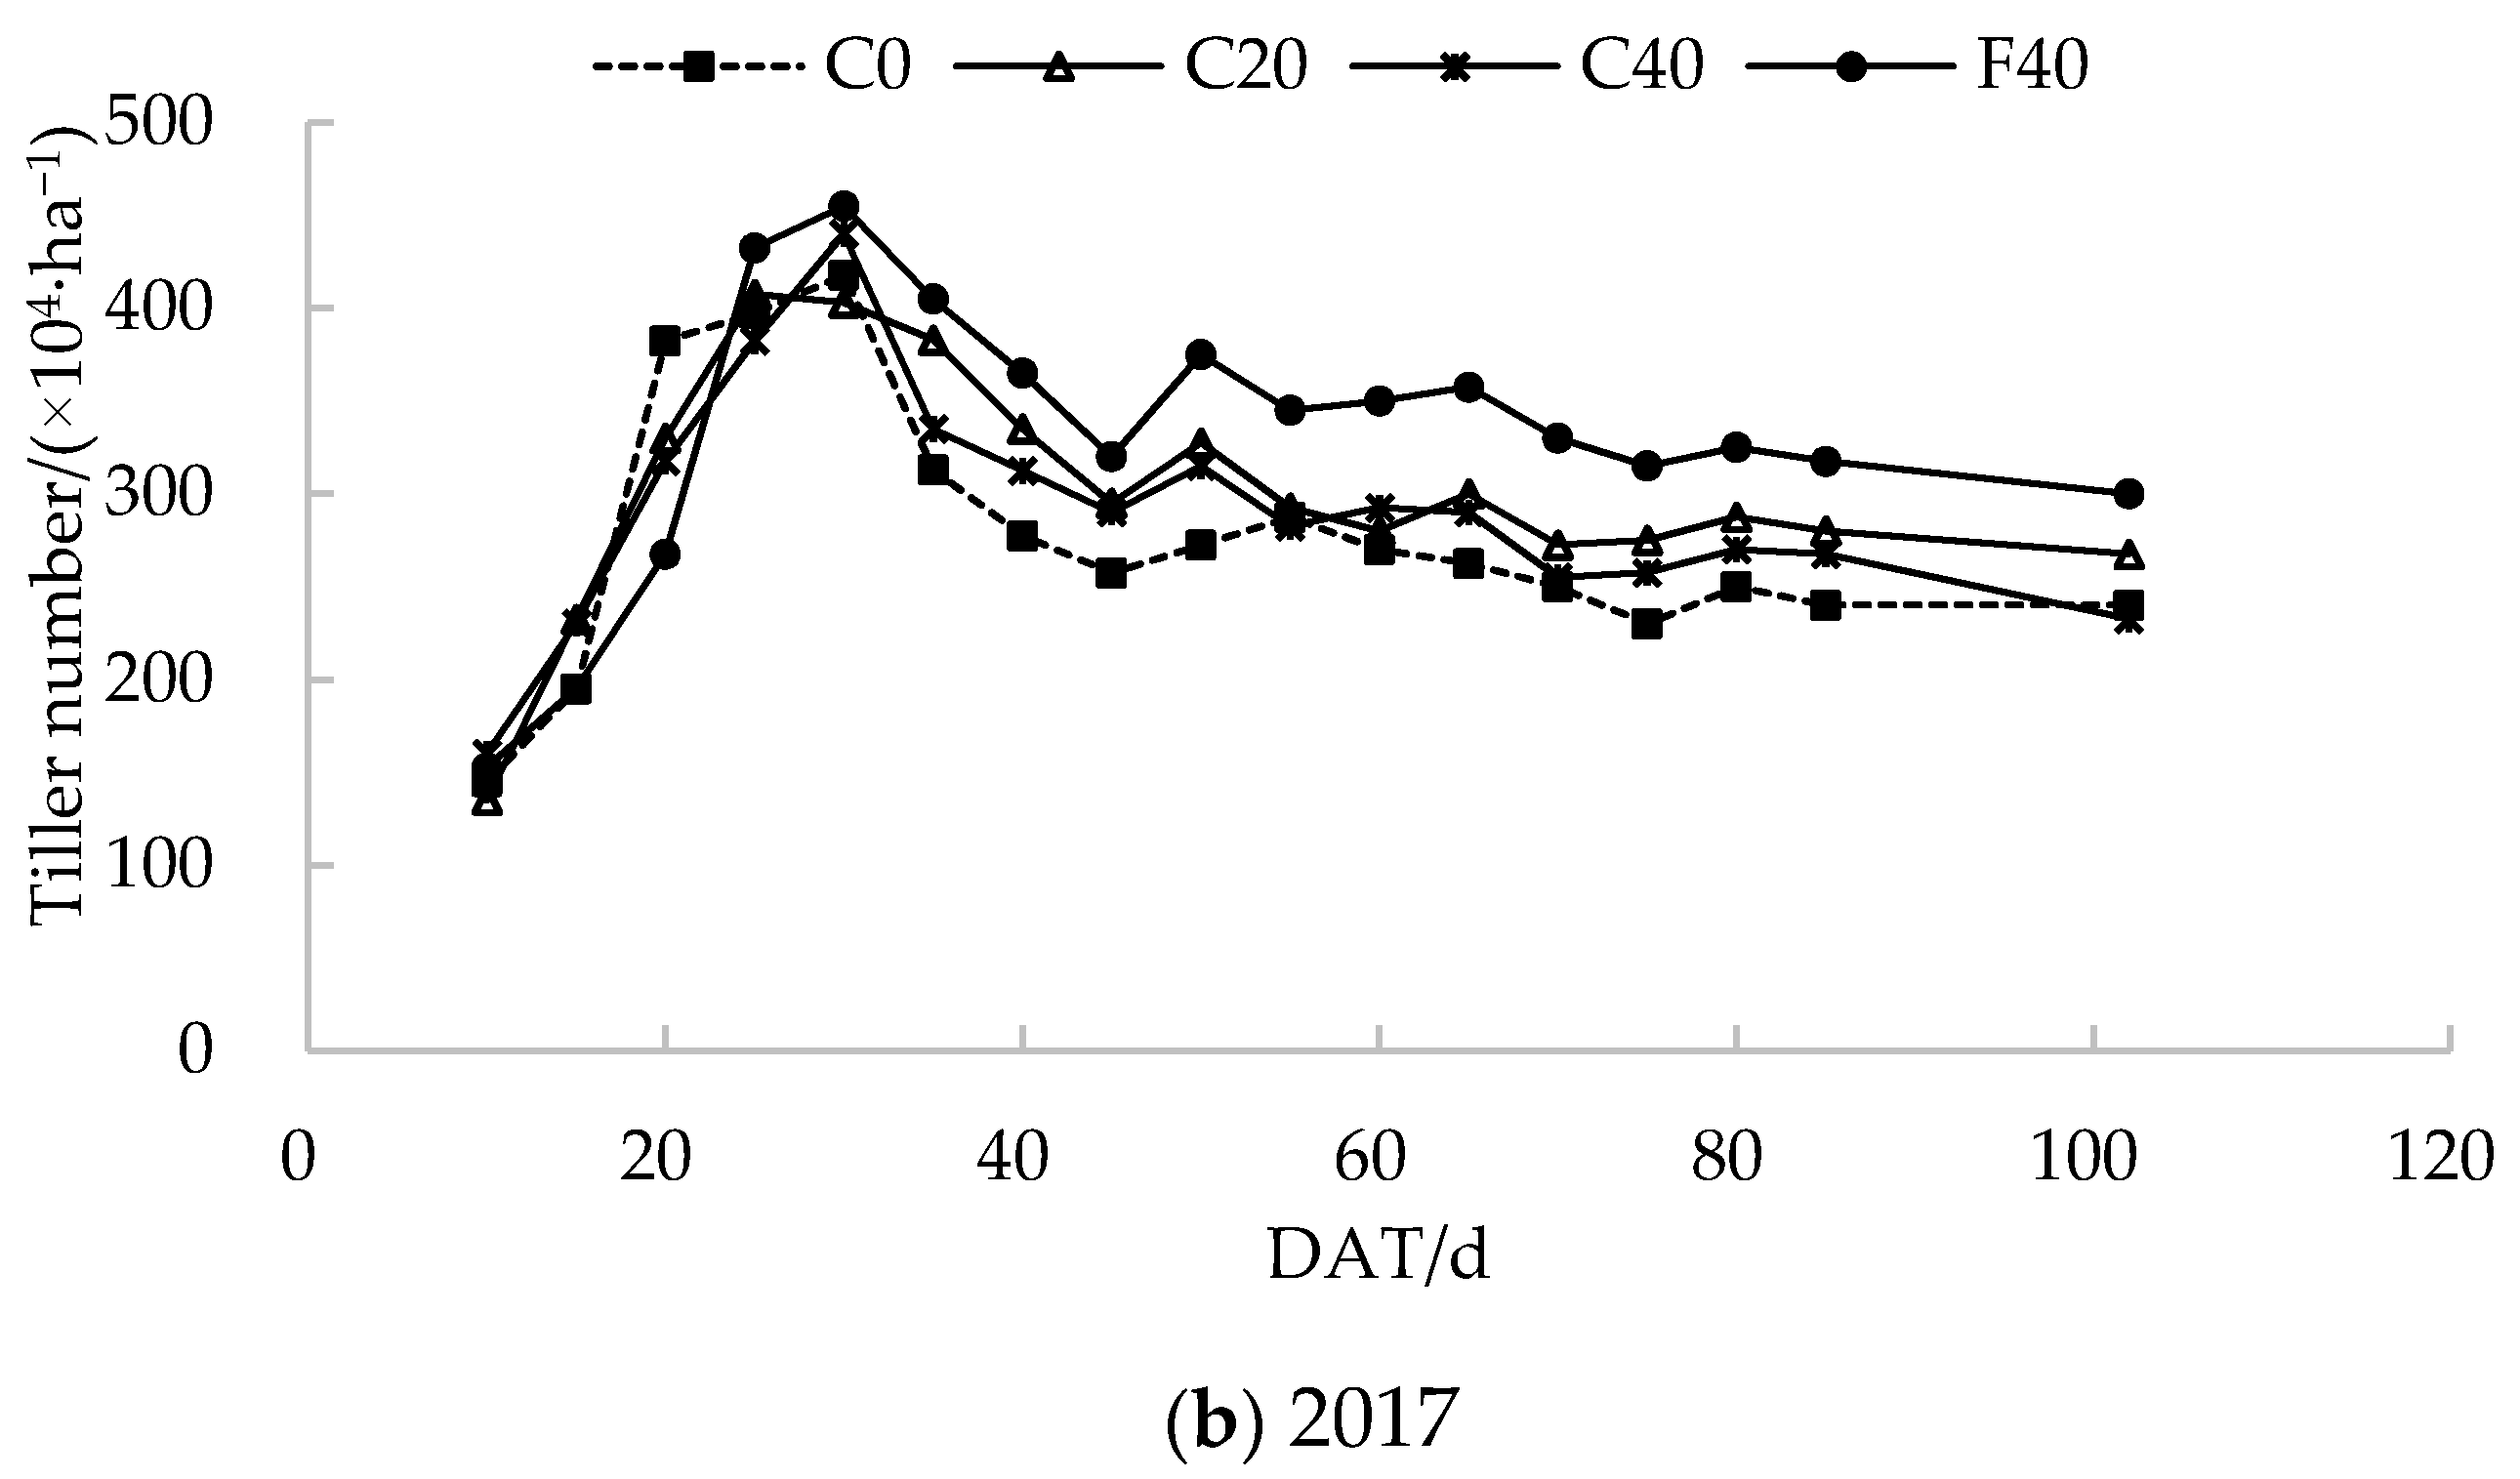
Dynamic characteristics of rice tiller number for the whole growth stage are shown in Figure 1. It can be found that the variation of rice tiller number under different treatments was relatively consistent. Rice tiller number increased rapidly at the tillering stage, and after reaching the peak, it declined slightly owing to the gradual extinction of the ineffective tillers. The tiller number changed slightly and remained stable after the late tillering stage.
Biochar input increased rice tiller number under CI. As shown in Table 2, the average rice tiller number of the C20 treatment was the highest, reaching 295.00 × 10⁴ and 300.21 × 10⁴ tiller/ha in 2016 and 2017, increased by 8.85–12.17% compared to the C0 treatment. There was an annual difference in the effect of irrigation management on rice tiller number. In 2016, the difference in rice tiller number between the C40 and F40 treatments was very small. Meanwhile, the average rice tiller number of the F40 treatment in 2017 was 329.85 × 10⁴ tiller/ha, which was 13.74% higher than that of the C40 treatment.
3.2. Effects of Biochar on Rice Plant Height under Water-Saving Irrigation
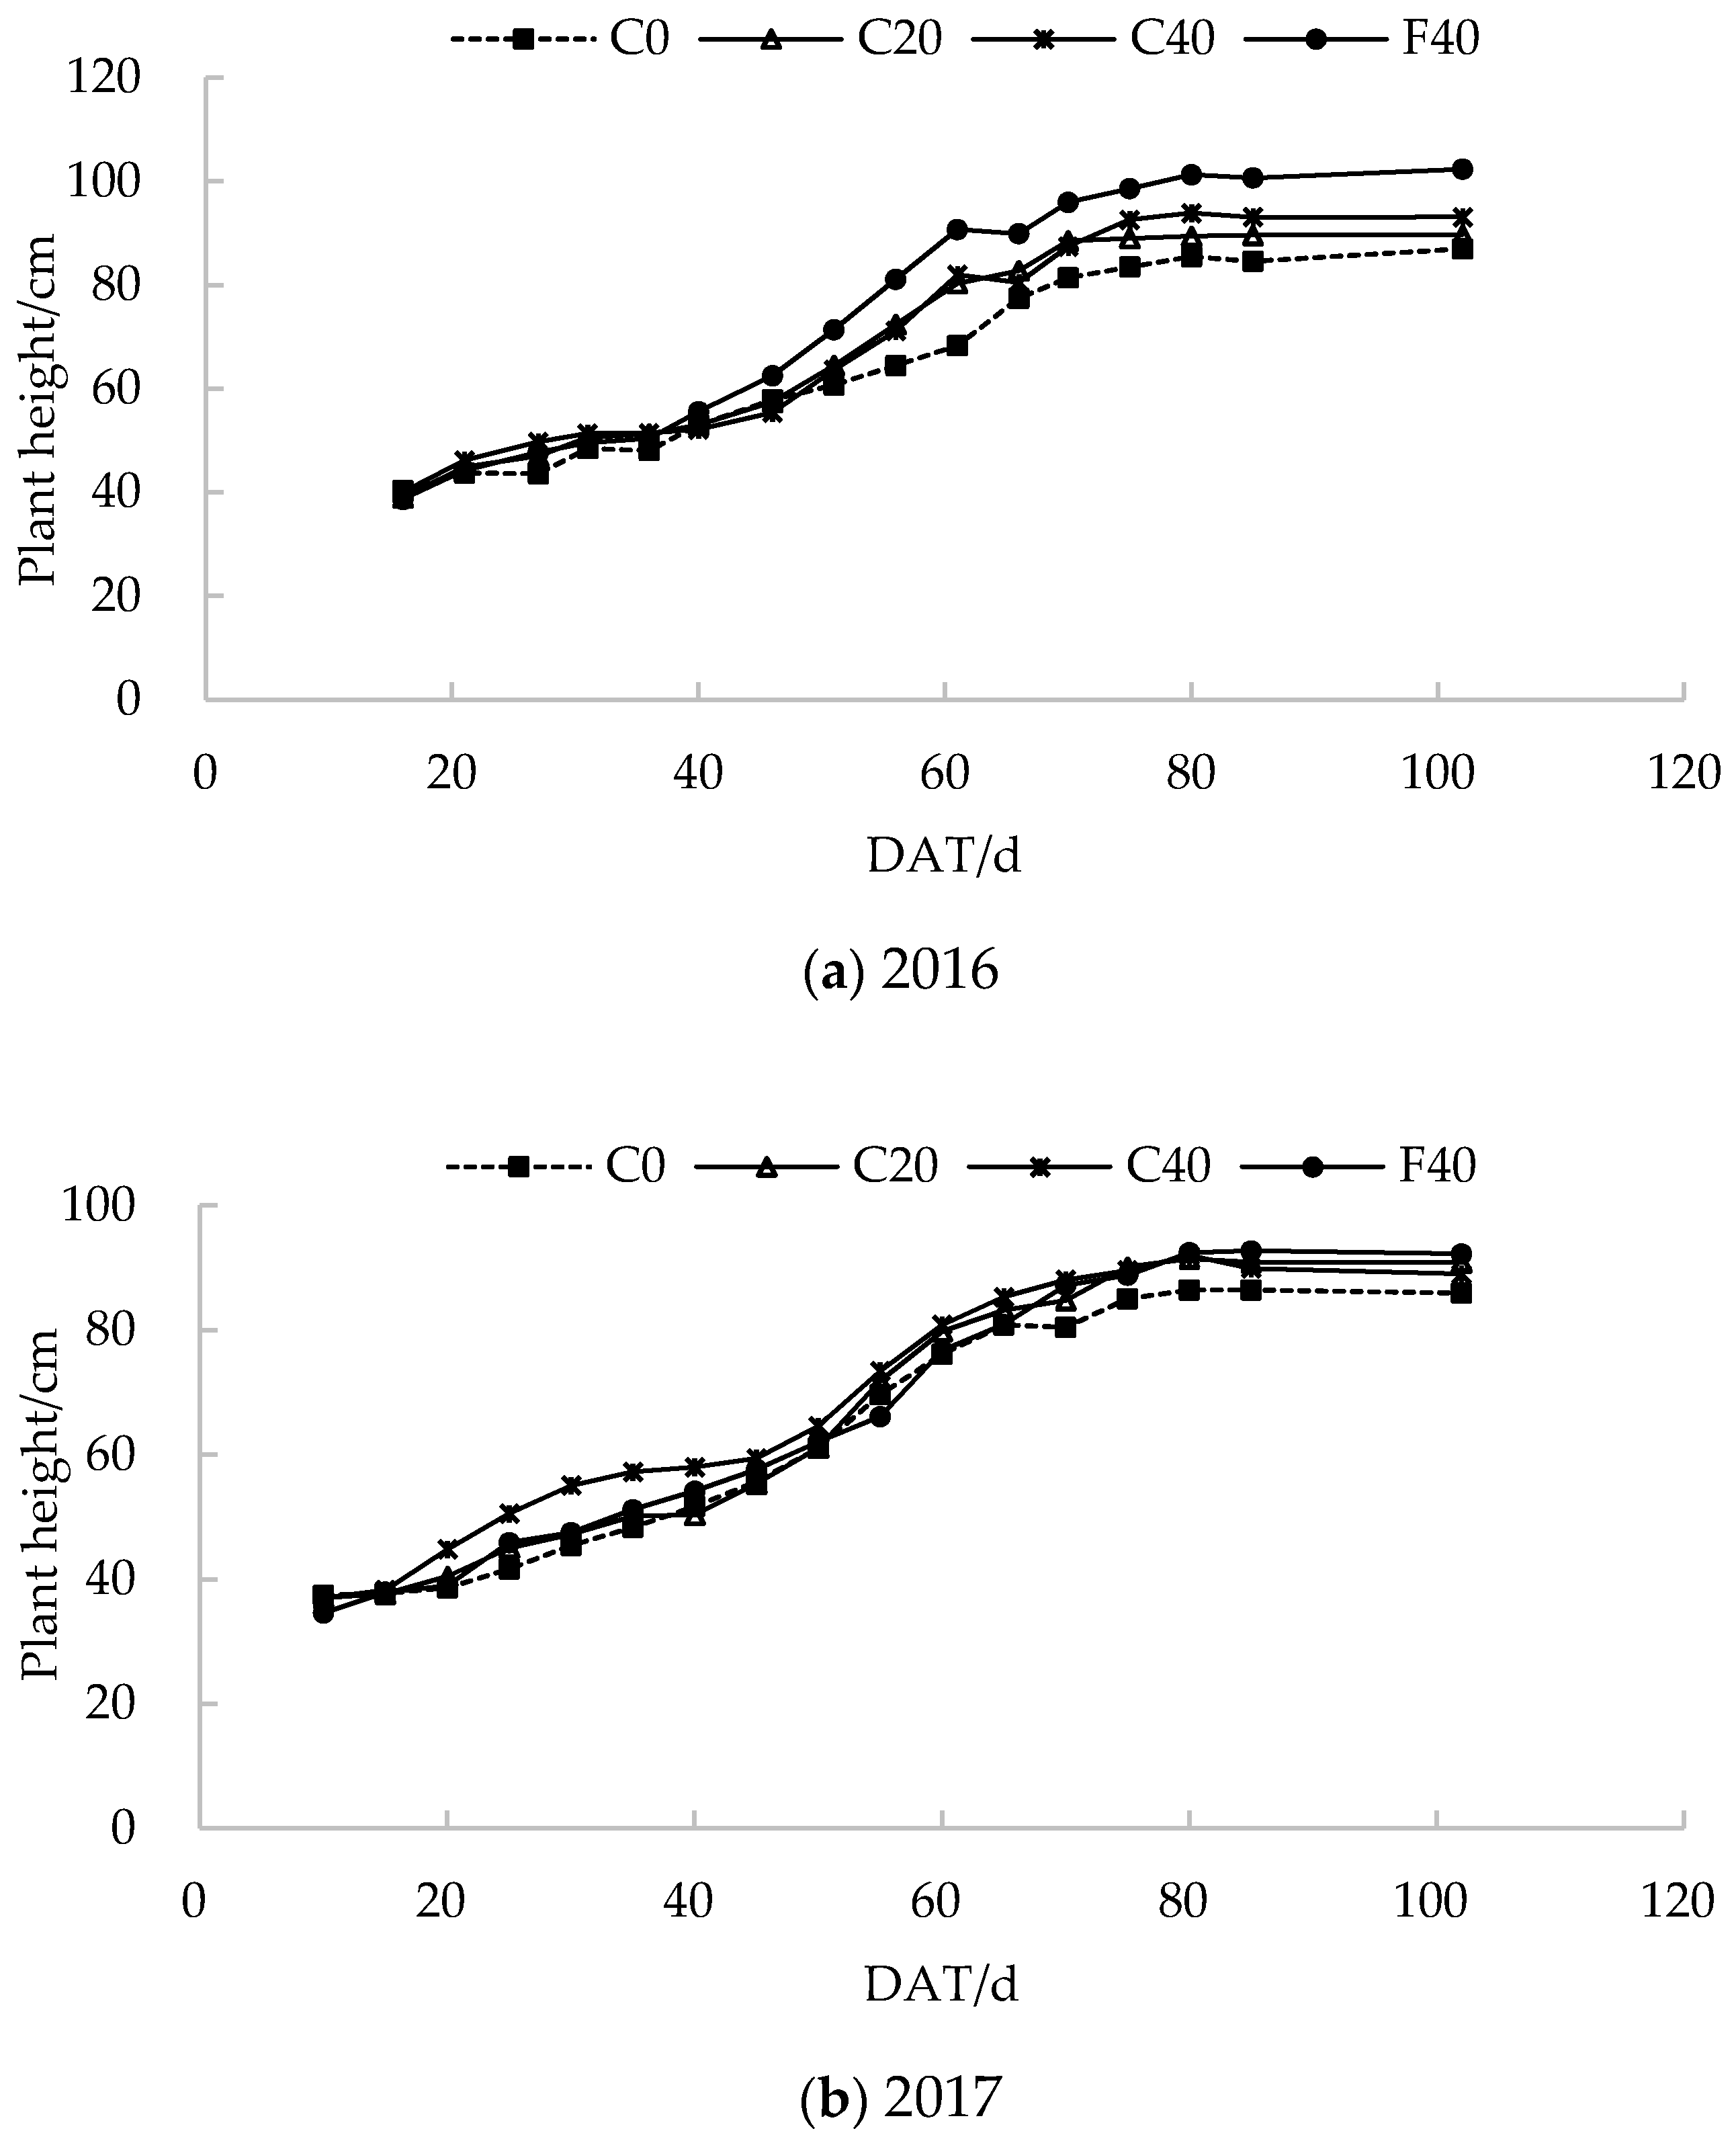
The dynamic change of rice plant height with different management methods had the same “S” type trend (Figure 2). The rice plant height increased gradually after transplanting and increased most rapidly during the jointing and booting stages. 75 days after transplanting (DAT), rice entered the milk stage and the plant height was stabilized. Under the condition of water-saving irrigation, both the average and maximum values of rice plant height were raised with the increase in biochar input (Table 2). The increment of rice plant height of the C40 treatment was 53.82–54.97 cm during the whole growth period, which was 7.30% and 1.29% higher than those of the C0 and C20 treatments in 2016, and 7.87% and 4.15% higher in 2017. In 2016, rice plant height with different treatments had no significant difference before 45 DAT. After that, rice plant height of the C20 and C40 treatments increased rapidly compared to the C0 treatment. The advantage of rice plant height of the C40 treatment was always maintained from 2.88–13.64 cm advantage compared to the C0 treatment. However, the difference of rice plant height among different treatments was large in the tillering stage in 2017, and then the gap slightly narrowed while the rice plant height under the C40 treatment was still 3.03–7.57 cm higher than that of the C0 treatment. Irrigation management had a certain effect on rice plant height. The increment of rice plant height in the C40 treatment was always smaller than that in the F40 treatment in 2016 and 2017, reduced by an average of 10.67% in the two years.
3.3. Effects of Biochar on Rice Yield under Water-Saving Irrigation
Rice yield under water-saving irrigation was raised with the increase in the biochar application amount (Table 3). The rice yield of the C40 treatment was the highest, which reached 8552 kg/ha and 7325 kg/ha in 2016 and 2017, and increased 15.79–36.33% and 5.91–9.90% compared to the C0 and C20 treatments, respectively. From the perspective of rice yield components, the rice filled grain number of the biochar treatment was higher than that of the control. The filled grain number of the C20 and C40 treatments increased by 8.45–35.67% and 15.78–32.96%, respectively, compared to the C0 treatment. In addition, the rice productive panicle number and seed setting rate of the biochar treatment were also higher than those of the control. Moreover, the enhancement effect on rice productive panicle number and seed setting rate improved with the increase in the biochar input under CI. Therefore, the increase in filled grain number, productive panicle number, and seed setting rate caused by the biochar input was the main reason for the increase in rice yield under CI.
Different irrigation management methods had a certain effect on rice yield. There was an interannual difference between the rice yield in 2016 and 2017 and, in general, rice yield in 2017 was lower than that in 2016. In 2016, the rice yield under the C40 treatment decreased by 5.99% compared with that of the F40 treatment, while the rice yield of these two treatments was similar in 2017. Although the rice productive panicle number under water-saving irrigation was about 10% lower than that of flooding irrigation, the rice grain number and filled grain number of water-saving irrigation increased slightly compared to flooding irrigation. This may be the reason for the similarities in rice yield between different irrigation management types in 2017.
3.4. Effects of Biochar on Irrigation Water Use Efficiency under Water-Saving Irrigation
Irrigation water amount and irrigation water use efficiency are shown in Table 4. Under water-saving irrigation management, there was no significant difference in irrigation water amount among the three gradient biochar inputs. Hence, the difference in irrigation water use efficiency between different treatments mainly comes from different yields. Irrigation water use efficiency was C0 < C20 < C40 in 2016 and 2017. The C40 treatment had the largest irrigation water use efficiency, reaching 1.50 kg/m3, and increased by 4.76% and 27.68%, respectively, compared to the C20 and C0 treatments.
Water-saving irrigation maintained a high rice yield and significantly decreased irrigation water input compared to flooding irrigation. The irrigation water input of the C40 treatment was 485 mm and 592 mm in 2016 and 2017, and decreased by 55.11% and 40.53% compared to flooding irrigation. The significant decrease in irrigation water input increased the irrigation water use efficiency under water-saving irrigation. The irrigation water use efficiency of the C40 treatment increased by an average of 91.05% compared to the F40 treatment in these two years.
4. Discussion
Existing studies have shown that biochar can promote crop growth [17] and increase yield. The results of the effect of biochar on rice plant height are relatively consistent. Rice plant height with biochar is obviously higher than that of the paddy field without biochar [25], and the enhancement effect increases with the increase in biochar input [26], which is consistent with the results in this experiment. The rice plant height with 5% mass ratio of biochar increased by 14% compared to that with 5% mass ratio of normal fertilizer in mushroom culture soil [27]. In this study, the maximum increase rate of rice plant height with biochar compared to control was 7.58%. The results of the effect of biochar on rice tiller numbers are different from the literature. The rice effective tiller number with straw biochar was 51.13% more than that of unfertilized rice [25]. Meanwhile, commercial biochar input inhibited the rice tillering, and significantly reduced the number of panicles per hill [28]. Differences in the effect of biochar on rice tiller numbers may be due to the types and amounts of biochar, which exert different effects on plant growth. In this experiment, there was no positive correlation between the amount of biochar input and the rice tiller number. The average rice tiller number with medium biochar (20 t/ha) was the highest, and increased by 8.85–12.17% compared with the control. In sum, biochar application can also promote the growth of plant height and tillering under water-saving irrigation.
Previous studies have shown that the application of biochar can promote the rice yield by increasing the panicle number [26,29], grain number [26,29] and the seed setting rate [21,29]. In terms of rice yield, there are some differences in the optimal application amount of biochar. With the biochar made from rice husk, the rice panicle number and grain number increased with the increase in the biochar input, and the rice yield increased by 15.26–44.89%. In particular, the rice yield with a high amount of biochar (300 kg/ha) was significantly different from that of other treatments [26]. The rice panicle length and yield with biochar (4% mass ratio) increased by 9.19% and 10.53% compared to treatment without biochar [30]. On the contrary, the plot experiment results of Zhang et al. [29] showed that the rice yield was not positively correlated with the amount of biochar application. The rice yield with 20 g biochar per kilogram dry soil was the highest, 33.21% higher than that of non-biochar. An experiment showed that amendment with bamboo biochar increased the average rice stem height and yield to some extent, but the differences were not statistically significant. In contrast, statistically significant increases were observed with the application of rice straw biochar in two years [31]. The effect of biochar application on crop growth is a complex process. A few studies also showed negative impacts. Sometimes biochar reduced nutrient retention due to the quick decomposition of biochar C (e.g., by 51% within 16 months of application) [32]. Biochar has been shown to reduce P uptake by plants [33,34] and thus decrease crop yield, which might be due to the phytotoxic effects of wood biochar [34]. Therefore, the difference in experimental results of the effect of biochar on rice yield may be related to soil type, biochar type, and application method [21]. Moreover, the promotion effect of biochar on crop growth also depends on the amount of chemical nitrogen fertilizer [35,36], and only the appropriate C/N ratio in soil can promote the uptake of nutrients in crops [37]. Furthermore, the original soil texture and soil fertility in the experimental area have an influence on the test results. Barren soil led to a more obvious impact of biochar on crop yield [38]. In summary, studies have shown that biochar can increase the dry crop yield and rice yield under flooding irrigation. In this study, the results showed that biochar improved rice filled grain number, productive panicle number, seed setting rate, and yield under water-saving irrigation. The rice yield was raised with the increase in the amount of biochar application, by 15.79–36.33%, compared to non-biochar addition paddy fields.
The rice yield of flooding irrigation was slightly larger than that of water-saving irrigation, but the difference is not significant. CI affected the rice photosynthetic process to a certain extent. Although the rice yield was slightly reduced, the irrigation water use efficiency was obviously improved due to the significant decrease in irrigation water input. The results of this experiment showed that irrigation water use efficiency with a high amount of biochar (40 t/ha) and water-saving irrigation was the highest, and was increased by an average of 91.05% compared to flooding irrigation in these two years.
5. Conclusions
- (1)
- Biochar application could promote rice tiller numbers and plant height under water-saving irrigation. The average rice tiller number with a medium amount of biochar (20 t/ha) was the highest, and increased by 8.85–12.17% compared to the control. With the increased amount of biochar application, both the average and maximum values of rice plant height increased. Rice plant height with a high amount of biochar (40 t/ha) always maintained a plant height advantage of 2.88–13.64 cm compared with the control.
- (2)
- Rice yield under water-saving irrigation improved with the increase in biochar input. Rice yield with a high biochar application (40 t/ha) was the highest. Its average yield in the two years reached 7938.50 kg/ha, increased by 24.44% compared with the control. The application of biochar improved the filled grain number, productive panicle number, and seed setting rate, which were the main reasons for the increase in rice yield.
- (3)
- Compared with flooding irrigation, the rice tiller number and plant height under water-saving irrigation were restrained to some extent by water deficit, and the yield decreased slightly. However, the amount of irrigation water was significantly reduced. The irrigation water input with a high amount of biochar (40 t/ha) and water-saving irrigation decreased by 40.53–55.11%, and the irrigation water use efficiency increased by 91.05% on average compared to flooding irrigation.
Author Contributions
Methodology, X.C. and X.S.; experiments, S.Y. and J.D.; data analysis, Z.J.; software, X.C.; writing—original draft preparation, J.D.; writing—review and editing, X.C. and J.D.; principal investigation, S.Y. All authors have read and agreed to the published version of the manuscript.
Funding
This work was funded by the National Natural Science Foundation of China (51879076 and 51579070); the Fundamental Research Funds for the Central Universities (2019B67814, 2018B34114, and 2018B55814); Water Conservancy Science and Technology Project of Jiangxi Province (201921ZDKT06); National Key R & D Program of China (2018YFC1508303).
Institutional Review Board Statement
Not applicable.
Informed Consent Statement
Not applicable.
Data Availability Statement
Data is contained within the article. Further data and materials requests should be addressed to S.Y. at [email protected] or X.C. at [email protected].
Acknowledgments
We give thanks to Kunshan water-affair bureau for their help in experiments. And we also wish to thank Yanan Xiao, the student in the College of Agricultural Science and Engineering Hohai University in China, who was involved in the experiment.
Conflicts of Interest
The authors declare that they have no conflict of interest.
References
- Zhang, H.; Ye, X.; Cheng, T.; Chen, J.; Yang, X.; Wang, L.; Zhang, R. A laboratory study of agricultural crop residue combustion in China: Emission factors and emission inventory. Atmos. Environ. 2008, 42, 8432–8441. [Google Scholar] [CrossRef]
- Cao, G.L.; Zhang, X.Y.; Zeng, F.C. Inventory of black carbon and organic carbon emissions from China. Atmos. Environ. 2006, 40, 6516–6527. [Google Scholar] [CrossRef]
- Zhang, H.; Hu, J.; Qi, Y.; Li, C.; Chen, J.; Wang, X.; He, J.; Wang, S.; Hao, J.; Zhang, L.; et al. Emission characterization, environmental impact, and control measure of PM2.5 emitted from agricultural crop residue burning in China. J. Clean. Prod. 2017, 149, 629–635. [Google Scholar] [CrossRef]
- Tomczyk, A.; Sokołowska, Z.; Boguta, P. Biochar physicochemical properties: Pyrolysis temperature and feedstock kind effects. Rev. Environ. Sci. Bio/Technol. 2020, 19, 191–215. [Google Scholar]
- Sohi, S.P.; Krull, E.; Lopez-Capel, E.; Bol, R. A review of biochar and its use and function in soil. Adv. Agron. 2010, 105, 47–82. [Google Scholar]
- Chen, W.F.; Zhang, W.M.; Meng, J. Advances and prospects in research of biochar utilization in agriculture. Sci. Agric. Sin. 2013, 46, 3324–3333. [Google Scholar]
- Ippolito, J.A.; Laird, D.A.; Busscher, W.J. Environmental benefits of biochar. J. Environ. Qual. 2012, 41, 967. [Google Scholar]
- Oliveira, F.R.; Patel, A.K.; Jaisi, D.P.; Adhikari, S.; Lu, H.; Khanal, S.K. Environmental application of biochar: Current status and perspectives. Bioresour. Technol. 2017, 246, 110–122. [Google Scholar] [CrossRef]
- Seyfferth, A.L.; Amaral, D.; Limmer, M.A.; Guilherme, L.R.G. Combined impacts of Si-rich rice residues and flooding extent on grain As and Cd in rice. Environ. Int. 2019, 128, 301–309. [Google Scholar] [CrossRef]
- Ippolito, J.A.; Stromberger, M.E.; Lentz, R.D.; Dungan, R.S. Hardwood Biochar Influences Calcareous Soil Physicochemical and Microbiological Status. J. Environ. Qual. 2014, 43, 681–689. [Google Scholar]
- Krapfl, K.J.; Hatten, J.A.; Roberts, S.D.; Baldwin, B.S.; Rousseau, R.J.; Shankle, M.W. Soil properties, nitrogen status, and switchgrass productivity in a biochar-amended silty clay loam. Soil Sci. Soc. Am. J. 2014, 78, S136. [Google Scholar] [CrossRef]
- Sethupathi, S.; Ming, Z.; Rajapaksha, A.U.; Sang, R.L.; Nor, N.M.; Mohamed, A.R.; Al-Wabel, M.; Lee, S.R.; Ok, Y.S. Biochars as potential adsorbers of CH4, CO2 and H2S. Sustainability 2017, 9, 121. [Google Scholar] [CrossRef] [Green Version]
- Shen, J.; Tang, H.; Liu, J.; Wang, C.; Li, Y.; Ge, T.; Jones, D.L.; Wu, J.S. Contrasting effects of straw and straw-derived biochar amendments on greenhouse gas emissions within double rice cropping systems. Agric. Ecosyst. Environ. 2014, 188, 264–274. [Google Scholar] [CrossRef]
- Woolf, D.; Amonette, J.E.; Streetperrott, F.A.; Lehmann, J.; Joseph, S. Sustainable biochar to mitigate global climate change. Nat. Commun. 2010, 1, 1–9. [Google Scholar] [CrossRef] [Green Version]
- Graber, E.R.; Harel, Y.M.; Kolton, M.; Cytryn, E.; Silber, A.; David, D.R.; Tsechansky, L.; Borenshtein, M.; Elad, Y. Biochar impact on development and productivity of pepper and tomato grown in fertigated soilless media. Plant Soil 2010, 337, 481–496. [Google Scholar] [CrossRef]
- Brantley, K.; Savin, M.; Brye, K.; Longer, D. Pine woodchip biochar impact on soil nutrient concentrations and corn yield in a silt loam in the mid-southern U.S. Agriculture 2015, 5, 30–47. [Google Scholar] [CrossRef] [Green Version]
- Yang, Y.; Ma, S.; Zhao, Y.; Jing, M.; Xu, Y.; Chen, J. A field experiment on enhancement of crop yield by rice straw and corn stalk-derived biochar in northern china. Sustainability 2015, 7, 13713–13725. [Google Scholar] [CrossRef] [Green Version]
- Agegnehu, G.; Bass, A.M.; Nelson, P.N.; Muirhead, B.; Wright, G.; Bird, M.I. Biochar and biochar-compost as soil amendments: Effects on peanut yield, soil properties and greenhouse gas emissions in tropical North Queensland, Australia. Agric. Ecosyst. Environ. 2015, 213, 72–85. [Google Scholar] [CrossRef]
- Cornelissen, G.; Martinsen, V.; Shitumbanuma, V.; Alling, V.; Breedveld, G.D.; Rutherford, D.W.; Sparrevik, M.; Hale, S.E.; Obia, A.; Mulder, J. Biochar effect on maize yield and soil characteristics in five conservation farming sites in Zambia. Agronomy 2013, 3, 256–274. [Google Scholar] [CrossRef] [Green Version]
- Wang, L. Research on application effect of carbon matrix bio-fertilizer on rice. Agric. Sci. Technol. Equip. 2017, 2, 14–15+18. [Google Scholar]
- Wang, Y.M.; Gao, Q.; Xue, L.H.; Yang, L.Z.; Li, H.X.; Feng, Y.F. Effects of different biochar application patterns on rice growth and yield. J. Agric. Resour. Environ. 2018, 1, 58–65. [Google Scholar]
- Li, Y. Water saving irrigation in china. Irrig. Drain. 2010, 55, 327–336. [Google Scholar] [CrossRef]
- Yang, S.H.; Peng, S.Z.; Xu, J.Z.; Yao, J.Q.; Jin, X.P.; Song, J. Characteristics and simulation of ammonia volatilization from paddy fields under different water and nitrogen management. Trans. Chin. Soc. Agric. Eng. 2012, 28, 99–104. [Google Scholar]
- China Meteorological Administration. Specifications for Agricultural Meteorological Observation, 1st ed.; China Meteorological Press: Beijing, China, 1993; pp. 32–35.
- Zhou, Y.L.; Zhang, Z.H.; Fan, R.Q.; Qian, X.Q.; Luo, J.; Lu, X.; Liu, Y.F.; Liu, L.Z. Effects of straw-returning modes on paddy soil properties and rice yield. Jiangsu J. Agric. Sci. 2016, 32, 786–790. [Google Scholar]
- Zhang, A.P.; Liu, R.L.; Gao, J.; Zhang, Q.W.; Xiao, J.N.; Chen, Z.; Yang, S.Q.; Hui, J.Z.; Yang, Z.L. Effects of biochar on nitrogen losses and rice yield in anthropogenic-alluvial soil irrigated with yellow river water. J. Agro-Environ. Sci. 2014, 33, 2395–2403. [Google Scholar]
- Zhang, X.; Zhang, G.L.; Sun, Q.N.; Peng, Y.B.; Wang, X.D.; Li, M.; Wang, Y. Influence of biochar from spent mushroom substrate on properties of pig manure compost and rice growth. J. Agro-Environ. Sci. 2014, 33, 2036–2041. [Google Scholar]
- Chen, Y.; Zhang, M.L.; Liu, X.P.; Dai, G.J.; Hou, S.G. Effects of biochar on chlorophyll fluorescence at full heading stage and yield components of rice. Crops 2016, 3, 94–98. [Google Scholar]
- Zhang, W.M.; Meng, J.; Wang, J.Y.; Fan, S.X.; Chen, W.F. Effect of biochar on root morphological and physiological characteristics and yield in rice. Acta Agron. Sin. 2013, 39, 1445. [Google Scholar] [CrossRef]
- Liu, X.X.; Wu, D.T.; Zhu, W.F.; Tao, Y.B.; Wang, J.J.; Chen, Y.D. Effects of exogenous biochar addition on rice yield and soil properties. J. Zhejiang Agric. Sci. 2016, 57, 1776–1779. [Google Scholar]
- Dong, D.; Yang, M.; Wang, C.; Wang, H.L.; Li, Y.; Luo, J.F.; Wu, W.X. Responses of methane emissions and rice yield to applications of biochar and straw in a paddy field. J. Soils Sediments 2013, 13, 1450–1460. [Google Scholar] [CrossRef]
- Beusch, C.; Cierjacks, A.; Bohm, J.; Mertens, J.; Bischoff, W.A.; de Araujo, J.C.; Kaupenjohann, M. Biochar vs clay: Comparison of their effects on nutrient retention of a tropical arenosol. Geoderma 2019, 337, 524–535. [Google Scholar] [CrossRef]
- Kang, S.W.; Kim, S.H.; Park, J.H.; Seo, D.C.; Ok, Y.S.; Cho, J.S. Effect of biochar derived from barley straw on soil physicochemical properties, crop growth, and nitrous oxide emission in an upland field in South Korea. Environ. Sci. Pollut. Res. 2018, 10, 1–9. [Google Scholar] [CrossRef] [PubMed]
- Liu, C.; Liu, F.; Ravnskov, S.; Rubaek, G.H.; Sun, Z.; Andersen, M.N. Impact of wood biochar and its interactions with mycorrhizal fungi, phosphorus fertilization and irrigation strategies on potato growth. J. Agron. Crop Sci. 2017, 203, 131–145. [Google Scholar] [CrossRef]
- Chan, K.Y.; Van Zwieten, L.; Meszaros, I.; Downie, A.; Joseph, S. Agronomic values of greenwaste biochar as a soil amendment. Aust. J. Soil Res. 2007, 45, 629–634. [Google Scholar] [CrossRef]
- Hidetoshi, A.; Benjamink, S.; Haefelem, S.; Khamdok, S.; Koki, H.; Yoshiyuki, K.; Yoshio, I.; Tatsuhiko, A.; Takeshi, H. Biochar amendment techniques for upland rice production in northern Laos 1. soil physical properties, leaf spad and grain yield. Field Crop. Res. 2009, 111, 81–84. [Google Scholar]
- Lu, J.J.; Gao, C.H.; Li, J.H.; Jin, D.S.; Lu, C.D.; Dong, Y.Z. Effect of biochar on soil nutrients and corn growth in farmland of loess area. Chin. Agric. Sci. Bull. 2017, 33, 92–99. [Google Scholar]
- Qiu, H.Y.; Sun, J.; Chen, G.; Zhou, K.N.; Liang, J.X. Effect of biochar on yield and agronomic traits of maize in new-reclamation land of Ningxia. Ningxia J. Agric. For. Sci. Technol. 2017, 58, 27–30. [Google Scholar]
Figure 1.
Dynamic change of rice tiller number. (a): rice tiller number in 2016; (b): rice tiller number in 2017. (DAT represents the days after transplanting; C0, C20, C40 indicate the treatment with 0, 20, 40 t/ha biochar under controlled irrigation, F40 indicates the treatment with 40 t/ha biochar under flooding irrigation).


Figure 2.
Dynamic change of rice plant height. (a): rice plant height in 2016; (b): rice plant height in 2017. (DAT represents days after transplanting; C0, C20, C40 indicate the treatment with 0, 20, 40 t/ha biochar under controlled irrigation, F40 indicates the treatment with 40 t/ha biochar under flooding irrigation).


Table 1.
Date and rate of nitrogen fertilization during the rice growth season.
| Year | Activity | Application of Nitrogen Fertilizer |
|---|---|---|
| (kg/ha) | ||
| 2016 | Base fertilizer (29 Jun) | 72.0 |
| Tillering fertilizer (16 Jul) | 97.0 | |
| Panicle fertilizer (9 Aug) | 104.0 | |
| Total nitrogen | 273.0 | |
| 2017 | Base fertilizer (29 Jun) | 153.6 |
| Tillering fertilizer (16 Jul) | 69.6 | |
| Panicle fertilizer (11 Aug) | 69.6 | |
| Total nitrogen | 292.8 |
Table 2.
Average tiller number and plant height of rice season.
| Item | Tiller Number/(×104 × ha−1) | Plant Height/(cm) | ||
|---|---|---|---|---|
| Year | 2016 | 2017 | 2016 | 2017 |
| C0 | 263 ± 9.58 c | 275.79 ± 16.95 c | 64.29 ± 4.25 c | 62.87 ± 4.7 b |
| C20 | 295 ± 10.46 a | 300.21 ± 15.72 b | 68.1 ± 4.74 b | 65.12 ± 5.09 ab |
| C40 | 284.63 ± 10.03 b | 290 ± 15.1 bc | 68.98 ± 4.93 b | 67.82 ± 4.7 a |
| F40 | 283.13 ± 11.58 b | 329.85 ± 18.33 a | 73.8 ± 5.91 a | 65.12 ± 5.11 ab |
Note: C0, C20, C40 indicate the treatment with 0, 20, 40 t/ha biochar under controlled irrigation, F40 indicates the treantment with 40 t/ha biochar under flooding irrigation. Different letters within a column represents differences between groups for significance analysis.
Table 3.
Rice yield and its components.
| Year | Treatment | Productive Panicle Number | Grain Number | Filled Grain Number | Seed Setting Rate | 1000-Grain Weight | Actual Yield |
|---|---|---|---|---|---|---|---|
| (×104 panicle/ha) | (/panicle) | (/panicle) | (%) | (g) | (kg/ha) | ||
| 2016 | C0 | 247.05 ± 12 b | 107.58 ± 0.49 a | 80.50 ± 7.25 b | 74.80 ± 6.40 a | 22.40 ± 0.67 a | 7386 ± 137 b |
| C20 | 286.05 ± 15 a | 104.63 ± 7.86 a | 87.30 ± 4.32 ab | 83.60 ± 2.15 a | 23.00 ± 1.58 a | 8075 ± 569 ab | |
| C40 | 291 ± 22.05 a | 109.76 ± 15.67 a | 93.20 ± 10.40 a | 85.30 ± 2.70 a | 23.60 ± 1.42 a | 8552 ± 347 ab | |
| F40 | 316.05 ± 7.95 a | 105.87 ± 1.54 a | 92.40 ± 6.90 a | 87.20 ± 5.25 a | 23.40 ± 3.05 a | 9097 ± 145.8 a | |
| 2017 | C0 | 179.25 ± 7.5 b | 98.52 ± 13.40 a | 64.22 ± 5.58 a | 65.19 ± 3.20 a | 23.91 ± 1.45 a | 5373 ± 585 a |
| C20 | 265.2 ± 11.25 ab | 116.66 ± 17.37 a | 87.13 ± 8.70 a | 74.69 ± 3.70 a | 21.62 ± 2.14 a | 6665 ± 199 a | |
| C40 | 268.95 ± 59.7 ab | 113.40 ± 7.19 a | 85.39 ± 17.21 a | 75.30 ± 10.40 a | 23.25 ± 0.00 a | 7325 ± 844 a | |
| F40 | 302.55 ± 3.75 a | 98.08 ± 10.33 a | 72.69 ± 5.96 a | 74.11 ± 1.70 a | 23.99 ± 0.06 a | 7253 ± 91 a |
Note: C0, C20, C40 indicate the treatment with 0, 20, 40 t/ha biochar under controlled irrigation, F40 indicates the treatment with 40 t/ha biochar under flooding irrigation. Different letters within a column represents differences between groups for significance analysis.
Table 4.
Irrigation water use efficiency of rice under different management measures.
| Year | 2016 | 2017 | ||
|---|---|---|---|---|
| Treatment | Irrigation Water | YWUEIR | Irrigation Water | YWUEIR |
| (mm) | (kg/m3) | (mm) | (kg/m3) | |
| C0 | 498 | 1.482 | 619 | 0.868 |
| C20 | 473 | 1.706 | 576 | 1.158 |
| C40 | 485 | 1.764 | 592 | 1.237 |
| F40 | 1080 | 0.842 | 996 | 0.728 |
Note: C0, C20, C40 indicate the treatment with 0, 20, 40 t/ha biochar under controlled irrigation, F40 indicates the treatment with 40 t/ha biochar under flooding irrigation. YWUEir represents the irrigation water use efficiency.
Publisher’s Note: MDPI stays neutral with regard to jurisdictional claims in published maps and institutional affiliations. |
© 2021 by the authors. Licensee MDPI, Basel, Switzerland. This article is an open access article distributed under the terms and conditions of the Creative Commons Attribution (CC BY) license (http://creativecommons.org/licenses/by/4.0/).
Share and Cite
MDPI and ACS Style
Chen, X.; Yang, S.; Ding, J.; Jiang, Z.; Sun, X. Effects of Biochar Addition on Rice Growth and Yield under Water-Saving Irrigation. Water 2021, 13, 209. https://doi.org/10.3390/w13020209
AMA Style
Chen X, Yang S, Ding J, Jiang Z, Sun X. Effects of Biochar Addition on Rice Growth and Yield under Water-Saving Irrigation. Water. 2021; 13(2):209. https://doi.org/10.3390/w13020209
Chicago/Turabian StyleChen, Xi, Shihong Yang, Jie Ding, Zewei Jiang, and Xiao Sun. 2021. "Effects of Biochar Addition on Rice Growth and Yield under Water-Saving Irrigation" Water 13, no. 2: 209. https://doi.org/10.3390/w13020209
Note that from the first issue of 2016, this journal uses article numbers instead of page numbers. See further details here.