
Characteristics of Hydrochemistry and Stable Isotopes in a Karst Region in Samcheok, Republic of Korea


Department of Geology, College of Natural Sciences, Kangwon National University, Chuncheon 24341, Korea
*
Author to whom correspondence should be addressed.
Water 2021, 13(2), 213; https://doi.org/10.3390/w13020213
Submission received: 21 December 2020
/
Revised: 14 January 2021
/
Accepted: 15 January 2021
/
Published: 17 January 2021
(This article belongs to the Special Issue Hydrochemical Characteristics of Groundwater)
Abstract
:Karst regions cover approximately 10% of the Korean Peninsula and are highly vulnerable to contamination. In this study, five field surveys were conducted between 2017 and 2019 to examine the monthly and seasonal changes in the hydro-environment of a characteristic karst region in Samchoek, South Korea. During the surveys, a total of 24 surface water samples were collected and analyzed for field water quality parameters, major and minor ions, and stable isotopes. The results indicate that the water quality in the study area is significantly affected by precipitation. Overall, the water was classified as a Ca-Mg-HCO3 type, and correlation analysis of the major ions detected in the water samples indicates that the inflow of nitrate to the surface water originated from agricultural activities in the region. Furthermore, variations caused by climate were verified using the relationships between the various ions. In addition, high precipitation rates during the rainy season cause the active exchange of surface material, which was verified using stable isotope outliers. The results provide a scientific basis for studying the connectivity of water systems in complex karst hydrogeological regions and can aid future sustainable management of water resources in these regions.
1. Introduction
Karst commonly refers to topography formed by soluble rocks, such as limestone, which have been dissolved by water (e.g., groundwater or meteoric water). The etymology originates from Kar, a limestone zone in the former country of Yugoslavia [1]. The topographies that develop on the surface of a karst region include doline, uvala, polje, and lapies [2]. Most of the karst regions in Korea occur in lower Paleozoic strata and are widely distributed in the northern part of Gangwon Province, accounting for ~10% of the total area of the Korean Peninsula (16,347 km2) [3]. Karst aquifers contain dissolution-generated conduits that permit the rapid transport of groundwater, often as turbulent flow. The conduit system is interconnected with groundwater stored in fractures and in the granular permeability of the bedrock. As a conceptual framework, these basic components of karst aquifers are generally accepted [4].
Karst significantly impacts surface water and groundwater qualities, and water and rock react faster in karst regions than in other rock types [5,6]. In general, karst regions have rapid transport times, and precipitation can easily affect pollutants, making these regions vulnerable environments [7]. In karst hydrogeology, hydraulic features can be characterized by quantitative analysis. However, more detailed geological data are required to comprehensively determine the effects of surface water leakages on karst groundwater [8]. Hydrochemically, chemical changes in the surface water actively interact, depending on the season [9]. During the winter and summer, the chemical compositions of karst surfaces and groundwater are dominated by Ca2+, Mg2+, HCO3−, and SO42−, which account for more than 80% of the total ions in the system. During the summer, surface waters are diluted, and the chemical constituents in the groundwater exceed those in the surface water. Furthermore, the water system connectivity can be verified because the major elements in a karst region provide additional information about the groundwater conduits [10]. Consequently, analyses of the geological background and hydrochemistry must be conducted simultaneously for more accurate water quality determinations. Most hydrochemical compositions in karst regions originate from the dissolution of limestone and dolomite, and very few compositions originate from the dissolution of silicate minerals [11]. In river basins, the activities of plants and humans must be correlated with the carbonate dilution rate to determine the hydrochemical source. Compared with global river basins, basins characterized by karst topography have significantly higher total rock weathering rates [12].
Combined hydrochemical and stable isotope analyses provide new insights into the hydrochemical evolution of karst regions [13]. Karst isotopes have the same isotopic values as those in rainfall when the recharge rate through limestone is high [14]. Furthermore, the measured local meteoric water line (LMWL) closely follows the global meteoric water line (GMWL), and minimal evaporation occurs during rainfall. Considerable inverse correlations between isotopes and rainfall have been reported in previous studies, and the analysis of the stable isotope compositions of karst hydrological systems has been used as a simple and effective method for studying the hydrology of stagnant water systems compared to conventional hydrologic monitoring [15]. The ratios of oxygen (δ18O) and hydrogen (δ2H) isotopes are excellent tracers for determining the origin of groundwater and have been widely used to study groundwater recharge and the mixing of different water systems. Furthermore, in scatter plots of δ18O and δ2H, groundwater samples generally plot close to the GMWL of δD = 8δ18O + 10 [16]; therefore, the groundwater origin can be determined using this formula [17].
Surface water in karst regions interacts with groundwater when water is lost through the sinkhole of a spring [18]. Karst aquifers are highly heterogeneous and anisotropic; thus, groundwater management is difficult. Therefore, further scientific studies on the heterogeneity and other physical properties of karst aquifers are required [19]. Previous studies on the effects of rainfall and temperature on water–rock interactions have been conducted [8,20,21]. Therefore, the analysis of climate data can provide critical parameters for understanding the hydrochemistry of karst regions. Furthermore, these extreme changes significantly affect the development of karst. Rainfall events are increasing worldwide due to climate change, and careful review of these events is necessary to ensure the preservation of water resources and ecosystems in karst regions [20]. Hydrochemical changes may be caused by excessive water pumping for agriculture and can serve as indicators of the negative impacts of anthropogenic activity on aquifers, provided there have been no noticeable effects from climate change [21]. The hydraulic flow process in a karst region occurs relatively quickly; therefore, data interpretation based on time series analysis is critical for monitoring changes in karst groundwater resources [8].
Karst regions represent crucial areas for securing water resources and are highly vulnerable to the negative impacts of climate change and artificial pollution. In addition, their complex flow networks hamper the estimation of water resources in karst regions. Therefore, to secure water resources and manage the effects of artificial pollution, the seasonal connectivity of water systems must be characterized using hydrochemical analyses.
2. Study Site and Methods
2.1. Study Site
There are numerous caves in the city of Samcheok, Gangwon Province, as stated by a 2018 survey of the region, which documented more than 100 caves. Among these, the Chodang and Sohan caves to the south of the study area have significant geoheritage values [22]. Chodang Cave was designated as “Natural Monument No. 226” on 17 September 1970. Sohan Cave is situated below Chodang Cave, and both caves are interconnected [23,24]. Chodang Cave is large, with a three-level structure consisting of a vertical cave section, a ramp, and a horizontal cave section. It also features several relatively large square-shaped chambers in the bottom layer that are connected to Sohan Cave and generate effluent throughout the year. Sohan Cave is a W-shaped underwater cave with extremely limited access to the entrance. The internal heights and widths of the cave are 3–9 m and 3–5 m, respectively [23].
2.1.1. Geologic Setting
The geology of the study region comprises the limestone series of the Taebaek Group (Cambrian-Ordovician), which unconformably overlies Precambrian gneiss bedrock (Figure 1). Moreover, a fluvial deposit featuring these rocks as unconformities with the bedrock is visible in the area [25]. The Taebaek Group is mainly composed of schists formed by regional metamorphism and gneisses formed by secondary metamorphic processes [26,27].
The Daegi Formation is conformable with the Myobong Formation and is broadly distributed in a N–S direction at the center of the study area. This formation is composed of light pink, white, and gray limestones and dolomites and features increasing amounts of shale in the upper portions [28,29,30]. The Hwajeol Formation, which is conformable with the Daegi Formation, is the top layer of Cambrian strata and is distributed in a N–S direction to the west of the Pungchon Limestone Formation [31]. The lower part of the Hwajeol Formation consists of dark brown or dark green shales and slates, and the upper part comprises muddy limestones.
The Dongjeom Formation is conformable with the Hwajeol Formation and comprises Ordovician strata. It is distributed on a small scale in a N–S direction to the west of the study area. The maximum thickness of the Hwajeol Formation is 200 m, and it is characterized by alternating layers of limestone and siltstone. This limestone—shale pattern is noticeable below the Hwajeol Formation and is conformable with the Daegi Formation. In this layer, the limestone and slate layers are composed of ribbon rocks, green-gray slates, gray-dark gray lobed limestones, dark gray fine sandstones to sandy shales, gray marlstones, and muddy limestones [32]. The Dongjeom Formation conformably overlies the Hwajeol Formation and is ~60 m thick. The component rocks are gray, dark gray, or black sandstone slates or sandstones and dark gray or light brown neutral sandstones. Depending on the location, these rocks are composed of dark gray calcareous shales and sandstones, and shales.
The Dumugol Formation conformably overlies the Dongjeom Formation and is mainly composed of shales, calcareous shales, muddy limestones, and limestones, with a thickness of 150–270 m [33]. The lower part of the Dumugol Formation comprises fine-grained sandstones and siltstones, and ribbon rocks and flat pebble conglomerates frequently occur in the upper part of the formation. The middle part is composed of marlstones, siltstones, and alternating ribbon rocks and flat pebble conglomerates [34]. The upper part is composed of thick calcareous shales, thin ribbon rocks, and marlstone shales that occur in an alternating pattern.
2.1.2. Climate
The study area experiences a typical monsoon climate [35]. From 2000 to 2019, the average annual precipitation was 1302.9 mm, and the differences in rainfall and temperature between the dry season (November–February) and the rainy season (June–September) were relatively large (Figure 2). In the study area, 30 out of 38 events with monthly precipitation of 200 mm or higher were concentrated from July to September, and extreme seasonal variations were recorded. Securing water resources is challenging because the annual precipitation has been largely unpredictable since the early 2000s. Recently, a strong decreasing precipitation trend has been recorded, and additional climate data will be required to secure water resources in the future. The average temperature ranges from 12–14 °C, and there is a strong correlation between rainfall and the annual average temperature in the study area.
2.2. Methods
In this study, 24 locations were selected in the Hamaengbang (HM), Kyogok (KG), and Sangwolsan (SW) areas to evaluate the hydrochemistry of the Samcheok region (sampling locations are indicated in Figure 1) from November 2017 to January 2018 and July 2019. Field water quality surveys were conducted five times in each area for hydrochemical analyses. In addition, to examine the seasonal differences and changes in precipitation, field water quality surveys were conducted twice in July 2019 (before and after rainfall).
Before collecting water samples for analysis, the water temperature, pH, dissolved oxygen (DO), electrical conductivity (EC), oxidation–reduction potential (ORP), and turbidity were measured using a field water quality meter (Horiba D-50 Series and Hach 2100Q). The ORP was measured using an Ag/AgCl electrode, and the measured values were converted to standard hydrogen electrode values. The water samples for anion and cation analyses were filtered using a 0.45 μm filter, and the cation sample was adjusted to a pH of 2 or lower using a strong nitric acid. The samples were sealed in containers and refrigerated at 4 °C or lower until analysis.
Major and minor ionic analyses were conducted at the Basic Science Analysis Support Center at Sangji University, and stable isotopes were analyzed by the Beta Analytic Testing Laboratory (CA, USA). The ionic concentrations are reported in mg/L, and the stable isotope values are expressed in ‰. Furthermore, to examine the connectivity of the cave water systems, a correlation analysis was performed for 17 factors, including field water quality surveys, cations, anions, and 2H, 18O, and 13C stable isotopes, using the R Studio program. This analysis determined the relationships between the factors affecting water quality in the study area.
3. Results and Discussion
3.1. Hydrochemistry
Table 1 lists the surface water quality parameters of the HM, KG, and SW samples. Surface water temperatures displayed significant seasonal variations due to the direct effects of high air temperatures [11,36]. The hydrogen ion concentration (pH) of the surface water was approximately 8, typical for karst topography. Moreover, weak alkaline properties were detected for the samples and were attributed to a bicarbonate ion increase caused by the coupling of carbonate and hydrogen ions caused by the dissolution of carbonate rock and the dissolution of carbon dioxide, respectively [37,38,39], as shown in Reactions R1 and R2:
The EC values of surface water in this region were significantly higher (average 180 μS/cm) than those of the surface waters (50–100 μS/cm) [40] and shallow groundwater samples (150–500 μS/cm), due to ion enrichment from the dissolution of carbonate rocks as water moves along a conduit during rainwater infiltration and flow [11,41]. In particular, the surface water samples from the Sohan cave spring recorded anomalously high EC readings, suggesting that carbonate dissolution occurred while rainwater penetrated underground and flowed through a conduit.
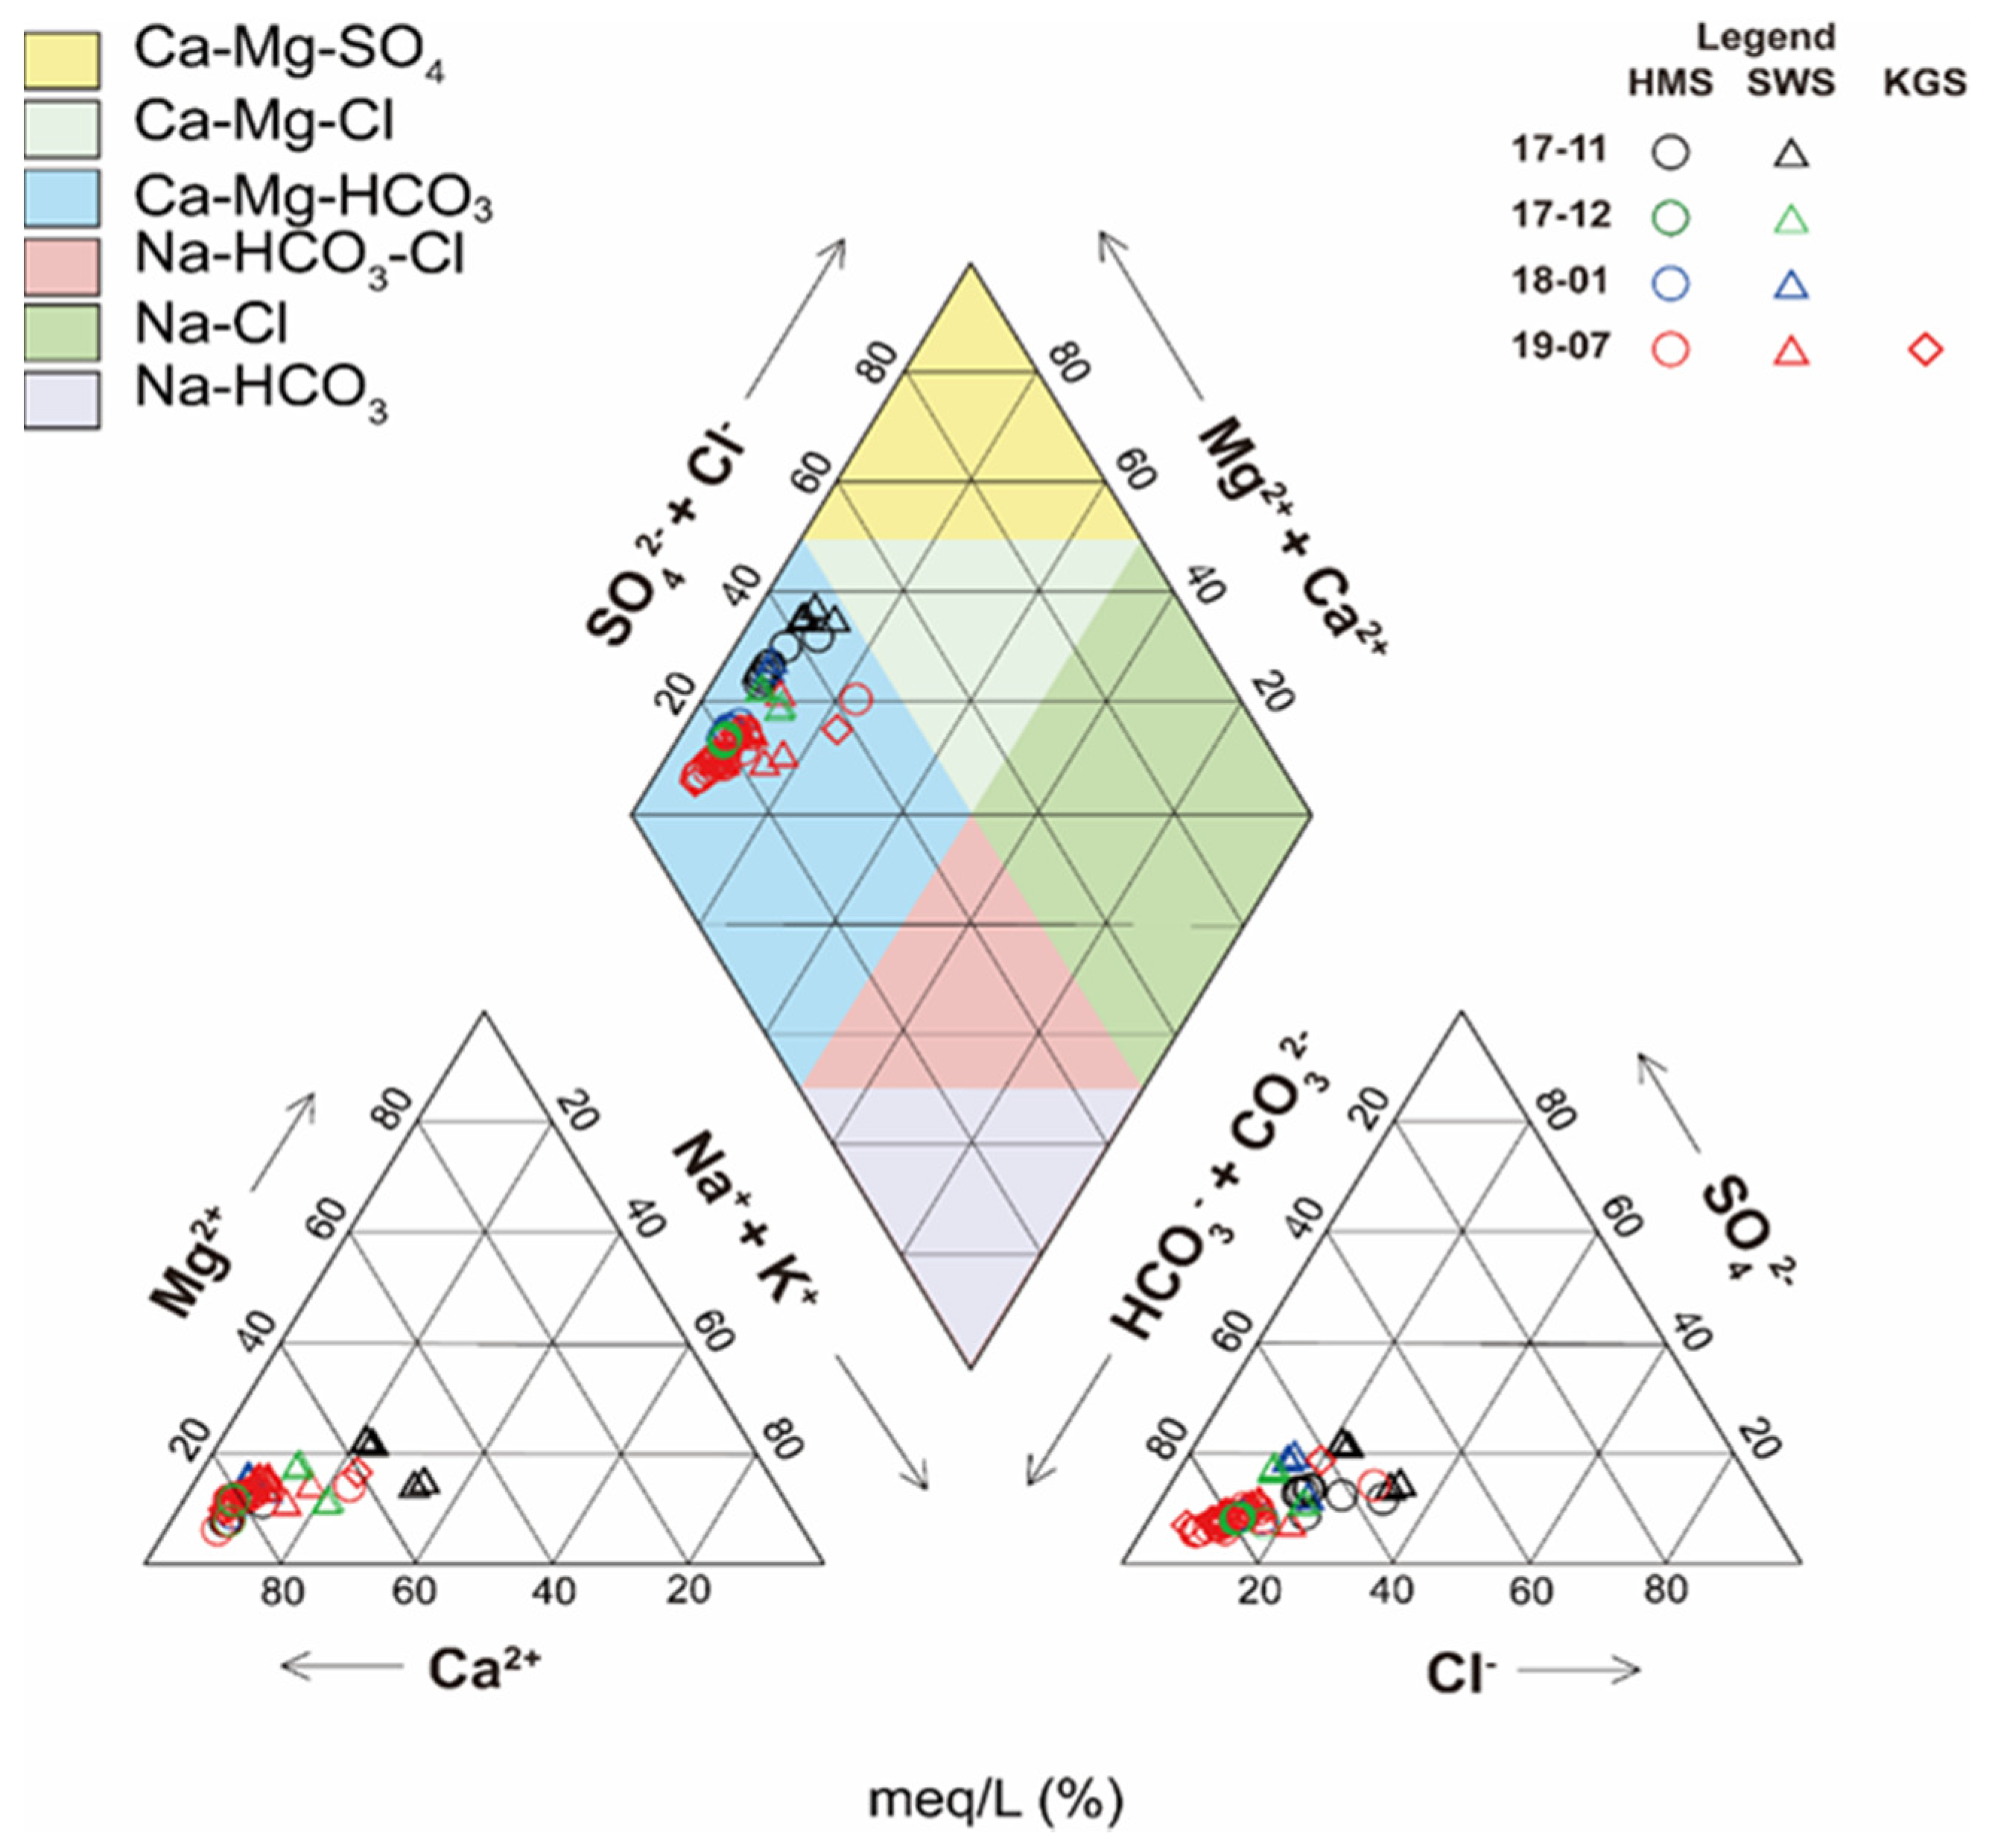
Figure 3 shows a piper diagram of the cations and anions in the surface water samples. The dominant cation and anion in the surface water samples were Ca2+ and HCO3−, respectively, and most of the water quality ions were the Ca-Mg-HCO3-type. This classification is characteristic of surface water that has been directly influenced by the atmosphere, and it is likely that carbonate rock dissolution (weathering) significantly affects the hydrology of this region [42,43]. However, SO42− and Cl− ions also increased in some surface waters near the East Sea due to the effect of farmland and brackish water.
3.2. Correlation Analysis
The analysis of correlation coefficients can reveal linear or nonlinear relationships between variables. Two variables can be mutually independent or correlated, and the intensity of the correlation between the two variables is the correlation coefficient [44]. The correlation coefficient is usually represented by Pearson’s correlation coefficient (r), which has a value between +1 and −1, where +1 indicates a positive linear correlation, 0 indicates no linear correlation, and −1 indicates a negative linear correlation. The r-value is determined by dividing the covariances of two variables in the data of an equal scale or a proportional scale by the product of the standard deviations and is expressed as follows:
where is the coefficient of correlation, and are individual hydrochemical data, and and are the means of the individual hydrochemical data.
The r-value only indicates the degree of correlation between two variables and does not explain the causal relationship [45]. Moreover, determining one of the two correlated variables allows for the determination of the other variable. As the correlation coefficient can be used as a measure of the relationship between variables, it was used in this study to establish the relationships between the hydrochemical parameters.
Table 2 shows the results of the water quality correlation analysis between the Samcheok region and the study area. A total of 79 samplings were performed in the Samcheok region, and numerous Ca2+ ions, which are dominant in karst environments, exhibited strong positive linear correlations with HCO3− ions. Furthermore, the EC data had significantly positive linear relationships with K+, Mg2+, Na+, Cl−, and SO4−. Moreover, NO3− did not display any conspicuous correlations with the other major ions. However, a positive linear relationship was observed between NO3− and turbidity. This correlation suggests that nitrates were not naturally generated and were most likely derived from surface materials in rainwater runoff from neighboring farmhouses and domestic wastewater. The correlation analysis of the HM area indicates strong positive correlations between EC and cations and anions, except Ca2+ and HCO3−. Meanwhile, HCO3− exhibited a weak negative correlation with EC, while Ca2+ exhibited a positive linear relationship with HCO3−. This trend indicates an increase in HCO3− by the coupling of CO32− supplied by the dissolution of carbonates and hydrogen ions, which were supplied by the dissolution of CO2 [35,37,38].
For nitrate, the absence of residential development in the vicinity of the sampling area excludes it as a potential source of nitrates. However, several NO3− ions exhibited positive linear relationships with other major ions, suggesting an agricultural origin. In the KG area, effluents from the mine flow into the surface through a natural purification process. In the KG area, EC exhibited strong positive linear relationships with K+, Na+, and HCO3−. The upstream region was enriched in Ca2+ and HCO3− from carbonate dissolution. However, the correlations between the ions decreased as the water mixed with other water systems. Furthermore, δD and δ18O exhibited a strong negative linear relationship, suggesting various water sources in the study area. Furthermore, cations (excluding δD and δ18O) and Ca2+ exhibited intermediate negative linear relationships. This could be due to the lack of water–rock reaction. The water systems in the KG area are not significantly influenced by carbonate rocks, indicating the separation of the water systems. In the SW area, Ca2+, Mg2+, and HCO3− exhibited strong positive linear relationships, whereas K+, Na+, Cl−, and SO4− exhibited strong negative relationships. This suggests that groundwater does not percolate through deep bedrock and only reacts with carbonate rocks in the shallow strata.
3.3. Ionic Ratios
Figure 4 shows the factors influencing the water quality determined from the relationship between the total dissolved solids (TDS) and the ionic ratios. Most of the surface water samples in the study area had TDS values of 80–260 mg/L and much higher ion quantities than the surface water samples. The ratios of cations (Na+ and Ca2+) to anions (Cl− and HCO3−) were mostly 0.3 or less, which is typical for water in karst topographies [11]. After each rainfall event, the TDS increased by 30% or more. Furthermore, the ion ratio was significantly affected by rock weathering, and the increases in TDS in the water samples after rainfall events indicate an exchange between surface materials and water immediately after rainfall.
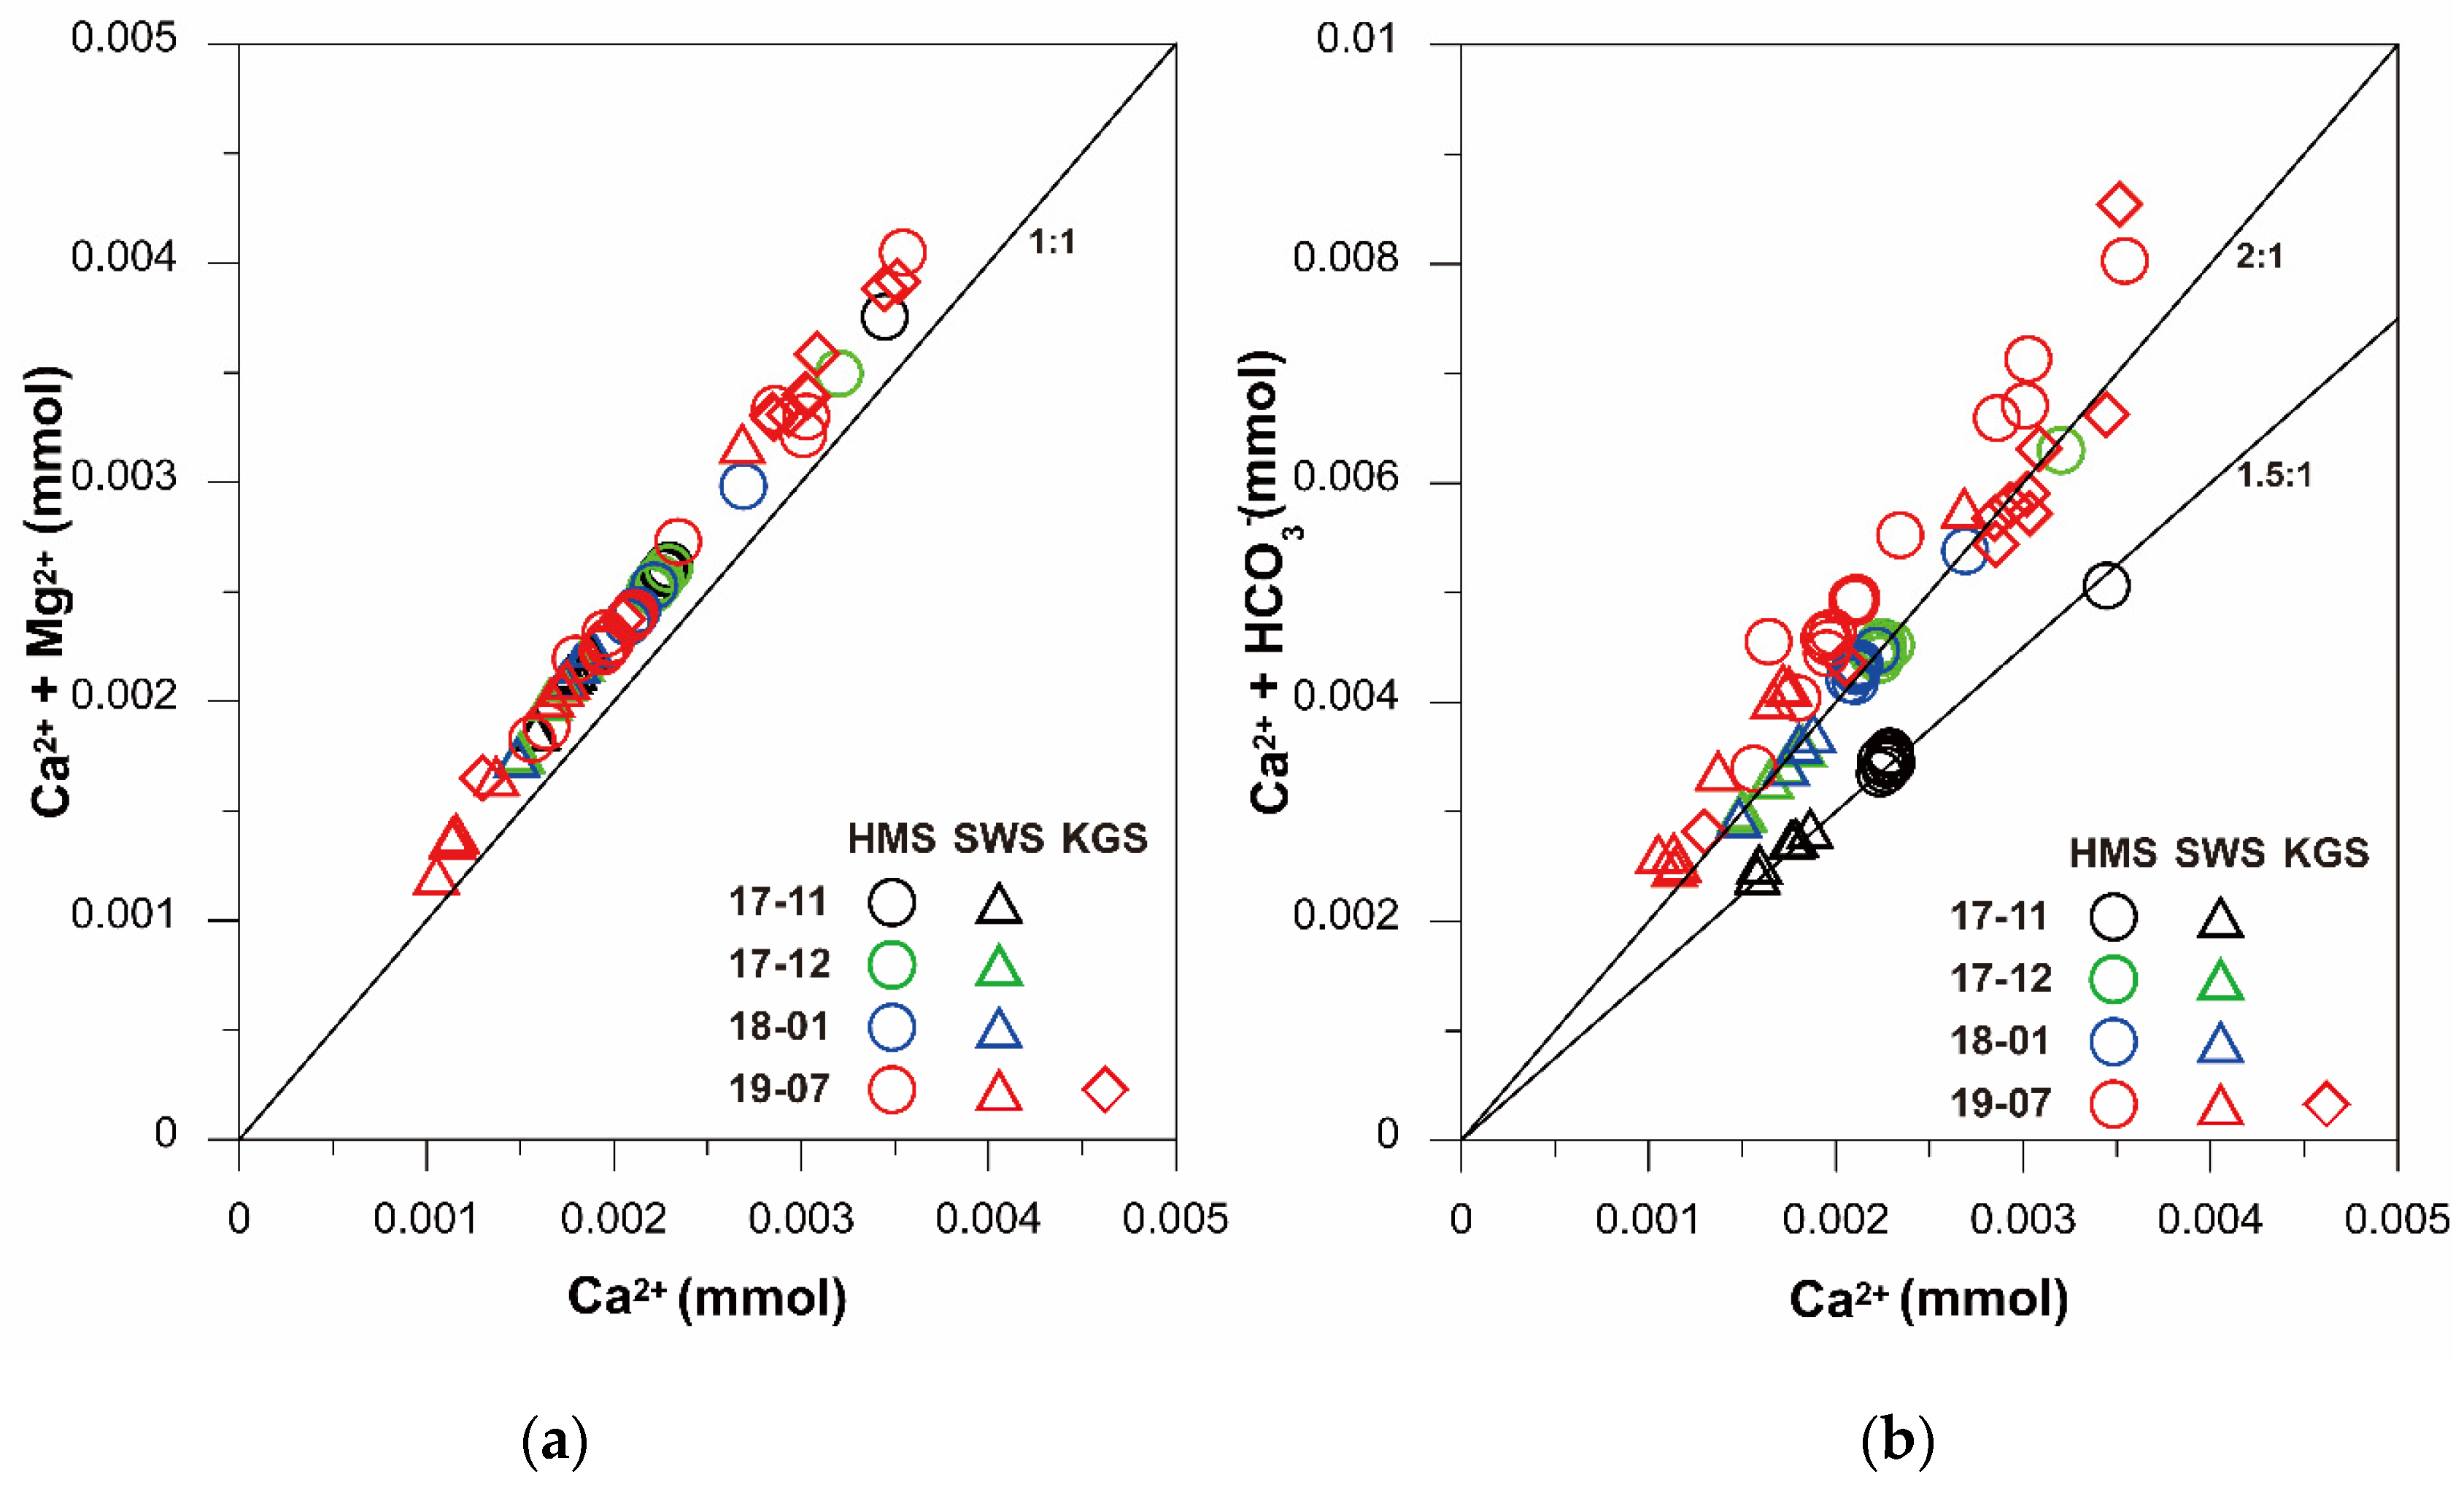
Figure 5 shows the relationships among Ca2+, Mg2+, and HCO3−. Mg2+ increased monthly. Most of the ratios between the total amounts of Ca2+ and Mg2+ were near 1:1, and the amount of Mg2+ was not large. This indicates that the rocks affecting the water system in this area were likely influenced by limestone, which does occur among the carbonate rocks. However, the ratio of Ca2+ to HCO3− exhibited distinct monthly variations, likely due to changes in climate in the study area. In November 2017, the monthly average temperature was 9 °C, and the rainfall was 31.2 mm. However, between December 2017 and January 2018, the average temperature decreased to 1.6 °C, and the total rainfall was 8.4 mm. Consequently, at the beginning of the dry season (November), the rainfall would have flowed underground, promoting water circulation. However, during the dry season (December–February), precipitation decreased, stagnating the groundwater flow. As a result, the water–rock reaction time would have increased, enriching the ions in the surface and groundwater. During the rainy season (July), water circulates more rapidly due to higher rainfall rates and water is mixed with sediment. Furthermore, it is thought that the ionic ratios would be higher in July than in December and January due to higher temperatures [46]. In the case of HCO3−, increased rainfall and higher average temperatures during the wet summer season promote active chemical weathering and dissolution, thereby increasing the flow of CO2 into the atmosphere. As shown in Figure 5, the changes in the Ca2+ and Mg2+ ionic ratios were negligible. However, the ionic ratios during the rainy season were similar to those in the dry season, as it is closer to spring, and HCO3− enrichment occurs with flow distance.
3.4. Stable Isotope Characteristics
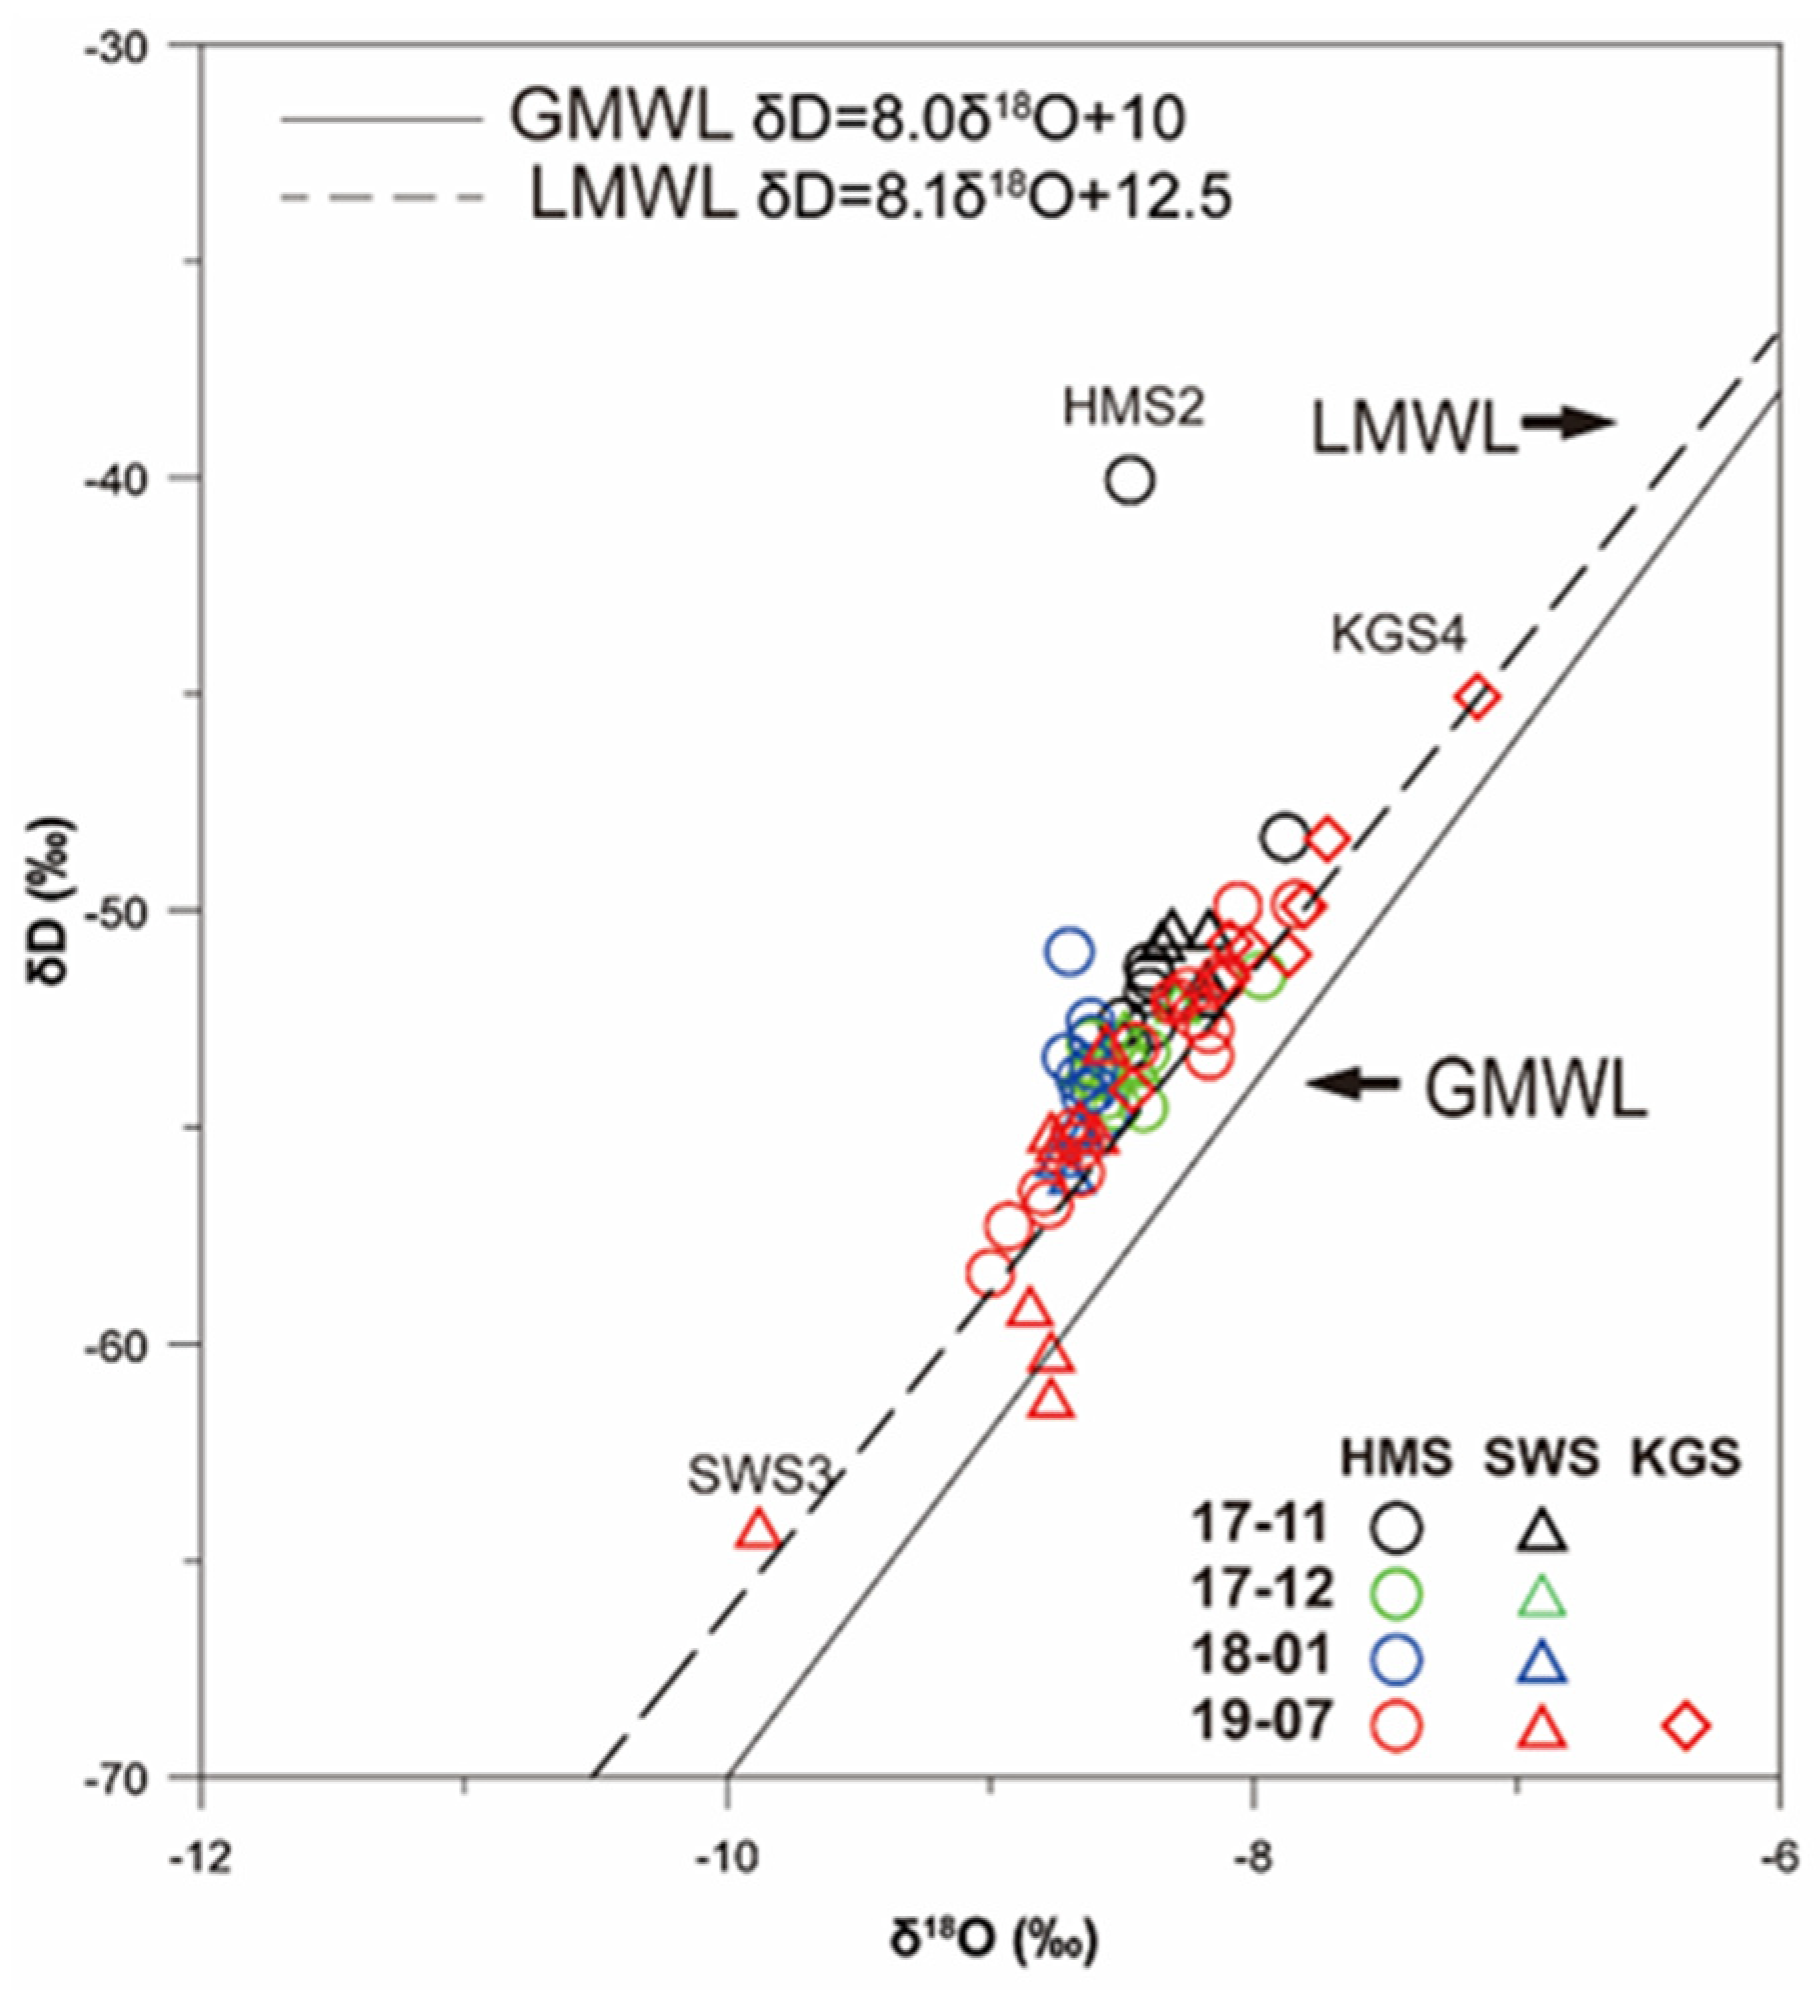
The isotopes of water in the study area were enriched relative to the GMWL, and the origin of water in the area could be determined using the average isotope values for the area. The δ18O and δD values in Figure 6 range from −64.2 to −40.1‰ and from −9.9 to −7.2‰, respectively. The seasonal differences in the isotope values were not significant. The surveys in July were performed twice (before and after rainfall), and the analyses revealed two clusters of significantly dispersed and consistent isotopic values. These trends indicate that the isotopic values plotted in similar locations during the dry season before rainfall but were widely dispersed after rainfall, likely due to disturbance of the water systems by rainfall.
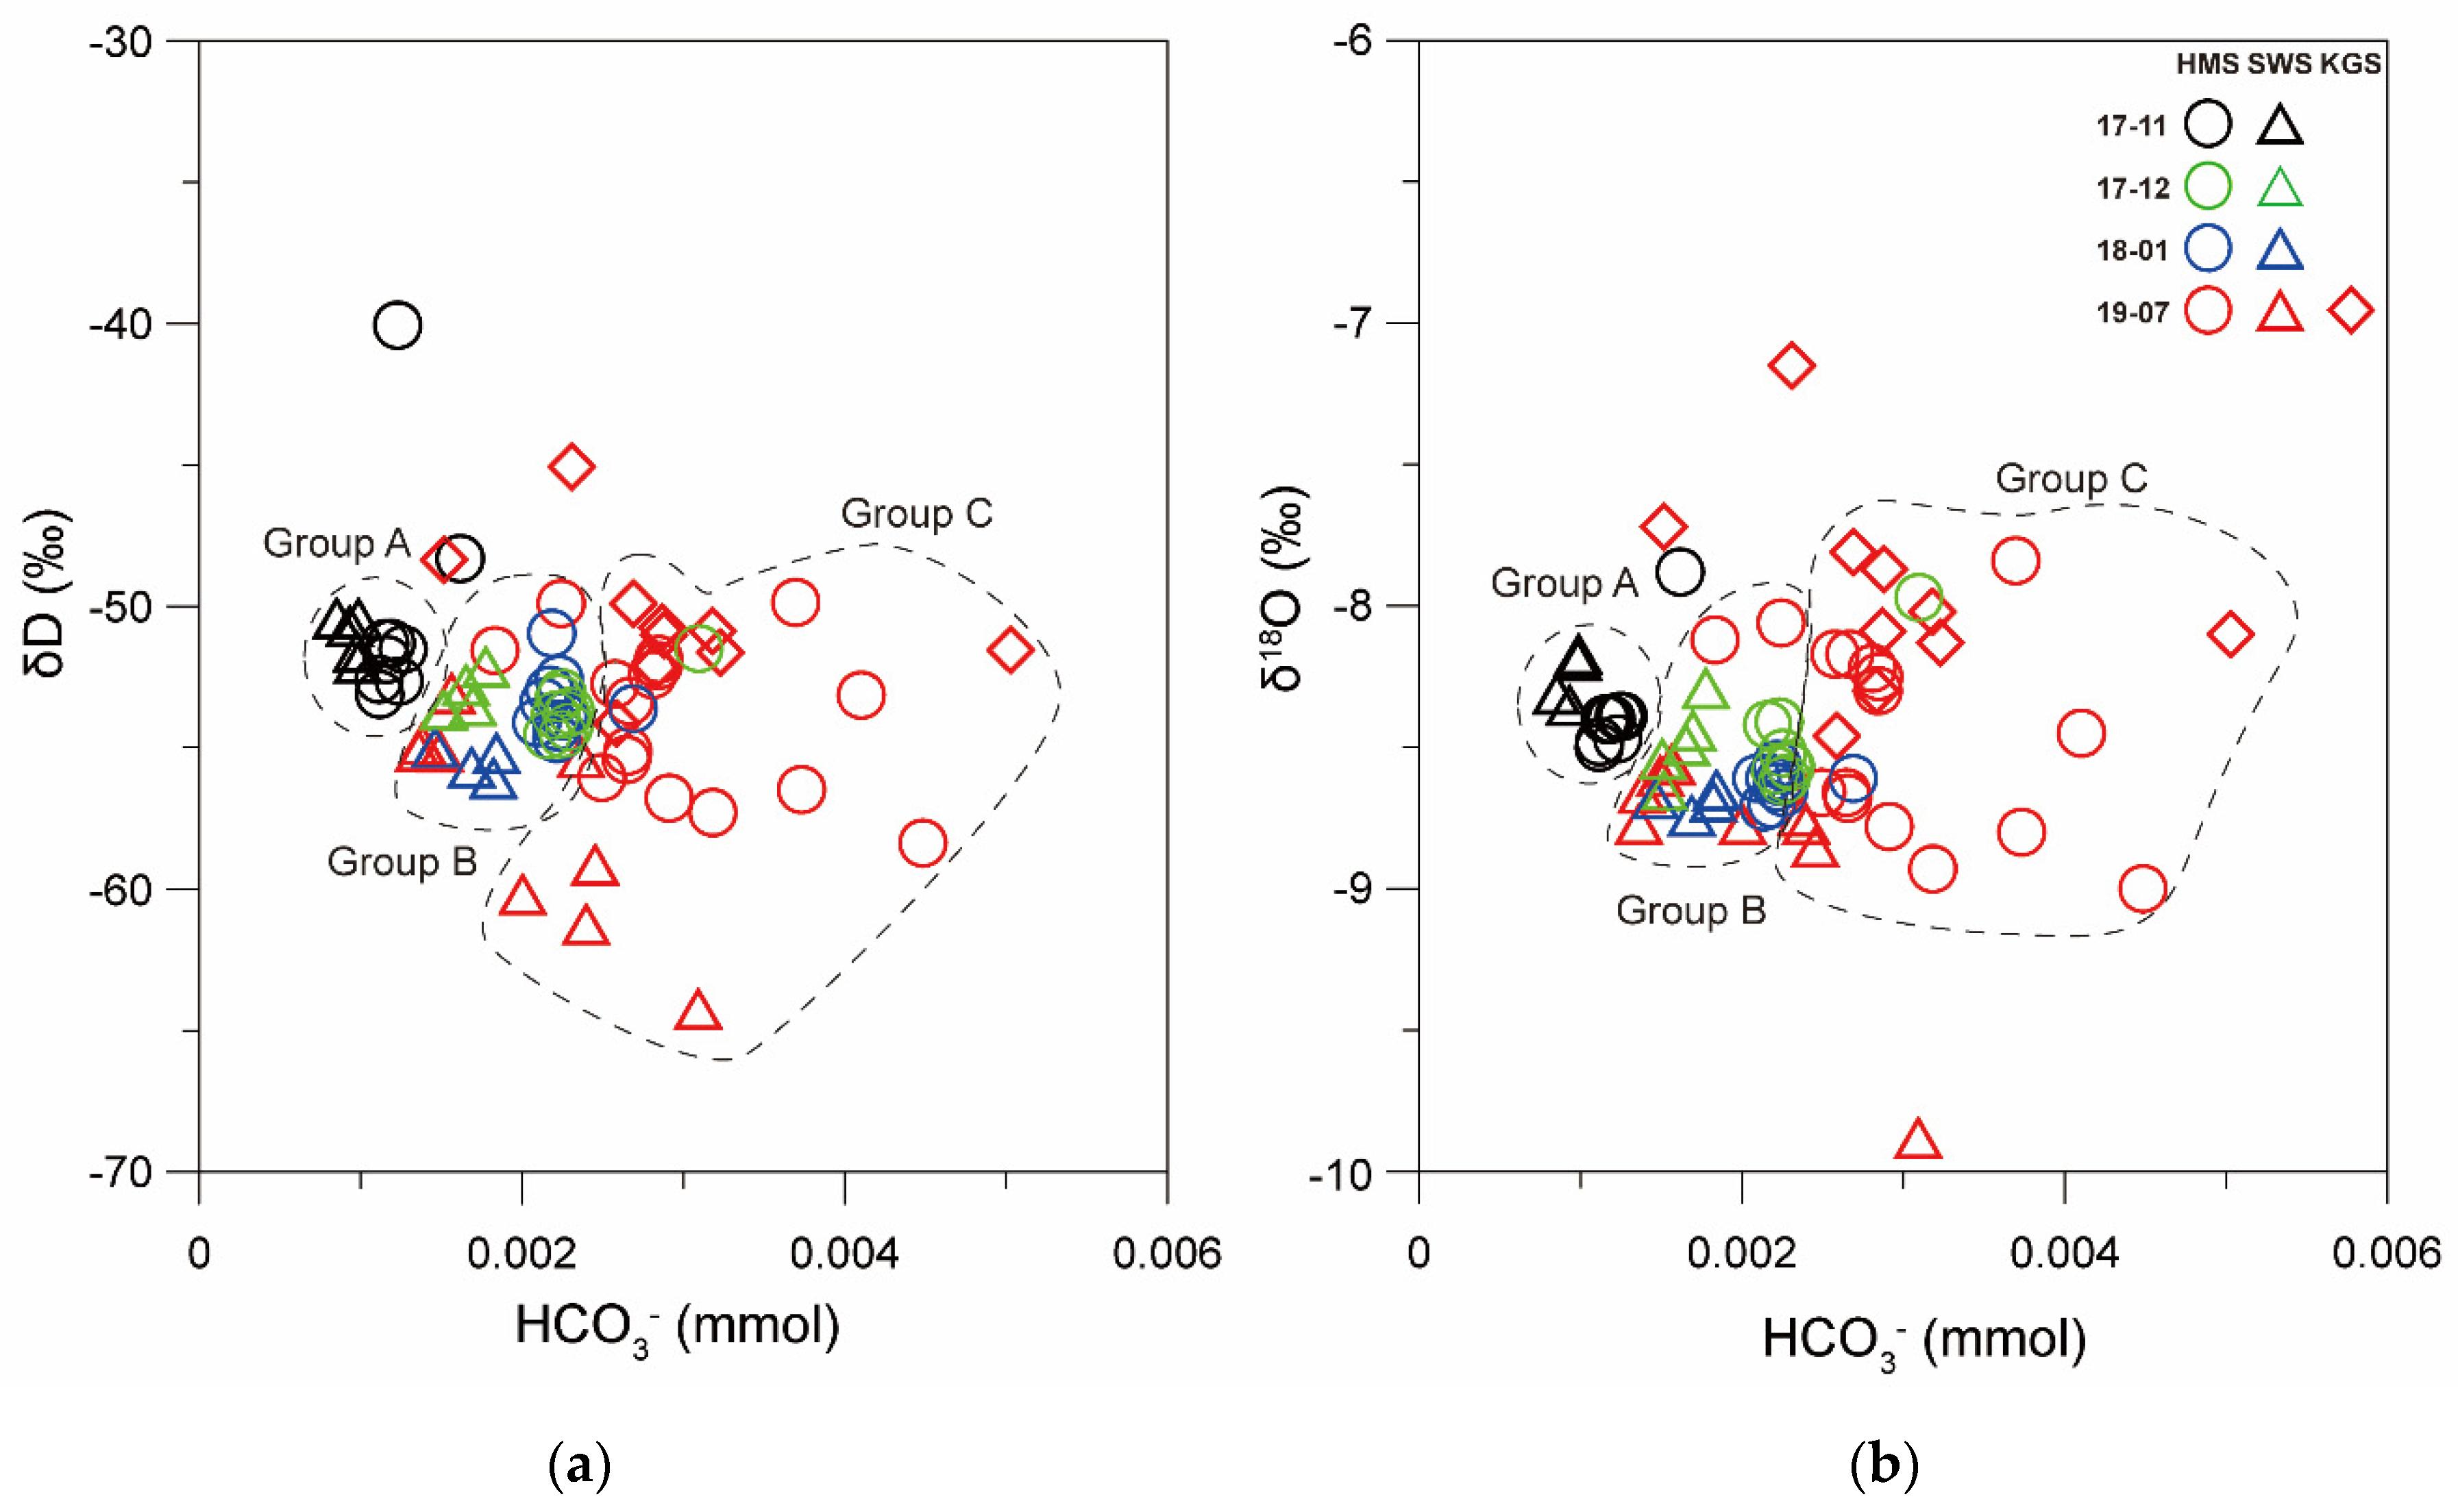
It is likely that rainfall had a more significant influence on δ18O because of the surface materials (sediment) that were incorporated into the water by rainfall. Furthermore, the δD values exhibited significant differences according to the area, season, and flow distance of the stream. However, the δD values exhibited almost no change immediately after rainfall, and the lowest values were recorded near the location of water outflow. This suggests that CO2 dissolved in the water escapes during water outflow. Figure 7 shows the relationship between bicarbonate and water stable isotopes. Although seasonal changes in the isotopic values are not significant, the HCO3− contents could be divided into three groups (Figure 7). At the beginning of the dry season, the average temperature was relatively warm (9 °C), and the effect of water–rock interactions was likely insignificant. Further, into the dry season, a more extreme climate was observed. Consequently, CO2 from the dissolution of carbonate rocks reacted more actively with H+, leading to HCO3− enrichment.
During the rainy season, the compositions in several of the SW areas were similar to those during the extreme dry season, but the HM and SW areas had distinct isotopic values. Furthermore, the surveys conducted during the rainy season indicate seasonal isotopic changes in the KG and SW areas. However, the HM area did not experience significant seasonal isotopic or hydrochemical changes. In terms of stable isotopes, extreme variations were observed after the occurrence of rainfall events. During the rainy season, the isotopic values before a rainfall event were similar to those recorded during the dry season. However, the data measured immediately after rainfall show marked increases in HCO3−.
4. Conclusions
This study sampled surface water at 24 locations in the study area to determine the seasonal fluctuations in isotopic and hydrochemical compositions. The results indicate that the Ca2+ and HCO3− concentrations during the rainy season were approximately two times higher than those recorded during the dry season. Consequently, the surface water was determined to be predominately a Ca-Mg-HCO3-type. Based on our analyses, we determined that Ca2+ and HCO3− ions originate from the interaction between carbonate rocks and rainwater.
The HMS1 sample (Figure 1) from the Sohan cave exhibited similar patterns throughout the year, whereas the other surface water samples were characterized by ion enrichment during the dry season. Furthermore, samples collected in the middle of the dry season (December–February) were enriched in ions compared to those collected at the beginning of the dry season (November). This suggests that, as the dry season continues, the residence time of water between the karst networks increases, thereby activating water–rock reactions. Furthermore, high rainfall rates during the rainy season (July) flushed sediment into the water systems, thereby increasing the ionic concentrations of the surface waters by 30% and increasing the TDS three-fold.
Most of the surface water samples in this region plot close to the GMWL, indicating that they originated from rainfall that was derived from the evaporation of nearby seawater. Also, in the rainy season, it is likely that the exchange of surface materials is more active. This implies that exchange with surface materials occurred through the stable isotope outliers. Furthermore, the relationships among the ratios of the various ions indicate the occurrence of several separate water systems in the study area, which are interconnected during the rainy season. This study provides an essential reference on the connectivity of water systems in complex karst hydrogeological regions and can aid future sustainable management of water resources in these regions.
Author Contributions
Conceptualization, methodology, software, validation, formal analysis, investigation, writing—original draft preparation, writing—review and editing, and supervision, J.J., J.-Y.L. and H.K.; resources, data curation, visualization, project administration, and funding acquisition, J.-Y.L. and H.K. All authors have significantly contributed to manuscript preparation. All authors have read and agreed to the published version of the manuscript.
Funding
This research was funded by the Korea Environmental Industry & Technology Institute (KEITI) through the Measurement and Risk Assessment Program for the Management of Microplastics Program of the Korea Ministry of Environment (MOE; grant number 2020003110010), by the Basic Science Research Program through the National Research Foundation of Korea (NRF) funded by the Ministry of Education (grant numbers 2019R1I1A2A01057002 and 2019R1A61A03033167), and by a 2020 Research Grant from Kangwon National University.
Conflicts of Interest
The authors declare no conflict of interest.
References
- Burdon, D.J.; Papakis, N. Handbook of Karst Hydrogeology. United Nations Special Fund; Institute for Geology and Subsurface Research: Athens, Greece, 1963. [Google Scholar]
- Lee, E.S. Review of principle and applications of karst hydrogeology. J. Geol. Soc. Korea. 2004, 40, 349–359, (abstract in Korean). [Google Scholar]
- Tak, H.M.; Son, I. The drainage and irrigation system developed on the karstic uvala: The case of Kwangduk-ri, Nam-myeon, Jungseon-gun, Kangwon-do. J. Korea. Geomorphol. Assoc. 2014, 49, 639–655. (In Korean) [Google Scholar]
- White, W.B. Karst hydrology: Recent developments and open questions. Eng. Geol. 2002, 65, 85–105. [Google Scholar] [CrossRef]
- Hartmann, A.; Goldcheider, N.; Wangener, T.; Lange, J.; Weiler, M. Karst water resources in a changing world: Review of hydrological modeling approaches. Rev. Geophys. 2014, 52, 218–242. [Google Scholar] [CrossRef]
- Pu, J.; Cao, M.; Zhang, Y.; Yuan, D.; Zhao, H. Hydrochemical indications of human impact on karst groundwater in a subtropical karst area, Chongqing, China. Environ. Earth Sci. 2015, 72, 1683–1695. [Google Scholar] [CrossRef]
- Einsiedl, F.; Maloszewski, P.; Stichler, W. Multiple isotope approach to the determination of the natural attenuation potential of a high-alpine karst system. J. Hydrolo. 2009, 365, 113–121. [Google Scholar] [CrossRef]
- Wang, Y.; Guo, Q.; Su, C.; Ma, T. Strontium isotope characterization and major ion geochemistry of karst water flow, Shentou, northern China. J. Hydrolo. 2006, 328, 592–603. [Google Scholar] [CrossRef]
- Raza, M.; Lee, J.Y. Factors affecting spatial pattern of groundwater hydrochemical variables and nitrate in agricultural region of Korea. Episodes 2019, 42, 135–148. [Google Scholar] [CrossRef]
- Barbieri, M.; Boschetti, T.; Petitta, M.; Tallini, M. Stable isotope (2H, 18O and 87Sr/86Sr) and hydrochemistry monitoring for groundwater hydrodynamics analysis in a karst aquifer (Gran Sasso, Central Italy). Appl. Geochem. 2005, 20, 2063–2081. [Google Scholar] [CrossRef]
- Ryu, H.-S.; Lee, J.Y.; Lim, C.W.; Kim, K.T. Hydrochemical characteristics of groundwater and stream water in a karst area of Samcheok, Korea. J. Geol. Soc. Korea. 2019, 55, 117–129. [Google Scholar] [CrossRef]
- Han, G.; Lui, C.-Q. Water geochemistry controlled by carbonate dissolution: A study of the river waters draining karst0dominated terrain, Huizhou Province, China. Chem. Geol. 2004, 204, 1–21. [Google Scholar] [CrossRef]
- Chen, L.; Wang, G.; Hu, F.; Wang, Y.; Liu, L. Groundwater hydrochemistry and isotope geochemistry in the Turpan Basin, northwestern China. J. Arid Land. 2014, 6, 378–388. [Google Scholar] [CrossRef] [Green Version]
- Florea, L.; Forray, F.L.; Banks, S.M. Eurokarst 2018, Catherine Bertrand: Besançon, France; Marc Steinmann: Besançon, France, 2020; pp. 31–46. [Google Scholar]
- Bugna, G.C.; Grace, J.M.; Hsieh, Y.-P. Sensitivity of using stable isotopic tracers to study the hydrology of isolated wetlands in North Florida. J. Hydrolo. 2020, 580, 124321. [Google Scholar] [CrossRef]
- Crag, H. Isotopic Variation in Meteoric Waters. Science 1961, 133, 1702–1703. [Google Scholar] [CrossRef] [PubMed]
- Subyani, A. Use of chloride-mass balance and environmental isotopes for evaluation of groundwater recharge in the alluvial aquifer, Wadi Tharad, western Saudi Arabia. Environ. Geol. 2004, 46, 741–749. [Google Scholar] [CrossRef]
- O’Driscoll, M.A.; DeWalle, D.R. Stream-air temperature relations to classify stream-ground water interactions in a karst setting, central Pennsylvania, USA. J. Hydrolo. 2006, 329, 140–153. [Google Scholar] [CrossRef]
- Dar, F.A.; Perrin, J.; Ahmed, S.; Narayana, A.C. Review: Carbonate aquifers and future perspectives of karst hydrogeology in India. Hydrogeol. J. 2014, 22, 1493–1506. [Google Scholar] [CrossRef]
- Li, G.; Rubinato, M.; Wan, L.; Wu, B.; Luo, J.; Fang, J.; Zhou, J. Preliminary Characterization of Underground Hydrological Processes under Multiple Rainfall Conditions and Rocky Desertification Degrees in Karst Regions of Southwest China. Water 2020, 12, 594. [Google Scholar] [CrossRef] [Green Version]
- Bicalho, C.C.; Guilhe, C.B.; Seidel, J.L.; Exter, S.V.; Jourde, H. Hydrodynamical changes and their consequences on groundwater hydrochemistry induced by three decades of intense exploitation in a Mediterranean Karst system. Environ. Earth Sci. 2012, 65, 2311–2319. [Google Scholar] [CrossRef]
- Cave Research Institute of Korea. Gangwon-do Cave Basic Survey Report; Cave Research Institute of Korea: Chuncheon, Korea, 2018; pp. 52–53. [Google Scholar]
- Woo, K.S.; Won, J.K.; Lee, G.C.; Namkoong, C.; Choi, Y.K. Comprehensive Investigation Report of Chodang Cave; Samcheok City: Samcheok, Korea, 2000; 202p. (In Korean) [Google Scholar]
- Sampyo, K.N.U. Groundwater Impact Investigation Report (1st Stage) on High. Quality Limestone Development of Dongyang 2nd Mine; Sampyo: Samcheok, Korea, 2017; pp. 42–47. [Google Scholar]
- Won, J.K.; Park, B.K.; Lee, S.H. Geologic Report on Samcheok-Gosari Sheet; KIGAM: Daejeon, Korea, 1994; pp. 1–36. [Google Scholar]
- Lee, Y.L.; Choi, D.K. Sedimentology of the Dumugol formation (Lower Ordovician) in the vicinity of the Dongjeom station, Taebaeg City: A preliminary study. J. Geol. Soc. Korea 1987, 23, 331–337. [Google Scholar]
- Choi, D.K.; Chough, S.K.; Kwon, Y.K.; Lee, S.; Woo, J.; Kang, I.; Lee, H.S.; Lee, S.M.; Sohn, J.W.; Shinn, Y.J.; et al. Taebaek Group (Cambrian-Ordovician) in the Seokgaejae section, Taebaeksan Basin: A refined lower Paleozoic stratigraphy in Korea. Geosci. J. 2004, 8, 125–152. [Google Scholar] [CrossRef]
- Kobayashi, T. Stratigraphy of the Chosen Group in Korea and south Manchuria and its relation to the Cambro-Ordovician formations of other areas. Section, B. The Chosen Group of north Korea and northeast China. J. Fac. Sci. 1966, 2, 209–311. [Google Scholar]
- Noh, J.H.; Oh, S.J. Hydrothermal alteration of the Pungchon limestone and the formation of high-Ca limestone. J. Geol. Soc. Korea. 2005, 41, 175–197. [Google Scholar]
- Kim, Y.H.; Kim, G.B.; Choi, S.G.; Kim, C.S. SWIR application for the identification of high-grade limestones from the Upper Pungchon formation. Econ. Environ. Geol. 2016, 49, 335–347. [Google Scholar] [CrossRef] [Green Version]
- Ryu, H.-S.; Kim, H.J.; Lee, J.Y.; Jang, J.W.; Park, S.W. Spatio-temporal variations of hydrochemical and microbial characteristics in karst water in Samcheok, South Korea. Water 2020, 12, 3407. [Google Scholar] [CrossRef]
- Cheong, C.H. Stratigraphy and paleontology of the Samcheog Coalfield, Gangwondo, Korea. J. Geol. Soc. Korea. 1969, 5, 13–55. [Google Scholar]
- Son, C.M.; Cheong, C.H. Sedimentary environment and geologic structure or Taebaegsan district. Seoul National Univ. Sci. Tech. Ser. (A). 1965, 15, 741–749. [Google Scholar]
- Park, S.I.; Lee, H.K.; Lee, S.H. Characteristics and distribution pattern of carbonate rock resources in Kangwon Area: The Gabsan Formation around the Mt. Gachang Area, Chungbuk, Korea. J. Geol. Soc. Korea 2000, 21, 437–448. [Google Scholar]
- Lee, J.Y.; Raza, M.; Kwon, K.D. Land use and land cover changes in the Haean Basin of Korea: Impacts on soil erosion. Episodes. 2019, 42, 17–32. [Google Scholar] [CrossRef]
- Lee, J.Y.; Hahn, J.S. Characterization of groundwater temperature obtained from the Korean national groundwater monitoring stations: Implications for heat pumps. J. Hydrolo. 2006, 329, 514–526. [Google Scholar] [CrossRef]
- Sasowsky, I.D.; Dalton, C.T. Measurement of pH for field studies in karst areas. J. Caves. Karst. Stud. 2005, 67, 127–132. [Google Scholar]
- Lang, Y.-C.; Liu, C.-Q.; Zhao, Z.-Q.; Li, S.-L.; Han, G.L. Geochemistry of surface and ground water in Giuyang, China: Water/rock interaction and pollution in a karst hydrological system. Appl. Geochem. 2006, 21, 887–903. [Google Scholar] [CrossRef]
- Sappa, G.; Ergul, S.; Ferranti, F. Water quality assessment of carbonate aquifers in southern Latium region, Central Italy: A case study for irrigation and drinking purposes. Appl. Water Sci. 2014, 4, 115–128. [Google Scholar] [CrossRef] [Green Version]
- Yun, S.W.; Jeon, W.H.; Lee, J.Y. Evaluation of hydrochemical characteristics of groundwater and stream water in a heavy agricultural region of the Haean basin, Korea. J. Geol. Soc. Korea. 2017, 53, 727–742. [Google Scholar] [CrossRef]
- Yun, S.W.; Lee, J.Y.; Lee, H.G. Variation of stream water quality and baseflow contribution from groundwater during rainfall event in the Haean basin. J. Geol. Soc. Korea. 2015, 51, 611–621. [Google Scholar] [CrossRef]
- Kim, H.; Jang, J.; Park, S.; Kim, C.S.; Ryu, H.S.; Lee, J.Y. Spatial variations in microbial compositions in a karst critical zone in Samcheok, Republic of Korea. Appl. Sci. 2020, 10, 4714. [Google Scholar] [CrossRef]
- Hwang, J.H.; Song, M.H.; Cho, H.L.; Woo, N.C. Influence of groundwater on the origin of Oseepchun in Dogye area, Korea. Econ. Environ. Geol. 2016, 49, 161–179, (In Korean with English abstract). [Google Scholar]
- Nwankwoala, H.O.; Amadi, A.N.; Oborie, E.; Ushie, F.A. Hydrochemical factors and correlation analysis in groundwater quality in Yenagoa, Bayelsa State, Nigeria. Appl. Ecol. Env. Sci. 2014, 2, 100–105. [Google Scholar] [CrossRef] [Green Version]
- Voudouris, K.; Panagopoulos, A.; Koumantakis, J. Multivariate statistical analysis in the assessment of hydrochemistry of the Northern Korinthia prefecture alluvial aquifer system (Peloponnese, Greece). Nat. Resour. Res. 2000, 9, 135–146. [Google Scholar] [CrossRef]
- Gaillardet, J.; Calmels, D.; Romero-Mujalli, G.; Zakharova, E.; Hartmann, J. Global climate control on carbonate weathering intensity. Chem. Geol. 2019, 527, 118762. [Google Scholar] [CrossRef]
Figure 1.
Geologic setting of the study area and sampling locations.

Figure 2.
Annual average air temperatures and boxplots of monthly precipitation for 20 years (2000–2019) in Samcheok.
Figure 2.
Annual average air temperatures and boxplots of monthly precipitation for 20 years (2000–2019) in Samcheok.

Figure 3.
Piper diagram of surface water in Samcheok (black: Nov. 2017, green: Dec. 2017, blue: Jan. 2018, red: Jul. 2019).
Figure 3.
Piper diagram of surface water in Samcheok (black: Nov. 2017, green: Dec. 2017, blue: Jan. 2018, red: Jul. 2019).

Figure 4.
Gibbs diagram of surface water samples in Samcheok: (a) relationship between total dissolved solids and Na+/(Ca2+ + Na+), and (b) relationship between total dissolved solids and Cl−/(Cl− + HCO3−).
Figure 4.
Gibbs diagram of surface water samples in Samcheok: (a) relationship between total dissolved solids and Na+/(Ca2+ + Na+), and (b) relationship between total dissolved solids and Cl−/(Cl− + HCO3−).

Figure 5.
Relationships between Ca2+, Ca2++Mg2+, and Ca2++HCO3− for the surface water in Samcheok: (a) relationship between Ca2+ and Mg2+; (b) relationship between Ca2+ and HCO3−.
Figure 5.
Relationships between Ca2+, Ca2++Mg2+, and Ca2++HCO3− for the surface water in Samcheok: (a) relationship between Ca2+ and Mg2+; (b) relationship between Ca2+ and HCO3−.

Figure 6.
Relationship between δ18O and δD values of the surface waters in Samcheok.

Figure 7.
Relationships between stable isotopes (δ18O and δD) and HCO3− for surface waters in Samcheok: (a) relationship between δD and HCO3−, and (b) relationship between δ18O and HCO3−.
Figure 7.
Relationships between stable isotopes (δ18O and δD) and HCO3− for surface waters in Samcheok: (a) relationship between δD and HCO3−, and (b) relationship between δ18O and HCO3−.


Table 1.
Statistics of field parameters and ionic composition of surface water sampled in November 2017, December 2017, January 2018, and July 2019.
Table 1.
Statistics of field parameters and ionic composition of surface water sampled in November 2017, December 2017, January 2018, and July 2019.
| Parameter | Hamaengbang Area | Sangwolsan Area | Kyogok Area | ||||||||||||
|---|---|---|---|---|---|---|---|---|---|---|---|---|---|---|---|
| n | Max. | Min. | Avg. | SD * | n | Max. | Min. | Avg. | SD * | n | Max. | Min. | Avg. | SD * | |
| Temp. (°C) | 45 | 27.8 | 2.1 | 12.3 | 6.3 | 24 | 28.3 | 0.6 | 10.5 | 9.7 | 10 | 29.8 | 17.4 | 20.9 | 3.8 |
| pH | 45 | 8.9 | 7.8 | 8.3 | 0.2 | 24 | 8.9 | 8.0 | 8.4 | 0.2 | 10 | 8.7 | 8.0 | 8.3 | 0.3 |
| EC (μS/cm) | 45 | 321 | 138 | 192 | 36.7 | 24 | 233 | 102 | 139 | 36.2 | 10 | 358 | 170 | 298 | 51.7 |
| DO (mg/L) | 45 | 11.2 | 4.9 | 7.6 | 1.4 | 24 | 10.6 | 5.3 | 7.4 | 1.3 | 10 | 8.0 | 5.1 | 6.4 | 1.0 |
| Eh (mV) | 45 | 530 | 229 | 435 | 47 | 24 | 453 | 286 | 384 | 51 | 10 | 498 | 311 | 426 | 50 |
| Turb. (NTU) | 46 | 74.2 | 0.8 | 15.1 | 23.4 | 24 | 5.1 | 0.5 | 2.6 | 1.3 | 10 | 892 | 6.7 | 169 | 300 |
| Ca2+ (mg/L) | 45 | 70.9 | 31.2 | 45.8 | 8.3 | 22 | 53.7 | 21.0 | 32.9 | 6.7 | 9 | 70.3 | 26.0 | 55.7 | 14.0 |
| Mg2+ (mg/L) | 45 | 6.1 | 2.5 | 3.8 | 0.6 | 22 | 5.9 | 1.9 | 3.9 | 0.8 | 9 | 6.0 | 3.9 | 4.9 | 0.7 |
| Na+ (mg/L) | 45 | 13.5 | 3.4 | 4.5 | 1.6 | 22 | 7.8 | 3.1 | 4.4 | 1.3 | 9 | 9.5 | 4.9 | 5.9 | 1.4 |
| K+ (mg/L) | 45 | 6.6 | 0.5 | 1.1 | 0.9 | 22 | 1.7 | 0.0 | 0.8 | 0.3 | 9 | 3.0 | 0.8 | 1.7 | 0.7 |
| HCO3− (mg/L) | 45 | 139 | 34.5 | 73.2 | 24.4 | 22 | 95.9 | 26.4 | 51.3 | 17.5 | 9 | 155 | 47.0 | 90.4 | 29.3 |
| SO42− (mg/L) | 45 | 14.1 | 3.6 | 6.3 | 1.6 | 22 | 13.2 | 4.3 | 8.3 | 2.8 | 9 | 12.5 | 6.2 | 8.5 | 1.9 |
| Cl− (mg/L) | 45 | 11.4 | 3.6 | 5.5 | 2.1 | 22 | 16.6 | 2.6 | 4.4 | 2.9 | 9 | 70.2 | 6.5 | 36.8 | 21.2 |
| NO3− (mg/L) | 45 | 21.6 | 4.7 | 7.4 | 2.8 | 22 | 11.6 | 4.9 | 7.3 | 1.9 | 9 | 9.7 | 5.5 | 7.6 | 1.5 |
| δ2H (‰) | 45 | −40.1 | −57.3 | −52.9 | 2.8 | 22 | −50.4 | −64.2 | −54.8 | 3.6 | 9 | −45.1 | −54.1 | −50.8 | 2.4 |
| δ13C (‰) | 45 | −8.9 | −14.3 | −11.7 | 1.1 | 22 | −8.5 | −13.0 | −10.7 | 1.7 | 9 | −9.4 | −14.2 | −11.5 | 1.3 |
| δ18O (‰) | 45 | −7.8 | −8.9 | −8.5 | 0.3 | 22 | −8.2 | −9.9 | −8.6 | 0.4 | 9 | −7.2 | −8.5 | −8.0 | 0.4 |
Temp.: temperature, EC: electrical conductivity, DO: dissolved oxygen, Turb.: turbidity, * SD: standard deviation.
Table 2.
Correlation analysis of surface water parameters in Samcheok. Values exceeding 0.6 are bolded.
Table 2.
Correlation analysis of surface water parameters in Samcheok. Values exceeding 0.6 are bolded.
| n = 79 | Temp. | pH | EC | DO | Eh | Turb. | Ca2+ | K+ | Mg2+ | Na+ | Cl− | NO3− | SO42− | HCO3− | δD | δ18O | δ13C |
|---|---|---|---|---|---|---|---|---|---|---|---|---|---|---|---|---|---|
| Temp. | – | 0.1 | 0.0 | −0.5 | −0.5 | 0.2 | 0.0 | −0.1 | −0.1 | −0.1 | −0.1 | 0.3 | −0.2 | 0.4 | −0.2 | 0.2 | −0.5 |
| pH | 0.1 | – | −0.3 | 0.2 | −0.3 | 0.0 | −0.2 | −0.4 | −0.3 | −0.3 | −0.3 | 0.0 | −0.4 | −0.1 | −0.2 | −0.1 | 0.4 |
| EC | 0.0 | −0.3 | – | 0.0 | −0.1 | 0.1 | 0.2 | 1.0 | 1.0 | 1.0 | 1.0 | 0.3 | 0.9 | 0.0 | 0.2 | 0.2 | 0.0 |
| DO | −0.5 | 0.2 | 0.0 | – | 0.3 | −0.1 | 0.1 | 0.0 | 0.0 | 0.0 | 0.0 | −0.1 | 0.0 | −0.2 | 0.2 | 0.0 | 0.5 |
| Eh | −0.5 | −0.3 | −0.1 | 0.3 | – | 0.0 | 0.0 | 0.0 | 0.0 | 0.0 | 0.0 | −0.3 | 0.0 | −0.2 | 0.2 | 0.0 | −0.1 |
| Turb. | 0.2 | 0.0 | 0.1 | −0.1 | 0.0 | – | 0.3 | 0.0 | 0.0 | 0.0 | 0.0 | 0.6 | 0.0 | 0.2 | 0.1 | 0.3 | −0.2 |
| Ca2+ | 0.0 | −0.2 | 0.2 | 0.1 | 0.0 | 0.3 | – | 0.1 | 0.1 | 0.0 | 0.0 | 0.5 | 0.0 | 0.6 | 0.2 | 0.3 | −0.1 |
| K+ | −0.1 | −0.4 | 1.0 | 0.0 | 0.0 | 0.0 | 0.1 | – | 1.0 | 1.0 | 1.0 | 0.1 | 1.0 | −0.1 | 0.2 | 0.2 | 0.0 |
| Mg2+ | −0.1 | −0.3 | 1.0 | 0.0 | 0.0 | 0.0 | 0.1 | 1.0 | – | 1.0 | 1.0 | 0.2 | 1.0 | −0.1 | 0.1 | 0.1 | 0.1 |
| Na+ | −0.1 | −0.3 | 1.0 | 0.0 | 0.0 | 0.0 | 0.0 | 1.0 | 1.0 | – | 1.0 | 0.1 | 1.0 | −0.1 | 0.1 | 0.1 | 0.1 |
| Cl− | −0.1 | −0.3 | 1.0 | 0.0 | 0.0 | 0.0 | 0.0 | 1.0 | 1.0 | 1.0 | – | 0.1 | 1.0 | −0.1 | 0.1 | 0.1 | 0.1 |
| NO3− | 0.3 | 0.0 | 0.3 | −0.1 | −0.3 | 0.6 | 0.5 | 0.1 | 0.2 | 0.1 | 0.1 | – | 0.1 | 0.3 | 0.1 | 0.2 | 0.1 |
| SO42− | −0.2 | −0.4 | 0.9 | 0.0 | 0.0 | 0.0 | 0.0 | 1.0 | 1.0 | 1.0 | 1.0 | 0.1 | – | −0.1 | 0.1 | 0.2 | −0.1 |
| HCO3− | 0.4 | −0.1 | 0.0 | −0.2 | −0.3 | 0.2 | 0.6 | −0.1 | −0.1 | −0.1 | −0.1 | 0.3 | −0.1 | – | −0.3 | −0.1 | −0.4 |
| δD | −0.2 | −0.2 | 0.2 | 0.2 | 0.2 | 0.1 | 0.2 | 0.2 | 0.1 | 0.1 | 0.1 | 0.1 | 0.1 | −0.3 | - | 0.8 | 0.1 |
| δ 18O | 0.2 | −0.1 | 0.2 | 0.0 | 0.0 | 0.3 | 0.3 | 0.2 | 0.1 | 0.1 | 0.1 | 0.2 | 0.2 | −0.1 | 0.8 | - | 0.0 |
| δ13C | −0.5 | 0.4 | 0.0 | 0.5 | −0.1 | −0.2 | −0.1 | 0.0 | 0.1 | 0.1 | 0.1 | 0.1 | −0.1 | −0.4 | 0.1 | 0.0 | - |
Publisher’s Note: MDPI stays neutral with regard to jurisdictional claims in published maps and institutional affiliations. |
© 2021 by the authors. Licensee MDPI, Basel, Switzerland. This article is an open access article distributed under the terms and conditions of the Creative Commons Attribution (CC BY) license (http://creativecommons.org/licenses/by/4.0/).
Share and Cite
MDPI and ACS Style
Jang, J.; Lee, J.-Y.; Kim, H. Characteristics of Hydrochemistry and Stable Isotopes in a Karst Region in Samcheok, Republic of Korea. Water 2021, 13, 213. https://doi.org/10.3390/w13020213
AMA Style
Jang J, Lee J-Y, Kim H. Characteristics of Hydrochemistry and Stable Isotopes in a Karst Region in Samcheok, Republic of Korea. Water. 2021; 13(2):213. https://doi.org/10.3390/w13020213
Chicago/Turabian StyleJang, Jiwook, Jin-Yong Lee, and Heejung Kim. 2021. "Characteristics of Hydrochemistry and Stable Isotopes in a Karst Region in Samcheok, Republic of Korea" Water 13, no. 2: 213. https://doi.org/10.3390/w13020213
Note that from the first issue of 2016, this journal uses article numbers instead of page numbers. See further details here.