Impact of Suspended Solids and Organic Matter on Chlorine and UV Disinfection Efficiency of Greywater


1
Faculty of Civil & Environmental Engineering, Technion—Israel Institute of Technology, Technion, Haifa 3200, Israel
2
Zuckerberg Institute for Water Research, Blaustein Institutes for Desert Research, Sede Boqer Campus, Ben-Gurion University of the Negev, Midreshet Ben-Gurion 84990, Israel
*
Author to whom correspondence should be addressed.
Water 2021, 13(2), 214; https://doi.org/10.3390/w13020214
Submission received: 4 December 2020
/
Revised: 12 January 2021
/
Accepted: 13 January 2021
/
Published: 18 January 2021
(This article belongs to the Special Issue The Use of Greywater and Wastewater for Irrigation)
Abstract
:Reusing greywater (GW) can lower domestic water consumption. However, the GW must be treated and disinfected for securing user health. This research studied at the laboratory scale, and in flow-through setups, which are generally used in full-scale GW treatment the disinfection efficiency of the two commonly used technologies (a) chlorination and (b) low-pressure UV irradiation. The disinfection methods were studied under a commonly found range of total suspended solids (TSS; 3.9–233 mg/L) and 5-d biochemical oxygen demand (BOD5) concentrations (0–107 mg/L) as a representative/proxy of bioavailable organic matter. The negative effect of TSS began even at low concentrations (<20 mg/L) and increased consistently with increasing TSS concentrations across all the concentrations tested. On the other hand, the negative effect of BOD5 on FC inactivation was observed only when its concentration was higher than 50 mg/L. Multiple linear regression models were developed following the laboratory results, establishing a correlation between FC inactivation by either chlorination or UV irradiation and initial FC, TSS, and BOD5 concentrations. The models were validated against the results from the flow-through reactors and explained the majority of the variability in the measured FC inactivation. Conversion factors between the laboratory scales and the flow-through reactor experiments were established. These enable the prediction of the required residual chlorine concentration or the UV dose needed for an on-site flow-through reactor. This approach is valuable from both operational and research perspectives.
1. Introduction
Greywater (GW; domestic wastewater excluding toilet water) reuse for non-potable purposes, such as garden irrigation, can decrease domestic water demand and, thus, mitigate the pressure on depleted water resources while reducing household water costs [1]. However, untreated GW contains pathogens and other pollutants and may pose environmental and health risks if used without treatment and disinfection [2,3]. Chlorination and low-pressure UV irradiation are probably the most widely used disinfection methods in small, on-site GW systems [4,5,6].
Chlorine is dependably effective against a wide spectrum of pathogenic microorganisms and is considered to be a cost-effective disinfectant [3,7]. In addition, residual chlorine remains in the effluent after application, ensuring continued disinfection throughout the conveyance system, reducing potential regrowth [8,9]. Furthermore, chlorine dosing is flexible and can be controlled by simple, low-cost devices. Nonetheless, chlorine is toxic and corrosive; thus, its storage, shipping, handling, and application must be managed responsibly.
UV irradiation prevents replication of microorganisms through a photochemical reactions that damage their nucleic acids in either DNA or RNA [10]. The main reasons for the use of low-pressure UV (254 nm) irradiation in small on-site systems are: (1) it does not require chemical additives (making transport, storage, and dosing irrelevant), (2) it has been found to be effective on numerous pathogens including viruses and protozoans which were found to be chlorine-resistant, (3) it is cost-effective on both initial capital investment and operational levels, and (4) both the equipment operation and maintenance are simple and safe [4].
It should be noted that varying disinfection efficiencies have been reported in full-scale installations [11], and some studies have demonstrated that sub-standard water quality can reduce the efficiency of both chlorine and UV disinfection. Specifically, the presence of particulate matter and organic substances in the water may negatively impact these disinfection methods’ performances [4,12]. In the case of chlorination, this negative effect is expressed by increasing the chlorine demand as dissolved and suspended organic matter is oxidized by chlorine. Thus, the overall disinfection efficiency decreases. Microorganisms attach to particles present in water, thus reducing the chance for efficient contact between the microorganism and the chlorine, compared to non-attached bacteria [12,13]. Even more, the presence of organic matter may further reduce chlorine disinfection efficiency by stabilizing microbial cell membranes [14]. Lastly, the presence of organic matter may lead to the formation of unwanted disinfection by-products (including known or suspected carcinogens), thereby not only impeding the disinfection process [15] but also posing a health hazard. Winward et al. [12] investigated the effects of organic and particulate matter on GW chlorine disinfection in a batch system, and claimed that an increase in the organic matter enhanced the chlorine demand but did not affect total coliforms’ resistance to chlorine. However, these authors recommended removing organic matter prior to chlorination in order to reduce the chlorine demand and the potential for microbial regrowth.
In the case of UV irradiation, particles interfere with the exposure of the target microorganisms to the irradiation [15,16,17], either by shielding them, or by absorbing or scattering the light, thus reducing the UV dose received by the microorganisms and, consequently, the method’s efficiency. The presence of particulate matter and organics in GW has been noted in many studies, yet only a few discussed their adverse impact on UV disinfection efficiency. For example, the authors of [4] studied disinfection of artificial GW, proposed limits of 60 mg/L of suspended solids and a turbidity of 125 NTU, beyond which GW cannot practically be disinfected to achieve a 4-log reduction of fecal coliforms (FC), regardless of UV reactor dimensions. Ref. [18] recommended removing particles through filtration to obtain a turbidity level of 2 NTU (Nephelometric Turbidity Units), to increase UV disinfection efficiency. Other studies have focused on the particle sizes that block microorganisms from UV light [12], and the specific particle types associated with certain bacteria in treated GW that cause bacterial shielding from UV disinfection [19].
Interestingly, no systematic information exists regarding the combined impact of suspended solids and organic matter (measured as 5-d biochemical oxygen demand (BOD5)), on low-pressure UV disinfection and chlorine disinfection in both batch and continuous-flow disinfection units. This study aimed to test the efficiency of both disinfection methods on GW under a range of total suspended solids (TSS) and BOD5 concentrations. Experiments were performed in controlled batch laboratory setups and in flow-through reactors. Moreover, the study’s objectives included the development of regression models to predict the impact of TSS and BOD5 on chlorine and UV disinfection efficiency in both setups.
2. Materials and Methods
The research was performed in two stages. Initially, treated GW samples, varying in their TSS and BOD5 concentrations, were disinfected in a batch setup by either a hypochlorite solution or UV radiation using a collimated beam. The results obtained from this stage were used to develop two multiple linear regression models (one for chlorination and the other for UV irradiation). In the second stage, treated GW, from on-site treatment systems (outlined underneath), was disinfected in a flow-through disinfection unit using one of the two methods: chlorine tablets or commercial low-pressure UV. The models’ applicability and verification were studied, and then compared with the results of the second stage.
2.1. GW Treatment System
Eleven single-family full-scale recirculating vertical flow constructed wetland (RVFCW) systems were used for treating domestic GW (Figure S1). The RVFCW system comprised two 500-L plastic containers (1.0 m × 1.0 m × 0.5 m) placed on top of each other. The top container that had a perforated bottom held a planted three-layered bed, while the lower container functioned as a reservoir. The bed consisted of a 10-cm lower layer of limestone pebbles, with a 35-cm middle layer of tuff gravel, and a 5-cm upper layer of woodchips. GW was pumped from a 200-L settling-equalization tank from which it was conveyed to the top of the bed. From there, it trickled through the bed layers (unsaturated flow) and into the reservoir. GW was recirculated from the reservoir to the upper bed at a rate of about 300 L/h for 8 h, after which it was filtered through a 130-μm filter and then reused for garden irrigation. Additional details about the system can be found in [20,21].
2.2. Batch Experiment
Treated domestic GW samples (1 L) from the 11 RVFCW were collected at least four times along the study and brought to the laboratory shortly after collection in a cooler. The quality of the pre-disinfected treated GW was examined for the following parameters: TSS by the gravimetric method, BOD5 using standard 300-mL bottles, % irradiation transmission at 254 nm by a spectrophotometer (Genesys 10, Thermo), turbidity using a HACH 2100P Turbidimeter, and FC by membrane-filtration methods using mTEC agar (Lesher, Michigan USA, Acumedia). All analyses followed standard procedures [22].
Treated GW samples were examined either as is or after they were subjected to concentration increases in either TSS (final TSS concentrations ranging from 1–130 mg/L) or organic matter (measured as BOD5 with concentrations ranging from 3–100 mg/L) or a combination of both suspended particles and organic matter concentrations at different ratios. Increasing the TSS was conducted by adding different amounts of powdered dried suspended solids to the treated GW. The suspended solids were prepared by concentrating raw GW (centrifugation at 6000 rpm for 5 min) and drying the pellet at 60 °C for 48 h. Organic matter concentration was increased by introduction of different quantities of 0.2 μm- filtered raw GW with known BOD5 concentrations to the treated GW. The required components were stirred in a beaker for 15 min to produce a uniform mixture. Additionally, FC were introduced by adding < 0.5 mL/L GW sample of kitchen effluent to ensure FC concentrations of 104 to 105 CFU/100 mL. Overall, 432 combinations were tested.
Subsamples were analyzed before and after disinfection, when disinfection efficiency was determined by calculating the log inactivation of FC.
2.2.1. Chlorination Experiment
The efficient application of a disinfection agent should take into consideration the required dose, which can be achieved by varying the chlorine concentration and disinfection contact time. The required dose varies based on chlorine demand (wastewater characteristics) and residual chlorine requirements. According to [23] the free residual chlorine concentration should be ≥0.5 mg/L after at least 30 min contact time at pH < 8.0. Subsamples were disinfected in a batch mode. Initially, the chlorine demand of the subsamples was determined. For this, aliquots of 25 mL were exposed to four different chlorine doses of 0.5, 1, 3, and 6 mg/L. Samples were gently stirred and after 1 h, the total and free residual chlorine levels were determined by the DPD method [22].
2.2.2. Collimated Beam Setup
A quasi-parallel beam bench-scale UV apparatus (Trojan Technologies Inc., Ontario, Canada) was used to test the efficiency of UV disinfection (Figure S2). The system consisted of an 11-W low-pressure mercury vapor germicidal UV lamp, emitting monochromatic UV radiation at 254 nm directly over an inner 25-cm-long non-reflective collimated beam with a diameter of 40 mm. An ILT 1700 radiometer (International Light, Peabody, Massachusetts, USA) with a detector sensitive at 254 nm (IL photonic SED240) was used to measure the intensity of the incident UV light. Samples (25 mL aliquots) were placed under the collimation tube in a 50 × 35 mm crystallization dish and mixed with stirring bar (~110 rpm) allowing a uniform UV dose application to the entire sample.
Control over the UV dose was conducted by a shutter that allowed changing the exposure time of the stirred sample. Samples were exposed to three UV irradiation doses: 7.5, 15, and 30 mJ/cm2. Exposure times for each UV dose depended on several factors, including: incident intensity, reflection, petri factors, divergence, and water factors. The methods used for determining these factors are described in [24]. The divergence and reflection factors were constant in all experiments, and their values were 0.960 and 0.975, respectively. The petri factor was calculated every week and averaged 0.88 ± 0.05. The water factor varied from 0.40 to 0.89, and the incident intensity measured at the water surface varied from 0.30 to 0.32 mW/cm2.
2.3. Flow-Through Setups
Treated GW samples (10 L) were taken from the on-site full-scale single-family RVFCW (Section 2.1 above), immediately transported to the laboratory, and served as inflow to the continuous-flow disinfection units. All samples were analyzed for TSS, BOD5, % irradiation transmission at 254 nm, turbidity, and FC as described above. After disinfection, samples were analyzed again for FC.
2.3.1. Flow-Through Chlorination Chamber
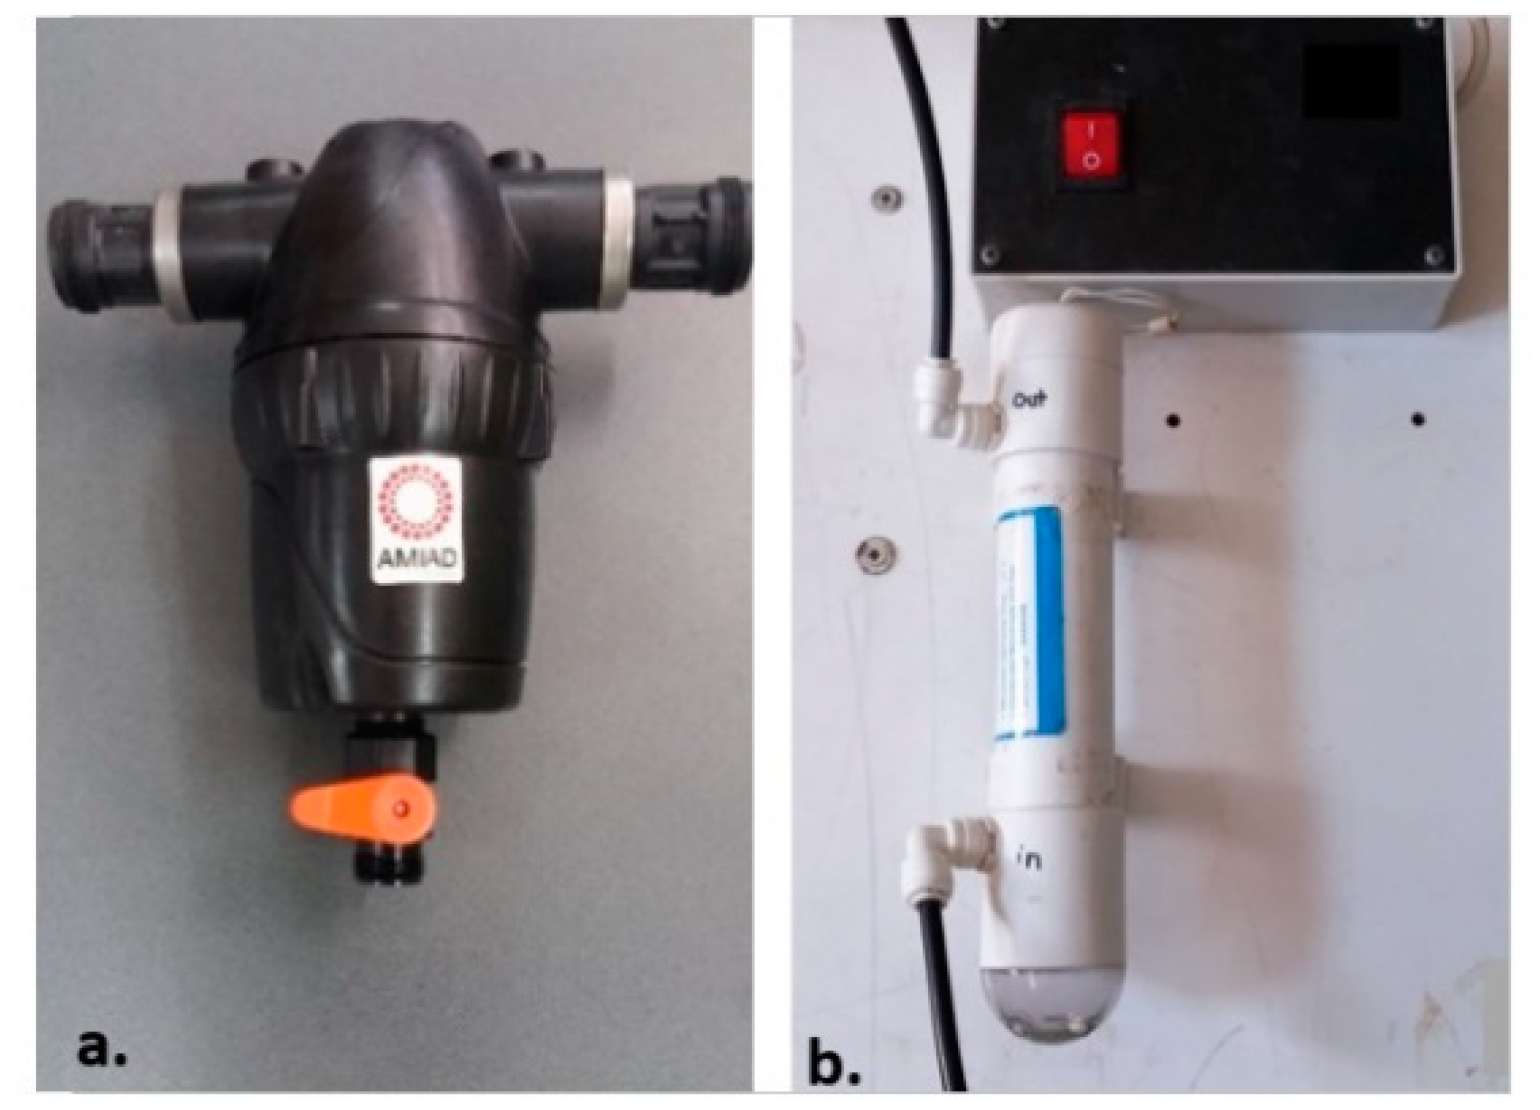
Chlorination was performed by discharging the treated GW (at a predetermined flow rate) via a 500-mL chamber containing a slow release HTH tablet (High Test Hypochlorite; 70% available chlorine, HYDRO-LINE, Silinierby, Finland). The chamber was a 500-mL Amiad filter housing without the filter (Model. BSP 1″, Amiad Ltd., Amiad, Isael; Figure 1a). A single chlorine tablet was placed in the flow-through chamber and was designed to dissolve slowly as the water flows through the chamber, according to the determined contact time. The chamber was connected at both ends to tubes; the input tube was connected to a submerged aquarium pump (Atman, model AT 102, Guangdong, China) that regulated the input flow at 8 L/min, mimicking typical rates in regular GW reuse garden systems. In other words, each sample of treated GW was exposed to the same contact time, although the quality of the treated GW was quite different, and, thus, there could be large variability in the required chlorine dose. Chlorinated samples were collected from the outlet tube.
2.3.2. Flow-Through UV Reactor
A low-pressure continuous flow UV reactor (UV6A, WaterTec Inc., Pan- Chiao Taipei, Taiwan) with a startup time from turn-on to maximum intensity of 100 s was used to irradiate samples (Figure 1b). The reactor (43 mL in volume) contained a low-pressure 4 W mercury lamp and was 1.6 cm in diameter and 13.5 cm in length. More details about the UV reactor can be found in [25]. The lamp was turned on at least 120 s after which treated GW samples were pumped through the reactor using a peristaltic pump (Masterflex, Cole-Parmer Instrument Co., Chicago, IL, USA) at a flow rate of 24 L/h. The iodide–iodate chemical actinometry (for details see [25]) was used to determine the actual average UV dose in the reactor which was found to be 44 mJ/cm2, with a calculated lamp intensity of 2.8 mW/cm2 and a mean residence time of 14 s.
2.4. Multiple Linear Regression (MLR) Models
The results of the batch experiments were used to develop MLR models. The models are intended to predict the log inactivation of FC based on water quality parameters and applied disinfectant dose (chlorine or UV irradiation). The water quality parameters chosen for the model (TSS, BOD5 and log FC concentrations in the GW prior to disinfection) were expected to significantly affect the model prediction and the coefficient of determination (R2). The developed models were validated against the results from the on-site greywater samples that were obtained from the flow-through reactor experiments. Finally, the models were used to propose a conversion factor between the chlorination or UV collimated beam batch laboratory setups and the experimental continuous-flow reactors results.
3. Results and Discussion
3.1. Batch Experiments
Treated GW samples, containing different BOD5 and TSS concentrations, were disinfected by chlorine or UV irradiation. In order to distinguish between the effect of each parameter (TSS or dissolved BOD5) on FC reduction, the results of the batch disinfection experiments (chlorination or UV irradiation) were divided into two categories: (1) changing the TSS concentration while keeping the BOD5 concentration below 10 mg/L, and (2) changing the BOD5 concentration while keeping the TSS concentration below 10 mg/L. These thresholds were chosen in accordance with the Israeli government’s regulation for unlimited treated wastewater reuse in irrigation [26]. It should be noted that the range of TSS and BOD5 concentrations that were used in this study represent concentrations that are found in GW [27].
3.1.1. Chlorination
As expected, the presence of TSS and organic matter reduced the chlorination efficiency of removing FC and was more pronounced for the lower initial chlorine concentrations used, such as 0.5 and 1 mg/L.
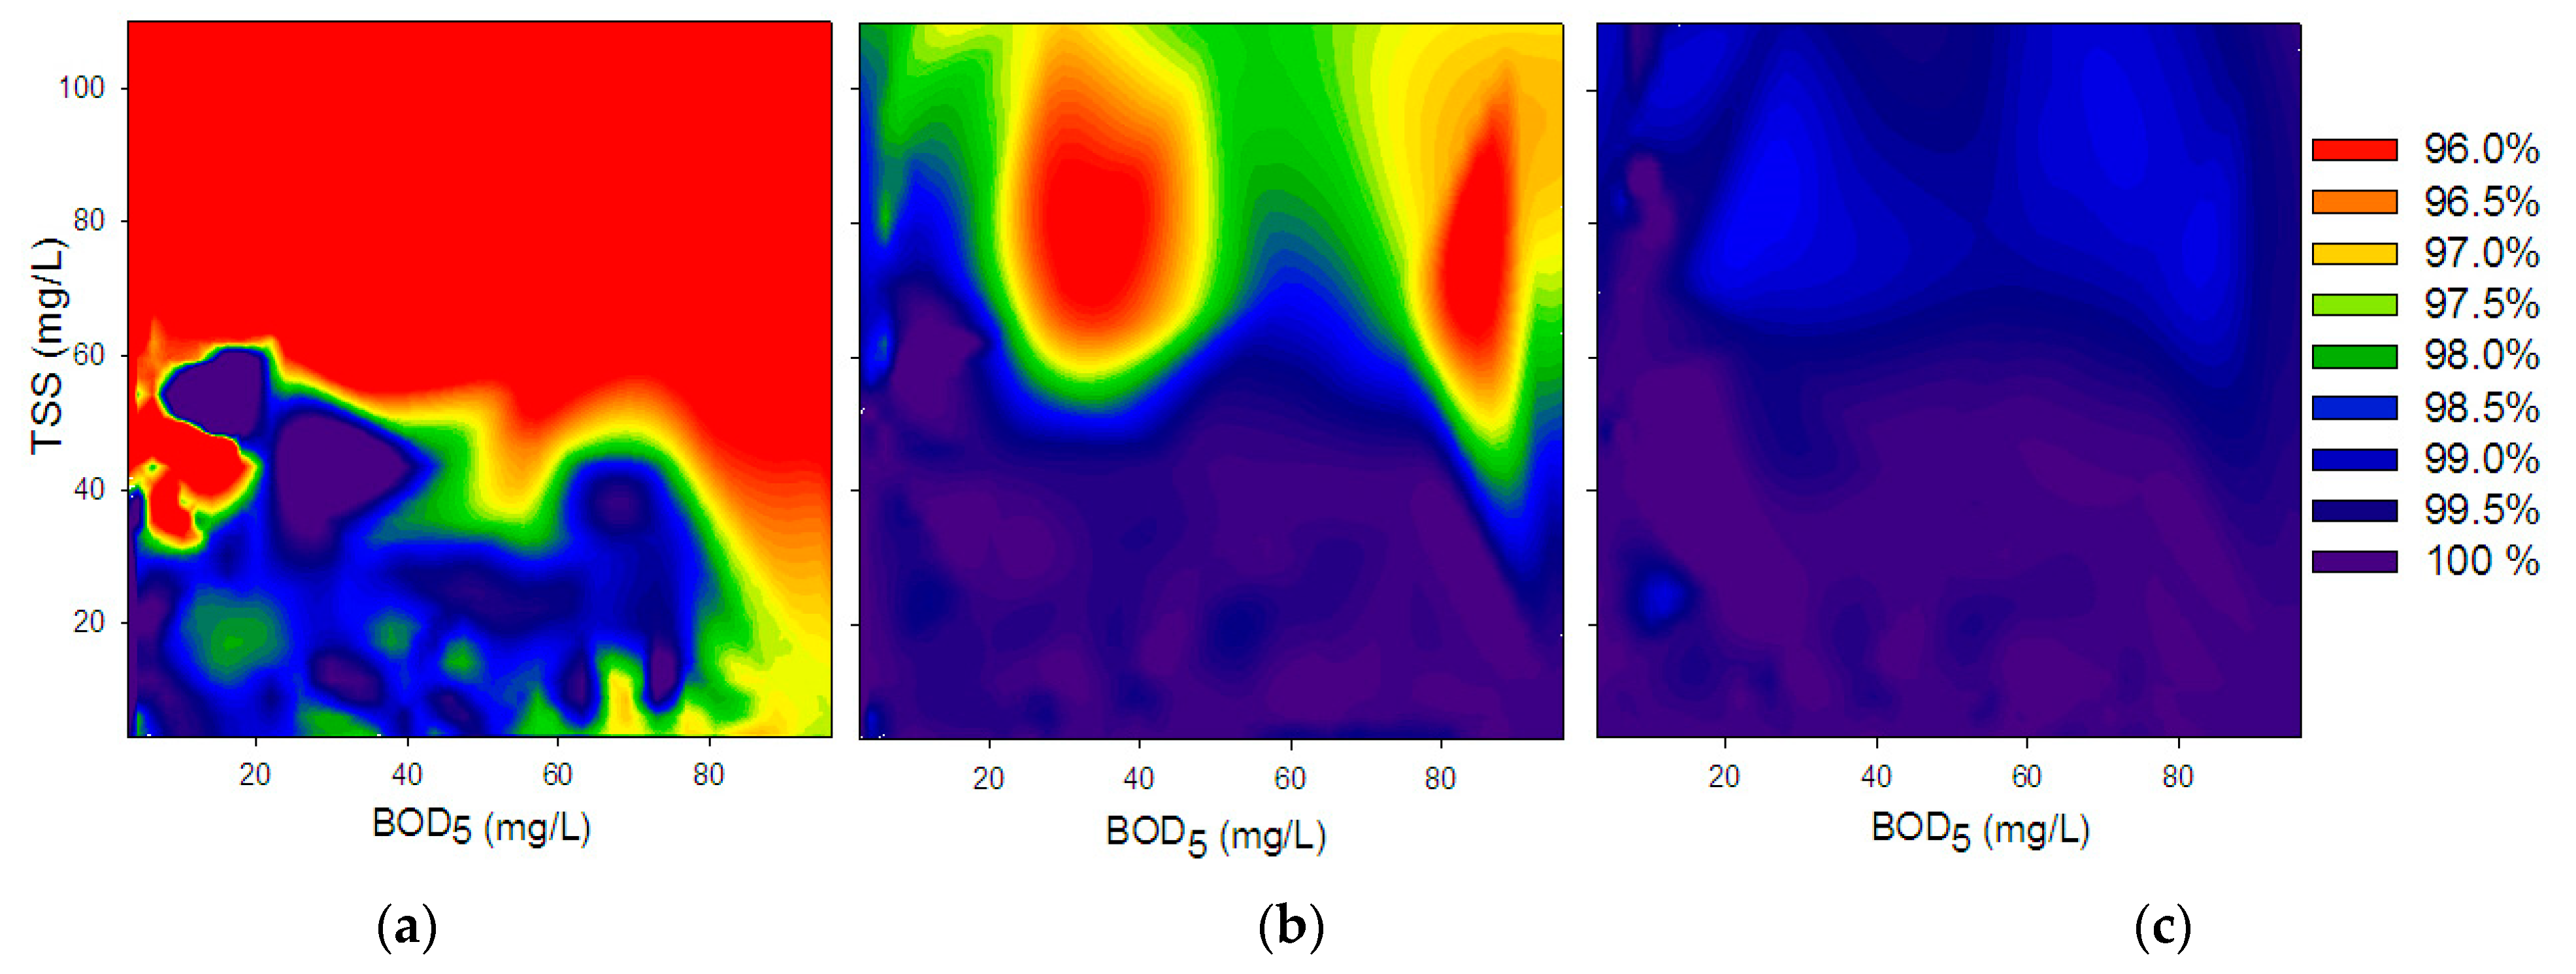
The reduction in chlorination efficiency was usually more pronounced when the TSS concentration was increased, rather than when BOD5 concentrations were higher (Figure 2). Moreover, the negative effect of TSS began even at low concentrations (<20 mg/L) and increased consistently with increasing TSS concentrations across all the concentrations tested. On the other hand, the negative effect of BOD5 on FC inactivation was observed only when its concentration was higher than 50 mg/L. These results are consistent with previous findings [12,13] that suggested that coliforms in GW were associated with particles and were sheltered by them; thus, they were resistant to disinfection, whereas organic matter affected chlorine demand (and thus residual chlorine concentration) but not bacterial resistance.
3.1.2. Collimated Beam
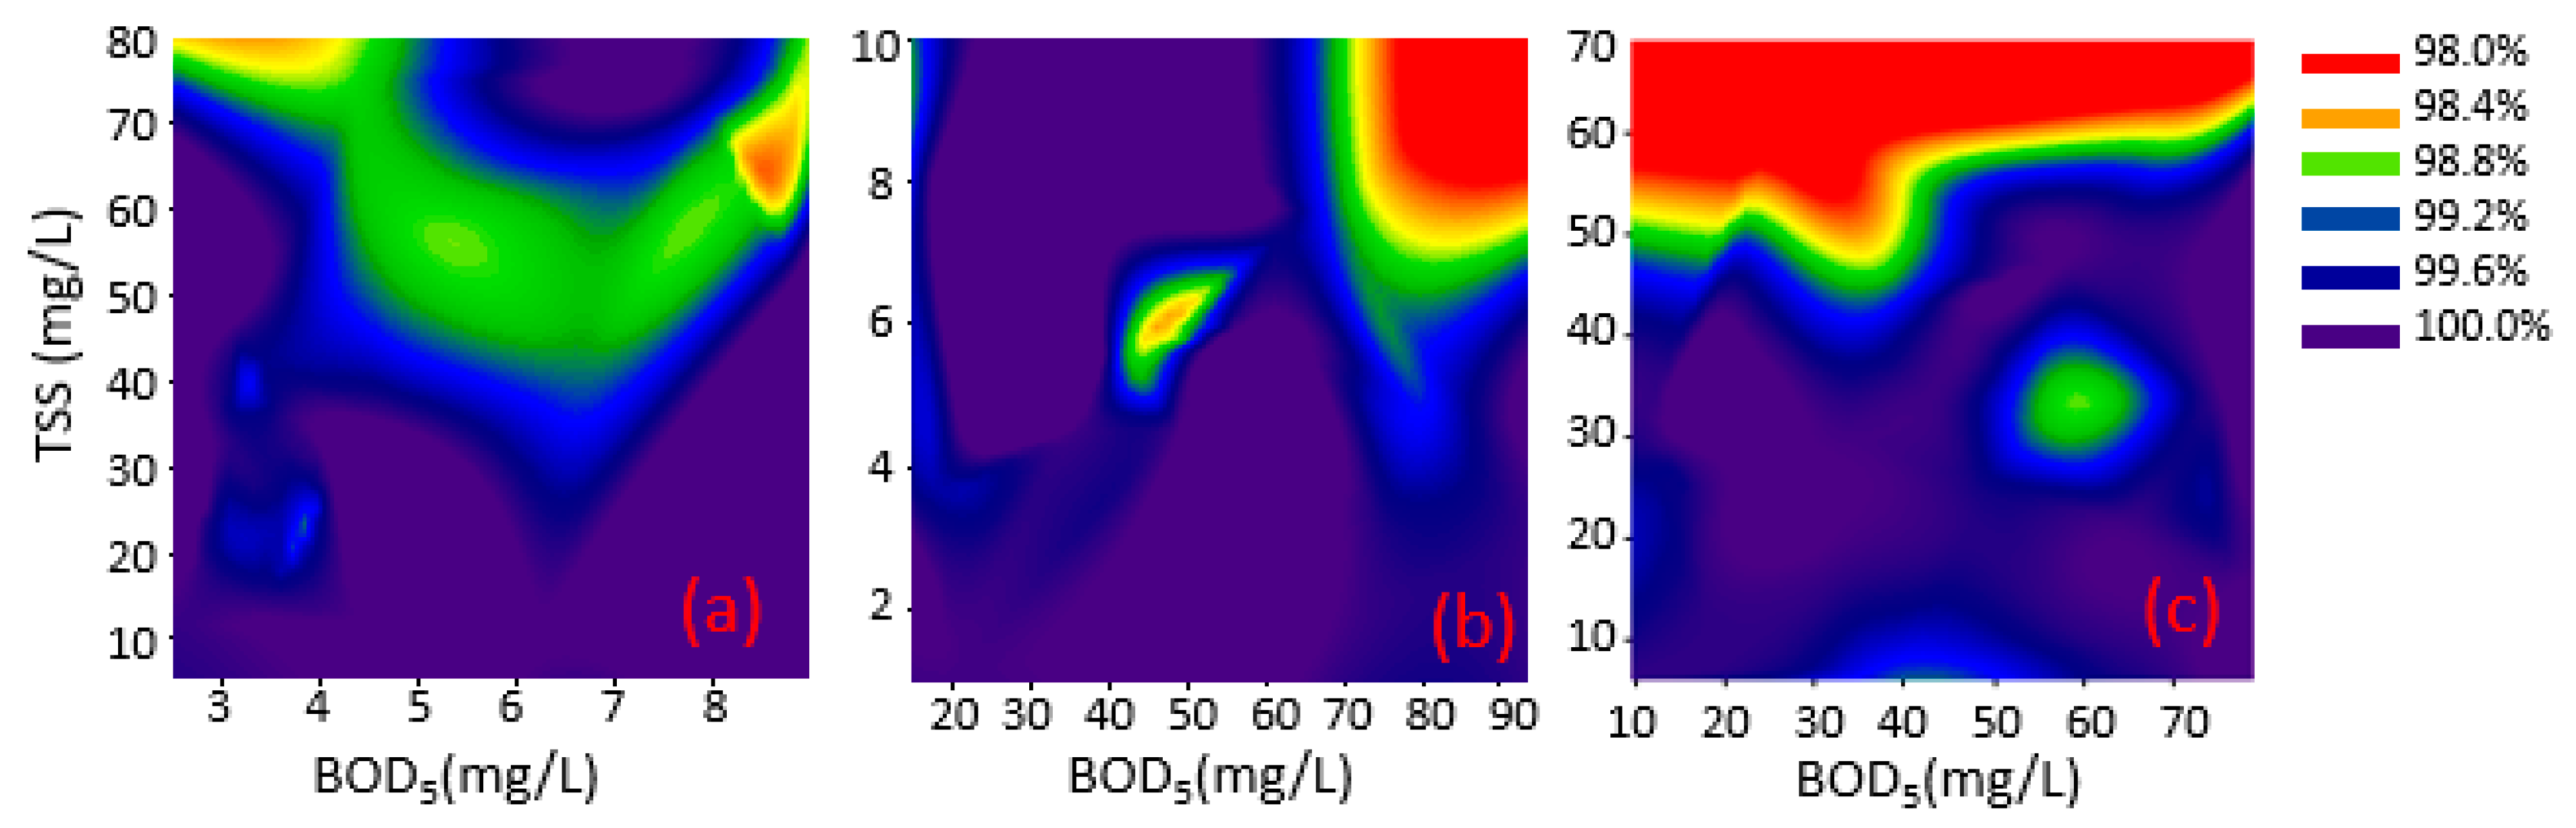
The UV disinfection efficiency of FC increased as the UV dose increased but was negatively affected by the presence of TSS and BOD5 (Figure 3). This was anticipated given that these constituents are known to absorb and/or scatter light, thereby reducing the UV dose absorbed by the bacteria [16,28,29,30]. These results are in line with [13] who recommended filtration prior to UV disinfection, to remove particles, for more efficient disinfection.
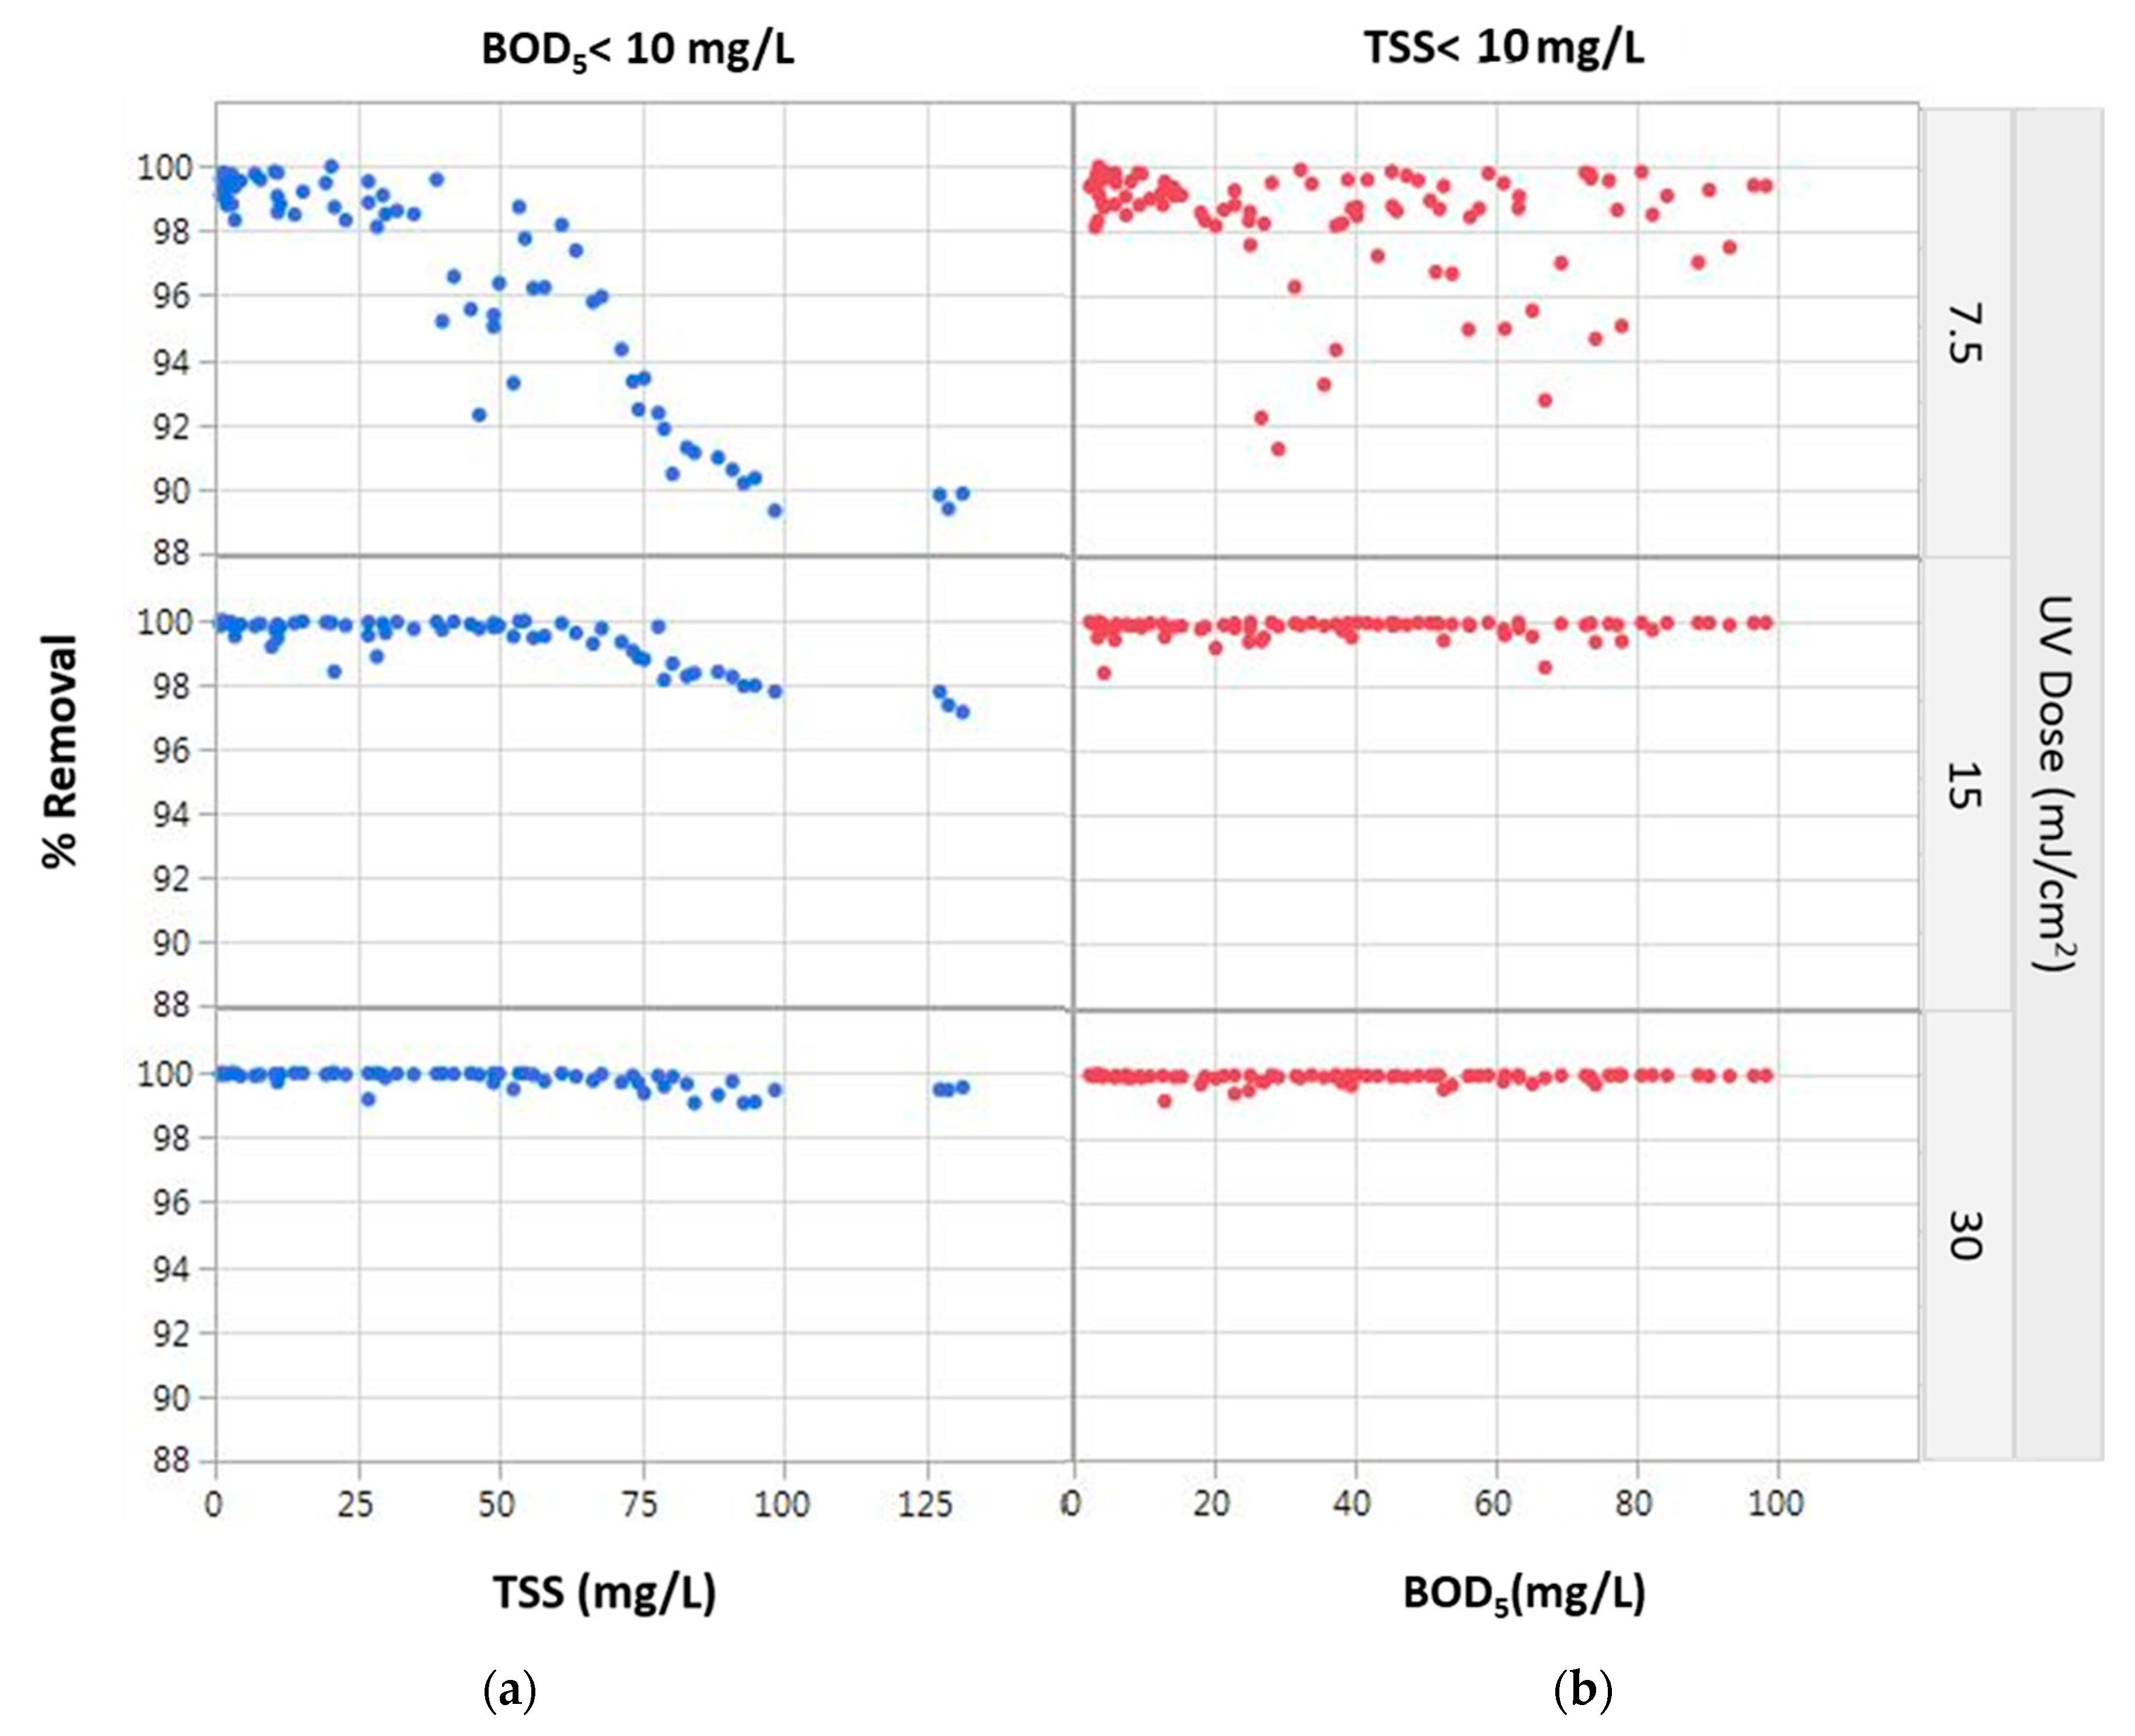
Increasing the TSS concentration reduced the UV disinfection efficiency more than increasing the BOD5 concentration (Figure 4). The reduction in UV FC inactivation efficiency was more pronounced at the lower UV doses (7.5 and 15 mJ/cm2). At those of 7.5 mJ/cm2, the threshold for reduction of FC inactivation efficiency was 50 mg/L TSS, reaching ~1 log reduction in the inactivation efficiency when the TSS concentration was ~100 mg/L. At UV dose of 15 mJ/cm2 the effect of high TSS on FC removal was lower, and at UV dose of 30 mJ/cm2 was hardly observed. These results accord with previous findings by [4] who stated that a 4-log reduction of FC can be achieved by low-pressure UV irradiation when the TSS concentration is kept below 60 mg/L. In contrast, at the highest examined dose of 30 mJ/cm2, nearly 100% FC inactivation was achieved for the entire range of TSS and BOD5 concentrations tested.
BOD5 (dissolved) exhibited a different trend than TSS, with FC inactivation barely changing when the UV dose increased from 15 to 30 mJ/cm2. Almost 100% FC inactivation was achieved for the entire range of BOD5 concentrations tested (while keeping TSS < 10 mg/L) for UV doses of 15 mJ/ cm2 and higher. This indicates that TSS influence UV disinfection efficiency more than dissolved organic substances. These findings were demonstrated previously by [31] who suggested that adjusting UV absorption through the composition of organic extracellular polymeric substances does not have a significant effect on UV disinfection. Furthermore, Ref. [30] compared the levels of UV absorption of various constituents and determined that wastewater and surface water organic matter exhibit lower UV absorption than suspended solids.
3.2. Multiple Linear Regression (MLR) Model
MLR models were developed to describe the relationship between log FC inactivation and TSS, BOD5, log FC concentration of the treated GW (before disinfection), and either the measured total residual chlorine (Equation (1)) or the applied UV dose (Equation (2)).
where FCinactivation is in log(cfu/100 mL); BOD5, TSS and residual chlorine is in mg/L; log FC raw is in log(cfu/100 mL); UV dose in mJ/cm2 and β1–β8 are coefficients estimating the explanatory variables (Table 1).
FCinactivation = β1·[BOD5] + β2·[TSS]+ β3·[log FC raw]+ β4·[residual chlorine]
FCinactivation = β5·[BOD5]+ β6·[TSS]+ β7·[log FC raw]+ β8·[UV dose]
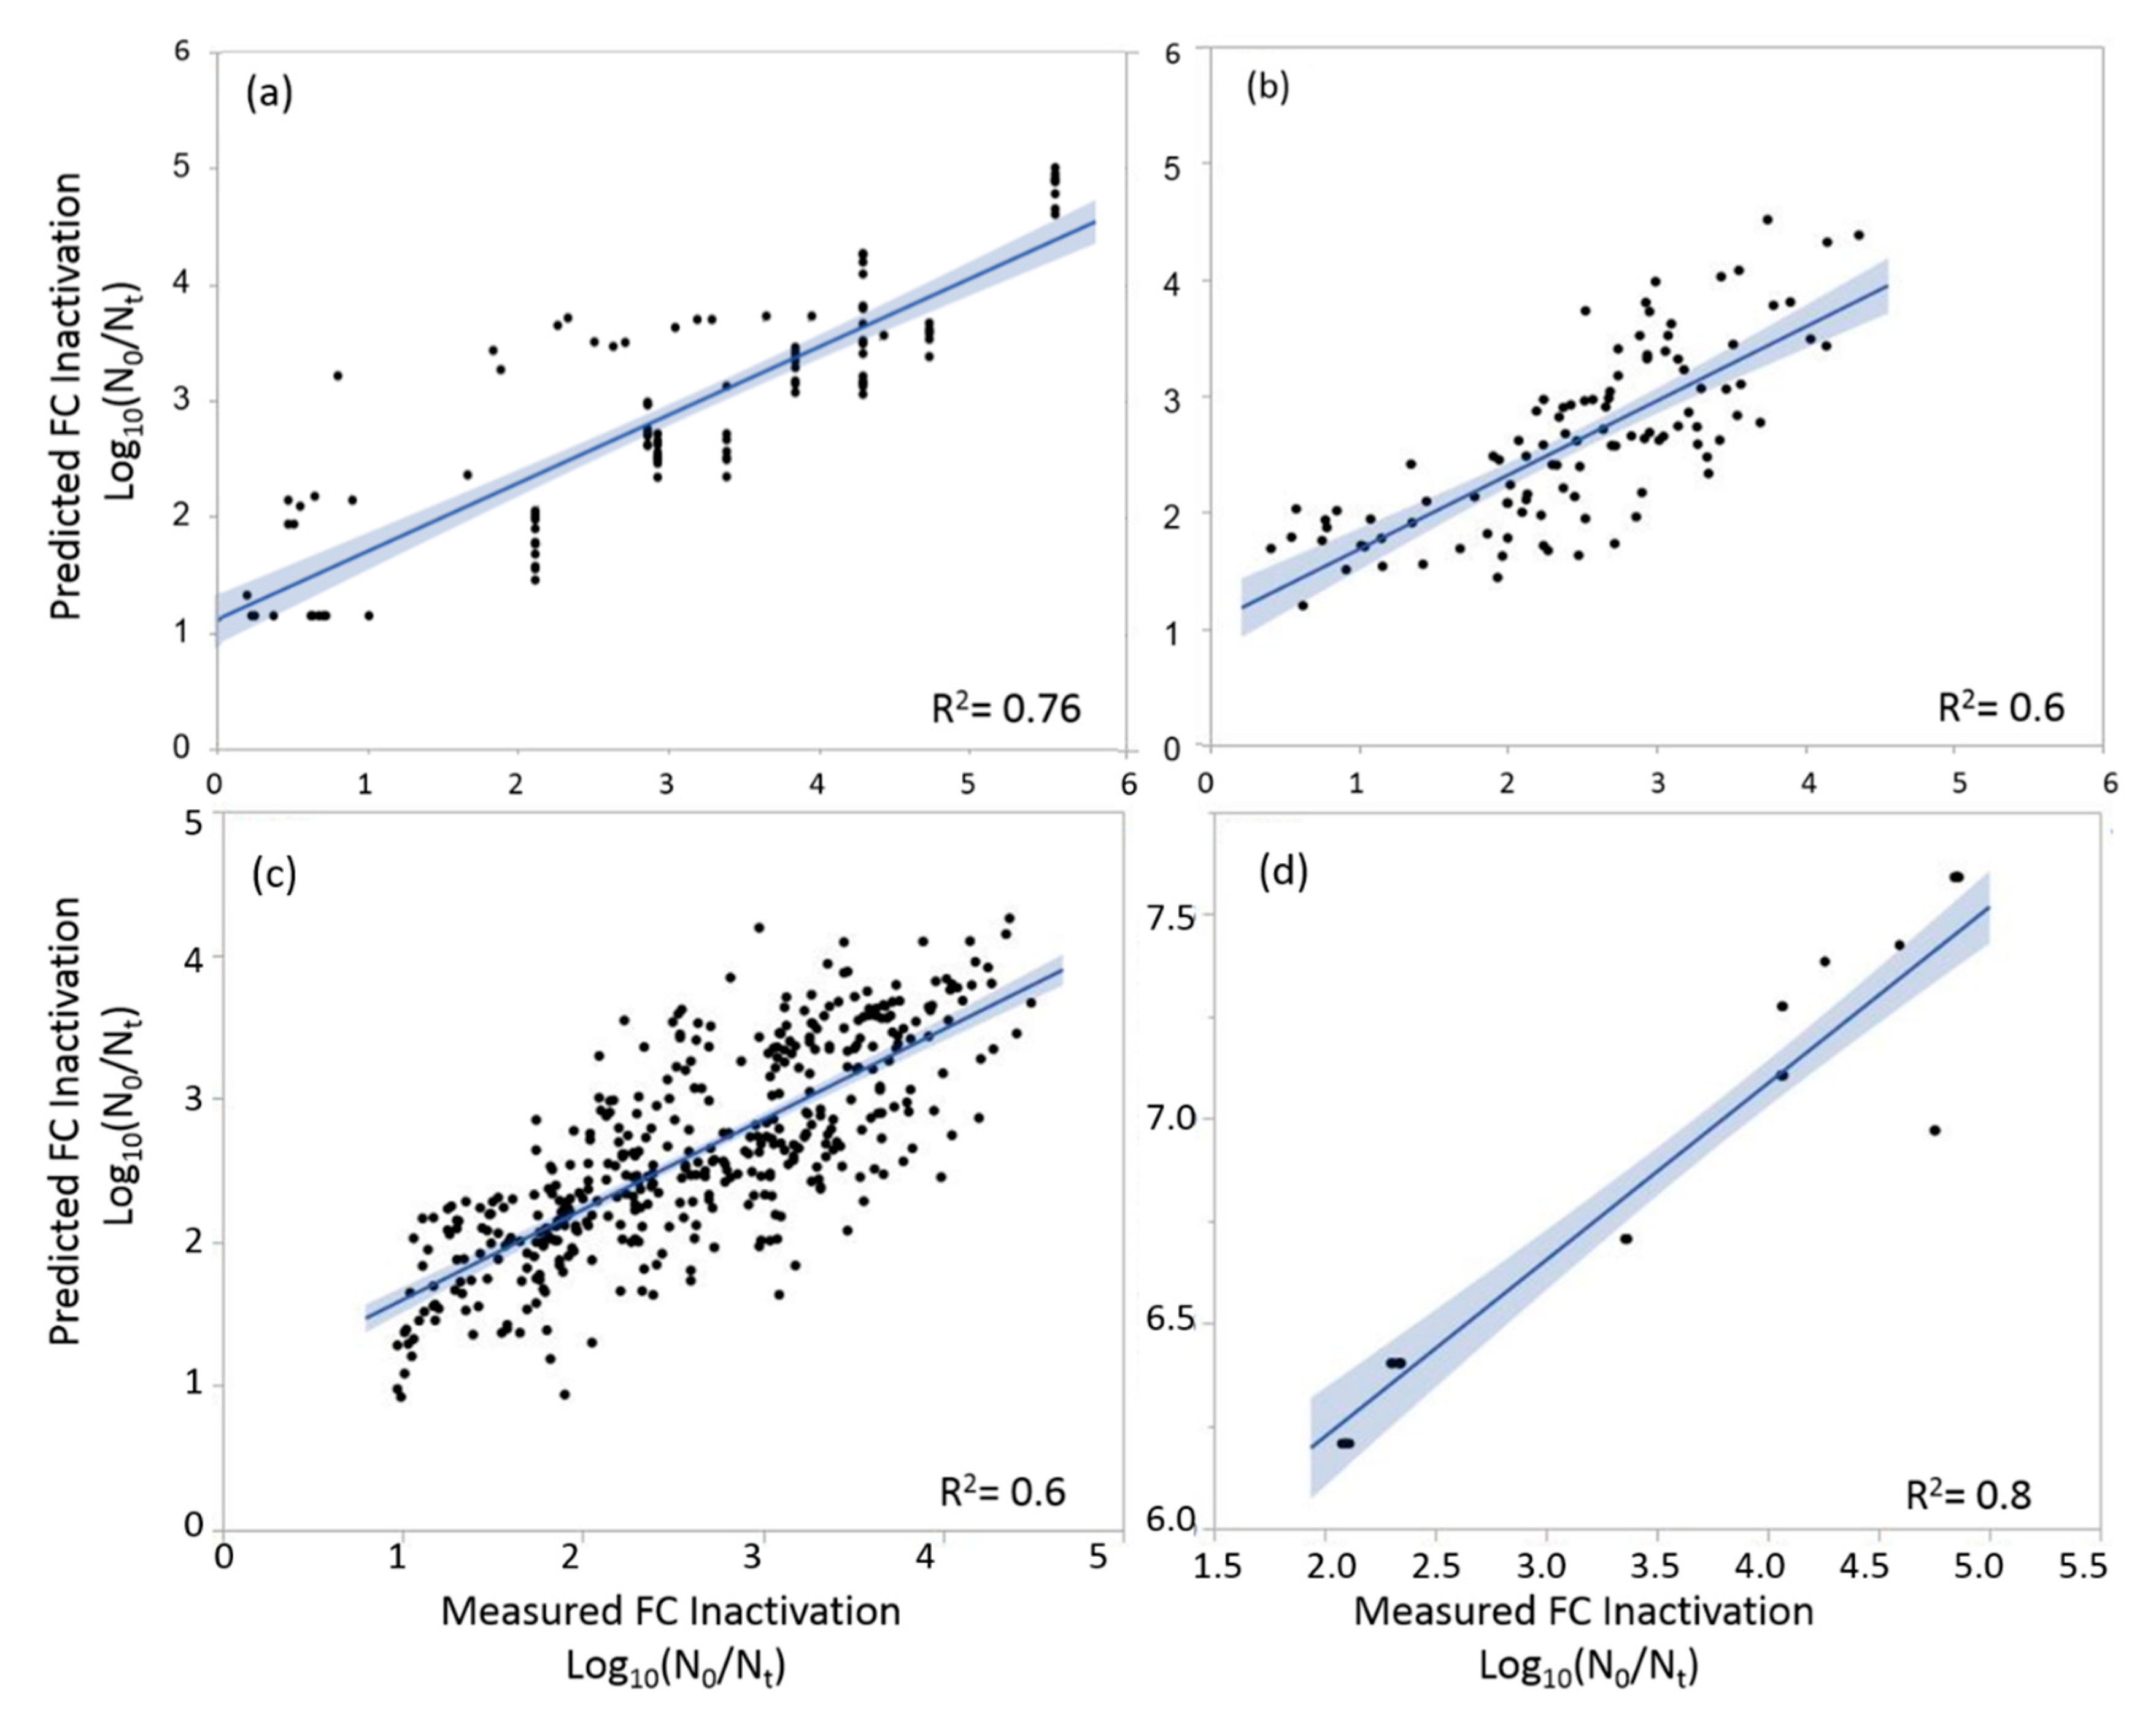
All coefficients were established based on the batch disinfection experiments, and both models were found to be statistically significant (p < 0.0001) with R2 = 0.76 and R2 = 0.60 for chlorination and UV disinfection, respectively (Table 1). Moreover, for chlorination, all explanatory variables were found to be statistically significant, indicating that that these chosen variables have a significant influence on the efficiency of chlorine disinfection (in the examined ranges). On the other hand, for the UV collimated beam experiments, dissolved BOD5 concentration was not found to be statistically significant, indicating that dissolved BOD5 had only a moderate impact (if any) on the UV disinfection efficiency (at the concentrations tested, <20–100 mg/L), and the model’s statistical estimation was similar when the BOD5 concentration was excluded/included in the model.
It should be noted that more complex models containing combinations of the explanatory variables (including interactions between them) were explored. However, since they did not increase the fit of the models, the simplest ones are presented. To compare the effects of the various explanatory variables on UV/chlorination disinfection efficiency, an effect size test, which is used for assessing variables’ effects on a suggested model, was applied. In this test, the p-value was transformed to the LogWorth (−log10(p-value)), assuming that larger effects lead to more significant p-values and larger LogWorth values (Table 1).
Both models indicated that the initial microbial concentration was the most significant parameter (having a positive effect). In the case of chlorination, the initial microbial concentration was followed by TSS and then BOD5 concentrations; both resulted in a reduction of FC inactivation (negative effect). These results are consistent with established theory and demonstrate the negative effect of TSS and BOD5 on chlorine disinfection. Most likely, some of the BOD5 and TSS increased chlorine demand as they were oxidized, thus reducing the active chlorine concentration in the effluent and, consequently, lowering FC inactivation. In addition, as aforementioned, TSS and BOD5 may affect chlorination efficiency by increasing bacterial resistance due to stabilization of the microbial cell membranes [14] or due to bacterial attachment to suspended solids [12,13].
The MLR model, obtained from the UV collimated beam, indicates that high initial microbial concentrations and high UV doses result in increased FC inactivation, while increasing TSS concentrations result in a reduction in FC inactivation. In this case, the effect of dissolved BOD5 was not significant (in the range tested). These results are consistent with established theory and demonstrate the negative effect of TSS on UV disinfection, likely due to the “shielding and shadowing effect” of particles [29].
3.3. Flow-Through Setups and Model Verification
The concentrations of FC, TSS, and BOD5 from pre-disinfected treated GW (11 on-site systems) ranged from 0–106 CFU/100 mL, 3.9–233 mg/L, and 0–107 mg/L, respectively (Table 2). FC counts after disinfection were also analyzed and compared with the models predictions.
The MLR models, developed based on the batch-phase experiments, were verified against the results of the continuous flow-through disinfection setups (chlorination chamber and UV reactor) and were found to be statistically significant (p < 0.0001), with R2 = 0.60 and R2 = 0.84 for the chlorination and UV irradiation, respectively (Figure 5b,d). Although the quality of the treated GW from the two phases was quite different, as were the means of chlorination and UV irradiation, the models fitted well and explained most of the variability in the measured FC inactivation.
The correlation for chlorination suggests that it would be possible to predict the required residual chlorine concentration needed for continuous reactors (common in full-scale treatment systems), given FC, BOD5 and TSS concentrations in the treated GW (prior to chlorination), and the required final FC concentration after chlorination, as described in Equation (3).
where required residual chlorine, BOD5 and TSS are in mg/L; FC inactivation is in Log(cfu/100 mL).
Controlling the residual chlorine concentration in a flow-through disinfection reactor for a certain GW quality would require manipulating the amount of chlorine in the reactor (e.g., number of chlorine tablets) and/or the contact time (by changing the flow rate).
Regarding the UV disinfection, interestingly, difference between the model (based on the collimated beam batch experiments) prediction of FC inactivation efficiencies and the flow-through reactor results was found (Figure 5d). This difference most likely resulted from the different way that the UV irradiation was applied. In the collimated beam, samples were small, well mixed, and directly irradiated, while in the flow-through UV reactor, the flow regime was more complex (being partially well-mixed and partially plug-flow [25]). Thus, not all the GW passing through the reactor received the same UV dose, meaning that not all FC present in the GW were exposed to the same dose. For the same log inactivation, dividing the measured UV dose in the flow-through reactor (44 mJ/cm2 in this study) by the model-predicted UV dose (based on the batch collimated beam results) resulted in a correction factor (CF) of 7.47 (STD = 1.25). This factor transforms the UV dose required for certain FC inactivation in the collimated beam batch experiments to the dose required by the UV flow-through reactor for the same FC inactivation. In other words, in order to achieve the same log FC inactivation for waters of comparable quality (i.e., TSS, BOD5 and pre-disinfection FC concentrations), the UV dose required in the flow-through reactor is 7.47 times higher than the dose required in the collimated beam. Refs. [32,33] report similar differences between collimated beam experimental results and the flow-through reactor results. Using the model amended by the CF, the required UV dose in flow-through reactors can be assessed based on laboratory tests (Equation (4)).
where required UV dose is in mJ/cm2, FC inactivation is in Log(cfu/100 mL), BOD5 and TSS are in mg/L; log FC row in Log(cfu/100 mL); CF: 7.47 (unitless).
4. Conclusions
This study quantified the effects of treated greywater quality (TSS, BOD5, and FC) on both chlorination and UV disinfection efficiencies in batch and continuous flow setups.
The efficiency of chlorine disinfection of treated GW was found to decrease as a result of increasing TSS and BOD5 concentrations, in which the effect of TSS was continuous starting from low concentrations, while the effect of BOD5 became significant only above a certain threshold concentration. Batch chlorination experiments have shown that dissolved organic matter affects chlorination efficiency significantly less than TSS, as reflected by the much lower LogWorth value. Based on the batch chlorination results, an MLR model was developed and successfully verified against the results of a flow-through chlorination unit.
The results of the batch UV disinfection experiments suggest that the UV disinfection efficiency of treated GW decreases as a result of increasing TSS concentrations beyond a threshold value of 50 mg/L. Yet, as the applied UV dose increased, the influence of TSS decreased. The effect of dissolved BOD5 on UV disinfection efficiency was found to be negligible (in the concentration range tested).
Similarly, based on the batch UV disinfection experiments an MLR model was developed and was verified against the results of treated GW that was disinfected by a flow-through UV reactor. Using these two models, one can assess the UV dose, or the residual chlorine concentration required in flow-through reactors based on batch results. This approach is valuable not only from an operational standpoint, but also from a research perspective.
Supplementary Materials
The following are available online at https://www.mdpi.com/2073-4441/13/2/214/s1, Figure S1: Schematic of the onsite recirculating vertical flow constructed wetlands (RVFCW) GW treatment system (After Alfiya et al., 2013); Figure S2: Trojan UV collimated beam system excluding the shutter.
Author Contributions
Conceptualization, funding acquisition, methodology, supervision, review, and editing: A.G. and E.F. Methodology, validation data curation, writing: D.F.C. and Y.A. Visualization, writing—original draft, project administration: Y.G. All authors have read and agreed to the published version of the manuscript.
Funding
This research was funded by the Zuk Maccabi Research Fund.
Institutional Review Board Statement
Not applicable.
Informed Consent Statement
Not applicable.
Data Availability Statement
Data is contained within the article or supplementary material.
Conflicts of Interest
The authors declare no conflict of interest. The funders had no role in the design of the study; in the collection, analyses, or interpretation of data; in the writing of the manuscript, or in the decision to publish the results.
Nomenclature
| BOD5 | five-day biochemical oxygen demand |
| FC | fecal coliforms |
| GW | greywater |
| MLR | multiple linear regression |
| RVFCW | recirculating vertical flow constructed wetland |
| TSS | total suspended solids |
| UV | ultraviolet irradiation |
| β1–β8 | coefficients |
References
- Maimon, A.; Tal, A.; Friedler, E.; Gross, A. Safe on-site reuse of greywater for irrigation-a critical review of current guidelines. Environ. Sci. Technol. 2010, 44, 3213–3220. [Google Scholar] [CrossRef] [PubMed]
- March, J.G.; Gual, M. Studies on chlorination of greywater. Desalination 2009, 249, 317–322. [Google Scholar] [CrossRef]
- USEPA (U.S. Environmental Protection Agency). Onsite Wastewater Treatment Systems Manual; EPA 625-R- 00-008, Office of Water; U.S. Environmental Protection Agency: Washington, DC, USA, 2002. [Google Scholar]
- Fenner, R.A.; Komvuschara, K. A new kinetic model for ultraviolet disinfection of greywater. J. Environ. Eng. 2005, 131, 850–864. [Google Scholar] [CrossRef]
- Ekeren, K.M.; Hodgson, B.A.; Sharvelle, S.E.; De Long, S.K. Investigation of pathogen disinfection and regrowth in a simple graywater recycling system for toilet flushing. Desalination Water Treat. 2016, 57, 26174–26186. [Google Scholar] [CrossRef]
- Oh, K.S.; Leong, J.Y.C.; Poh, P.E.; Chong, M.N.; Von Lau, E. A review of greywater recycling related issues: Challenges and future prospects in Malaysia. J. Clean. Prod. 2018, 171, 17–29. [Google Scholar] [CrossRef]
- Leverenz, H.L.; Darby, J.; Tchobanoglous, G. Comparison of a commercially available chlorine and an ultraviolet disinfection unit for onsite wastewater systems. Small Flows Mag. 2007, 8, 11–21. [Google Scholar]
- Friedler, E.; Kovalio, R.; Ben-Zvi, A. Comparative study of the microbial quality of greywater treated by three on-site treatment systems. Environ. Technol. 2006, 27, 653–663. [Google Scholar] [CrossRef]
- Friedler, E.; Yardeni, A.; Gilboa, Y.; Alfiya, Y. Disinfection of greywater effluent and regrowth potential of selected bacteria. Water Sci. Technol. 2011, 63, 931–940. [Google Scholar] [CrossRef]
- USEPA (United States Environmental Protection Agency). Ultraviolet Disinfection Guidance Manual for the Final Long Term 2 Enhanced Surface Water Treatment Rule; EPA 815-R-06-007 Office of Water; USEPA: Washington, DC, USA, 2006. [Google Scholar]
- Benami, M.; Gillor, O.; Gross, A. The question of pathogen quantification in disinfected graywater. Sci. Total Environ. 2015, 506, 496–504. [Google Scholar] [CrossRef]
- Winward, G.; Avery, L.; Stephenson, T.; Jefferson, B. Ultraviolet (UV) disinfection of grey water: Particle size effects. Environ. Technol. 2008, 29, 235–244. [Google Scholar] [CrossRef]
- Bohrerova, Z.; Linden, K.G. Ultraviolet and chlorine disinfection of Mycobacterium in wastewater: Effect of aggregation. Water Environ. Res. 2006, 78, 565–571. [Google Scholar] [CrossRef] [PubMed]
- Virto, R.; Manas, P.; Alvarez, I.; Condon, S.; Raso, J. Membrane damage and microbial inactivation by chlorine in the absence and presence of a chlorine-demanding substrate. Appl. Environ. Microbiol. 2005, 71, 5022–5028. [Google Scholar] [CrossRef] [PubMed] [Green Version]
- Onga, Z.C.; Asadsangabifardb, M.; Ismailb, Z.; Tama, J.H.; Roushenasa, P. Design of a compact and effective greywater treatment system in Malaysia. Desalination Water Treat. 2019, 146, 141–151. [Google Scholar] [CrossRef]
- Christensen, J.; Linden, K.G. How particles affect UV light in the UV disinfection of unfiltered drinking water. J. Am. Water Works Assoc. 2003, 95, 179–189. [Google Scholar] [CrossRef]
- Carré, E.; Pérot, J.; Jauzein, V.; Lopez-Ferber, M. Impact of suspended particles on UV disinfection of activated-sludge effluent with the aim of reclamation. J. Water Process Eng. 2018, 22, 87–93. [Google Scholar] [CrossRef]
- Beck, S.E.; Rodríguez, R.A.; Salveson, A.; Goel, N.; Rhodes, S.; Kehoe, P.; Linden, K.G. Disinfection methods for treating low TOC, light graywater to California title 22 water reuse standards. J. Environ. Eng. 2013, 139, 1137–1145. [Google Scholar] [CrossRef]
- Madge, B.A.; Jensen, J.N. Ultraviolet disinfection of fecal coliform in municipal wastewater: Effects of particle size. Water Environ. Res. 2006, 78, 294–304. [Google Scholar] [CrossRef]
- Gross, A.; Shmueli, O.; Ronen, Z.; Raveh, E. Recycled Vertical Flow Constructed Wetland (RVFCW)—a novel method of recycling greywater for landscape irrigation in small communities and households. Chemosphere 2007, 66, 916–923. [Google Scholar] [CrossRef]
- Alfiya, Y.; Gross, A.; Sklarz, M.; Friedler, E. Reliability of on-site greywater treatment systems in Mediterranean and arid environments—A case study. Water Sci. Technol. 2013, 67, 1389–1395. [Google Scholar] [CrossRef]
- APHA; AWWA; WEF. Standard Methods for the Examination of Water and Wastewater, 22nd ed.; American Public Health Association, American Water Works Association, Water Environment Federation: Washington, DC, USA, 2012. [Google Scholar]
- WHO (World Health Organization). Guidelines for the Safe Use of Wastewater, Excreta and Greywater—Volume 1 and Vol. 4—Excreta and Greywater Use in Agriculture Policy and Regulatory Aspects; WHO: Geneva, Switzerland, 2006. [Google Scholar]
- Mamane, H.; Linden, K.G. UV disinfection of indigenous aerobic spores: Implications for UV reactor validation in unfiltered waters. Water Res. 2004, 38, 2898–2906. [Google Scholar] [CrossRef]
- Friedler, E.; Gilboa, Y. Performance of UV disinfection and the microbial quality of greywater effluent along a reuse system for toilet flushing. Sci. Total Environ. 2010, 408, 2109–2117. [Google Scholar] [CrossRef] [PubMed]
- Inbar, Y. New standards for treated wastewater reuse in Israel. In Wastewater Reuse-Risk Assessment, Decision-Making and Environmental Security; Springer: Berlin/Heidelberg, Germany, 2007; pp. 291–296. [Google Scholar]
- Gross, A.; Maimon, A.; Alfiya, Y.; Friedler, E. Greywater Reuse; CRC Press: New York, NY, USA, 2015. [Google Scholar]
- Crittenden, J.; Trussell, R.; Hand, D.; Howe, K.; Tchobanoglous, G. Water Treatment: Principles and Design, 2nd ed.; John Wiley & Sons Inc.: Hoboken, NJ, USA, 2005. [Google Scholar]
- Mamane, H. Impact of particles on UV disinfection on water and wastewater effluents: A review. Rev. Chem. Eng. 2008, 24, 65–157. [Google Scholar] [CrossRef]
- Cantwell, R.E.; Hofmann, R. Ultraviolet absorption properties of suspended particulate matter in untreated surface waters. Water Res. 2011, 45, 1322–1328. [Google Scholar] [CrossRef] [PubMed]
- Scott, H.E.; Liss, S.N.; Farnood, R.R.; Allen, D.G. Ultraviolet disinfection of sequencing batch reactor effluent: A study of physiochemical properties of microbial floc and disinfection performance. J. Environ. Eng. Sci. 2005, 4, S65–S74. [Google Scholar] [CrossRef]
- Cabaj, A.; Sommer, R.; Schoenen, D. Biodosimetry: Model calculations for UV water disinfection devices with regard to dose distributions. Water Res. 1996, 30, 1003–1009. [Google Scholar] [CrossRef]
- Kuo, J.; Chen, C.L.; Nellor, M. Standardized collimated beam testing protocol for water/wastewater ultraviolet disinfection. J. Environ. Eng. 2003, 129, 774–779. [Google Scholar] [CrossRef]
Figure 1.
Flow-through units: (a) chlorination chamber; (b) UV reactor.

Figure 2.
Effects of TSS and dissolved BOD5 concentrations in treated greywater on fecal coliform inactivation within a total residual chlorine concentration range of 0.5–1.5 mg/L for three different scenarios: increase of TSS (a), increase of BOD5 (b), and increase of TSS and BOD5 (c). Colors represent percent inactivation from 96–100 % with a line interval of 0.5%.

Figure 3.
Effects of TSS and dissolved BOD5 concentrations in treated greywater on fecal coliform inactivation under three UV doses: (a) 7.5, (b) 15 and (c) 30 mJ/cm2. Colors represent percent inactivation from 96–100% with a line interval of 0.5%.
Figure 3.
Effects of TSS and dissolved BOD5 concentrations in treated greywater on fecal coliform inactivation under three UV doses: (a) 7.5, (b) 15 and (c) 30 mJ/cm2. Colors represent percent inactivation from 96–100% with a line interval of 0.5%.

Figure 4.
Effects of TSS and dissolved BOD5 on FC inactivation under three UV doses: 7, 15 and 30 mJ/cm2: (a) at low BOD5 concentration (<10 mg/L) and (b) at low TSS concentration (<10 mg/L).
Figure 4.
Effects of TSS and dissolved BOD5 on FC inactivation under three UV doses: 7, 15 and 30 mJ/cm2: (a) at low BOD5 concentration (<10 mg/L) and (b) at low TSS concentration (<10 mg/L).

Figure 5.
MLR-predicted vs. measured FC inactivation: (a) batch chlorination setup, (b) chlorine flow-through chamber, (c) UV collimated beam, and (d) UV flow-through reactor.
Figure 5.
MLR-predicted vs. measured FC inactivation: (a) batch chlorination setup, (b) chlorine flow-through chamber, (c) UV collimated beam, and (d) UV flow-through reactor.


Table 1.
Chlorination/UV disinfection: coefficients of the MLR models.
| Explanatory Variable | Coefficient | Estimate | p-Value | LogWorth | |
|---|---|---|---|---|---|
| Batch Chlorination | Dissolved BOD5 (mg/L) | β1 | −0.016 | <0.0001 | 5.43 |
| TSS (mg/L) | β2 | −0.013 | <0.0001 | 10.8 | |
| Log FC raw (log(CFU/100 mL)) | β3 | 0.831 | <0.0001 | 22.8 | |
| Residual chlorine (mg/L) | β4 | 0.644 | <0.0001 | 2.83 | |
| UV irradiation Collimated beam | Dissolved BOD5 (mg/L) | β5 | 0.001 | 0.2211 * | 0.20 |
| TSS (mg/L) | β6 | −0.012 | <0.0001 | 23.0 | |
| Log FC raw (log(CFU/100 mL)) | β7 | 0.495 | <0.0001 | 43.5 | |
| UV dose (mJ/cm2) | β8 | 0.059 | <0.0001 | 38.2 |
* not statistically significant.
Table 2.
Quality levels of pre-disinfected treated GW samples, from 11 on-site treatment systems, that were used in the flow-through experiments. Each site was sampled four times (n = 44 samples).
Table 2.
Quality levels of pre-disinfected treated GW samples, from 11 on-site treatment systems, that were used in the flow-through experiments. Each site was sampled four times (n = 44 samples).
| Range | Average | Median | |
|---|---|---|---|
| TSS (mg/L) | 3.9–233 | 38 | 15 |
| Dissolved BOD5 (mg/L) | 0–107 | 41 | 37 |
| % Transmission254 nm | 39–85 | 64 | 67 |
| Turbidity (NTU) | 1.47–512 | 87 | 18 |
| FC (CFU/100 mL) | 0–106 | 105 | 105 |
Publisher’s Note: MDPI stays neutral with regard to jurisdictional claims in published maps and institutional affiliations. |
© 2021 by the authors. Licensee MDPI, Basel, Switzerland. This article is an open access article distributed under the terms and conditions of the Creative Commons Attribution (CC BY) license (http://creativecommons.org/licenses/by/4.0/).
Share and Cite
MDPI and ACS Style
Friedler, E.; F. Chavez, D.; Alfiya, Y.; Gilboa, Y.; Gross, A. Impact of Suspended Solids and Organic Matter on Chlorine and UV Disinfection Efficiency of Greywater. Water 2021, 13, 214. https://doi.org/10.3390/w13020214
AMA Style
Friedler E, F. Chavez D, Alfiya Y, Gilboa Y, Gross A. Impact of Suspended Solids and Organic Matter on Chlorine and UV Disinfection Efficiency of Greywater. Water. 2021; 13(2):214. https://doi.org/10.3390/w13020214
Chicago/Turabian StyleFriedler, Eran, Diana F. Chavez, Yuval Alfiya, Yael Gilboa, and Amit Gross. 2021. "Impact of Suspended Solids and Organic Matter on Chlorine and UV Disinfection Efficiency of Greywater" Water 13, no. 2: 214. https://doi.org/10.3390/w13020214
Note that from the first issue of 2016, this journal uses article numbers instead of page numbers. See further details here.