Preparation, Performances and Mechanisms of Co@AC Composite for Herbicide Atrazine Removal in Water
by
 , and
, and
Yongpan Liu
1, 
Danxia Liu
1,
Huijun He
1,2,3,* ,
,
Jinxiao Zhang
4,*, 
Jie Liu
1,2,3,
Dunqiu Wang
1,2,3,
Liangliang Huang
1,2,3 and
Zhihong Tu
1,2,3 1
College of Environmental Science and Engineering, and Guangxi Key Laboratory of Environmental Pollution Control Theory and Technology, Guilin University of Technology, Guilin 541004, China
2
Collaborative Innovation Center for Water Pollution Control and Water Safety in Karst Area, Guilin University of Technology, Guilin 541004, China
3
Guangxi Key Laboratory of Environmental Pollution Control Theory and Technology for Science and Education Combined with Science and Technology Innovation Base, Guilin University of Technology, Guilin 541004, China
4
College of Chemistry and Bioengineering, Guilin University of Technology, Guilin 541004, China
*
Authors to whom correspondence should be addressed.
Water 2021, 13(2), 240; https://doi.org/10.3390/w13020240
Submission received: 24 December 2020
/
Revised: 15 January 2021
/
Accepted: 16 January 2021
/
Published: 19 January 2021
(This article belongs to the Section Wastewater Treatment and Reuse)
Abstract
:In this study, a high-performance adsorbent Co@AC was prepared by loading cobalt ions (Co2+) on activated carbon (AC) via solution impregnation and high-temperature calcination technology, and was used to remove atrazine in water. The preparation factors on the adsorbent properties were studied, and the characteristics were analyzed by scanning electron microscopy (SEM), energy dispersive spectroscopy (EDS), and Fourier transform infrared spectrometer (FTIR). The results showed that Co@AC possessed the best performance when the factors were 7.0% of Co2+ (w/v), 7.0 h of immersing time, 500 °C of calcination temperature and 4.0 h of calcination time. The adsorption conditions and mechanisms for atrazine removal by Co@AC were also studied scientifically. As the conditions were pH 4.0, reaction time 90 min and temperature 25 °C, Co@AC had the largest adsorption capacity, which was 92.95 mg/g, and the maximum removal rate reached 94.79%. The correlation coefficient of the Freundlich isotherm was better than that of the Langmuir isotherm, and the adsorption process followed the pseudo-second-order kinetic model. Cycle experiments showed that the removal efficiency of atrazine by Co@AC remained above 85% after five repeated experiments, indicating that Co@AC showed a strong stable performance and is a promising material for pesticides removal.
1. Introduction
Since the 1950s, organic pesticides have been widely used in the pest control and weed removal of farmland. When used, pesticides will inevitably enter the surface water and groundwater, leading to the increasing severity of pesticide pollution [1]. In agriculture, atrazine (2-chloro-4-ethylamino-6-isopropylamino-1,3,5-triazine) can effectively control and remove broadleaf weeds and grass weeds, and is also used as a non-selective herbicide on fallow and non-farm land [2]. Due to the convenient usage, excellent weeding effect, and low price, atrazine has been widely used as a herbicide for sugarcane, corn, sorghum and other crops [3], and its global annual consumption is as high as 70–90 thousand tons [4].
With the extensive usage and the relative stability in environment, atrazine has been detected in both surface water and groundwater [5]. The World Health Organization (WHO) and the United States Environmental Protection Agency (USEPA) stipulate that the allowable concentration of atrazine in water is 2.0 and 3.0 μg/L, respectively [6]. In the US Midwest, the residue concentration of atrazine in farmland exceeded 300 μg/L after rainfall in the spring and summer of 2016 [7]. Data from the US Natural Resources Defense Council showed that 80% of the 153 water systems in the US contained atrazine, and the concentration of atrazine exceeded the maximum allowable concentration of 3.0 μg/L about 65% of the water systems [8]. Atrazine is among the most widely used herbicides in the United States, with an estimated annual consumption of 82 million pounds [9]. In the past few decades, China has been the main user of atrazine, with an annual consumption of 1000–1500 tons [10], and the area of atrazine-contaminated land exceeds 1.0 × 10¹⁰ hm2 [11]. Up to now, many countries and organizations such as Japan, US and the European Community have added atrazine to their list of endocrine disrupting chemicals (EDCs), because atrazine is an environmental estrogen and a potential carcinogen [12]. The study of Vieira et al. showed that atrazine in the aquatic environment could undermine the biodiversity [13], and Xing et al. [14] found that atrazine could induce the methylation of DNA in carp’s brain. According to the reports [15,16], atrazine can harm the growth of fish, damage the reproductive and immune systems of mammals, crustaceans, reptiles and amphibians, as well as endanger human health.
Given the hazards of atrazine, studying how to remove atrazine and reduce its toxicity on the environment and humans is the focus of current studies. Currently, the treatment technology for atrazine mainly included physical methods, chemical methods, biological methods and the combined technologies [17]. The most commonly used technology regarding physical methods is the adsorption method [18]. The researchers mixed anion exchange resins (AERs) and powdered activated carbon (PAC) to remove atrazine from water, the removal rate of atrazine by the combined material was increased by 20% compared to PAC alone [19]. The chemical method is mainly based on a redox reaction to treat organic pollutants in water. Generally, some specific techniques are used to generate strong oxidizing chemical substances such as oxygen atoms, hydroxyl radicals, sulfate radicals, etc., and then atrazine is degraded [20]. Wu et al. [21] studied the degradation of atrazine by the ferrate (Fe(VI))/peroxymonosulfate (PMS) system, and found that the removal efficiency of atrazine by the combined system was higher than that of Fe(VI) or PMS alone, and the system could effectively degrade atrazine in the pH range of 5.0–9.0. Biological methods mainly utilize the metabolism of plants or microorganisms to treat contaminated water or soil by the organic pesticide atrazine [22]. Zhao et al. [23] isolated atrazine-degrading strain ZXY-2 from soil samples near a pesticide plant, and identified it as genus Arthrobacter by 16 S rRNA gene sequencing, the strain could completely degrade 100 mg/L of atrazine after 15 h of cultivation. For removing organic pollutants in water more simply and efficiently, various combined technologies have been developed, among which the material-microbial combined technology has become a new research hotspot [24]. Yu et al. [25] synthesized a bead by using polyvinyl alcohol-sodium alginate (PVA-SA) to encapsulate Penicillium yz11-22N2 and nano-Fe3O4. Under optimal conditions, the removal rate of 8.0 mg/L atrazine by this bead reached 91.2%.
In recent years, people have paid great attention to pesticide pollution and a lot of research has been done regarding pesticide removal. However, pesticides have been used for a long time and were spread to the environment extensively, which has seriously aggravated the treatment difficulty and health risks of pesticide pollution. Many existing treatment technologies for atrazine from water bodies have shortcomings in terms of high costs and risks of secondary pollution. Moreover, the use of adsorption as a treatment approach and the development of novel adsorbents for removing atrazine contaminated water are still in need for major improvements. Therefore, the development of new technologies and materials for pesticide treatment is particularly important. In these technologies, solution impregnation and high temperature calcination technologies are very effective methods to prepare high-performance materials. The solution impregnation is that solid samples are immersed in a solution containing active components so as to load the active components on the solids [26]. High-temperature calcination is to heat the material to a certain temperature so that the active components are stably loaded on the solids [27]. In this study, a new functional material Co@AC was prepared by loading cobalt ion (Co2+) on activated carbon (AC) via solution impregnation and high-temperature calcination technologies. The influence of preparation factors such as the concentration of cobalt ions, immersing time, calcination temperature and calcination time on the material properties was studied systematically, and the removal conditions, adsorption isotherms and adsorption kinetics of the prepared material for atrazine treatment were investigated. At the same time, the reusability of the material was also evaluated.
2. Materials and Methods
2.1. Materials
Activated carbon was bought from Xilong Scientific Co., Guangzhou, China. The basic characterizations were that the BET specific surface area was 846.136 m2/g, the total pore volume was 0.619 cm3/g, the mean aperture was 3.075 nm and the point-of-zero charge of pH (pHzpc) was 6.3. The pretreatment of activated carbon was as follows: The powdered activated carbon was screened with a standard sample sieve of 100 mesh, and the undersized powder was soaked with a concentration of 0.5 mol/L NaOH solution for 24 h, then washed with Milli-Q water (>18 MΩ cm) to neutrality, and dried in an oven at 90 °C. After that, the treated activated carbon was soaked in hydrochloric acid solution with a concentration of 1.0 mol/L for 24 h, filtrated and washed with Milli-Q water to neutrality, then dried in an oven at 90 °C to obtain the hydrogen-type activated carbon.
The pesticide atrazine (>97% purity) used in the experiment was procured from Shanghai Yuanye Biological Technology Co., Ltd. Unless otherwise stated, the concentration of atrazine in all experiments was 10 mg/L. The cobalt ion stock solution with a mass fraction of 20% was prepared by dissolved Cobalt nitrate [Co(NO3)2•6H2O] in Milli-Q water. Except the chromatographic grade methanol and acetonitrile was used for liquid chromatography analysis, all other chemicals were analytically pure and without further purification.
2.2. Preparation of Co@AC
Cobalt ions were adsorbed on the activated carbon via the solution impregnation method, then the filtered solid sample was dried at 90 °C. The dried solid was calcined at a specified temperature and time so that the cobalt ions were stably loaded on the activated carbon, then the calcined solid was ground into powder to obtain a high-performance Co@AC material. In the process of material preparation, the single-factor experimental method was used to investigate the performance of the material such as the Co2+ concentration in the impregnation solution, immersing time, calcination temperature and calcination time. The experimental method is that when studying the first factor, all the other factors are assumed to be one value. In this experiment, the assumed values of Co2+ concentration in the impregnation solution, immersing time, calcination temperature and calcination time were 7%, 9.0 h, 500 °C and 4.0 h, respectively.
Investigating the influence of the Co2+ concentration in the impregnation solution, the mass fraction of Co2+ was 3%, 5%, 7%, 9%, 11%, respectively, and the immersing time was set as 3.0 h, 5.0 h, 7.0 h, 9.0 h, 12.0 h. When studying the influence of calcination temperature and time, the control temperature was 300 °C, 400 °C, 500 °C, 600 °C, 700 °C, and the calcination time was 2.0 h, 3.0 h, 4.0 h, 5.0 h, and 6.0 h. The material performance was judged based on the removal of 10 mg/L atrazine accompanied by instrumental characterization. The concentration of atrazine in the filtrate after treatment was analyzed by liquid chromatography to calculate the removal rate, the characterization was described in Section 2.5.
2.3. Atrazine Removal Experiment
The appropriate amounts of Co@AC were placed in conical flasks containing 50 mL of atrazine solution with a concentration of 10 mg/L, and then the conical flasks were quickly placed in a constant temperature water bath oscillator and reacted at a shaking speed of 120 rpm. After the reaction of 3.0 h, an appropriate volume of the solution was filtered through a 0.25 μm filter membrane and the filtrate was injected into a sample bottle, the concentration of atrazine in the filtrate was analyzed by liquid chromatography to calculate the removal rate. In the removal experiment, the single-factor experimental method was employed to investigate the influence of the solution pH, reaction time, reaction temperature and material dosage on the removal effect of atrazine. In this experiment, the assumed values of solution pH, reaction time, reaction temperature and material dosage were 6.0, 180 min, 25 °C and 60 mg/L, respectively.
When studying the influence of pH on the removal effect, the pH of the solution was adjusted to 2.0, 3.0, 4.0, 5.0, 6.0, 7.0, 8.0, 9.0, 10.0. As studying the influence of reaction time, we set the time to 2, 5, 10, 20, 40, 60, 90, 120, 150 min. When investigating the influence of the reaction temperature, the temperature was conducted as 25 °C, 35 °C, and 45 °C. Subsequently, the influence of the material dosage on the removal of atrazine was also investigated.
2.4. Analysis Method
A high-performance liquid chromatograph (HPLC, 1260 Infinity, Agilent Technologies) was used to determine the residual concentration of atrazine in the solution after reaction. The detection parameters of the HPLC were: the chromatographic column ZORBAX SB-C18 (4.6 × 250 mm, 5 μm), the detection wavelength of the variable wavelength scanning UV detector (VWD) was 236 nm, the mobile phase was composed of water, acetonitrile and methanol (3:1:6, v/v/v) at a flow rate of 1.0 mL/min, the injection volume was 20 μL, and the column temperature was 40 °C.
The calculation formulae for the adsorption capacity (1) and the removal rate (2) of Co@AC for atrazine refer to [28]:
in which Qt (mg/g) denotes the adsorption capacity at time t, V (L) the volume of the reaction solution, C0 (mg/L) the initial concentration of atrazine, Ct (mg/L) the remaining concentration of atrazine at time t, m (g) the adsorbent mass, and α (%) the removal rate of atrazine.
2.5. Characterization
The surface morphology of Co@AC was analyzed by scanning electron microscopy (SEM, ∑IGMA, Zeiss) with a multiple of 10 K. Before measuring, the samples were coated on conductive glue and sprayed with gold for 30 s. At the same time, the energy dispersive spectroscopy (EDS) equipped with the SEM was used to confirm the micro-domain components of the samples. In addition, the Fourier transform infrared spectrometer (FTIR, NICOLET iS10, Thermo Fisher) was utilized to determine the surface functional groups of the samples, the dried samples and KBr were ground into powder at a mass ratio of 1:100 and measured in the range of 450–4000 cm−1.
2.6. Desorption and Cycle Experiments
Under the best experimental conditions obtained in Section 2.3, the reacted material Co@AC was filtered with a 0.45 μm organic filter membrane, and then rinsed five times with the mixed liquor of pure methanol and ultrapure water at a ratio of 1:1. After that the reacted material was rinsed with ultrapure water again. The obtained Co@AC was dried at 90 °C for 12 h. According to the experimental method in Section 2.3 overall four cycles were repeated to investigate the reusability of Co@AC.
All adsorption experiments were set to three parallel samples, average values were calculated in view of the final results.
3. Results and Discussion
3.1. The Influence of Preparation Conditions on Material Properties
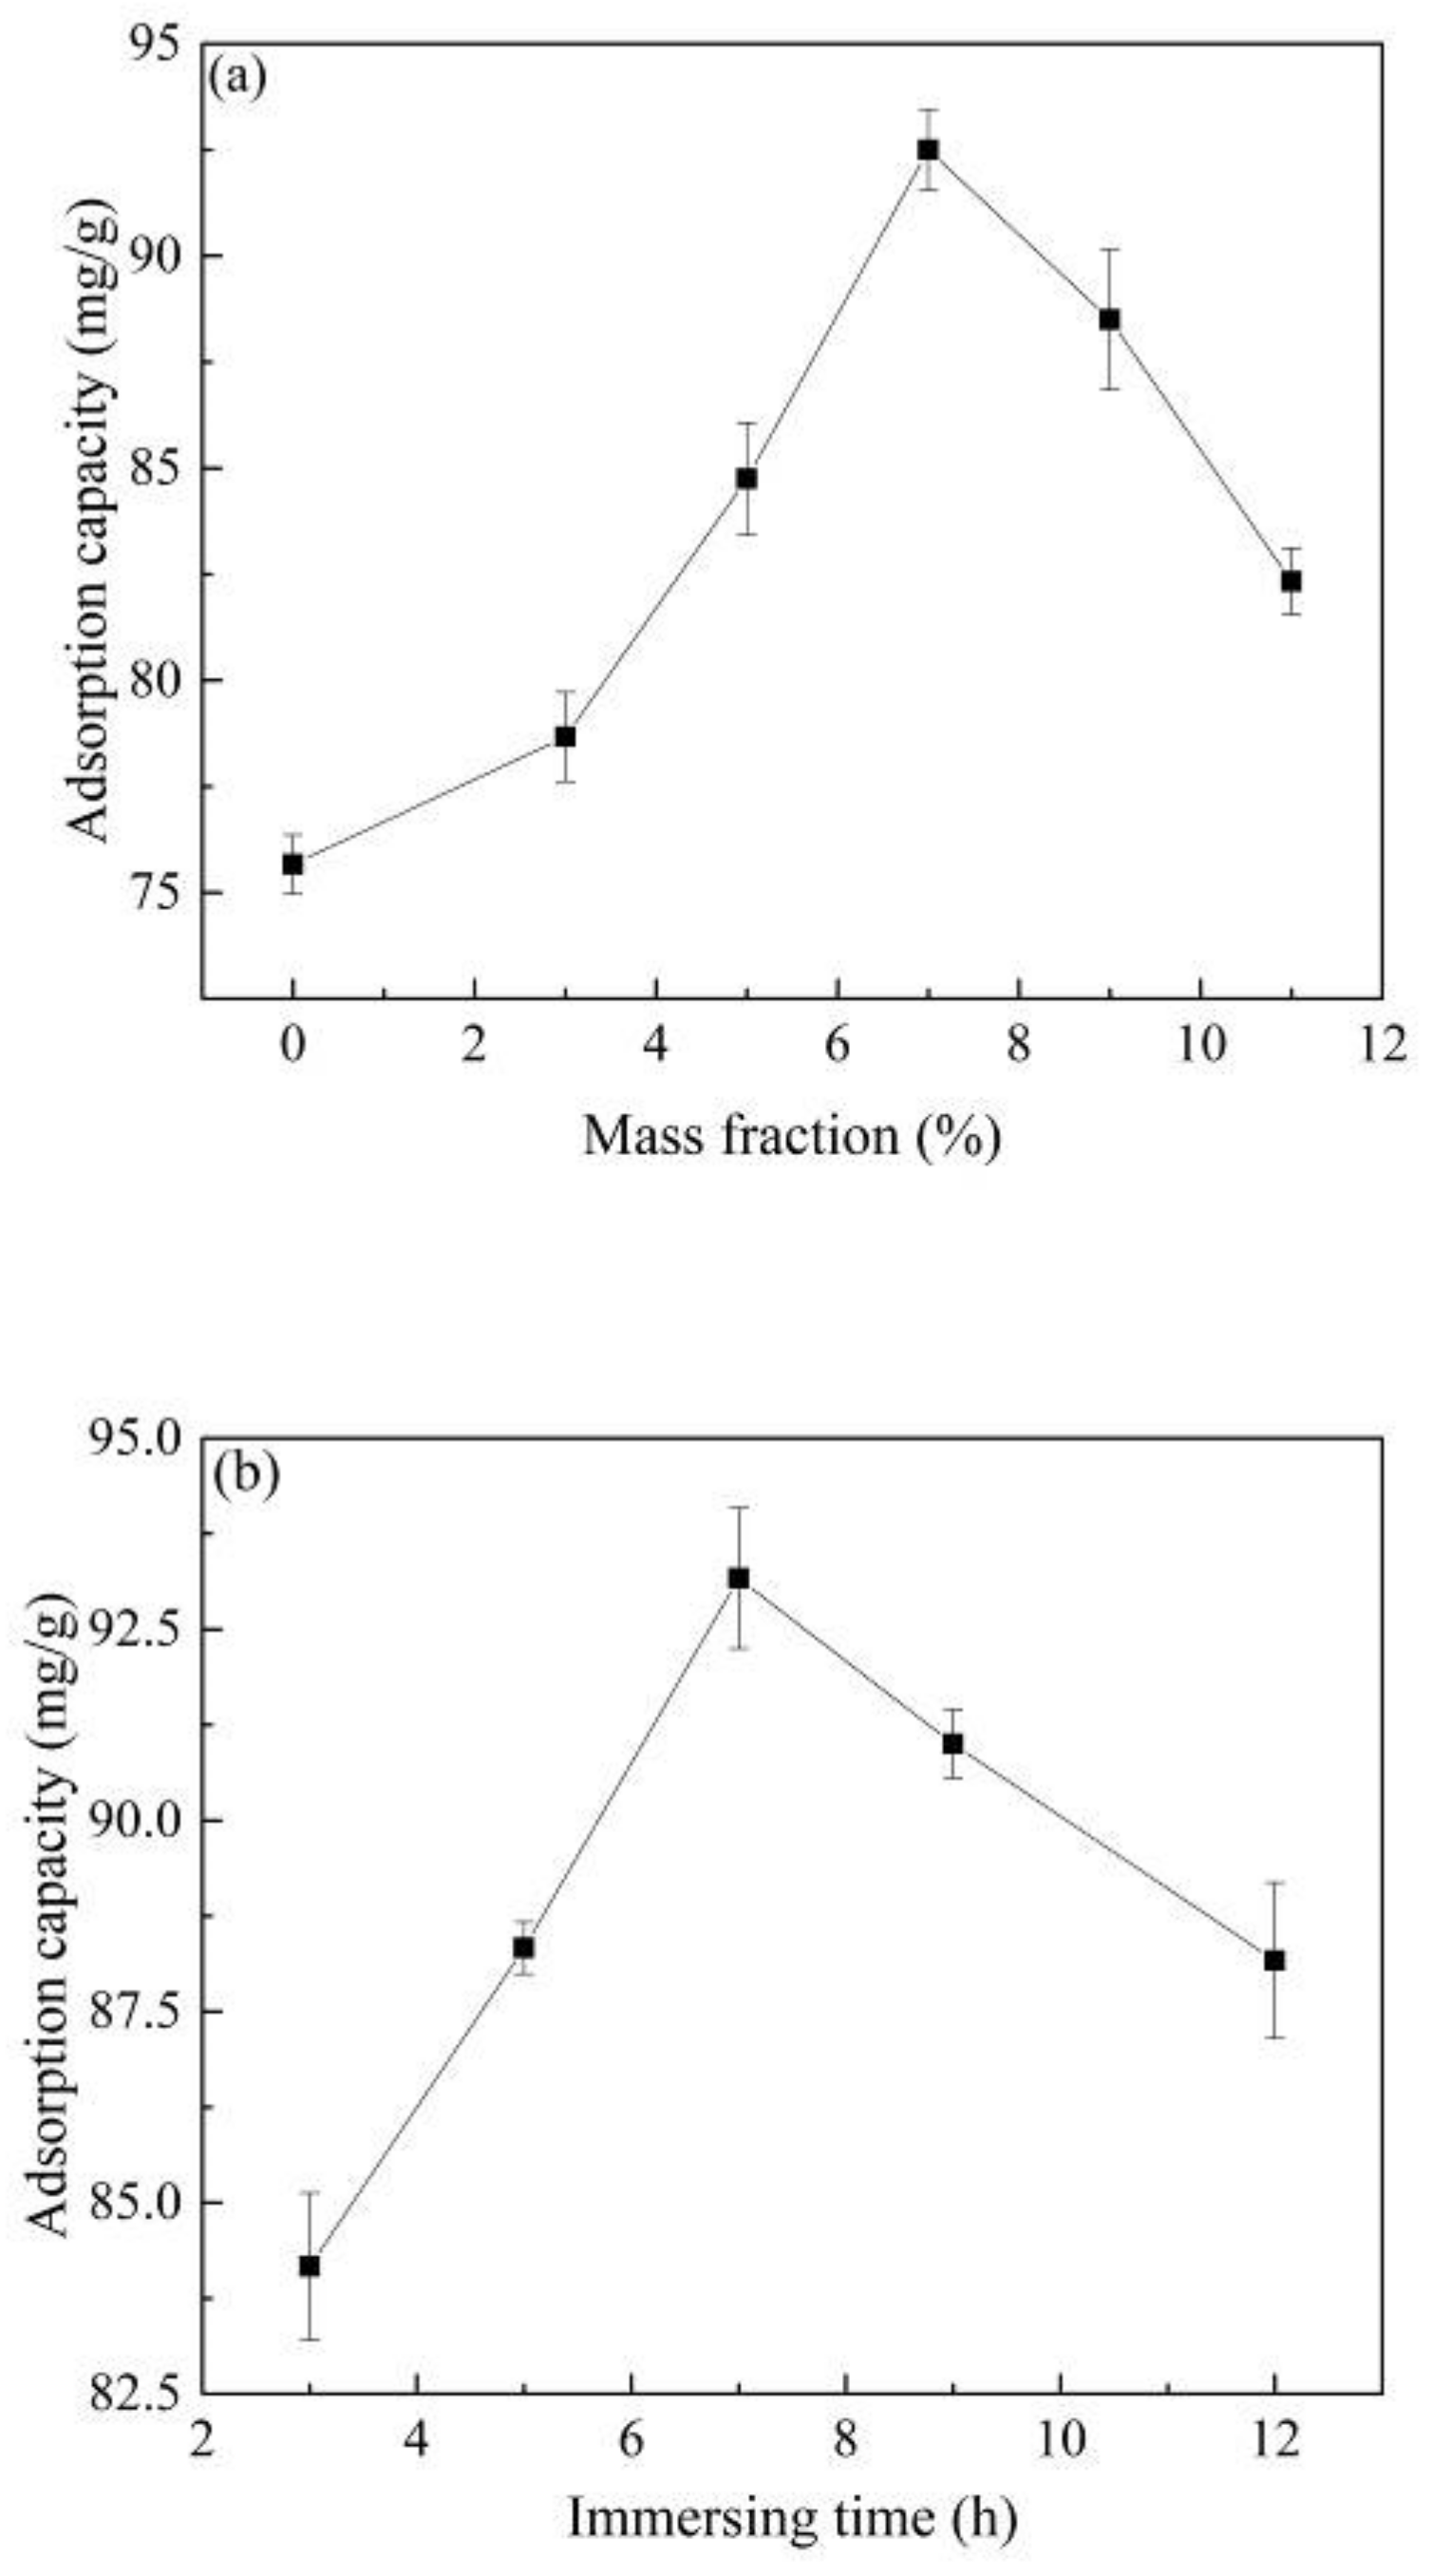
The Co2+ concentration in the impregnation solution had a great influence on the performance of the material. It can be seen from Figure 1a that the adsorption capacity of Co@AC for atrazine increased with the increase in the Co2+ concentration from 0 to 7.0% in the impregnating solution. The raw activated carbon (not impregnated with Co2+) had only an adsorption capacity of 75.66 mg/g for atrazine. When the Co2+ content increased to 7.0%, the adsorption capacity of Co@AC for atrazine was the highest, reaching 92.5 mg/g. The metal concentration of the impregnating solution was directly related to the distribution of metal ions on the material, which had a direct effect on the active components of the material [29]. The amount of Co2+ loaded on the activated carbon was small as the Co2+ content in the impregnating solution was too low, which reduced the content of active components, so as to adversely affect the adsorption performance of the material. However, when the metal concentration of the impregnating solution was too high, it was easy to cause the agglomeration of Co2+ on the surface of the activated carbon and form large particulate matters, resulting in a decrease in the specific surface area of the material and a decrease in active components [30], thereby reducing the performance of the material. As seen in Figure 1a, the adsorption capacity was only 82.33 mg/g when the Co2+ content was 11.0%. In the subsequent preparation experiments, we choose the optimal Co2+ concentration of 7.0% in the impregnating solution as the preparation factor of Co@AC.
Figure 1b showed the relationship between the immersing time and the adsorption capacity of Co@AC. When the immersing time increased from 3.0 to 7.0 h, the atrazine removal by Co@AC also increased, and the maximum adsorption capacity was 93.17 mg/g as the immersing time was 7.0 h. However, as the immersing time exceeded 7.0 h, the adsorption capacity decreased as well. At a short immersing time, the adsorption effect of Co@AC was poor, because the immersing time was too short for Co2+ to be heavily loaded on the activated carbon. As the immersing time increased, the loaded amount of Co2+ and the active components on the activated carbon increased, so as to enhance the performance of the material [31]. However, when the immersing time was too long, the Co@AC could undergo a recrystallization process and reduced the amount of metal loading, which resulted in a decrease in the adsorption capacity. Similar results were obtained by Cejudo et al. [32]. Therefore, the immersing time of 7.0 h was used as the preparation factor in the subsequent experiments.
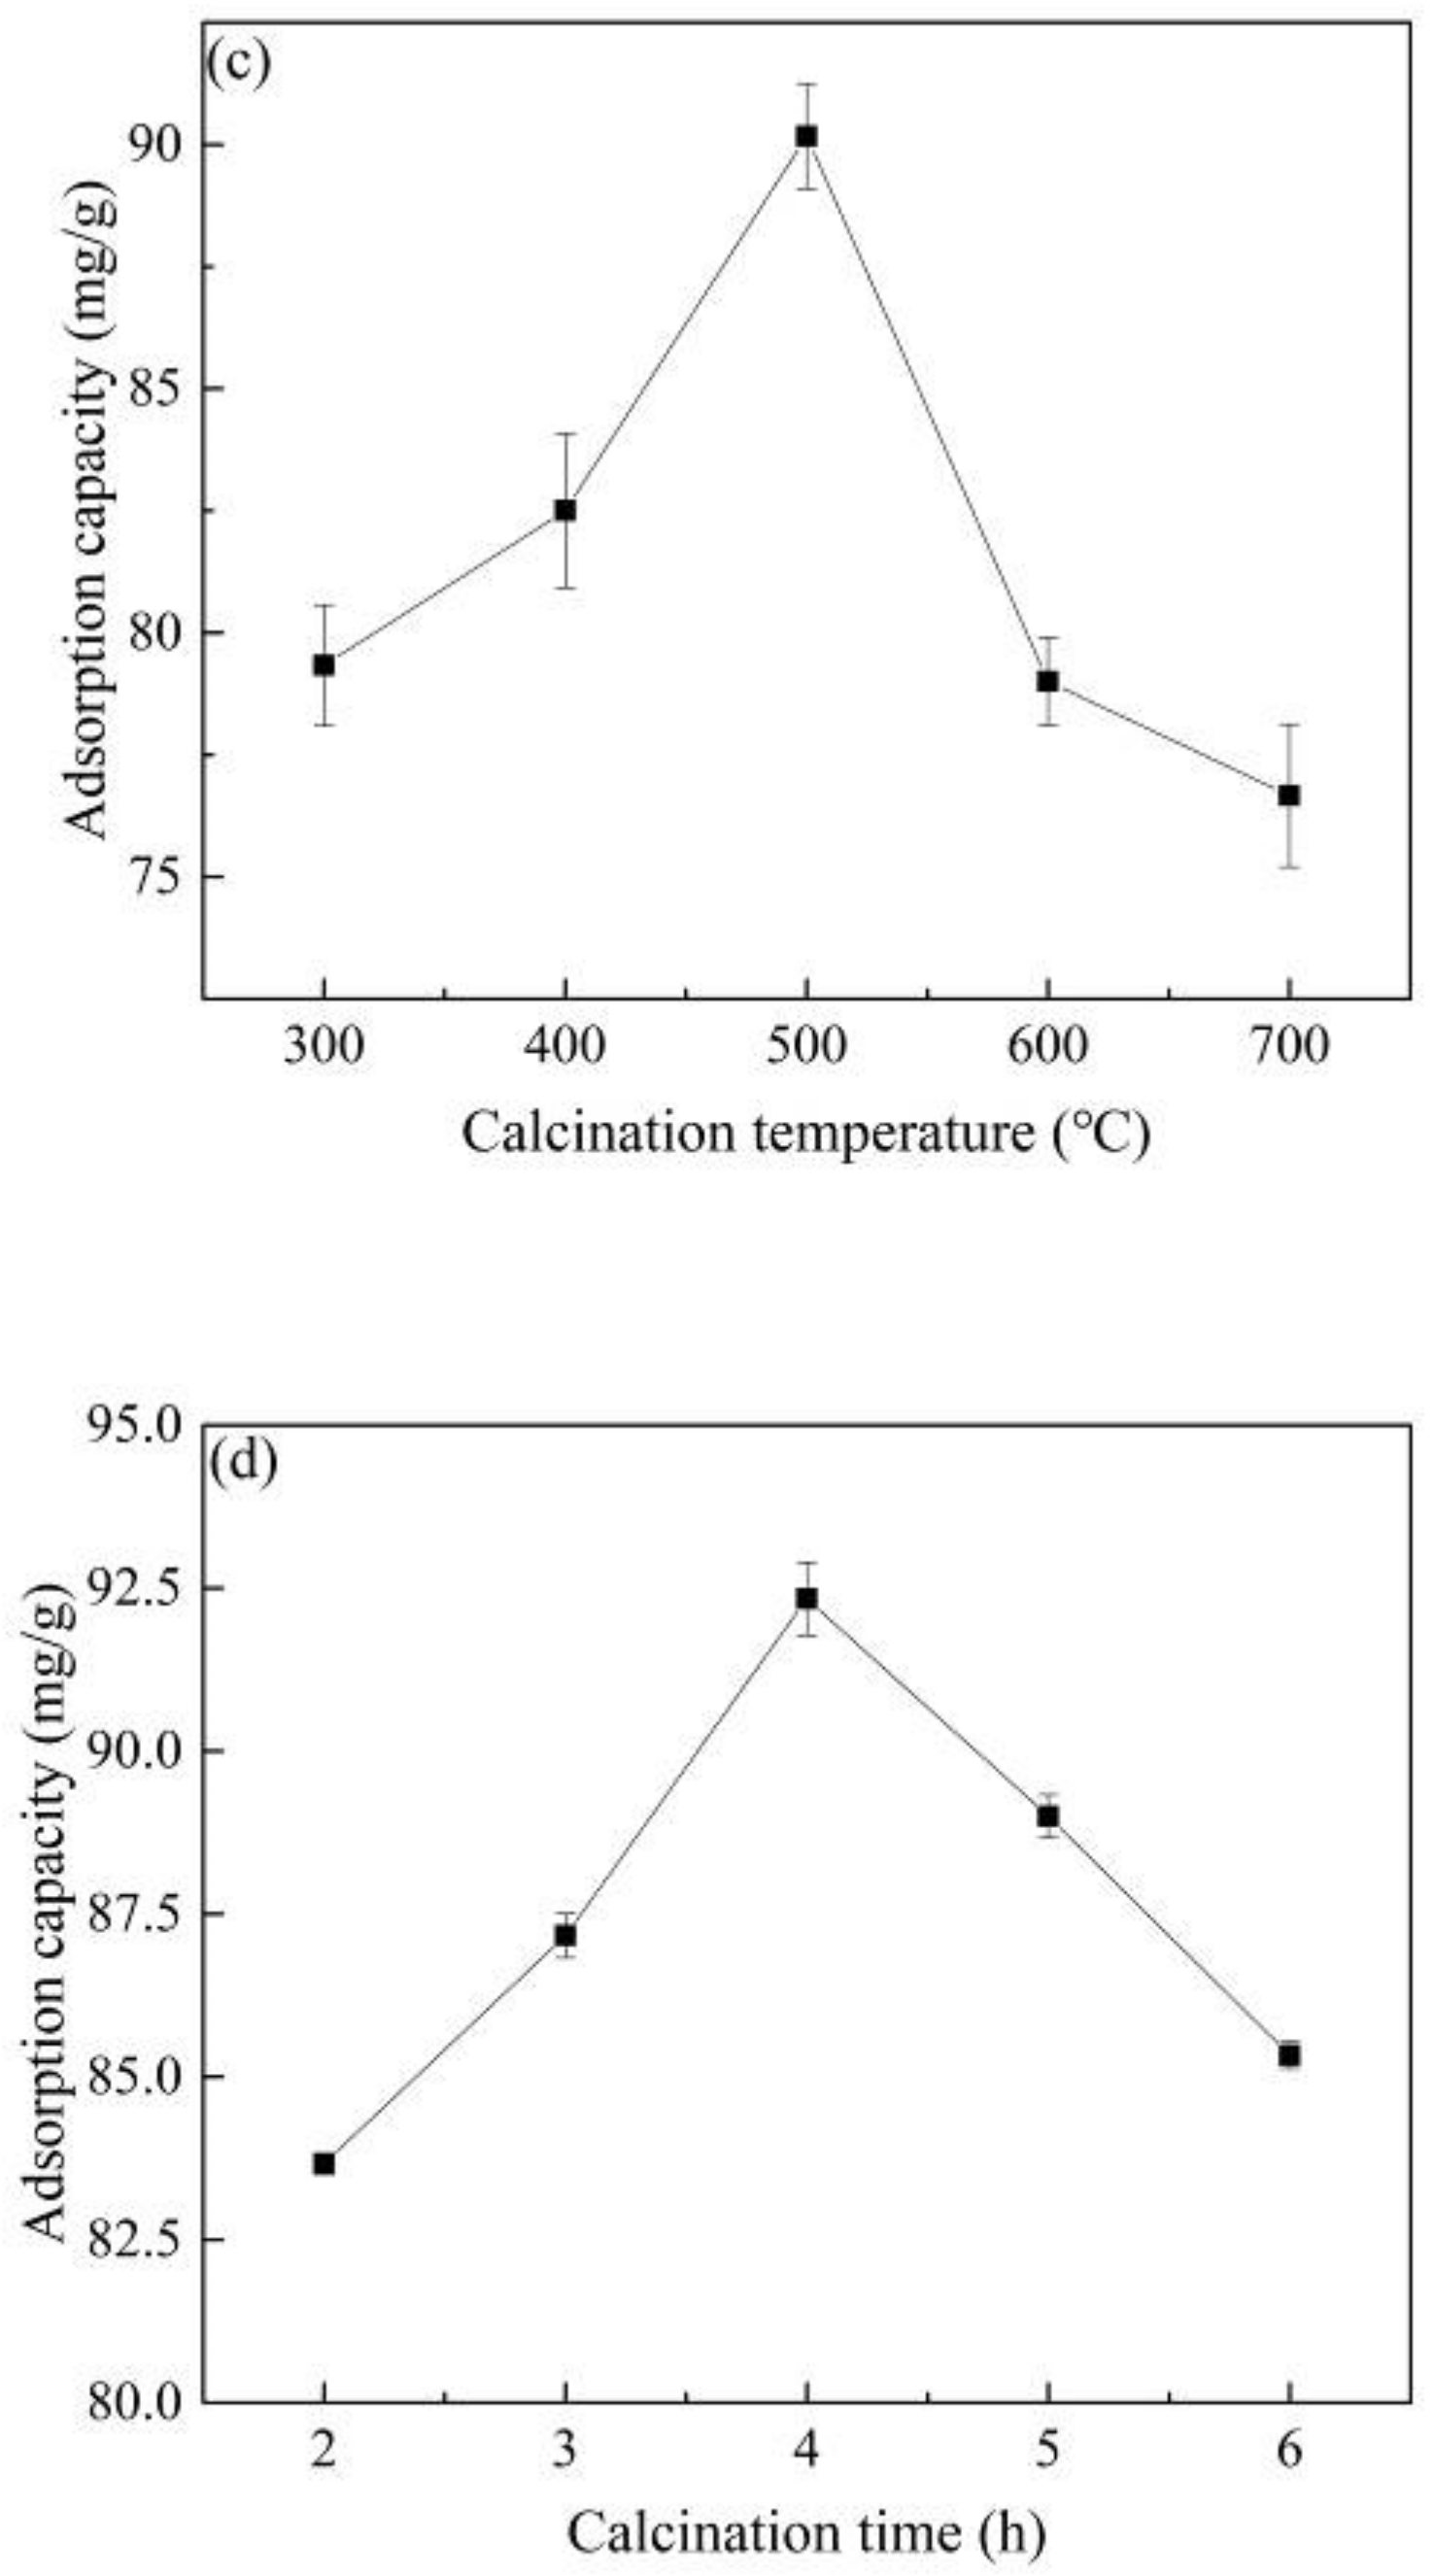
Figure 1c shows that the adsorption capacity of Co@AC for atrazine increased with a rise of the calcination temperature from 300 °C to 500 °C. When the temperature was 500 °C, the adsorption effect of the material was the best and the adsorption capacity reached 90.17 mg/g. As the calcination temperature was further increased, the adsorption capacity of Co@AC gradually decreased. Pontón et al. [33] found that the calcination stage had a great influence on the final shape of materials. When the material was calcined at a lower temperature, the active components such as oxides cannot be completely formed on the material surface, which affected the adsorption effect of the material. Nevertheless, higher calcination temperature would cause the sintering of material and the agglomeration of active components, which reduced the specific surface area of the material so as to affect the adsorption effect [34]. It could be seen that the adsorption capacity decreased when the calcination temperature was higher than 500 °C. Hence a calcination temperature of 500 °C was used as a material preparation factor in the subsequent experiments.
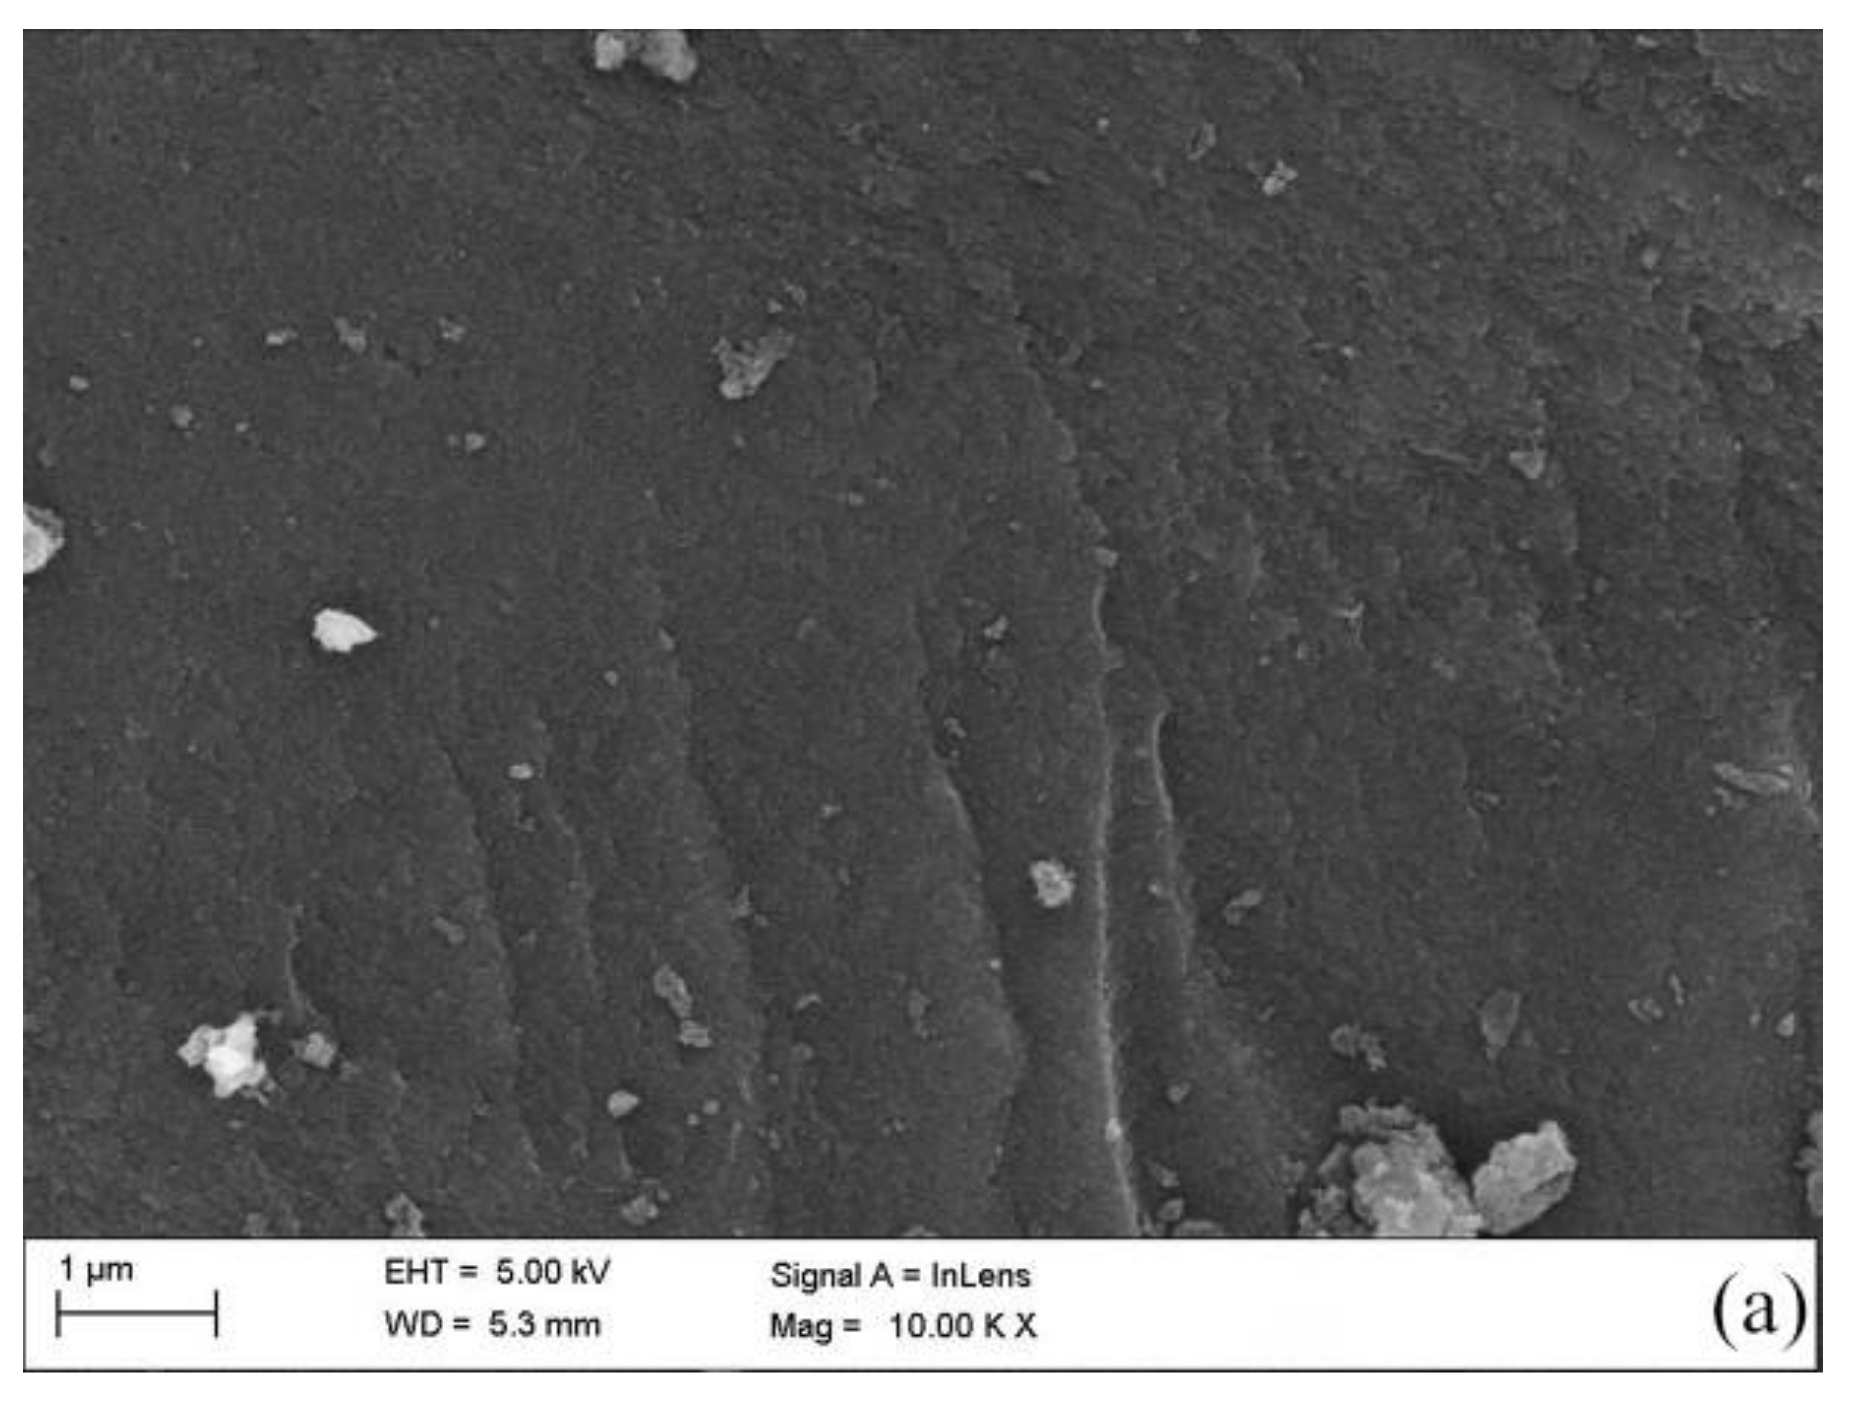
The effect of calcination time on the adsorption capacity of Co@AC for atrazine is shown in Figure 1d. The adsorption capacity increased with the increase in calcination time, and the maximum adsorption capacity was 92.33 mg/g at 4.0 h of calcination time. When the material was calcined in a short time, the material surface could not generate enough oxides active components, which resulted in a decrease in the adsorption effect [35]. As the calcination time increased, the absorption properties of Co@AC were improved, which could also be seen intuitively from the SEM images of Figure 2b,c. However, if the calcination time was too long, it would cause the material to agglomerate and the crystal grains would continue to increase, which led to the decrease in the specific surface area of Co@AC and the adsorption performance for atrazine. This also indicated that as the calcination time was increased from 4.0 to 6.0 h, the adsorption capacity of Co@AC for atrazine decreased from 92.33 to 85.33 mg/g.
From the above experimental results, the optimal preparation conditions of Co@AC were as follows: Co2+ impregnation concentration was 7.0%, immersing time was 7.0 h, calcination temperature was 500 °C and calcination time was 4.0 h. Unless otherwise specified, all subsequent materials in this experiment were prepared by the experimental conditions.
3.2. Characterization
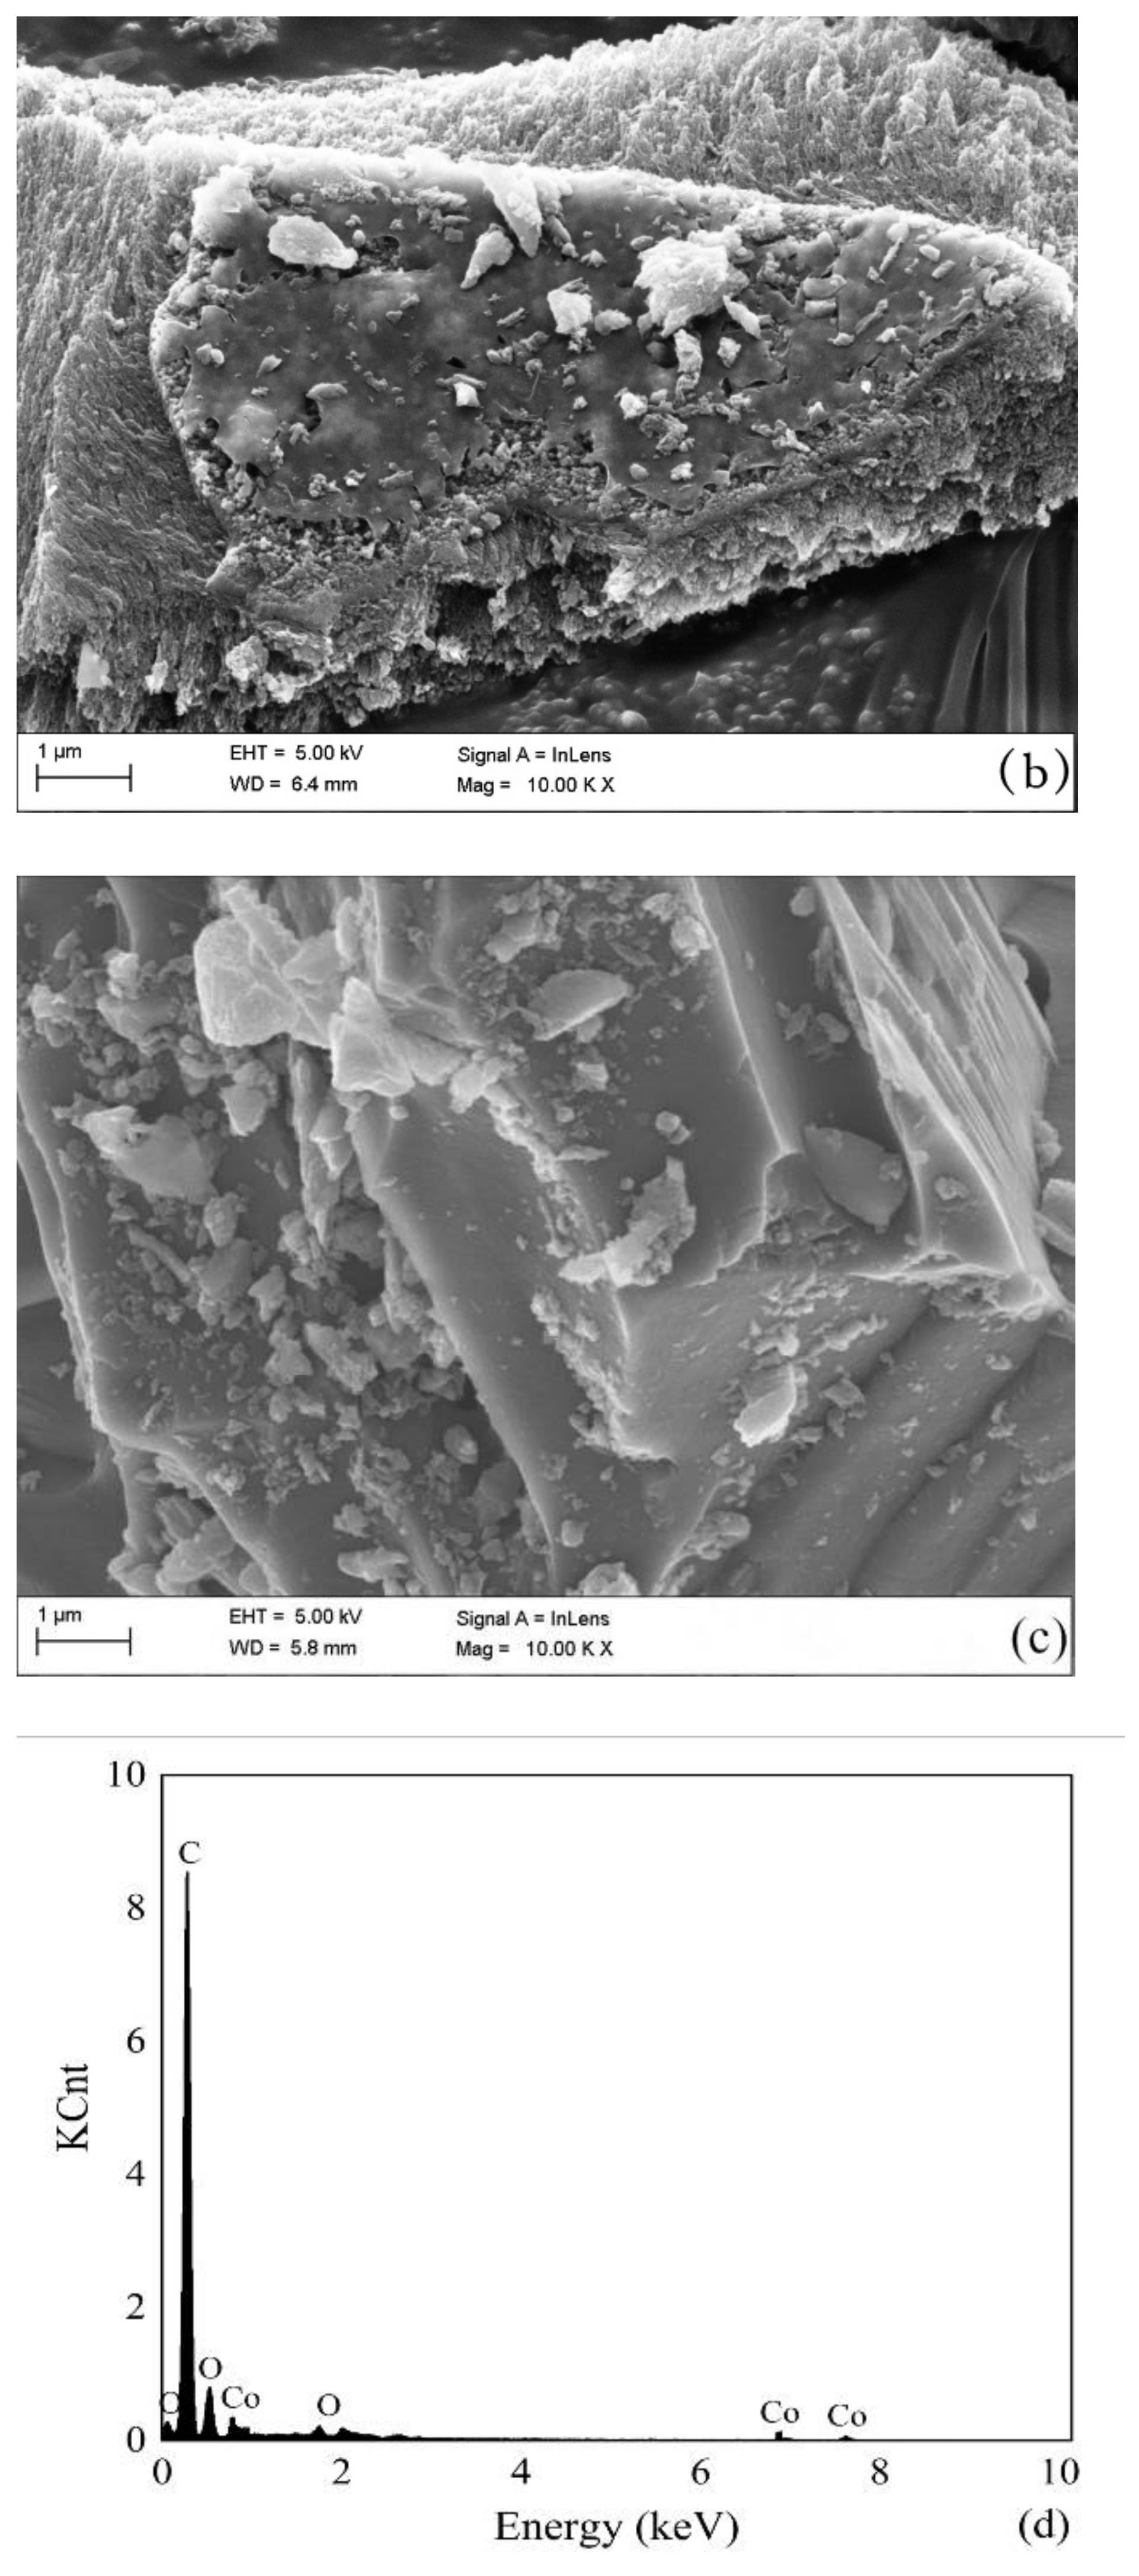
According to the aforementioned experimental results, several representative materials were selected for characterization, the results are shown in Figure 2 and Figure 3. The SEM image illustrated that the surface of the original activated carbon was very smooth and had few attached particles via acid-base pretreatment (Figure 2a). After Co2+ impregnation and high temperature calcination, the surface of the prepared Co@AC became rough and many fine particles were formed (Figure 2b,c). Under different calcination time, the amount of particles generated on the surface of Co@AC had some differences. More fine particles were formed on the surface of Co@AC after 4.0 h of calcination (Figure 2c) compared to 2.0 h of calcination (Figure 2b), because oxides could be formed enough on the surface in a longer period of calcination time. This led to a rougher structure and many active components of Co@AC, which also meant that it possessed a better adsorption effect on atrazine. The characterization was also consistent with the results obtained in Figure 1. Figure 2d was the EDS image of Co@AC after 4.0 h of calcination, it showed that cobalt ions had been successfully loaded onto the activated carbon.
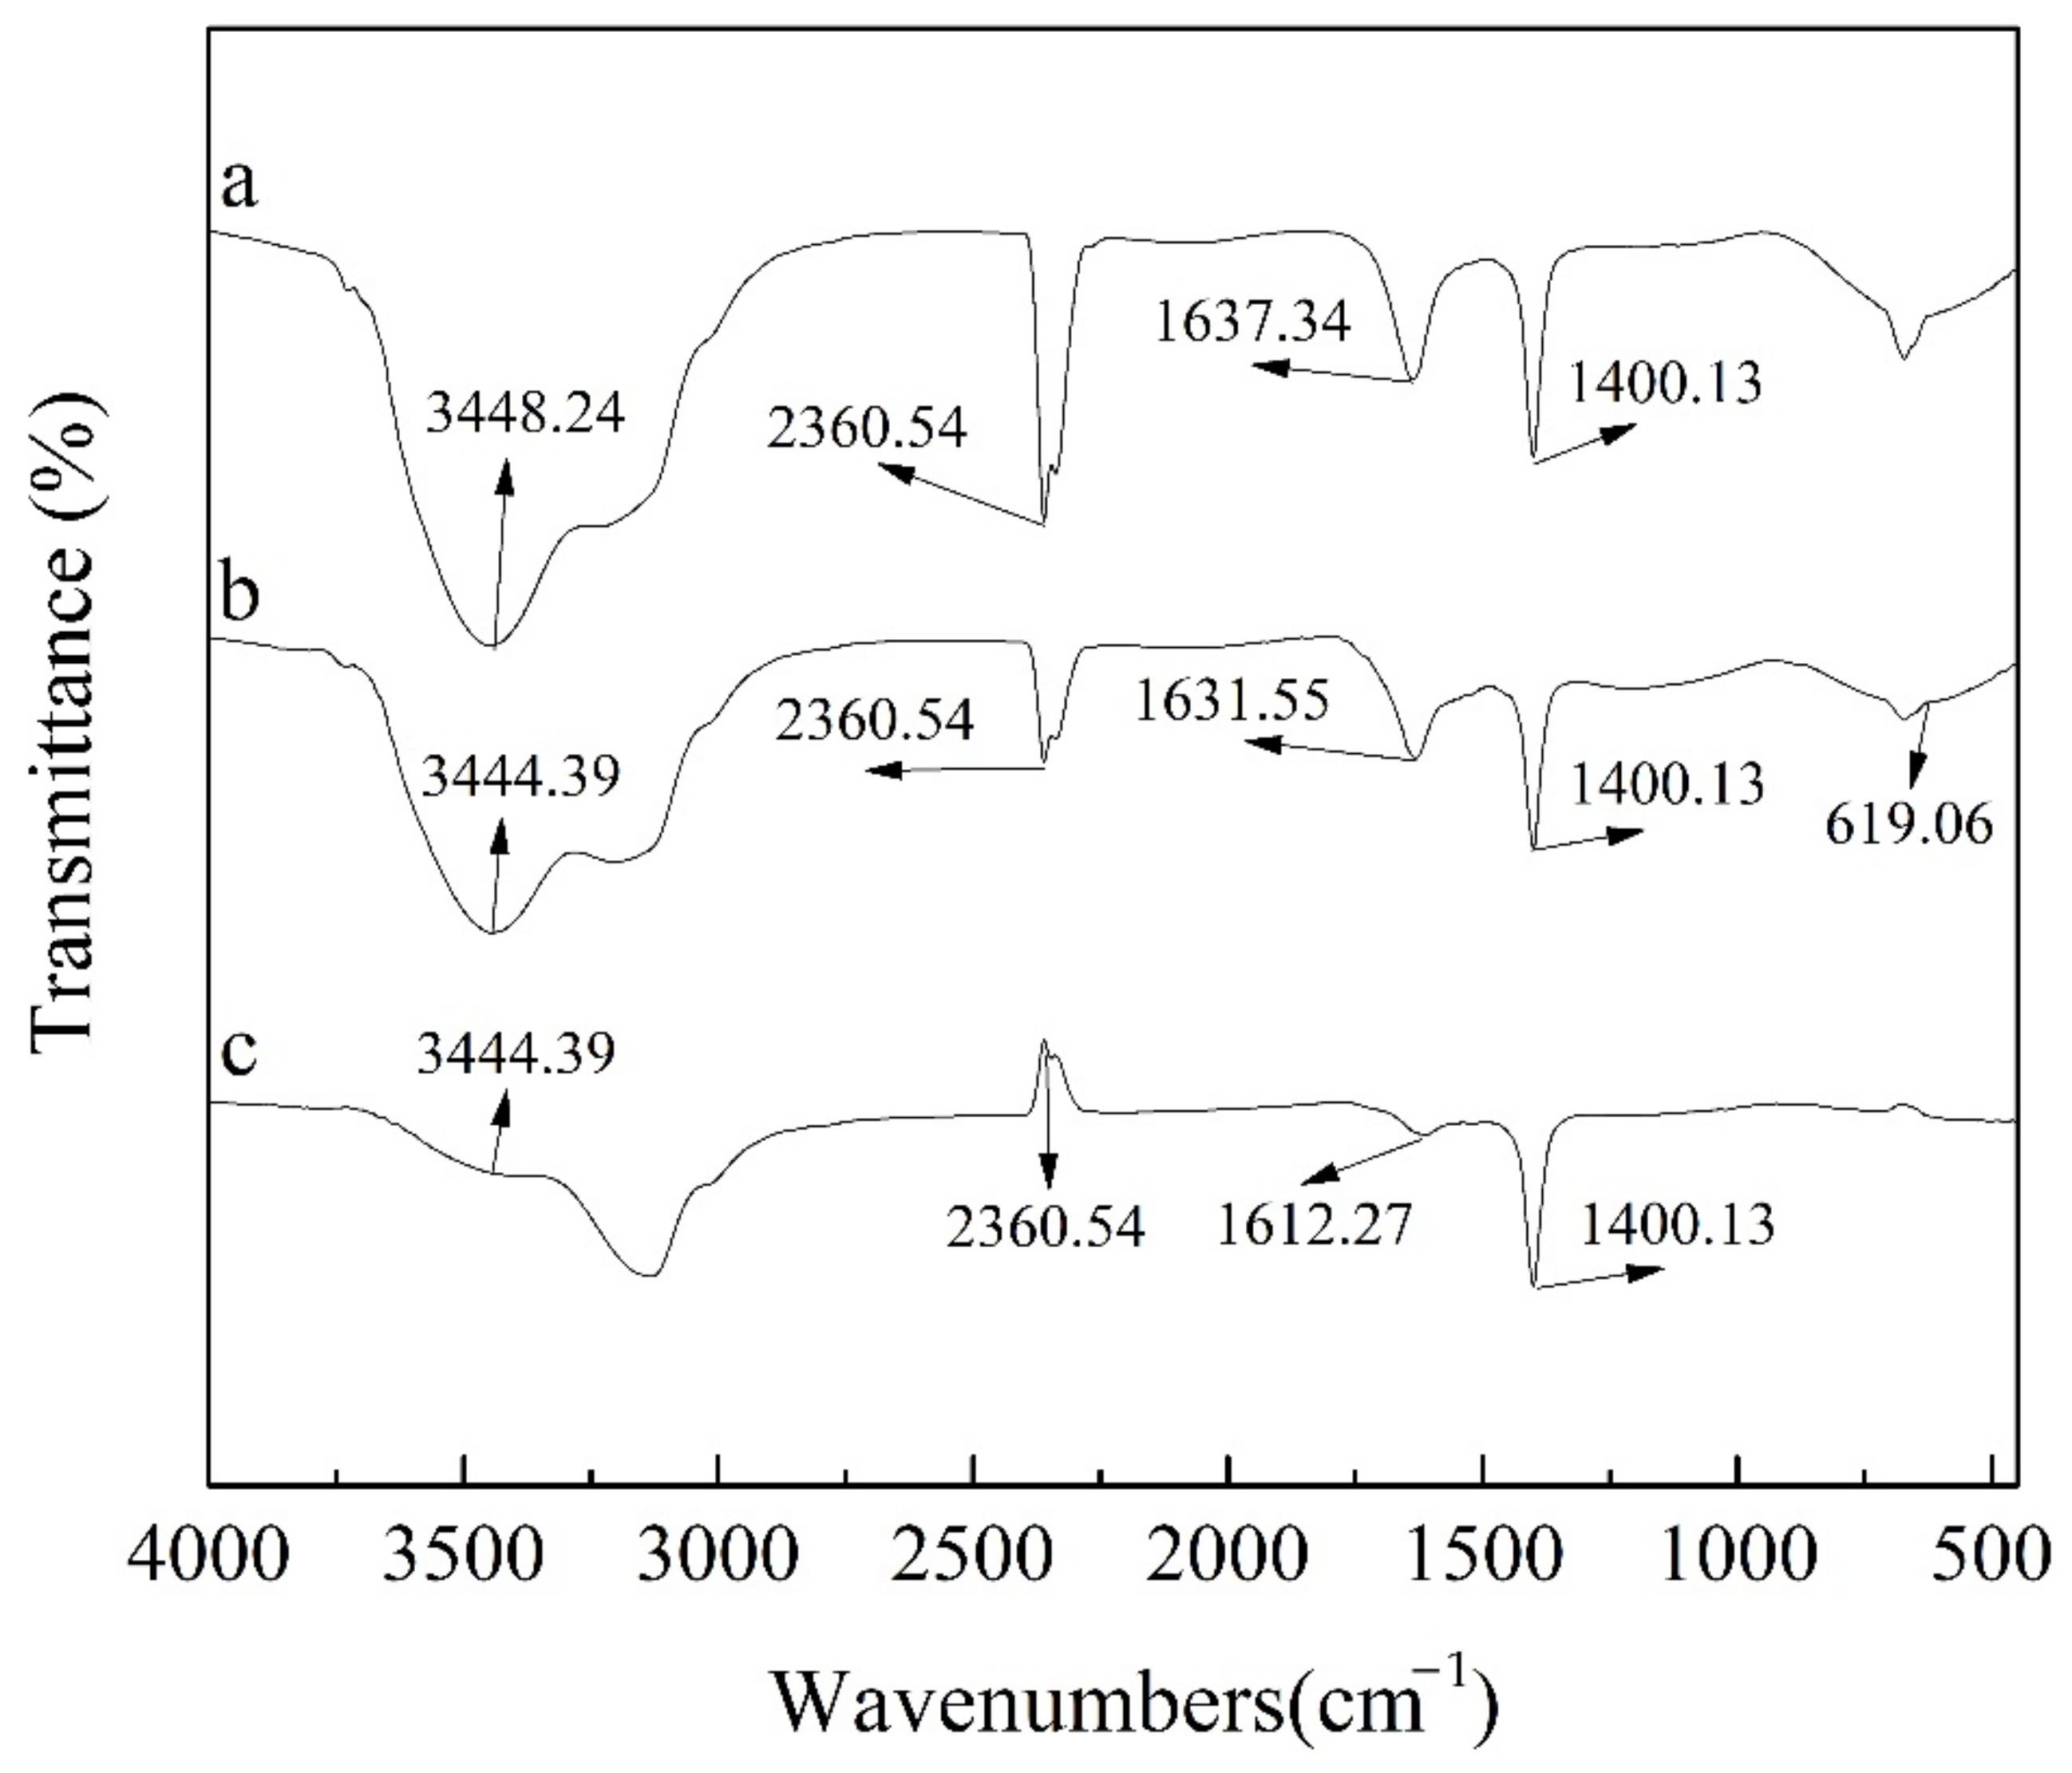
The surface functional groups of activated carbon and Co@AC were detected by FTIR, the results are shown in Figure 3. The peaks of 3448.24 cm−1 and 3444.39 cm−1 corresponded to the H-O-H stretching vibration of water [36], the peak at 2360.54 cm−1 reflected the C=O vibrations of CO2 [37], the peaks of 1637.34 cm−1 and 1631.55 cm−1 corresponded to the stretching vibration of C=C [37], and the peak at 1400.13 cm−1 corresponded to the stretching vibration of C-OH [38]. In Figure 3b, it could be seen that the technology of solution impregnation and high temperature calcination did not change the original functional groups of activated carbon, but only slightly shifted the two peaks of 3448.24 and 1637.34 cm−1. Moreover, a new characteristic peak of 619.06 cm−1 was measured on the surface of Co@AC, which corresponded to the Co3O4 spinel structure [39], indicating that the prepared Co@AC had more active components. Figure 3c was the FTIR image of Co@AC after adsorption reaction. Compared with the unreacted Co@AC, the characteristic peak of Co@AC at 619.06 cm−1 was not obvious after the reaction. The reason could be that atrazine adsorbed on the surface of Co@AC concealed the group, indicating that the functional group participated in the adsorption process. The result was also consistent with the high adsorption capacity of Co@AC for atrazine shown in Figure 1.
3.3. Influence of Reaction Conditions on the Atrazine Removal
In order to comprehensively evaluate the removal effect of atrazine by Co@AC, four experimental factors including solution pH, reaction time, reaction temperature and material dosage were studied. Before the optimal parameters were determined by the experiments, the assumed values of solution pH, reaction time, reaction temperature and material dosage were 6.0, 180 min, 25 °C and 60 mg/L, respectively.
The pH value significantly influenced the adsorption effect of Co@AC on atrazine (Figure 4a). When the pH increased from 2.0 to 4.0, the adsorption capacity of the material for atrazine rapidly increased from 78.62 to 93.28 mg/g, and reached a peak when the pH was 4.0. When the pH further increased, the adsorption capacity of Co@AC gradually decreased, and its adsorption capacity dropped to 71.82 mg/g when the pH was 10.0. The previous bibliography has shown that atrazine was charged negatively in water [5], so when the solution pH value was acidic (such as 4.0 ≤ pH < 7.0), the H+ in the solution could be adsorbed on the surface of Co@AC to form positively charged functional groups on the material surface. At this time, it was easy to chemically adsorb with the negatively charged atrazine in the solution, so the adsorption effect of Co@AC was enhanced [40]. When the solution pH value was strongly acidic (such as pH = 2.0, 3.0), a large amount of H+ in the solution could neutralize the negatively charged atrazine, which reduced the overall negative charges of atrazine or even caused a change to positive charges, resulting in the electrostatic repulsion between atrazine and Co@AC, so as to decrease the adsorption effect [41]. When the solution pH value was alkaline, a large amount of OH− in solution could change the surface of Co@AC to negative charge, leading to electrostatic repulsion between Co@AC and atrazine, and reduced adsorption capacity of the material.
Figure 4b shows the influence of reaction time on the adsorption capacity of Co@AC for atrazine. As the reaction time increased, the adsorption capacity of Co@AC for atrazine continued to increase, and reached the adsorption equilibrium at 90 min. The adsorption capacity at this time was 92.95 mg/g. In the first 20 min of the reaction, the adsorption capacity increased rapidly. The reason may be that the adsorption of atrazine by Co@AC was a rapid reaction process, and the most available adsorption sites on the surface of Co@AC were quickly utilized [42]. As the reaction time further increased, the number of adsorption sites on the Co@AC surface decreased, which decelerated the removal effect of atrazine and finally reached the adsorption equilibrium after 90 min reaction.
During the same reaction time, the adsorption capacity of Co@AC for atrazine gradually increased as the reaction temperature rose from 25 °C to 45 °C (Figure 4c). This indicated that the adsorption process was endothermic. A high temperature could promote the molecular motion of atrazine in water and improve the contact between atrazine and Co@AC, resulting in an increased reaction rate.
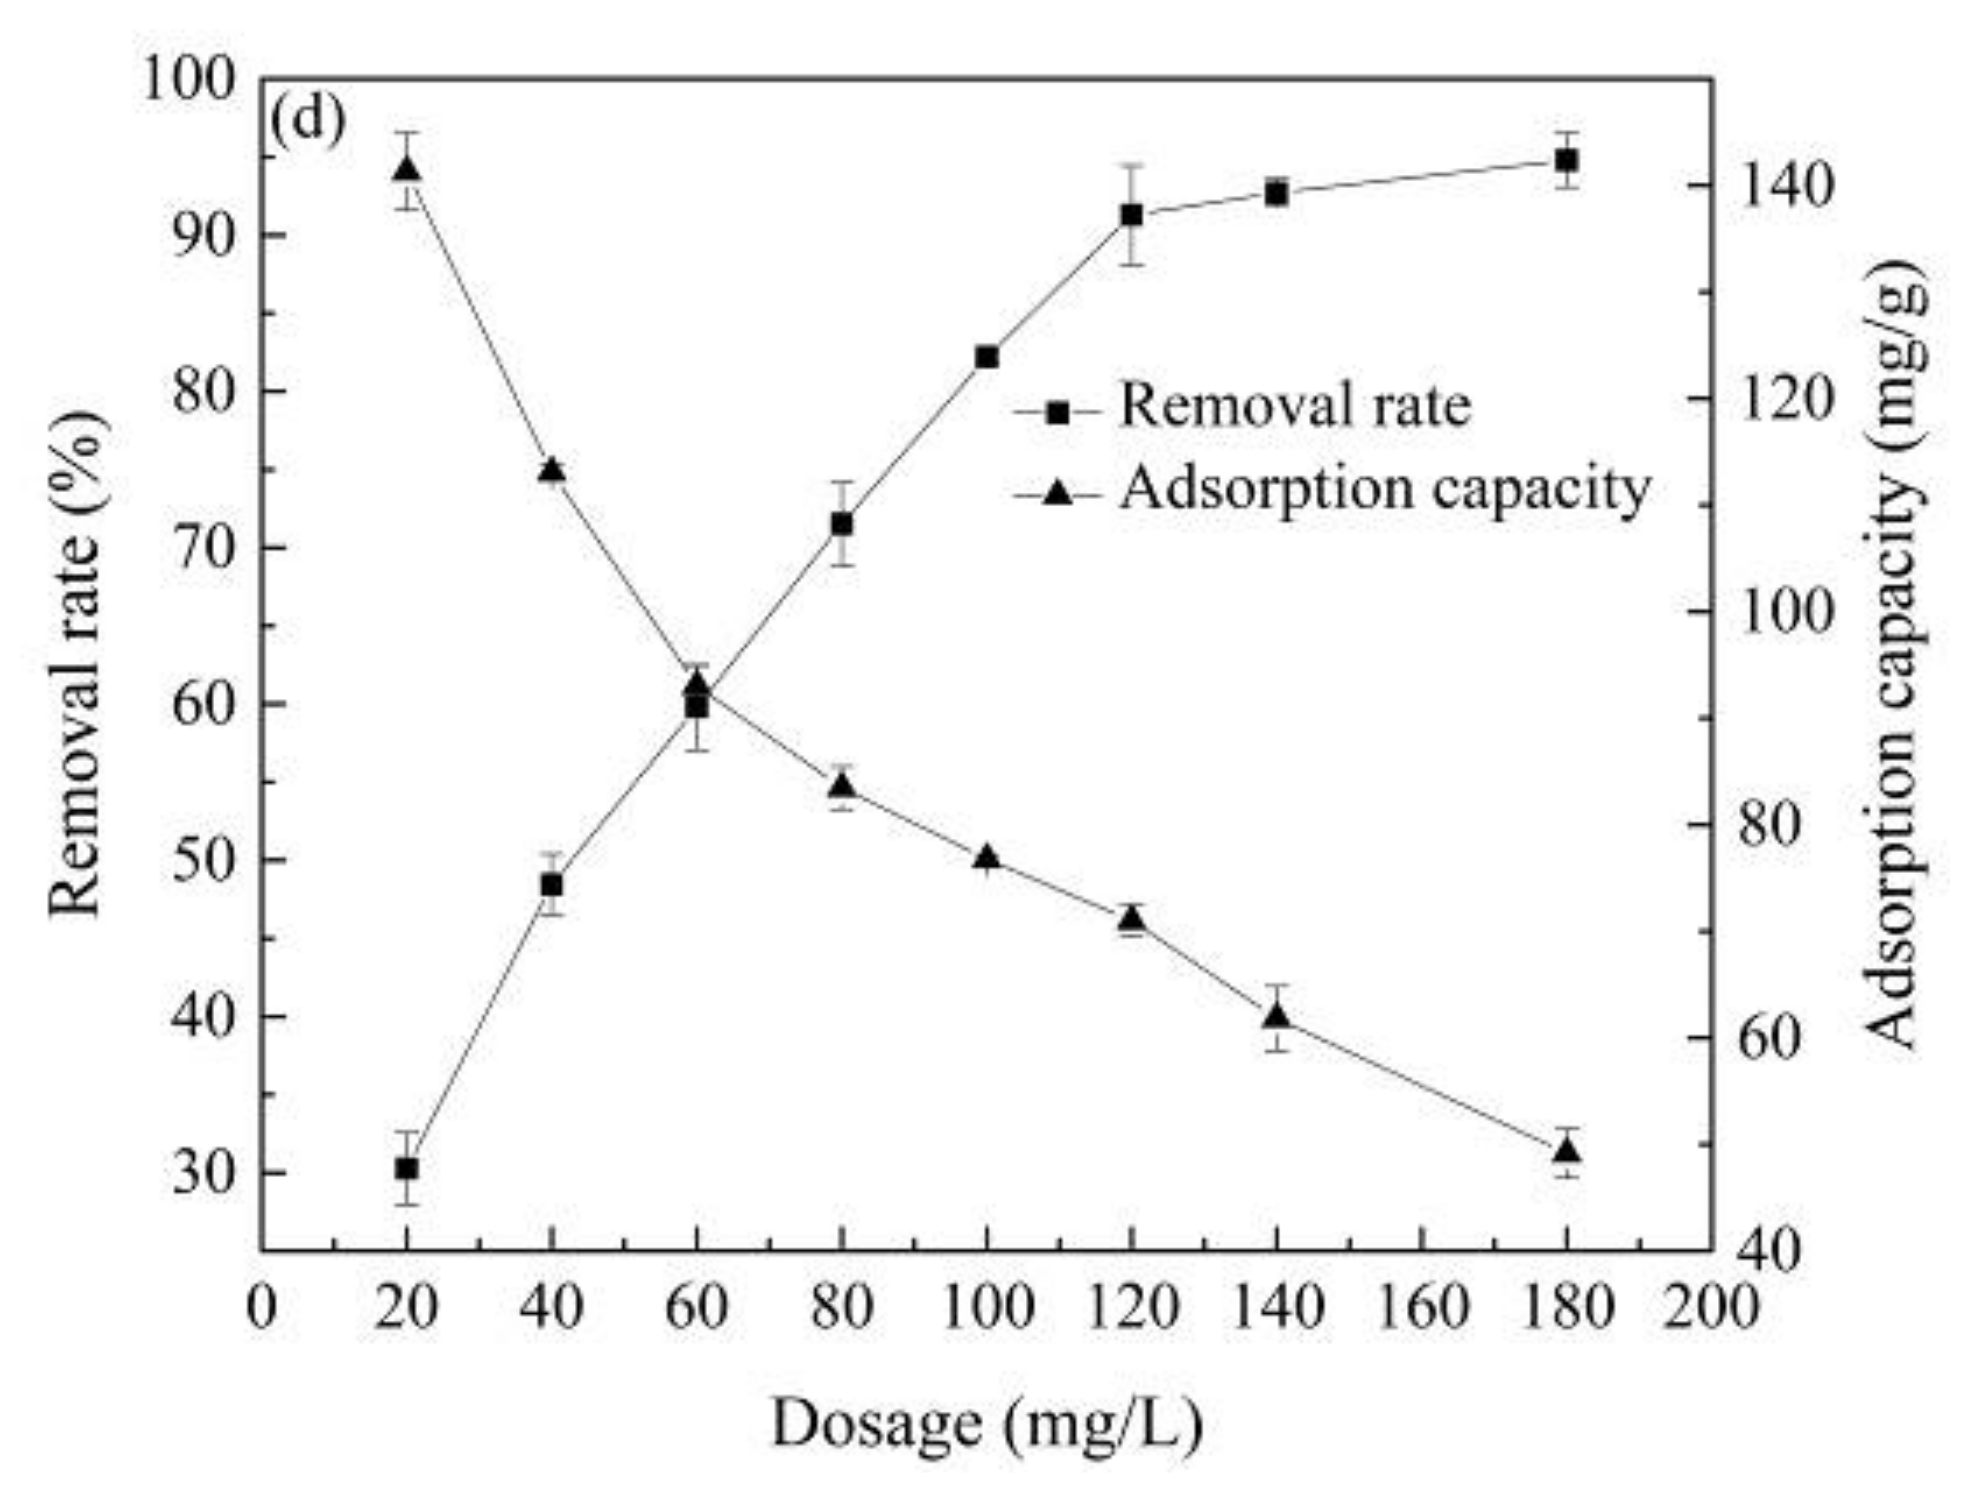
Figure 4d shows that having a dosage of Co@AC of only 20 mg/L, the removal rate of atrazine by Co@AC was 30.27%. With the increase in the material dosage, the removal rate of atrazine gradually increased. The removal rate of atrazine by Co@AC reached 91.28% at a dosage of 120 mg/L. When the dosage was further increased to 180 mg/L, the removal rate of atrazine only increased by 3.51%. Contrary to the removal rate, the adsorption capacity of Co@AC for atrazine gradually decreased with the increase in the material dosage. When the dosage of Co@AC was 20 mg/L, the adsorption capacity of Co@AC for atrazine was 141.3 mg/g; however, the adsorption capacity of Co@AC was only 49.17 mg/g when the dosage increased to 180 mg/L. The reason for the above results was that with the increase in the material dosage, the surface area and active adsorption sites of the adsorbent increased, which led to a high removal efficiency [43]. The change trend of adsorption capacity was opposite to the removal efficiency because all the adsorbent participated in the adsorption reaction. When there was only a small amount of adsorbent in the solution, the adsorption capacity was high. As the dosage increased, some adsorption sites and pore structures of adsorbent could not effectively participate in the adsorption process, resulting in a reduction in the material’s removal effect [44].
Regarding the above adsorption experiments, when the solution pH value was 4.0, the dosage of Co@AC was 60 mg/L and the reaction temperature was 25 °C, after 90 min of reaction, the adsorption capacity of Co@AC for atrazine was greatest and reached 92.95 mg/g.
3.4. Adsorption Kinetics
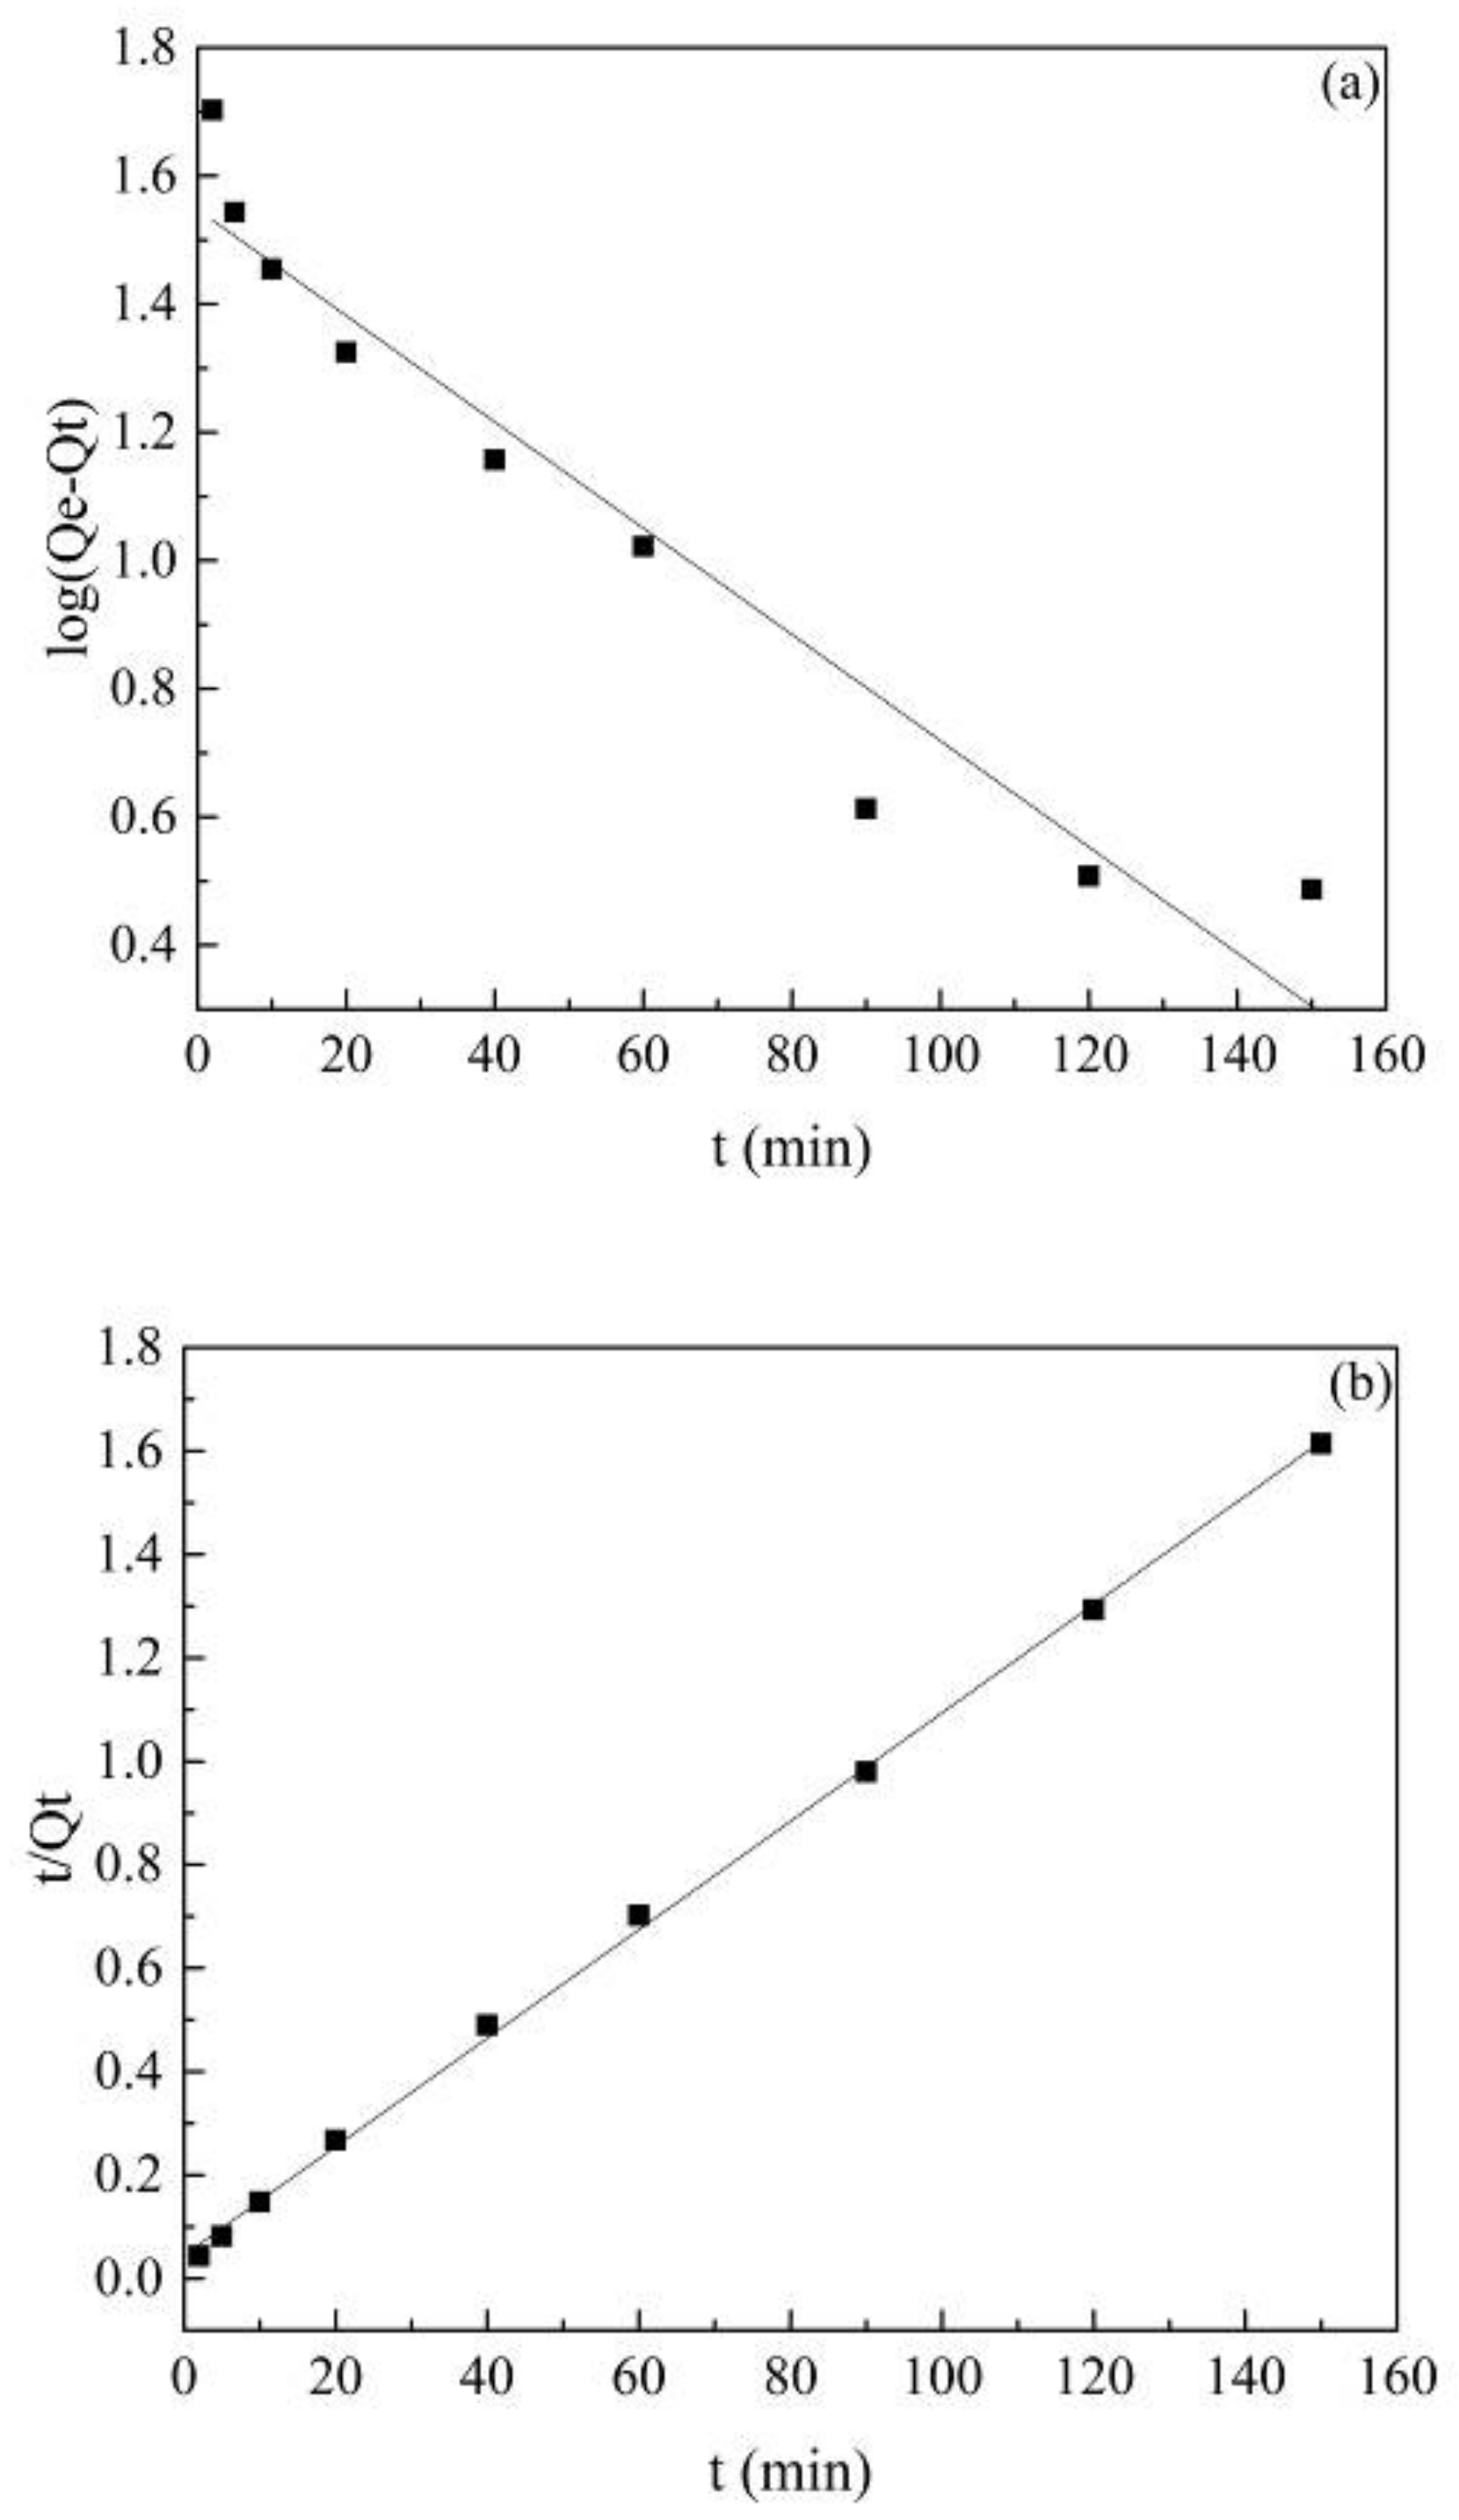
In order to well explain the adsorption kinetics of atrazine by Co@AC, Lagergren’s pseudo-first-order kinetics model and pseudo-second-order kinetics model were used to illuminate the adsorption process [45]. The pseudo-first-order kinetic model is described as being that the adsorption is controlled by the diffusion step when adsorbates migrate from the solution to the surface of the adsorbent, while the pseudo-second-order kinetic model is based on the control of adsorption by chemical adsorption. The linear equations of the pseudo-first-order kinetic Equation (3) and the pseudo-second-order kinetic Equation (4) can be stated as [46].
where t (min) denotes the reaction time, Qt (mg/g) the adsorption capacity at time t, k1 the pseudo-first-order adsorption rate constant and k2 the pseudo-second-order adsorption rate constant.
The fitting results of the two kinetic models are shown in Figure 5. The relevant constants were calculated by the kinetic models, listed in Table 1. Theoretically, if the adsorption process can be explained by a certain adsorption model, the data of the adsorption experiments should be distributed on a straight line, and the correlation coefficient (R2) of the straight line should be close to 1.000 [47]. Obviously, the correlation coefficient (R2) of the pseudo-second-order kinetic model was 0.999, which was higher than the correlation coefficient of the pseudo-first-order kinetic model (R2 = 0.927). The theoretical adsorption capacity Qcal (Qcal = 95.42 mg/g) calculated by the pseudo-second-order kinetic model was closer to the experimental value, indicating that the adsorption process was a good fit with the pseudo-second-order kinetic model and the adsorption of atrazine by Co@AC was mainly chemical adsorption [28].
3.5. Adsorption Isotherms
In this study, the Langmuir isotherm and the Freundlich isotherm were used to describe the equilibrium relationship of atrazine adsorbed by Co@AC. Due to the principle of the Langmuir equation is assumed that the adsorption is single-layer adsorption, and the adsorbate is uniformly adsorbed on the surface of the adsorbent [48]. The Freundlich equation considers that adsorption happens on a multi-molecular layer, accompanied by the interaction between adsorbate molecules [49].
The linearization form of the Langmuir equation can be stated as [50]:
The linearization form of the Freundlich equation can be stated as [44]:
where Ce (mg/L) denotes the concentration of atrazine at adsorption equilibrium, Qe (mg/g) the adsorption capacity at adsorption equilibrium, Qmax (mg/g) the saturated adsorption capacity, KL (L/mg) the affinity constant of the Langmuir equation, Kf ((mg/g)/(mg/L)n) and n (g/L) the constants of the Freundlich equation.
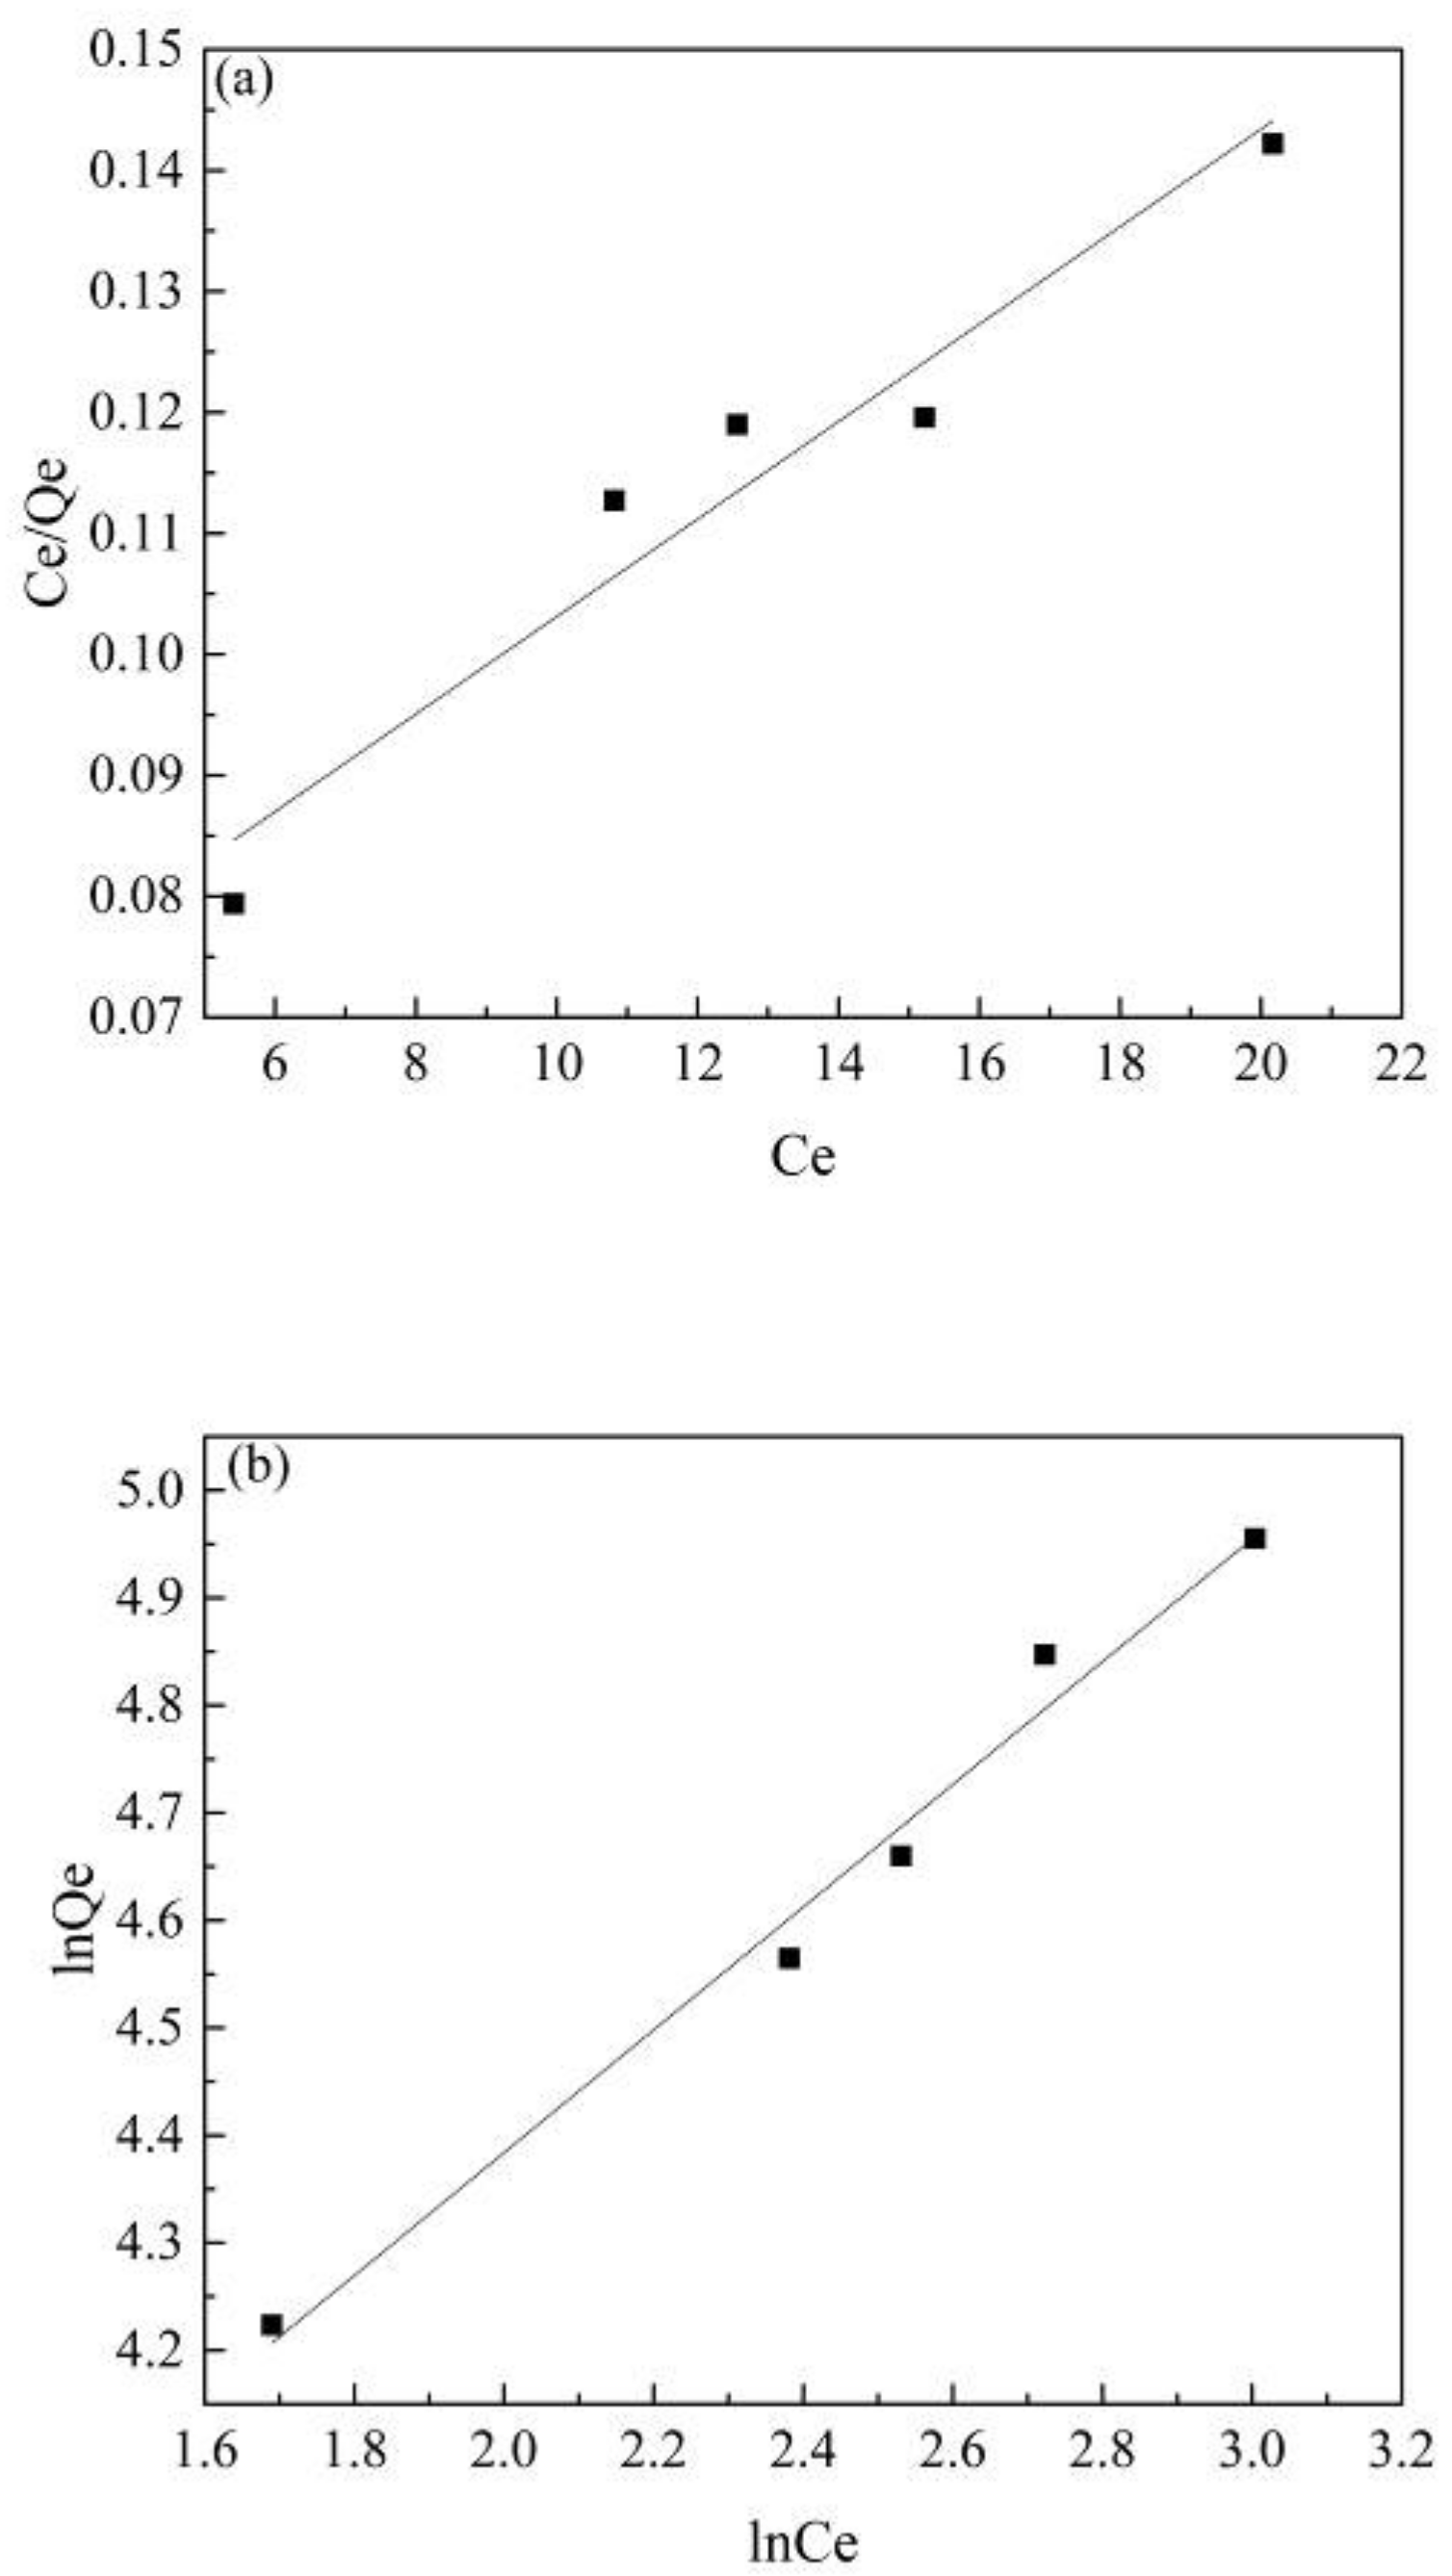
The fitting results of the two adsorption isotherms in this experiment are shown in Figure 6. The correlation constants of the two adsorption isotherms are shown in Table 2. The results show that the Freundlich isotherm (R2 = 0.98) had a better accuracy and a better fitting effect than the Langmuir isotherm (R2 = 0.92), which illustrated that the surface and energy distribution of Co@AC was uneven and its adsorption of atrazine happened on a multi-molecular layer [51].
From the study of the adsorption kinetics and the adsorption isotherms, it showed that the adsorption of atrazine onto the prepared Co@AC had the dual effects of chemical adsorption and multi-molecular layer adsorption.
3.6. Cycle Experiments
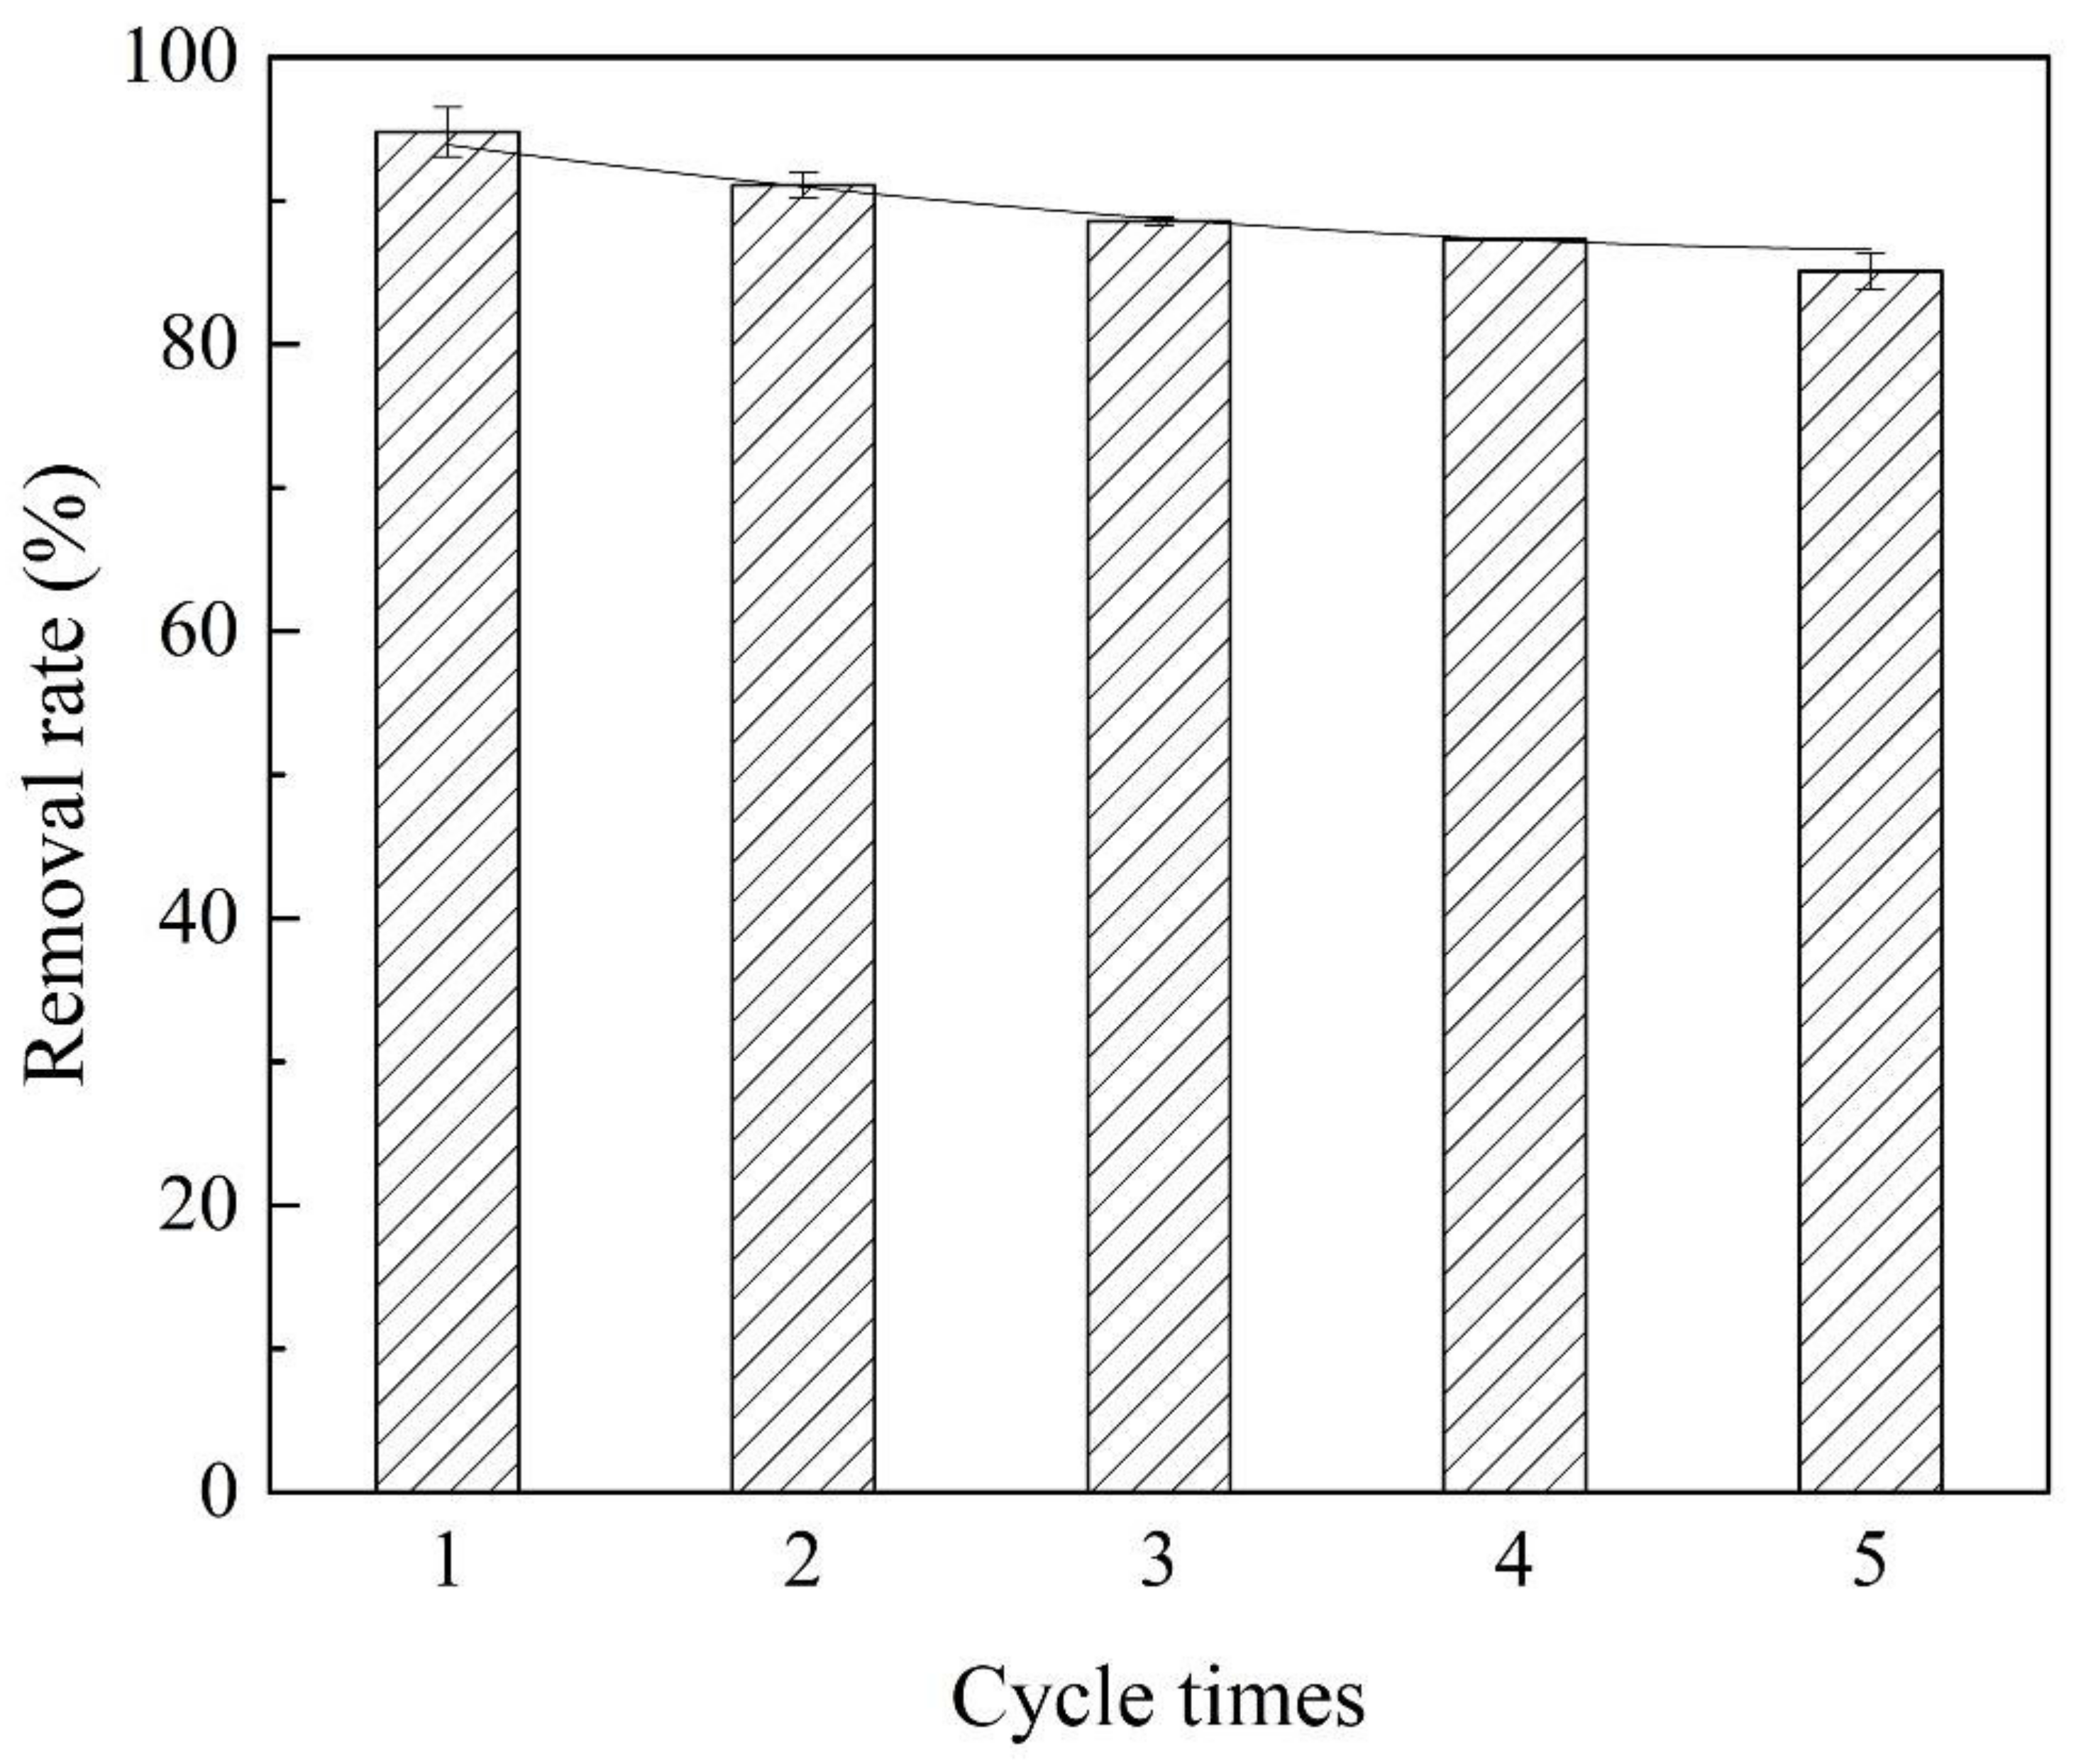
In the usage of materials, the service life and recyclability rate of materials are very important to reduce the practical cost. From Figure 7, it can be seen that after five cycle experiments, the removal efficiency of atrazine by the prepared Co@AC remained above 85%, indicating that the prepared material possessed robust qualities by the technology of solution impregnation and high temperature calcination. The prepared Co@AC is a promising renewable material in water pollution control.
4. Conclusions
In this study, cobalt ions were successfully loaded onto activated carbon using the technology of solution impregnation and high temperature calcination, when the optimal preparation conditions of Co@AC were as follows: Co2+ impregnation concentration was 7.0%, immersing time was 7.0 h, calcination temperature was 500 °C and calcination time was 4.0 h. From the characterization by SEM, EDS and FTIR, it showed that the prepared Co@AC had a rougher structure and many active components. In the removal experiment of atrazine from water, it was found that when the solution pH was 4.0, the material dosage was 60 mg/L and the reaction temperature was 25 °C, after 90 min of reaction, the adsorption capacity of Co@AC for atrazine was best, reached to 92.95 mg/g. The maximum removal rate was 94.79%. Compared to the Langmuir isotherm model, the Freundlich isotherm model was more suitable for simulating the adsorption process. The adsorption kinetics showed that the pseudo-second-order kinetic model fitted the experimental data well and had a higher correlation coefficient (R2 = 0.999). This indicated that the adsorption of atrazine by Co@AC had the dual effects of multi-molecular layer adsorption and chemical adsorption. Cycle experiments showed that the prepared Co@AC possessed robust qualities and is a promising material that could be used repeatedly. All the experiments were performed in standard solutions, and further experiments in real matrixes remain necessary to assess the potential of the material.
Author Contributions
Y.L., H.H. and J.Z. conceived the concept and experiments. Y.L. and D.L. carried out the materials synthesis and characterizations. J.L., D.W. and L.H. analyzed the results. Y.L., D.L. and H.H. co-wrote the paper, J.Z. and Z.T. revised the paper. All authors have read and agreed to the published version of the manuscript.
Funding
This research was supported by the Innovation Project of Guangxi Graduate Education (Grant No.: YCSW2020172), the Guangxi Science & Technology Planning Project (Grant No.: Guike-AD19110105, Guike-AD19245065, 2018GXNSFBA050001), the National Natural Science Foundation of China (Grant No.: 51638006, 41807367), and the Scientific Research Staring Foundation of Guilin University of Technology (Grant No.: GUTQDJJ2017072).
Institutional Review Board Statement
Not applicable.
Informed Consent Statement
Not applicable.
Data Availability Statement
The data presented in this study are available on request from the corresponding author. The data are not publicly available due to the raw/processed data required to reproduce these findings cannot be shared at this time as the data also forms part of an ongoing study.
Conflicts of Interest
The authors declare no conflict of interest.
References
- Zhu, C.Y.; Yang, W.L.; He, H.J.; Yang, C.P.; Yu, J.P.; Wu, X.; Zeng, G.M.; Tarre, S.; Green, M. Preparation, performances and mechanisms of magnetic Saccharomyces cerevisiae bionanocomposites for atrazine removal. Chemosphere 2018, 200, 380–387. [Google Scholar] [CrossRef] [PubMed]
- Wu, S.H.; He, H.J.; Li, X.; Yang, C.P.; Zeng, G.M.; Wu, B.; He, S.Y.; Lu, L. Insights into atrazine degradation by persulfate activation using composite of nanoscale zero-valent iron and graphene: Performances and mechanisms. Chem. Eng. J. 2018, 341, 126–136. [Google Scholar] [CrossRef]
- Sanchez, V.; Lopez-Bellido, F.J.; Canizares, P.; Rodriguez, L. Assessing the phytoremediation potential of crop and grass plants for atrazine-spiked soils. Chemosphere 2017, 185, 119–126. [Google Scholar] [CrossRef] [PubMed] [Green Version]
- Zhang, C.; Qin, L.; Dou, D.C.; Li, X.N.; Ge, J.; Li, J.L. Atrazine induced oxidative stress and mitochondrial dysfunction in quail (Coturnix C.coturnix) kidney via modulating Nrf2 signaling pathway. Chemosphere 2018, 212, 974–982. [Google Scholar] [CrossRef] [PubMed]
- Sun, S.W.; He, H.J.; Yang, C.P.; Cheng, Y.; Liu, Y.P. Effects of Ca2+ and fulvic acids on atrazine degradation by nano-TiO2: Performances and mechanisms. Sci. Rep. 2019, 9, 11. [Google Scholar] [CrossRef] [Green Version]
- Shamsedini, N.; Dehghani, M.; Nasseri, S.; Baghapour, M.A. Photocatalytic degradation of atrazine herbicide with Illuminated Fe+3-TiO2 Nanoparticles. J. Environ. Health Sci. 2017, 15, 10. [Google Scholar] [CrossRef] [Green Version]
- Wirbisky-Hershberger, S.E.; Sanchez, O.F.; Horzmann, K.A.; Thanki, D.; Yuan, C.L.; Freeman, J.L. Atrazine exposure decreases the activity of DNMTs, global DNA methylation levels, and dnmt expression. Food Chem. Toxicol. 2017, 109, 727–734. [Google Scholar] [CrossRef]
- Yilmaz, E.; Ozgur, E.; Bereli, N.; Turkmen, D.; Denizli, A. Plastic antibody based surface plasmon resonance nanosensors for selective atrazine detection. Mat. Sci. Eng. C-Mater. 2017, 73, 603–610. [Google Scholar] [CrossRef]
- Cleary, J.A.; Tillitt, D.E.; vom Saal, F.S.; Nicks, D.K.; Claunch, R.A.; Bhandari, R.K. Atrazine induced transgenerational reproductive effects in medaka (Oryzias latipes). Environ. Pollut. 2019, 251, 639–650. [Google Scholar] [CrossRef]
- Yue, L.; Ge, C.J.; Feng, D.; Yu, H.M.; Deng, H.; Fu, B.M. Adsorption–desorption behavior of atrazine on agricultural soils in China. J. Environ. Sci. 2017, 57, 180–189. [Google Scholar] [CrossRef]
- Lin, Z.; Zhen, Z.; Liang, Y.Q.; Li, J.; Yang, J.W.; Zhong, L.Y.; Zhao, L.R.; Li, Y.T.; Luo, C.L.; Ren, L.; et al. Changes in atrazine speciation and the degradation pathway in red soil during the vermiremediation process. J. Hazard. Mater. 2019, 364, 710–719. [Google Scholar] [CrossRef] [PubMed]
- Fan, X.X.; Song, F.Q. Bioremediation of atrazine: Recent advances and promises. J. Soil Sediments 2014, 14, 1727–1737. [Google Scholar] [CrossRef]
- Vieira, L.A.J.; Alves, R.D.F.B.; Menezes-Silva, P.E.; Mendonça, M.A.C.; Silva, M.L.F.; Silva, M.C.A.P.; Sousa, L.F.; Loram-Lourenço, L.; Alves da Silva, A.; Costa, A.C.; et al. Water contamination with atrazine: Is nitric oxide able to improve Pistia stratiotes phytoremediation capacity? Environ. Pollut. 2020, 115971. [Google Scholar] [CrossRef] [PubMed]
- Xing, H.J.; Wang, Z.L.; Gao, X.J.; Chen, D.C.; Wang, L.L.; Li, S.; Xu, S.W. Atrazine and chlorpyrifos exposure induces liver autophagic response in common carp. Ecotoxicol. Environ. Saf. 2015, 113, 52–58. [Google Scholar] [CrossRef] [PubMed]
- Bohn, T.; Cocco, E.; Gourdol, L.; Guignard, C.; Hoffmann, L. Determination of atrazine and degradation products in Luxembourgish drinking water: Origin and fate of potential endocrine-disrupting pesticides. Food Addit. Contam. A 2011, 28, 1041–1054. [Google Scholar] [CrossRef]
- Jiang, C.; Yang, Y.; Zhang, L.; Lu, D.; Lu, L.; Yang, X.; Cai, T. Degradation of Atrazine, Simazine and Ametryn in an arable soil using thermal-activated persulfate oxidation process: Optimization, kinetics, and degradation pathway. J. Hazard. Mater. 2020, 400, 123201. [Google Scholar] [CrossRef]
- He, H.J.; Liu, Y.P.; You, S.H.; Liu, J.; Xiao, H.; Tu, Z.H. A Review on Recent Treatment Technology for Herbicide Atrazine in Contaminated Environment. Int. J. Environ. Res. Pub. Health 2019, 16, 17. [Google Scholar] [CrossRef] [Green Version]
- Farooq, M.; Bell, A.H.; Almustapha, M.N.; Andresen, J.M. Bio-methane from an-aerobic digestion using activated carbon adsorption. Anaerobe 2017, 46, 33–40. [Google Scholar] [CrossRef]
- Humbert, H.; Gallard, H.; Suty, H.; Croue, J.-P. Natural organic matter (NOM) and pesticides removal using a combination of ion exchange resin and powdered activated carbon (PAC). Water Res. 2008, 42, 1635–1643. [Google Scholar] [CrossRef]
- Rodriguez-Chueca, J.; Garcia-Canibano, C.; Sarro, M.; Encinas, A.; Medana, C.; Fabbri, D.; Calza, P.; Marugan, J. Evaluation of transformation products from chemical oxidation of micropollutants in wastewater by photoassisted generation of sulfate radicals. Chemosphere 2019, 226, 509–519. [Google Scholar] [CrossRef]
- Wu, S.H.; Li, H.R.; Li, X.; He, H.J.; Yang, C.P. Performances and mechanisms of efficient degradation of atrazine using peroxymonosulfate and ferrate as oxidants. Chem. Eng. J. 2018, 353, 533–541. [Google Scholar] [CrossRef]
- Merini, L.J.; Bobillo, C.; Cuadrado, V.; Corach, D.; Giulietti, A.M. Phytoremediation potential of the novel atrazine tolerant Lolium multiflorum and studies on the mechanisms involved. Environ. Pollut. 2009, 157, 3059–3063. [Google Scholar] [CrossRef] [PubMed]
- Zhao, X.Y.; Ma, F.; Feng, C.J.; Bai, S.W.; Yang, J.X.; Wang, L. Complete genome sequence of Arthrobacter sp ZXY-2 associated with effective atrazine degradation and salt adaptation. J. Biotechnol. 2017, 248, 43–47. [Google Scholar] [CrossRef] [PubMed]
- Shin, D.C.; Kim, J.S.; Park, C.H. Study on physical and chemical characteristics of microorganism immobilized media for advanced wastewater treatment. J. Water Process. Eng. 2019, 29, 100784. [Google Scholar] [CrossRef]
- Yu, J.P.; He, H.J.; Yang, W.L.; Yang, C.P.; Zeng, G.M.; Wu, X. Magnetic bionanoparticles of Penicillium sp yz11-22N2 doped with Fe3O4 and encapsulated within PVA-SA gel beads for atrazine removal. Bioresour. Technol. 2018, 260, 196–203. [Google Scholar] [CrossRef] [PubMed]
- Yu, Y.; Ji, J.; Li, K.; Huang, H.; Shrestha, R.P.; Kim Oanh, N.T.; Winijkul, E.; Deng, J. Activated carbon supported MnO nanoparticles for efficient ozone decomposition at room temperature. Catal. Today 2020, 355, 573–579. [Google Scholar] [CrossRef]
- Yang, D.; Sararuk, C.; Suzuki, K.; Li, Z.; Li, C. Effect of calcination temperature on the catalytic activity of VPO for aldol condensation of acetic acid and formalin. Chem. Eng. J. 2016, 300, 160–168. [Google Scholar] [CrossRef]
- Chen, H.E.; Cheng, Y.; Zhu, Z.Q.; He, H.J.; Zhang, L.H.; Li, N.J.; Zhu, Y.N. Adsorption of Pb(II) from Aqueous Solution by Mercerized Moso Bamboo Chemically Modified with Pyromellitic Dianhydride. J. Environ. Eng. 2020, 146, 8. [Google Scholar] [CrossRef]
- Gupta, N.; Pal, B. Photocatalytic activity of transition metal and metal ions impregnated TiO2 nanostructures for iodide oxidation to iodine formation. J. Mol. Catal. A-Chem. 2013, 371, 48–55. [Google Scholar] [CrossRef]
- Ezaty, S.N.; Zaini, N.; Farahhin, N.J.; Kamarudin, K.S.N. Study of hydrogen adsorption onto kenaf sorbent surface by metal impregnation method. Mater. Today Proc. 2020, 6. [Google Scholar] [CrossRef]
- Ameri, A.; Sodeifian, G.; Sajadian, S.A. Lansoprazole loading of polymers by supercritical carbon dioxide impregnation: Impacts of process parameters. J. Supercrit. Fluid 2020, 164, 104892. [Google Scholar] [CrossRef]
- Cejudo Bastante, C.; Casas Cardoso, L.; Fernández Ponce, M.T.; Mantell Serrano, C.; Martínez de la Ossa-Fernández, E.J. Characterization of olive leaf extract polyphenols loaded by supercritical solvent impregnation into PET/PP food packaging films. J. Supercrit. Fluid 2018, 140, 196–206. [Google Scholar] [CrossRef]
- Pontón, P.I.; Prisco, L.P.; Dosen, A.; Faro, G.S.; de Abreu, M.A.S.; Marinkovic, B.A. Co-precipitation synthesis of Y2W3O12 submicronic powder. Ceram. Int. 2017, 43, 4222–4228. [Google Scholar] [CrossRef]
- Marzano, M.; Pontón, P.I.; Marinkovic, B.A. Co-precipitation of low-agglomerated Y2W3O12 nanoparticles: The effects of aging time, calcination temperature and surfactant addition. Ceram. Int. 2019, 45, 20189–20196. [Google Scholar] [CrossRef]
- Liu, S.; Ouyang, J.; Ren, J. Mechanism of calcination modification of phosphogypsum and its effect on the hydration properties of phosphogypsum-based supersulfated cement. Constr Build. Mater. 2020, 243, 118226. [Google Scholar] [CrossRef]
- Huang, B.Y.; Liu, Y.G.; Li, B.; Liu, S.B.; Zeng, G.M.; Zeng, Z.W.; Wang, X.H.; Ning, Q.M.; Zheng, B.H.; Yang, C.P. Effect of Cu(II) ions on the enhancement of tetracycline adsorption by Fe3O4@SiO2-Chitosan/graphene oxide nanocomposite. Carbohyd. Polym. 2017, 157, 576–585. [Google Scholar] [CrossRef] [PubMed]
- Aydin, H.; Gündüz, B.; Aydin, C. Surface morphology, spectroscopy, optical and conductivity properties of transparent poly (9-vinylcarbazole) thin films modified with graphene oxide. Synth. Met. 2019, 252, 1–7. [Google Scholar] [CrossRef]
- Muñoz, A.J.; Espínola, F.; Ruiz, E. Biosorption of Ag(I) from aqueous solutions by Klebsiella sp. 3S1. J. Hazard. Mater. 2017, 329, 166–177. [Google Scholar] [CrossRef]
- Al-Senani, G.M.; Deraz, N.M.; Abd-Elkader, O.H. Magnetic and Characterization Studies of CoO/Co3O4 Nanocomposite. Processes 2020, 8, 13. [Google Scholar] [CrossRef]
- Rouhaninezhad, A.A.; Hojati, S.; Masir, M.N. Adsorption of Cr (VI) onto micro- and nanoparticles of palygorskite in aqueous solutions: Effects of pH and humic acid. Ecotoxicol. Environ. Saf. 2020, 206, 111247. [Google Scholar] [CrossRef]
- Tahir, S.S.; Naseem, R. Removal of Cr(III) from tannery wastewater by adsorption onto bentonite clay. Sep. Purif. Technol. 2007, 53, 312–321. [Google Scholar] [CrossRef]
- Yang, C.P.; Wang, J.Q.; Lei, M.; Xie, G.X.; Zeng, G.M.; Luo, S.L. Biosorption of zinc(II) from aqueous solution by dried activated sludge. J. Environ. Sci. 2010, 22, 675–680. [Google Scholar] [CrossRef]
- Cheng, Y.; Yang, C.P.; He, H.J.; Zeng, G.M.; Zhao, K.; Yan, Z. Biosorption of Pb(II) Ions from Aqueous Solutions by Waste Biomass from Biotrickling Filters: Kinetics, Isotherms, and Thermodynamics. J. Environ. Eng. 2016, 142, 7. [Google Scholar] [CrossRef]
- He, H.J.; Xiang, Z.H.; Chen, X.J.; Chen, H.; Huang, H.; Wen, M.; Yang, C.P. Biosorption of Cd(II) from synthetic wastewater using dry biofilms from biotrickling filters. Int. J. Environ. Sci. Technol. 2018, 15, 1491–1500. [Google Scholar] [CrossRef]
- Yurtsever, M.; Sengil, I.A. Biosorption of Pb(II) ions by modified quebracho tannin resin. J. Hazard. Mater. 2009, 163, 58–64. [Google Scholar] [CrossRef]
- Karthik, R.; Meenakshi, S. Biosorption of Pb(II) and Cd(II) ions from aqueous solution using polyaniline/chitin composite. Sep. Sci. Technol. 2016, 51, 733–742. [Google Scholar] [CrossRef]
- Wang, J.Y.; Cui, H.; Cui, C.W.; Xing, D.F. Biosorption of copper(II) from aqueous solutions by Aspergillus niger-treated rice straw. Ecol. Eng. 2016, 95, 793–799. [Google Scholar] [CrossRef]
- Guo, X.; Wang, J. Comparison of linearization methods for modeling the Langmuir adsorption isotherm. J. Mol. Liq. 2019, 296, 111850. [Google Scholar] [CrossRef]
- Dil, E.A.; Ghaedi, M.; Asfaram, A.; Hajati, S.; Mehrabi, F.; Goudarzi, A. Preparation of nanomaterials for the ultrasound-enhanced removal of Pb2+ ions and malachite green dye: Chemometric optimization and modeling. Ultrason. Sonochem. 2017, 34, 677–691. [Google Scholar] [CrossRef]
- Pehlivan, E.; Arslan, G. Removal of metal ions using lignite in aqueous solution—Low cost biosorbents. Fuel Process. Technol. 2007, 88, 99–106. [Google Scholar] [CrossRef]
- D’Arcy, M.; Weiss, D.; Bluck, M.; Vilar, R. Adsorption kinetics, capacity and mechanism of arsenate and phosphate on a bifunctional TiO2-Fe2O3 bi-composite. J. Colloid Interf. Sci. 2011, 364, 205–212. [Google Scholar] [CrossRef] [PubMed]
Figure 1.
The influence of preparation conditions on material properties: (a) Co2+ concentration of impregnation solution, (b) immersing time, (c) calcination temperature, (d) calcination time. (atrazine concentration 10 mg/L, material dosage 60 mg/L, reaction time 180 min, reaction temperature 25 °C and shaking speed 120 rpm).


Figure 2.
Material characterization: (a) SEM image of AC, (b) SEM image of Co@AC calcined for 2.0 h, (c) SEM image of Co@AC calcined for 4.0 h, (d) EDS image of Co@AC calcined for 4.0 h. (The preparation conditions of Co@AC: Co2+ mass fraction 7.0%, immersing time 7.0 h, calcining temperature 500 °C).


Figure 3.
FTIR image: (a) AC, (b) Co@AC before reaction, (c) Co@AC after reaction (The preparation conditions of Co@AC: Co2+ mass fraction 7%, immersing time 7.0 h, calcining temperature 500 °C, calcination time 4.0 h).
Figure 3.
FTIR image: (a) AC, (b) Co@AC before reaction, (c) Co@AC after reaction (The preparation conditions of Co@AC: Co2+ mass fraction 7%, immersing time 7.0 h, calcining temperature 500 °C, calcination time 4.0 h).

Figure 4.
The effect of reaction conditions on the atrazine removal: (a) solution pH, (b) reaction time, (c) reaction temperature, (d) material dosage.
Figure 4.
The effect of reaction conditions on the atrazine removal: (a) solution pH, (b) reaction time, (c) reaction temperature, (d) material dosage.


Figure 5.
Co@AC adsorption kinetics of atrazine: (a) pseudo-first-order kinetic model, (b) pseudo-second-order kinetic model. (Co@AC dosage 60 mg/L, atrazine concentration 10 mg/L, the solution pH value 4.0, reaction temperature 25 °C).
Figure 5.
Co@AC adsorption kinetics of atrazine: (a) pseudo-first-order kinetic model, (b) pseudo-second-order kinetic model. (Co@AC dosage 60 mg/L, atrazine concentration 10 mg/L, the solution pH value 4.0, reaction temperature 25 °C).

Figure 6.
The adsorption isotherms for atrazine by Co@AC: (a) Langmuir isotherm, (b) Freundlich isotherm. (Co@AC dosage 60 mg/L, atrazine concentration 10 mg/L, the solution pH value 4.0, reaction time 90 min, reaction temperature 25 °C).
Figure 6.
The adsorption isotherms for atrazine by Co@AC: (a) Langmuir isotherm, (b) Freundlich isotherm. (Co@AC dosage 60 mg/L, atrazine concentration 10 mg/L, the solution pH value 4.0, reaction time 90 min, reaction temperature 25 °C).

Figure 7.
Cycle experiments of Co@AC (Co@AC dosage 180 mg/L, atrazine concentration 10 mg/L, the solution pH 4.0, reaction time 180 min, reaction temperature 25 °C).
Figure 7.
Cycle experiments of Co@AC (Co@AC dosage 180 mg/L, atrazine concentration 10 mg/L, the solution pH 4.0, reaction time 180 min, reaction temperature 25 °C).


Table 1.
The constants of pseudo-first-order kinetic and pseudo-second-order kinetic models for the adsorption of atrazine on Co@AC.
Table 1.
The constants of pseudo-first-order kinetic and pseudo-second-order kinetic models for the adsorption of atrazine on Co@AC.
| Pseudo-First-Order Kinetic Model | Pseudo-Second-Order Kinetic Model | ||||
|---|---|---|---|---|---|
| k1 | Qcal (mg/g) | R2 | k2 | Qcal (mg/g) | R2 |
| 0.0191 | 35.291 | 0.927 | 0.00243 | 95.42 | 0.999 |
Table 2.
The Langmuir and Freundlich isotherm constants of Co@AC to atrazine.
| Langmuir Isotherm | Freundlich Isotherm | ||||
|---|---|---|---|---|---|
| Qmax (mg/g) | KL (L/mg) | R2 | Kf ((mg/g)/(mg/L)n) | n (g/L) | R2 |
| 248.139 | 0.064 | 0.92 | 25.574 | 1.751 | 0.98 |
Publisher’s Note: MDPI stays neutral with regard to jurisdictional claims in published maps and institutional affiliations. |
© 2021 by the authors. Licensee MDPI, Basel, Switzerland. This article is an open access article distributed under the terms and conditions of the Creative Commons Attribution (CC BY) license (http://creativecommons.org/licenses/by/4.0/).
Share and Cite
MDPI and ACS Style
Liu, Y.; Liu, D.; He, H.; Zhang, J.; Liu, J.; Wang, D.; Huang, L.; Tu, Z. Preparation, Performances and Mechanisms of Co@AC Composite for Herbicide Atrazine Removal in Water. Water 2021, 13, 240. https://doi.org/10.3390/w13020240
AMA Style
Liu Y, Liu D, He H, Zhang J, Liu J, Wang D, Huang L, Tu Z. Preparation, Performances and Mechanisms of Co@AC Composite for Herbicide Atrazine Removal in Water. Water. 2021; 13(2):240. https://doi.org/10.3390/w13020240
Chicago/Turabian StyleLiu, Yongpan, Danxia Liu, Huijun He, Jinxiao Zhang, Jie Liu, Dunqiu Wang, Liangliang Huang, and Zhihong Tu. 2021. "Preparation, Performances and Mechanisms of Co@AC Composite for Herbicide Atrazine Removal in Water" Water 13, no. 2: 240. https://doi.org/10.3390/w13020240
Note that from the first issue of 2016, this journal uses article numbers instead of page numbers. See further details here.