Article

Experimental Study for Sand Filter Backwash Water Management: Low-Cost Treatment for Recycling and Residual Sludge Utilization for Radium Removal

Department of Civil Engineering, College of Engineering, Qassim University, Buraydah 51452, Saudi Arabia
*
Author to whom correspondence should be addressed.
Water 2021, 13(20), 2799; https://doi.org/10.3390/w13202799
Submission received: 2 September 2021 / Revised: 29 September 2021 / Accepted: 3 October 2021 / Published: 9 October 2021
(This article belongs to the Section Water Quality and Contamination)

Abstract

:
Management of backwash water (BW) generated from sand filtration of groundwater naturally contaminated with iron (Fe), manganese (Mn), and radium (Ra) remains a challenge worldwide. The present study investigated the effectiveness of a low-cost clay ceramic filter for BW recycling along with residual sludge utilization for Ra removal from BW. A 15 day continuous ceramic filtration process operated at a constant flux of 2000 L/m2/d (83 LMH) showed 99% removal of Fe, Mn, and turbidity. The treated BW was found suitable for recycling back to the sand filters. Subsequently, the residual sand filter backwash sludge (BS) was collected, characterized by scanning electron microscopy (SEM) and X-ray diffraction, and examined as a potential adsorbent to the Ra. Results showed that the sludge constituted heterogeneous basic elements, with higher percentages of iron and manganese oxides. The sludge can be classified as typical mesoporous and poorly crystalline minerals consisting primarily of quartz and Mn2O3. Over 60% of Ra from the initial 2.1 bq/L could be removed by sludge in 30 min at neutral pH. The adsorption kinetics of sludge described well by the pseudo-second order model and Ra adsorption on the sludge were mainly controlled by chemisorption rate-controlling steps, intraparticle diffusion, and external mass transfer processes. Treatment of BW by low-cost clay ceramic filters and the utilization the BS for Ra removal would be a sustainable sand filter BW management practice.

1. Introduction

A large amount of backwash water (BW) is produced, particularly from the sand filter backwash in the drinking water purification process for groundwater sources [1,2,3]. Globally, around 2–10% of treated water has been used for the backwashing process [1,4]. In the Kingdom of Saudi Arabia (KSA), around 26 million m3 of treated water is used for sand filter backwashing per annum, which is later discharged to land or the municipal sewerage system. In recent years, several studies have been carried out to explore the possibility of BW recycling using membrane filtration [3,5,6,7,8]. As the technology needs a high initial cost and consumes high energy for operations, it has limited application in most cases, including in KSA. A sustainable low-cost method and simple technology are needed for treating BW.
In our previous study [4], a simple low-cost clay ceramic filter, coupled with the coagulation and flocculation process, was evaluated for BW treatment. However, the coagulation and flocculation process complicates the treatment system, leading to extra costs for the chemicals used (coagulant) and consuming high energy (although relatively less than membrane systems). To further minimize initial cost and energy requirements, investigation of the efficacy of the direct filtration of BW using a low-cost clay ceramic filter might lead to a more sustainable solution. Furthermore, BW produced from water treatment plants (WTPs) contains a large amount of solids, known as sand filter backwash sludge (BS) [9]. The BS resulting from Fe and Mn (naturally occurring in groundwater sources) removal processes consists primarily of the particulate forms of Fe and Mn oxy-hydroxides [10], with a negligible level of hazardous substances [10]. Since this sludge is produced in large quantities, its safe disposal remains a challenge. Hence BS reuse has drawn worldwide attention from researchers as a way to protect the environment and economize resources.
Groundwater contamination due to ubiquitously existing, naturally occurring minerals, metals, and radionuclides is a major concern for water regulators worldwide. Among the Ra isotopes, 226Ra, and 228Ra are the most important, with a half-life of 5.75 and 1600 years, respectively. These isotopes can accumulate in plants, humans, and animals as well as transfer to animals and humans through the food chains [11]. In addition to being naturally occurring, human activities, including the oil and gas industry production [12], uranium mining [13], and phosphate fertilizers [14] can increase Ra concentration in the surface water and groundwater. Health impacts associated with Ra in drinking water supplies have constituted major concerns in the last few decades. Consumption of water containing a high level of Ra may cause genetic damage, which may lead to bone cancer in humans [15]. Consequently, the standard limit for several radionuclides in drinking water was set by many national and international authorities. For instance, a combined Ra (226Ra + 228Ra) of 0.185 Bq/L (5 pCi/L) was regulated by the United States Environmental Protection Agency (USEPA) [16]. According to the world health origination (WHO) drinking water quality guidelines, the maximum contamination level (MCL) of radium isotopes is 1.0 Bq/L for 226Ra and 0.1 Bq/L for 228Ra [17].
The extent of the contamination level of radionuclides in groundwater has been extensively investigated in various countries, including KSA [18,19,20,21]. A significant level of naturally occurring radioactive material (particularly Ra) in groundwater was reported in many studies. Groundwater is the primary source (more than 80%) of the drinking water supply in KSA [22]. Therefore, the elevated level of Ra in drinking water sometimes affects the efficacy of treatment processes and is a primary concern of water suppliers [23]. Irrigation application of groundwater containing radioactive materials contaminates the soil and ultimately reaches the human body via soil to plant uptake [24]. Land disposal of BW containing Ra has also been found to be threatening to the natural environment. Consequently, WTP managers are eager to find sustainable treatment mechanisms for Ra removal from the plant influents (raw water).
Several methods, including chemical precipitation, lime softening, ion exchange, and reverse osmosis have been employed for removing radionuclides from water [25,26,27]. In recent years, adsorption-based materials such as clay, zeolite, and bentonite have received special attention in the removal of radionuclides from water because of their low cost and higher removal efficiency [28,29,30]. Fe and Mn based adsorbents have shown good adsorption properties for many heavy metals and radionuclides, including uranium (U) and Ra [31,32]. Utilizing the water treatment backwash sludge (WTBS) as catalysts, coagulation reagents, and adsorbents for the removal of heavy metals from waters and wastewaters is a rational approach [10]. Previous studies reported that WTBS has a high potential to adsorb many biological and chemical pollutants from water and wastewater due to its specific properties, such as high porosity, amorphous phases, and the presence of Fe and Al hydroxides, which work as chelating agents [33,34]. Although WTBS has been extensively tested to remove heavy metals from the water, its efficiency for Ra removal has not been investigated thus far. Hence, simultaneous treatment of BW by a low-cost clay ceramic filter and reuse of the filter residual (WTBS) as adsorbent of Ra from the groundwater would be a sustainable solution for the management of BW.
Our present study aims to perform the experimental study for sand filter BW management for water treatment facilities relying on naturally contaminated groundwater sources, like in KSA. The specific objectives are to (i) investigate the efficacy of a low-cost clay ceramic filter for BW treatment and subsequent recycling to sand filters, and (ii) develop and test the WTBS as an adsorbent for Ra removal from the groundwater.

2. Materials and Methods

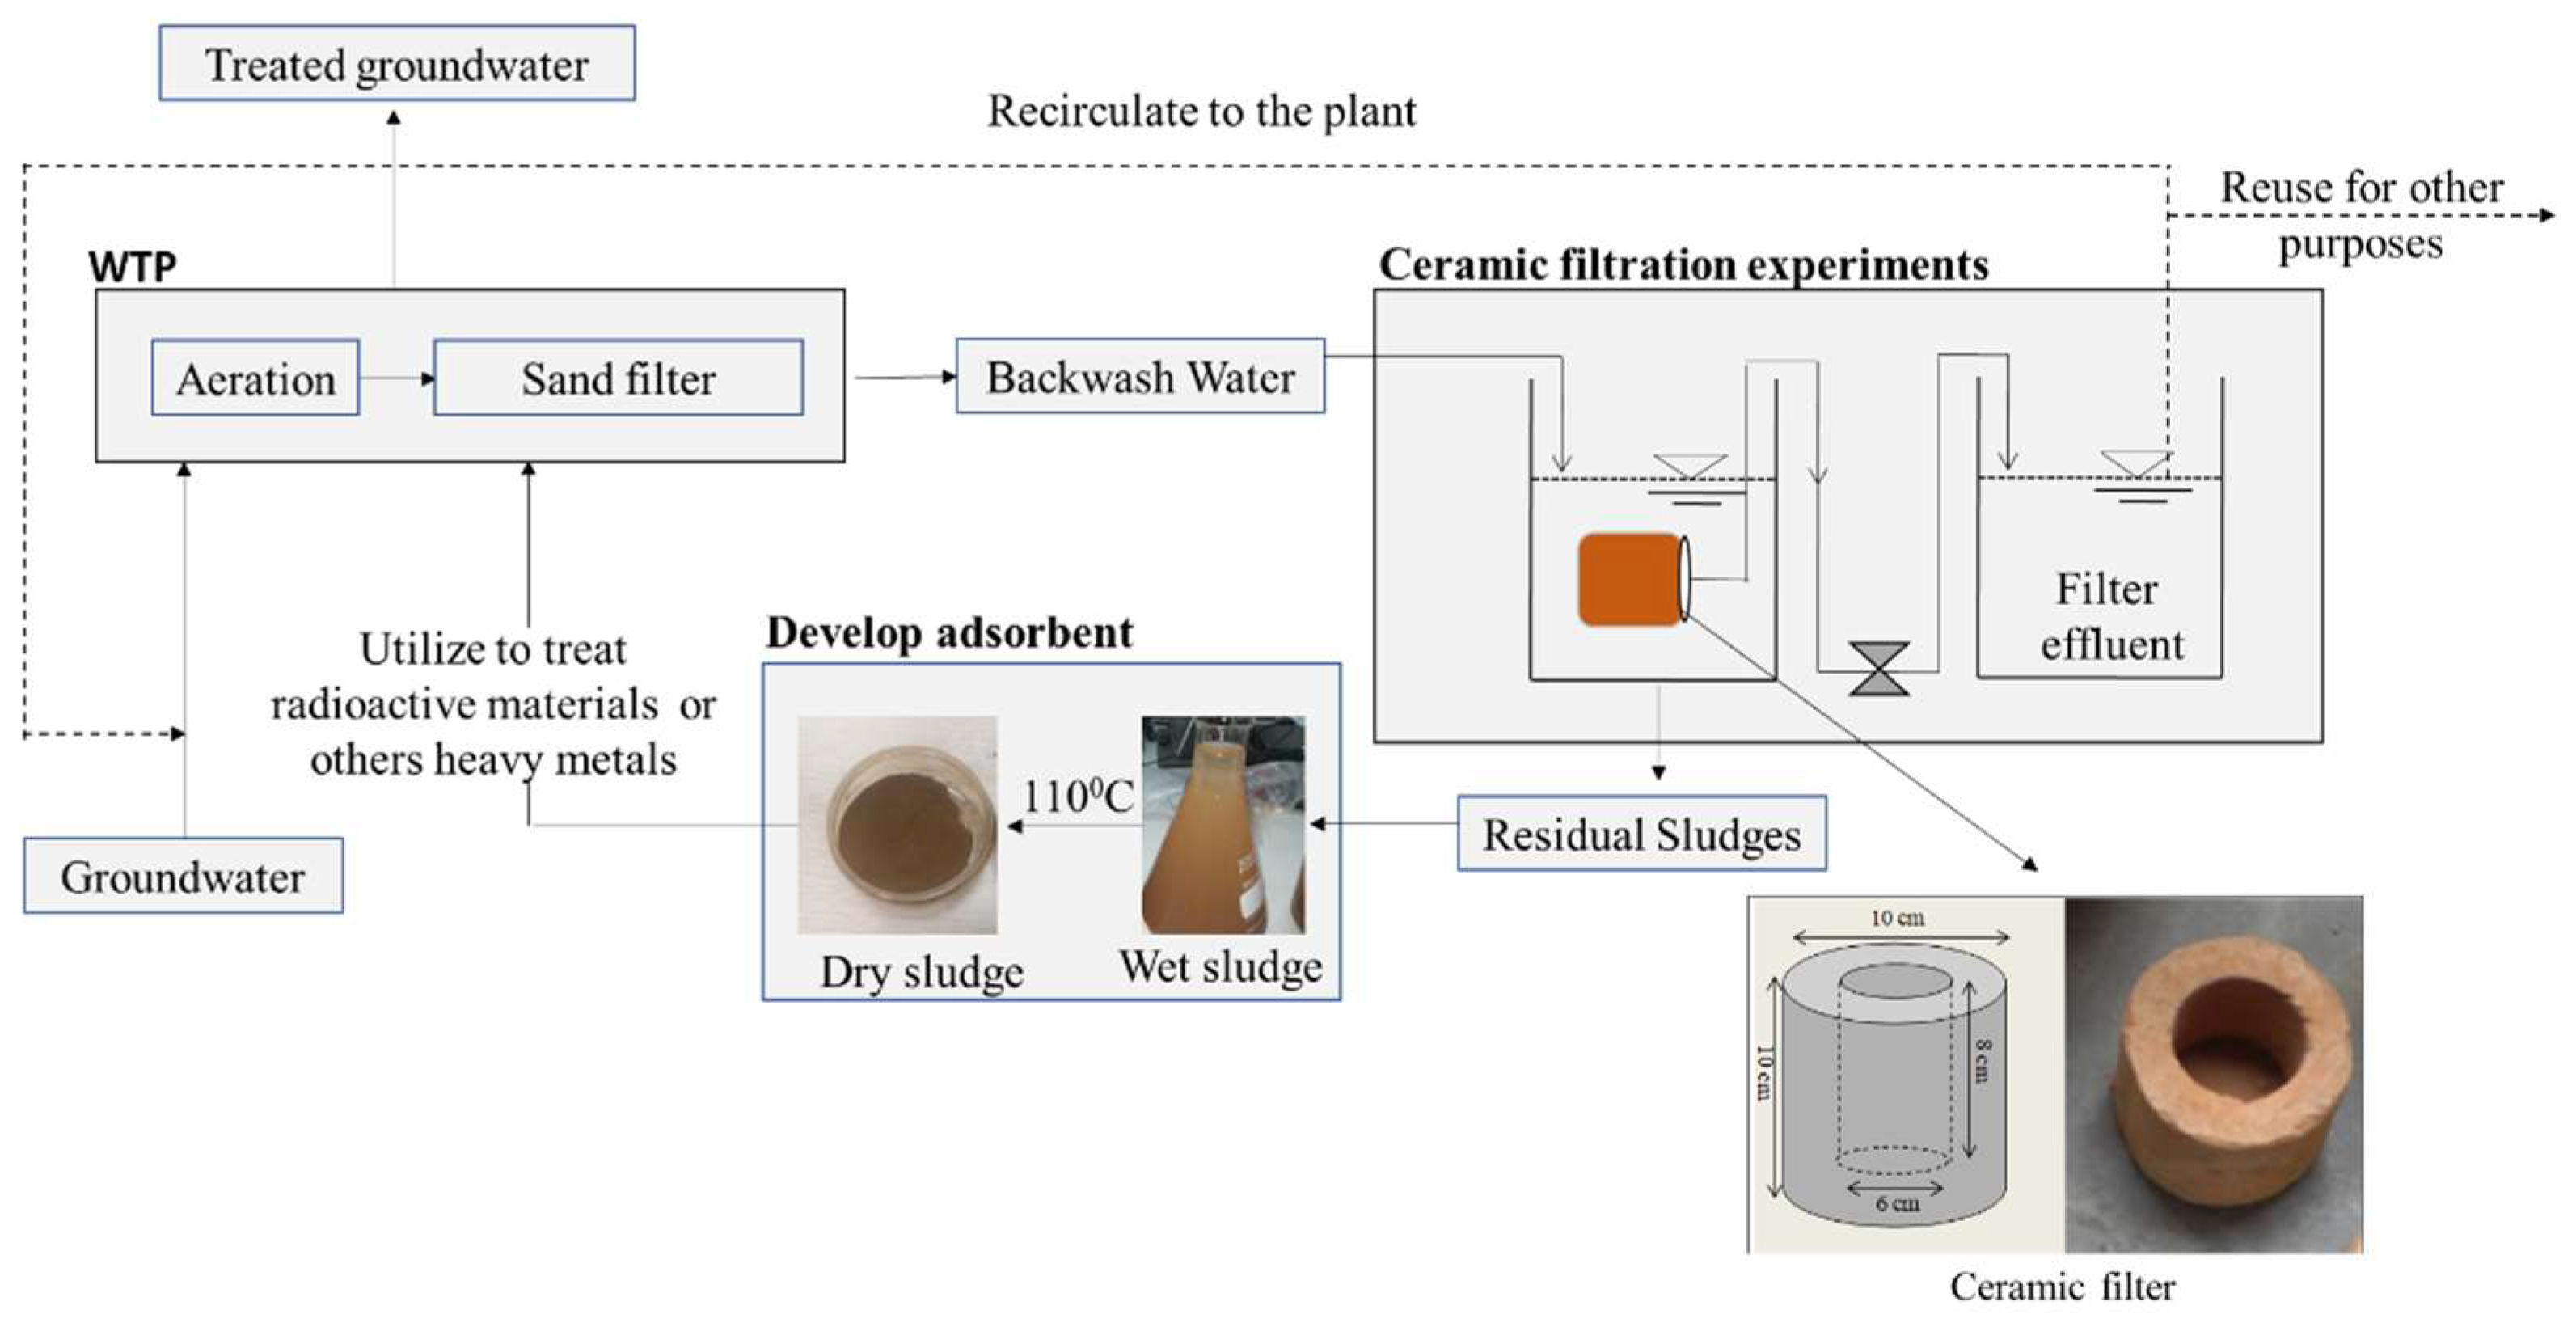
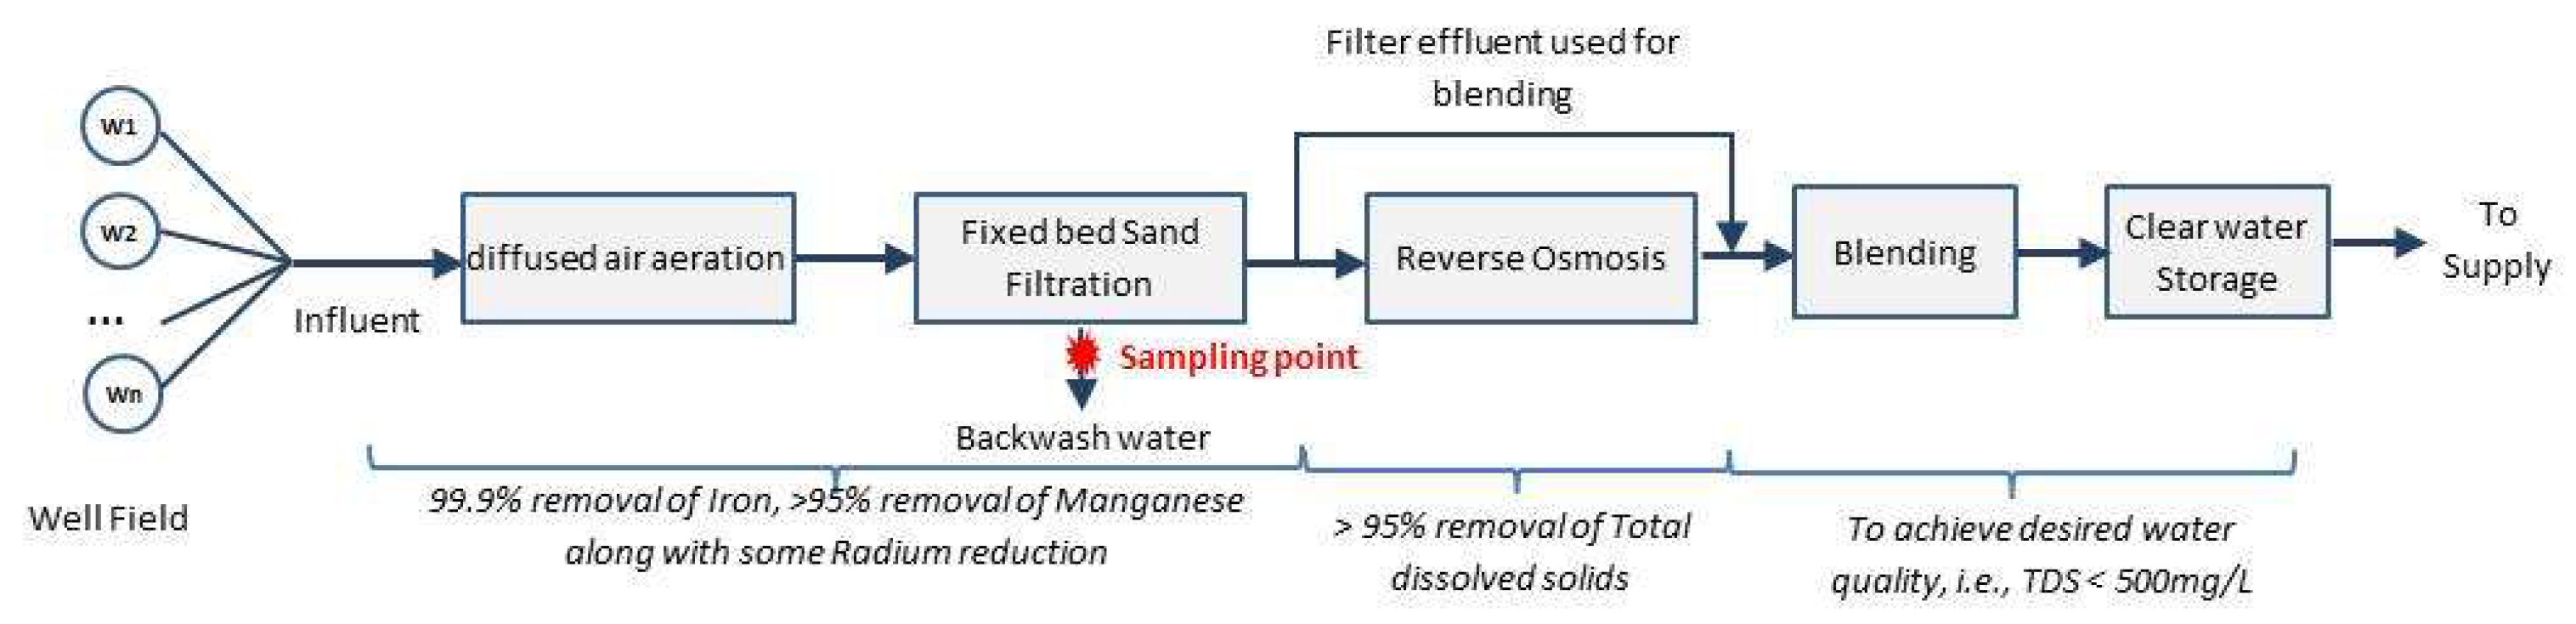
2.1. Conceptual Model for Sustainable BW Management

Figure 1 illustrates a conceptual model for a sustainable water treatment BW management system. The model was primarily proposed to treat and recycle the BW and utilize the residual as an adsorbent for radioactive materials. The sand filter BW was first filtrated by a low-cost clay ceramic filter. The filtrated water was recirculated to the plant, but could be reused for other purposes, e.g., toilet flushing and agriculture. The BW filtration residual sludge (i.e., WTBS) was collected and processed to develop an adsorbent, which was then tested for Ra removal from the groundwater. Sand filter BW from a local WTP was collected to conduct the laboratory experiments.

2.2. Collection of Backwash Water

Backwash water samples were collected from the disposal point of Buraydah WTP located in Buraydah City, i.e., the capital of Qassim Province of KSA. Figure 2 illustrates the schematics of water treatment processes along with the sampling location. The plant operates by diffused air aeration of raw groundwater containing iron and manganese, followed by fixed bed sand filtration. In the subsequent steps, the cartridge filter then uses reverse osmosis to remove total dissolved solids. Filtered water is blended with reverse osmosis demineralized water to produce the final product, which complies with Saudi Arabian Water Quality Standards. For the present research, the samples were collected in a 50 L jar and brought back to the laboratory. Fresh samples were immediately analyzed and used for experiments without any pre-treatment.

2.3. Clay Ceramic Filter

The cylindrical shaped clay ceramic filter used in this study was manufactured using locally available clay soil and rice bran (see bottom right of Figure 1). The manufacturing process was adapted from our previous study [35]. Briefly, clay soil and rice bran were mixed at a ratio of 80:20 by weight. Water was added as needed to make the dough and cast in a cylindrical shape mold to make the hollow cylindrical shape with a closed one-end clay ceramic filter. The filter was sun-dried for 48–72 h, followed by firing in a muffle furnace in a small-scale pottery kiln at 900 °C for 4–5 h. The hollow clay ceramic filter is open on one side, 10 cm high, and holds a thickness of 2 cm (Figure 1). The filter has a pore size of 1–5 µm, with an active surface area of 0.039 m2/filter [35].

2.4. Ceramic Filtration Experiments

A lab-scale continuous ceramic filtration system was developed to investigate the contaminant removal efficiency of the low-cost clay ceramic filter. Figure 1 presents the schematics of the experimental setup and ceramic filtration experiment position. The low-cost clay ceramic filter was submerged in a rectangular tank (filtration tank) made of thermoplastic glass. The filter was sealed with a rubber cap and connected with an effluent tube to the effluent tank. The filtration was carried out continuously for 15 days at a fixed flux of 2000 L/m2/d (83 LMH) using a suction pump. Influent and effluent water samples were regularly collected for water quality analysis.

2.5. Water Treatment Backwash Sludge (WTBS)

Following the filtration experiments, the residuals remaining in the filtration tank, known as WTBS, were collected and kept for 24 h settling, as shown in Figure 1. Subsequently, the settled sludge was separated and oven dried for 72 h at 110 °C. Finally, the sludge was ground manually, passed through a 300 μm sieve to remove large particles, and stored in a desiccator for characterization and adsorption experiments.

2.6. Characterization of WTBS

Elemental analysis of the WTBS was measured, including total concentrations of Fe, Al, Mn, As, Zn, Pb, Cu, Cd, and Cr, using an inductively coupled plasma atomic emission spectroscopy (ICP-AES Thermo Scientific, Waltham, MA, USA). Prior to ICP-AES analysis, the WTBS samples were digested with Aqua regia solution comprising a 3:1 mixture of hydrochloric acid and nitric acid. The surface morphology of the WTBS was assessed using FEI Quanta SEM scanning Electron Microscopy (SEM). The SEM analysis was performed by applying an accelerating voltage of 5 kV with various magnification essays. The X-ray diffraction technique (XRD) using ULTIMA IV/Rigaku was applied to assess the crystalline structure of the WTBS samples. The main mineral phases of the WTBS were identified by the phase analysis of the samples using XRD methods. The sweeping speed of the samples was maintained at 1°/min between 2θ = 0° to 70°.

2.7. Adsorption Kinetics Experiments

Adsorption studies were carried out in a batch mode, using the A&F jar test apparatus (JM4, Novatech International, Kingwood, TX, USA) at 140 rpm. Natural groundwater containing 2.66 bq/L of total Ra (226Ra and 228Ra) was used as the source of Ra solution. The Ra solution was mixed with 0.1 g of WTBS powder in 1000 mL glass beakers for 5, 10, 15, 30, 60, and 120 min. Experiments were conducted under neutral pH (7.2 ± 0.26) and room temperature (26–28 °C). At specified time intervals, samples were taken and filtered through the glass fiber filter paper (ADVANTEC GS 50) and the concentrations of residual Ra were measured. All experiments were conducted in duplicate, and the average values are presented.

2.8. Kinetic Adsorption Models

Pseudo-first-order (PFO) and pseudo-second-order (PSO) kinetic models along with intraparticle and external diffusion models were applied to the adsorption data to understand the sorption kinetic of Ra by WTBS. These kinetics models are well known and give insight into the rate and the mechanism of the adsorption process [36,37]. Thus, they were applied for a detailed understanding of the adsorption process of Ra onto the WTBS. Table 1 shows the equations for the kinetics adsorption models used in this study [36,37,38].

2.9. Water Quality Analysis

A radiochemical method was employed to measure the Ra isotope. The samples were prepared by co-precipitation of Ra isotopes with a barium carrier followed by mixing with gelling scintillating cocktail LumaGel™. Finally, the Ra was measured in a low-level liquid scintillation spectrometer Quantulus™. All other physical and chemical analyses of water samples were performed according to the standard method [39]. pH and electrical conductivity (EC) were measured using a potable meter (HMP6, HACH). Turbidity was measured using the turbidity meter (2100Q, HACH). A potable Ultra-meter II 6P (6PIIFCE, Myron L, Carlsbad, CA, USA) was used to measure TDS. Alkalinity was measured using the per-standard titration method. Total Fe and Mn were measured using a spectrophotometer (HACH DH-5000) according to the HACH method. Chloride (Cl) was measured by titration with potassium chromate and silver nitrate solutions. Total hardness, calcium (Ca), and magnesium (Mg) were measured using HACH test kits according to the retraction methods specified by HACH. Total suspended solids (TSS) were measured by the gravimetric method.

2.10. Econmomic Analysis of the Ceramic Filtration Process

The economic analysis of the low-cost ceramic filtration process was performed by estimating the costs of major components, including the filter, feed pump, suction pump, as well as the operating (electricity) cost of the pumps. The total annualized cost can be estimated using Equation (1):
Ctotal = CAfilter + CApump + CAop
The annualized filter cost (CAfilter, $/year), pump cost (CApump, $/year), and operating costs of the pump (CAop, $/year) were estimated using a method given by Shethi and Winsner [40]. The feed rate was selected based on 1−10% of the total freshwater production of the WTP. The cost of the clay ceramic filter ($30/m2) was taken from a previous study [35]. The lifespan of the clay ceramic filter was assumed to be 1 year. Based on the present study, the permeate flux (2000 L/m2/d) was adapted from the continuous filtration data, and the operating pressure was calculated to be 3.5 KPa.

3. Results

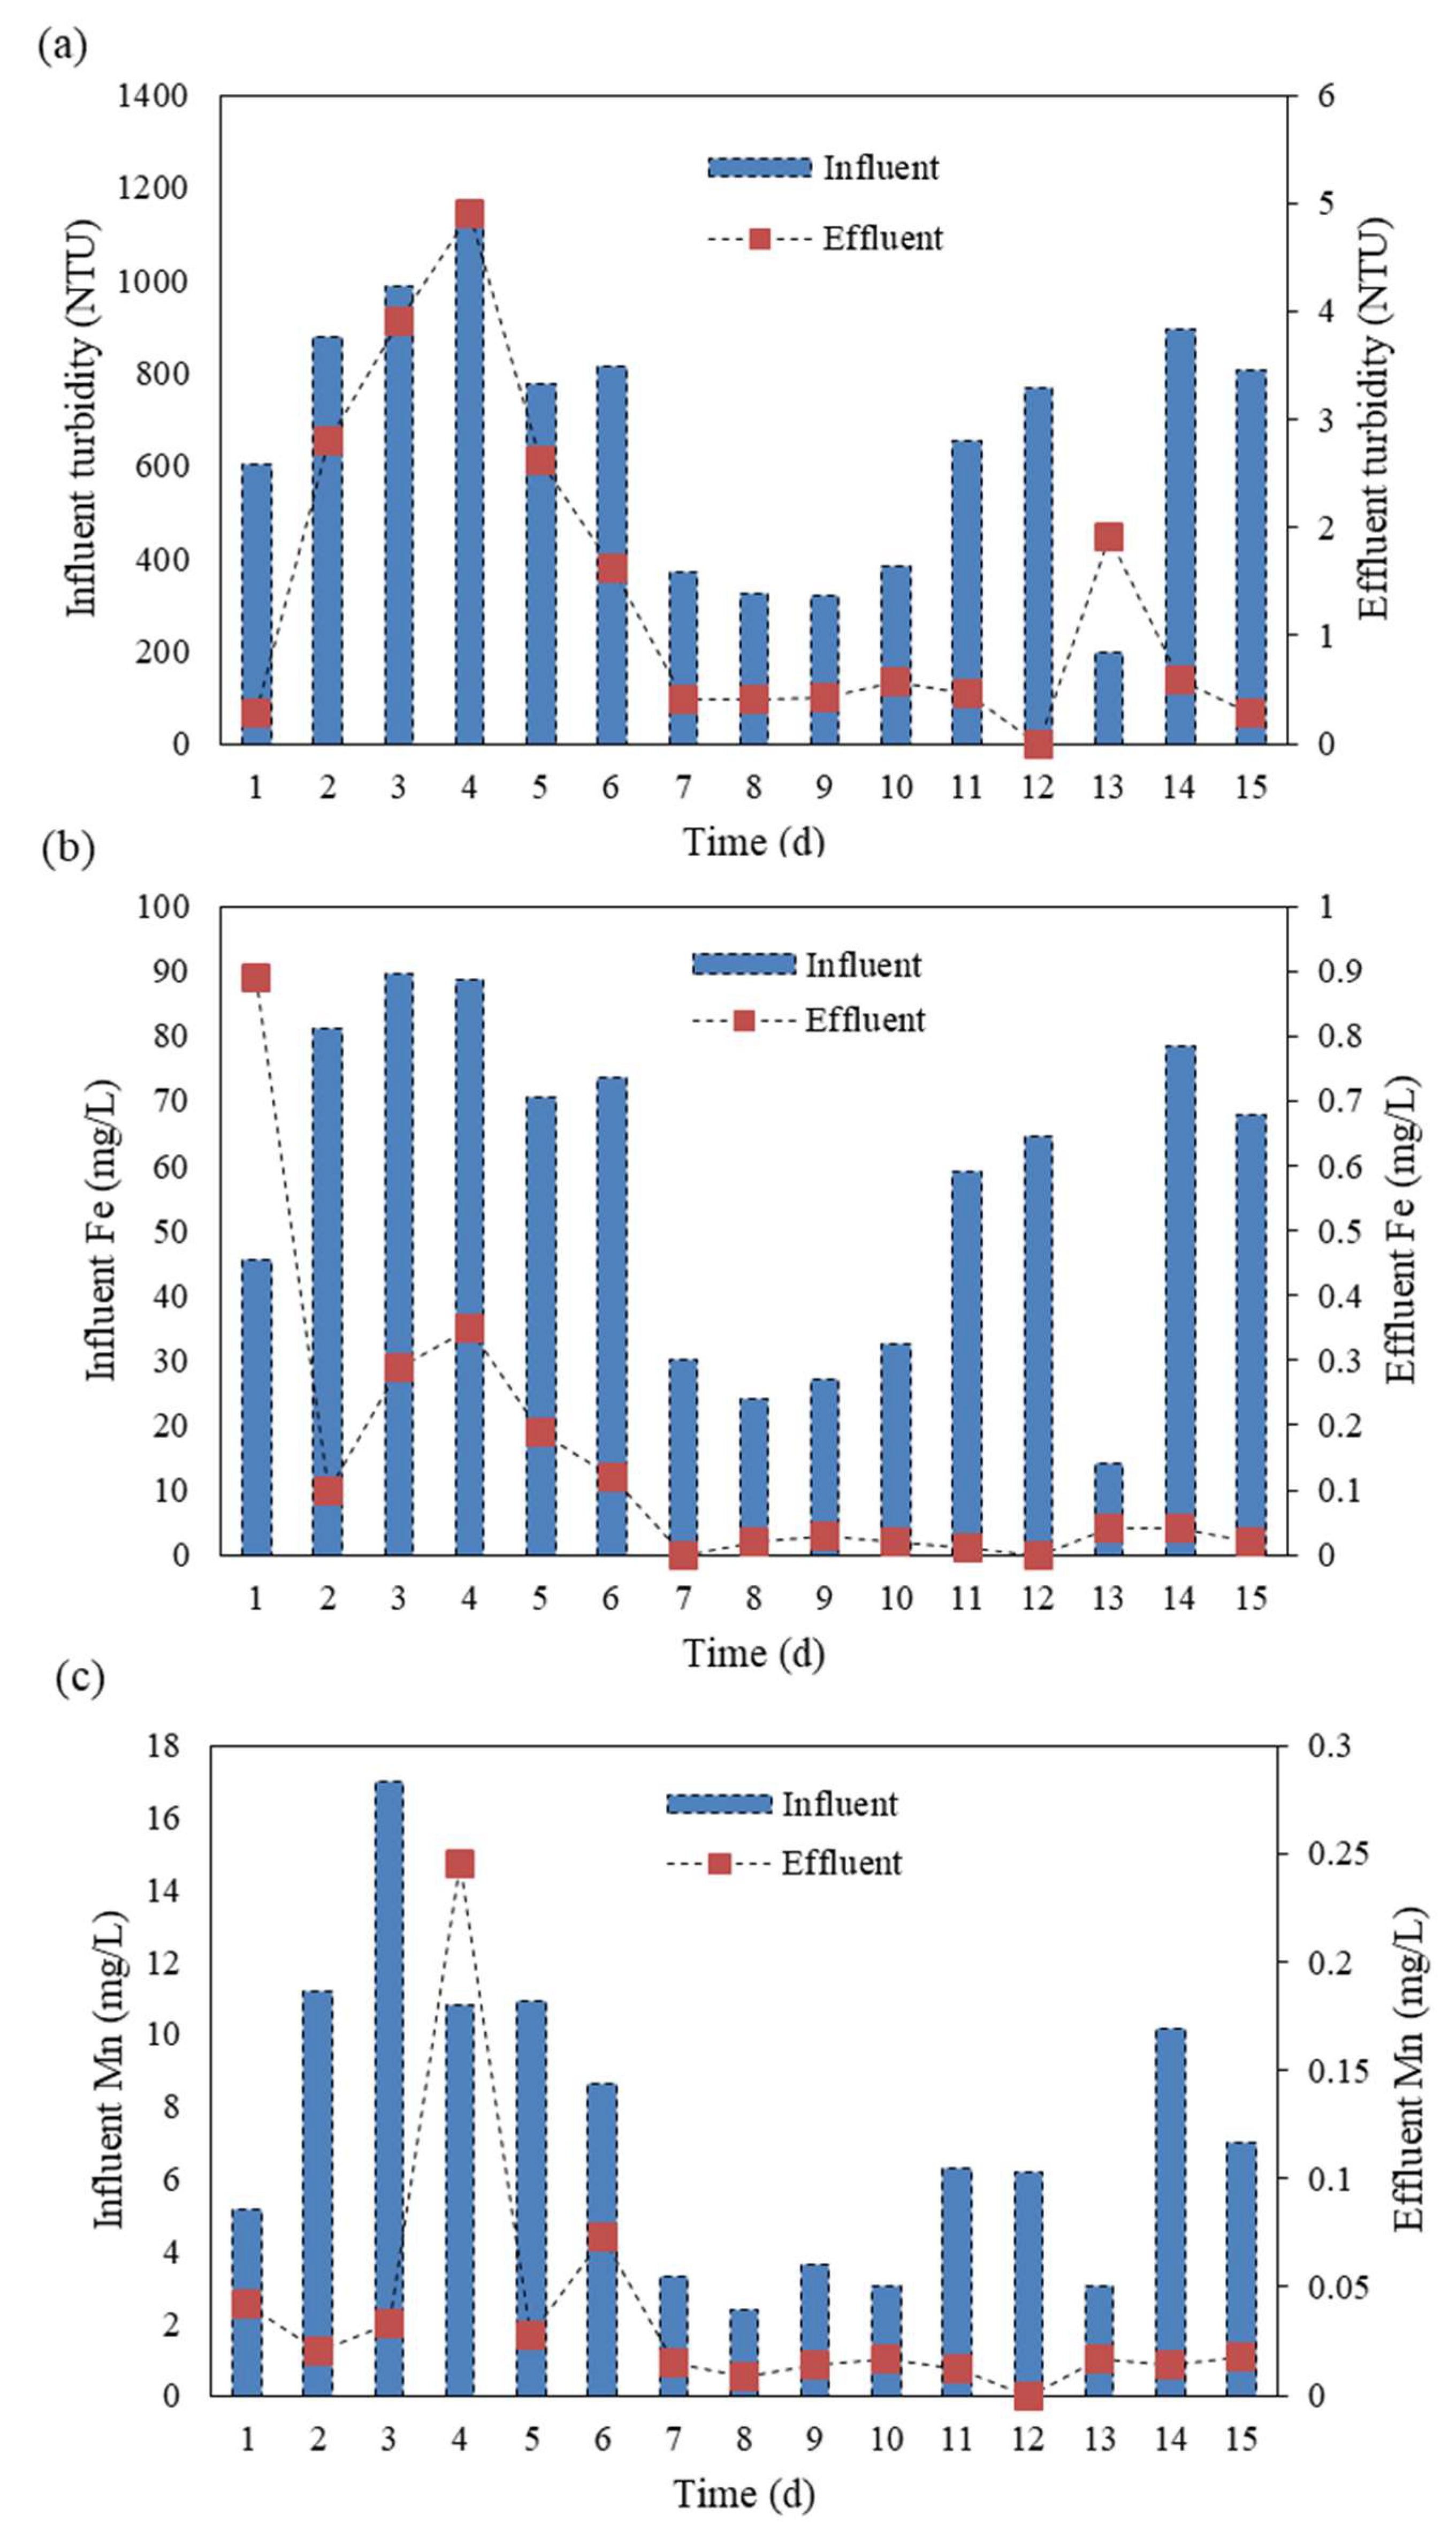
3.1. Characteristics of BW and Treatment Efficiency

The treatability of BW using a low-cost clay ceramic filter was investigated in a continuous filtration experiment, and the results are presented in Figure 3. Analysis indicated that the turbidity of BW was very high (635 ± 253 NTU), containing significantly higher concentrations of Fe (54.9 ± 24.0 mg/L) and Mn (7.6 ± 4.8 mg/L). Figure 2 presents the removal performance of turbidity, Fe, and Mn by the low-cost clay ceramic filter. More than 99% of the turbidity, Fe, and Mn was removed by simple ceramic filtration. The average effluent concentrations were as follows: turbidity < 5 NTU, Fe < 0.9 mg/L, Mn < 0.5 mg/L; these correspond to more than 99% average removal from the raw BW.
As the BW contained the particulate forms of Fe and Mn oxy-hydroxides, the micro-porous clay ceramic filter effectively separated these during the filtration process, resulting in very low concentrations of Fe, Mn, and turbidity in the effluent. As expected, high TSS removal (>99%) was also achieved. The removal of other parameters, including TDS, conductivity, hardness, Ca, Mg, and Si were not significant and remained almost unchanged. Subsequently, the residual sludge in the filter was collected, processed, characterized, and tested for Ra removal from the groundwater.

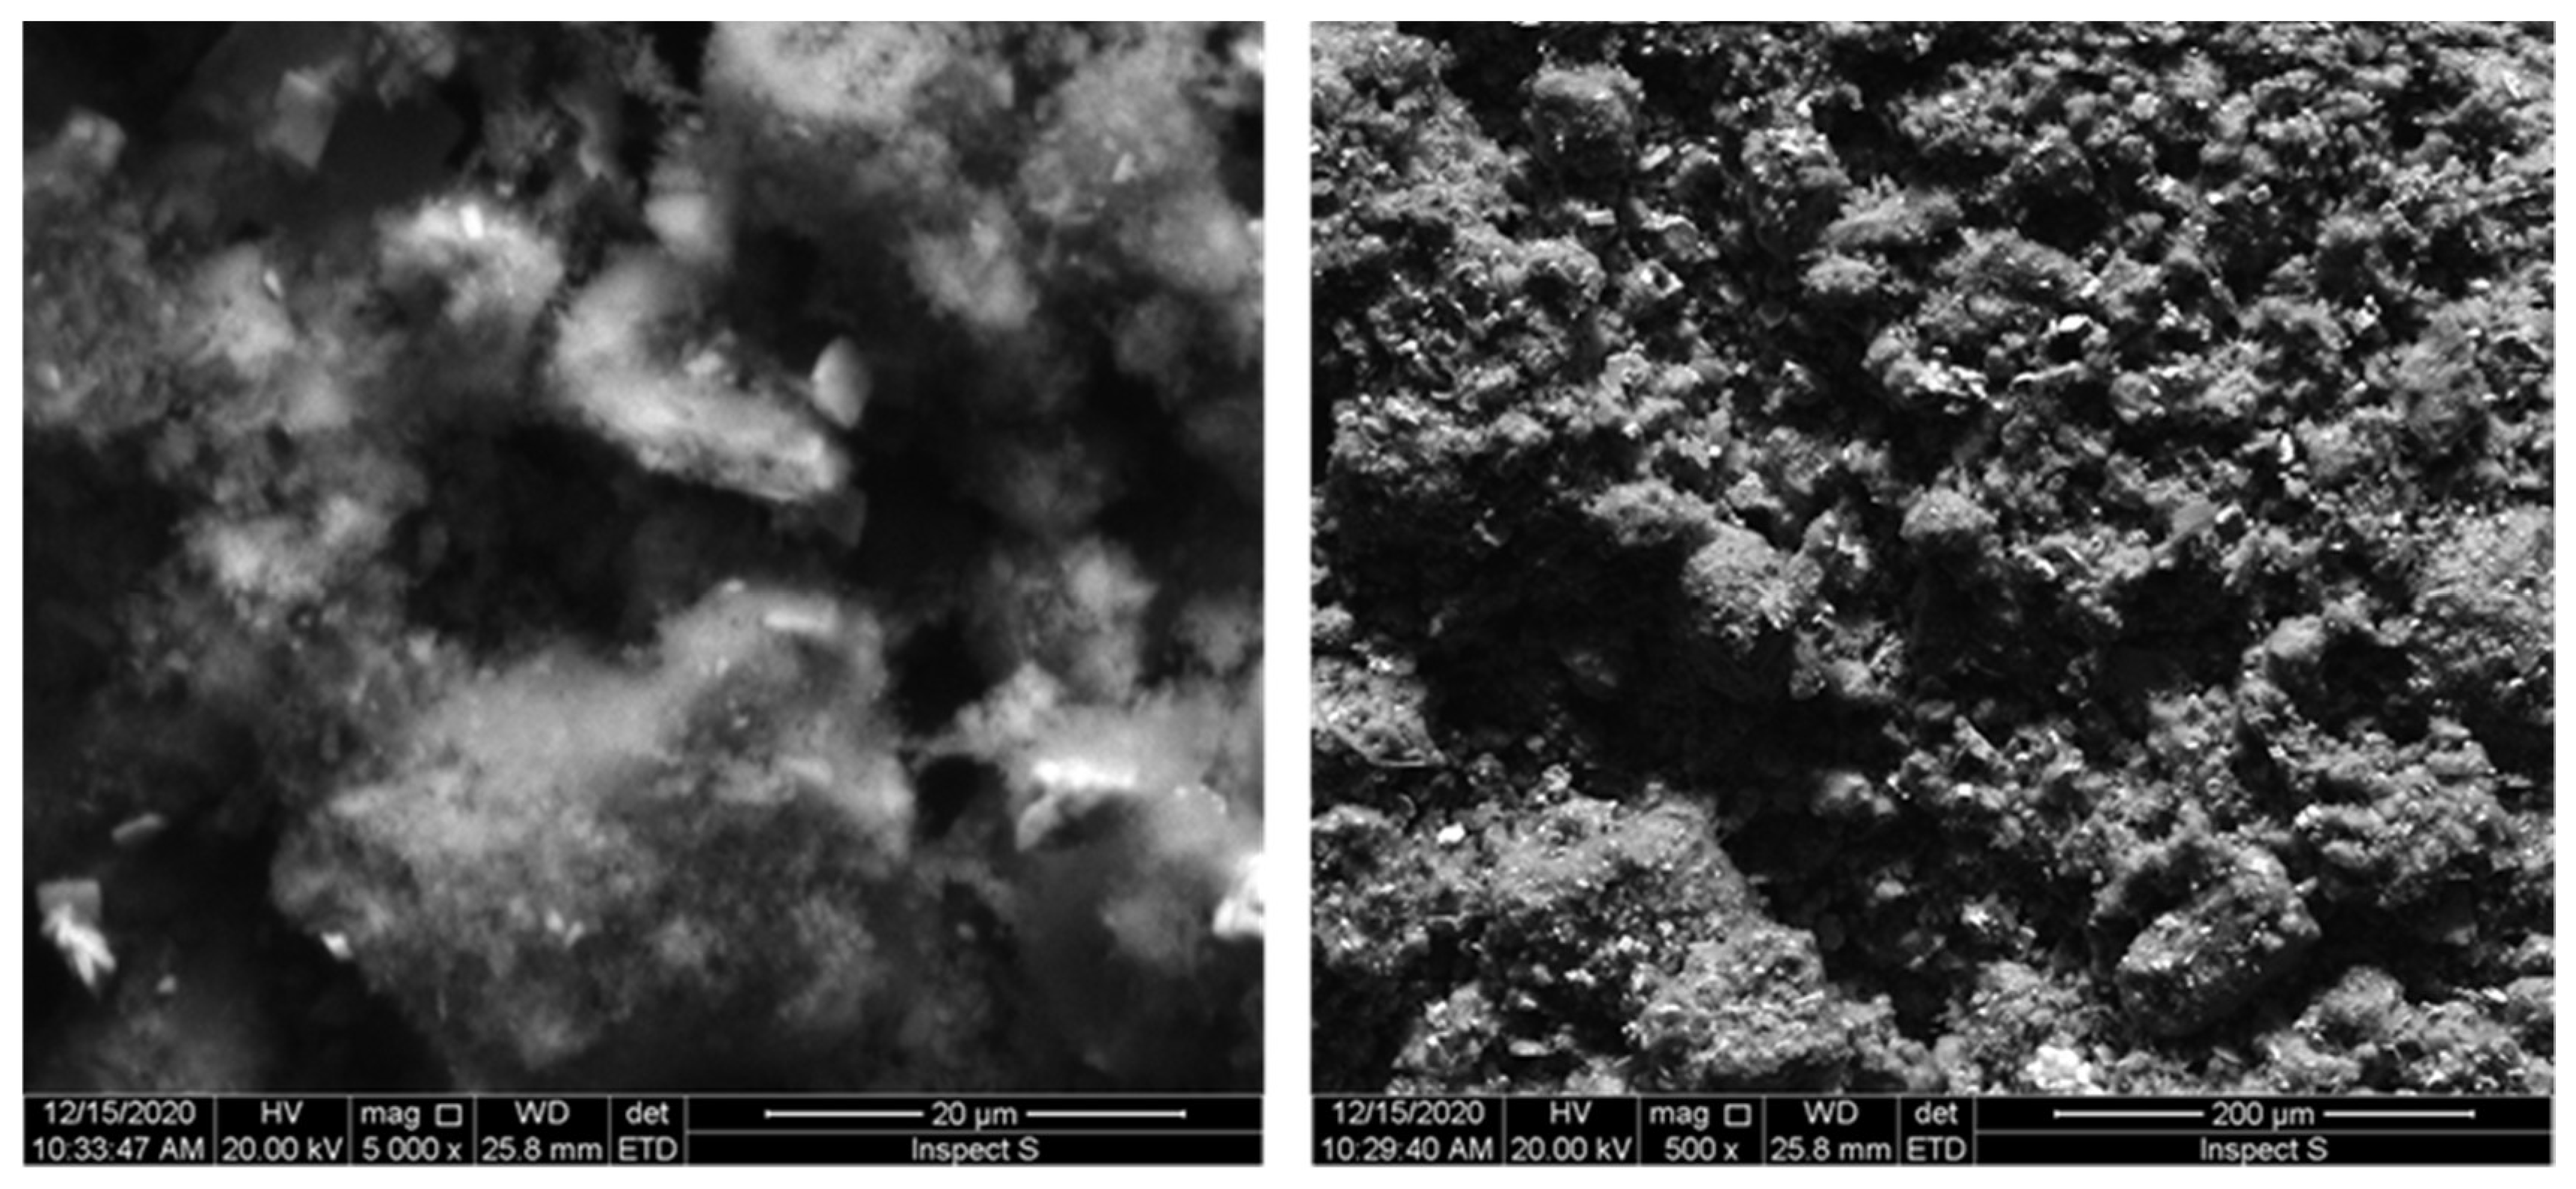
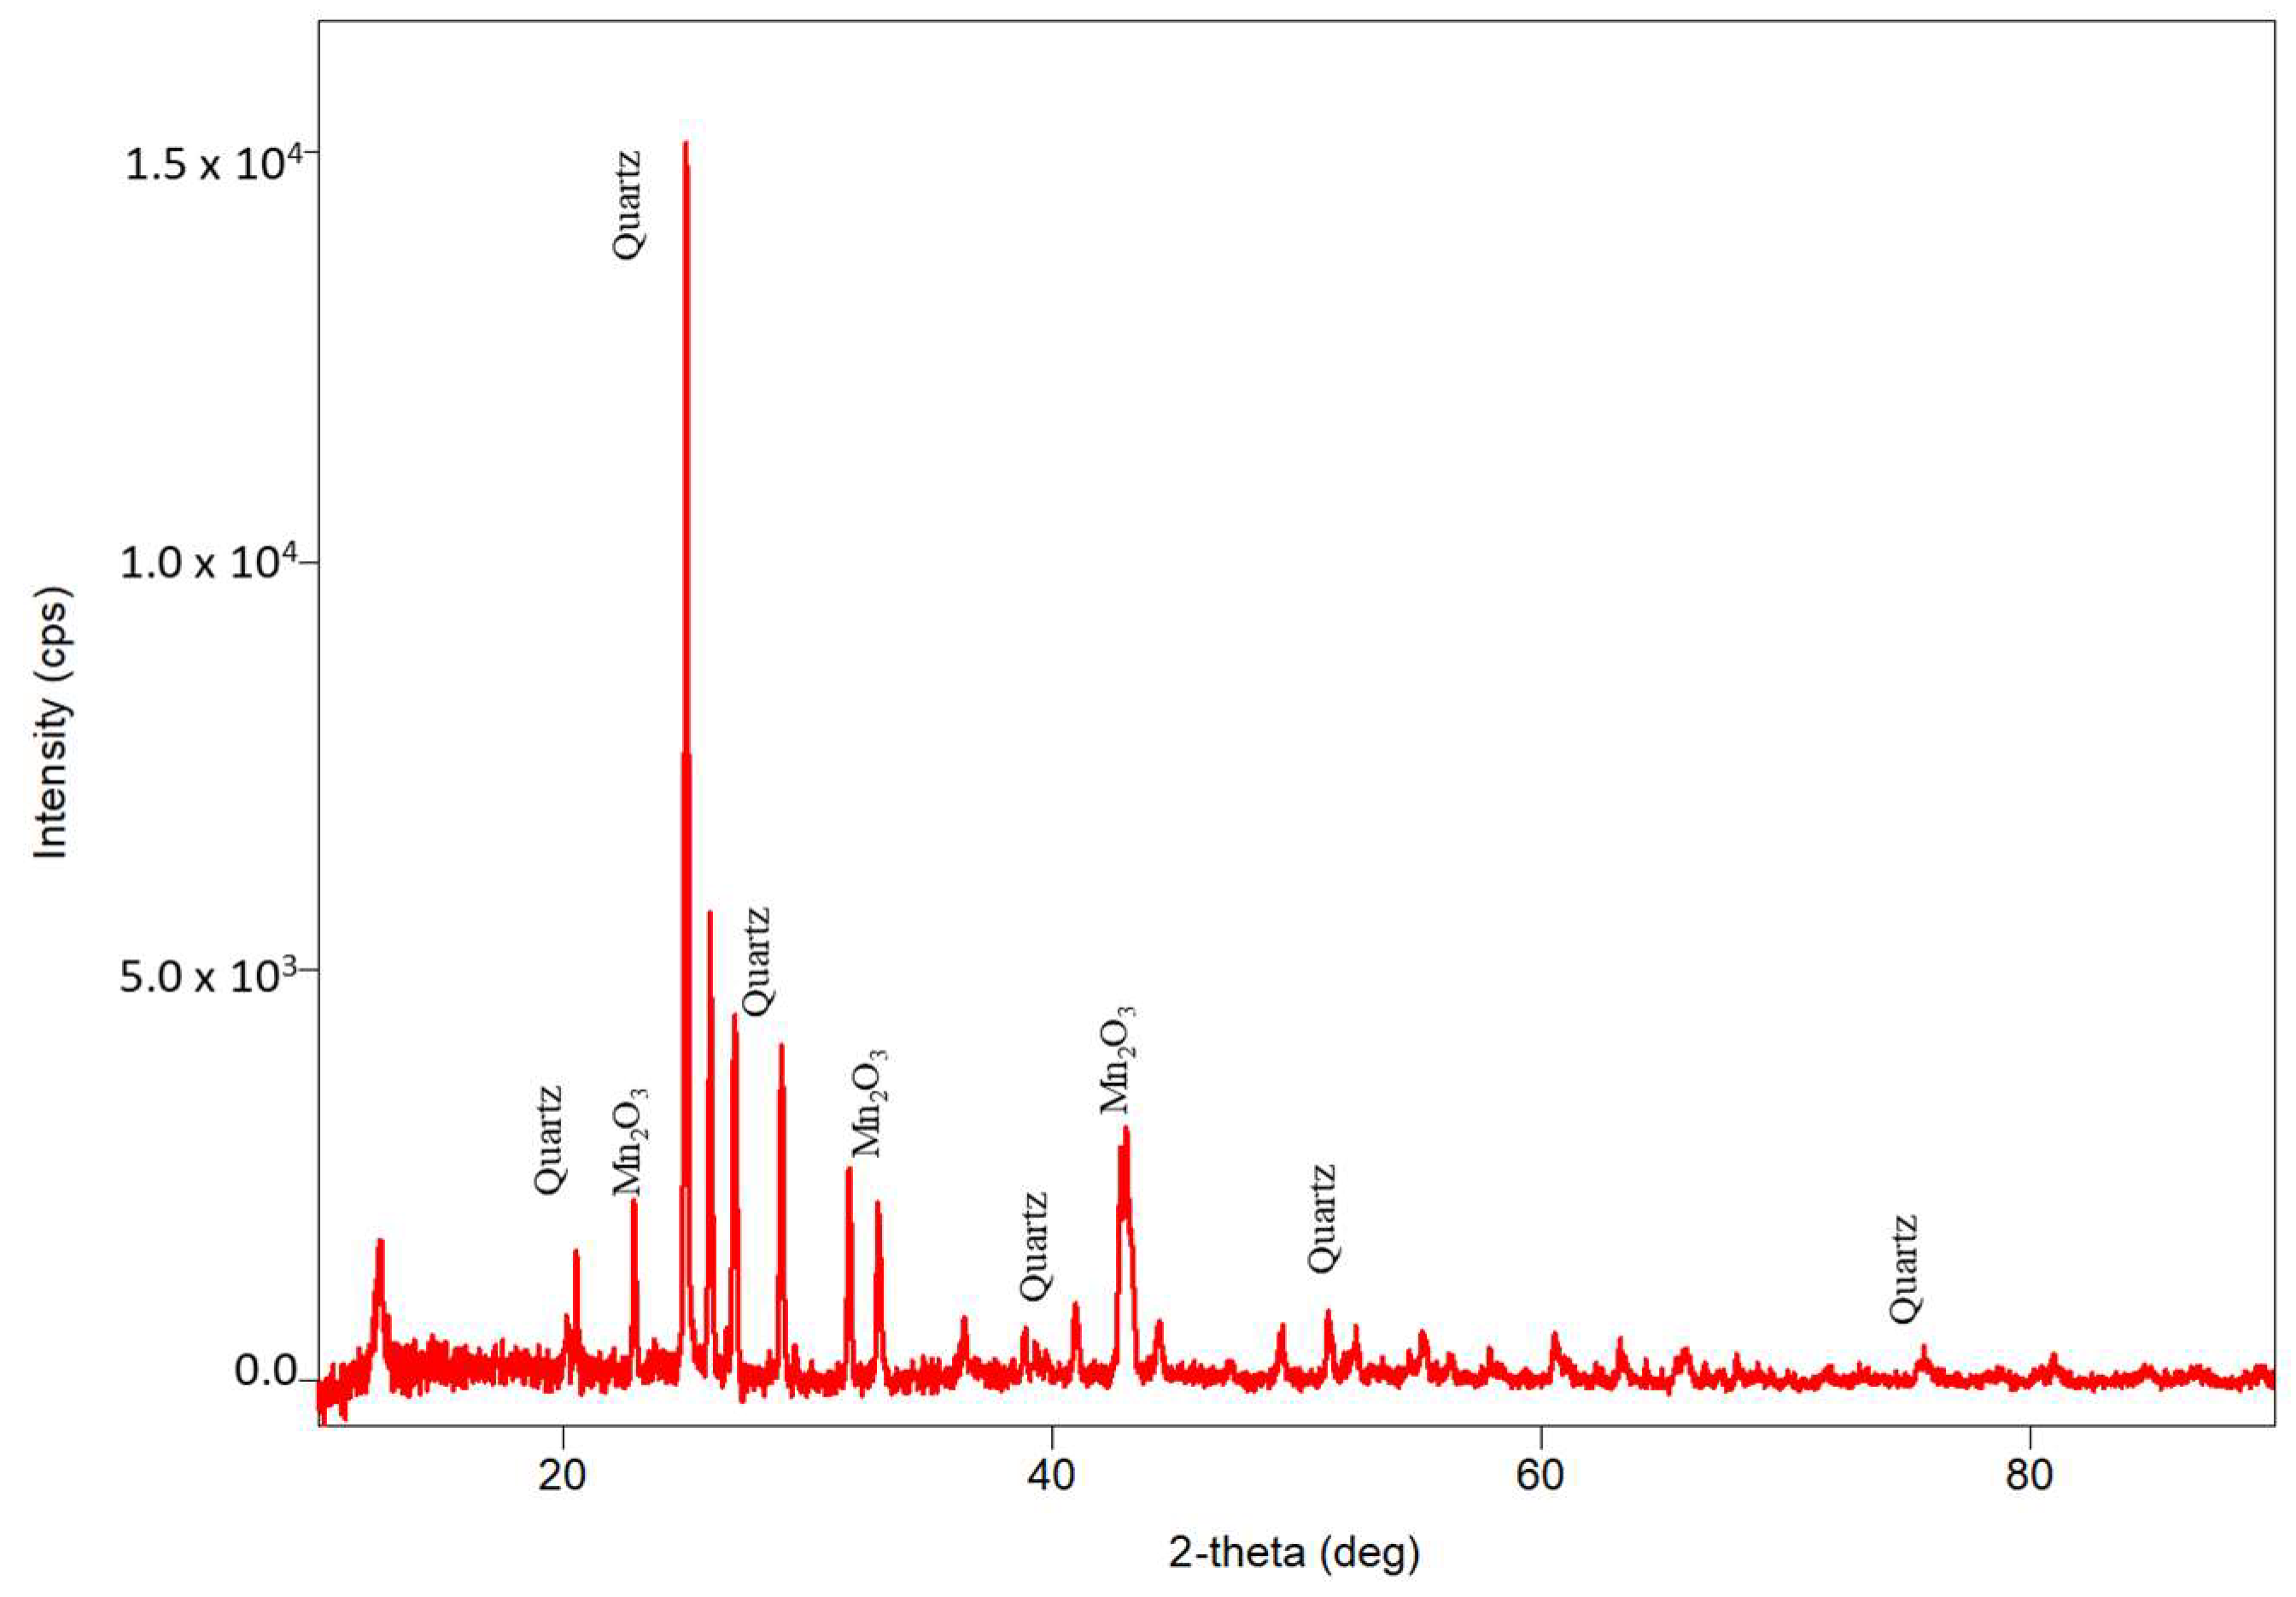
3.2. Characterizations of WTBS

The diffused aeration of raw groundwater, followed by a fixed bed sand filter, produced insoluble WTBS containing hydroxides and oxides of Fe and Mn. Elemental analysis of the WTBS as presented in Table 2 reveals that Fe, Mn, and sodium (Na) compounds were the main constituents, accounting for 61.4%, 14.05%, and 12.6%, respectively. High concentrations of Fe and Mn indicated the presence of their oxide and oxo-hydroxide forms. Moreover, a significant amount of Mg (5.2%), Ca (2.4%), K (2.0%), and Zn (1%) was observed with Fe and Mn in the WTBS. The presence of Ca and Mg suggested the formation of amorphous calcium carbonate and calcite precipitate in the WTBS.
The SEM image is an effective method to examine surface morphology in the micro-region of environmental samples [41]. The SEM image, presented in Figure 4, showed that the WTBS is irregular in shape and size. The grains are aggregated, with a micro-sized, porous, and smoothly layered structure. Therefore, the WTBS can be classified as a typical mesoporous material with a broad grain size distribution. Usually, the effectiveness of the adsorption process is highly dependent on the morphology of the adsorbent. However, the pH of the adsorbent plays a significant role in the adsorption process, particularly in the case of chemisorption and ion exchange reactions. Anion adsorption is favorable under the pH below pHpzc (pH at the potential of zero charges), while cations adsorb effectively above pHpzc [10]. The pH of WTBS was measured as 7.2.
In Figure 5, the diffraction pattern shows that the predominant phases were poorly crystalline minerals consisting primarily of quartz and Mn2O3. The observed peaks of crystalline form indicate the presence of quartz (JCPDS 47-1301) and Mn2O3 (JCPDS 41-1442). A similar XRD pattern of water treatment residuals containing quartz and Mn2O3 was also reported in a previous study [10]. The results of the XRD pattern imply that the Fe oxides present in the WTBS were amorphous. Two primary forms, including ferrihydrite and feroxyhyte (d0-FeOOH), might be the most probable products of the studied WTBS minerals.

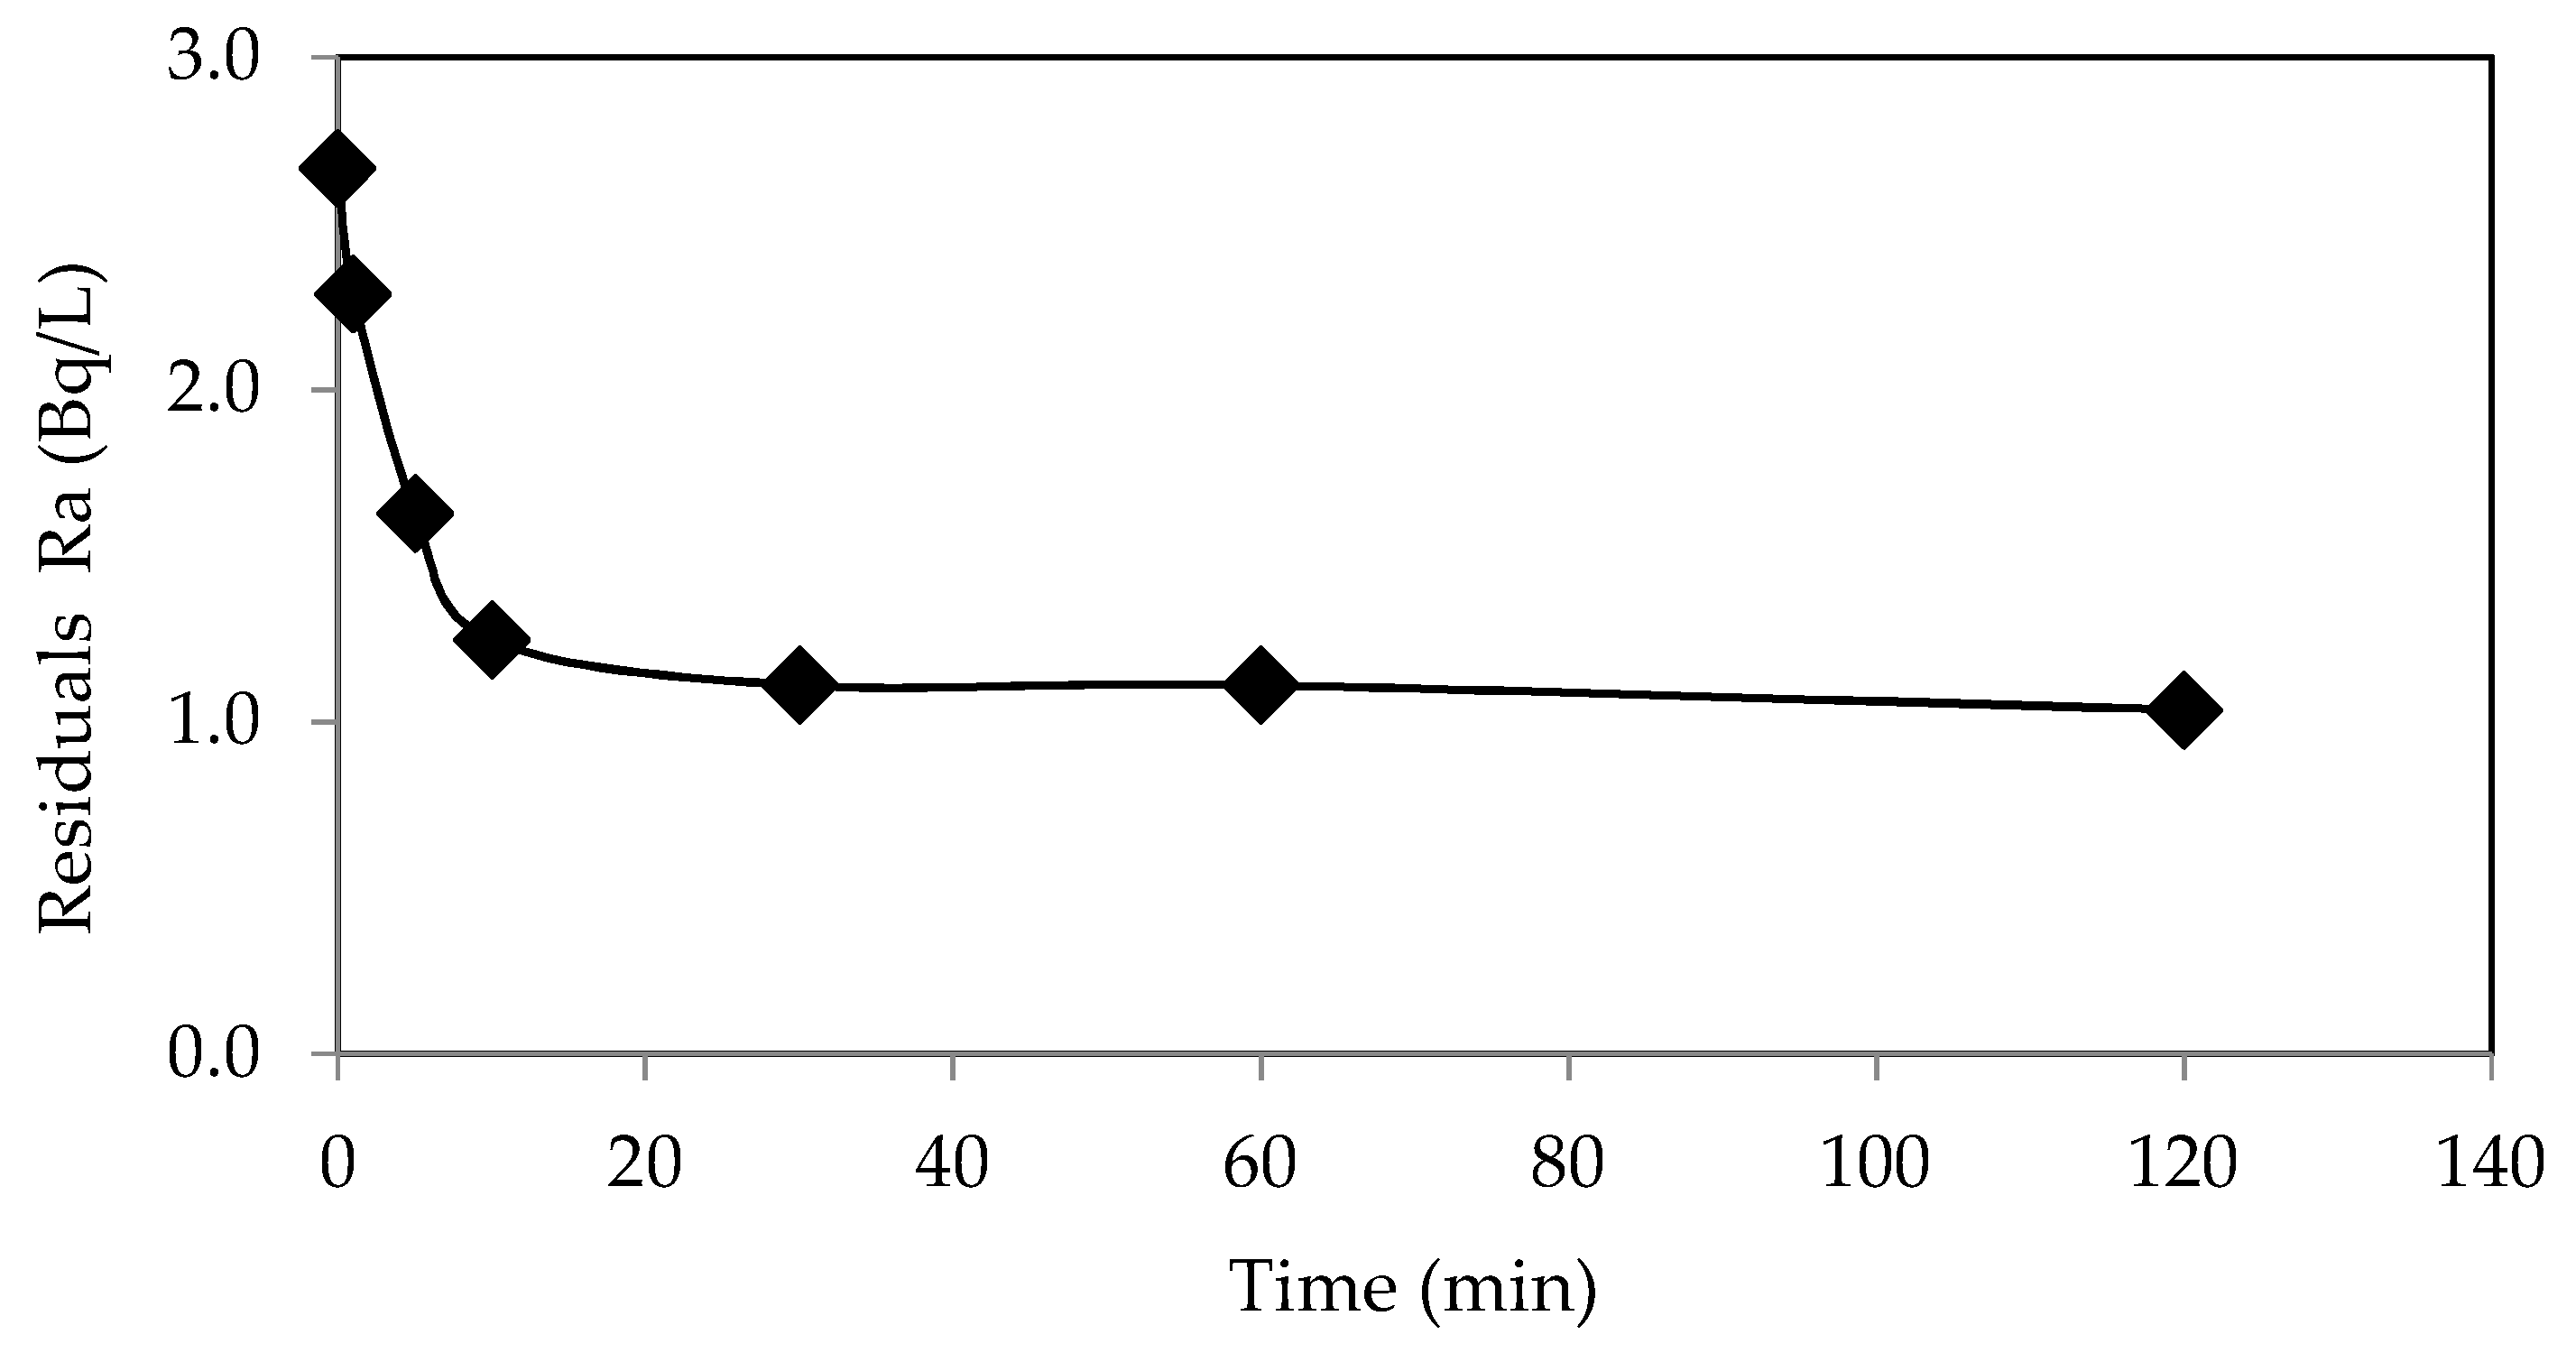
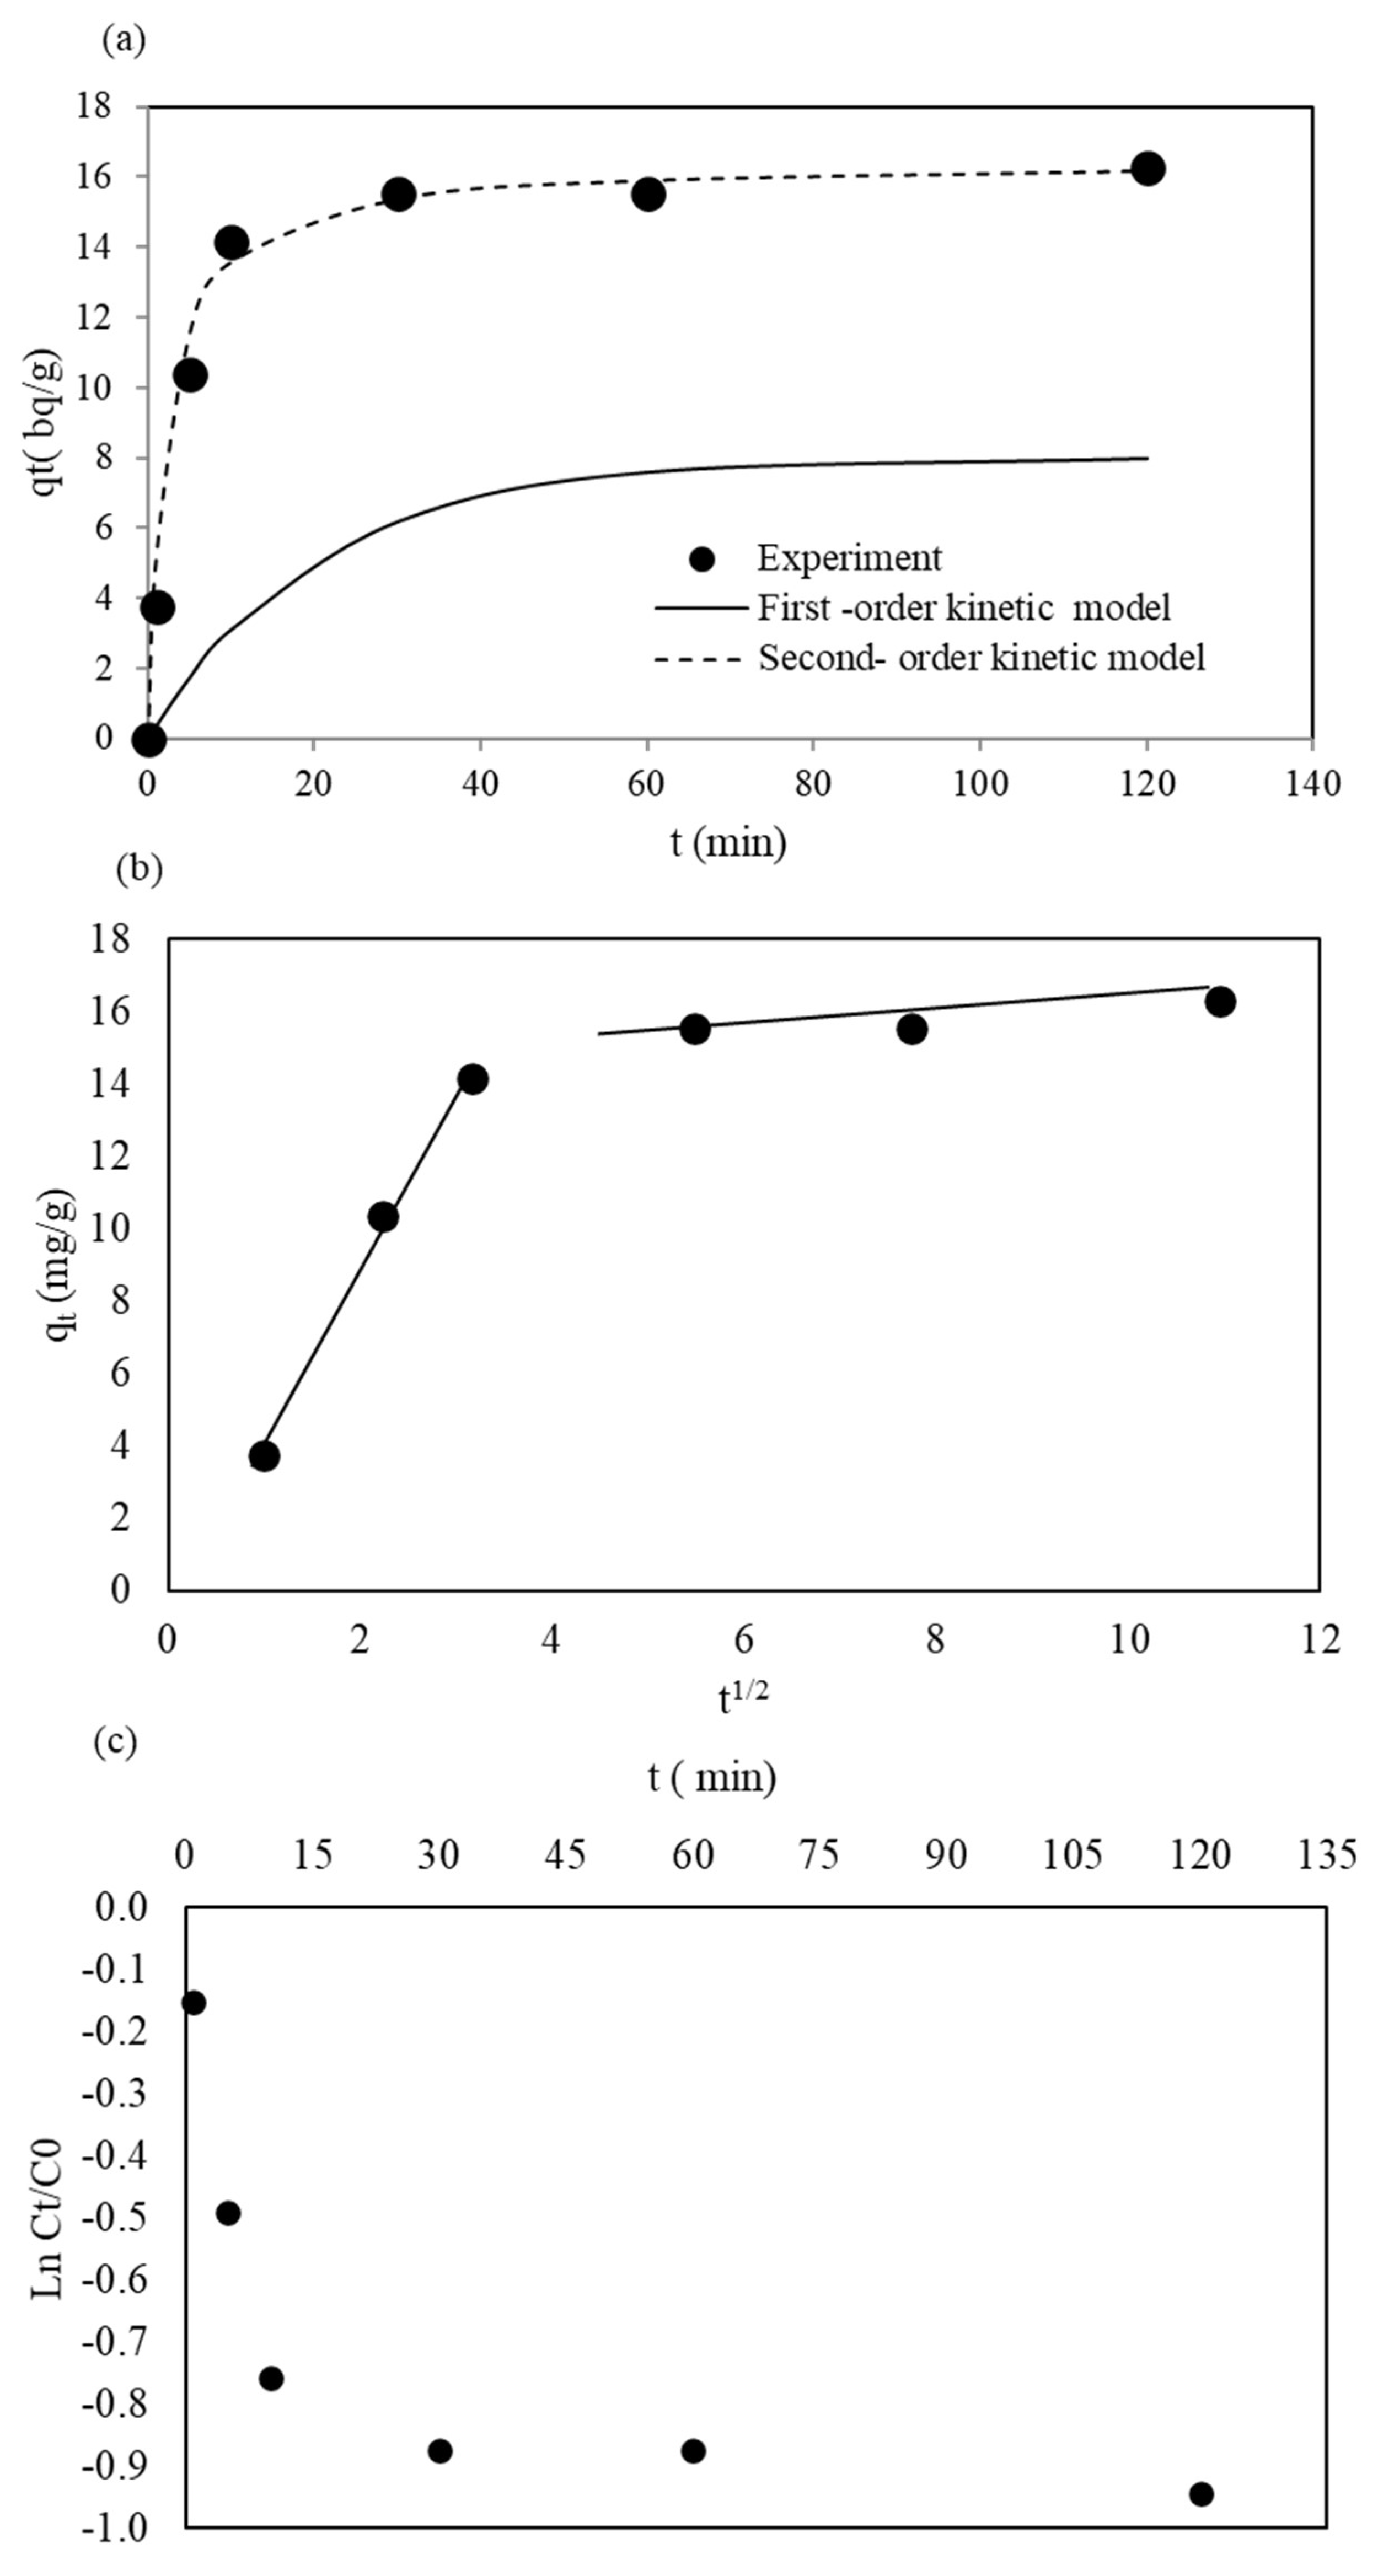
3.3. Kinetic Studies of Ra Removal by WTBS

Figure 6 presents the kinetic results of Ra adsorption on WTBS at neutral pH 7.5–8.0. The adsorption of Ra is fast and effective during the first 30 min, adsorbing around 58.3%, with a residual Ra of 1.11 Bq/L, which was then decelerated until 120 min and remained almost steady to 61% removal, with a residual Ra of 1.04 Bq/L. However, the adsorption never reached 100%, indicating that the effectiveness of Ra removal was dependent on the initial concentrations of Ra. Nevertheless, the residual Ra almost met the WHO standard (1.0 Bq/L) of maximum contaminant level (MCL) in drinking water. The adsorption equilibrium was reached at 120 min, which was presumed to be the equilibrium time for Ra adsorption. Relatively shorter equilibrium time indicates a higher concentration gradient between the bulk solution and the adsorption surface [10]. The radium adsorption efficiency (61%) of WTBS observed in this study was comparable with some of the previously studied adsorbents, where the reported removal efficiency of Ra 226 from the contaminated ground water was 60–69% for Montmorillonite, 33–45% for biochar, and around 50% for polyacrylonitrile and clinoptilolite adsorbents [30,42]. However, for a detailed comparison, a further study including batch adsorption isotherms and the influence of pH and temperature on Ra removal by the WTBS is recommended.
The adsorption rate, process mechanism, and rate-limiting step were determined by modeling the experimental data using the kinetic equations as described in Table 1. The adsorption data fitted well with the pseudo-second-order adsorption model with the correlation coefficient R2 of 0.999 (Figure 7a and Table 3), emphasizing that Ra adsorption on the WTBS is primarily governed by chemisorption rate–controlling mechanism. Equilibrium sorption capacities and adsorption rate were calculated from the model. For the PSO model, the calculated equilibrium adsorption qe (16.47 Bq/g) was close to the experimental qe value of 16.28 Bq/g (PFO). The reaction rate constant (k2) was calculated to be 0.028 g/bq.min, whereas the initial adsorption rate (h0) was found to be 7.77 Bq/g.min. Two clearly distinct phases were observed during Ra adsorption onto WTBS: rapid adsorption at the initial phase over the first 30 min (about 58% adsorption), followed by a steady adsorption stage to become equilibrium until 120 min. At the initial phase, an instantaneous and faster surface diffusion process took place due to the availability of an adequate adsorption surface of WTBS. A gradual adoption at the second phase was attributed to the slow intraparticle diffusion between the adsorbate (Ra) and the WTBS active sites.
To verify this supposition, the kinetics data were further analyzed using various adsorption diffusion models, including external film diffusion and intraparticle diffusion models. The diffusion models provide a better insight into the mechanism of the process, including the determination of rate-limiting steps. Several studies have shown that adsorption is the rate-controlling process if the plot of qt vs. t1/2 of the intraparticle diffusion model is linear and passes through the origin [10]. If the plot represents multilinearly, this indicates that the adsorption is a multi-stage process involving various limiting factors at different steps of the process. As can be seen for the Ra adsorption, the intraparticle diffusion is multilinear and has two straight lines, which did not pass through the origin (Figure 7b). Thus different processes at subsequent steps are involved and control the Ra adsorption rate by WTBS [43]. The calculated rate constant kp1 value was higher than the kP2 value (Table 4), suggesting that the intraparticle diffusion was the rate-limiting step for the adsorption of Ra onto the WTBS. Moreover, the deflection of the straight lines from the point of origin (Figure 7b) indicated that other steps, such as surface adsorption, may also be involved in the rate-limiting step in the adsorption process. For more insight, the kinetics data were also analyzed using the external diffusion (ED) model (Table 3, Figure 7c). If the linear form of the ED model (ln Ct/C0 vs. t) passes through the origin, then the process is determined by the transport of adsorbate through the boundary layer [44]. As can be seen, at the initial stage of the process (first 15 min), the plot of the ED model includes straight lines, but they do not pass through the origin. These results suggest that the chemisorption and inner-sphere complexation is a crucial phenomenon affecting the rate of the process. Overall, the kinetic data suggested that Ra adsorption by WTBS is attributed to a combination process including chemisorption rate-controlling steps, intraparticle diffusion, and external mass transfer processes.

4. Discussion

The quality of the treated BW obtained from the filtration system is presented in Table 4. The removal performance was highly effective at the optimal flux conditions, achieving almost 99.9% removal of turbidity, Fe, and Mn from the raw BW. Table 4 also compares the effluent with the WHO standards for reuse applications as well as for the drinking water. All the measured parameters in the effluent were lower than the recommended limits, showing that the low-cost ceramic filtration system is a sustainable option for BW recycling. Additionally, the ceramic filtration system used to reclaim backwash flow could significantly reduce the WTP potential for environmental impact and recover valuable resources, including BS. Overall, it can eliminate all wastewater effluent (i.e., BW) from the plant. The study found that if a WTP produced drinking water at a rate of 100,000 m3/day with a 10% backwash discharge, the ceramic filtration system is likely to treat approximately 10,000 m3/day for reclamation. Furthermore, it was calculated that approximately 1650 kg of BS can be produced daily from 10,000 m3 of BW (based on the TSS value 165 mg/L presented in Table 4), which can treat approximately 130,000 m3 of groundwater containing 2 bq/L of radium (calculated based on the equilibrium data qe = 16.47 bq/g of kinetics adsorption, presented in Table 3).
Table 5 shows that the total annualized cost for the treatment of BW decreased from 0.021 to 0.011 US$/m3 feed as the feed rate increased from 1000 to 10,000 m3/day. The lowest cost contribution was achieved at 5.5−13% of the operating cost. A filter cost contribution of approximately 55−68% remained relatively consistent with the feed rate. As the feed rate decreased, the pump’s cost contribution increased from 18 to 39%. The overall cost of the present study was found to be lower than the previously studied microfiltration systems.
Table 6 presents a comparison of transmembrane pressure (TMP), flux, and permeate turbidity of previous studies on BW treatment systems with the current study. The table shows that the range of operating TMP was 10−60 KPa, and the flux was 960−4000 L/m2/d, with an acceptable permeate quality (0.1−1.5 NTU turbidity) in the previous studies. In contrast, the operating pressure and flux in our study were found to be 3.5 kPa and 2000 L/m2/d, respectively, with the permeate quality achieving a turbidity of 0.3 NTU. Comparing the results of the current study with previous studies, it is evident that the operating pressure of the current study is approximately 3−30-fold less, with an approximately equivalent quantity and quality of permeate. Therefore, the energy consumption is low, leading to lower operating costs of the system. The manufacturing cost of the clay ceramic filter of the current study was evaluated to be 30 US $/m2, whereas those of various commercial polymeric membranes and ceramic symmetric membranes range from 500 to 4000 US$/m2 [46]. Furthermore, the lifespan of the clay ceramic filter used in the current study is likely to be longer, as the ceramic membrane offers excellent chemical and fouling resistance. Overall, it can be concluded that the ceramic filtration system appears to be economical and promising for application in BW treatment.
The ceramic filtration system reclaiming BW could significantly reduce the potential environmental impacts associated with land disposal from the discharge of BW from any WTP. This research also revealed that the produced WTBS can successfully be used as an adsorbent for radium removal.

5. Conclusions

The low-cost clay ceramic filter showed high efficiency to separate Fe and Mn hydroxides as well as turbidity from the sand filter BW to make it suitable for recycling. More than 99% of Fe, Mn, turbidity, and TSS was removed by simple ceramic filtration. Simultaneously, Fe and Mn oxides in the sand filter BS worked as adsorbents for the effective removal of Ra from groundwater. Over 60% of Ra removal was achieved by the BS in 30 min at neutral pH. The kinetics study revealed that the Ra adsorption mechanisms followed the pseudo-second-order model and were primarily controlled by chemisorption rate-controlling steps, intraparticle diffusion, and external mass transfer processes. Treatment of sand filter backwash water by a low-cost clay ceramic filters and preparation of the BWTS adsorbent for Ra removal would be a sustainable alternative to manage the water treatment BW. A further study including batch adsorption isotherms and the influence of pH and temperature on Ra removal by the BS is recommended. Analysis of the performance of the BS using a continuous column study is also necessary to determine the breakthrough curve for Ra removal.

Author Contributions

Conceptualization, M.S.; methodology, M.S. and S.S.A.; validation, M.S., H.H. and M.T.A.; formal analysis, M.S. and H.H.; investigation, M.S., S.S.A., M.T.A. and H.T.; resources, M.S., S.S.A. and M.T.A.; data curation, M.S. and H.H.; writing—original draft preparation, M.S.; writing—review and editing, S.S.A., H.H., M.T.A. and H.T.; visualization, M.S. and H.T.; supervision, M.S.; project administration, M.S.; funding acquisition, M.S. All authors have read and agreed to the published version of the manuscript.

Funding

This research was funded by the Deanship of Scientific Research, Qassim University, grant No. 9905-qec-2019-1-1-Q.

Institutional Review Board Statement

Not applicable.

Informed Consent Statement

Not applicable.

Data Availability Statement

Not applicable.

Acknowledgments

The author(s) gratefully acknowledge Qassim University, represented by the Deanship of Scientific Research, for the financial support for this research under the number (9905-qec-2019-1-1-Q) during the academic year 1440 AH/2019 AD. The authors also acknowledge the water treatment plants’ management and Water Directorate in Qassim Region of Saudi Arabia for their continuous support in sample collection and laboratory analysis.

Conflicts of Interest

The authors declare no conflict of interest.

References

  1. Walsh, M.E.; Gagnon, G.A.; Alam, Z.; Andrews, R.C. Bio-stability and disinfectant by-product formation in drinking water blended with UF-treated filter backwash water. Water Res. 2008, 42, 2135–2145. [Google Scholar] [CrossRef]
  2. Kim, Y.H.; Eom, J.Y.; Kim, K.Y.; Lee, Y.S.; Kim, H.S.; Hwang, S.J. Applicability study of backwash water treatment using tubular membrane system with dead-end filtration operation mode. Desalination 2010, 261, 104–110. [Google Scholar] [CrossRef]
  3. Weiying, L.; Yuasa, A.; Bingzhi, D.; Naiyun, G. Study on backwash wastewater from rapid sand-filter by monolith ceramic membrane. Desalination 2010, 250, 712–715. [Google Scholar] [CrossRef]
  4. Shafiquzzaman, M.; Al-Mahmud, A.; AlSaleem, S.S.; Haider, H. Application of a Low Cost ceramic filter for Recycling Sand Filter Backwash Water. Water 2018, 10, 150. [Google Scholar] [CrossRef] [Green Version]
  5. Li, S.; Heijman, S.G.J.; Verberk, J.Q.J.C.; Verliefde, A.R.D.; Kemperman, A.J.B.; VanDijk, J.C.; Amya, G. Impact of backwash water composition on ultrafiltration fouling control. J. Membr. Sci. 2009, 344, 17–25. [Google Scholar] [CrossRef]
  6. Ling, Z.L.; Dong, Y.; Zi-Jie, Z.; Ping, G. Application of hybrid coagulation–microfiltration process for treatment of membrane backwash water from water works. Sep. Purif. Technol. 2008, 62, 415–422. [Google Scholar]
  7. Huanga, C.; Lina, J.R.; Leea, W.S.; Pan, J.R.; Zhao, B. Effect of coagulation mechanism on membrane permeability incoagulation-assisted microfiltration for spent filter backwash water recycling. Colloids Surf. A Physicochem. Eng. Asp. 2011, 378, 72–78. [Google Scholar] [CrossRef]
  8. Sardari, R.; Osouleddini, N. The dataontheremovalofturbidityand biological agentsinspent filter backwash by bed ceramic in water treatment process. Data Brief 2018, 19, 1794–1798. [Google Scholar] [CrossRef] [PubMed]
  9. Makris, K.C.; O’Connor, G.A. Chapter 28 Beneficial utilization of drinking-water treatment residuals as contaminant-mitigating agents. Develop. Environ. Sci. 2007, 5, 609–635. [Google Scholar]
  10. Ocinski, D.; Jacukowicz-Sobala, I.; Mazur, P.; Raczyk, J.; Kociołek-Balawejder, Z. Water treatment residuals containing iron and manganese oxides or arsenic removal from wate—Characterization of physicochemical properties and adsorption studies. Chem. Eng. J. 2016, 294, 210–221. [Google Scholar] [CrossRef]
  11. Condomines, M.; Rihs, S.; Lloret, E.; Seidel, J. Determination of the four natural Ra isotopes in thermal waters by gamma-ray spectrometry. Appl. Radiat. Isot. 2010, 68, 384–391. [Google Scholar] [CrossRef]
  12. Al-Masri, M.; Suman, H. NORM waste management in the oil and gas industry: The Syrian experience. J. Radioanal. Nucl. Chem. 2003, 256, 159–162. [Google Scholar] [CrossRef]
  13. Testa, C.; Desideri, D.; Meli, M.; Roselli, C.; Bassignani, A.; Finazzi, P. Determination of uranium, thorium and radium in waters, soils and muds around a uranium mine in decommissioning. Appl. Radiat. Isot. 1994, 45, 394. [Google Scholar] [CrossRef]
  14. Barišić, D.; Lulić, S.; Miletić, P. Radium and uranium in phosphate fertilizers and their impact on the radioactivity of waters. Water Res. 1992, 26, 607–611. [Google Scholar] [CrossRef]
  15. USEPA. Guidelines for Developmental Toxicity Risk Assessment; Risk Assessment Forum, U.S. Environmental Protection Agency: Washington, DC, USA, 1991.
  16. USEPA. United States Environmental Protection Agency: Drinking Water Regulations and Health Advisories; EPA 822-B-96-002; Office of Water, USEPA: Washington, DC, USA, 1996.
  17. WHO. World Health Organization, Management of Radioactivity in Drinking-Water; WHO: Geneva, Switzerland, 2018; ISBN 78-92-4-151374-6. [Google Scholar]
  18. Alkhomashi, N.; Al-Hamarneh, I.F.; Almasoud, F. Determination of natural radioactivity in irrigation water of drilled wells in northwestern Saudi Arabia. Chemosphere 2016, 144, 1928–1936. [Google Scholar] [CrossRef]
  19. Almasoud, F.; Ababneh, Z.Q.; Alanazi, Y.J.; Khandaker, M.U.; Sayyed, M. Assessment of radioactivity contents in bedrock groundwater samples from the northern region of Saudi Arabia. Chemosphere 2020, 242, 125181. [Google Scholar] [CrossRef]
  20. Kumar, A.; Karpe, R.; Rout, S.; Gautam, Y.P.; Mishra, M.; Ravi, P.; Tripathi, R. Activity ratios of 234U/ 238U and 226Ra/ 228Ra for transport mechanisms of elevated uranium in alluvial aquifers of groundwater in south-western (SW) Punjab, India. J. Environ. Radioact. 2016, 151, 311–320. [Google Scholar] [CrossRef]
  21. Turhan, S.; Özçıtak, E.; Ta¸skın, H.; Varinlioglu, A. Determination of natural radioactivity by gross alpha and beta measurements in ground water samples. Water Res. 2013, 47, 3103–3108. [Google Scholar] [CrossRef] [PubMed]
  22. Al-Zubari, W. Sustainable Water Consumption in Arab Countries. In Arab Environment: Sustainable Consumption. Annual Report of Arab Forum for Environment and Development, 2015; Abdel Gelil, I., Saab, N., Eds.; Technical Publications: Beirut, Lebanon, 2015; pp. 108–133. [Google Scholar]
  23. Haider, H.; Al-Salamah, I.S.; Ghumman, A.R. Development of Groundwater Quality Index using Fuzzy-based Multicriteria Analysis for Buraydah, Qassim, Saudi Arabia. Arab. J. Sci. Eng. 2017, 49, 4033–4051. [Google Scholar] [CrossRef]
  24. Al-Hamarneh, I.F.; Alkhomashi, N.; Almasoud, F. Study on the radioactivity and soil-to-plant transfer factor of 226Ra, 234U and 238U radionuclides in irrigated farms from the northwestern Saudi Arabia. J. Environ. Radioact. 2016, 160, 1–7. [Google Scholar] [CrossRef]
  25. Khedr, M.G. Radioactive contamination of groundwater, special aspects and advantages of removal by reverse osmosis and nanofiltration. Desalination 2013, 321, 47–54. [Google Scholar] [CrossRef]
  26. Baeza, A.; Salas, A.; Guill_en, J.; Mu~noz-Serrano, A.; Ontalba-Salamanca, M.A.; Jim_enez-Ramos, M.C. Removal naturally occurring radionuclides from drinking water using a filter specifically designed for Drinking Water Treatment Plants. Chemosphere 2017, 167, 107–113. [Google Scholar] [CrossRef] [PubMed]
  27. Clifford, D.A.; Zhang, Z. Modifying ion exchange for combined removal of uranium and radium. J. Am. Water Works Assoc. 1994, 86, 214–227. [Google Scholar] [CrossRef]
  28. Samolej, K.; Chalupnik, S. Investigations on the application of different synthetic zeolites for radium removal from water. J. Environ. Radioact. 2021, 229–230, 106529. [Google Scholar] [CrossRef] [PubMed]
  29. Erenturk, S.; Kaygun, A.K. Removal of 226Ra from aqueous media and its thermodynamics and kinetics. J. Radioanal. Nucl. Chem. 2017, 311, 1227–1233. [Google Scholar] [CrossRef]
  30. Chalupnik, S.; Franus, W.; Wysocka, M.; Gzyl, G. Application of zeolites for radium removal from mine water. Environ. Sci. Pollut. Res. 2013, 20, 7900–7906. [Google Scholar] [CrossRef] [PubMed] [Green Version]
  31. Nagar, M.S.; Abdou, A.A.; Abdel, R.; Ghazala, S. Removal of Radium from Uranium Effluent by Manganese Oxide Coated Modified Bentonite (Mn-NaB) Mediterranean. J. Chem. 2018, 7, 105–114. [Google Scholar]
  32. Chen, M.A.; Kocar, B.D. Radium Sorption to Iron (Hydr) oxides, Pyrite, and Montmorillonite: Implications for Mobility. Environ. Sci. Technol. 2018, 52, 4023–4030. [Google Scholar] [CrossRef]
  33. Wołowiec, M.; Komorowska-Kaufman, M.; Pruss, A.; Rzepa, G.; Bajda, T. Removal of Heavy Metals and Metalloids from Water Using Drinking Water Treatment Residuals as Adsorbents: A Review. Minerals 2019, 9, 487. [Google Scholar] [CrossRef] [Green Version]
  34. Shen, C.; Zhao, Y.; Li, W.; Yang, Y.; Liu, R.; Morgen, D. Global profile of heavy metals and semimetals adsorption using drinking water treatment residual. Chem. Eng. J. 2019, 372, 1019–1027. [Google Scholar] [CrossRef]
  35. Shafiquzzaman, M.; Hasan, M.M.; Nakajima, J.; Mishima, I. Development of a simple and effective arsenic removal filter based on ceramic filtration. J. Water Environ. Technol. 2011, 9, 333–347. [Google Scholar] [CrossRef] [Green Version]
  36. Ho, Y.S.; McKay, G. Pseudo-second order model for sorption processes. Process. Biochem. 1999, 34, 451–465. [Google Scholar] [CrossRef]
  37. Plazinski, W.; Dziuba, J.; Rudzinski, W. Modelling of sorption kinetics: The pseudo-second order equation and the sorbate intraparticle diffusivity. Adsorption 2013, 19, 1055–1064. [Google Scholar] [CrossRef] [Green Version]
  38. Liu, W.; Zhang, J.; Zhang, C.; Wang, Y.; Li, Y. Adsorptive removal of Cr (VI) by Fe-modified activated carbon prepared from Trapa natans husk. Chem. Eng. J. 2010, 162, 677–684. [Google Scholar] [CrossRef]
  39. APHA. Standard Methods for the Examination of Water and Wastewater; American Public Health Association (APHA): Washington, DC, USA, 2005. [Google Scholar]
  40. Sethi, S.; Wiesner, M.R. Simulated cost comparisons of hollow-fiber and integrated nanofiltration configurations. Water Res. 2000, 34, 2589–2597. [Google Scholar] [CrossRef]
  41. Li, J.H.; Zheng, L.R.; Wang, S.L.; Wu, Z.; Wu, W.; Niazi, N.; Shaheen, S.M.; Rinklebe, J.; Bolan, N.; Ok, Y.S.; et al. Sorption mechanisms of lead on silicon-rich biochar in aqueous solution: Spectroscopic investigation. Sci. Total Environ. 2019, 672, 572–582. [Google Scholar] [CrossRef] [PubMed]
  42. Almasoud, F.I.; Al-Farraj, A.S.; Al-Wabel, M.I.; Usman, A.R.A.; Alanazi, Y.J.; Ababneh, Z.Q. The Potential Use of Zeolite, Montmorillonite, and Biochar for the Removal of Radium-226 from Aqueous Solutions and Contaminated Groundwater. Processes 2020, 8, 1537. [Google Scholar] [CrossRef]
  43. World Health Organization (WHO). Guidelines for Drinking Water Quality, 2nd ed.; World Health Organization: Geneva, Switzerland, 2004. [Google Scholar]
  44. Lopez, M.M.C.; Perez, M.C.C.; Garcia, M.S.D.; Vilarino, J.M.L.; Rodriguez, M.V.G.; Losada, L.F.B. Preparation, evaluation and characterization of quercetin-molecularly imprinted polymer for preconcentration and clean-up of catechins. Anal. Chim. Acta 2012, 721, 68–78. [Google Scholar] [CrossRef]
  45. World Health Organization (WHO). Guidelines for the Safe Use of Wastewater, Excreta and Greywater, Volume 4: Excreta and Greywater Use in Agriculture; WHO: Geneva, Switzerland, 2006. [Google Scholar]
  46. Nandi, B.K.; Uppaluri, R.; Purkait, M.K. Treatment of Oily Waste Water Using Low-Cost Ceramic Membrane: Flux Decline Mechanism and Economic Feasibility. Sep. Sci. Technol. 2009, 44, 2840–2869. [Google Scholar] [CrossRef]
  47. Vigneswaran, S.; Boonthanon, S.; Prasanthia, H. Filter backwash water recycling using crossflow microfiltration. Desalination 1996, 106, 31–38. [Google Scholar] [CrossRef]
  48. Willemse, R.J.N.; Brekvoort, Y. Full-scale recycling of backwash water from sand filters using dead-end membrane Filtration. Water Res. 1999, 33, 3379–3385. [Google Scholar] [CrossRef]
  49. Reissmann, F.G.; Uhl, W. Ultrafiltration for the reuse of spent filter backwash water from drinking water treatment. Desalination 2006, 198, 225–235. [Google Scholar] [CrossRef]
  50. Ćurko, J.; Mijatović, I.; Rumora, D.; Crnek, V.; Matošić, M.; Nežić, M. Treatment of spent filter backwash water from drinking water treatment with immersed ultrafiltration membranes. Desalination Water Treat. 2013, 51, 4901–4906. [Google Scholar] [CrossRef]
Figure 1. A conceptual model for sustainable BW management system.
Water 13 02799 g001
Figure 2. Schematic diagram of water treatment processes in Buraydah, Qassim, Saudi Arabia.
Water 13 02799 g002
Figure 3. Removal performances of (a) turbidity, (b) Fe, and (c) Mn by using continuous ceramic filtration experiments.
Water 13 02799 g003
Figure 4. SEM images of WTBS: left image (surface at 5000× magnification); right image (surface at 500× magnification).
Water 13 02799 g004
Figure 5. X-ray diffraction pattern of WTBS.
Water 13 02799 g005
Figure 6. Removal of Ra by WTBS with time.
Water 13 02799 g006
Figure 7. (a) Kinetics of data and fitted models of radium adsorption of WTBS, (b) plot of the intraparticle diffusion model and, (c) plots of the external diffusion model.
Water 13 02799 g007
Table 1. Equations for kinetics adsorption models.
Model NameMathematical ModelModel Parameters Definition
Pseudo-first-order model d q t d t = k t ( q e q t )
Integrated from
ln ( q e q t ) = ln q e = k 1 t
qe = amount of Ra adsorbed at equilibrium time (bq/g)
qt = amount of Ra adsorbed at time t (bq/g)
k1 = pseudo-first-order rate constant (/min)
Pseudo-second-order model d q t d t = k 2 ( q e q t ) 2
Integrated from
1 q t = 1 k 2 q e 2 + 1 q e t
Initial adsorption rate
h 0 = k 2 q e 2
k2 = pseudo-second-order rate constant (g/mg/min)
Intraparticle diffusion model q t = k p t 1 2 + C kp = equilibrium rate constant of intraparticle diffusion (bq/g.min0.5)
C = intraparticle diffusion model constant (bq/g)
External diffusion model ln ( c t c 0 ) = k e x t kex = equilibrium rate constant of external diffusion (/min)
c0 = initial concentration of Ra in the solution (bq/L)
ct = concentration of Ra in the solution at time t (bq/L)
Table 2. Elemental compositions of the WTBS.
ElementsConcentrations (mg/L)% Content in WTBS
Fe9.67861.419
Mn2.21514.057
Na1.99212.640
Mg0.8295.264
Ca0.3872.453
K0.3262.070
Zn0.1591.010
Al0.0720.459
Ni0.0430.276
V0.0080.050
Cu0.0080.049
Cd0.0070.046
Rb0.0070.045
Li0.0070.042
Cr0.0060.037
Pb0.0050.033
Se0.0030.021
Co0.0030.018
As0.0010.009
Table 3. Kinetic parameters for Radium adsorption on WTBS.
ModelsParametersValues
Pseudo-first-order kinetic model
qe exp (bq/g)16.28
qe cal (bq/g)8.00
k1 (/min)0.049
R20.72
Pseudo-second-order kinetic model
qe cal (bq/g)16.47
k2 (g/bq.min)0.028
R20.999
h0 (bq/g.min)7.77
Intraparticle diffusion model
kp1(bq/g.min0.5)4.847
c1 (bq/g)–0.907
R20.995
kp2 (bq/g.min0.5)0.141
c1 (bq/g)13.72
R20.848
External diffusion model
kex (/min)0.280
R20.981
Table 4. Contaminant removal performance of low-cost clay ceramic filters compared to WHO standards.
ParameterInfluentEffluentWHO Reuse Standard [45]WHO Drinking Water Standard [43]
PH7.2 ± 0.267.2 ± 0.156.0–9.06.5–8.5
Alkalinity (mg/L)131 ± 5.0155 ± 27--
Turbidity (NTU)635 ± 2530.95 ± 1.25<1
TSS (mg/L)165 ± 210.31± 0.41--
TDS (mg/L)770 ± 5788 ± 13-500
Conductivity (µS/cm)1545 ± 101648 ± 71-400
Hardness (mg/L)303 ± 6326 ± 21--
Ca (mg/L)82.6 ± 2.0110 ± 17--
Mg (mg/L)23 ± 0.718.0 ± 3.0--
Fe (mg/L)54.9 ± 24.00.08 ± 0.1850.3
Mn (mg/L)7.6 ± 4.80.03 ± 0.0450.20.1
Si (mg/L)18.3 ± 2.118.3 ± 2.5--
Table 5. The cost of water production of the ceramic filtration process for BW treatment at different feed rates.
Feed Flow (m3/day)Total Cost (US$/m3 Feed)% Contribution
Filter CostPump CostOperating (Energy Cost)
1000 (1%)0.02155395.5
1500 (1.5%)0.01858356.3
2500 (2.5%)0.01562307.5
5000 (5%)0.01266249.5
7500 (7.5%)0.011682111.2
10,000 (10%)0.011681912.9
The feed flow was calculated from the percentage (%, indicated in the bracket) of total freshwater production (100,000 m3/day).
Table 6. Comparison of TMP, flux, and permeate turbidity of different BW treatment systems of previous studies and those of the current study.
Filtration ModeMaterialsTMP (kPa)Flux (L/m2/d)Permeate Turbidity (NTU)References
Cross-flow MFCeramic1001200−16000.2−1.5[47]
Dead-end MFPolyethylene20−601000−2000<0.003[48]
Dead-end UFPolysulfone15960-[49]
Dead-end UFPolysulfone401200-[2]
Dead-end MFCeramic304000<0.1[3]
Dead-end UFPolyethersulfone or Polyethylene10−30240−1300<0.6[50]
Dead end MFPolytetrafluoroethylene40-1.6–2.0[7]
UF membrnaeCeramic100-0.14[8]
Dead-end MFClay ceramic3.52000<0.3This study
Publisher’s Note: MDPI stays neutral with regard to jurisdictional claims in published maps and institutional affiliations.

