Article

Predicted and Measured Concentration of Pharmaceuticals in Surface Water of Areas with Increasing Anthropic Pressure: A Case Study in the Coastal Area of Central Italy

Institute of Life Sciences, Scuola Superiore Sant’Anna, 56127 Pisa, Italy
*
Author to whom correspondence should be addressed.
Water 2021, 13(20), 2807; https://doi.org/10.3390/w13202807
Submission received: 15 July 2021 / Revised: 26 September 2021 / Accepted: 28 September 2021 / Published: 9 October 2021
(This article belongs to the Section Water Quality and Contamination)

Abstract

:
This study investigated the occurrence of 12 pharmaceuticals (PhCs) in surface water in Central Italy, aiming to improve the estimation of the predicted environmental concentration (PEC) by normalizing the loads to the number of inhabitants of the drainage system in rural, periurban, and urban areas. We performed two sampling campaigns assessing the concentration of PhCs (measured environmental concentration (MEC)) in surface water and in effluent from a wastewater treatment plant. The reliability of PEC calculated by the refined formula was assessed and compared to the ratio obtained by the unrefined formula. MECs of diclofenac, estradiol, estrone, ibuprofen, metformin, naproxen, sulfamethoxazole, atenolol, carbamazepine, and dehydro-erythromycin were significantly higher in urban than in periurban and rural areas, and increases were 12-, 3600-, 256-, 33-, 18-, 120-, 10-, 5-, 2-, and 1-fold, respectively. Refinement of PEC improved estimation of PhC concentrations for all areas, especially for the urban one. The environmental risk was predicted as low for atenolol, carbamazepine, erythromycin, metformin, and naproxen; low/medium for diclofenac and ibuprofen; and high for clarithromycin, estradiol, estrone, and sulfamethoxazole. Overall, the highest risk was posed by PhCs in effluent, while a progressively decreasing risk was estimated for urban, periurban, and rural areas.

1. Introduction

Surface or groundwater quality is a function of natural processes and human activities [1,2,3,4,5]. Main natural processes are weathering of bedrock minerals, evapotranspiration, deposition of dust and salt, leaching of organic matter and nutrients from soil, hydrological factors leading to run-off, and biological processes. Human activities, such as discharging treated or untreated sewage, may determine point and nonpoint sources of pollution in both rural and urban areas, releasing, e.g., nitrates [6,7]; metals such as mercury, lead, and cadmium [8]; organics such as pesticides [9]; and pharmaceutical compounds (PhCs) [10,11,12,13]. Several physical, biological, and chemical methods were developed and applied for the removal of inorganic and organic compounds from water. According to the targeted components, treatment processes are generally classified into three main categories: primary, secondary, and tertiary treatments [14]. Primary treatment removes inorganic and organic suspended solids through floatation, settling, and screening mechanisms, while secondary treatment removes the residual organic matter and, in some cases, dissolved nutrients through trickling filters consisting of bacteria-coated stones and bacterial activated sludges. Finally, tertiary treatment may be required to remove suspended and dissolved materials, such as nutrients and metals, to meet regulatory requirements and can be based on various chemical and biological treatments.
The presence of PhCs and their metabolites in the aquatic environment of several countries has been documented since the 1970s (e.g., [1,15]). However, these contaminants have only recently received attention from the scientific community, the institutions, and the general public because of the concern over possible toxicological risks to the microbial community, fish, wild fauna, and humans and the development of microbial resistance to antibiotics [16,17,18,19,20].
A great number of PhCs have been reported in surface water, groundwater, and drinkable water all over the world, at concentrations ranging from few nanograms per liter to hundreds of micrograms per liter [10,21,22,23]. The direct excretion of PhCs through urine and feces by humans and animals consuming drugs represents the main and widespread source of PhCs released into the environment, while pharmaceutical industries are the secondary point source [24,25]. Moreover, the use of sludge coming from wastewater treatment plants (WWTPs), manure from intensive animal farming used as fertilizer, and irrigation with reclaimed water could also bring PhCs into agricultural soils [10,26,27].
PhC removal in conventional secondary WWTPs is often incomplete, as they are not designed for this purpose [28,29,30]. Moreover, the share of the population connected to wastewater treatment plants varies considerably worldwide and in Europe, as does the level of treatment (primary, secondary, or tertiary) [31]. In Italy, advanced plants fulfilled the needs of 67% of the total population in 2018 [32]. As required by the Urban Waste Water Treatment Directive (Directive 91/271/EEC), all agglomerations with a population of more than 2000 should be provided with collecting systems for urban wastewater and urban wastewater entering collecting systems should be adequately treated before discharge. However, the European Commission decided to refer Italy to the Court of Justice of the EU because 620 agglomerations in 16 regions are in breach of EU rules on collection or treatment of urban wastewater [33].
At the European level, the Directive 2013/39/EU focused on emerging contaminants and PhCs, and the Decisions 2015/495, 2018/840, and 2020/1161 identified a watch list of substances that pose a significant risk to the aquatic environment [34,35,36]. These substances include biocides and pharmaceuticals. The assessment of PhCs in the environment should be carried out by monitoring programs, providing measured environmental concentrations (MECs), or using predictive models, based mainly on human consumption and excretion/removal and dilution factors [37,38,39], providing predicted environmental concentration (PEC). The European Medicines Agency (EMA) recommended the estimation of PEC for the environmental risk assessment of PhCs for human use [40]. For any given PhC, the PEC can be calculated from sale volume and human excretion rate, i.e., the percentage excreted as parent compound, and dilution of wastewater by the surface water flow. The PEC of the effluents of WWTs could be refined by applying the removal factor of the specific WWTP. However, assumptions made during the calculation of PEC values, such as an evenly distributed usage over time and space, may not be appropriate and could vary also depending on the hydrology at the local scale. Thus, the relevance of PEC vs. MEC should be evaluated, especially at the local scale, where the pattern of consumption could differ from the regional or national one when the density of population greatly varies, according to the distance to the cities.
So far, the model for PEC estimates of PhCs [40] was applied in Italy by Verlicchi et al. [41] in the effluents of a WWTP and by Riva et al. [42] in both WWTP effluent and surface water bodies. They showed that the PEC was close to and sometimes overlapped the MEC, but differences between PEC and MEC were significant for some PhCs. Conversely, Ong et al. [43] and He et al. [44] demonstrated the usefulness of the predictive model in Melbourne (Australia) and Japan, respectively, whereas Neves et al. [45] successfully slightly modified the model for 10 of the most used PhCs in Belo Horizonte (Brazil). The modification was based on refinements of the parameters (i.e., human consumption excretion/removal and dilution factors) of the formula, allowing a better representation of the city of study. At the same time, Gomez-Canela et al. [46] refined the model [40] applied to PEC prediction in Catalonia rivers, using the dilution factor proposed by Keller et al. [47] from Spain. Accordingly, other authors [48] highlighted the impact of climate parameters on the dilution factor, especially for carbamazepine, diclofenac, and metoprolol in small and medium rivers downstream WWTPs in Germany.
Thus, the present study aimed at investigating the occurrence of some PhC contaminants in surface water and in the effluent of a WWTP located in the coastal area of Central Italy and at improving the predictive model recommended by the EMA [40] comparing the PEC of PhCs in surface water with the MEC. An additional objective was to evaluate the environmental risk that the presence of PhCs can produce for the environment. To these aims, in the study area, we defined three categories of anthropic pressure on the basis of the number of inhabitants per unit surface (rural, periurban, and urban areas), and we performed two sampling campaigns of surface water and analyzed the samples for 12 selected PhCs, representing the main therapeutic classes. The PEC was calculated from the sale date and the formula for the calculation of the PEC was modified to take into account the number of inhabitants in the three categories of anthropogenic pressure. PEC and MEC values were compared, and the relevance of PEC values was assessed according to the PEC/MEC ratio. Finally, the environmental risk of the PhCs was assessed by the risk quotient (RQ), which is the ratio between MEC and the corresponding predicted no-effect concentration (PNEC), calculated by dividing the lowest chronic no-observed-effect concentration from standard toxicity tests by an assessment factor.

2. Materials and Methods

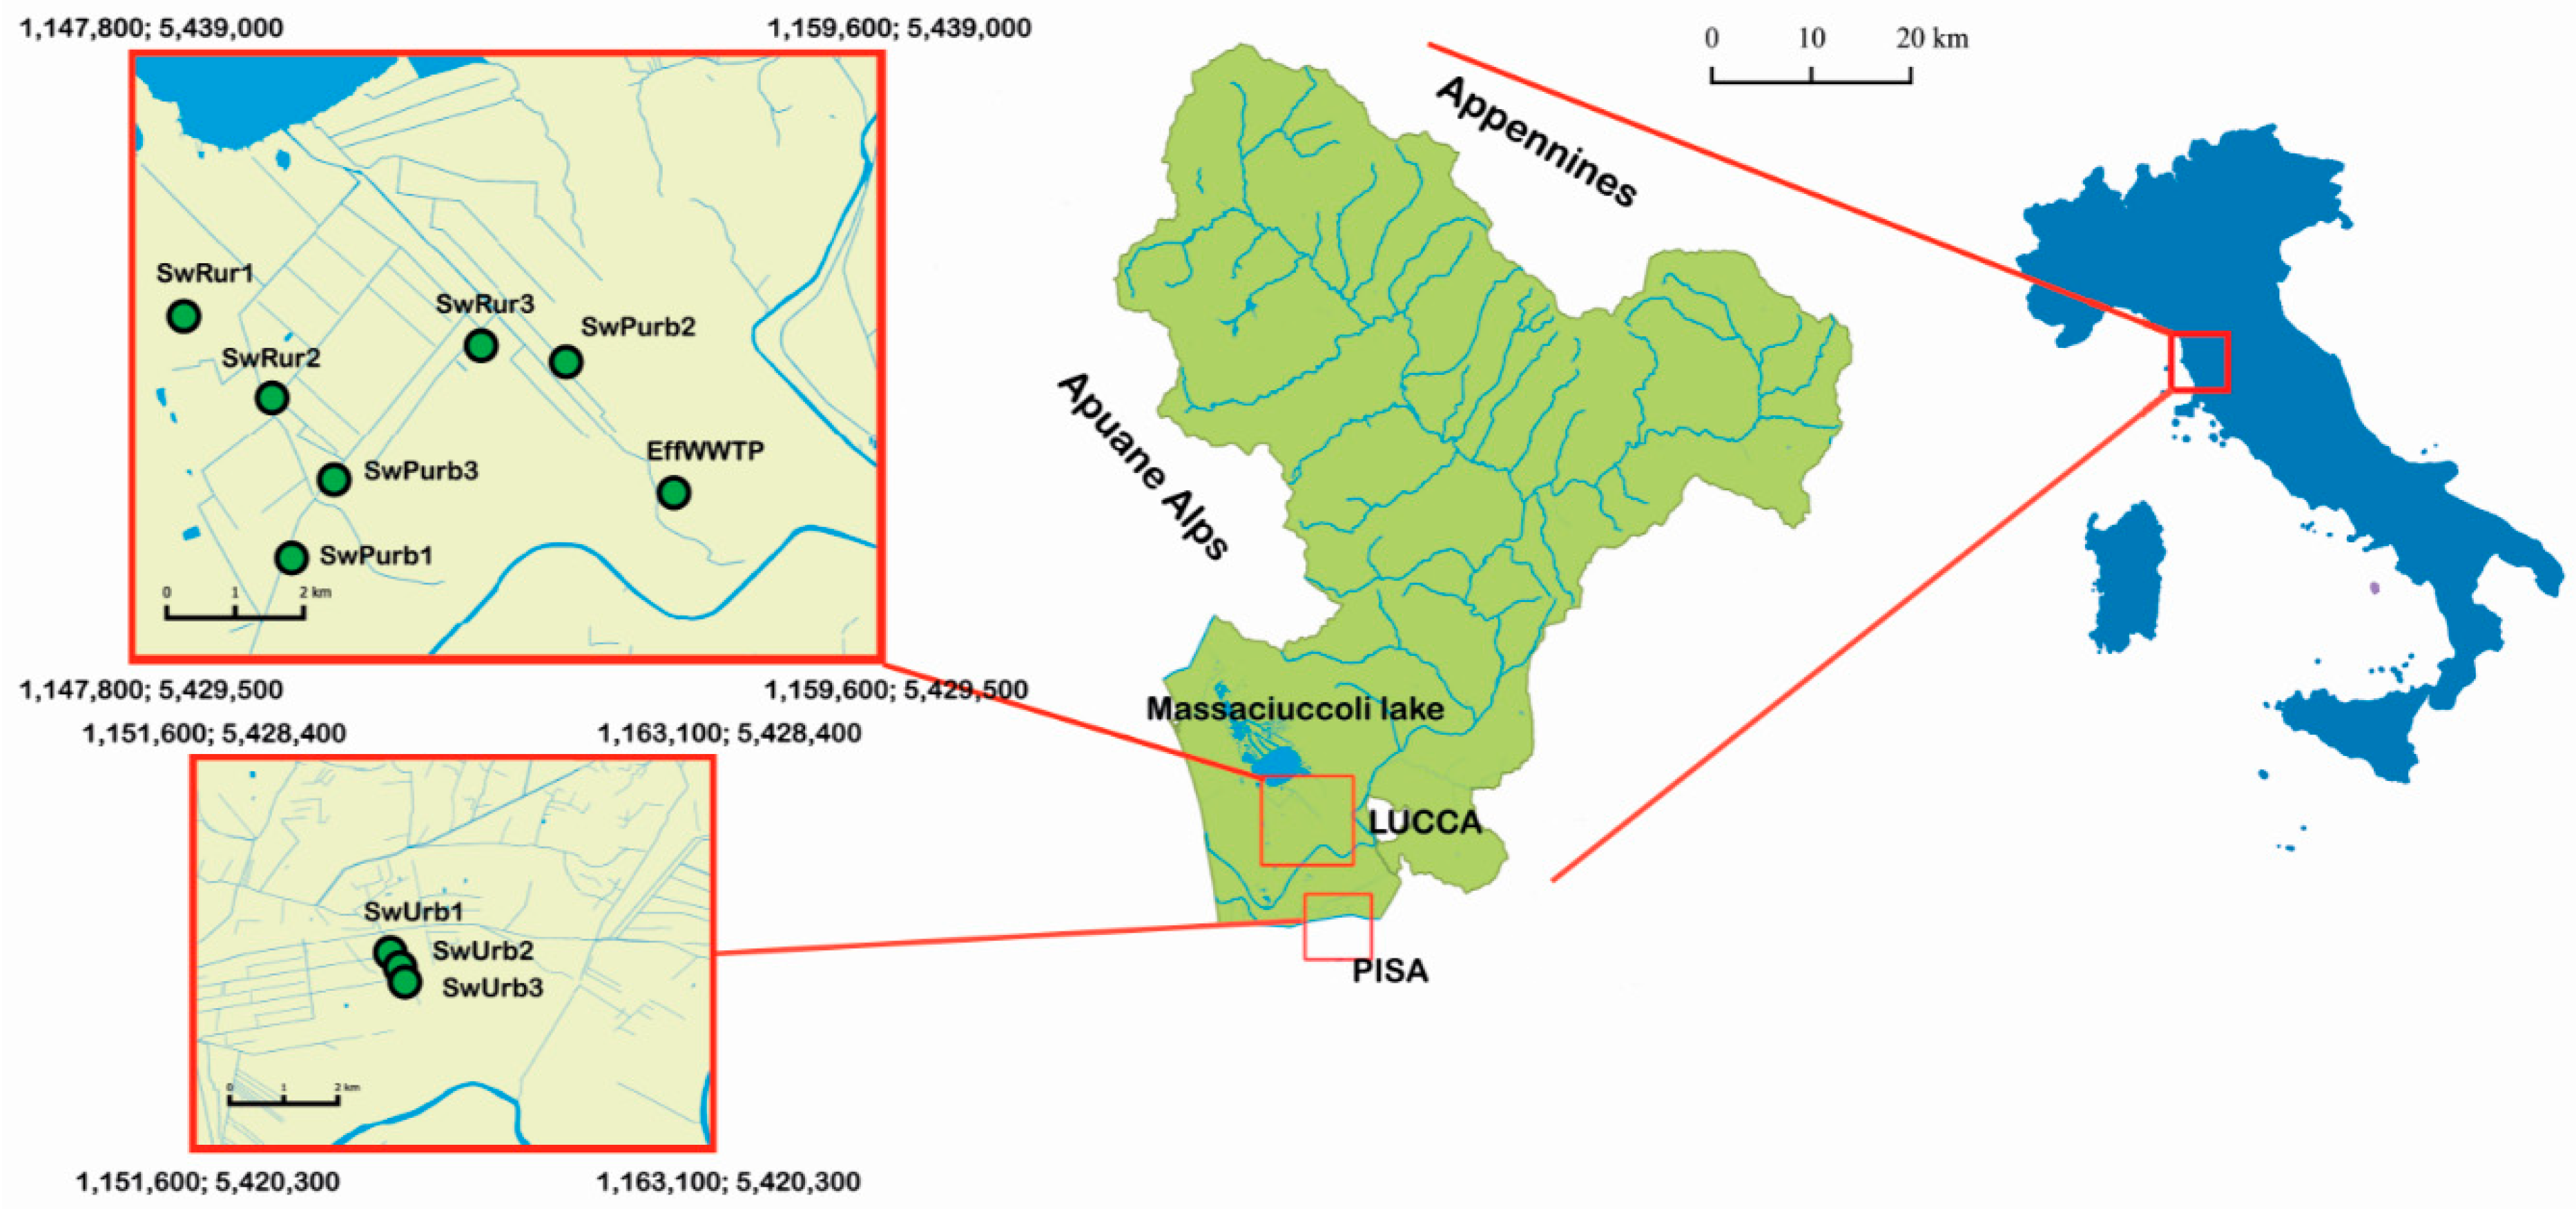
2.1. Study Site and Sample Collection

The study area is situated in the coastal area of Central Italy (Tuscany region, Italy) between the city of Pisa and the Massaciuccoli Lake (Figure 1). Most of the area is located in the natural park of Migliarino, San Rossore, and Massaciuccoli. The area was a wetland until 1930, when it was drained by a complex network of artificial canals, ditches, and pumping stations [49,50,51]. During the year, the artificial network drains the superficial aquifer and some excess rainfall to the Massaciuccoli Lake, whereas during summer (July–October), the network supplies irrigation water from the lake to cropland by inverting water flow direction. The water table is maintained by pumping stations at a quite stable level, ranging from 0.40 to 0.60 m. The climate is Mediterranean (Csa) according to the Köppen–Geiger climate classification map [52]. Summers are dry and hot, rainfall is mainly concentrated in autumn and spring (mean annual rainfall ca. 945 mm year−1), and mean monthly air temperature ranges from 7 °C in February to 30 °C in August (with a mean of 14.8 °C year−1).
Water samples were collected during two analytical campaigns in March and September 2016 from the sampling points shown in Figure 1. The sampling points were selected to represent areas with increasing anthropic pressure (at least three per area) as follows:
(i)
Rural area with low inhabitant density (SwRur);
(ii)
Periurban area with medium inhabitant density (SwPurb);
(iii)
Urban area with high inhabitant density (SwUrb).
Furthermore, water samples were collected in both campaigns from the effluent of the wastewater treatment plant (WWTP) in Vecchiano (Pisa) (EffWWTP) that receives domestic and industrial sewage and discharges the treated water into a canal that flows into the Massaciuccoli Lake. The Vecchiano WWTP is a small plant in the north of the town of Vecchiano (Pisa) designed to serve a population equivalent (PE) of 9000 inhabitants, and it currently treats, on average, 28,000 m3 day−1 of wastewater.
Composite 4 h wastewater samples were collected from the central part of the canal between 7:30 and 11:30 a.m. Samplings were carried out during a dry period to avoid dilution effects due to rainfall. Samples were filtered through 0.45 μm nylon filters (Whatman, Maidstone, UK) and stored in 500 mL dark polypropylene (PP) bottles at 4 °C before analysis.

2.2. Analytical Determinations

Twelve pharmaceutical compounds (PhCs) were selected for analytical determinations, following the evidence in the scientific literature on their occurrence in wastewaters and surface waters and based on their environmental impact (e.g., [25,53]). Among them, clarithromycin, diclofenac, erythromycin, 17ß-estradiol E2 (hereafter estradiol), 17α-ethinylestradiol EE2 (hereafter ethinylestradiol), and estrone E1 are listed in the Decision 2015/495; clarithromycin, erythromycin, estradiol, ethinylestradiol, and estrone are listed in the Decision 2018/840; and sulfamethoxazole is listed in the Decision 2020/1161 [35,36]. Nine of the twelve selected PhCs, namely atenolol, carbamazepine, clarithromycin, erythromycin, estradiol, ethinylestradiol, estrone, metformin, and sulfamethoxazole, are prescription drugs, whereas three, namely ibuprofen, diclofenac, and naproxen, are drugs that can be bought without a prescription, i.e., over-the-counter (OTC) drugs. In addition, two metabolites were selected for the analysis: 10,11-dehydro-10,11-dehydroxycarbamazepine and dehydro-erythromycin, metabolites of carbamazepine and erythromycin, respectively.
The PhCs dissolved in water samples were measured by high-performance liquid chromatography–tandem mass spectrometry (HPLC–MS/MS), after solid-phase extraction (SPE), following the procedures described in [42]. In detail, samples were acidified to pH 2.0 with 37% HCl, spiked with labeled internal standards, and solid-phase extracted using mixed reverse-phase cation exchange cartridges (Oasis-MCX, Waters Corp., Milford, MA, USA). Cartridges were then vacuum-dried and eluted with 2 mL of methanol and 2 mL of a 2% ammonia solution in methanol. The eluates were pooled in glass tubes, dried under a gentle nitrogen stream, redissolved in 200 µL Milli-Q water, and transferred into glass vials for instrumental analysis. For analysis, we used two Series 200 pumps and a Series 200 autosampler (Perkin-Elmer, Norwalk, CT, USA) in an HPLC system with an API5500 triple quadrupole mass spectrometer equipped with a turbo ion spray source (AB—Sciex, Thornhill, ON, Canada) MS system. Compounds were quantified by selected reaction monitoring (SRM) using both the positive and negative ionization modes. A 10 min gradient was used for chromatographic separation using formic acid 0.1% in water for analysis in positive mode and triethyl-amine 0.05% for analysis in negative mode as solvent A (gradient from 98 to 2% in 10 min) and acetonitrile as solvent B. Quantification was done by isotope dilution using the two most abundant precursor/production transitions. Retention times were also compared with reference standards to identify the compounds. The quantification limits (LOQs) were calculated from chromatograms of STP effluents; the LOQ was the concentration with a signal/noise ratio of 10. The instrumental precision and accuracy for PhC determination ranged from 5 to 10%.

2.3. Predicted Environmental Concentration of the Selected PhCs and Comparison Method

Sale volumes of the selected PhCs were estimated using the total sale data provided by the Local Health Agency of Tuscany 5 (ASL5) for 2014 [54] and using the data of the annual report on PhC use in Italy provided by the “Osservatorio nazionale sull’impiego dei Medicinali” (OsMed) for the year 2014 [55]. The ASL5 recorded the sale data of prescribed drugs, i.e., those that were purchased with medical prescription, as kg for the total number of citizens of ASL5 in 2014 (defined total sale from ASL5 report) (Table 1). The ASL5 has jurisdiction over 26 municipalities in the Pisa province on a whole number of 345,651 citizens [56]. On the other hand, the OsMed report contains the sale volumes of the largest selling drugs in Italy including the prescribed and OTC drugs [55]. The OsMed reports the sale volumes as the number of defined daily doses (DDDs) sold per one thousand inhabitants per day per drug (j) (DDDj,1000) [55]. The World Health Organization (WHO) Collaborating Centre for Drug Statistics reports the DDD values as the assumed average maintenance dose (mg) per day for a drug j used for its main indication in adults (DDDj) [57]. Thus, for each selected drug, the total of active ingredient (mg) sold in Italy per inhabitant per year (Qj) was calculated by the following formula:
Qj (mg inh−1 y−1) = DDDj,1000 ∗ (DDDj) ∗ (365/1000)
where DDDj,1000 is the number of defined daily doses for one thousand inhabitants of the drug j (n ∗ 1000 inhabitants day−1), DDDj (defined daily dose) is the assumed average maintenance dose of the drug j (mg), and 365 are the days in a year. In Table 1, the DDDj from the WHO report is shown for all the studied PhCs. Moreover, the DDDj,1000 from 2014 for the drugs included in the OsMed report and the Qj and the total sale data (Aj) for these drugs (calculated based on the total number of citizens of ASL5) are reported. Finally, using the total sale data from the ASL5 report (Aj), we calculated the Qj for the prescribed drugs (Table 1).
The predicted environmental concentration (PEC) was calculated from Aj (kg), assuming that sales and consumptions were equal. For OTC drugs, we used the quantities calculated from the OsMed report, while for the prescription drugs, we used the quantities calculated from the ASL5 report (Table 1). According to European Medicines Agency (EMA) guidelines [40], PEC (ng L−1) in WWTP effluents (k = eff) and in surface water (k = sw) was calculated using the following formula [40] for each drug j:
PECj,k = (Aj ∗ (1 − Rj)) ∗ Ej ∗ 1012)/(P ∗ V ∗ D ∗ 365)
where Aj is the total sale data for each drug per year (kg), Rj is the removal rate (from 0 to 1) (due to loss by adsorption to sludge particles, by hydrolysis, by biodegradation, etc.), Ej is the excretion rate (from 0 to 1), there are 365 days in a year, P is the number of inhabitants of the geographic area considered (i.e., ASL5: 345,651 in 2014), V is the volume of wastewater per capita per day (assumed to be equal to 200 L inhabitant−1 day−1), and D is the factor for dilution of wastewater by surface water flow. The PECj,eff was evaluated assuming that no dilution occurred (D = 1), whereas the PECj,sw was calculated using a D equal to 10, following the EMA guidelines. The Rj and Ej values were obtained from literature and are reported in Table 2. However, the formula does not take into account the anthropic pressure, as PEC is calculated considering the average population density of the geographical area (i.e., 184 inhabitants km−2 in 2014, [56]). To improve the predictive power of the formula for geographical areas showing an uneven density of population and thus varying in anthropic pressure, we applied site-specific data of the population density [58] for rural, periurban, and urban areas of the ASL5. Thus, for PEC calculation in the surface water of rural, periurban, and urban areas (SwRur, SwPurb, and SwUrb), we normalized the PECj,k to 50, 200, and 500 inhabitants km−2, respectively. This normalization was performed by dividing the PECj,k by 184 and multiplying the value by the specific densities.
To assess the reliability of the method of estimation of PhC concentration, the logarithm of the ratio between PEC and MEC (average of all concentrations) in SwRur, SwPurb, SwUrb, and EffWWTP was calculated. When MEC was below the detection limit (LOD), the value of LOD was considered. Following [41,59], the PEC is acceptable if the difference between PEC and MEC values does not exceed 100%, corresponding to log(PEC/MEC) ranging from −0.3 to 0.3. Conversely, PEC is overestimated if log(PEC/MEC) is higher than 0.3 and underestimated if it is lower than −0.3. For comparison, PEC was calculated utilizing the unrefined model of [40]. The improvement of the predictive model was evaluated by comparing the frequencies of the log(PEC/MEC) classified in the three categories of acceptability and obtained from the refined and unrefined formula for the three areas (rural, periurban, and urban).

2.4. Environmental Risk Assessment

Risk quotients (RQs) have been used to evaluate the environmental risk that the occurrence of PhCs could produce in the organisms after a discharge into the environment. The calculation of RQs was carried out by comparing the MEC of the target PhC with the PNEC in different organisms (algae, daphnids, and fish). PNEC values were estimated as 1000 times lower than the most sensitive species assayed in acute toxicity tests, following [28,63,65] (Table 2).

2.5. Statistical Analyses of Results

The MEC values of the 12 PhCs obtained from March and September campaigns in 2014 were graphically represented by box plot after calculating the 25th and 75th percentiles, the median, and the lowest and highest values. Then, a one-way ANCOVA was applied using the anthropic pressure (rural, periurban, and urban areas) as a fixed factor and the date of sampling as a covariate. To meet the ANCOVA assumptions, the data were log(1 + x) transformed when needed (x = value of the drug j). The LSD test was used for comparison among treatments on the estimated marginal means. Means and standard errors given in figures are for untransformed data, and different small letters represent LSD differences at a probability (P) ≤ 0.05. Analyses were performed using the SPSS software package version 21.0 (SPSS Inc., Chicago, IL, USA).

3. Results

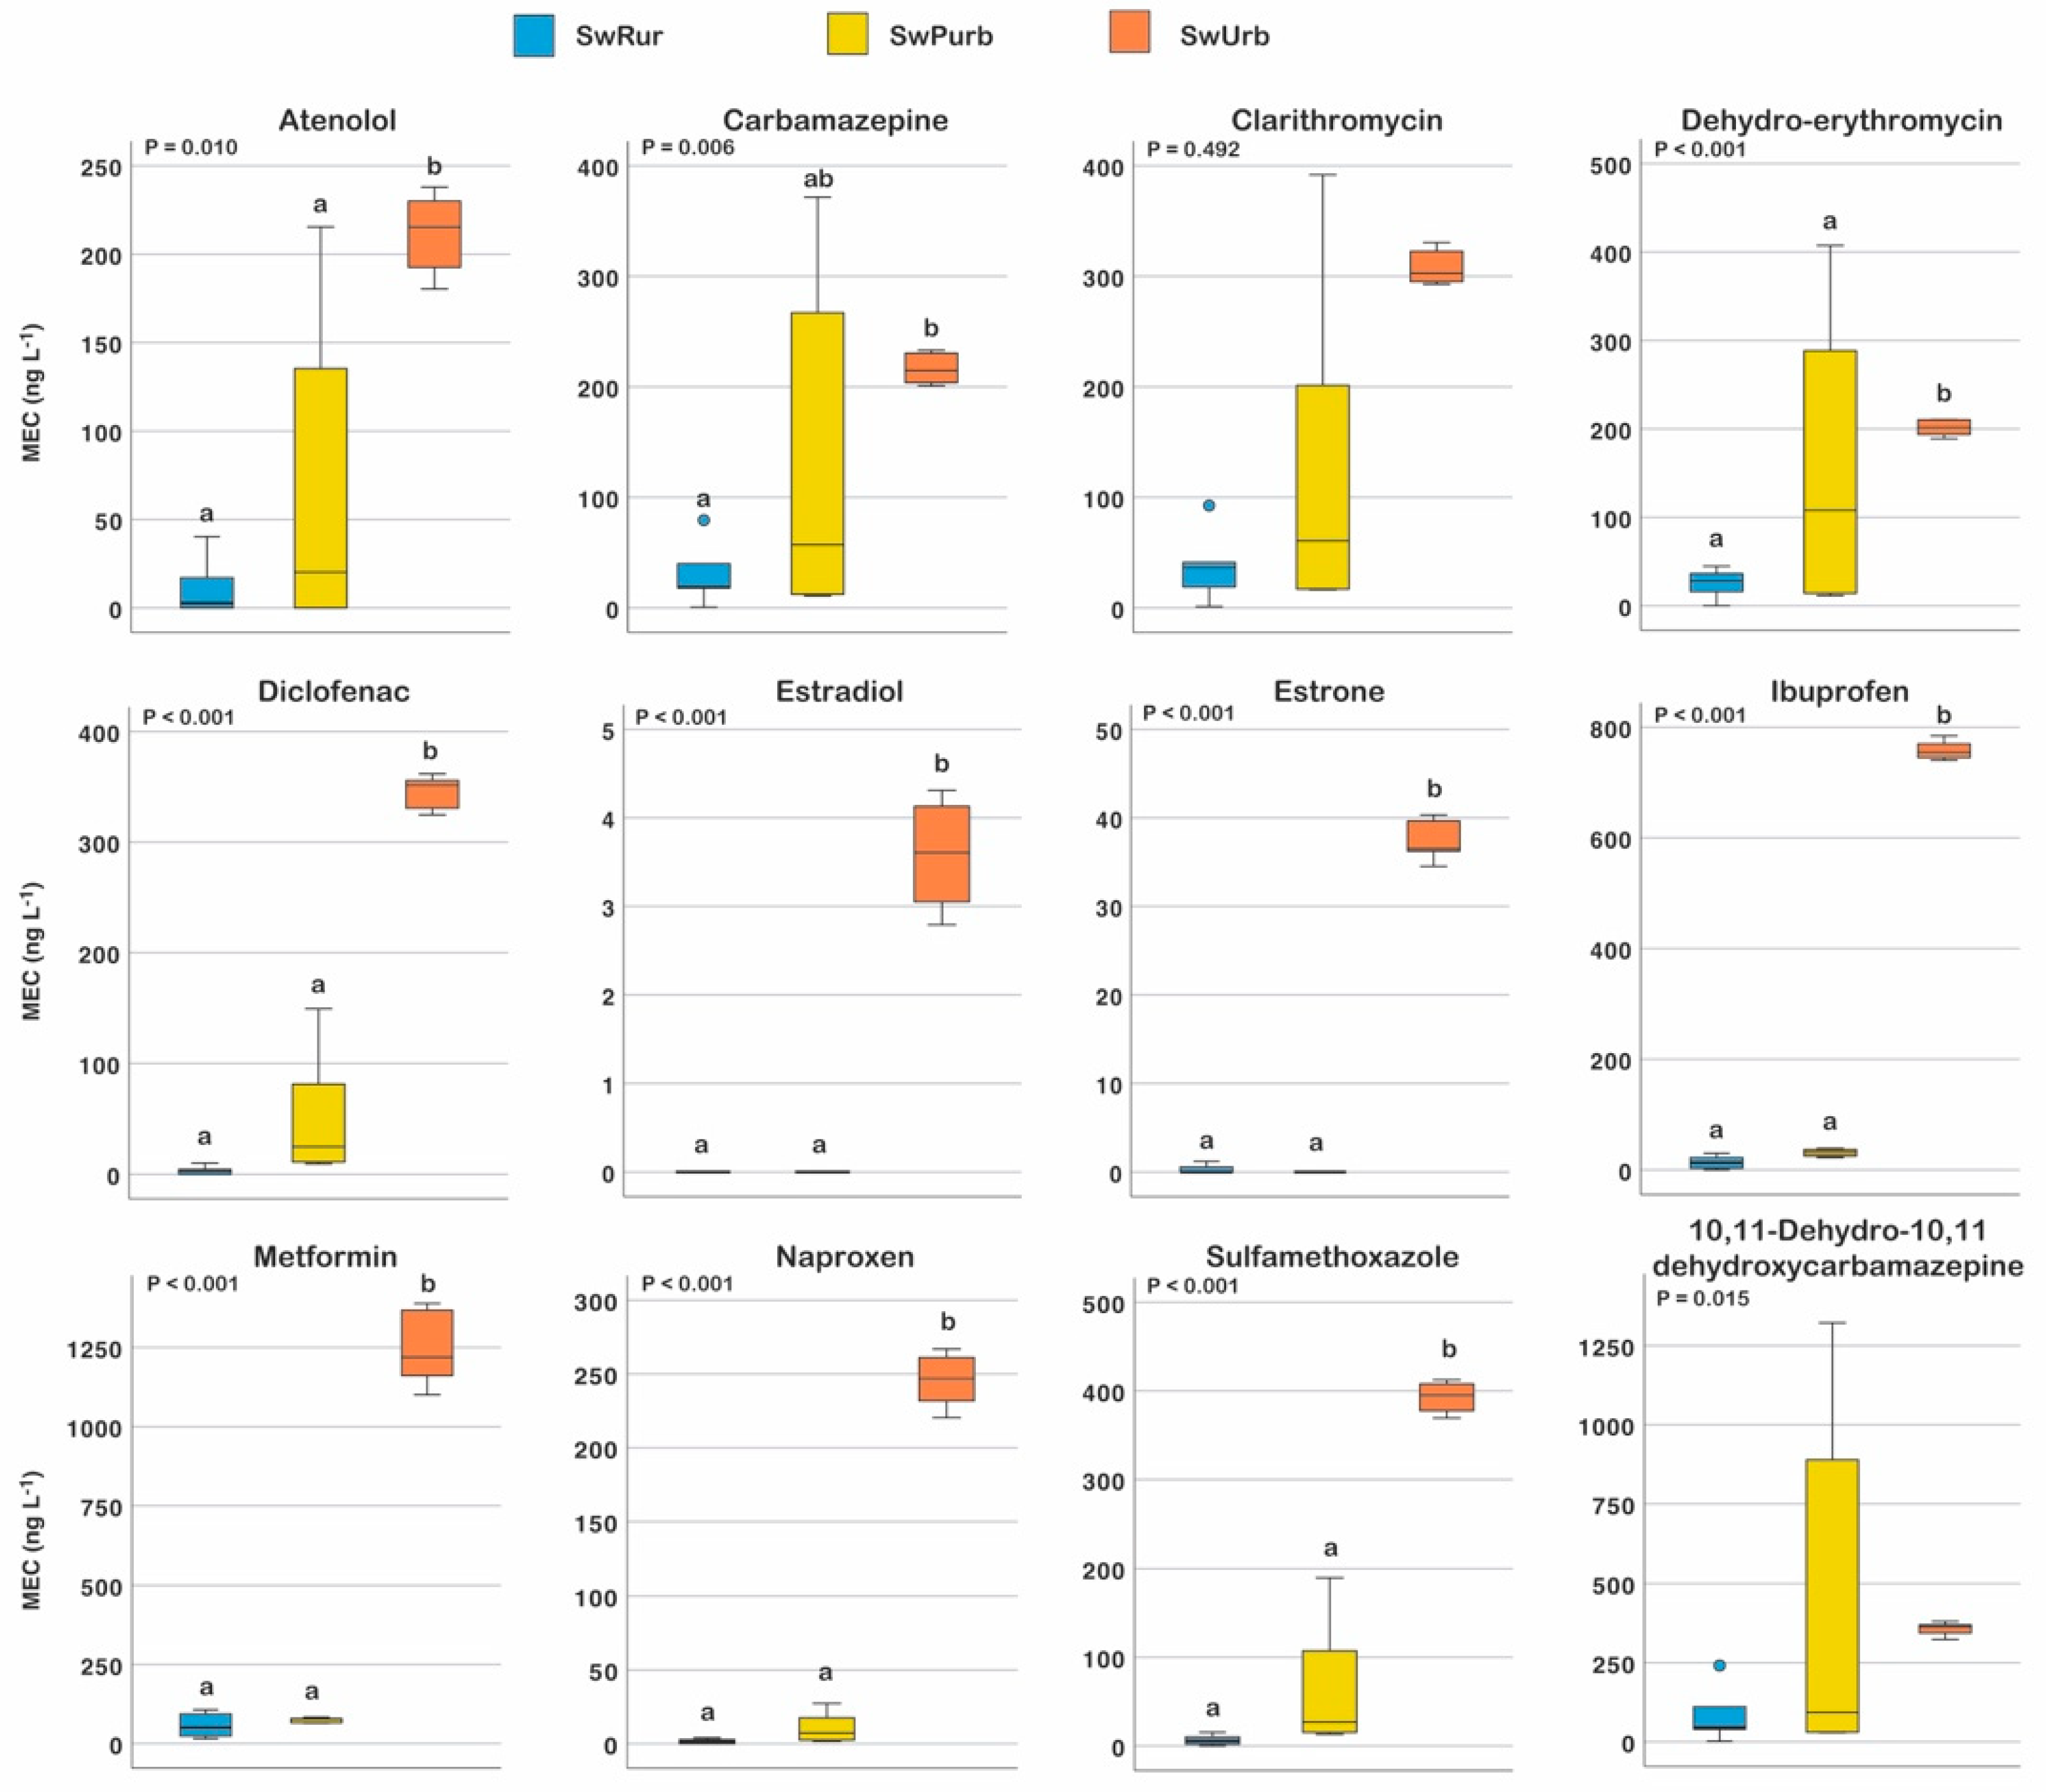
3.1. Measured Environmental Concentration of PhCs

Concentrations of the selected PhCs measured during the two analytical campaigns are reported in Figure 2 and Figure 3. In the campaign of March, most of the selected compounds were detected in all sampling points, with the exception of erythromycin and ethinylestradiol (Figure 2). Although erythromycin was never detectable, its metabolite dehydro-erythromycin was found in all samples. The hormones estradiol and estrone were detected only in the untreated surface water in urban areas (SwUrb), and estrone was also detected in low concentrations in rural areas (SwRur). Concentrations of atenolol, carbamazepine, clarithromycin, diclofenac, ibuprofen, naproxen and the metabolites dehydro-erythromycin and 10,11-dehydro-10,11-dehydroxycarbamazepine increased from samples taken in surface water in rural areas to samples taken in periurban and urban areas. In the treated effluent (EffWWTP), concentration of PhCs was relevant except for hormones (estradiol and estrone) and ibuprofen. Moreover, comparing the treated effluent with the urban surface water (SwUrb), the effluent showed higher PhC concentrations, except for atenolol, diclofenac, ibuprofen, naproxen, and hormones.
The sampling campaign of September confirmed the high presence of most of the selected PhCs only in the SwUrb and effluent, whereas the PhCs were absent or at very low concentration in SwRur and SwPurb (Figure 3). Atenolol, estradiol, estrone, ibuprofen, and naproxen were detected at higher concentrations in SwUrb compared with EffWWTP, whereas the reverse was true for carbamazepine, dehydro-erythromycin, diclofenac, metformin, and sulfamethoxazole.
By analyzing the whole data set and removing the effect of the sampling campaign, it was found that the increase in anthropic pressure led to statistically significant increases in the environmental concentrations of PhCs (Figure 4). The effect was significant for all compounds except for clarithromycin and 10,11-dehydro-10,11-dehydroxycarbamazepine. However, the pattern of these two compounds was similar to the other PhCs (i.e., SwRur = SwPurb < SwUrb), but the greater variation among samples in SwPurb probably determined the nonsignificant effect. For diclofenac, estradiol, estrone, ibuprofen, metformin, naproxen, and sulfamethoxazole, the concentrations were significantly higher in SwUrb than in the SwPurb and SwRur, which showed similar values. Indeed, with respect to the average concentrations found in periurban and rural areas, the increases in SwUrb were 12-, 3600-, 256-, 33-, 18-, 120-, and 10-fold for diclofenac, estradiol, estrone, ibuprofen, metformin, naproxen, and sulfamethoxazole, respectively. Similarly, for atenolol, carbamazepine, and dehydro-erythromycin, although the concentration was significantly higher in SwUrb with respect to SwPurb and SwRur (5-, 2-, and 1-fold, respectively), the median values recorded in SwPurb were higher than in SwRur and the variability of the data was larger than for the other PhCs.

3.2. Validation of the Predictive Method

Based on the total sale data from OsMed and ASL5 reports for each investigated PhC in the study area, metformin (5122.2 kg and 5453.7 kg, respectively), ibuprofen (696.4 kg and 390 kg), and clarithromycin (170.3 kg and 176.8 kg) were the compounds consumed in the greatest quantities, while erythromycin (62.38 kg), estradiol (0.24), and ethinylestradiol (0.02 kg), which are all prescribed drugs, were those consumed the least (Table 1). Since the discharge loads of PhCs depend not only on the amount of the compound administered but also on its excretion factor and removal efficiency, the ranking of the compounds in terms of PECs slightly changed (Table 3). Indeed, the highest PECs were estimated for metformin, clarithromycin, and atenolol, and the lowest PECs were estimated for ethinylestradiol, erythromycin, and estradiol (Table 3). The evaluation of the reliability of PECs based on the log(PEC/MEC) was performed separately for the three areas of anthropic pressure (SwRur, SwPurb, SwUrb) and the effluent (EffWWTP) (Figure 5). As shown in Figure 5, the occurrence of the three categories of reliability of PEC (acceptable, underestimated, and overestimated) in terms of frequency demonstrated that acceptability varied with PhCs and surface water categories. In detail, in SwUrb and EffWWTP, the PEC of the majority of PhCs was underestimated (9 out of 11 PhCs and 8 out of 11 PhCs, respectively), whereas in SwRur and SwPurb, the PEC of the majority of PhCs was acceptable (4 out of 11 PhCs and 3 out of 11 PhCs, respectively) or overestimated (4 out of 11 PhCs and 3 out of 11 PhCs, respectively).
The reliability of the PEC of erythromycin and estradiol was consistently acceptable in SwRur and SwPurb, whereas in SwUrb, only the PEC of erythromycin was consistently acceptable. Conversely, in EffWWTP, the PEC of erythromycin was underestimated, and the PEC of estradiol was 50% acceptable. Moreover, ibuprofen and metformin were consistently overestimated in SwRur, SwPurb, and EffWWTP, whereas in SwUrb, only the PEC of ibuprofen was overestimated, and the PEC of metformin was underestimated in all cases. The reliability of the PEC estimate was higher in rural and periurban areas than in urban areas and in the effluent of the WWTP.
The improvement of the predictive model obtained by the refined formula with respect to the unrefined one can be evaluated by the comparison of Figure 5 and Figure S1. Overall, the predictive power of PEC for the surface water of rural areas with the unrefined formula allowed obtaining acceptable values only for 1 out of 11 PhCs, i.e., carbamazepine. For the periurban areas, PEC for the surface water with the unrefined formula did not allow obtaining acceptable estimates. Moreover, for the urban areas, the unrefined formula allowed obtaining underestimations of all 11 PhCs. Obviously, no changes were reported for the EffWWTP as no refinement of the formula was applied.

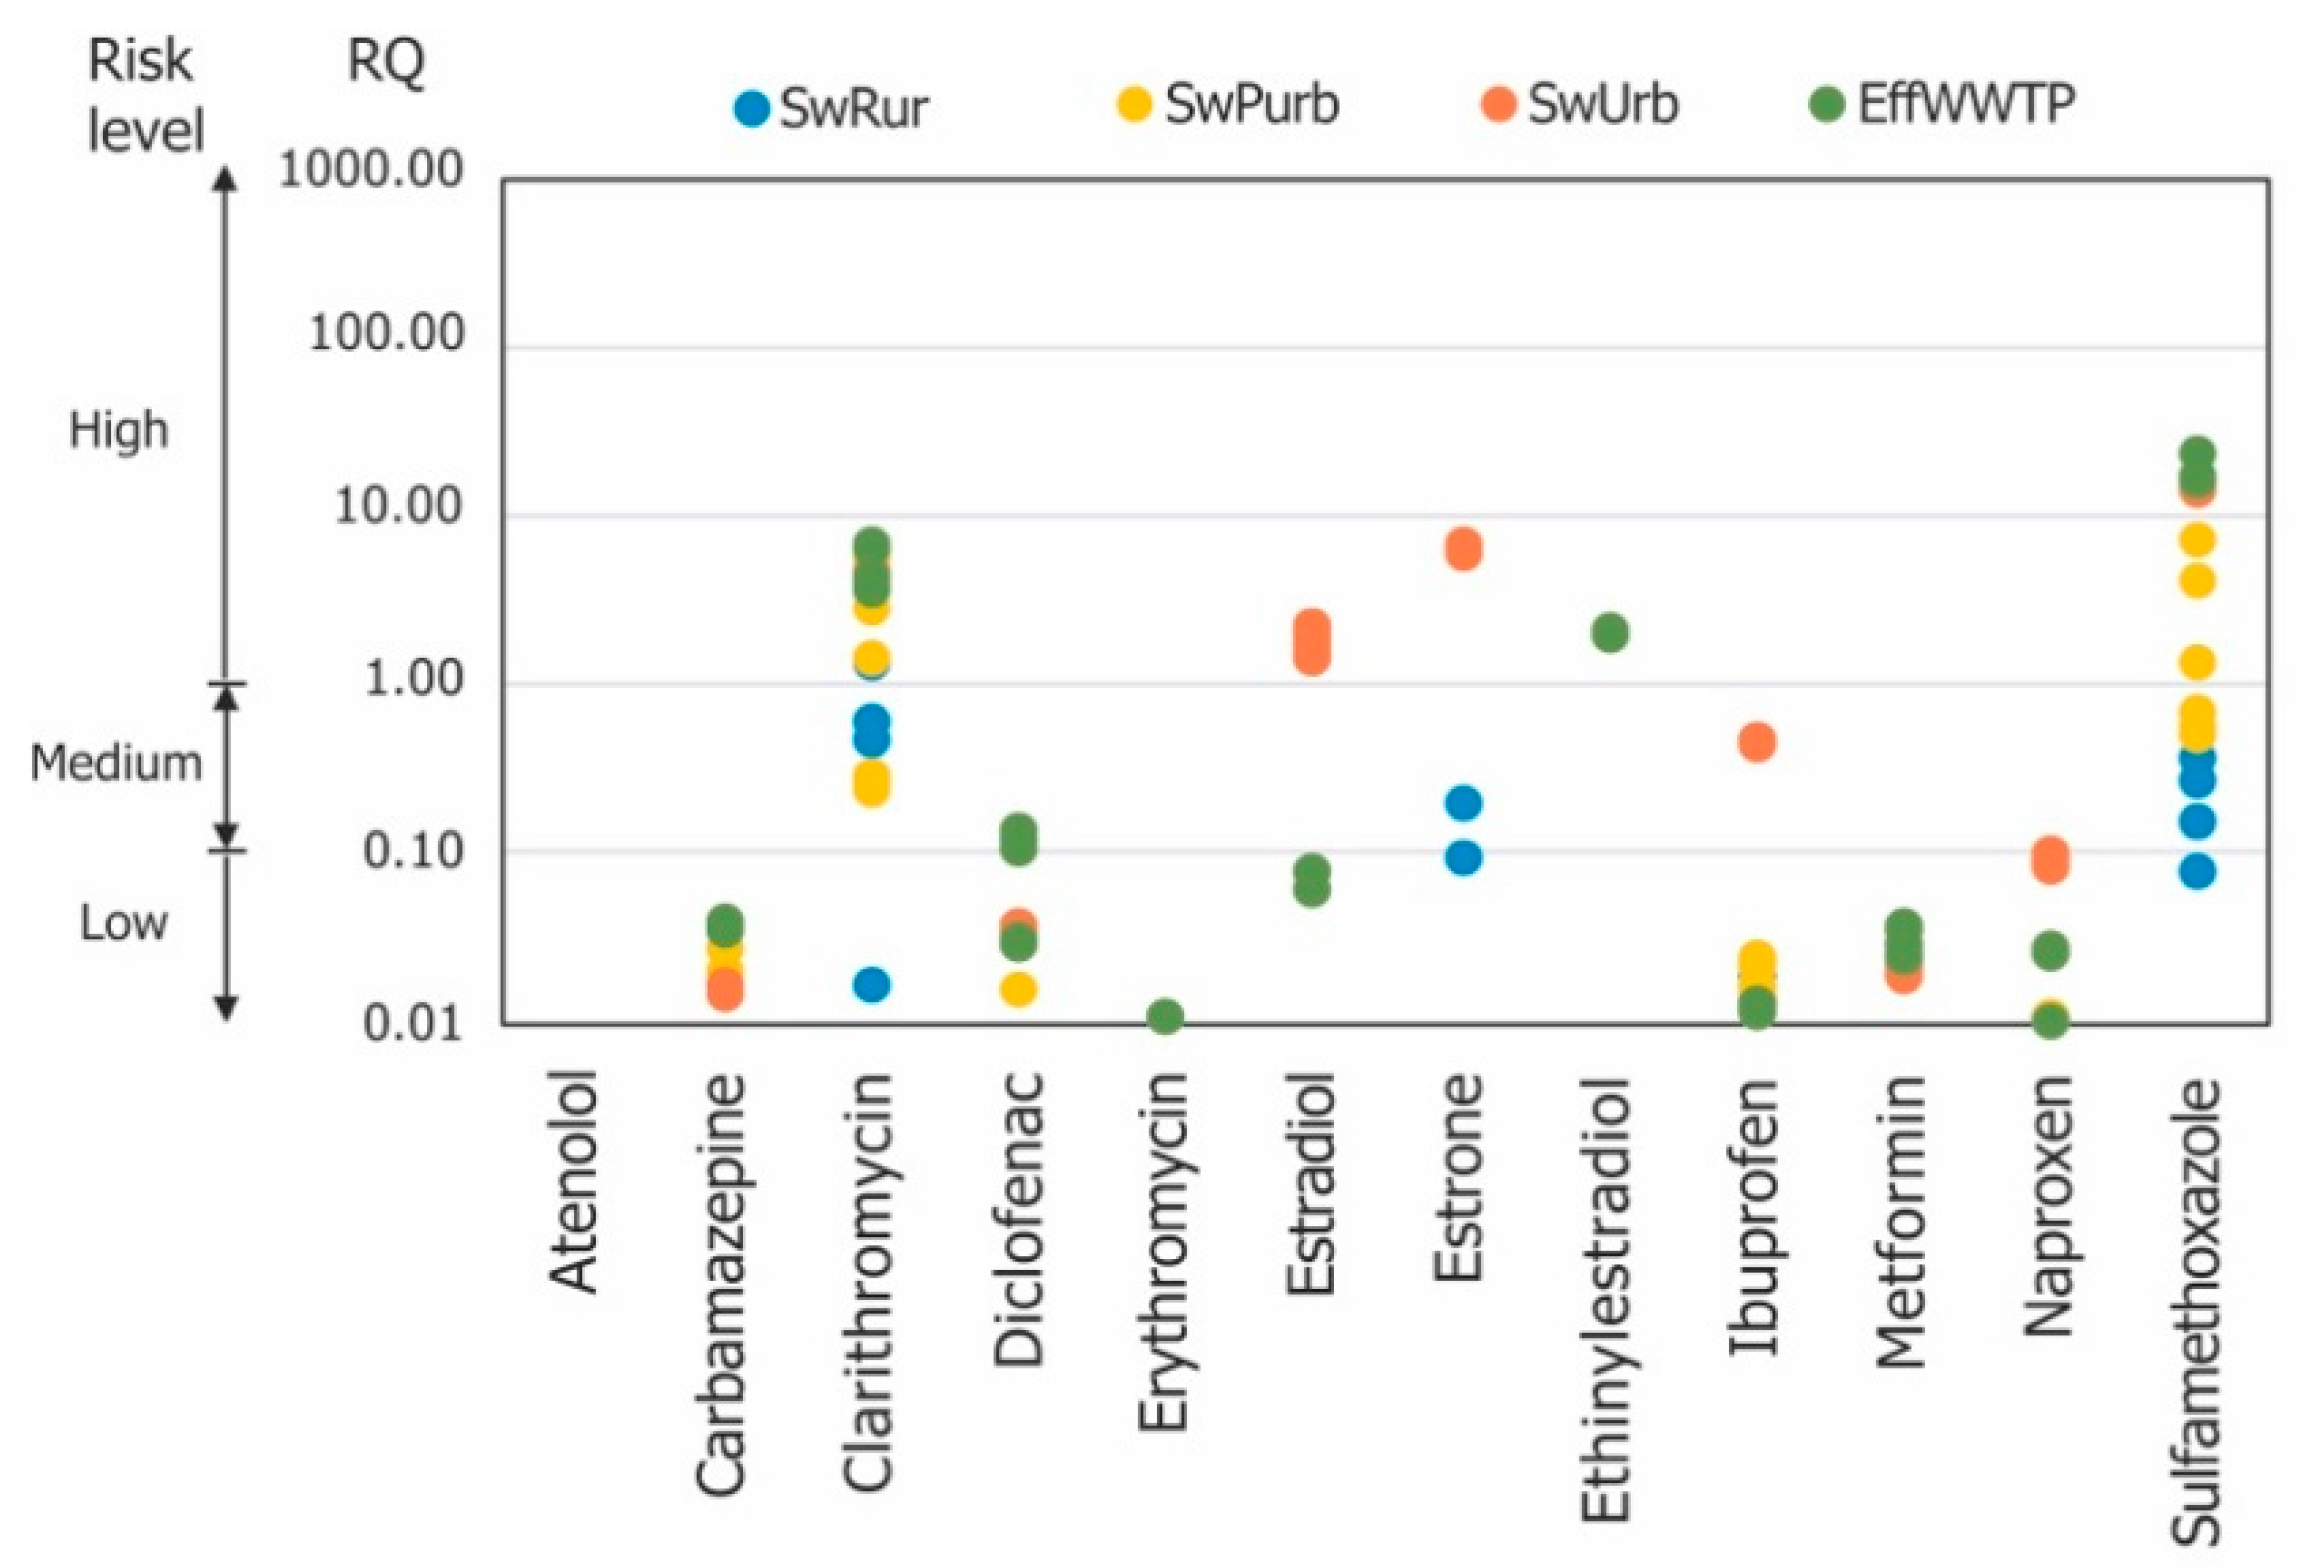
3.3. Environmental Risk Assessment

Risk quotients (MEC/PNEC) were used for the assessment of the environmental risk of PhCs in surface water. For all PhCs, except atenolol, the risk was predictable (Figure 6). Risk showed differences in accordance with each compound and type of surface water. Low risk was predicted for atenolol, carbamazepine, erythromycin, metformin, and naproxen. Diclofenac and ibuprofen showed a risk from low to medium, whereas clarithromycin, estradiol, estrone, and sulfamethoxazole showed a high risk. Ethinylestradiol showed a high risk only in the EffWWTP. Overall, the highest environmental risk is posed by PhCs in the effluent, while a progressively decreasing risk is estimated for the urban, periurban, and rural surface waters.

4. Discussion

The analysis of the samples of surface water and effluent of WWTP in the study area confirmed the presence of all selected PhCs or metabolites. Overall, averaged between sampling campaigns, the concentration of retrieved PhCs in surface water were in the range from 1.7 to 1243 ng L−1 (for naproxen and metformin, respectively), while concentrations in WWTP effluents were in the range from 0.07 to 1824 ng L−1 (for estradiol and metformin, respectively). It is noteworthy that several PhCs exceeded the threshold proposed by the European Agency for the Evaluation of Medicinal Products [67] for environmental risk (10 ng L−1).
These results were consistent with the results of monitoring performed by many authors worldwide, e.g., in Italy [28,41,68], Sweden [69], and China [70]. A synthesis of research on PhC occurrence in freshwaters at national, regional, and global scales presented in [23] confirmed that investigations were mainly concentrated in North America, Europe, and the most populous parts of China. In Europe, research efforts were clustered around the high population areas of, e.g., London, Paris, Hamburg, and Frankfurt. Conversely, knowledge of PhC occurrence is poor or absent for large parts of the globe, particularly in developing countries.
Some PhCs, such as carbamazepine, metformin, and sulfamethoxazole in both sampling campaigns and dehydro-erythromycin, diclofenac, and 10,11-dehydro-10,11-dehydroxycarbamazepine in the sampling campaign of September, even increased in the effluent of WWTP compared with the surface water of all the three areas (rural, periurban, and urban). This can be explained by the higher efficiency of the plants, soil, and associated microorganisms (bacteria, fungi, etc.) in PhC degradation compared with WWTPs including primary and secondary treatments [71,72]. Thus, the peculiar behavior of these PhCs may depend on the chemical and physical characteristics of their active principles and on the characteristics of the interacting environment. Indeed, for some of these PhCs, the degradative processes, able to remove or break them down into nondangerous and inactive molecules, are known, while for others, no degradation occurs in realistic environmental conditions, and this means that they remain unchanged or form metabolites that can be even more active and harmful than the parent molecule. In the environment where plants, soil, and associated microorganisms interact, the degradation can be physical, chemical (e.g., photodegradation, oxidation), or biological (i.e., carried out by microorganisms such as fungi and bacteria or by plants) [73,74], as in constructed wetlands (CWs). Accordingly, CW plants were found to be more efficient in the removal of PhCs than actual WWTPs [75]. It is noteworthy to cite as an example diclofenac, which is highly photodegradable and was found to be rapidly mineralized in various agricultural soils (with half-lives lower than 5 days) but stable in soils following sterilization by autoclaving, indicating the active role played by microorganisms in its degradation [76]. Moreover, as regards metabolites, in the present study, we measured those known to be produced and potentially toxic, i.e., dehydro-erythromycin from erythromycin and 10,11-dehydro-10,11-dehydroxycarbamazepine from carbamazepine [77]. The fact that we detected only the metabolite of erythromycin (i.e., dehydro-erythromycin) in surface water samples of both campaigns can be explained by the rapid degradation of this molecule (50% dissipation time 7–17 days) with respect to other PhCs, such as carbamazepine [78]. Accordingly, Guasch et al. [79] reported higher concentrations of dehydro-erythromycin (up to 2.5 μg L−1) than erythromycin (from very low nanograms per liter to very few micrograms per liter) in various environmental matrices and in effluents.
Overall, our results suggest a growing gradient of concentration from the rural to the urban areas: the samples collected in the urban surface water had concentrations of PhCs of one and in some cases four orders of magnitude higher compared to the concentrations measured in the suburban/rural surface water. This can be explained not only by the higher density of resident population and thus by the higher PhC consumption and release, but also by specific activities normally performed in urban areas, such as medical care and services, tourism, sport, and hospitality [39,60,80]. Thus, our results of increasing PhC pollution with an increasing number of inhabitants confirm the appropriateness of the risk-based approach targeting the receiving waters in densely populated areas [81].
Although a consistent pattern of increase in environmental loads of all PhCs was evidenced with the increase in anthropic pressure from rural to urban areas, a great variability within the SwPurb was detected for some PhCs in the first sampling campaign (March), leading to nonsignificant statistical differences (i.e., clarithromycin and 10,11-dehydro-10,11-dehydroxycarbamazepine). This is likely to be due to variations in the suburban area in the numbers of inhabitants and activities or to differences in the flows of surface water in canals, causing an increase or decrease in PhC concentrations. Similar results were found in [37,80]. In the former work [37], similarly to our results, the occurrence of PhCs (i.e., atenolol, lincomycin, erythromycin, clarithromycin, bezafibrate, and furosemide) in sampling sites located along the rivers Po and Lambro in North Italy was different among subbasins and was strictly correlated with the presence of large human settlements and/or animal farms. Similarly, in the latter work [80], tourism and the associated number of tourist arrivals were demonstrated as a significant contributor to the overall PhC pollution of the Alpine aquatic environment. Indeed, similarly to our results, the potential impact of areas with high population density due to tourism was demonstrated to strongly affect analgesic/anti-inflammatory compounds, such as diclofenac.
The monitoring of the seasonal variation (March vs. September sampling campaign) in the concentrations of the 12 studied compounds showed variations between rural and periurban surface waters, as well as within surface water categories, for some PhCs (i.e., atenolol, carbamazepine, clarithromycin, dehydro-erythromycin, diclofenac, and 10,11-dehydro-10,11-dehydrocarbamazepine). The seasonal variability might be due to the reduction in the consumption of these PhCs in rural and periurban areas in the summertime, and thus the concentration and variability in sample concentrations are lower in September. Conversely, for the other PhCs, no evident seasonal variation was detected either for the surface waters or for the effluents of the WWTP. This is likely to be due to the fact the selected PhCs are highly consumed throughout the year in the urban areas and that the temperature (from March to September) did not have any influence on the improvement of the removal rate, thus not affecting the urban surface water and potentially also the influents of WWTP.
The comparison with predicted and measured concentrations of PhCs in surface water and in WWTP effluent showed that the PECs adjusted with the normalization of the loads to the number of inhabitants of the drainage basin at the sampling stations can provide a good approximation of the MECs in all areas, especially for the urban one. This was supported by the comparison of the frequencies of log(PEC/MEC) classification as acceptable, underestimated, and overestimated estimations using our proposed, refined formula and the unrefined one. However, looking at the pattern of the frequencies using the refined formula, PECs substantially differed from the MECs in urban samples, leading to a consistent underestimation of most PhCs (atenolol, carbamazepine, clarithromycin, diclofenac, estradiol, ethinylestradiol, metformin, naproxen, and sulfamethoxazole). To improve the prediction power in urban surface water samples, we can suggest refining the removal factors using specific estimations based on additional/improved degradation tests or using dilution factors according to the studied areas.
Thus, our method represents a further refinement of the method initially proposed by the EMA and improved in [38] considering the degradation of the compounds in surface water. In the work of [38], the refinement of PEC, using the removal factors estimated by information from metabolism, excretion, adsorption in sewage sludge, biodegradation in surface water and in sewage treatment plants, and degradation with hydrolysis and/or photolysis [47], provided a good approximation of the MEC in 40% of the cases for 13 PhCs (e.g., atenolol, erythromycin, clarithromycin, ibuprofen). However, in other cases (60%), PECs substantially differed from the MECs (from one to two orders of magnitude), indicating that the estimate of the environmental fate of the molecule was not reliable enough. Later, the computation was modified and PECs were refined by considering a further value: the removal rate in WWTPs [21,42]. Nevertheless, discrepancies between PEC and MEC still occur, and the uncertainty of prediction may derive from the inaccurate evaluation of dilution effect due to potential variability in the receiving water body flow rate [41]. In our research, we used a default dilution factor of 10 in all surface waters, but this assumption might be inappropriate, as dilution can change quickly both in space and time. Thus, we can hypothesize that a lower dilution factor should be applied for the urban samples to improve the PECs and thus reach acceptable estimations of the MECs.
The differences in the measured-to-predicted ratios for PhCs are probably also ascribable to their differences in environmental behavior along the surface water body, where various chemical and biological processes of degradation are supposed to occur. As an example, some microorganisms are known to be effective in the degradation of diclofenac (e.g., bacteria: Streptomyces: 17% in 120 h; Actinoplanes sp. ATCC 53,771 100% in 5 h; fungi: Trametes versicolor: 100% in few hours; Cunninghamella elegans: 100% in 120 h), producing oxidative enzymes (in bacteria), such as lignin peroxidase or laccases [82], which catalyze the oxidation of various aromatic compounds [83], or nonspecific enzymes (in fungi) [84,85]. Thus, in the process of degradation, the environmental behavior and fate of the PhC might well play significant roles that, however, still need to be clarified for many PhCs across different environments. In our refined calculation of PEC, we hypothesized that the degradation of PhCs occurred in surface water receiving effluents from the WWTP or other primary treatment plants. For this reason, we used the same removal factors taken by literature, but, as previously stated, a more accurate estimate should apply the degradation coefficient of the specific depuration system or of natural systems or differently managed agroecosystems [86,87,88].
Since the environmental assessment evidenced risks classified into three categories, namely low (i.e., atenolol, carbamazepine, erythromycin, metformin, and naproxen), low/medium (i.e., diclofenac and ibuprofen), and high (i.e., clarithromycin, estradiol, estrone, and sulfamethoxazole), in all samples, and the risk increased progressively in rural, periurban, and urban areas, we could use those data to make PhC prioritizations and, consequently, to address correction actions and serve as a guide for future ecotoxicological research [53,89,90,91,92]. According to our results, Grill et al. [59] predicted high ecotoxicological risk for 2 out of 15 PhCs (i.e., ethinylestradiol and azithromycin). Moreover, similarly to our results, diclofenac was classified as having low to high acute toxicity [93,94]. However, the methodology (e.g., organisms, acute or chronic endpoints) used for ecotoxicity tests, and thus for the calculating of the PNEC values, may greatly affect the evaluation of the exposure risk [93]. Finally, since the risk was consistently high in the effluents of the WWTP for most of the PhCs, this result additionally demonstrated the poor removal capacity of WWTPs having primary and secondary levels of treatments.

5. Conclusions

In this work, we studied the occurrence, predictability, and environmental risk of 12 PhCs from different therapeutic classes in surface water samples and samples from a conventional WWTP located in the coastal area of Central Italy. Almost all selected PhCs or metabolites were detected at increasing concentrations according to the increase in anthropic pressure, from rural and periurban to urban areas. Compared with the unrefined data, the refined PECs of PhCs, adjusted with the normalization of the loads to the number of inhabitants, provided a good approximation of MEC in all areas, especially the urban one. Thus, our methodology can be of practical use and could be widely applied for the assessment of PEC in areas with a gradient of anthropic pressures. However, the prediction of PEC in the urban area might be improved by refining the removal factors based on additional/improved environmental degradation tests or applying dilution factors more appropriate for the local conditions, on the basis of a good knowledge of the hydrology at the local scale.

Supplementary Materials

The following are available online at https://www.mdpi.com/article/10.3390/w13202807/s1, Figure S1: Frequency of reliability of predicted concentration of pharmaceuticals (PEC) (acceptable, overestimated, and underestimated) based the logarithm of the ratio between PEC calculated by the unrefined formula [1] and the measured concentration of pharmaceuticals (MEC) (average of all concentrations measured in both sampling campaigns) in SwRur, SwPurb, SwUrb, and EffWWTP (SwRur: rural area; SwPurb: periurban area; SwUrb: urban area; EffWWTP: effluent of the wastewater treatment plant).

Author Contributions

Conceptualization, E.P. and L.E.; methodology, A.C.; writing—original draft preparation, A.C., E.P. and L.E.; writing—review and editing, E.P. and L.E.; funding acquisition, E.P. and L.E. All authors have read and agreed to the published version of the manuscript.

Funding

This research was funded by the Ministry of Foreign Affairs and International Cooperation General Directorate for Political Affairs and Security Italian Republic under the project named “Removal of PHARMaceuticals from treated wastewaters in the Soil-WAter-Plant continuum in the MEDiterranean basin—PHARM-SWAP MED” (Rep. 353 of 2015) within the Israel-Italian Call for Proposals on Scientific & Technological Cooperation (Call for Proposal for 2015–2017).

Institutional Review Board Statement

Not applicable.

Informed Consent Statement

Not applicable.

Conflicts of Interest

The authors declare no conflict of interest. The funders had no role in the design of the study; in the collection, analyses, or interpretation of data; in the writing of the manuscript; or in the decision to publish the results.

References

  1. Hignite, C.; Azarnoff, D.L. Drugs and drug metabolites as environmental contaminants: Chlorophenoxyisobutyrate and salicylic acid in sewage water effluent. Life Sci. 1977, 20, 337–341. [Google Scholar] [CrossRef]
  2. Cortecci, G.; Dinelli, E.; Boschetti, T.; Arbizzani, P.; Pompilio, L.; Mussi, M. The Serchio River catchment, northern Tuscany: Geochemistry of stream waters and sediments, and isotopic composition of dissolved sulfate. Appl. Geochem. 2008, 23, 1513–1543. [Google Scholar] [CrossRef]
  3. Khatri, N.; Tyagi, S. Influences of natural and anthropogenic factors on surface and groundwater quality in rural and urban areas. Front. Life Sci. 2015, 8, 23–39. [Google Scholar] [CrossRef]
  4. Lapworth, D.J.; Baran, N.; Stuart, M.E.; Ward, R.S. Emerging organic contaminants in groundwater: A review of sources, fate and occurrence. Environ. Pollut. 2012, 163, 287–303. [Google Scholar] [CrossRef] [Green Version]
  5. Figoli, A.; Fuoco, I.; Apollaro, C.; Chabane, M.; Mancuso, R.; Gabriele, B.; De Rosa, R.; Vespasiano, G.; Barca, D.; Criscuoli, A. Arsenic-contaminated groundwaters remediation by nanofiltration. Sep. Purif. Technol. 2020, 238, 116461. [Google Scholar] [CrossRef]
  6. Mateo-Sagasta, J.; Zadeh, S.M.; Turral, H. More People, More Food, Worse Water?: A Global Review of Water Pollution from Agriculture; Food and Agriculture Organization of the United Nations, FAO, and the International Water Management institute on Behalf of the Water, Land and Ecosystems Research Program of the CGIAR Colombo: Rome, Italy, 2018. [Google Scholar]
  7. De Filippis, G.; Ercoli, L.; Rossetto, R. A spatially distributed, physically-based modeling approach for estimating agricultural nitrate leaching to groundwater. Hydrology 2021, 8, 8. [Google Scholar] [CrossRef]
  8. Sall, M.L.; Diaw, A.K.D.; Gningue-Sall, D.; Efremova Aaron, S.; Aaron, J.J. Toxic heavy metals: Impact on the environment and human health, and treatment with conducting organic polymers, a review. Environ. Sci. Pollut. Res. 2020, 27, 29927–29942. [Google Scholar] [CrossRef] [PubMed]
  9. Meffe, R.; de Bustamante, I. Emerging organic contaminants in surface water and groundwater: A first overview of the situation in Italy. Sci. Total Environ. 2014, 481, 280–295. [Google Scholar] [CrossRef] [PubMed]
  10. Petrie, B.; Barden, R.; Kasprzyk-Hordern, B. A review on emerging contaminants in wastewaters and the environment: Current knowledge, understudied areas and recommendations for future monitoring. Water Res. 2015, 72, 3–27. [Google Scholar] [CrossRef]
  11. Richardson, S.D.; Ternes, T.A. Water analysis: Emerging contaminants and current issues. Anal. Chem. 2018, 90, 398–428. [Google Scholar] [CrossRef] [PubMed]
  12. Tran, H.N.; Tomul, F.; Ha, N.T.H.; Nguyen, D.T.; Lima, E.C.; Le, G.T.; Chang, C.T.; Masindi, V.; Woo, S.H. Innovative spherical biochar for pharmaceutical removal from water: Insight into adsorption mechanism. J. Hazard. Mater. 2020, 394, 122255. [Google Scholar] [CrossRef]
  13. Wilkinson, J.L.; Hooda, P.S.; Swinden, J.; Barker, J.; Barton, S. Spatial (bio)accumulation of pharmaceuticals, illicit drugs, plasticisers, perfluorinated compounds and metabolites in river sediment, aquatic plants and benthic organisms. Environ. Pollut. 2018, 234, 864–875. [Google Scholar] [CrossRef] [Green Version]
  14. Carey, R.O.; Migliaccio, K.W. Contribution of wastewater treatment plant effluents to nutrient dynamics in aquatic systems: A review. Environ. Manag. 2009, 44, 205–217. [Google Scholar] [CrossRef]
  15. Richardson, M.L.; Bowron, J.M. The fate of pharmaceutical chemicals in the aquatic environment. J. Pharm. Pharmacol. 1985, 37, 1–12. [Google Scholar] [CrossRef] [PubMed]
  16. Crane, M.; Watts, C.; Boucard, T. Chronic aquatic environmental risks from exposure to human pharmaceuticals. Sci. Total Environ. 2006, 367, 23–41. [Google Scholar] [CrossRef] [PubMed]
  17. Roig, B.; Greenwood, R.; Barceló, D. An international conference on “Pharmaceuticals in the Environment in a frame of EU Knappe project. Environ. Int. 2009, 35, 763–765. [Google Scholar] [CrossRef] [PubMed]
  18. Malchi, T.; Maor, Y.; Tadmor, G.; Shenker, M.; Chefetz, M. Irrigation of root vegetables with treated wastewater: Evaluating uptake of pharmaceuticals and the associated human health risks. Environ. Sci. Technol. 2014, 48, 9325–9333. [Google Scholar] [CrossRef]
  19. Richardson, S.D.; Ternes, T.A. Water analysis: Emerging contaminants and current issues. Anal. Chem. 2014, 86, 2813–2848. [Google Scholar] [CrossRef] [PubMed]
  20. Proia, L.; von Schiller, D.; Sànchez-Melsió, A.; Sabater, S.; Borrego, C.M.; Rodrìguez-Mozaz, S.; Balcázar, J.L. Occurrence and persistence of antibiotic resistance genes in river biofilms after wastewater inputs in small rivers. Environ. Pollut. 2016, 210, 121–128. [Google Scholar] [CrossRef] [PubMed]
  21. Castiglioni, S.; Bagnati, R.; Fanelli, R.; Pomati, F.; Calamari, D.; Zuccato, E. Removal of pharmaceuticals in sewage treatment plants in Italy. Environ. Sci. Technol. 2006, 40, 357–363. [Google Scholar] [CrossRef] [PubMed]
  22. Gros, M.; Petrović, M.; Ginebreda, A.; Barceló, D. Removal of pharmaceuticals during wastewater treatment and environmental risk assessment using hazard indexes. Environ. Int. 2010, 36, 15–26. [Google Scholar] [CrossRef]
  23. Hughes, S.R.; Kay, P.; Brown, L.E. Global synthesis and critical evaluation of pharmaceutical data sets collected from river systems. Environ. Sci. Technol. 2012, 47, 661–677. [Google Scholar] [CrossRef]
  24. Jjemba, P.K. Excretion and ecotoxicity of pharmaceutical and personal care products in the environment. Ecotoxicol. Environ. Saf. 2006, 63, 113–130. [Google Scholar] [CrossRef]
  25. Wilkinson, J.L.; Hooda, P.S.; Barker, J.; Barton, S.; Swinden, J. Ecotoxic pharmaceuticals, personal care products, and other emerging contaminants: A review of environmental, receptor-mediated, developmental, and epigenetic toxicity with discussion of proposed toxicity to humans. Crit. Rev. Environ. Sci. Technol. 2016, 46, 336–381. [Google Scholar] [CrossRef] [Green Version]
  26. Sabourin, D.L.; Beck, A.; Duenk, P.W.; Kleywegt, S.; Lapen, D.R.; Li, H.; Metcalfe, C.D.; Payne, M.; Topp, E. Runoff of pharmaceuticals and personal care products following application of dewatered municipal biosolids to an agricultural field. Sci. Total Environ. 2009, 407, 4596–4604. [Google Scholar] [CrossRef]
  27. Gottschall, N.; Topp, E.; Metcalfe, C.; Edwards, M.; Payne, M.; Kleywegt, S.; Russell, P.; Lapen, D.R. Pharmaceutical and personal care products in groundwater, subsurface drainage, soil, and wheat grain, following a high single application of municipal biosolids to a field. Chemosphere 2012, 87, 194–203. [Google Scholar] [CrossRef] [PubMed]
  28. Verlicchi, P.; Al Aukidy, M.; Zambello, M. Occurrence of pharmaceutical compounds in urban wastewater: Removal, mass load and environmental risk after a secondary treatment-a review. Sci. Total Environ. 2012, 429, 123–155. [Google Scholar] [CrossRef]
  29. Luo, Y.; Guo, W.; Ngo, H.H.; Nghiem, L.D.; Hai, F.I.; Zhang, J.; Liang, S.; Wang, X.C. A review on the occurrence of micropollutants in the aquatic environment and their fate and removal during wastewater treatment. Sci. Total Environ. 2014, 473, 619–641. [Google Scholar] [CrossRef] [PubMed]
  30. Grandclément, C.; Seyssiecq, I.; Piram, A.; Wong-Wah-Chung, P.; Vanot, G.; Tiliacos, T.; Roche, N.; Doumenq, P. From the conventional biological wastewater treatment to hybrid processes, the evaluation of organic micropollutant removal: A review. Water Res. 2017, 111, 297–317. [Google Scholar] [CrossRef] [Green Version]
  31. Joss, A.; Zabczynski, S.; Göbel, A.; Hoffmann, B.; Löffler, D.; McArdell, C.S.; Ternes, T.A.; Thomsen, A.; Siegrist, H. Biological degradation of pharmaceuticals in municipal wastewater treatment: Proposing a classification scheme. Water Res. 2006, 40, 1686–1696. [Google Scholar] [CrossRef] [PubMed]
  32. Statista. Available online: https://www.statista.com/statistics/978889/wastewater-treatment-plants-by-population-served-in-italy/ (accessed on 11 June 2021).
  33. Press release European Commission. Available online: https://ec.europa.eu/commission/presscorner/detail/en/IP_19_1475 (accessed on 16 June 2021).
  34. EU Decision 495/2015, Commission Implementing Decision (EU) 2015/495 of 20 March 2015 Establishing a Watch List of Substances for Union-Wide Monitoring in the Field of Water Policy Pursuant to Directive 2008/105/EC of the European Parliament and of the Council, Off. J. Eur. Union L 78 (2015) 40–42. Available online: https://eur-lex.europa.eu/legal-content/EN/TXT/?uri=uriserv%3AOJ.L_.2015.078.01.0040.01.ENG (accessed on 11 June 2021).
  35. EU Decision 2018/840, Commission Implementing Decision (EU) 2018/840 of 5 June 2018 Establishing a Watch List of Substances for Union-Wide Monitoring in the Field of Water Policy Pursuant to Directive 2008/105/EC of the European Parliament and of the Council and Repealing Commission Implementing Decision (EU) 2015/495, Off. J. Eur. Union L 141/9 (7.6.2018). Available online: https://eur-lex.europa.eu/legal-content/EN/TXT/?uri=CELEX%3A32018D0840 (accessed on 11 June 2021).
  36. EU Decision 2020/1161, Commission Implementing Decision (EU) 2018/840 of 4 August 2020 Establishing a Watch List of Substances for Union-Wide Monitoring in the Field of Water Policy Pursuant to Directive 2008/105/EC of the European Parliament and of the Council, Off. J. Eur. Union L 257/32 (6.8.2020). Available online: https://eur-lex.europa.eu/legal-content/EN/TXT/?uri=uriserv:OJ.L_.2020.257.01.0032.01.ENG&toc=OJ:L:2020:257:TOC (accessed on 11 June 2021).
  37. Calamari, D.; Zuccato, E.; Castiglioni, S.; Bagnati, R.; Fanelli, R. Strategic survey of therapeutic drugs in the rivers Po and Lambro in northern Italy. Environ. Sci. Technol. 2003, 37, 1241–1248. [Google Scholar] [CrossRef]
  38. Castiglioni, S.; Fanelli, R.; Calamari, D.; Bagnati, R.; Zuccato, E. Methodological approaches for studying pharmaceuticals in the environment by comparing predicted and measured concentrations in River Po, Italy. Regul. Toxicol. Pharmacol. 2004, 39, 25–32. [Google Scholar] [CrossRef]
  39. Escher, B.I.; Baumgartner, R.; Koller, M.; Treyer, K.; Lienert, J.; McArdell, C.S. Environmental toxicology and risk assessment of pharmaceuticals from hospital wastewater. Water Res. 2011, 45, 75–92. [Google Scholar] [CrossRef] [Green Version]
  40. European Medicines Agency, EMA. CHMP Committee for Medicinal Products for Human Use; Guideline on the Environmental Risk Assessment of Medicinal Products for Human Use. Doc. Ref. EMEA/CHMP/SWP/4447/00 corr 1, June; European Medicine Agency, EMA: London, UK, 2006. [Google Scholar]
  41. Verlicchi, P.; Al Aukidy, M.; Jelic, A.; Petrović, M.; Barcelò, D. Comparison of measured and predicted concentrations of selected pharmaceuticals in wastewater and surface water: A case study of a catchment area in the Po Valley (Italy). Sci. Total Environ. 2014, 470, 844–854. [Google Scholar] [CrossRef]
  42. Riva, F.; Zuccato, E.; Castiglioni, S. Prioritization and analysis of pharmaceuticals for human use contaminating the aquatic ecosystem in Italy. J. Pharm. Biomed. Anal. 2015, 106, 71–78. [Google Scholar] [CrossRef]
  43. Ong, T.T.; Blanch, E.W.; Jones, O.A. Predicted environmental concentration and fate of the top 10 most dispensed Australian prescription pharmaceuticals. Environ. Sci. Pollut. Res. 2018, 25, 10966–10976. [Google Scholar] [CrossRef]
  44. He, K.; Borthwick, A.G.; Lin, Y.; Li, Y.; Fu, J.; Wong, Y.; Liu, W. Sale-based estimation of pharmaceutical concentrations and associated environmental risk in the Japanese wastewater system. Environ. Int. 2020, 139, 105690. [Google Scholar] [CrossRef] [PubMed]
  45. Neves, A.C.; Mol, M.P.G. Theoretical environmental risk assessment of ten used pharmaceuticals in Belo Horizonte, Brazil. Environ. Monit. Assess. 2019, 191, 275. [Google Scholar] [CrossRef] [PubMed]
  46. Gómez-Canela, C.; Pueyo, V.; Barata, C.; Lacorte, S.; Marcé, R.M. Development of predicted environmental concentrations to prioritize the occurrence of pharmaceuticals in rivers from Catalonia. Sci. Total Environ. 2019, 666, 57–67. [Google Scholar] [CrossRef]
  47. Keller, V.D.J.; Williams, R.J.; Lofthouse, C.; Johnson, A.C. Worldwide estimation of river concentrations of any chemical originating from sewage-treatment plants using dilution factors. Environ. Toxicol. Chem. 2014, 33, 447–452. [Google Scholar] [CrossRef] [PubMed] [Green Version]
  48. Meyer, W.; Reich, M.; Beier, S.; Behrendt, J.; Gulyas, H.; Otterpohl, R. Measured and predicted environmental concentrations of carbamazepine, diclofenac, and metoprolol in small and medium rivers in northern Germany. Environ. Monit. Assess. 2016, 188, 487. [Google Scholar] [CrossRef]
  49. Pellegrino, E.; Bosco, S.; Ciccolini, V.; Pistocchi, C.; Sabbatini, T.; Silvestri, N.; Bonari, E. Agricultural abandonment in Mediterranean reclaimed peaty soils: Long-term effects on soil chemical properties, arbuscular mycorrhizas and CO2 flux. Agric. Ecosyst. Environ. 2014, 199, 164–175. [Google Scholar] [CrossRef]
  50. Ciccolini, V.; Bonari, E.; Ercoli, L.; Pellegrino, E. Phylogenetic and multivariate analyses to determine the effect of agricultural land-use intensification and soil physico-chemical properties on N-cycling microbial communities in drained Mediterranean peaty soils. Biol. Fertil. Soils 2016, 52, 811–824. [Google Scholar] [CrossRef] [Green Version]
  51. Ciccolini, V.; Ercoli, E.; Davison, J.; Vasar, M.; Öpik, M.; Pellegrino, E. Land-use intensity and host plant simultaneously shape the composition of arbuscular mycorrhizal fungal communities in a Mediterranean drained peatland. FEMS Microbiol. Ecol. 2016, 92, fiw186. [Google Scholar] [CrossRef]
  52. Kottek, M.; Grieser, J.; Beck, C.; Rudolf, B.; Rubel, F. World map of the Köppen-Geiger climate classification updated. Meteorol. Z. 2006, 15, 259–263. [Google Scholar] [CrossRef]
  53. Zuccato, E.; Castiglioni, S.; Fanelli, R. Identification of the pharmaceuticals for human use contaminating the Italian aquatic environment. J. Hazard. Mater. 2005, 122, 205–209. [Google Scholar] [CrossRef]
  54. Local Health Agency of Tuscany 5 (ASL5). Available online: https://www.ars.toscana.it/2-articoli/4473-rapporto-farmaci-in-toscana.html (accessed on 11 June 2021).
  55. Osservatorio Nazionale sull’Impiego dei Medicinali (OsMed). L’uso dei Farmaci in Italia; Rapporto Nazionale Anno 2014; Agrnzia Italiana del Farmaco (AIFA): Rome, Italy, 2015. [Google Scholar]
  56. ISTAT. Rapporto Annuale 2016. Available online: https://www.istat.it/it/files/2016/05/Ra2016.pdf (accessed on 11 June 2021).
  57. WHO Collaborating Centre for Drug Statistics Methodology. Available online: http://www.whocc.no (accessed on 11 June 2021).
  58. Demo-Geodemo, ISTAT. Available online: http://demo.istat.it/ricostruzione/index.php?lingua=ita (accessed on 11 June 2021).
  59. Ort, C.; Hollender, J.; Schaerer, M.; Siegrist, H. Model-based evaluation of reduction strategies for micropollutants from wastewater treatment plants in complex river networks. Environ. Sci. Technol. 2009, 43, 3214–3220. [Google Scholar] [CrossRef] [PubMed]
  60. Verlicchi, P.; Galletti, A.; Petrović, M.; Barcelò, D. Hospital effluents as a source of emerging pollutants: An overview of micropollutants and sustainable treatment options. J. Hydrol. 2010, 389, 416–428. [Google Scholar] [CrossRef]
  61. Zhang, Y.; Geißen, S.U.; Gal, C. Carbamazepine and diclofenac: Removal in wastewater treatment plants and occurrence in water bodies. Chemosphere 2008, 73, 1151–1161. [Google Scholar] [CrossRef] [PubMed]
  62. Johnson, A.C.; Williams, R.J. A model to estimate influent and effluent concentrations of estradiol, estrone, and ethinylestradiol at sewage treatment works. Environ. Sci. Technol. 2004, 38, 3649–3658. [Google Scholar] [CrossRef] [PubMed]
  63. Caldwell, D.J.; Mastrocco, F.; Anderson, P.D.; Länge, R.; Sumpter, P.J. Predicted-no-effect concentrations for the steroid estrogens estrone, 17β-estradiol, estriol, and 17α-ethinylestradiol. Environ. Toxicol. Chem. 2012, 31, 1396–1406. [Google Scholar] [CrossRef] [PubMed]
  64. Oosterhuis, M.; Sacher, F.; Ter Laak, T.L. Prediction of concentration levels of metformin and other high consumption pharmaceuticals in wastewater and regional surface water based on sales data. Sci. Total Environ. 2013, 442, 380–388. [Google Scholar] [CrossRef] [PubMed]
  65. Helwig, K.; Hunter, C.; McNaughtan, M.; Roberts, J.; Pahl, O. Ranking prescribed pharmaceuticals in terms of environmental risk: Inclusion of hospital data and the importance of regular review. Environ. Toxicol. Chem. 2016, 35, 1043–1050. [Google Scholar] [CrossRef] [PubMed] [Green Version]
  66. Johnson, A.C.; Keller, V.; Dumont, E.; Sumpter, J.P. Assessing the concentrations and risks of toxicity from the antibiotics ciprofloxacin, sulfamethoxazole, trimethoprim and erythromycin in European rivers. Sci. Total Environ. 2015, 511, 747–755. [Google Scholar] [CrossRef] [Green Version]
  67. European Agency for the Evaluation of Medicinal Products, EMEA. CPMP Safety Working Party. Note for Guidance on Environmental Risk Assessments of Non-Genetically Modified Organism (Non-GMO) Containing Medicinal Products for Human Use; CPMP/SWP/4447/00; EMEA: London, UK, 2003. [Google Scholar]
  68. Zuccato, E.; Castiglioni, S.; Fanelli, R.; Reitano, G.; Bagnati, R.; Chiabrando, C.; Pomati, F.; Rossetti, C.; Calamari, D. Pharmaceuticals in the environment in Italy: Causes, occurrence, effects and control. Environ. Sci. Pollut. Res. 2006, 13, 15–21. [Google Scholar] [CrossRef]
  69. Lindim, C.; Van Gils, J.; Georgieva, D.; Mekenyan, O.; Cousins, I.T. Evaluation of human pharmaceutical emissions and concentrations in Swedish river basins. Sci. Total Environ. 2016, 572, 508–519. [Google Scholar] [CrossRef]
  70. Zhang, R.; Du, J.; Dong, X.; Huang, Y.; Xie, H.; Chen, J.; Li, X.; Kadokami, K. Occurrence and ecological risks of 156 pharmaceuticals and 296 pesticides in seawater from mariculture areas of Northeast China. Sci. Total Environ. 2021, 792, 148375. [Google Scholar] [CrossRef]
  71. Pescod, M.B. Wastewater Treatment and Use in Agriculture; Food and Agriculture Organization: Rome, Italy, 1992. [Google Scholar]
  72. Sigmund, C. Teoria e Pratica Della Depurazione Delle Acque Reflue. Procedure di Smaltimento e Progettazione (Theory and Practice of Wastewater Treatment. Disposal Procedures and Design); S.F. Flaccovio Editore: Palermo, Italy, 2008. [Google Scholar]
  73. Randhawa, G.K.; Kullar, J.S. Bioremediation of pharmaceuticals, pesticides, and petrochemicals with gomeya/cow dung. Int. Sch. Res. Netw. ISRN Pharmacol. 2011, 2011, 362459. [Google Scholar] [CrossRef] [Green Version]
  74. Sridevi, V.; Chandana, M.V.V.; Lakshmi, M.V.V.C.; Manasa, M. An overview on Bioremediation. Asian J. Biochem. Pharm. Res. 2012, 3, 99–104. [Google Scholar]
  75. Matamoros, V.; Nguyen, L.X.; Arias, C.A.; Salvadó, V.; Brix, H. Evaluation of aquatic plants for removing polar microcontaminants: A microcosm experiment. Chemosphere 2012, 88, 1257–1264. [Google Scholar] [CrossRef]
  76. Caracciolo, A.B.; Topp, E.; Grenni, P. Pharmaceuticals in the environment: Biodegradation and effects on natural microbial communities. A review. J. Pharm. Biomed. Anal. 2015, 106, 25–36. [Google Scholar] [CrossRef] [PubMed]
  77. Zhang, D.; Gersberg, R.M.; Ng, W.J.; Tan, S.K. Removal of pharmaceuticals and personal care products in aquatic plant-based systems: A review. Environ. Pollut. 2014, 184, 620–639. [Google Scholar] [CrossRef] [PubMed]
  78. Chenxi, W.; Spongberg, A.L.; Witter, J.D. Determination of the persistence of pharmaceuticals in biosolids using liquid-chromatography tandem mass spectrometry. Chemosphere 2008, 73, 511–518. [Google Scholar] [CrossRef] [PubMed]
  79. Guasch, H.; Ginebreda, A.; Geiszinger, A. (Eds.) Emerging and Priority Pollutants in Rivers: Bringing Science into River Management Plans; Springer Science & Business Media: Berlin, Germany, 2012; Volume 19. [Google Scholar]
  80. Mandaric, L.; Diamantini, E.; Stella, E.; Cano-Paoli, K.; Valle-Sistac, J.; Molins-Delgado, D.; Bellin, A.; Chiogna, G.; Majone, B.; Diaz-Cruz, M.S.; et al. Contamination sources and distribution patterns of pharmaceuticals and personal care products in Alpine rivers strongly affected by tourism. Sci. Total Environ. 2017, 590, 484–494. [Google Scholar] [CrossRef]
  81. Borja, A.; Galparsoro, I.; Solaun, O.; Muxika, I.; Tello, E.M.; Uriarte, A.; Valencia, V. The European Water Framework Directive and the DPSIR, a methodological approach to assess the risk of failing to achieve good ecological status. Estuar. Coast. Shelf Sci. 2006, 66, 84–96. [Google Scholar] [CrossRef]
  82. Zhang, Y.; Geißen, S.U. Elimination of carbamazepine in a non-sterile fungal bioreactor. Bioresource Technol. 2012, 112, 221–227. [Google Scholar] [CrossRef]
  83. Margot, J.; Bennati-Granier, C.; Maillard, J.; Blánquez, P.; Barry, D.A.; Holliger, C. Bacterial versus fungal laccase: Potential for micropollutant degradation. AMB Express 2013, 3, 63. [Google Scholar] [CrossRef] [Green Version]
  84. Domaradzka, D.; Guzik, U.; Wojcieszyńska, D. Biodegradation and biotransformation of polycyclic non-steroidal anti-inflammatory drugs. Rev. Environ. Sci. Biotechnol. 2015, 14, 229–239. [Google Scholar] [CrossRef] [Green Version]
  85. Rodarte-Morales, A.I.; Feijoo, G.; Moreira, M.T.; Lema, J.M. Degradation of selected pharmaceutical and personal care products (PPCPs) by white-rot fungi. World J. Microbiol. Biotechnol. 2011, 27, 1839–1846. [Google Scholar] [CrossRef]
  86. Mariotti, M.; Masoni, A.; Ercoli, L.; Arduini, I. Nitrogen leaching and residual effect of barley/field bean intercropping. Plant Soil Environ. 2015, 61, 60–65. [Google Scholar] [CrossRef] [Green Version]
  87. Afonso-Olivares, C.; Sosa-Ferrera, Z.; Santana-Rodríguez, J.J. Occurrence and environmental impact of pharmaceutical residues from conventional and natural wastewater treatment plants in Gran Canaria (Spain). Sci. Total Environ. 2017, 599, 934–943. [Google Scholar] [CrossRef] [PubMed]
  88. Piazza, G.; Pellegrino, E.; Moscatelli, M.C.; Ercoli, L. Long-term conservation tillage and nitrogen fertilization effects on soil aggregate distribution, nutrient stocks and enzymatic activities in bulk soil and occluded microaggregates. Soil Tillage Res. 2020, 196, 104482. [Google Scholar] [CrossRef]
  89. Besse, J.P.; Garric, J. Human pharmaceuticals in surface waters: Implementation of a prioritization methodology and application to the French situation. Toxicol. Lett. 2008, 176, 104–123. [Google Scholar] [CrossRef] [PubMed]
  90. Cooper, E.R.; Siewicki, T.C.; Phillips, K. Preliminary risk assessment database and risk ranking of pharmaceuticals in the environment. Sci. Total Environ. 2008, 398, 26–33. [Google Scholar] [CrossRef] [PubMed]
  91. Bouissou-Schurtz, C.; Houeto, P.; Guerbet, M.; Bachelot, M.; Casellas, C.; Mauclaire, A.C.; Panetier, P.; Delval, C.; Masset, D. Ecological risk assessment of the presence of pharmaceutical residues in a French national water survey. Regul. Toxicol. Pharmacol. 2014, 69, 296–303. [Google Scholar] [CrossRef]
  92. Tahar, A.; Tiedeken, E.J.; Clifford, E.; Cummins, E.; Rowan, N. Development of a semi-quantitative risk assessment model for evaluating environmental threat posed by the three first EU watch-list pharmaceuticals to urban wastewater treatment plants: An Irish case study. Sci. Total Environ. 2017, 603, 627–638. [Google Scholar] [CrossRef]
  93. Grill, G.; Khan, U.; Lehner, B.; Nicell, J.; Ariwi, J. Risk assessment of down-the-drain chemicals at large spatial scales: Model development and application to contaminants originating from urban areas in the Saint Lawrence River Basin. Sci. Total Environ. 2016, 541, 825–838. [Google Scholar] [CrossRef] [PubMed] [Green Version]
  94. Fent, K.; Weston, A.A.; Caminada, D. Ecotoxicology of human pharmaceuticals. Aquat. Toxicol. 2006, 76, 122–159. [Google Scholar] [CrossRef]
Figure 1. Map of the study area and sampling points of the March and September campaigns in a coastal area of Central Italy. Sampling points are a rural area (SwRur), a periurban area (SwPurb), an urban area (SwUrb), and the effluent of a wastewater treatment plant (EffWWTP).
Water 13 02807 g001
Figure 2. Box plot indicating measured environmental concentration (MEC) of selected pharmaceuticals (ng L−1) in surface waters and effluent wastewater collected in March 2016 from the sampling points in a coastal area of Central Italy (SwRur: rural area; SwPurb: periurban area; SwUrb: urban area; EffWWTP: effluent of the wastewater treatment plant). The box indicates the 25th and 75th percentiles, the horizontal line indicates the median, and the whiskers indicate the lowest and the highest values. Dehydro-erythromycin and 10,11-dehydro-10,11-dehydroxycarbamazepine are metabolites of erythromycin and carbamazepine, respectively.
Water 13 02807 g002
Figure 3. Box plot indicating measured environmental concentration (MEC) of selected pharmaceuticals (ng L−1) in surface waters and effluent wastewater collected in September 2016 from the sampling points in a coastal area of Central Italy (SwRur: rural area; SwPurb: periurban area; SwUrb: urban area; EffWWTP: effluent of the wastewater treatment plant). The box indicates the 25th and 75th percentiles, the horizontal line indicates the median, and the whiskers indicate the lowest and the highest values. Dehydro-erythromycin and 10,11-dehydro-10,11-dehydroxycarbamazepine are metabolites of erythromycin and carbamazepine, respectively.
Water 13 02807 g003
Figure 4. Box plot indicating measured environmental concentration (MEC) of selected pharmaceuticals (ng L−1) in surface waters and effluent wastewater collected in March and September 2016 campaigns from the sampling points in a coastal area of Central Italy (SwRur: rural area; SwPurb: periurban area; SwUrb: urban area; EffWWTP: effluent of the wastewater treatment plant). The box indicates the 25th and 75th percentiles, the horizontal line indicates the median, and the whiskers indicate the lowest and the highest values. Different small letters represent significant differences among treatments (LSD test on estimated marginal means, P ≤ 0.05), applying a one-way ANCOVA. Dehydro-erythromycin and 10,11-dehydro-10,11-dehydroxycarbamazepine are metabolites of erythromycin and carbamazepine, respectively.
Water 13 02807 g004
Figure 5. Frequency of reliability of predicted concentration of pharmaceuticals (PEC) (acceptable, overestimated, and underestimated) based on the logarithm of the ratio between PEC calculated by the refined formula and measured concentration of pharmaceuticals (MEC) (average of all concentrations measured in both sampling campaigns) in SwRur, SwPurb, SwUrb, and EffWWTP (SwRur: rural area; SwPurb: periurban area; SwUrb: urban area; EffWWTP: effluent of the wastewater treatment plant).
Water 13 02807 g005
Figure 6. Risk posed by pharmaceuticals assessed by risk quotient (RQ) calculated as the ratio between measured concentration of pharmaceuticals (MEC) and the corresponding predicted no-effect concentration (PNEC) in SwRur, SwPurb, SwUrb, and EffWWTP (average of March and September campaigns) (SwRur: rural area; SwPurb: periurban area; SwUrb: urban area; EffWWTP: effluent of the wastewater treatment plant).
Water 13 02807 g006
Table 1. Sale volumes of the selected pharmaceuticals per inhabitant (Qj) and for the whole number of citizens of ASL5 (total sale), and other parameters used for the calculation of sale data. For each drug (j), the defined daily dose (DDDj) and the DDD sold per one thousand inhabitants per day (DDDj,1000) obtained from the OsMed are reported.
PharmaceuticalTherapeutic ClassDDDj aOsMed bASL5 c
mgDDDj,1000QjTotal Sale (Aj)QjTotal Sale (Aj)
n 1000 inhab−1 day−1mg inh−1 year−1kgmg inh−1 year−1kg
AtenololCardiovascular drug7510.0273.894.62281.897.41
CarbamazepineAntiepileptic1000 -510.3176.38
ClarithromycinAntibiotic5002.7492.8170.32511.4176.76
DiclofenacNonsteroidal anti-inflammatory drug10012.7463.6160.23193.466.85
Erythromycin Antibiotic1000 -6.92.38
EstradiolHormone2 -0.70.24
EstroneHormone1 ---
EthinylestradiolSynthetic hormone0.025 -0.10.02
IbuprofenNonsteroidal anti-inflammatory drug12004.62014.8696.421128.4390.02
MetforminAntidiabetic200019.914,527.05122.2015,778.15453.70
NaproxenNonsteroidal anti-inflammatory drug5000.8146.050.47121.141.87
SulfamethoxazoleAntibiotic2000 -200.669.33
a World Health Organization Collaborating Centre for Drug Statistics [57]; b Osservatorio nazionale sull’impiego dei Medicinali [55], reporting prescribed and over-the-counter pharmaceuticals for 2014; c Local Health Agency of Tuscany 5 (ALS5) [54] reporting prescribed pharmaceuticals for 2014.
Table 2. Excretion and removal factors and predicted no-effect concentration (PNEC) of selected pharmaceuticals.
Pharmaceutical *Excretion FactorReferenceRemoval FactorReferencePNEC ng L−1Reference
Atenolol0.80[42]0.57[42]30,000[28]
Carbamazepine0.03[60]0.07[61]13,800[28]
Clarithromycin0.25[41]0.08[41]70[28]
Diclofenac0.10[60]0.35[42]9700[28]
Erythromycin 0.05[60]0.73[41]20[28]
Estradiol--0.13[62]2[63]
Ethinylestradiol0.27[41]0.21[41]0.1[63]
Ibuprofen0.10[60]0.92[42]1650[28]
Metformin0.79[42]0.98[64]60,000[65]
Naproxen0.10[57]0.68[42]2620[28]
Sulfamethoxazole0.18[66]0.48[66]27[28]
* Estrone was not included as it is a natural hormone.
Table 3. Predicted environmental concentration (PEC) of selected pharmaceuticals (ng L−1) in surface waters from rural (PEC Rur), periurban (PEC Purb), and urban (PEC Urb) areas based on the refinement of the formula using the population density of the areas at increasing anthropogenic pressure. For comparison, the unrefined PEC and the PEC of the effluent of the wastewater treatment plant (PEC EffWWTP) are shown.
Pharmaceutical *PEC RurPEC PurbPEC UrbUnrefined PEC PEC EffWWTP
Atenolol37.0148.0369.9136.11361.2
Carbamazepine5.321.253.019.5195.0
Clarithromycin43.8175.1437.8161.11611.2
Diclofenac4.718.746.841.3172.2
Erythromycin 0.00.10.30.11.3
Estradiol0.20.92.20.88.2
Ethinylestradiol0.00.00.10.00.2
Ibuprofen3.413.433.621.1123.7
Metformin92.8371.2928.0341.53415.0
Naproxen1.45.814.46.453.1
Sulfamethoxazole7.028.069.925.7257.2
* Estrone was not included as it is a natural hormone.
Publisher’s Note: MDPI stays neutral with regard to jurisdictional claims in published maps and institutional affiliations.

