Article

Distribution Patterns of Benthic Foraminifera in Fish Farming Areas (Corsica, France): Implications for the Implementation of Biotic Indices in Biomonitoring Studies

by
Antoine Dubois
1,†,
Christine Barras
2,
Jean-Charles Pavard
1,2,
Annick Donnay
3,
Melvin Béatrix
1 and
Vincent M. P. Bouchet
1,*
1
Laboratoire d’Océanologie et de Géosciences (LOG), UMR 8187, Station Marine de Wimereux, University Lille, CNRS, Université Littoral Côte d’Opale, 59000 Lille, France
2
Laboratory of Recent and Fossil Bio-Indicators (LPG-BIAF), UMR CNRS 6112, University Angers, 2 Boulevard Lavoisier, CEDEX 01, 49045 Angers, France
3
Station de Recherches Sous-Marines et Océanographiques (STARESO), Pointe Revellata, 20260 Corse, France
*
Author to whom correspondence should be addressed.
Current address: Institut Universitaire Mer et Littoral, Université de Nantes, EA2160 Mer Molécules Santé, 2 Rue de la Houssinière BP92208, CEDEX 3, 44035 Nantes, France.
Water 2021, 13(20), 2821; https://doi.org/10.3390/w13202821
Submission received: 25 September 2021 / Revised: 8 October 2021 / Accepted: 8 October 2021 / Published: 11 October 2021

Abstract

:
Corsican marine aquaculture is one of the highest contributors of fish production in France, which may result in environmental perturbations caused by organic matter (OM) accumulation under fish farms and impacting natural communities. This study aimed to (1) characterise the environmental conditions at two different fish farms, (2) monitor the response of benthic foraminiferal species to this activity, and (3) assess the accuracy of existing foraminiferal biotic indices. In 2017, sea floor sediment was sampled in transects from two Corsican fish farms for living foraminiferal and sedimentary analyses. Four indices were calculated and compared: exp(H′bc), Foram-AMBI, Foram Stress Index and TSI-Med. A significant increase in total organic carbon (TOC) has been shown, mainly below the fish cages. Communities were characterized by a shift from high density, opportunistic and tolerant species under the cages to lower densities and more sensitive species further away. According to their distribution patterns along the TOC gradient, we propose to update the ecological group classification of seven species to improve Foram-AMBI’s accuracy and sensitivity: Triloculina oblonga and Quinqueloculina lamarckiana to Ecological Group (EG) I; Rosalina bradyi to EGIII; and Bolivina dilatata, Bulimina aculeata and Quinqueloculina stalkeri to EGIV. We recommend prioritising the use of TSI-Med and Foram-AMBI with the updated list to assess ecological quality in coastal waters of the Mediterranean Sea.

1. Introduction

With an ever-increasing global demand for fish, aquaculture has been developed to counterbalance and to limit the impact of fisheries on marine biodiversity and biomass. Nowadays, aquaculture provides about 42.2% of worldwide fish production [1,2]. In the Mediterranean Sea, the sea bass (Dicentrarchus labrax) and the gilt-head sea bream (Sparus aurata) are among the most harvested fishes (Greece, Spain or France) [3]. In France, Corsica has had among the highest production for these two species for many years [4]. The impact of fish farms on the surrounding environment is now widely acknowledged, mainly due to the accumulation of organic matter (OM) under the cages; up to 30% of the organic matter in the sediment below the cages being non-consumed food [5]. In addition to food-related releases, feces of fishes also accumulate, corresponding to up to 12% of the OM in the sediment [5]. High nutrients and OM loads from fish farming may induce important changes in the environmental conditions of the habitat and thereby alter benthic communities [6,7,8,9]. Considering that the Mediterranean Sea is an oligotrophic sea, it artificially creates more eutrophic zones in areas adjacent to the fish cages, stimulating benthic macrofauna [10] and foraminiferal abundances [11]. Conversely, under the cages, decrease in the seagrass Posidonia oceanica meadows have been reported several times [12,13,14], up to 11 ha in 10 years [15]. Furthermore, OM enrichment decreases the number of macro-invertebrate species present under aquaculture cages [12]. Ecological assessment of benthic habitat under fish cages in the Mediterranean Sea concluded that benthic communities were heavily disturbed [15,16,17]. Specifically, there is an increase in macro-invertebrate opportunistic species near fish cages and sensitive species mostly occur away from the cages [15,18,19].
Since 1999, the European Water Framework Directive (WFD) and then the Marine Strategic Framework Directive (MSFD) emphasised the need to monitor and assess the health of coastal, estuarine and continental waters. According to these legislations, the evaluation of water masses’ quality involves determining the Ecological Quality Status (EcoQS), noticeably in human-modified habitats like fish farming areas. In this context, several biological quality elements have been chosen, for instance, seagrasses communities [20], macro-algae [21] and benthic macro-invertebrates [22].
Recently, a group of protists belonging to meiofauna, benthic foraminifera, are now used as indicators of pollution (e.g., [23,24,25,26,27,28,29,30,31]). Their natural features, i.e., fossilisable calcareous test [32,33,34] and great abundances in limited volumes of sediment, make them particularly interesting candidates for environmental monitoring [35]. They also have a short and fast life cycle that allows a clear observation of environmental modification [35]. Under fish farms, several studies have reported a change in foraminiferal communities [11,36,37,38,39,40]. Noticeably, tolerant and opportunistic species abundances increase close to the oyster and fish farms while sensitive ones tend to disappear [36,41,42,43]. To increase their use in environmental monitoring surveys, biotic indices based on benthic foraminifera indices have been developed (see review [44]). They are based either on their diversity i.e., the exp(H′bc) [45] or on the species-specific response to total organic carbon content i.e., Foram-AMBI [41,46,47], TSI-Med [48] and Foram Stress Index [49]. These indices were successfully applied to assess the health of benthic habitats in the Mediterranean Sea [31,37,41,48,49,50,51,52,53,54]. However, benthic foraminifera are not yet acknowledged as a biological quality element for the implementation of the WFD and MSFD.
In this context, the main objective of this study was to understand the distribution pattern of foraminiferal assemblages under fish farming cages in Corsica, and to further monitor the health of the benthic habitats underneath. Specifically, this study aimed to (1) characterize the environmental conditions under fish farming cages, (2) monitor the response of benthic foraminiferal species to the presence of fish aquaculture, and (3) assess the accuracy of foraminiferal biotic indices to reflect the impact of fish farms.

2. Materials and Methods

2.1. Sampling Strategy

Two fish farms were sampled in August 2017 by scuba divers from the STARESO (Station de Recherches Sous-marines et Océanographiques based in Calvi). Both farms are located along the west coast of Corsica (Figure 1) at 28 m (from 27 to 29 m) and 20 m (from 18 to 22.5 m) water depth for site B and D, respectively. Both fish farms have been awarded the French Label Rouge quality mark, indicating that they follow environmentally sound practices. They produce sea bass (Dicentrarchus labrax), gilt-head sea bream (Sparus aurata) and meagre (Argyrosomus regius, only site B). Fish farm B is located at the entrance of a bay, which is protected by islands from western and north-western winds, storms and it further allows for good seawater renewal (Figure 1). Outward seawater currents are oriented towards the west. Fish farm D is located in the inner part of a bay. It offers natural protection from western and south-western winds. The main seawater currents follow the coast and are oriented west- and eastward.
Five stations were sampled along a transect at each farm: under the cages (0) and then at 50, 100, 200 and 300 m away from the farm following a presumed gradient of organic matter enrichment at the sea floor (Figure 1). These aquacultures are the most active fish farms in Corsica, producing 850 and 150 tons of fish per year, respectively, for B and D.
Sampling was performed by pushing a core liner into the sediment (diameter: 7.4 cm) in patches of soft sediment between Posidonia oceanica meadows (Figure S1). Samples for benthic foraminifera analyses (sediment layer: 0–1 cm, n = 3) were preserved in a mix of 96% ethanol with rose Bengal dye (2 g L−1) to distinguish living from dead specimens [34]. At each station, three replicate cores (sediment layer: 0–1 cm, n = 3) were sampled for organic matter analyses (e.g., total organic carbon, carbon-to-nitrogen ratio) and one additional core (sediment layer: 0–1 cm, n = 1) was sampled for grain size analyses.

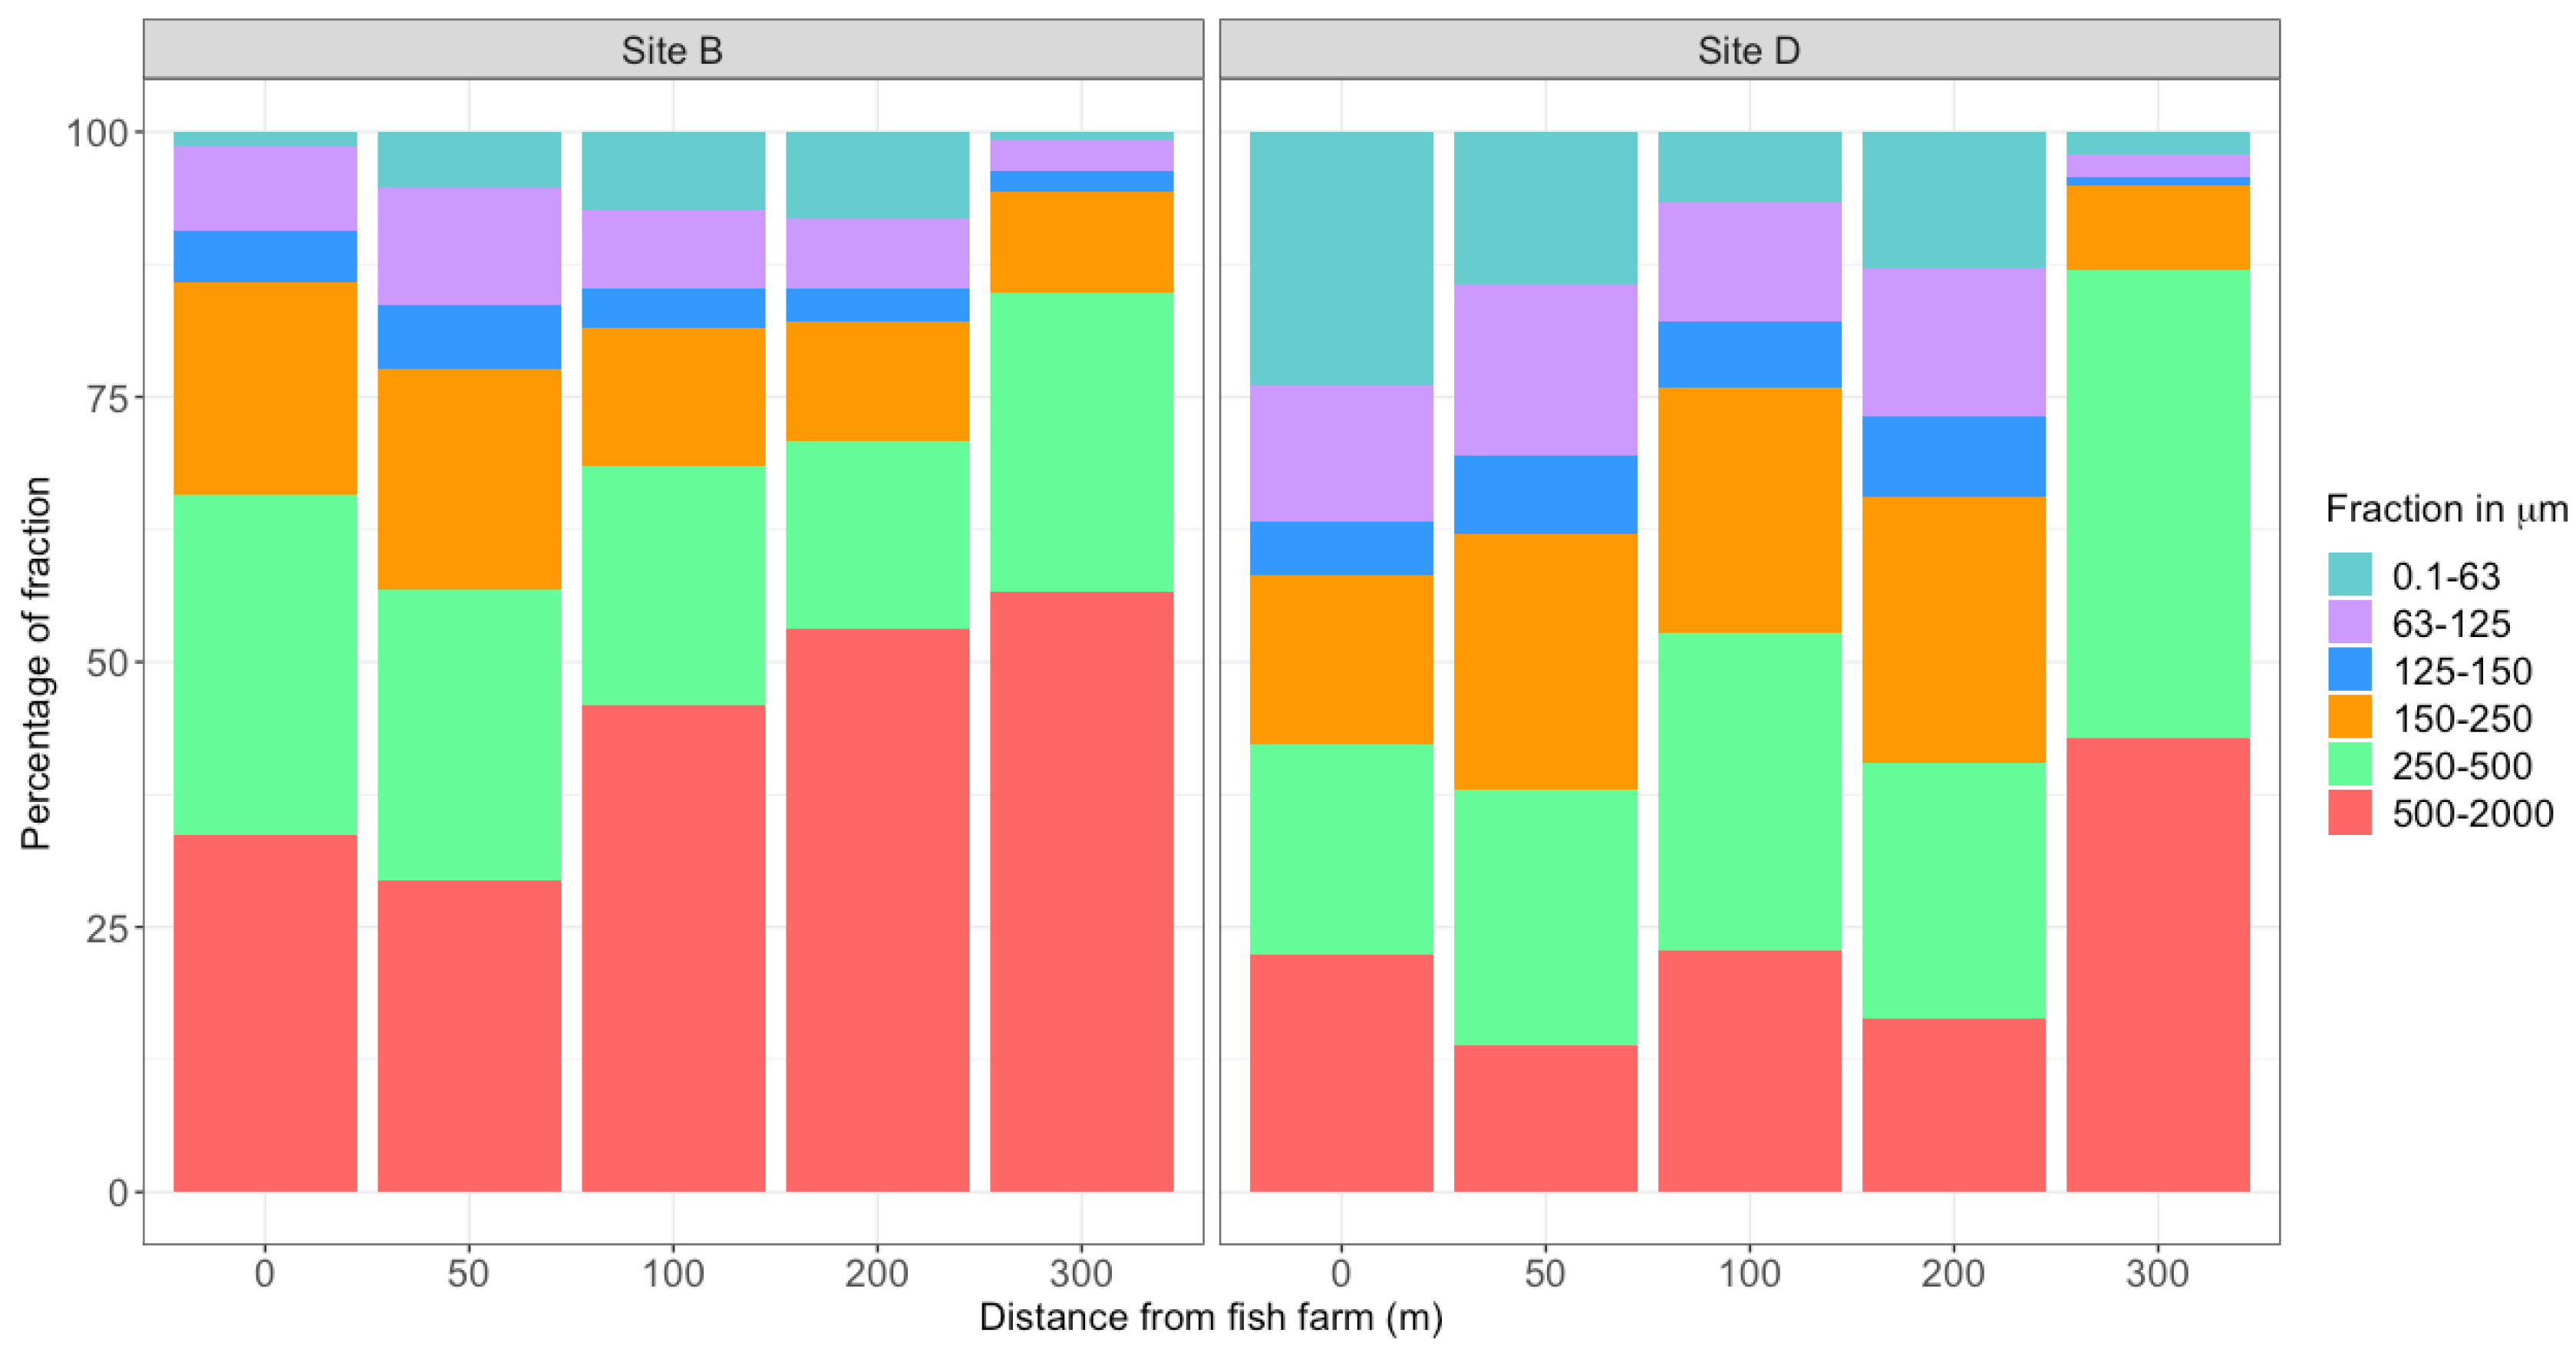
2.2. Grain Size Analyses

A sample dedicated to grain size analysis was taken from the surface sediment (0–1 cm). For each station, the bulk sediment was sieved over a 2000 μm mesh size. Then, the grain size distribution was measured in three aliquots with a Malvern Mastersizer 3000 (Malvern Inc., Malvern, UK). When the three aliquots had a similar grain size distribution, a single measurement was chosen randomly to describe the grain size distribution at each station.

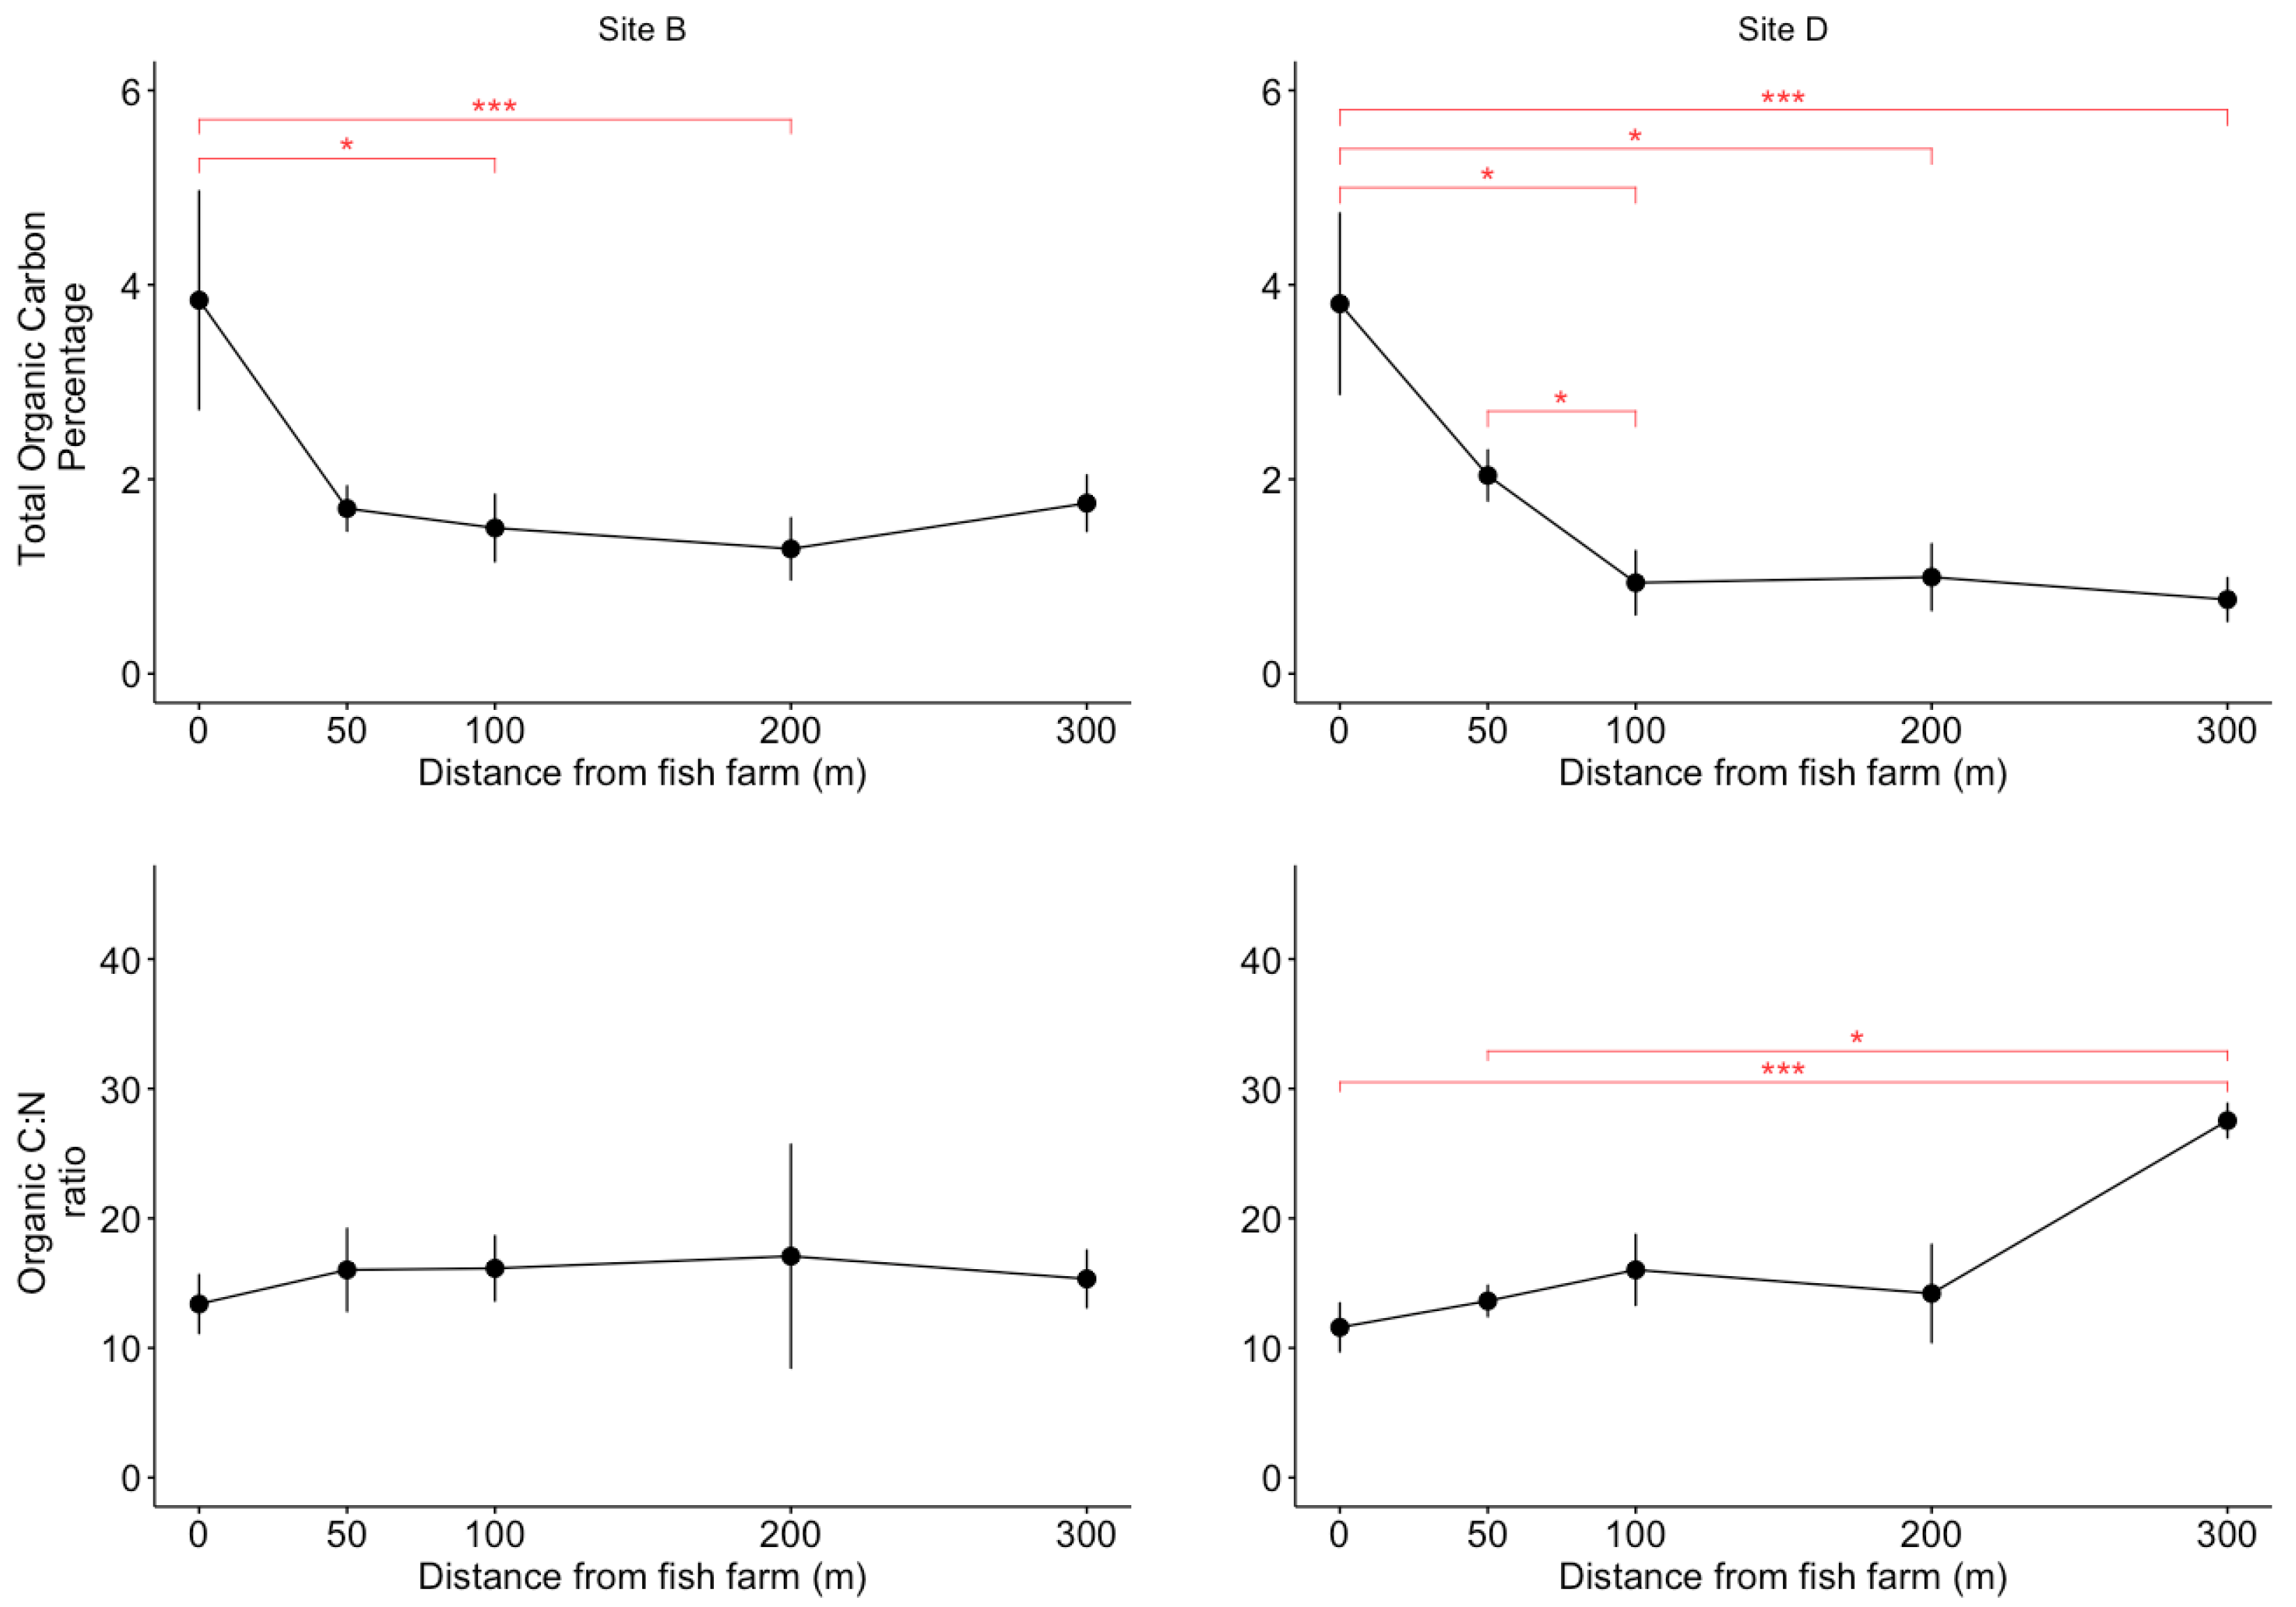
2.3. Organic Matter Analysis

Sediment samples for organic matter analyses were preserved at −20 °C at the laboratory. Total organic carbon and nitrogen contents were obtained after sediment grinding by hand, by quantifying the total amount of carbon and nitrogen (measured in dried samples). The amount of inorganic carbon and nitrogen (measured in samples burned at 550 °C for 5 h) was subtracted. It was determined with an elemental analyzer (Thermofisher Flash 2000, Laboratory of Oceanology and Geosciences in Wimereux, France) and expressed as the % of total organic carbon (TOC) and total organic nitrogen per total weight of dry sediment. The carbon-to-nitrogen (C:N) ratio was calculated at each station to determine the terrestrial or marine origin of the organic matter.

2.4. Foraminiferal Analysis

Samples were washed with tap water through a succession of 500, 125 and 63 µm mesh sieves to remove clay, silt and any excess of dye. Each residual fraction was dried at 50 °C for 12 h. Quantitative analysis of benthic foraminifera was performed on the 125–500 μm fraction. Density separations were performed for all samples with sodium polytungstate (SPT) solution of 2.3 density with 161 g of SPT powder in 60 mL of Milli-Q® water [55]. For all samples except for B0-3, B50-2, D0-2 and D0-3, all living specimens were dry picked. For these 4 samples showing high densities, 300 stained specimens per sample were dry picked [45]; the total number of individuals being then estimated using the precise weight of sediment picked compared to the total weight of sediment in the sample. Only specimens with dense and brightly red/pink stained protoplasm were considered as alive [35] and identified until species level, when possible, following taxonomical books on Mediterranean benthic foraminifera (e.g., [56,57]). Species names follow the World Register of Marine Species [58].

2.5. Faunal Analyses

We calculated specific richness, absolute densities (indiv.50 cm−2) and relative abundances per station (%) after pooling the three replicate samples together. Then, four biotic indices were calculated based on benthic foraminifera: the diversity index exp(H′bc) [45], and three sensitivity-based indices, i.e., Foram-AMBI [41,46,47], FSI [49] and TSI-Med (Tolerant Species Index-Mediterranean, [48]).
As the Shannon index H′ is biased when there are unobserved species in the community, a common problem with under-sampling [59], we used the bias-corrected version of Shannon’s index (H′bc), which has little bias [60]. Shannon’s index is an entropy rather than a diversity index. The entropy gives the average uncertainty of the identity of an individual picked from the community, not the number of species in the community [61,62]. It is calculated as follows (Equation (8) in [59]):
H bc = i = 1 S π ˜ i log ( π ˜ i ) 1 ( 1 π ˜ i ) n I ( A i )
where π ˜ i = ( X i n ) C ^ , C ^ = 1 ( f 1 n ) , Ai denotes the event that the ith unit is included in the sample and I(Ai) is the usual indicator function (i.e., I(Ai) = 1 when the event Ai is true and I(Ai) = 0 otherwise), S is the number of species in a community (labeled from 1 to S), X i is the number of individuals of the ith species observed in the sample, n is the number of individuals, f 1 is the number of species with 1 individual in the sample [59].
It can be converted to true diversity, the effective number of species, with the exponential function N1 = exp(H′bc) [63]. Exp(H′bc) gives the number of species that would, if each were equally common, produce the same H′bc as the sample. All data represent the pooled counts from three replicates per station (rather than the average).
For Foram-AMBI, species from open waters in the Mediterranean Sea were assigned to five ecological groups according to their response to TOC content [47]. Ecological Group I (EG-I) is composed of taxa sensitive to small increases in TOC; EG-II of taxa indifferent to TOC content; EG-III of third-order opportunists to excesses of TOC; EG-IV of second-order opportunistic species present at high TOC levels; and finally, EG-V of first-order opportunistic species able to resist strong disturbances and excesses in TOC. The following formula is used to compute Foram-AMBI:
FForam - AMBI = ( 0 × % EG   I ) + ( 1.5 × % EG   II ) + ( 3 × % EG   III ) + ( 4.5 × % EG   IV ) + ( 6 × % EG   V ) 100
Following the procedure described in [22], species not assigned to any of the five ecological groups (see Table S1) were not considered in the calculation of the relative proportions of the five EGs. Consequently, the cumulative proportion of EGI to EGV is equal to 1. Foram-AMBI values range between 0 (bad ecological quality) and 6 (high ecological quality). In this study, we first used the species classification proposed in 2018 [47] for open waters in the Mediterranean Sea. In a second step, we proposed modifying the species assignment of six of the major species identified in our study area. Three of these species (Triloculina oblonga, Quinqueloculina lamarckiana, Q. stalkeri) were not assigned yet by Jorissen et al. [47], and exhibited a clear distribution pattern along the TOC gradient. The three other species (Rosalina bradyi, Bolivina dilatata and Bulimina aculeata), originally classified by Jorissen et al. [47], exhibited a response to the TOC gradient different from their original assignments in our study area. According to these study results and to their known ecology, we assigned or re-assigned these species to EGs. This is further explained in the discussion. We calculated therefore the “Foram-AMBI” according to the original list [47] and the “Foram-AMBI-updated” according to the proposed updated list based on the present study findings.
The FSI considers only two groups of indicative species: sensitive and tolerant species [49]. This classification is based on literature review from their study area in the Eastern Mediterranean and we decided to follow this original classification to apply FSI to our dataset. FSI is defined by the following equation:
FSI = ( 10 ×   % Sensitive ) + ( % Tolerant )
As for the Foram-AMBI, some species were not assigned to any group (see Table S1) however they were not excluded from the dataset since no specifications were given for this aspect [49]. According to these authors, all taxa should be classified either as “Sensitive” or as “Tolerant”, but this was, in our opinion, not possible to decide for all species in our study area. FSI values range between 0 (high ecological quality) and 10 (bad ecological quality).
For TSI-Med, the index value is based on the cumulative proportion of a group of stress-tolerant taxa and is corrected for the expected proportion of this group under unpolluted reference conditions [48]. The latter value is estimated on the basis of a grain size parameter (% grains < 63 μm). We used the most recent species list provided in 2021 [31] which has been defined based on literature review, to identify tolerant species to increased OM and potential oxygen depletion. TSI-Med is calculated using the following equation:
TSI - Med = % T S x % T S r e f 100 % T S r e f × 100
where
% T S r e f = 0.1547 × % 63   µ m 0.3638
and %TSx is the percentage of tolerant species found in the sample. TSI-Med values range between 0 (high ecological quality) and 100 (bad ecological quality).
As the present study aims to evaluate the accuracy of the different biotic indices tested, we decided to not use the ecological quality status but rather the quantitative data given by these indices. Indeed, the transformation of these data into 5 EcoQS will strongly depend on the boundary limits proposed. This issue, i.e., how to set the boundary limits, is another scientific question that will need to be addressed separately.

2.6. Numerical Analysis

Kruskal-Wallis tests were performed on the TOC data as no normality and homogeneity has been found by Shapiro and Bartlett tests. Dunn’s post-hoc tests were computed when a significant difference was detected by the Kruskal-Wallis tests.
Correlation between indices and environmental parameters was investigated using Kendall’s coefficient of rank correlation (τ). Kendall’s coefficient of correlation was used in preference to Spearman’s coefficient of correlation (ρ), because Spearman’s ρ gives greater weight to pairs of ranks that are further apart, while Kendall’s τ weights each disagreement in rank equally [64].
For the species community data, initial detrended correspondence analyses indicated that the gradient is short (2.2SD) in the foraminiferal data. Consequently, principal correspondence analysis (PCA) was applied to the foraminiferal data. Replicate samples were pooled, and relative abundances data were log(x + 1) transformed prior to analysis. A heatmap was further used to visualize the distribution of species between stations (relative abundance > 5%, untransformed pooled data).
Statistical tests were performed with the statistical language R version 4.0.3 [65] and statistical packages (entropy v1.2.1, vegan v2.5-7, irr v0.84.1, gplots v3.1.1 and ggplot2 3.3.5).

3. Results

3.1. Environmental Parameters Analayses

Both sites are characterized by sandy sediment (sand fraction (>63 µm) = 92 ± 7%, all stations combined, Figure 2). Grain size analyses showed that fine fraction (<63 µm) percentages ranged from 0.9 (station B300) up to 23.9% (station D0, Figure 2). At site D, the fine fraction (<63 µm) decreased from the station below the cage (D0) towards more distant stations (Figure 2). Site B showed an increase in the fine fraction until 200 m from the fish farm with a lower percentage of this fraction at 300 m. A similar trend was observed for the fraction 500–2000 µm, with an increase along the transect (Figure 2).
Sites B (2.02 ± 1.04%) and D (1.71 ± 1.28%) show relatively similar total organic carbon percentages with intra-site differences (Figure 3). Indeed, at site B, TOC values at station 0 (i.e., under the fish cages) was significantly different from stations B100 (Dunn test, p < 0.05) and B200 (Dunn test, p < 0.001) with higher TOC content at station B0. For site D, station D0 had a significantly higher TOC content than stations D100, D200 and D300 (respectively Dunn test, p < 0.05, p < 0.05 and p < 0.001, Figure 3). There was also a statistically significant difference between station D50 and D100 (Dunn test, p < 0.05, Figure 3).
Conversely to TOC, the two sites exhibited different trends regarding organic C:N ratios (Figure 3). This ratio was rather stable at site B where no significant differences were found. On the other hand, C:N ratios increased slightly with a greater distance from the fish farm at site D with statistically higher value at site D300 (p < 0.05 at D300, and p < 0.001 at D50, Figure 3).

3.2. Foraminiferal Analyses

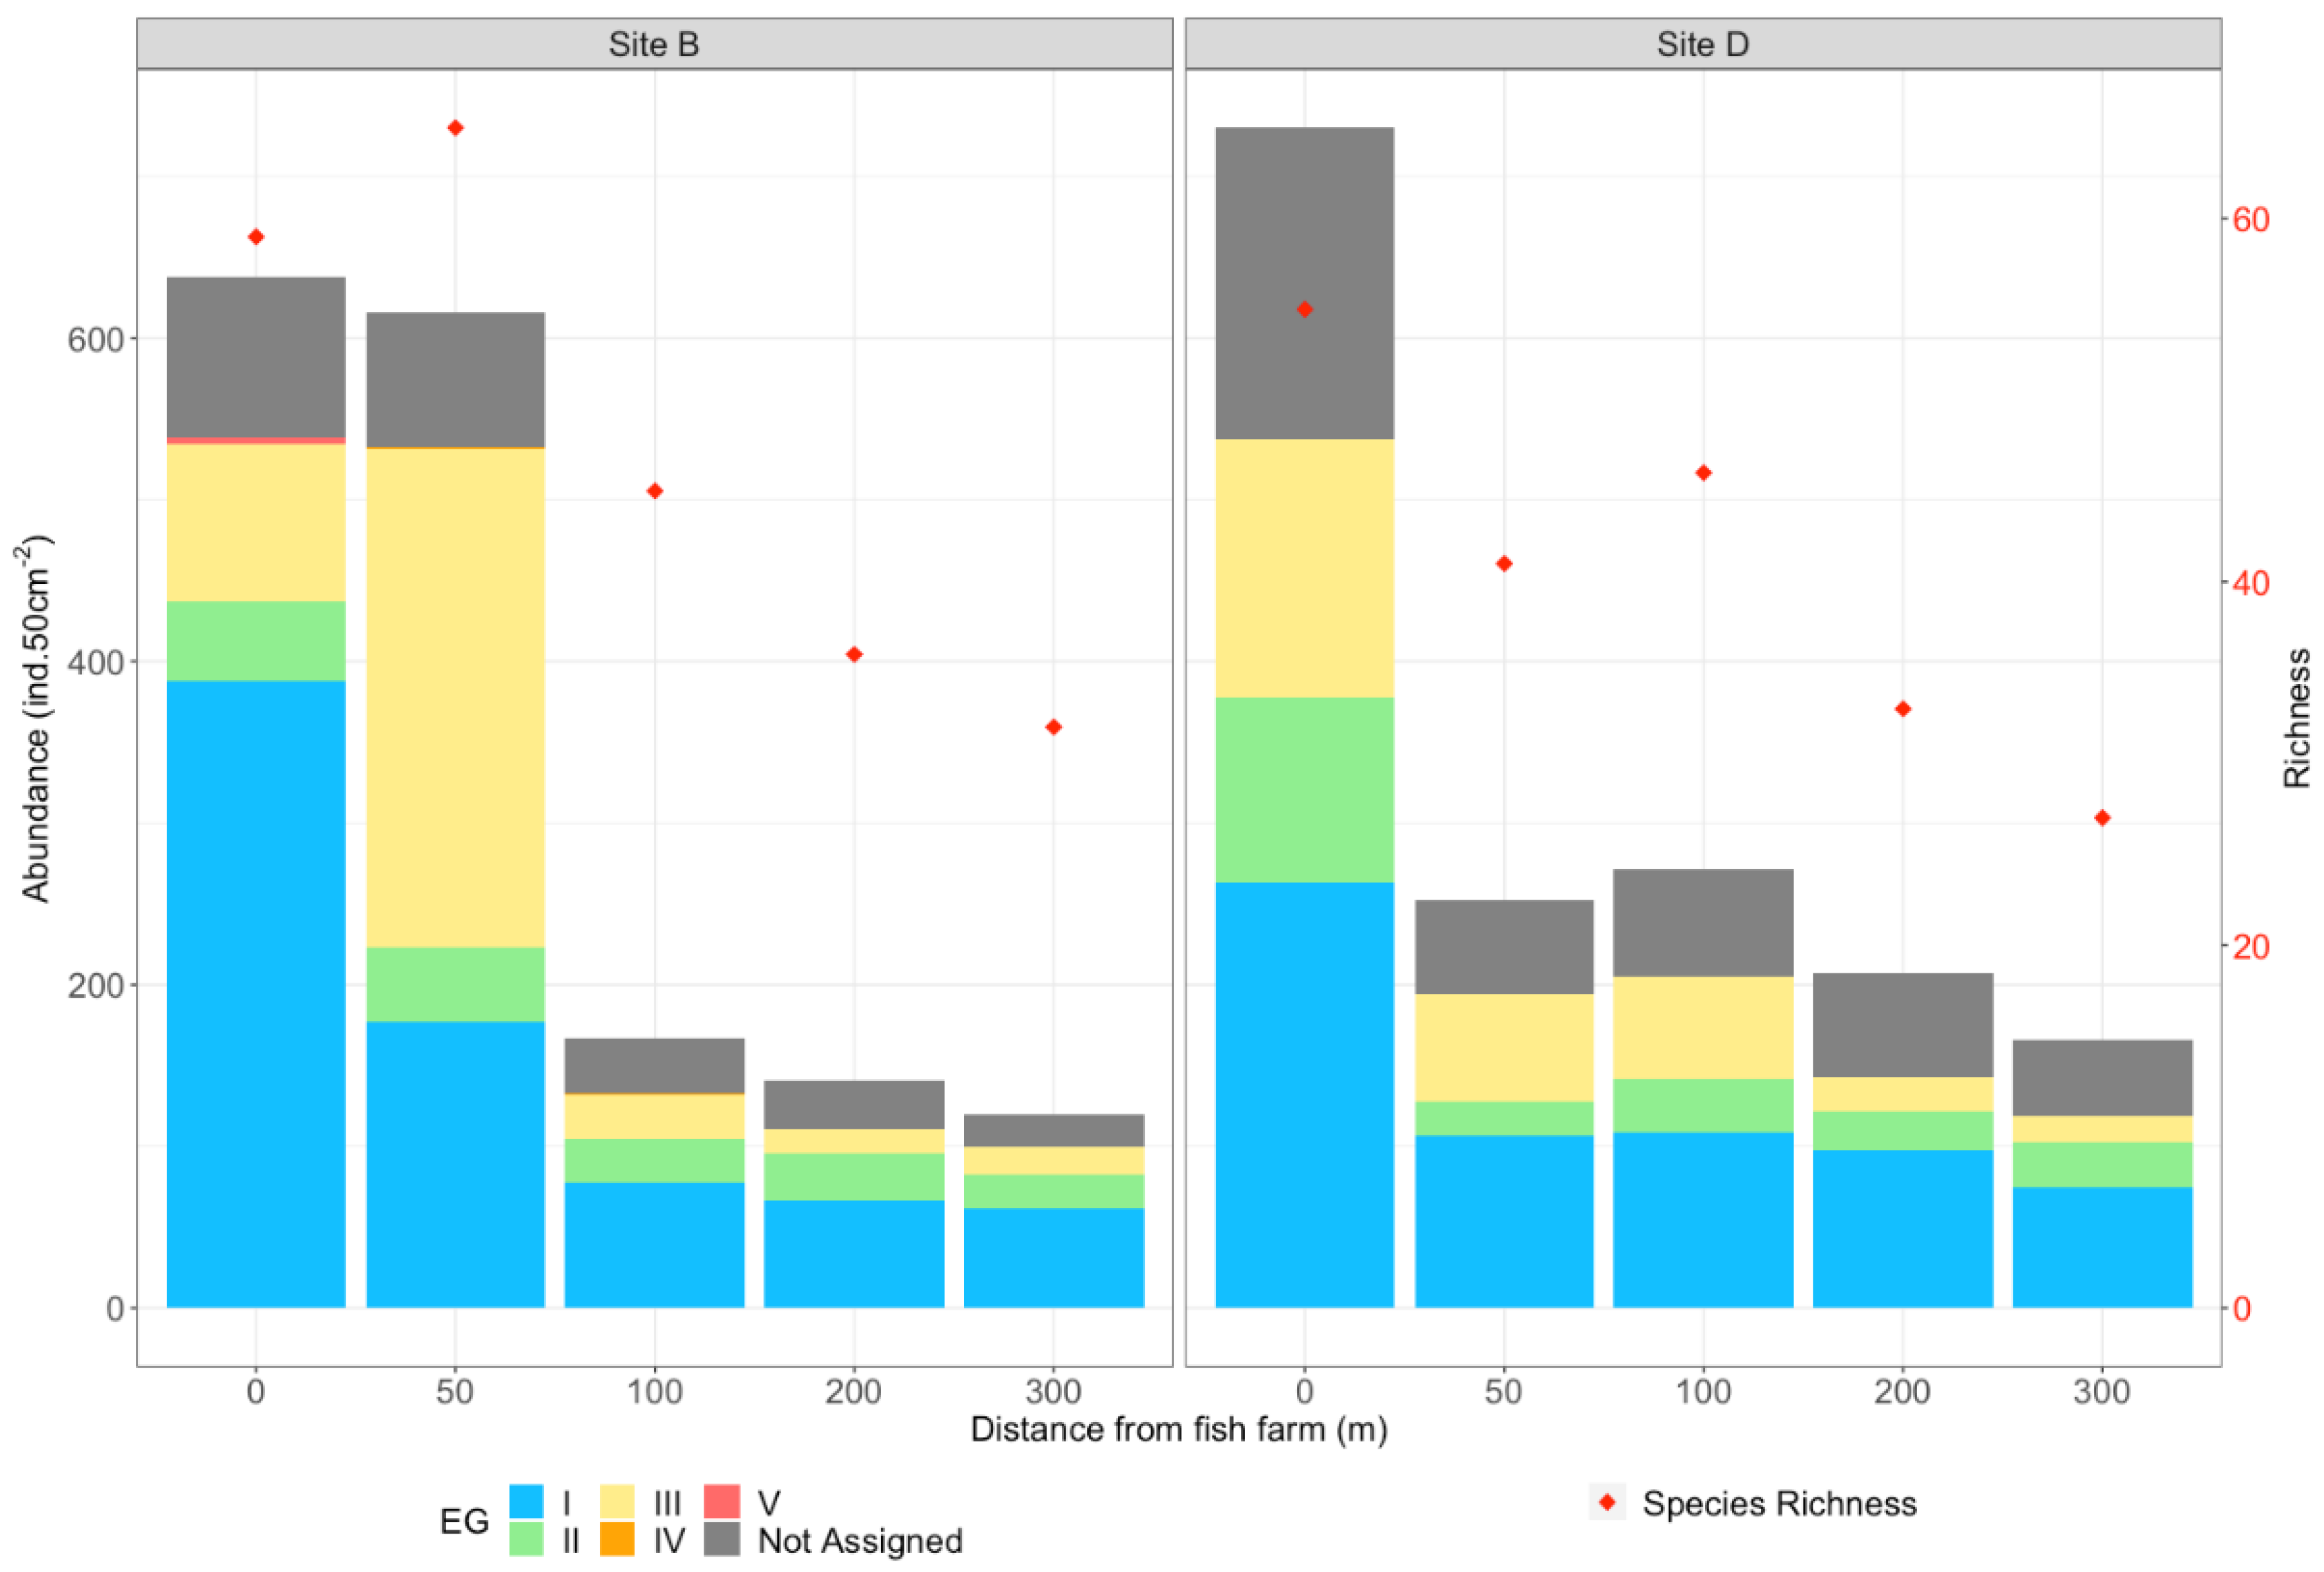
3.2.1. Abundance and Diversity

Foraminiferal analysis of the 125–500 µm fraction revealed a heterogeneity between samples in terms of density of foraminifera for 50 cm2 (ind.50 cm−2). Densities varied from 126 ind.50 cm−2 (station B300) to a maximum of 732 ind.50 cm−2 (station D0; Figure 4, Table S1). Stations under the fish farms (i.e., B0, B50, and D0) exhibited higher densities than stations further away from the fish farms (Figure 4).
We identified 102 different species among which 93 were identified to the species level (Table S1). A variation of species richness was observed among all of the stations with a maximum richness of 75 at station B50 and a minimum at station D300 with 37 species (Figure 4). However, species richness was clearly influenced by the total abundances at the stations (see Figures S2 and S3 for Kendall’s correlation). The exp(H′bc) exhibited a pattern that is similar between site B and D with higher biodiversity observed at intermediate stations of the transects (i.e., B100 and D100).

3.2.2. Faunal Composition

According to the PCA performed on relative densities of the total fauna, site B and D were well separated on axis 1 of the PCA representing 24.9% of the total variance of the fauna (Figure 5), meaning that both sites are characterized by different assemblages, probably because of their different geographical location. For site D, stations D100, D200 and D300, further away from the cages, have very similar faunal composition (Figure 5). For site B, the faunal composition seems to be quite different between all of the stations.
The heat map based on the 20 major species, present in more than 5% of the total fauna in at least one of the stations from sites B and D, showed different distribution patterns according to the species considered (Figure 6). For example, Bolivina dilatata and Bulimina aculeata exhibited a similar pattern at both sites with decreasing relative densities with increasing distance from the fish cages. On the other hand, species such as Adelosina cliarensis (site D), Astrononion stelligerum (site B), Lagenammina atlantica (site B, and D to a lesser extent), Pyrgo oblonga (site D), Triloculina oblonga (and T. tricarinata and T. trigonula to a lesser extent in site D) showed opposite trends with decreasing densities towards the cages. Eggerelloides scaber had a maximum of density at 50 m away from the cages at both sites. For Quinqueloculina spp., mainly present in site D, all species seemed to behave differently with a maximum density for Q. stalkeri under the fish cage whereas all other species (Q. bosciana, Q. lamarckiana and Q. seminula) showed increasing abundances further away. At site B, the epiphytic species Lobatula lobatula and Rosalina bradyi dominated the fauna under the cage.
In detail, Quinqueloculina lamarckiana and Triloculina oblonga (Figure 7a,b) exhibited maximum relative abundances when the TOC content was low with a distribution pattern similar to species from EGI (Figure 7g). Rosalina bradyi (Figure 7c) showed a maximum around 3% TOC; resembling to distribution pattern of species from EGIII (Figure 7g). Bulimina aculeata, Bolivina dilatata and Q. stalkeri (Figure 7d–f) had exponential relative abundances along the increasing gradient of TOC, a behaviour similar to species from EGIV (Figure 7g). These observations provide evidences for the assignment/re-assignment of these species. This is further addressed in the Discussion Section.

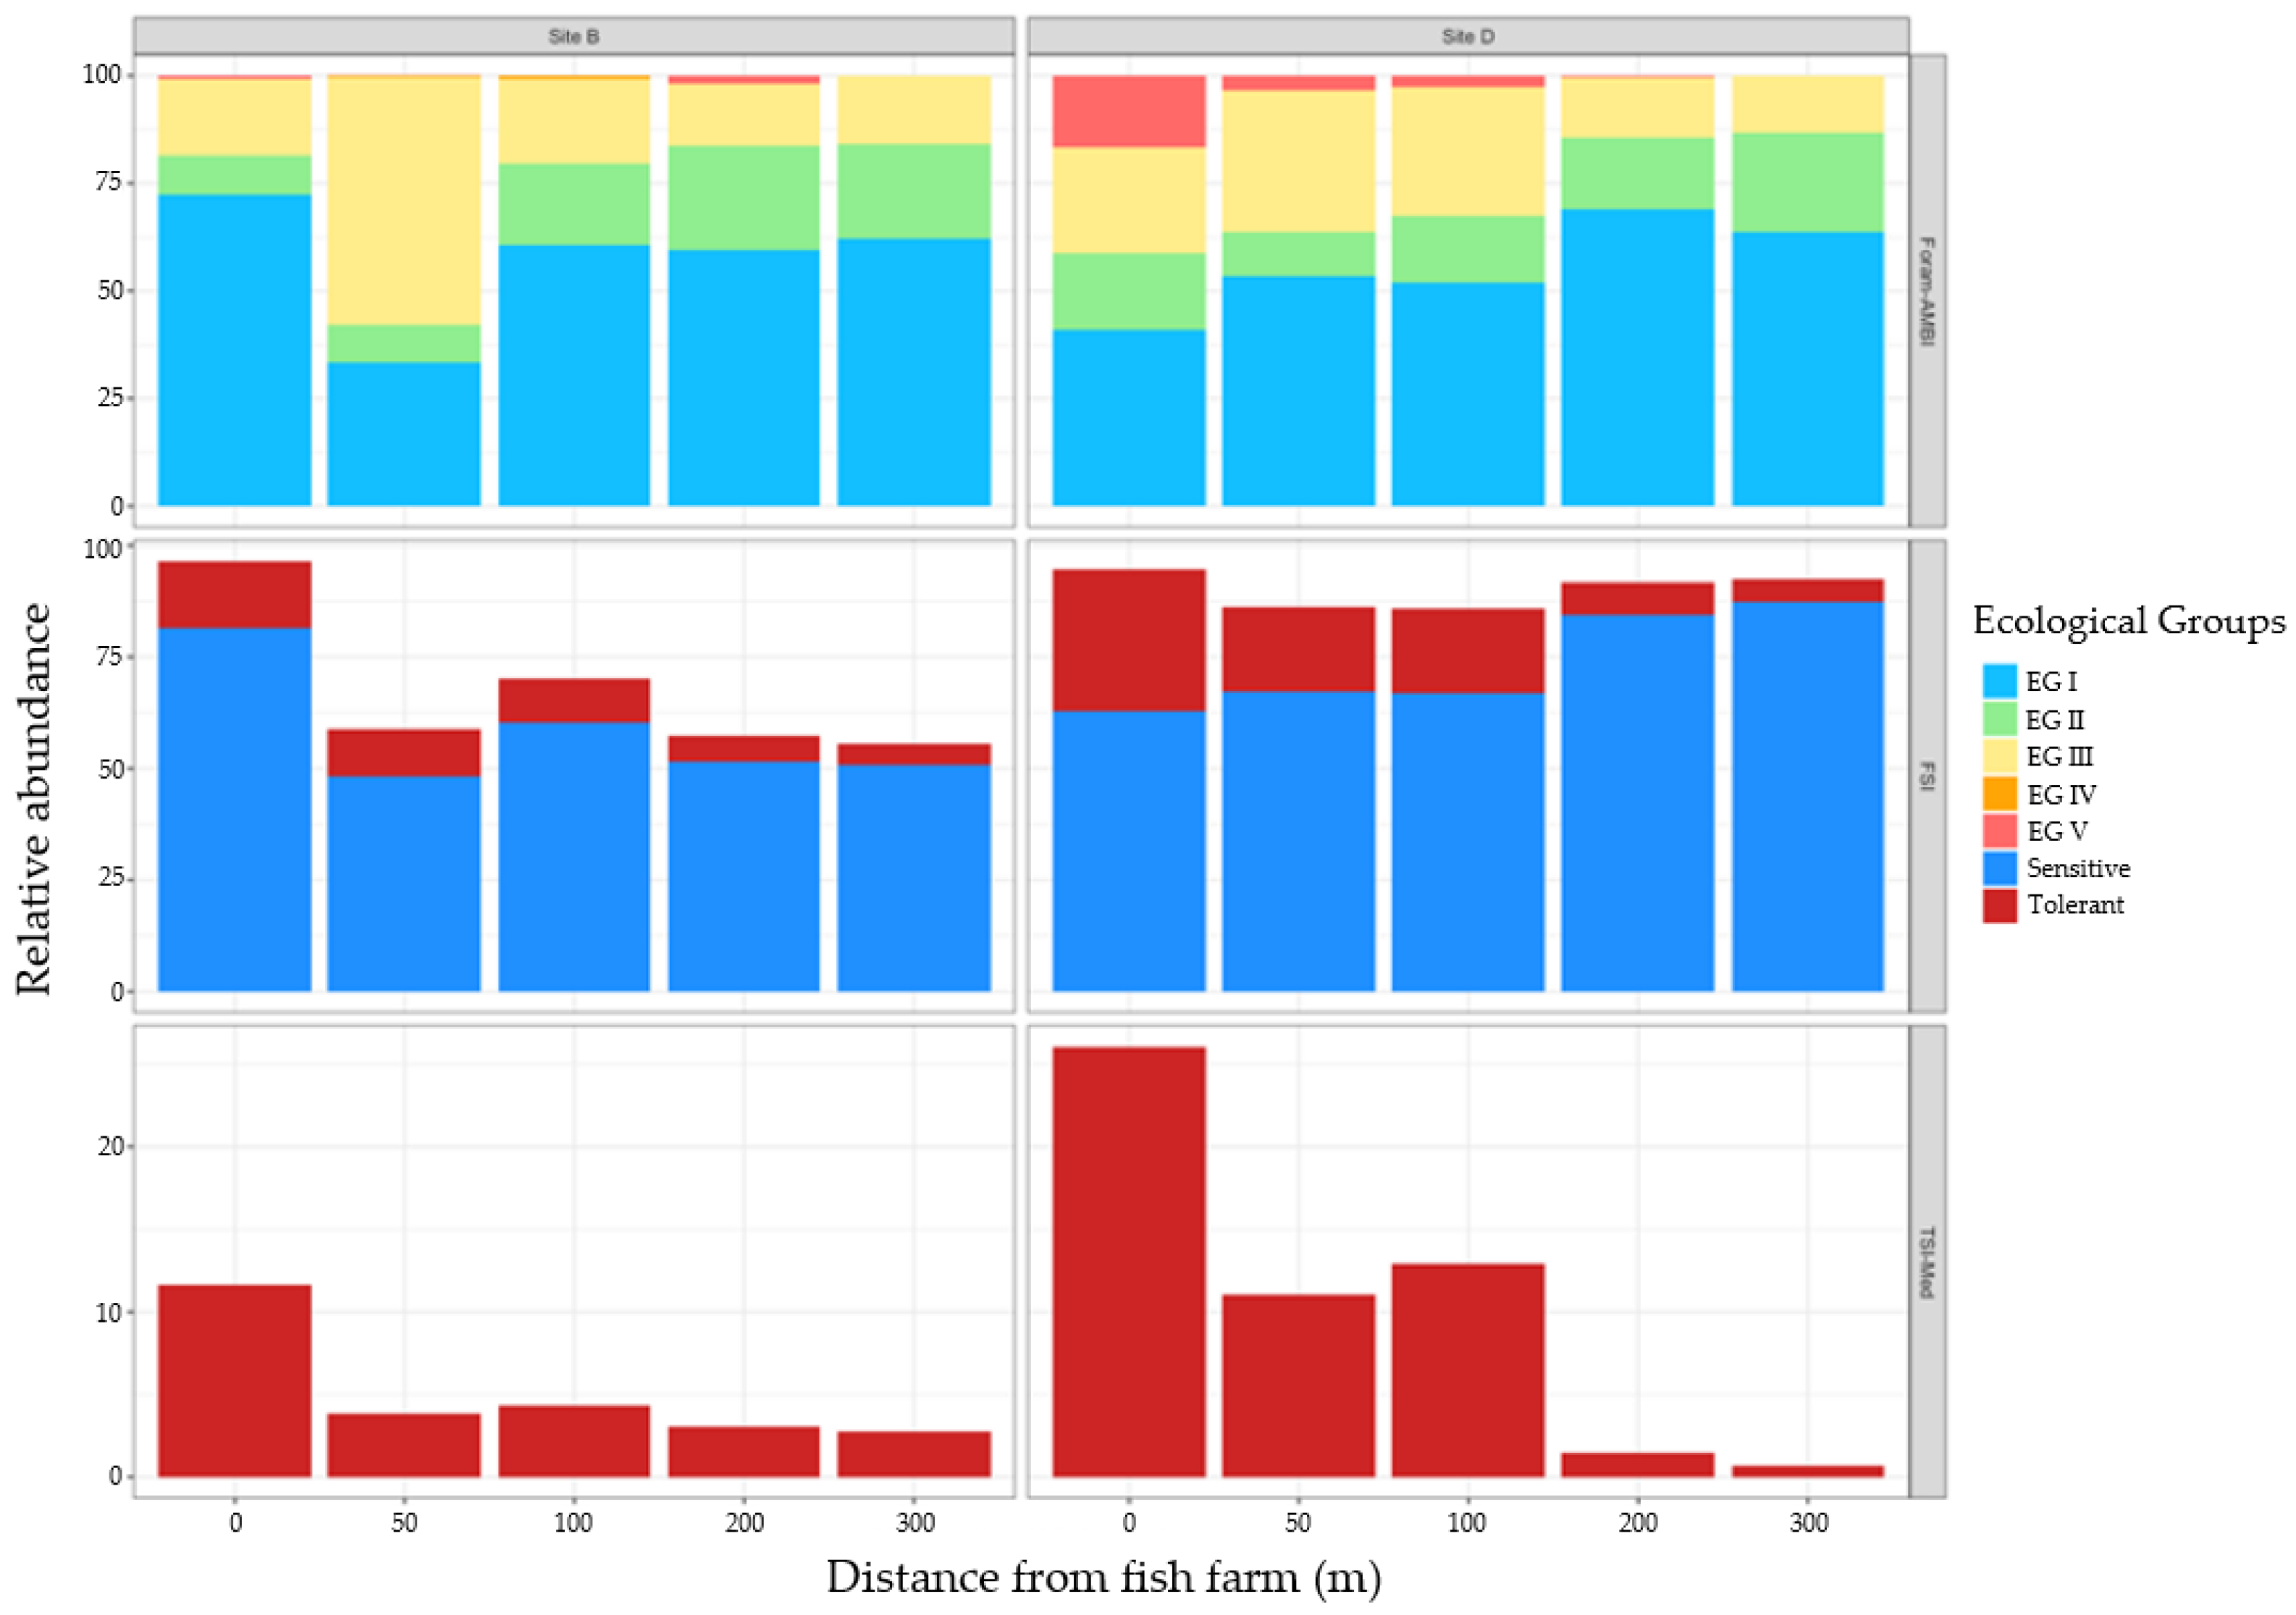
3.2.3. Proportions of Ecological Groups

At site D, the relative densities of tolerant to opportunistic species increased towards the fish cages whatever the index considered (Figure 8). The group of sensitive species identified in Foram-AMBI and FSI showed a slight increase with distance (Figure 8). For site B, there was no apparent trend in the different EGs from Foram-AMBI with distance from the cage. Actually, EGIII (3rd order opportunist species) dominated at the intermediate station B50. For TSI-Med and FSI, only station B0 below the cage exhibits higher proportions of tolerant species compared to all the other stations. Surprisingly, the proportion of sensitive species is also higher at B0 for FSI.
It is important to highlight that some species identified in this study were not assigned to any group for Foram-AMBI and FSI (“Not assigned species” (NA), Table S1). These proportions varied from 14.9% (D0) to 30.7% (D200) for Foram-AMBI, with 7 of the 10 stations studied with %NA > 20%. For FSI, it varied between 4% (B0) and 45% (B300), with 4 out of 10 stations with %NA > 20% (Table S1).

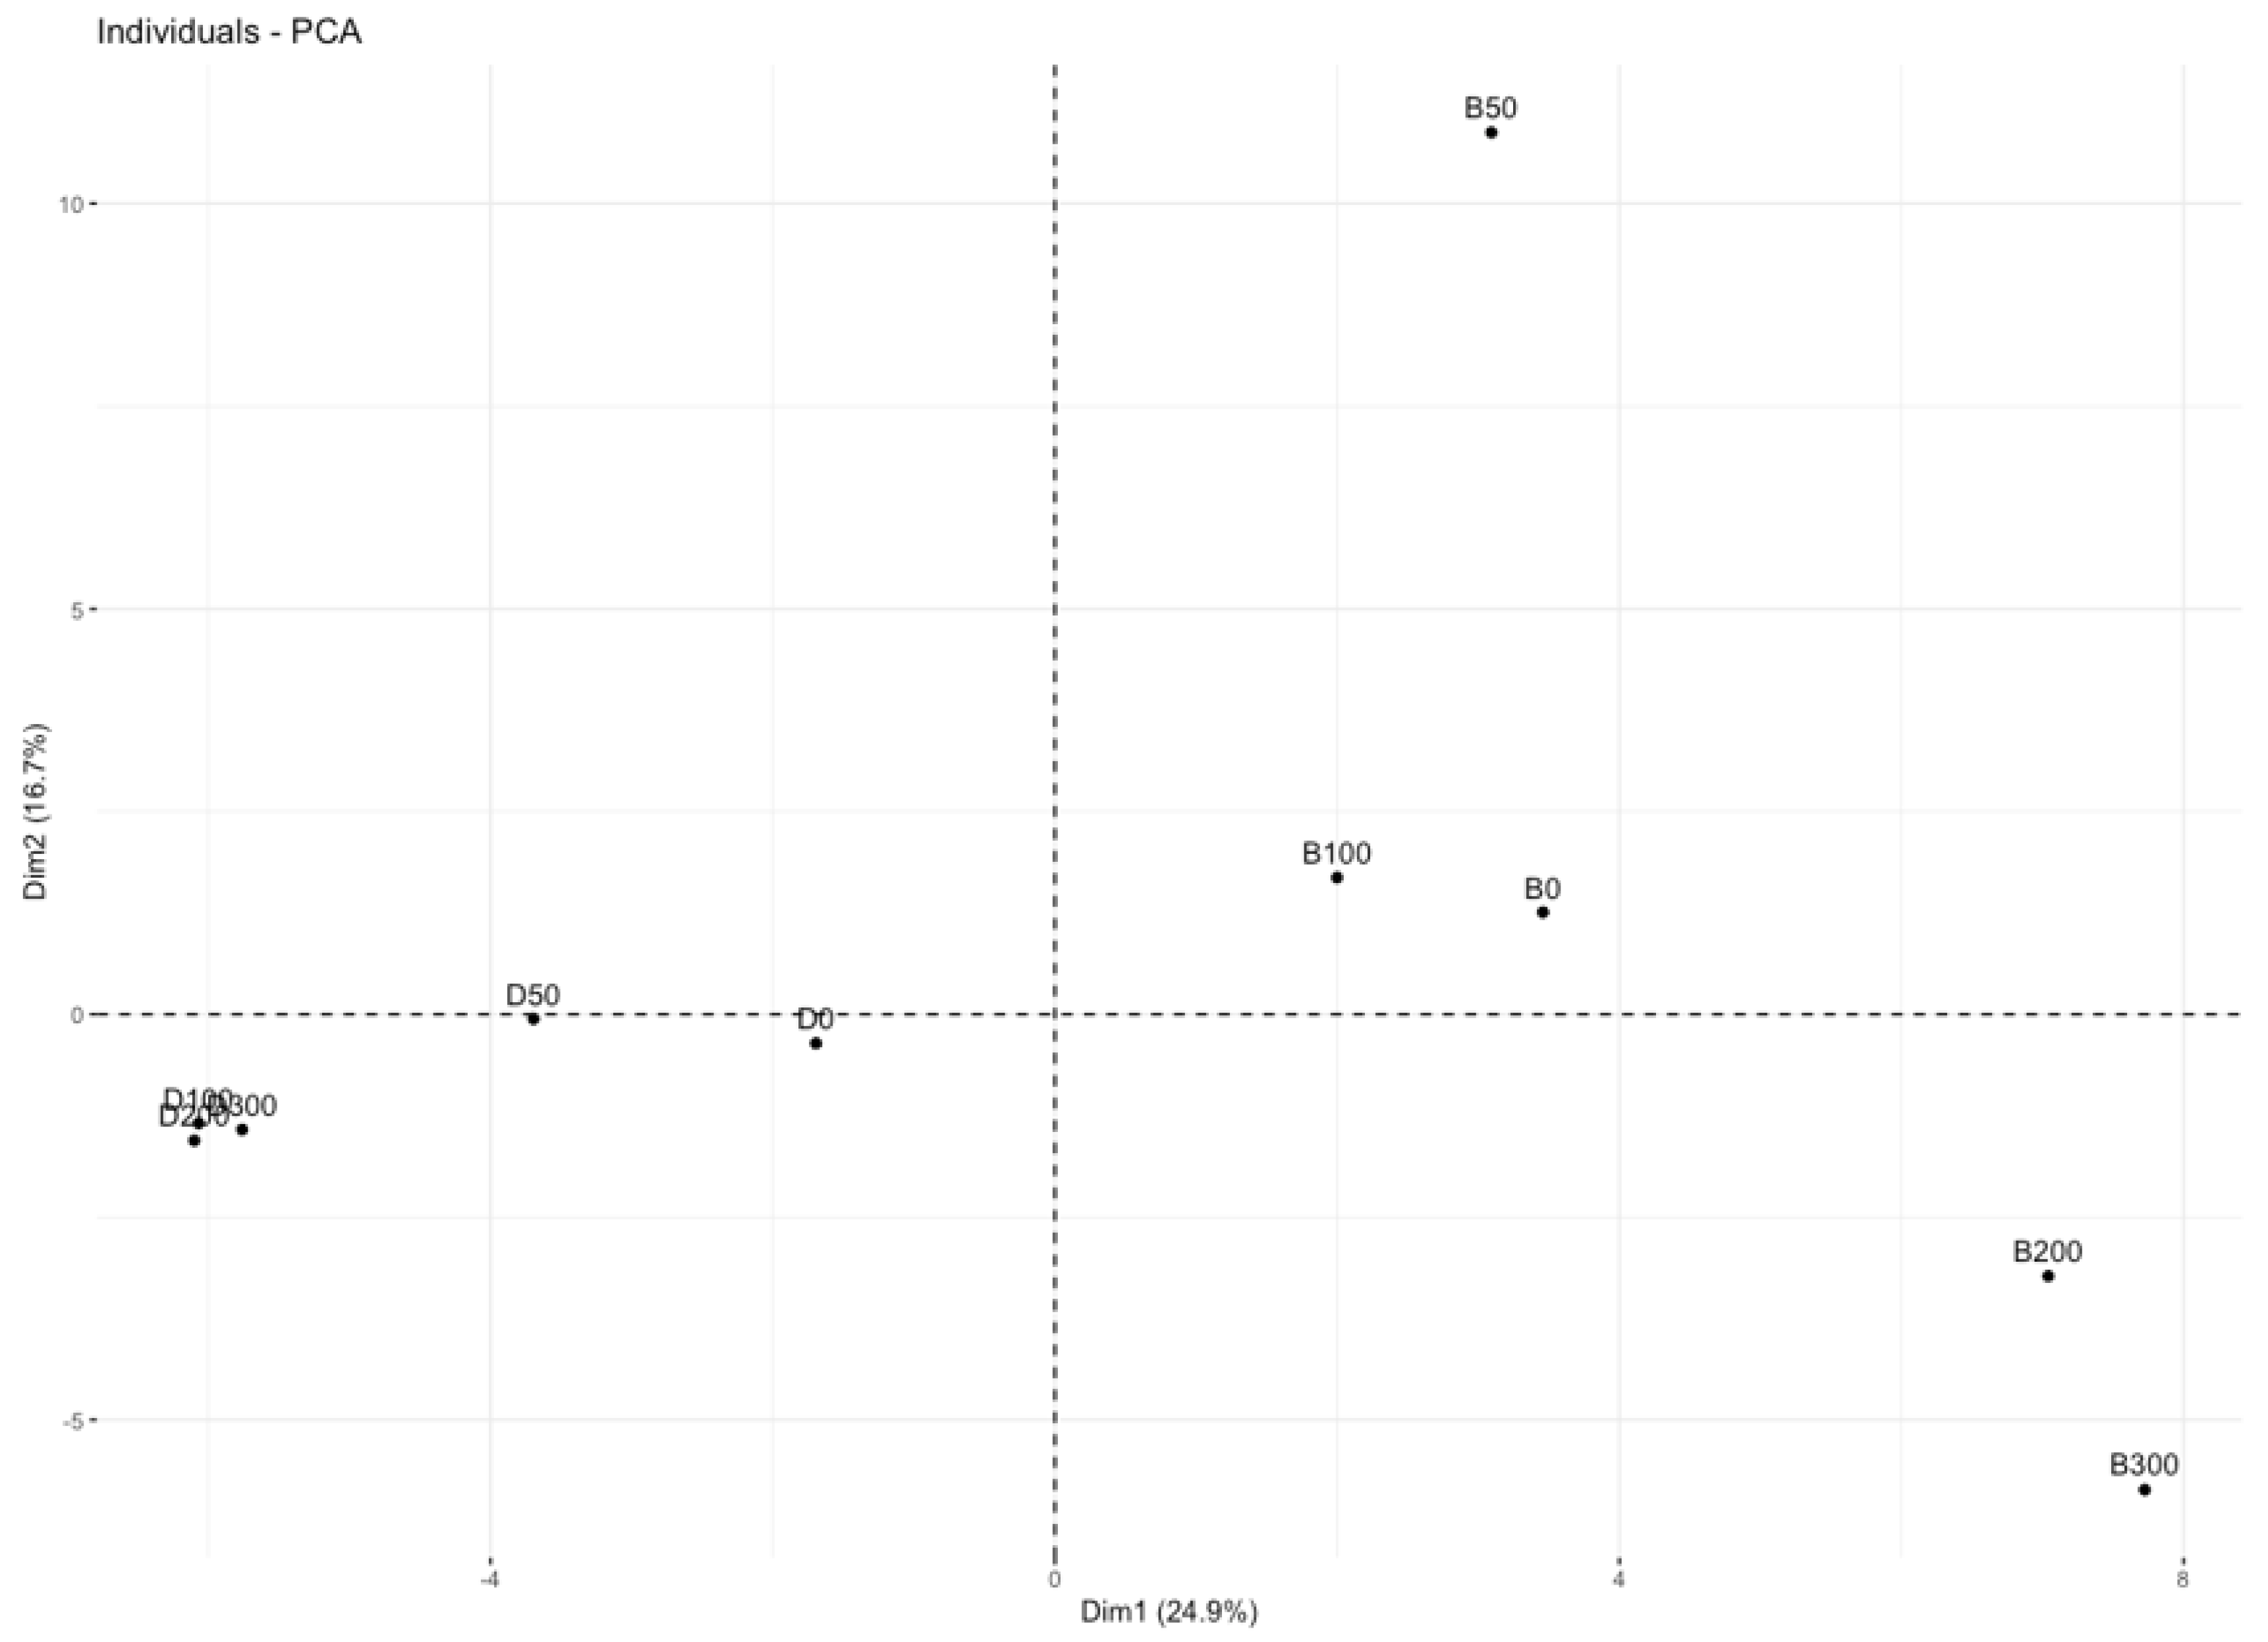
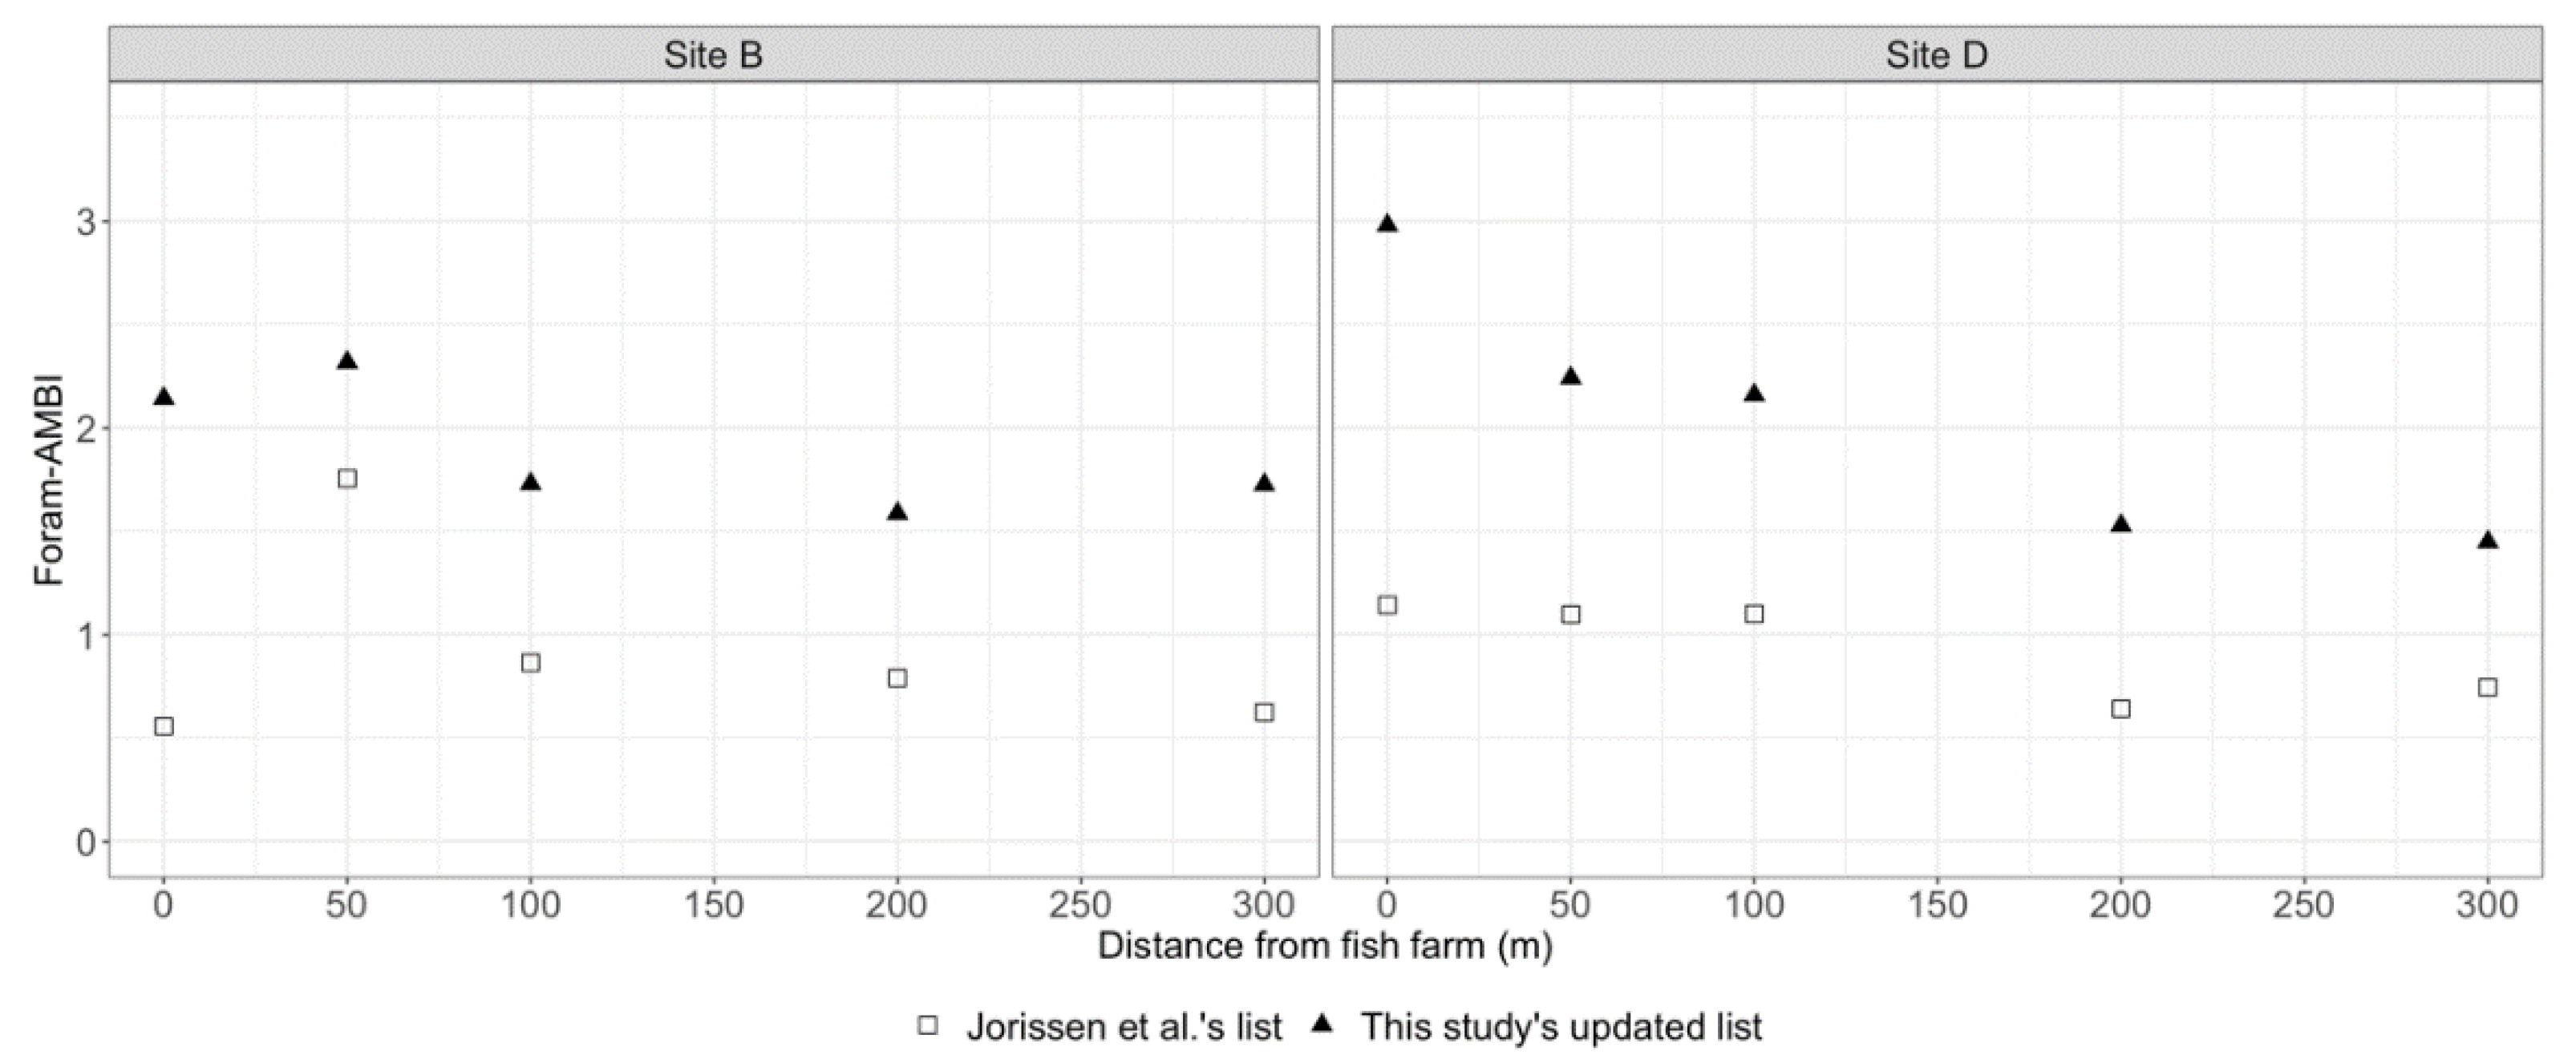
3.2.4. Biotic Indices and Environment Parameters

At site B, exp(H′bc) and Foram-AMBI did not exhibit a clear trend with respect to TOC or distance from the fish cages. The highest values were observed at station B50 for Foram-AMBI and at B100 for exp(H′bc). FSI and TSI-Med showed higher index values below the fish cages compared to more distant stations, suggesting opposite trends in terms of ecological quality evolution.
At site D, exp(H′bc) had its maximum 100 m away from the fish farming cages, like at site B (Figure 9). Foram-AMBI values were quite stable along the transect, although the three stations closer to the aquaculture exhibited higher values. Regarding FSI and TSI-Med, the former had increasing values while the later had decreasing values (Figure 9).
The index exp(H′bc) did not correlate with distance and TOC (Figures S2 and S3). Foram-AMBI did not correlate either with distance or TOC at both sites (Figures S2 and S3). FSI was significantly positively correlated with TOC at site B (p < 0.05, Figure S2) (i.e., better quality closer to the fish cages), although this is the opposite trend to what would be expected, and with distance at site D (p < 0.05, Figure S3). TSI-Med was significantly correlated with TOC at site B (p < 0.01) but not at site D. FSI was significantly positively correlated with Foram-AMBI at site D (p < 0.01), with TSI-Med at site B (p < 0.05) and negatively at site D (p < 0.05).
Foram-AMBI computed with this study-updated list (Foram-AMBI-updated) had higher values (Figure 10) than Foram-AMBI based on the original list [47]. Moreover, the percentage of NA species largely decreased in Foram-AMBI-updated, varying from 9 to 16.3% in the study area. None of the stations exhibited %NA > 20%. Specifically, values were higher at stations B0 and B50 for Foram-AMBI-updated, there was a shift then at station B100, B200 and B300 (Figure 10). At site D, the highest value was recorded under the cages, and there was a significant decrease toward site 300 (Figure 10). Foram-AMBI-updated was further significantly correlated with TOC at site D (p < 0.05, Figure S3). Foram-AMBI-updated was significantly positively correlated with TSI-Med and negatively with FSI at site D (p < 0.01 and p < 0.05, respectively, Figure S3).

4. Discussion

4.1. A Limited Effect of Fish Farming on Habitat Features

In Corsica, sites B and D correspond to large aquacultures with high annual productions and consequently higher fish densities and food inputs compared to other fish farms on the island. However, note that producers are engaged in sustainable fish-farming practices, further limiting the harmful effects on the benthic habitat. Except in a few stations, content in the fine fraction remained low compared to several studies made on aquaculture impacts (e.g., [36,37,53]) or on TOC content impacts [31]. In fact, the studied stations were mostly composed of fine or coarse sand, a composition typical of high energy hydrodynamic regimes. However, it has been shown that in some cases, accumulation of TOC can be seen in sandy bottoms without an increase in silty fractions because of the removal of fine particles with the currents [12,37,66].
Noticeably higher TOC values were reported under the cages. Since the different sites are located within Posidonia meadow habitats, part of the TOC content could correspond to Posidonia leaves and roots. However, C:N ratio values under the cages at sites B and D, respectively 13.39 (±2.32) and 11.59 (±1.94), are closed to characteristic values from aquaculture-derived organic matter [5] and not to the ones induced by Posidonia oceanica, typically with a C:N ratio of about 27.4 [67], corresponding to refractory organic matter. This suggests that the enrichment is due to OM produced by aquaculture activities (i.e., fish feeding and feces). The organic matter accumulation remains largely constrained under the cages. This confirmed previous studies’ findings reporting a moderate and spatially-limited impact of aquaculture in terms of direct OM loads [5,8,36,37,68].

4.2. Diversity-Based Indices May Not Be Adapted to Coastal Waters in the Mediterranean Sea

The foraminiferal faunas respond clearly to the TOC enrichment observed in the stations close to the fish cages with increasing absolute densities and specific richness. These results suggest that TOC under fish farming cages may most likely be composed of labile OM on which benthic foraminifera are feeding rather than refractory OM derived from Posidonia meadows. Furthermore, the positive response of foraminiferal assemblages to a moderate increase in TOC content is in line with previous studies in the Mediterranean Sea [11,31,37,52,69]. Specifically, in the early stages of enrichment, TOC can stimulate the size and specific richness of benthic communities, thanks to an increase in the biotic capacity of the environment [70]. Furthermore, we observed the same trend with the diversity index exp(H′bc) which is less sensitive to sampling effort than the specific richness; noticeably, maximum values were reported at intermediate stations (50 and 100 m). In mesotrophic to eutrophic environments, a TOC enrichment would result in a decrease in diversity. However, as above-stressed, in oligotrophic environments in the first stage of the TOC enrichment, diversity would be stimulated. Then diversity would decrease when the TOC content become too high with species tolerant to degraded conditions taking over sensitive ones. The non-monotonic trend observed here confirms observations from previous studies in the Mediterranean [31,48]. This succession follows the model of [10] the often named “the hypertrophic zone theory” in other studies [11,38,39]. Oligotrophic characteristics of the Mediterranean Sea habitats further enhance this phenomenon [69] and induce a strong dichotomy between stations under the influence of fish farming and stations not influenced. The present findings further suggest that the diversity index exp(H′bc) may not be accurate to evaluate environmental quality in oligotrophic coastal ecosystems such as coastal waters in the Mediterranean Sea; conversely, this index seems to be better adapted to more sheltered environments in the Mediterranean Sea [50,54].

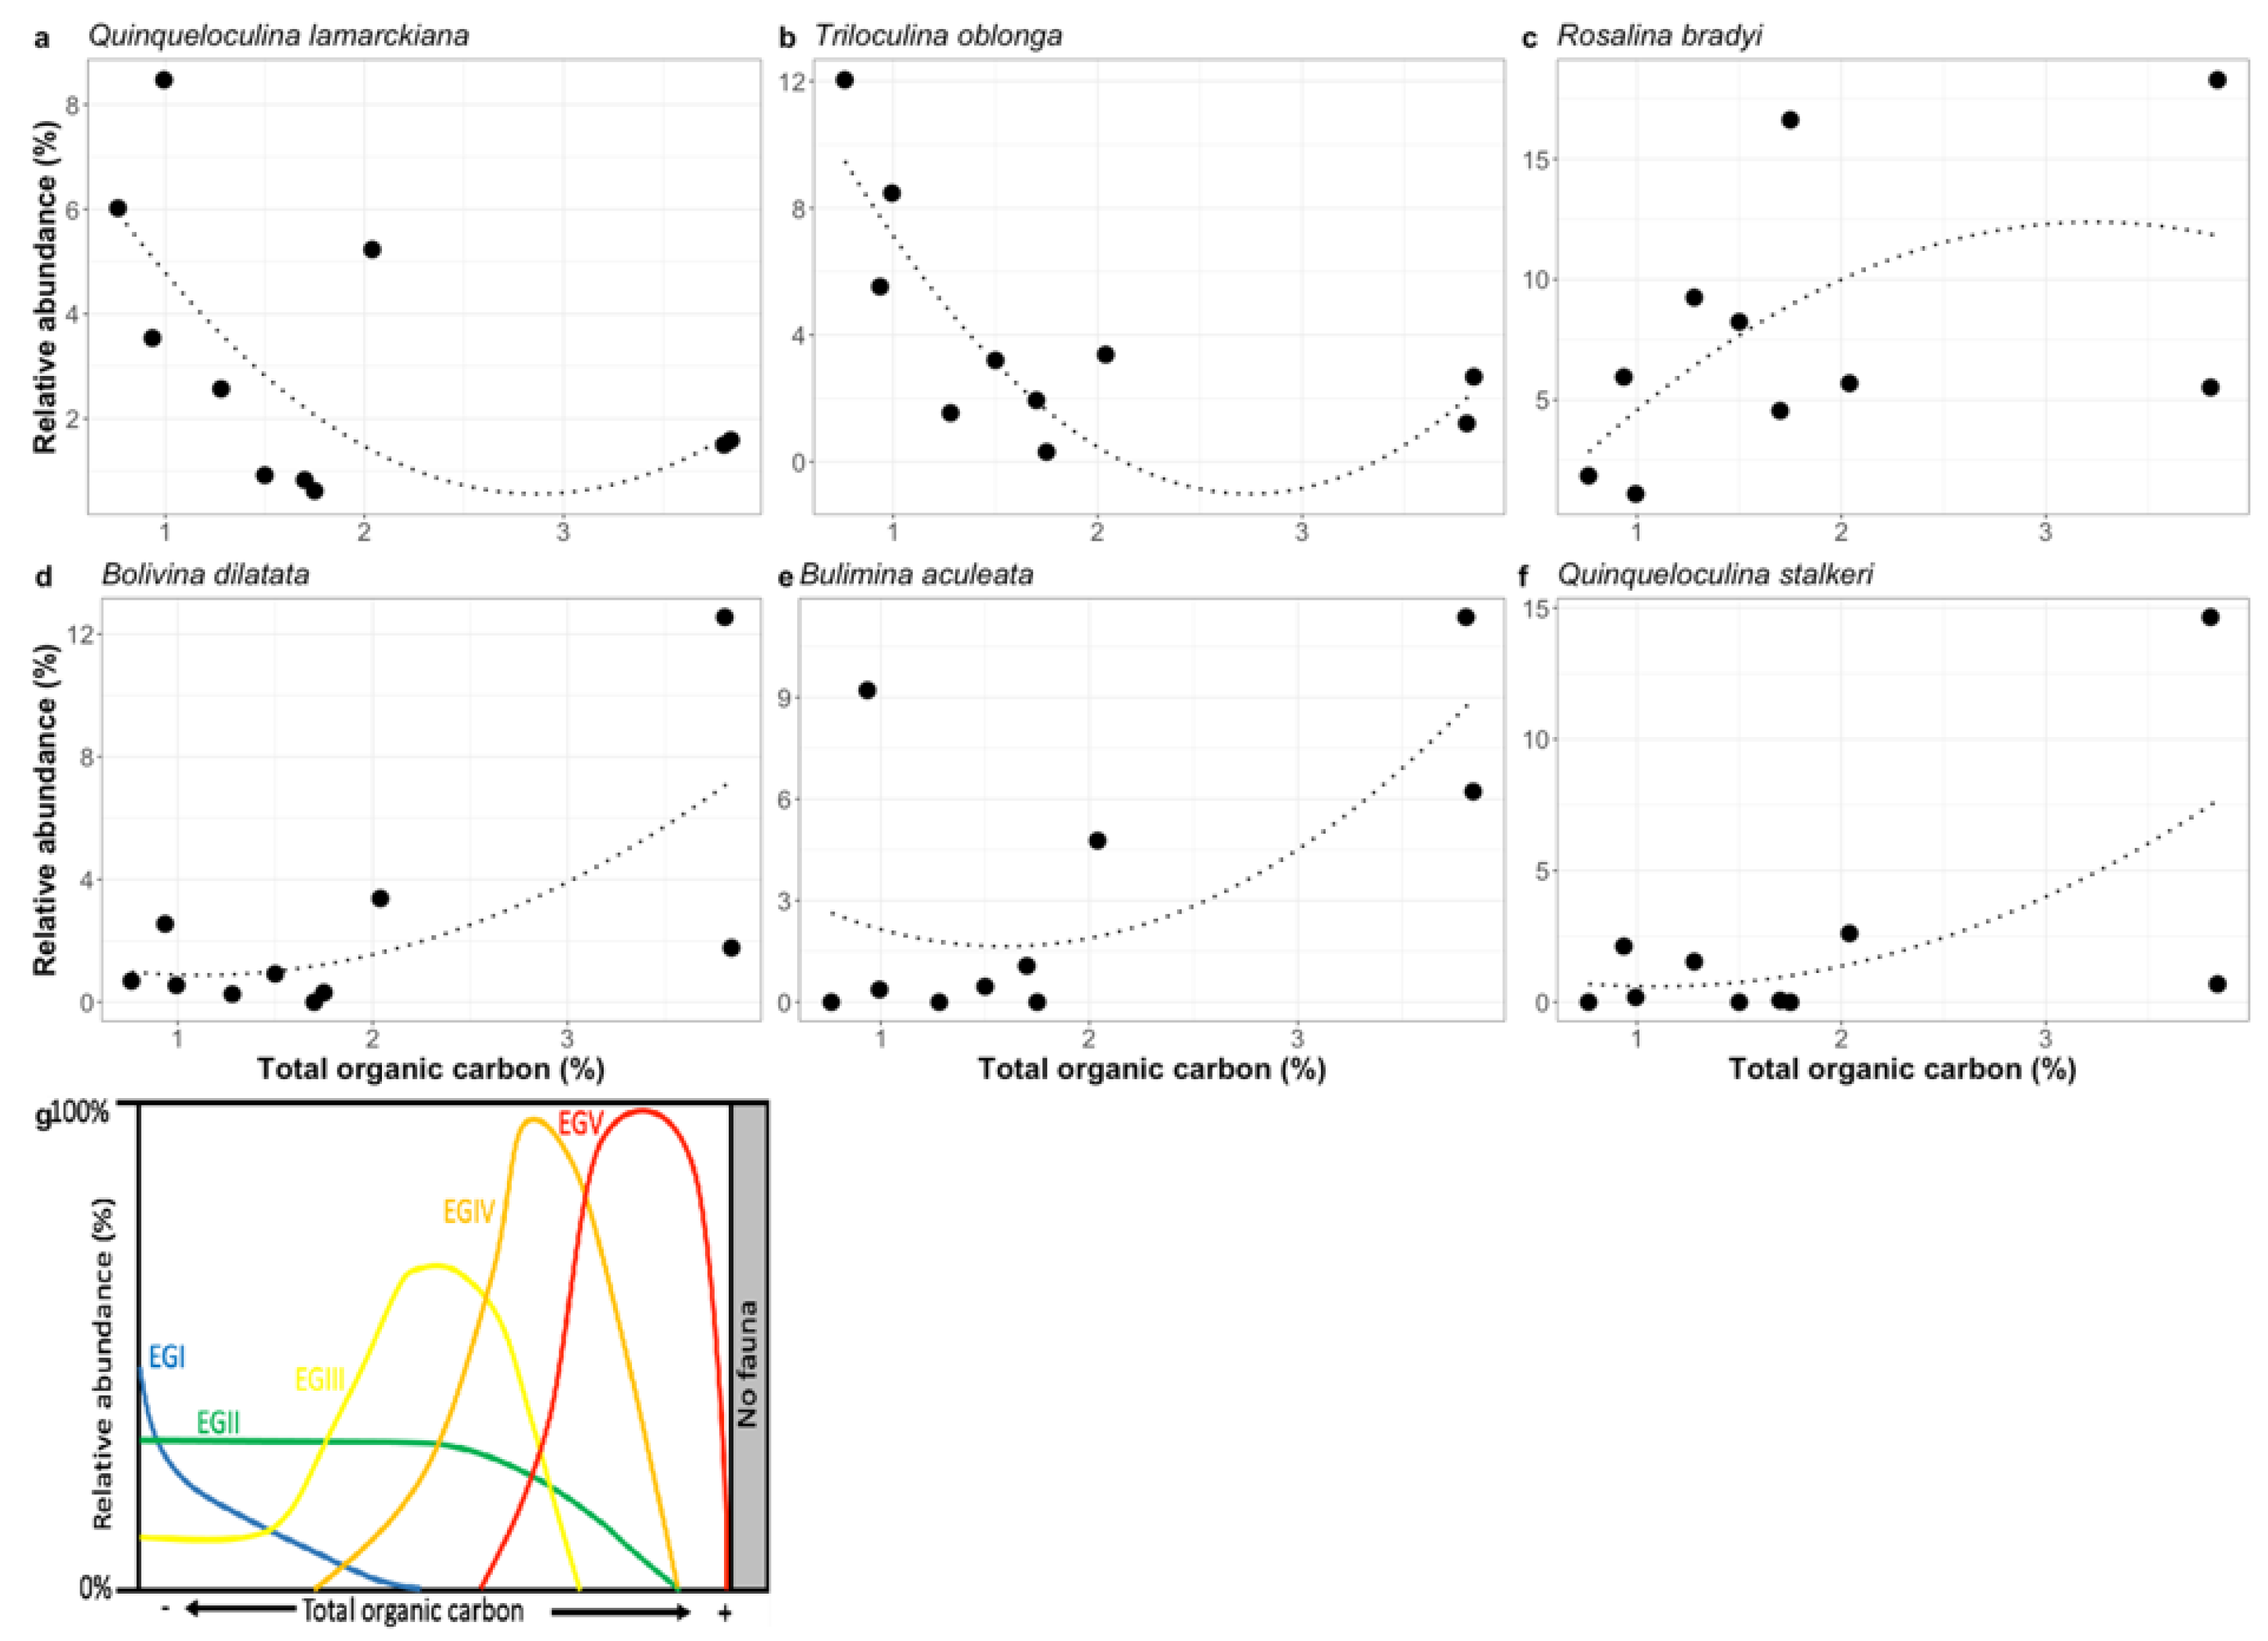
4.3. Species Response to Fish Farming Cages: Improving Foram-AMBI Original Species List Assignment to Ecological Group, the Foram-AMBI Updated

Our study area shows a clear pattern of TOC content according to the distance from the fish cages and is therefore a good opportunity to study the response of major species to this gradient and propose an update to the EG assignments originally published in [47]. This work would potentially help reducing the percentage of not-assigned species and improve the reliability and performance of Foram-AMBI. The heatmap of major species densities at both sites already highlighted that some species exhibited clear distribution patterns along the distance from the fish cages (Figure 6). To follow the same approach as performed in [47], the relative densities of seven major species were plotted to determine their response along the TOC gradient (Figure 7 and Figure S4). Then, the distribution patterns were compared with the theoretical model of succession for species of the five EG along the TOC gradient from [47] (Figure 7g) and their original assignments. Among the 20 major species, three were not assigned to any EG yet: Triloculina oblonga, Quinqueloculina lamarckiana and Q. stalkeri. For ten of these species, the distribution patterns observed in our study area were in agreement with the assignments proposed by Jorissen et al. [47]: Adelosina cliarensis (EGI), Eggerelloides scaber (EGIII), Neoconorbina terquemi (EGI), Q. stelligera (EGIII), T. trigonula (EGI), and to a lesser extend Gavelinopsis praegeri (EGI), Pyrgo oblonga (EGII), Q. bosciana (EQII), Textularia agglutinans (EGI) and T. tricarinata (EGI). For the other seven species, their responses to TOC in our study area were somewhat different from their initial assignments. However, we only proposed a new classification for three of them, Rosalina bradyi, Bolivina dilatata and Bulimina aculeata, as explained thereafter. For Astrononion stelligerum, Lagenammina atlantica, Lobatula lobatula and Q. seminulum, we considered that the arguments were not strong enough to modify the original assignments proposed by Jorissen et al. [47] (e.g., low relative abundances, absence of literature evidences to support our observations). We also proposed an assignment for the three originally not-assigned species (T. oblonga, Q. lamarkiana and Q. stalkeri).
Adelosina cliarensis, Gavelinopsis praegeri, Neoconorbina terquemi, Quinqueloculina lamarckiana, Triloculina oblonga, T. tricarinata and T. trigonula exhibited increasing relative abundances away from the fish farming cages, responding negatively to TOC (Figure 6). These species were assigned as sensitive species (EGI, [47]), except for T. oblonga (NA) and Q. lamarckiana (NA). In detail, Q. lamarckiana and T. oblonga (Figure 7a,b) exhibited maximum relative abundances when the TOC content was low with a distribution pattern typical of EGI (Figure 7g). We propose assigning the non-assigned species Q. larmarckiana and T. oblonga [47] to EGI; which is consistent to their classification as sensitive species in FSI [49].
Model of distribution pattern of Rosalina bradyi (Figure 7c) had a bell-shaped curve with a maximum around 3% TOC. Furthermore, high relative abundances were observed for Rosalina bradyi under the fish farming cages, particularly at site B. The observed distribution pattern for R. bradyi is in contradiction with its assignment to EGI by [47] and to the sensitive group by [49]. It responded positively to the first stage of TOC enrichment. Rosalina bradyi is usually recognised as a sensitive species because of its epiphytic behaviour. More precisely, this species is predominantly motile, living in the sediment, but is able to leave temporarily attached to leaves of Posidonia oceanica, with a short life cycle [71]. One hypothesis to explain the high relative abundances under the cages could therefore be that specimens were transported by the current from Posidonia oceanica meadows and accumulated under the fish farms. However, high abundances for R. bradyi were also reported in fish farms in Tunisia [37] and in abalone farms in Korea [72]. Furthermore, Rosalina spp. are often abundant in organic-rich habitats [73], being influenced by the quality of the OM [74]. This further suggests that R. bradyi may benefit from the organic matter released by aquaculture.
The distribution pattern of Rosalina bradyi along the TOC gradient may be compared with that of other species classified as EGIII by [47] and present as major species in our study area. This is the case for Quinqueloculina stelligera, Eggerelloides scaber and Textularia agglutinans. They were dominant at stations B50 (8%, 26.4% and 7.2%, respectively) and D50 (3.5%, 7.5% and 6.6%, respectively), but their abundances dropped under the fish farming cages. It is interesting to notice that E. scaber and T. agglutinans are also considered to be tolerant species in FSI, whereas TSI-Med did not consider these species. The behaviour of these two species along the TOC gradient observed in this study gives a good argument to add these species to the list of tolerant species proposed by [48]. Similarly, the miliolid species Q. stelligera can tolerate the first stage of TOC enrichment but then its relative abundance dropped when TOC values reached about 4%, which is a typical behaviour of third-order opportunistic species [47].
According to literature observations, the density distribution of Rosalina bradyi along the present study’s TOC gradient and the similarity of this distribution with other EGIII species and theoretical models of succession of species from [47], R. bradyi should be assigned to EGIII, in our opinion.
Bulimina aculeata exhibited a clear trend of increasing relative densities towards the fish farming cage (Figure 6). In the Mediterranean, this species was reported to positively respond to labile OM [75] and to increasing TOC content [49,76]. It is an opportunistic species characterising highly stressed environments [75,77,78] and is considered stress-tolerant in the FSI and TSI-Med species lists [48,49]. It was originally assigned to EGIII [47], however the distribution pattern of B. aculeata is different from the typical EGIII distribution in our study area (i.e., Eggerelloides scaber, Quinqueloculina stelligera). Specifically, its abundance increased when species from EGIII started to decrease, with maximum densities at the highest TOC values in our study area, which does not correspond to the extreme conditions of the TOC range presented in the theoretical model of EG distribution (Figure 7g). According to the present findings, B. aculeata should be re-assigned to EGIV in Jorissen et al.’s species lists.
Bolivina dilatata showed the same pattern as Bulimina aculeata, with increasing relative abundance towards the cages (Figure 6). Like other bolivinids, this species is able to flourish under harmful conditions [27] and is often considered a stress-tolerant or opportunistic species [41,48,49]. However, this species was assigned to EGII in open marine environments from the Mediterranean Sea [47]. According to the theoretical Foram-AMBI model of species succession along the TOC gradient, its presence in relatively high densities just below the fish cage and its distribution pattern along the TOC gradient suggests that these species should be re-assigned to EGIV like B. aculeata in the species list [47].
Quinqueloculina stalkeri is not yet included in the species list that we used originally. In the FSI and TSI-Med lists, it is respectively classified as a sensitive species like all miliolids [49] and not included in the stress-tolerant group [48]. Actually, this species exhibited the same pattern as Bolivina dilatata and Bulimina aculeata with low relative abundance at low TOC contents and a sudden increase in relative abundance up to 15% at site D under the cages when TOC reached 3.8%. Like B. dilatata and B. aculeata, this species bloomed when EGIII species’ relative abundances dropped. This suggests that Q. stalkeri is an opportunistic species, which, according to the theoretical model, can be assigned to EGIV.

4.4. Comparison of Sensitivity-Based Indices’ Efficiency in Monitoring the Impact of Fish Farming

Biotic indices based on groups of indicative species better reflect the impact of fish farms than diversity indices. However, we obtained contradictory results between indices. Noticeably, TSI-Med and Foram-AMBI-updated performed well compared to FSI and Foram-AMBI, since they correlated statistically with TOC and distance from the fish cages.
Higher values of FSI reported at stations with the highest TOC content at site B would indicate a better quality at these stations [49], when in fact, it should be the opposite; this shows that FSI did not perform well in highlighting the impact of the fish farming cages. One bias in the species classification proposed by [48] is that they considered all miliolids as sensitive species whereas [47] and this study identified that some miliolid species have tolerant or opportunistic behaviour, i.e., Quinqueloculina stelligera and Q. stalkeri. As FSI is giving more weight to the sensitive species (10 times more than to tolerant species), the assignment issue of the above-mentioned species impacted FSI more than the other indices.
As for Foram-AMBI, using the original list [47], we did not observe any clear trend. The high number of not-assigned species may explain this. Indeed, it is highly recommended not to calculate AMBI, and, hence, Foram-AMBI, when the percentage of NA species is higher than 20% [22]. In our study area, seven of the ten stations at site B and D exhibited more than 20% NA species, hampering the use of this index at the study sampling sites. Conversely to TSI-Med where only the tolerant species are assigned, the main challenge with the FSI and Foram-AMBI biotic indices is that all identified species are considered in the calculation of the index. Therefore, a huge effort has to be made to assign as many species as possible despite the difficulty due to the ecological and biological plasticity of the species [79,80,81]. Foram-AMBI values obtained in the present study may not be robust enough to give accurate information on the impact of the fish farms. For instance, Foram-AMBI does not detect the lower quality at B0 and D0 as does TSI-Med. It shows the urgent need to assign more species to ease the implementation of this index. The assignment of three new species to EGs (Triloculina oblonga, Quinqueloculina lamarckiana, Q. stalkeri) and the re-assignement of three others (Rosalina bradyi, Bolivina dilatata and Bulimina aculeata) allowed us to improve the accuracy of Foram-AMBI. Specifically, Foram-AMBI computed with this study-updated list (Foram-AMBI-updated) had higher values (Figure 10) than Foram-AMBI based on the original list [47]. This was mainly due to the attribution of EGIII to R. bradyi and the re-assigment of B. dilatata and B. aculeata to EGIV. Foram-AMBI-updated allowed us to better distinguish between the stations under the cages and further away from the cages; hence this index better reflected the deleterious effect of the fish farming cages on the benthic environment. It further suggests that more work is still required to improve the species’ assignment to EG, and to further facilitate the implementation of Foram-AMBI.
Higher values for Foram-AMBI-updated [41] and lower values for TSI-Med [48] reflected the environmental degradation in the fish farming area. Noticeably, according to TSI-Med and Foram-AMBI-updated, the impact of fish farming on the ecosystem is constrained to just below the fish cages at site B (or within 50 m according to Foram-AMBI) and within 100 m from the fish farm at site D. This corroborated quite well with the higher TOC values under the cages. In general, the effects of aquaculture are mostly limited in the sediment under the fish farms [11,16,36,82]. The abundances of opportunistic, tolerant and sensitive species were clearly constrained by the presence of fish cages; opportunistic and tolerant species were more abundant in the assemblages impacted by the farm and, conversely, sensitive species were more abundant outside the fish farm, confirming previous studies in fish farm areas [11,36,37,43,83]. Moreover, according to TSI-Med and Foram-AMBI-updated, which seems to work particularly well in this case study, the impact of the fish farm on the ecosystem quality would be slightly higher at site D than at site B, the former being more sheltered in a bay than the later which is at the entrance of a bay and which may contribute to the stronger impact observed at site D. Although the aquaculture located at site B produces roughly 5 times more tons of fishes than the aquaculture at site D, the fish cages are located at the outer part of the bay where the currents are strong enough to sweep away the OM discharges produced by the aquaculture activity, hydrodynamics playing a key role in limiting or enhancing the impact of aquaculture [5]. Conversely, aquaculture site D is located at the end of a bay where the hydrodynamic conditions are low therefore allowing the OM input from the fish farms to settle down and remain in the sediment.
Biotic indices based on species sensitivity were able to detect the more or less important decrease in the ecosystem quality below the fish cages. The TSI-Med and Foram-AMBI (using the updated list) highlighted quite well the ecological degradation of the benthic habitat under the fish farming cages. It confirms that foraminifera can be relevant for aquaculture impacts monitoring [36,37,43,84,85], and should be considered as a Biological Quality Element for the implementation of marine legislations.

5. Conclusions

This study reveals how benthic foraminiferal communities are affected by off-coast Corsican aquacultures and how biotic indices based on species sensitivity are able to detect and evaluate the ecological quality of the ecosystem. Generally, the impacts of the studied farms were restricted to a small area around the farms (50m), the TOC enrichment being moderated. Foraminiferal assemblages are characterised by opportunistic and tolerant species under the cages, while more sensitive species occurred further away from the farm. This study confirmed that diversity indices such as exp(H′bc) may not be adapted to detect organic matter pollution in oligotrophic systems like the open marine environments of the Mediterranean Sea. TSI-Med and Foram-AMBI-updated are the most relevant and sensitive indices amongst the sensitivity-based indices. Regarding Foram-AMBI, the here-proposed update of the original list improves the accuracy of this index to detect the decrease of the health of the ecosystem below the fish cages. The modifications to the original list are suggested and summarized in Table 1.
These results emphasize the need to conduct more quantitative studies to improve the knowledge of benthic foraminiferal responses to TOC in order to improve the species’ assignment to EG and further facilitate the implementation of Foram-AMBI. They also highlight the advantage of TSI-Med which requires only the identification of tolerant species. At this stage, we recommend prioritising the use of TSI-Med and Foram-AMBI with the updated list to assess ecological quality in open marine environments of the Mediterranean Sea until further improvements are made to FSI.

Supplementary Materials

The following are available online at https://www.mdpi.com/article/10.3390/w13202821/s1, Figure S1: Pictures of the sea bed for each sampled station, Figure S2: Correlation between biotic indices and environmental parameters at site B. Kendall’s coefficient of rank correlation (τ) is reported. P-values are represented by white stars (***: p-value < 0.001, **: p-value < 0.01, *: p-value < 0.05, none: p-value > 0.05), Figure S3: Correlation between biotic indices and environmental parameters at site D. Kendall’s coefficient of rank correlation (τ) is reported. P-values are represented by white stars (***: p-value < 0.001, **: p-value < 0.01, *: p-value < 0.05, none: p-value > 0.05), Figure S4: Distribution patterns of relative abundances (filled black circles) against TOC at sampling sites (black dotted-line: second-order polynomial regression) of (a) Astrononion stelligerum, (b) Triloculina tricarinata, (c) Triloculina trigonula, (d) Lobatula lobatula, (e) Gavelinopsis praegeri, (f) Neoconorbina terquemi, (g) Adelosina cliarensis, (h) Pyrgo oblonga, (i) Quinqueloculina bosciana, (j) Lagenammina atlantica, (k) Textularia agglutinans, (l) Quinqueloculina stelligera, (m) Eggerelloides scaber and (n) Quinqueloculina seminulum, Observed relative abundances are shown as filled black circles. Ecological groups are indicated according to the original list [47]. Table S1: raw data.

Author Contributions

Conceptualization, V.M.P.B.; methodology, V.M.P.B., C.B. and A.D. (Annick Donnay); formal analysis, C.B., A.D. (Antoine Dubois) and V.M.P.B.; investigation, A.D. (Antoine Dubois), J.-C.P. and M.B.; resources, A.D. (Annick Donnay); writing—original draft preparation, A.D. (Antoine Dubois), C.B. and V.M.P.B.; writing—review and editing, A.D. (Antoine Dubois), C.B., V.M.P.B., A.D. (Annick Donnay) and J.-C.P.; visualization, A.D. (Antoine Dubois), C.B. and V.M.P.B.; supervision, V.M.P.B., C.B. and J.-C.P.; funding acquisition, A.D. (Annick Donnay), C.B. and V.M.P.B. All authors have read and agreed to the published version of the manuscript.

Funding

This research was funded by the Agence de l’eau Rhône Méditerranée Corse and the Collectivité de Corse (CdC), as part of the STARECAPMED project research.

Data Availability Statement

The data presented in this study are available in Table S1.

Acknowledgments

We are grateful to G. Maillet and L. Marais for their help in grain size analyses and to Corinne Pelaprat for her contribution to this project. We would like to thank G. Duong for organic matter analyses.

Conflicts of Interest

The authors declare no conflict of interest.

References

  1. Food and Agriculture Organization of the United Nations. The State of the World Fisheries and Aquaculture 2014: Opportunities and Challenges; Food and Agriculture Organization of the United Nations: Rome, Italy, 2014. [Google Scholar]
  2. Food and Agriculture Organization of the United Nations. The State of World Fisheries and Aquaculture 2016: Contributing to Food Security and Nutrition for All; Food and Agriculture Organization of the United Nations: Rome, Italy, 2016. [Google Scholar]
  3. Food and Agriculture Organization of the United Nations. National Aquaculture Sector Overview—France; Food and Agriculture Organization of the United Nations: Rome, Italy, 2012. [Google Scholar]
  4. Lensi, P. La Politique de Diversification de l’aquaculture En Corse. La Démarche “Nouvelles Espèces”. Aspects économiques de la production aquacole. Cah. Opt. Médit 1995, 14, 137–148. [Google Scholar]
  5. Yokoyama, H.; Abo, K.; Ishihi, Y. Quantifying Aquaculture-Derived Organic Matter in the Sediment in and around a Coastal Fish Farm Using Stable Carbon and Nitrogen Isotope Ratios. Aquaculture 2006, 254, 411–425. [Google Scholar] [CrossRef]
  6. Chamberlain, J. Impacts of Biodeposits from Suspended Mussel (Mytilus Edulis L.) Culture on the Surrounding Surficial Sediments. ICES J. Mar. Sci. 2001, 58, 411–416. [Google Scholar] [CrossRef] [Green Version]
  7. Dauvin, J.-C.; Pezy, J.-P.; Baffreau, A.; Bachelet, Q.; Baux, N.; Méar, Y.; Murat, A.; Poizot, E. Effects of a Salmon Fish Farm on Benthic Habitats in a High-Energy Hydrodynamic System: The Case of the Rade de Cherbourg (English Channel). Aquaculture 2020, 518, 734832. [Google Scholar] [CrossRef]
  8. Holmer, M.; Wildish, D.; Hargrave, B. Organic Enrichment from Marine Finfish Aquaculture and Effects on Sediment Biogeochemical Processes. In Environmental Effects of Marine Finfish Aquaculture; Handbook of Environmental Chemistry; Hargrave, B.T., Ed.; Springer: Berlin/Heidelberg, Germany, 2005; Volume 5M, pp. 181–206. [Google Scholar] [CrossRef]
  9. Johannessen, P.J.; Botnen, H.B.; Tvedten, O.F. Macrobenthos: Before, during and after a Fish Farm. Aquac. Res. 1994, 25, 55–66. [Google Scholar] [CrossRef]
  10. Pearson, T.H.; Rosenberg, R. Macrobenthic Succession in Relation to Organic Enrichment and Pollution of the Marine Environment. Oceanogr. Mar. Biol. 1978, 16, 229–311. [Google Scholar]
  11. Angel, D.L. Impact of a Net Cage Fish Farm on the Distribution of Benthic Foraminifera in the Northern Gulf of Eilat (Aqaba, Red Sea). J. Foraminifer. Res. 2000, 30, 54–65. [Google Scholar] [CrossRef]
  12. Apostolaki, E.T.; Tsagaraki, T.; Tsapakis, M.; Karakassis, I. Fish Farming Impact on Sediments and Macrofauna Associated with Seagrass Meadows in the Mediterranean. Estuar. Coast. Shelf Sci. 2007, 75, 408–416. [Google Scholar] [CrossRef]
  13. Delgado, O.; Ruiz, J.; Pérez, M.; Romero, J.; Ballesteros, E. Effects of Fish Farming on Seagrass (Posidonia Oceanica) in a Mediterranean Bay: Seagrass Decline after Organic Loading Cessation. Oceanol. Acta 1999, 22, 109–117. [Google Scholar] [CrossRef] [Green Version]
  14. Ruiz, J.M. Effects of Fish Farm Loadings on Seagrass (Posidonia Oceanica) Distribution, Growth and Photosynthesis. Mar. Pollut. Bull. 2001, 42, 12. [Google Scholar] [CrossRef]
  15. Karakassis, I.; Tsapakis, M.; Smith, C.J.; Rumohr, H. Fish Farming Impacts in the Mediterranean Studied through Sediment Profiling Imagery. Mar. Ecol. Prog. Ser. 2002, 227, 125–133. [Google Scholar] [CrossRef]
  16. La Rosa, T.; Mirto, S.; Mazzola, A.; Maugeri, T.L. Benthic Microbial Indicators of Fish Farm Impact in a Coastal Area of the Tyrrhenian Sea. Aquaculture 2004, 230, 153–167. [Google Scholar] [CrossRef]
  17. Mazzola, A. Fish-Farming Effects on Benthic Community Structure in Coastal Sediments: Analysis of Meiofaunal Recovery. ICES J. Mar. Sci. 2000, 57, 1454–1461. [Google Scholar] [CrossRef] [Green Version]
  18. Muxika, I.; Borja, A.; Bonne, W. The Suitability of the Marine Biotic Index (AMBI) to New Impact Sources along European Coasts. Ecol. Indic. 2005, 5, 19–31. [Google Scholar] [CrossRef]
  19. Neofitou, N.; Vafidis, D.; Klaoudatos, S. Spatial and Temporal Effects of Fish Farming on Benthic Community Structure in a Semi-Enclosed Gulf of the Eastern Mediterranean. Aquacult. Environ. Interact. 2010, 1, 95–105. [Google Scholar] [CrossRef] [Green Version]
  20. Krause-Jensen, D.; Greve, T.M.; Nielsen, K. Eelgrass as a Bioindicator under the European Water Framework Directive. Water Resour. Manag. 2005, 19, 63–75. [Google Scholar] [CrossRef]
  21. Ar Gall, E.; Le Duff, M.; Sauriau, P.-G.; de Casamajor, M.-N.; Gevaert, F.; Poisson, E.; Hacquebart, P.; Joncourt, Y.; Barillé, A.-L.; Buchet, R.; et al. Implementation of a New Index to Assess Intertidal Seaweed Communities as Bioindicators for the European Water Framework Directory. Ecol. Indic. 2016, 60, 162–173. [Google Scholar] [CrossRef] [Green Version]
  22. Borja, A.; Franco, J.; Pérez, V. A Marine Biotic Index to Establish the Ecological Quality of Soft-Bottom Benthos within European Estuarine and Coastal Environments. Mar. Pollut. Bull. 2000, 40, 1100–1114. [Google Scholar] [CrossRef]
  23. Alve, E. Benthic Foraminiferal Responses to Estuarine Pollution; a Review. J. Foraminifer. Res. 1995, 25, 190–203. [Google Scholar] [CrossRef]
  24. Francescangeli, F.; Quijada, M.; Armynot du Châtelet, E.; Frontalini, F.; Trentesaux, A.; Billon, G.; Bouchet, V.M.P. Multidisciplinary Study to Monitor Consequences of Pollution on Intertidal Benthic Ecosystems (Hauts de France, English Channel, France): Comparison with Natural Areas. Mar. Environ. Res. 2020, 160, 105034. [Google Scholar] [CrossRef]
  25. Frontalini, F.; Coccioni, R. Benthic Foraminifera as Bioindicators of Pollution: A Review of Italian Research over the Last Three Decades. Rev. Micropaléontol. 2011, 54, 115–127. [Google Scholar] [CrossRef]
  26. Martins, V.A.; Frontalini, F.; Tramonte, K.M.; Figueira, R.C.L.; Miranda, P.; Sequeira, C.; Fernández-Fernández, S.; Dias, J.A.; Yamashita, C.; Renó, R.; et al. Assessment of the Health Quality of Ria de Aveiro (Portugal): Heavy Metals and Benthic Foraminifera. Mar. Pollut. Bull. 2013, 70, 18–33. [Google Scholar] [CrossRef]
  27. Martins, V.A.; Zaaboub, N.; Aleya, L.; Frontalini, F.; Pereira, E.; Miranda, P.; Mane, M.; Rocha, F.; Laut, L.; El Bour, M. Environmental Quality Assessment of Bizerte Lagoon (Tunisia) Using Living Foraminifera Assemblages and a Multiproxy Approach. PLoS ONE 2015, 10, e0137250. [Google Scholar] [CrossRef]
  28. Mojtahid, M.; Jorissen, F.; Durrieu, J.; Galgani, F.; Howa, H.; Redois, F.; Camps, R. Benthic Foraminifera as Bio-Indicators of Drill Cutting Disposal in Tropical East Atlantic Outer Shelf Environments. Mar. Micropaleontol. 2006, 61, 58–75. [Google Scholar] [CrossRef] [Green Version]
  29. Mojtahid, M.; Jorissen, F.; Pearson, T.H. Comparison of Benthic Foraminiferal and Macrofaunal Responses to Organic Pollution in the Firth of Clyde (Scotland). Mar. Pollut. Bull. 2008, 56, 42–76. [Google Scholar] [CrossRef] [Green Version]
  30. Morvan, M.; Le Cadre, V.; Jorissen, F.; Debenay, J.-P. Foraminifera as Potential Bio- Indicators of the “Erika” Oil Spill in the Bay of Bourgneuf: Field and Experimental Studies. Aquat. Living Resour. 2004, 17, 317–322. [Google Scholar] [CrossRef]
  31. Parent, B.; Hyams-Kaphzan, O.; Barras, C.; Lubinevsky, H.; Jorissen, F. Testing Foraminiferal Environmental Quality Indices along a Well-Defined Organic Matter Gradient in the Eastern Mediterranean. Ecol. Indic. 2021, 125, 107498. [Google Scholar] [CrossRef]
  32. Alve, E.; Lepland, A.; Magnusson, J.; Backer-Owe, K. Monitoring Strategies for Re-Establishment of Ecological Reference Conditions: Possibilities and Limitations. Mar. Pollut. Bull. 2009, 59, 297–310. [Google Scholar] [CrossRef] [PubMed]
  33. Dolven, J.K.; Alve, E.; Rygg, B.; Magnusson, J. Defining Past Ecological Status and In Situ Reference Conditions Using Benthic Foraminifera: A Case Study from the Oslofjord, Norway. Ecol. Indic. 2013, 29, 219–233. [Google Scholar] [CrossRef]
  34. Polovodova Asteman, I.; Hanslik, D.; Nordberg, K. An Almost Completed Pollution-Recovery Cycle Reflected by Sediment Geochemistry and Benthic Foraminiferal Assemblages in a Swedish–Norwegian Skagerrak Fjord. Mar. Pollut. Bull. 2015, 95, 126–140. [Google Scholar] [CrossRef] [PubMed]
  35. Schönfeld, J.; Alve, E.; Geslin, E.; Jorissen, F.; Korsun, S.; Spezzaferri, S. The FOBIMO (FOraminiferal BIo-MOnitoring) Initiative—Towards a Standardised Protocol for Soft-Bottom Benthic Foraminiferal Monitoring Studies. Mar. Micropaleontol. 2012, 94–95, 1–13. [Google Scholar] [CrossRef]
  36. Bouchet, V.M.P.; Deldicq, N.; Baux, N.; Dauvin, J.-C.; Pezy, J.-P.; Seuront, L.; Méar, Y. Benthic Foraminifera to Assess Ecological Quality Statuses: The Case of Salmon Fish Farming. Ecol. Indic. 2020, 117, 106607. [Google Scholar] [CrossRef]
  37. Damak, M.; Fourati, R.; Elleuch, B.; Kallel, M. Environmental Quality Assessment of the Fish Farms’ Impact in the Monastir Bay (Eastern of Tunisia, Central Mediterranean): A Benthic Foraminiferal Perspective. Environ. Sci. Pollut. Res. 2020, 27, 9059–9074. [Google Scholar] [CrossRef]
  38. Schafer, C.T.; Winters, G.V.; Scott, D.B.; Pocklington, P.; Cole, F.E.; Honig, C. Survey of Living Foraminifera and Polychaete Populations at Some Canadian Aquaculture Sites; Potential for Impact Mapping and Monitoring. J. Foraminifer. Res. 1995, 25, 236–259. [Google Scholar] [CrossRef]
  39. Vidović, J.; Dolenec, M.; Dolenec, T.; Karamarko, V.; Žvab Rožič, P. Benthic Foraminifera Assemblages as Elemental Pollution Bioindicator in Marine Sediments around Fish Farm (Vrgada Island, Central Adriatic, Croatia). Mar. Pollut. Bull. 2014, 83, 198–213. [Google Scholar] [CrossRef] [PubMed]
  40. Oron, S.; Angel, D.; Goodman-Tchernov, B.; Merkado, G.; Kiflawi, M.; Abramovich, S. Benthic Foraminiferal Response to the Removal of Aquaculture Fish Cages in the Gulf of Aqaba-Eilat, Red Sea. Mar. Micropaleontol. 2014, 107, 8–17. [Google Scholar] [CrossRef]
  41. Bouchet, V.M.P.; Frontalini, F.; Francescangeli, F.; Sauriau, P.-G.; Geslin, E.; Martins, M.V.A.; Almogi-Labin, A.; Avnaim-Katav, S.; Di Bella, L.; Cearreta, A.; et al. Indicative Value of Benthic Foraminifera for Biomonitoring: Assignment to Ecological Groups of Sensitivity to Total Organic Carbon of Species from European Intertidal Areas and Transitional Waters. Mar. Pollut. Bull. 2021, 164, 112071. [Google Scholar] [CrossRef]
  42. Pawlowski, J.; Esling, P.; Lejzerowicz, F.; Cedhagen, T.; Wilding, T.A. Environmental Monitoring through Protist Next-Generation Sequencing Metabarcoding: Assessing the Impact of Fish Farming on Benthic Foraminifera Communities. Mol. Ecol. Resour. 2014, 14, 1129–1140. [Google Scholar] [CrossRef] [PubMed] [Green Version]
  43. Pochon, X.; Wood, S.A.; Keeley, N.B.; Lejzerowicz, F.; Esling, P.; Drew, J.; Pawlowski, J. Accurate Assessment of the Impact of Salmon Farming on Benthic Sediment Enrichment Using Foraminiferal Metabarcoding. Mar. Pollut. Bull. 2015, 100, 370–382. [Google Scholar] [CrossRef] [PubMed]
  44. O’Brien, P.; Polovodova Asteman, I.; Bouchet, V.M.P. Benthic Foraminiferal Indices and Environmental Quality Assessment of Transitional Waters: A Review of Current Challenges and Future Research Perspectives. Water 2021, 13, 1898. [Google Scholar] [CrossRef]
  45. Bouchet, V.M.P.; Alve, E.; Rygg, B.; Telford, R.J. Benthic Foraminifera Provide a Promising Tool for Ecological Quality Assessment of Marine Waters. Ecol. Indic. 2012, 23, 66–75. [Google Scholar] [CrossRef]
  46. Alve, E.; Korsun, S.; Schönfeld, J.; Dijkstra, N.; Golikova, E.; Hess, S.; Husum, K.; Panieri, G. Foram-AMBI: A Sensitivity Index Based on Benthic Foraminiferal Faunas from North-East Atlantic and Arctic Fjords, Continental Shelves and Slopes. Mar. Micropaleontol. 2016, 122, 1–12. [Google Scholar] [CrossRef]
  47. Jorissen, F.; Nardelli, M.P.; Almogi-Labin, A.; Barras, C.; Bergamin, L.; Bicchi, E.; El Kateb, A.; Ferraro, L.; McGann, M.; Morigi, C.; et al. Developing Foram-AMBI for Biomonitoring in the Mediterranean: Species Assignments to Ecological Categories. Mar. Micropaleontol. 2018, 140, 33–45. [Google Scholar] [CrossRef] [Green Version]
  48. Barras, C.; Jorissen, F.J.; Labrune, C.; Andral, B.; Boissery, P. Live Benthic Foraminiferal Faunas from the French Mediterranean Coast: Towards a New Biotic Index of Environmental Quality. Ecol. Indic. 2014, 36, 719–743. [Google Scholar] [CrossRef] [Green Version]
  49. Dimiza, M.D.; Triantaphyllou, M.V.; Koukousioura, O.; Hallock, P.; Simboura, N.; Karageorgis, A.P.; Papathanasiou, E. The Foram Stress Index: A New Tool for Environmental Assessment of Soft-Bottom Environments Using Benthic Foraminifera. A Case Study from the Saronikos Gulf, Greece, Eastern Mediterranean. Ecol. Indic. 2016, 60, 611–621. [Google Scholar] [CrossRef]
  50. Bouchet, V.M.P.; Goberville, E.; Frontalini, F. Benthic Foraminifera to Assess Ecological Quality Statuses in Italian Transitional Waters. Ecol. Indic. 2018, 84, 130–139. [Google Scholar] [CrossRef]
  51. Cavaliere, M.; Barrenechea Angeles, I.; Montresor, M.; Bucci, C.; Brocani, L.; Balassi, E.; Margiotta, F.; Francescangeli, F.; Bouchet, V.M.P.; Pawlowski, J.; et al. Assessing the Ecological Quality Status of the Highly Polluted Bagnoli Area (Tyrrhenian Sea, Italy) Using Foraminiferal EDNA Metabarcoding. Sci. Total Environ. 2021, 790, 147871. [Google Scholar] [CrossRef] [PubMed]
  52. El Kateb, A.; Stalder, C.; Martínez-Colón, M.; Mateu-Vicens, G.; Francescangeli, F.; Coletti, G.; Stainbank, S.; Spezzaferri, S. Foraminiferal-Based Biotic Indices to Assess the Ecological Quality Status of the Gulf of Gabes (Tunisia): Present Limitations and Future Perspectives. Ecol. Indic. 2020, 111, 105962. [Google Scholar] [CrossRef]
  53. Fossile, E.; Sabbatini, A.; Spagnoli, F.; Caridi, F.; Dell’Anno, A.; De Marco, R.; Dinelli, E.; Droghini, E.; Tramontana, M.; Negri, A. Sensitivity of Foraminiferal-Based Indices to Evaluate the Ecological Quality Status of Marine Coastal Benthic Systems: A Case Study of the Gulf of Manfredonia (Southern Adriatic Sea). Mar. Pollut. Bull. 2021, 163, 111933. [Google Scholar] [CrossRef]
  54. Melis, R.; Celio, M.; Bouchet, V.M.P.; Varagona, G.; Bazzaro, M.; Crosera, M.; Pugliese, N. Seasonal Response of Benthic Foraminifera to Anthropogenic Pressure in Two Stations of the Gulf of Trieste (Northern Adriatic Sea, Italy): The Marine Protected Area of Miramare versus the Servola Water Sewage Outfall. Mediterr. Mar. Sci. 2019, 20, 120–141. [Google Scholar] [CrossRef]
  55. Parent, B.; Barras, C.; Jorissen, F. An Optimised Method to Concentrate Living (Rose Bengal-Stained) Benthic Foraminifera from Sandy Sediments by High Density Liquids. Mar. Micropaleontol. 2018, 144, 1–13. [Google Scholar] [CrossRef]
  56. Cimerman, F.; Langer, M.R. Mediterranean Foraminifera; Dela/Slovenska Akademija Znanosti in Umetnosti, Razred za Naravoslovne Vede = Opera/Academia Scientiarum et Artium Slovenica, Classis IV—Historia Naturalis, Znanstvenoraziskovalni Center SAZU, Paleontološki inštitut Ivana Rakovca; Slovenska Akademija Znanosti in Umetnosti: Ljubljana, Slovenia, 1991. [Google Scholar]
  57. Jones, R.W.; Brady, H.B. The Challenger Foraminifera; Oxford University Press: Oxford, MS, USA, 1994. [Google Scholar]
  58. World Register of Marine Species. Available online: http://www.marinespecies.org (accessed on 7 October 2021).
  59. Chao, A.; Shen, T.-J. Non-Parametric Estimation of Shannon’s Index of Diversity When There Are Unseen Species in Sample. Environ. Ecol. Stat. 2003, 10, 429–443. [Google Scholar] [CrossRef]
  60. Beck, J.; Schwanghart, W. Comparing Measures of Species Diversity from Incomplete Inventories: An Update. Methods Ecol. Evol. 2010, 1, 38–44. [Google Scholar] [CrossRef]
  61. Hayek, L.-A.; Buzas, M.A. Surveying Natural Populations: Quantitative Tools for Assessing Biodiversity, 2nd ed.; Columbia University Press: New York, NY, USA, 1997. [Google Scholar]
  62. Jost, L. Entropy and Diversity. Oikos 2006, 113, 363–375. [Google Scholar] [CrossRef]
  63. Hill, M.O. Diversity and Evenness: A Unifying Notation and Its Consequences. Ecology 1973, 54, 427–432. [Google Scholar] [CrossRef] [Green Version]
  64. Sokal, R.F.; Rolf, S.W. Biometry: The Principles and Practice of Statistics in Biological Research; MacMillan: New York, NY, USA, 1995. [Google Scholar]
  65. R Core Team. R: A Language and Environment for Statistical Computing; R Foundation for Statistical Compunting: Vienna, Austria, 2020. [Google Scholar]
  66. Souissi, R.; Turki, I.; Souissi, F. Effect of Submarine Morphology on Environment Quality: Case of Monastir Bay (Eastern Tunisia). Carpathian J. Earth Environ. Sci. 2014, 9, 231–239. [Google Scholar]
  67. Vizzini, S.; Sarà, G.; Michener, R.; Mazzola, A. The Role and Contribution of the Seagrass Posidonia oceanica (L.) Delile Organic Matter for Secondary Consumers as Revealed by Carbon and Nitrogen Stable Isotope Analysis. Acta Oeacologica 2002, 23, 277–285. [Google Scholar] [CrossRef]
  68. Ellis, A.M.; Culver, S.J.; Mallinson, D.J.; Corbett, D.R.; Leorri, E.; Buzas, M.A.; Shazili, N.A.M. The Influence of Aquaculture of Modern Foraminifera and Sediments in the Setiu Estuary and Lagoon, Terengganu, Malaysia: A Spatial Investigation. J. Foraminifer. Res. 2014, 44, 390–415. [Google Scholar] [CrossRef]
  69. Hyams-Kaphzan, O.; Almogi-Labin, A.; Benjamini, C.; Herut, B. Natural Oligotrophy vs. Pollution-Induced Eutrophy on the SE Mediterranean Shallow Shelf (Israel): Environmental Parameters and Benthic Foraminifera. Mar. Pollut. Bull. 2009, 58, 1888–1902. [Google Scholar] [CrossRef] [PubMed]
  70. Pearl, R.; Reed, L.J. On the Rate of Growth of the Population of the United States since 1790 and Its Mathematical Representation. Proc. Natl. Acad. Sci. USA 1920, 6, 275–288. [Google Scholar] [CrossRef] [PubMed] [Green Version]
  71. Langer, M.R. Epiphytic Foraminifera. Mar. Micropaleontol. 1993, 20, 235–265. [Google Scholar] [CrossRef]
  72. Choi, Y.H.; Jeong, D.U.; Lee, Y.G.; Choi, J.U.; Kim, S.; Lee, J.S. Opportunistic Species and Seasonal Variation in Epiphytic Foraminiferal Assemblages in Abalone Farm Nets. J. Coast. Res. 2019, 35, 559–573. [Google Scholar] [CrossRef]
  73. El Kateb, A.; Stalder, C.; Neururer, C.; Fentimen, R.; Spangenberg, J.E.; Spezzaferri, S. Distribution of Benthic Foraminiferal Assemblages in the Transitional Environment of the Djerba Lagoon (Tunisia). Swiss J. Geosci. 2018, 111, 589–606. [Google Scholar] [CrossRef] [Green Version]
  74. Buosi, C.; Armynot du Châtelet, E.; Cherchi, A. Benthic Foraminiferal Assemblages in the Current-Dominated Strait of Bonifacio (Mediterranean Sea). J. Foraminifer. Res. 2012, 42, 39–55. [Google Scholar] [CrossRef]
  75. Mojtahid, M.; Jorissen, F.; Lansard, B.; Fontanier, C.; Bombled, B.; Rabouille, C. Spatial Distribution of Live Benthic Foraminifera in the Rhône Prodelta: Faunal Response to a Continental–Marine Organic Matter Gradient. Mar. Micropaleontol. 2009, 70, 177–200. [Google Scholar] [CrossRef] [Green Version]
  76. Donnici, S.; Barbero, R. The benthic foraminiferal communities of the northern Adriatic continental shelf. Mar. Micropaleontol. 2002, 44, 93–123. [Google Scholar] [CrossRef]
  77. De Rijk, S.; Jorissen, F.J.; Rohling, E.J.; Troelstra, S.R. Organic flux control on bathymetric zonation of Mediterranean benthic foraminifera. Mar. Micropaleontol. 2000, 40, 151–166. [Google Scholar] [CrossRef]
  78. Murray, J.W. Ecology and Paleoecology of Benthic Foraminifera; Longman Scientific & Technical: London, UK, 1991; 397p. [Google Scholar]
  79. Dauvin, J.-C.; Bellan, G.; Bellan-Santini, D. Benthic Indicators: From Subjectivity to Objectivity—Where Is the Line? Mar. Pollut. Bull. 2010, 60, 947–953. [Google Scholar] [CrossRef] [PubMed]
  80. Spilmont, N. The Future of Benthic Indicators: Moving up to the Intertidal. Open J. Mar. Sci. 2013, 3, 76–86. [Google Scholar] [CrossRef]
  81. Zettler, M.L.; Proffitt, C.E.; Darr, A.; Degraer, S.; Devriese, L.; Greathead, C.; Kotta, J.; Magni, P.; Martin, G.; Reiss, H.; et al. On the Myths of Indicator Species: Issues and Further Consideration in the Use of Static Concepts for Ecological Applications. PLoS ONE 2013, 8, e78219. [Google Scholar] [CrossRef] [Green Version]
  82. Pearson, T.H.; Black, K.D. The Environmental Impacts of Marine Fish Cage Culture. In Environmental Impacts of Aquaculture; Sheffield Academic Press: London, UK, 2001; pp. 1–31. [Google Scholar]
  83. Vidović, J.; Ćosović, V.; Juračić, M.; Petricioli, D. Impact of Fish Farming on Foraminiferal Community, Drvenik Veliki Island, Adriatic Sea, Croatia. Mar. Pollut. Bull. 2009, 58, 1297–1309. [Google Scholar] [CrossRef]
  84. Alve, E.; Hess, S.; Bouchet, V.M.P.; Dolven, J.K.; Rygg, B. Intercalibration of benthic foraminiferal and macrofaunal biotic indices: An example from the Norwegian Skagerrak coast (NE North Sea). Ecol. Indic. 2019, 96, 107–115. [Google Scholar] [CrossRef]
  85. de Jesus, M.S.D.S.; Frontalini, F.; Bouchet, V.M.; Yamashita, C.; Sartoretto, J.R.; Figueira, R.C.; e Sousa, S.H.D.M. Reconstruction of the Palaeo-Ecological Quality Status in an Impacted Estuary Using Benthic Foraminifera: The Santos Estuary (São Paulo State, SE Brazil). Mar. Environ. Res. 2020, 162, 105121. [Google Scholar] [CrossRef] [PubMed]
Figure 1. Sampling sites (B and D) along the Corsican coast. Sites are represented by stars and stations by grey circles. Stations are named according to their distance (in meters) from fish farms.
Water 13 02821 g001
Figure 2. Distribution of sediment grain fractions for the different sites.
Water 13 02821 g002
Figure 3. Plot of total organic carbon percentage and organic C:N ratio by station along transects. Asterisks represent statistically significant difference between different stations (***: p-value < 0.001; **: p-value < 0.01; *: p-value < 0.05).
Water 13 02821 g003
Figure 4. Species richness and living foraminiferal abundances (ind.50 cm−2) for each station sampled and for each ecological group (EG) [47] to calculate Foram-AMBI.
Water 13 02821 g004
Figure 5. Principal component analysis performed on relative densities (replicates samples pooled) of living fauna for sites B and D.
Water 13 02821 g005
Figure 6. Heat map of the 20 major species (>5% of the total fauna in at least one of the stations from site B and D).
Water 13 02821 g006
Figure 7. Distribution patterns of the relative abundances (filled black circles) against TOC at sampling sites (black dotted-line: second-order polynomial regression) of (a) Quinqueloculina lamarckiana, (b) Triloculina oblonga, (c) Rosalina bradyi, (d) Bolivina dilatata, (e) Bulimina aculeata, (f) Quinqueloculina stalkeri and (g) a theoretical model of the succession of species from the five EGs along the TOC gradient is shown in a panel (modified from [47]).
Water 13 02821 g007
Figure 8. Relative proportion of the different groups of indicative species as defined and classified by the authors: EGI, EGII, EGIII, EGIV and EGV, for Foram-AMBI [47]; group of tolerant and sensitive species for FSI [49]; group of tolerant species for TSI-Med [31,48].
Water 13 02821 g008
Figure 9. Plots of biotic indices exp(H′bc), Foram-AMBI, Foram Stress Index and TSI-Med along the transect at both sites. Decreasing values (Foram-AMBI and TSI-Med) or increasing values (exp(H′bc) and FSI) indicate improving ecological conditions.
Water 13 02821 g009
Figure 10. Comparison of Foram-AMBI values according to [47] and the study-updated list.
Water 13 02821 g010
Table 1. Summary of ecological group changes from the originally used list [47] to this study’s updated list.
SpeciesOriginally Used List [47]This Study
Bolivina dilatataEGIIEGIV
Bulimina aculeataEGIIIEGIV
Quinqueloculina lamarckianaNAEGI
Quinqueloculina stalkeriNAEGIV
Rosalina bradyiEGIEGIII
Triloculina oblongaNAEG I
Publisher’s Note: MDPI stays neutral with regard to jurisdictional claims in published maps and institutional affiliations.

