Article

The Impact of Bioaugmentation on the Performance and Microbial Community Dynamics of an Industrial-Scale Activated Sludge Sequencing Batch Reactor under Various Loading Shocks of Heavy Oil Refinery Wastewater

1
State Key Laboratory of Multiphase Flow in Power Engineering, School of Chemical Engineering and Technology, Xi’an Jiaotong University, No. 28 Xianning West Road, Xi’an 710049, China
2
State Key Laboratory of Heavy Oil Processing, Beijing Key Lab of Oil & Gas Pollution Control, College of Chemical Engineering and Environment, China University of Petroleum, Beijing 102249, China
3
Shaanxi Key Laboratory of Energy Chemical Process Intensification, School of Chemical Engineering and Technology, Xi’an Jiaotong University, No. 28 Xianning West Road, Xi’an 710049, China
*
Authors to whom correspondence should be addressed.
Water 2021, 13(20), 2822; https://doi.org/10.3390/w13202822
Submission received: 30 August 2021 / Revised: 7 October 2021 / Accepted: 7 October 2021 / Published: 11 October 2021
(This article belongs to the Special Issue Innovative Technologies for Wastewater and Water Treatment)

Abstract

:
The stable and efficient operation of the activated sludge sequencing batch reactor (ASSBR) in heavy oil refineries has become an urgent necessity in wastewater biotreatment. Hence, we constructed a green and efficient solid bioaugmentation agent (SBA) to enhance the resistance of the reactor to loading shock. The impact of bioaugmentation on the performance and microbial community dynamics under three patterns of heavy oil refinery wastewater (HORW) loading shock (higher COD, higher toxicity, and higher flow rate) was investigated on an industrial-scale ASSBR. Results showed that the optimal SBA formulation was a ratio and addition of mixed bacteria Bacillus subtillis and Brucella sp., of 3:1 and 3.0%, respectively, and a glucose concentration of 5.0 mg/L. The shock resistance of ASSBR was gradually enhanced and normal performance was restored within 6–7 days by the addition of 0.2% SBA. Additionally, the removal efficiency of chemical oxygen demand and total nitrogen reached 86% and 55%, respectively. Furthermore, we found that Burkholderiaceae (12.9%) was replaced by Pseudomonadaceae (17.1%) in wastewater, and Lachnospiraceae (25.4%) in activated sludge was replaced by Prevotellaceae (35.3%), indicating that the impact of different shocks effectively accelerated the evolution of microbial communities and formed their own unique dominant bacterial families.

1. Introduction

Heavy oil refinery wastewater (HORW) contains high amounts of recalcitrant and toxic organic pollutants, such as petroleum hydrocarbons, emulsified oil, sulfur compounds, and dissolved and dispersed oil [1]. Traditional treatment of heavy oil refinery wastewater is time-consuming and expensive. Moreover, the concentration of these organic pollutants fluctuates significantly during daily operations. Thus, HORW has been recognized as one of the most refractory wastewaters [2]. It is not only very costly to treat HORW but also very challenging to maintain the stability of the wastewater treatment systems.
To date, a variety of activated sludge processes had been developed for HORW treatment [3]. Among them, the activated sludge sequencing batch reactor (ASSBR) is the most promising one because of its low operational cost, high volumetric loading rate, small space footprint, biological detoxification ability, etc. [4]. Moreover, the operation mode of ASSBR is adjustable according to the characteristics of the influent [5]. However, the quality and quantity of industrial oily wastewater often fluctuate sharply because of changes in the actual production process. Subsequently, the organic loading rate will change instantaneously, and the anaerobic system will switch passively to an overloading state, which is defined as an organic loading shock (OLS) [6]. However, unlike other overloading states, the imbalance caused by OLS may be irreversible, depending on not only the magnitude, duration, and composition of the OLS but also the tolerance of activated sludge [7]. At present, ASSBRs are subjected to three main loading shocks, namely, high-concentration wastewater loading shock, high-toxic pollutants loading shock, and the combined shock of variations in the quantity and composition of inflows [8]. To deal with the loading shocks, methods such as reducing the loading rate, increasing the amount of aeration, and enlarging the hydraulic retention time (HRT) have been applied to maintain or regain the activity of the reactor [9,10]. Although these methods have been able to alleviate the impact of shocks, they also have increased the operational cost of HORW treatment plants and are therefore economically unattractive solutions.
Bioaugmentation with high organic wastewater tolerant microbial inocula has gained ground in recent years as a method to avert OLS-induced bioreactor failure [11]. Bioaugmentation involves the addition of exogenous microorganisms with specific functions (toxic resistance, biodegradation capacity) directly into a biological system to achieve a microbiome-guided process, to endure specific process properties such as tolerance to inhibitors or increased biodegradability [12]. Semrany et al., (2012) reported that the addition of supplementary microorganisms with their associated biodegradation capacities through bioaugmentation improved the performance of the activated sludge process [13]. Moreover, the application of bioaugmentation is more likely to be successful in a treatment system with well-characterized wastewater and operational parameters. Ma et al., (2009) demonstrated the improved capability of a bio-augmented activated sludge process treating petrochemical wastewater to deal with shock loadings of chemical oxygen demand (COD). Recovery from loading shock was also 50% faster [14]. On the contrary, without detailed knowledge of the system, the likelihood of successful integration of the inoculum is reduced. Thus, bioaugmentation is a technique that has been associated with doubt regarding its ability to benefit treatment processes.
There are still many challenges that need to be addressed for developing appropriate strategies to alleviate loading shocks via mixed microbial inocula in ASSBR. The loading shocks and mixed microbial strain screening strongly influence the growth and activity of associated microbial communities [6,11], hence their effect on bioaugmentation performance is expected to be important and should be investigated. Only deep knowledge of the effects of these factors on key functional microbial groups such as organic degrading bacteria and denitrifying functional bacteria will allow process optimization. The treatment of high nitrogen loads (1820 mg/L) through bioaugmentation was reported by Onyia et al., (2001) for palm oil wastewater [15]. The results showed that organic nitrogen removal efficiency increased to 100% within 7 days after adding 15 mg/L mixed denitrification bacteria. Another major challenge for bioaugmentation is its long-term performance [16]. The introduced enriched microbial culture needs to safely establish and function in the system and should not be washed out during continuous operation. Thus, there also remains a need to undertake bioaugmentation efficacy studies of industrial scale ASSBR systems with testing and further reporting on the economic viability of the technique. At present, published studies on microbial community shifts driven by the high toxicity and high loading of wastewater shocks are few, and the characteristics of interrelations among different microbial populations for organic removal, nitrification, and denitrification in ASSBR remain unclear under various loading shocks. Therefore, when the ASSBR are subjected to different types of loading shocks, understanding the effects of bioaugmentation on the performance and microbial community dynamics in ASSBR could facilitate the optimization of bioreactor design and enable the solution of bioreactor related problems.
This study aimed to investigate the effects of bioaugmentation on the performance and microbial community dynamics of an industrial-scale ASSBR under various loading shocks of HORW. Specifically, to evaluate the efficacy of green and efficient solid bioaugmentation agents (SBA) for the stable operation and rapid recovery of ASSBR, this work sought to (1) construct and optimize the biological agent formulation by investigating the nutrient concentrations and dosages of SBA; (2) investigate the removal efficiency of COD and total nitrogen (TN) before and after SBA treatment under three patterns of HORW loading shock, and (3) reveal the impacts of bioaugmentation on the dynamic evolution characteristics of the microbial community in ASSBR. The findings from this work can serve as a guide for the optimization of bioreactor design in HORW treatment and further enrich our ecological understanding of bioaugmentation.

2. Materials and Methods

2.1. Screening and Evaluation of Mixed Microbial Strains

The selection of a suitable strain is essential to the success of bioaugmentation [17]. Therefore, two bacterial strains (Figure S1) were isolated from an ASSBR system fed with HORW and located in the Petrochemical Industries Co. in Liaoning Province, China. The experimental protocol was as follows: 10 mL of the mixtures of HORW and activated sludge (these mixtures were derived from the ASSBR) and 90 mL of Luria-Bertani (LB) edium (10 g/L peptones, 5 g/L yeast powder, and 10 g/L NaCl) were mixed at 30 °C with shaking at 150 rpm for 3 days. Then, 5% of the mixed bacteria liquid was inoculated into 100 mL of fresh screening medium 1 and 2, respectively. Screening medium 1 was (per L of deionized water) phenol, 1.5 g; NH4NO3, 1.0 g; KH2PO4, 0.5 g; K2HPO4, 0.5 g; MgSO4·7H2O, 0.2 g; CaCl2, 0.1 g; MnSO4·H2O, 0.01 g; and FeSO4·7H2O, 0.01 g. Screening medium 2 was (per L of deionized water) sodium succinate, 4.7 g; KNO3, 1.0 g; KH2PO4, 1.5 g; Na2HPO4, 0.5 g; MgSO4·7H2O, 1.0 g, 1.0 mL trace element solution, and 1 mL 0.1 % resazurin (redox indicator). The final pH of the mediums 1 and 2 was adjusted to 7–7.2 with 0.1 N NaOH. The inocula were incubated for 5 days under facultative anaerobic conditions (the dissolved oxygen (DO) concentration was less than 0.5 mg/L) at 30 °C with shaking at 150 rpm. The above steps were repeated several times, and the inocula were then stretched on Petri dishes to pick a single colony. Otherwise, the determination method of DO concentration in each medium was the same as that mentioned by Cao et al. [18].
The organic-degrading bacteria (Bacillus subtillis, named BY2) and the denitrifying functional bacteria (Brucella sp., named BN3) were screened by phenol and sodium succinate as the screening carbon sources, and the removal efficiency of COD and nitrate nitrogen was 42.1% and 97.7%, respectively. In addition, the ratio of BY2 and BN3 screening was conducted by measuring changes in COD and 5-day biochemical oxygen demand (BOD5) as indicators. The biological agent formulation was optimized by investigating the effects of different components (nutrient concentration and the dosage of SBA) on the biodegradability of the simulated HORW (the volume ratio of ASSBR effluent and secondary dissolved air flotation influent was 9:1). The characteristic parameters of ASSBR effluent included: COD 54.7 mg/L, BOD5 6 mg/L, ammonium nitrogen (NH4+-N) 5.3 mg/L, TN 30.6 mg/L, and BOD5/COD (B/C) = 0.11. The characteristic parameters of the secondary dissolved air flotation influent included: COD 423.9 mg/L, BOD5 225.0 mg/L, NH4+-N 19.8 mg/L, TN 54.4 mg/L, and B/C = 0.53. A schematic diagram of the process of HORW treatment is presented in Figure 1. The composition of simulated HORW included: COD 100 mg/L, BOD5 27.9 mg/L, NH4+-N 6.7 mg/L, TN 33.1 mg/L, and B/C = 0.28.

2.2. Preparation of SBA

The formulation of biological agents mainly consisted of mixed microbial strains, glucose, and diatomite. The volumetric concentration of mixed strains BY2 and BN3 in SBA was 3%, and the ratio was 3:1 (v/v). The weight concentration ratio of mixed bacteria solution and diatomite in SBA was 1:2. Moreover, the BY2 and BN3 were made into SBA for convenient subsequent loading shock experiments. The microbial culture used for bioaugmentation was immobilized on diatomite according to the method reported by Huang et al. [19].

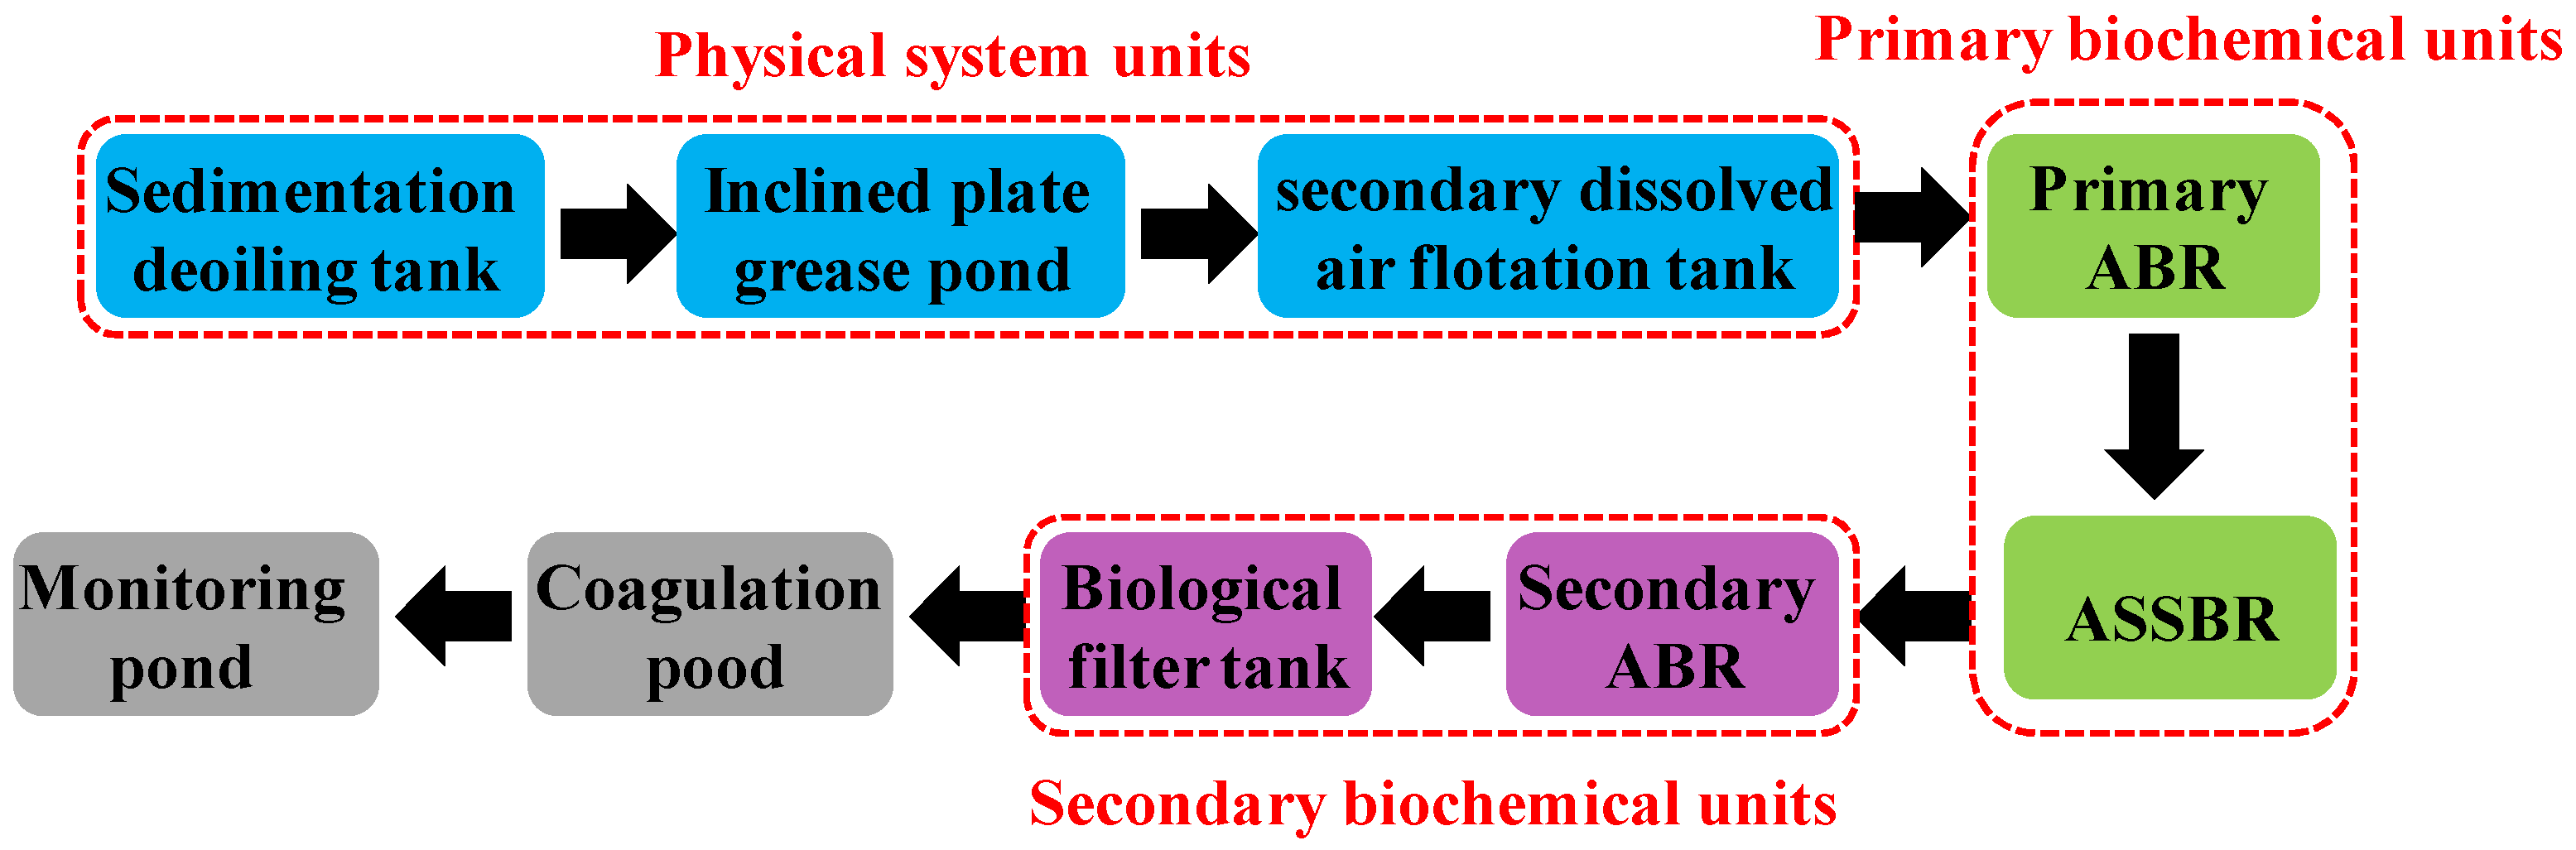
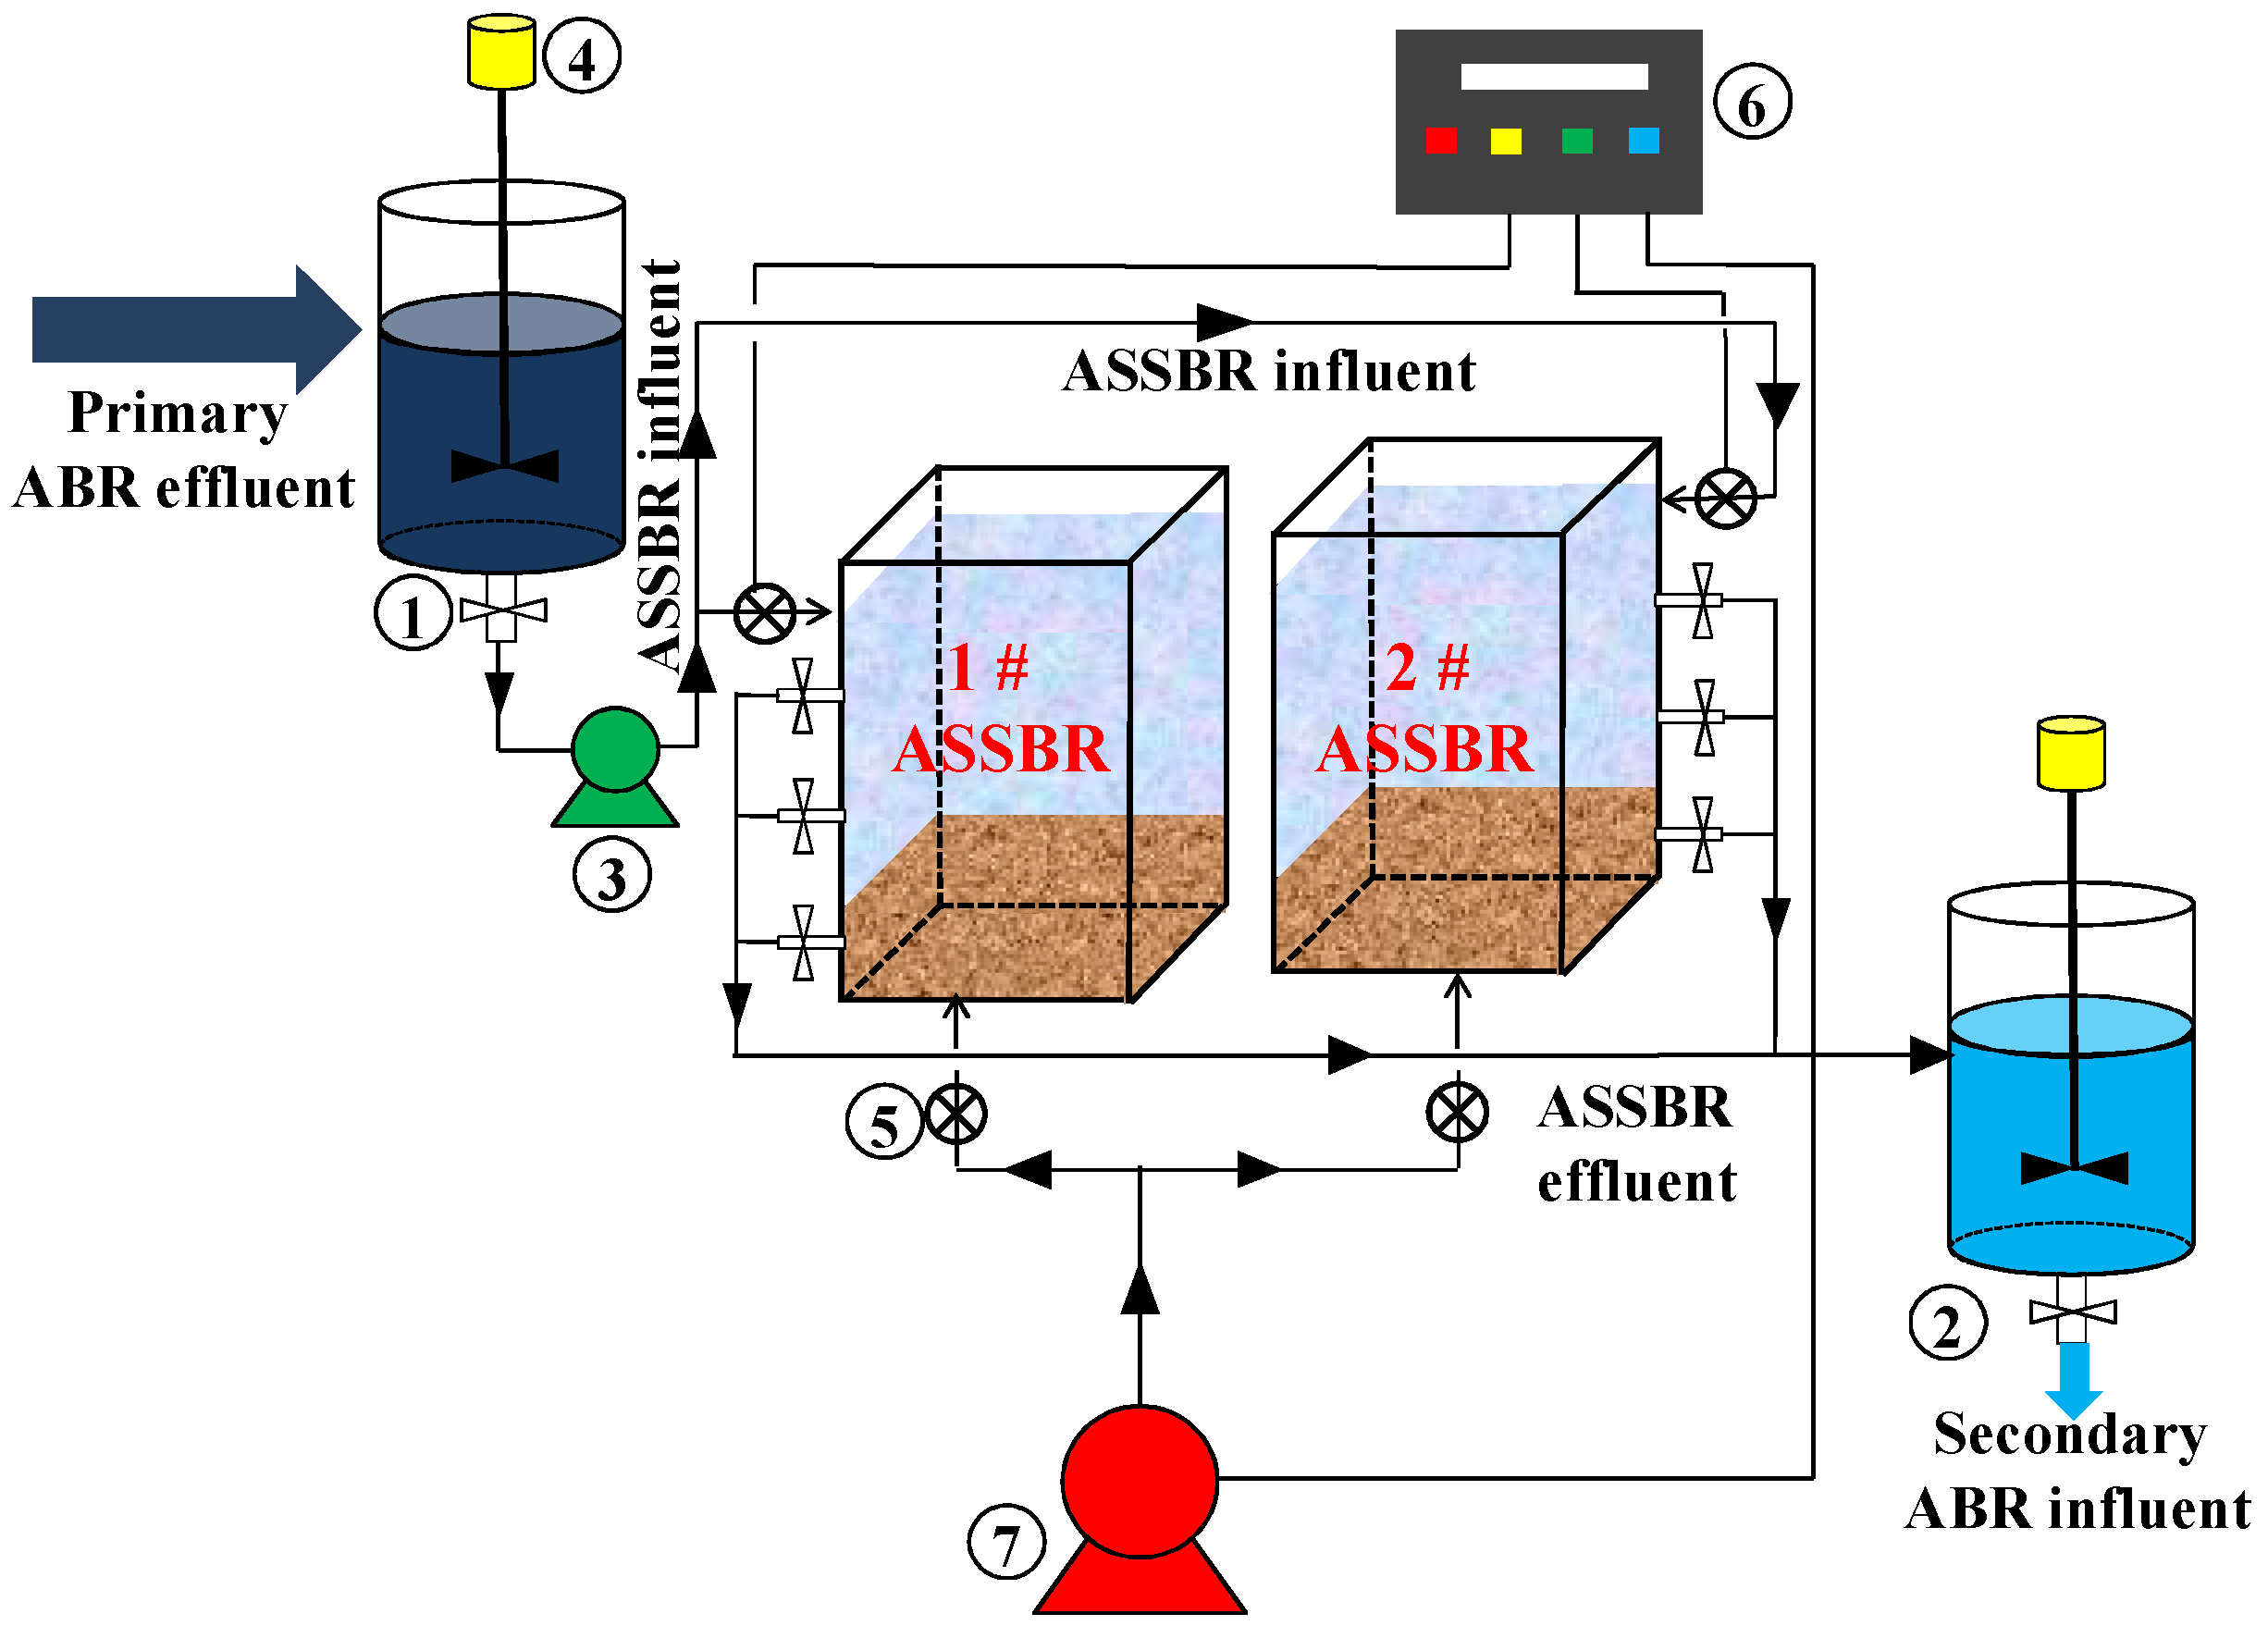
2.3. Industrial-Scale ASSBR Process

This work was performed in a HORW treatment plant with a treatment capacity of 12,000 m3/d in the Petrochemical Industries Co. in Liaoning Province, China. A schematic diagram of the oily wastewater treatment process is shown in Figure 2, which mainly involves two intermediate buffer tanks, two ASSBRs, a control center, and an aeration device. Among them, the ASSBRs were made of a 316 L stainless steel cuboid (550 mm × 550 mm × 600 mm, L × W × H) with a working volume of 180 L. Intermediate buffer tanks were installed between the anaerobic baffled reactor (ABR) and ASSBRs. The aeration device was fixed on the bottom inner loop flow guide tube. HORW was first pumped into the intermediate buffer tank from the primary hydrolytic acidification ABR, then into the ASSBRs, and finally into the secondary hydrolytic acidification ABR. The ASSBRs were embedded with activated sludge, which accounted for 1/10 (v/v) of the total volume. The operation of the whole ASSBR process was controlled by the control center to adjust the start and stop times of the influent/effluent water, aeration, and sedimentation according to the experimental design conditions. The sequential operation of the ASSBR system was controlled by the control center program. The detailed ASSBR process operating schedule can be found in the supplementary material section (Table S1).

2.4. ASSBR Start-Up and Operation

The two ASSBRs were started by inoculating the activated sludge. The seed-activated sludge was taken from a wastewater treatment plant of the Petrochemical Industries Co. in Liaoning Province, China. The amount of sludge inoculated was 30% of the effective volume of the reactor (activated sludge concentration was about 6000 mg/L), and the two ASSBRs’ temperatures were controlled at 28 ± 3 °C. After inoculation, the air supply was turned off for 48 h to accelerate the growth of digestion and denitrifying bacteria in the two ASSBRs. Additionally, the DO concentration was controlled between 3.0 and 5.0 mg/L by adjusting the volume and time of aeration. The flow rate of aeration was controlled by a rotor flowmeter. Then, when the oxygen deprivation period (DO concentration of less than 3.0 mg/L) ended, the effluent water from the primary hydrolytic acidification ABR was supplied to the two ASSBRs, and the influent flow rate was 15 L/h. The HRT of net flow was controlled at 12 h, and the food-to-micro ratio was 0.02 kg (BOD5)/kg (MLVSS)·d. After 5 days of operation, the microbes in two ASSBRs were gradually acclimatized to the fed wastewater during which the effluent COD, NH4+-N, and pH gradually stabilized, signifying that the two ASSBRs started successfully.

2.5. Design of Loading Shock Experiments

To investigate the efficiency of SBA on the shock resistance and recovery of the ASSBR, we simulated three patterns of loading shock experiments in this work: (1) the ASSBR influent was changed from the primary hydrolytic acidification ABR effluent to the secondary dissolved air flotation effluent (the COD is higher than the primary hydrolytic acidification ABR effluent, namely high COD loading shock). The #1 ASSBR was used as the control; (2) the ASSBR influent was changed from the secondary dissolved air flotation effluent to the mixed sewage of the crude oil pretreatment effluent (the COD concentration was 800–1000 mg/L and the toxicity was much higher than that of the secondary dissolved air flotation effluent, namely high COD and high toxicity loading shock); (3) based on shock 2, the influent volume of ASSBR was increased by 1.5 times (the original influent flow rate was 1/10, v/v, namely high flow rate loading shock). The detailed design scheme of the ASSBR loading shock tests is shown in Table 1.

2.6. Water Analysis

The influent and effluent samples from two ASSBRs were collected daily and analyzed immediately. The concentrations of COD, NH4+-N, TN-N, and nitrate-nitrogen (NO3-N) in the samples were measured daily following the standard methods of water and wastewater analyses (APHA, 2012) [20]. Each measurement was performed in triplicate. The average of the three parallel measurements was reported. Additionally, according to wastewater toxicity testing methods in the literature [21], the biological toxicity of ASSBR influent under different simulated shock conditions was measured by using a rapid water toxicity detector (Model BHP 9511, Germany). Toxicity levels refer to the percentage of the microorganisms killed with luminescent bacteria (Vibrio qinghaiensis sp. Q67) as reference. The luminescence intensity of Vibrio qinghaiensis sp. Q67 in different concentrations of mercury chloride was compared to judge the toxicity levels of simulated HORW. Additionally, this study mainly investigated the effect of SBA bioaugmentation on the removal efficiency of COD and TN in ASSBR. Hence, phosphorus concentration changes were not monitored in subsequent impact experiments. The sludge volume index (SVI) was the parameter of sludge settling performance, which reflects the loose degree, condensation, and settling performance of activated sludge. SVI was measured on activated sludge according to the method reported by Gupta et al., (2016) [22].

2.7. Collection of DNA Sequencing Samples

To investigate the microbial community composition of two ASSBRs, wastewater and activated sludge samples under different loading shock experimental conditions were collected from ASSBR #1 and #2. The sampling position was located at the outlets of the reactors during the experiment. Samples were immediately stored in 1 L plastic containers. The containers were filled to maintain an anaerobic condition by avoiding oxygen intrusion. Then, the samples were left at room temperature before shipment with ice blocks. The DNA of these samples was extracted by Soil DNA Kit (OMEGA, Norcross, GA, USA) within 48 h. The sampling position and characteristics of samples are shown in Table S2.

2.8. DNA Extraction and Microbial Diversity Analysis

The directly collected samples of wastewater and activated sludge contained crude oil, chemical additives, and suspended solids, all of which could hinder subsequent DNA extraction and affect data accuracy. Therefore, 1 L of the sample was filtered through a 5 μm glass filter with a 50 mm glass chimney filter unit to remove the impurities. Then, the filtrate was filtered through a 0.22 μm cellulose acetate filter to collect the microbes. Subsequently, the sample DNA was extracted from the collected microbial cells using a PowerWater DNA Isolation Kit (Beijing Tiangen Biochemical Technology Co., Ltd., Beijing, China) following the manufacturer’s instructions. The DNA samples were sequenced by using the Hiseq 2500 PE 250 Illumina high throughput sequencing platform at Beijing Institute of Genomics, Chinese Academy of Sciences.
The 16S rRNA sequence paired-end data set was joined and quality filtered using the FLASH method described by Magoc and Salzberg (2011). Sequence data were processed by utilizing the Quantitative Insights into Microbial Ecology pipeline (version 1.9.1) [23]. Then, the sequences were classified into different files according to the barcodes of the samples. Operational taxonomic unit screening and taxonomic richness and diversity analysis were also carried out as described in the literature [24]. The Mothur (https://www.mothur.org/wiki/Dow (accessed on 11 June 2021)) software package was used to calculate species abundance and diversity. Hierarchical clustering based on population profiles of the most common and abundant taxa was performed by using an unweighted pair group method with arithmetic mean, also known as average linkage, on the distance matrix of Operational Taxonomic Units (OTUs) abundance.

3. Results and Discussion

3.1. Construction and Optimization of SBA

3.1.1. Optimization of Nutrient Concentration

Nutrient limitations have been held responsible for failed bioaugmentation attempts due to competition between the indigenous and inoculated bacteria [25]. In this study, the concentrations of nitrogen and phosphorus in the simulated HORW were 33.01 mg/L and 2.18 mg/L, respectively, which should not limit the growth of biomass. Thus, this study mainly investigated the effect of different concentrations of carbon sources (e.g., glucose), BY2, and BN3 on the biodegradability of simulated HORW because glucose was added to the SBA to accelerate the rapid growth and activity of BY2 and BN3 in the ASSBR. In Table 2, compared with the blank group, the combination of different concentrations of glucose and BY2 or BN3 significantly improved the biodegradability and COD removal efficiency of simulated HORW. This result is consistent with the previous report of Zhou et al., (2017), in which researchers found that glucose as a co-substrate contributed to the enrichment of refractory compounds (such as aromatic compounds) degrading microorganisms [26]. We found that the biodegradability and COD degradation efficiency of BY2 or BN3 was higher than that of the blank group at a glucose dosage of 5 mg/L, and also had the best biodegradability and COD degradation at this concentration. These results may be attributed to the addition of a small amount of glucose, contributing to the rapid growth of exogenous functional bacteria, such that these combinations could effectively improve the utilization of organic compounds in HORW and break these macromolecules into small carbon molecules as electron donors for denitrification [27]. Nevertheless, the COD removal efficiency gradually decreased with increasing glucose concentration, which may be attributed to the deterioration of simulated HORW biodegradability for the increase in COD concentration in the short experimental time, because the BOD5 was unchanged, resulting in the decrease in B/C value. According to the above research results, 5 mg/L was the optimal combination concentration of glucose and the mixed functional bacteria (BY2 and BN3).

3.1.2. Optimization of Dosage of SBA

Carriers could help the target contaminants adhere to the microorganisms and protect the microbial agents [28]. In this study, we mainly investigated the preparation of SBA and its dosage by using diatomite as a carrier. When the SBA dosage was 0.1%, 0.2%, 0.5%, 0.7%, and 1% (kg SBA/m3 HORW), the effluent COD concentrations were 58.3, 62.6, 86.2, 103.1, and 140.2 mg/L, respectively (Figure 3), indicating that the content of organic pollutants in the simulated HORW continued to accumulate as the SBA dosage increased, eventually leading to the effluent COD concentration increase. Conversely, if the SBA dosage was too small, the shock interference caused by simulated HORW could not be resisted. Based on the results of previous laboratory studies [19], the effluent COD was higher than 80 mg/L when the dosage exceeded 0.2%, thus affecting the influent COD concentration in the shock experiments. After comprehensive consideration, 0.2% was preliminarily determined as the optimal dosage for subsequent simulated loading shock experiments. Additionally, because the selected carrier had little effect on COD removal efficiency (data not shown), this factor was not considered in the whole degradation process.

3.2. Effects of Bioaugmentation on the Dynamics of Microbial Communities

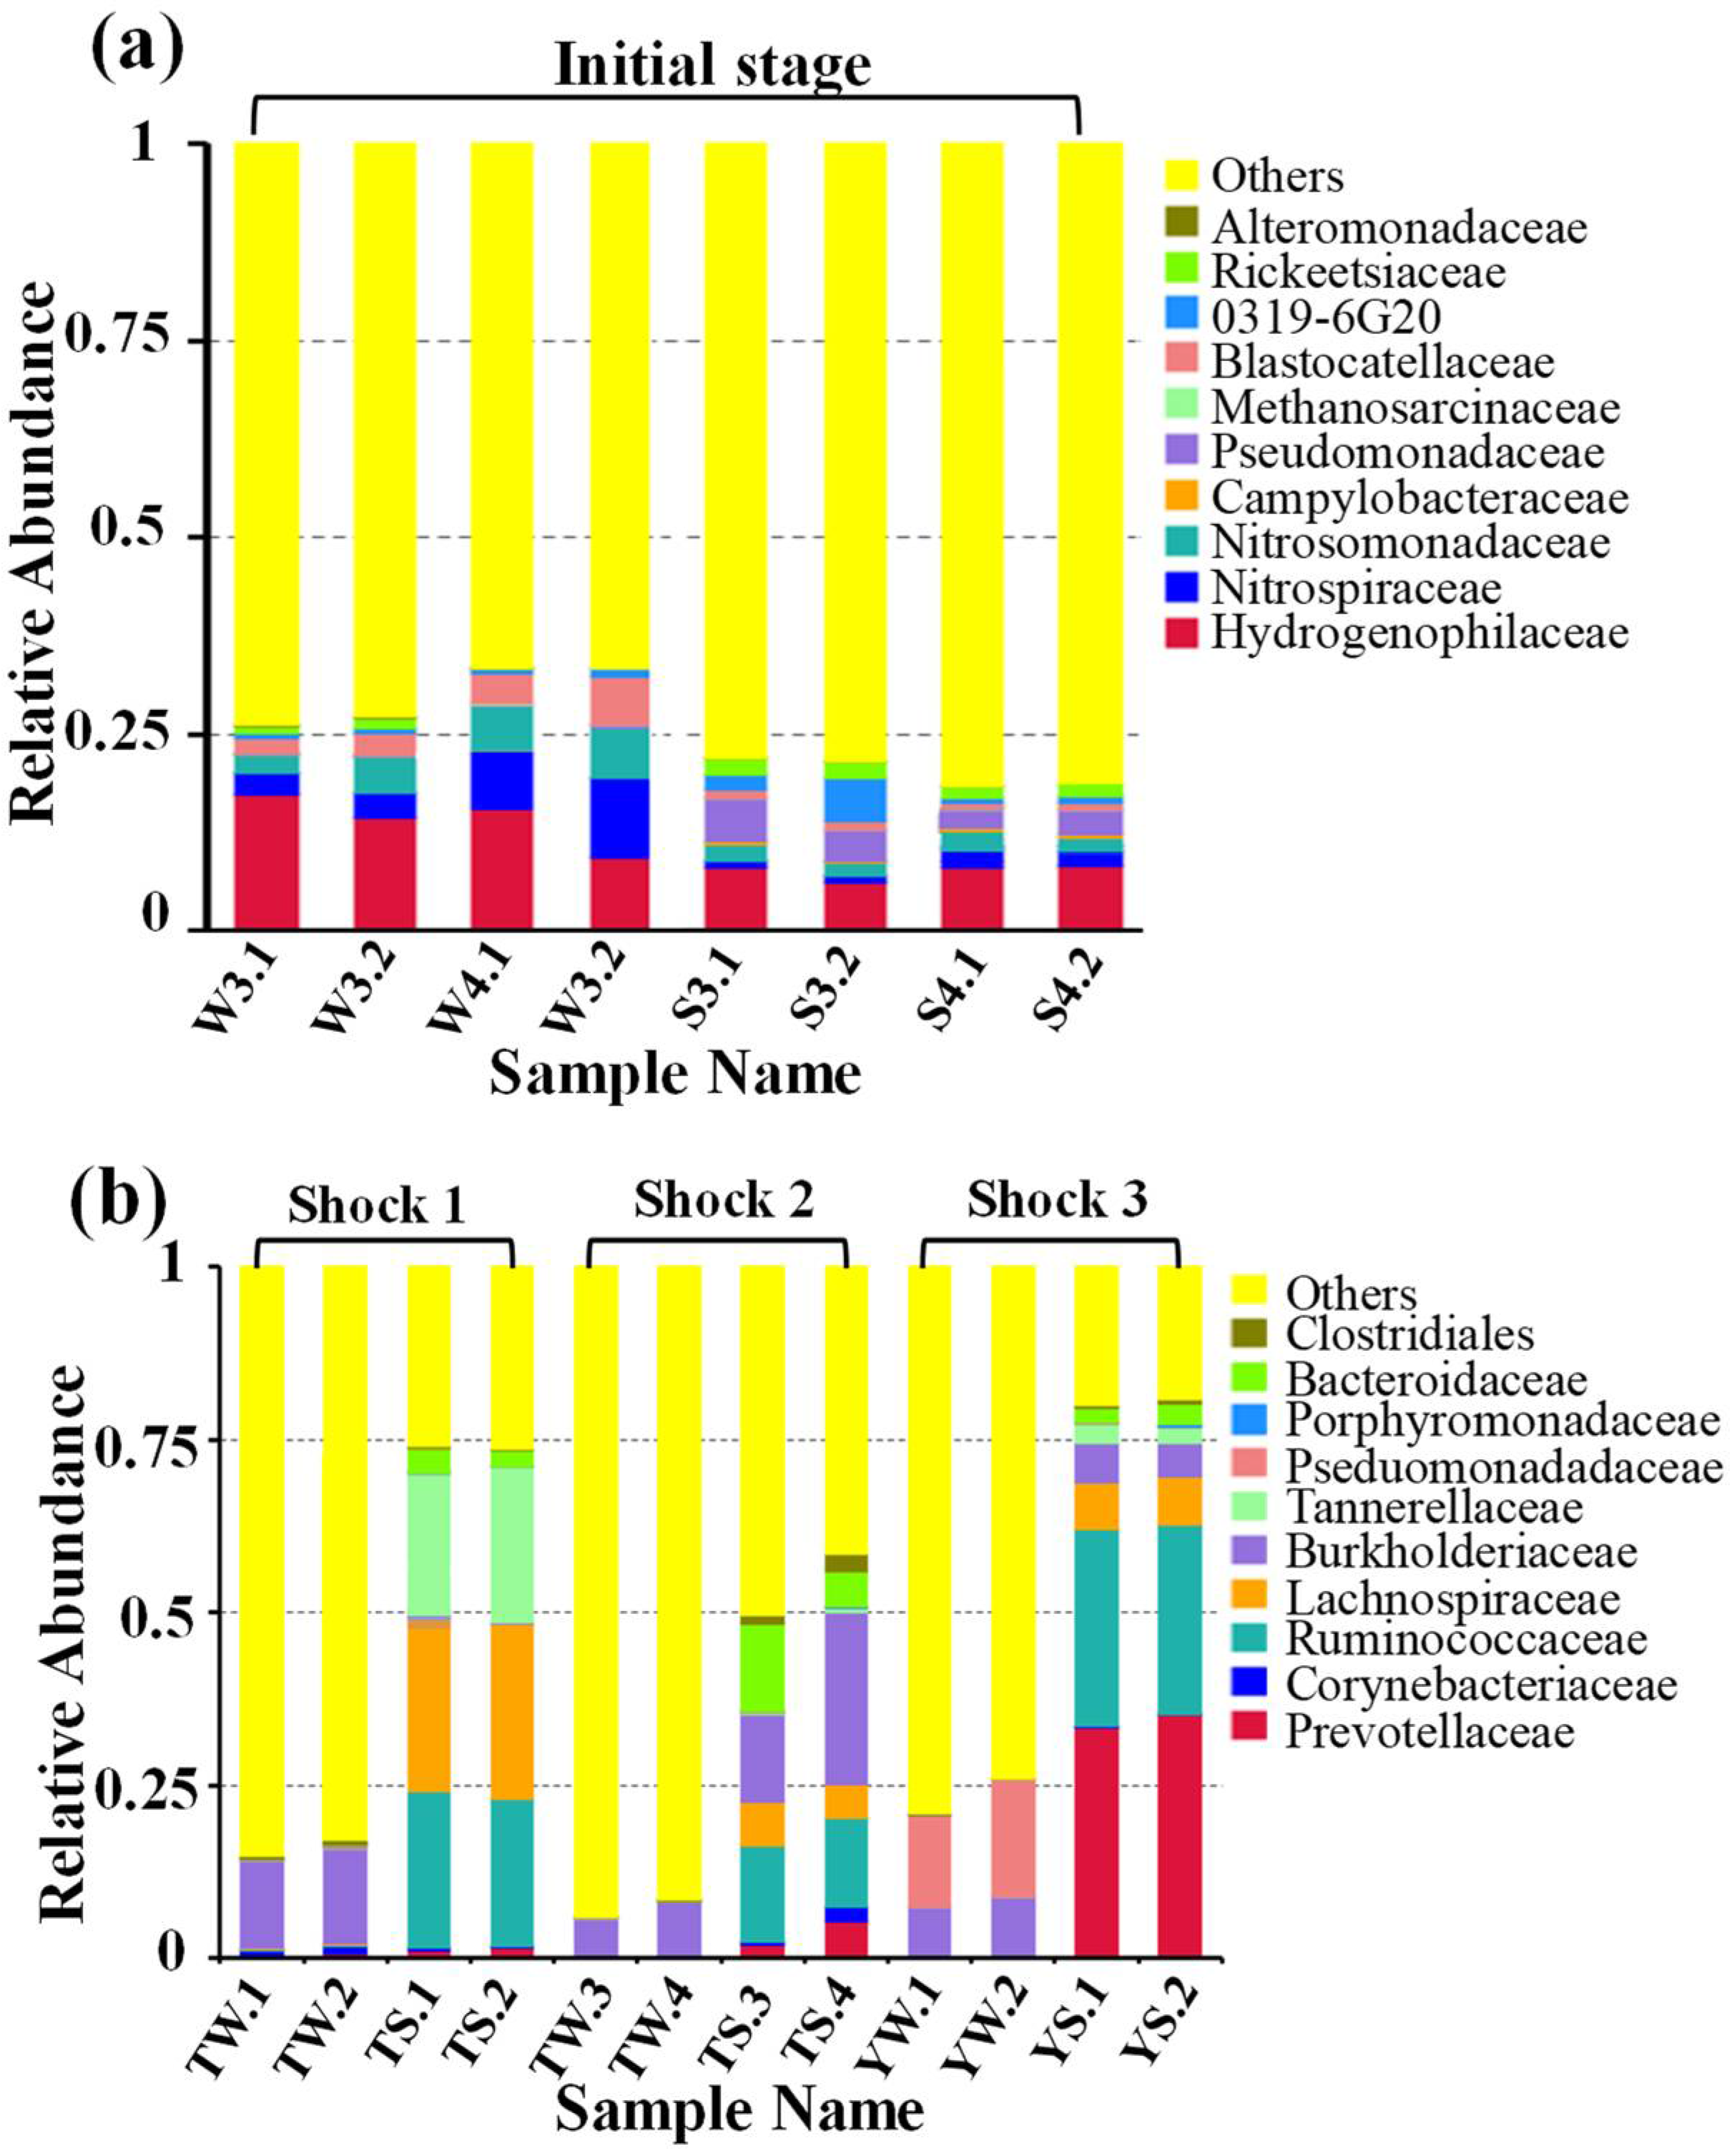
3.2.1. Evolutionary Characteristics of Microbial Communities

The dynamic changes in the microbial diversity and distribution in two ASSBRs under three patterns of HORW shock loading were revealed by high-throughput sequencing technology. The alpha diversity indices of the microbial communities in a different phase of the two reactors are summarized in Table 3. The values in Table 3 show the various characteristics of the diversity, richness, and evenness of the microbial community in the DNA samples. Among them, the higher the ACE and Chao 1, the higher the richness of the community. The higher the Simpson, the lower the community diversity, while Shannon was the opposite. The Good’s coverage of all samples exceeded 99%, indicating that the sequencing depth in this study could cover the microbial community in two ASSBRs treatment systems well [28]. Compared with the two ASSBRs that were not shocked by HORW, the indices of Shannon, Simpson, Chao 1, and ACE displayed some fluctuation in wastewater and sludge samples under three patterns of shock loading, demonstrating that the transient HORW loading shock had a great influence on the microbial communities. Among them, the values of ACE and Chao 1 for the samples in shock 1 were the highest, followed by the samples in shock 2. These results showed that the diversification of microorganisms in two reactors became smaller and smaller with the increase in loading shock strength, because some bacteria were not suitable for the high COD and high toxicity of HORW, causing the reduction of community richness [29]. Moreover, the Simpson index for the sludge samples was slightly lower than that in the wastewater samples, indicating that the microbial community in the sludge samples was more diversified. Meanwhile, it also implied that the activated sludge environment could mitigate the impact of loading shock on microorganisms. Furthermore, there were nonnegligible differences among the two reactors in microbial richness and diversity. The main reason for this difference might be attributed to different loading shocks that played various roles in promoting the evolution of microbial communities.
The microbial community was further compared at the family level; the community composition of the bacteria is given in Figure 4. The samples with the highest abundance and proportion of the top 10 species at the family levels were selected and analyzed. Figure 4a shows that before the two reactors’ loading shock, the bacterial community was mainly composed of Hydrogenophilaceae (14.3% and 7.5%), Nitrospiraceae (5.6% and 1.0%), and Nitrosomonadaceae (4.1% and 1.3%) at the family level in wastewater and activated sludge. Among them, Hydrogenophilaceae was relatively dominant in the ASSBRs and consisted mostly of chemolithotrophic nitrite-oxidizing bacteria that can reduce NO3-N by employing a broad scope of inorganic electron donors, such as hydrogen or reduced sulfuric compounds [30].
Compared with wastewater, activated sludge was less shocked. This result was consistent with reports in the existing literature that activated sludge can reduce the devastation from wastewater loading shock to microbial communities [31]. Figure 4b shows that the microbial community structure had undergone dramatic changes with the different loading shocks in two ASSBRs. The main bacterial families in reactor #2 were Burkholderiaceae, Ruminococcaceae, Lachnospiraceae, Tannerellaceae, Prevotellaceae, and Pseudomonadaceae. Simultaneously, the number of Hydrogenophilaceae members became too low for detection. The relative abundance of Burkholderiaceae in wastewater decreased from an average of 12.9% (TW.1 and TW.2) to approximately 7.4% (TW.3, TW.4, YW.1, and YW.2) accompanied by an increase in organic pollutant content and hydraulic load in the reactor influent. We found that Burkholderiaceae was also enriched in activated sludge samples—TS.3 (12.5%), TS.4 (24.7%), YS.1 (5.8%), and YS.2 (4.8%), respectively, which may have been due to the different shocks during continuous operation in the same reactor. As such, the leading Burkholderiaceae gradually adapted to the high COD, high toxicity, and high flow rate of the environment. According to the literature [30], Burkholderiaceae is capable of denitrification and is vital in activated sludge and denitrification effluents.
In addition, Ruminococcaceae, Lachnospiraceae, and Prevotellaceae were the dominant families in the activated sludge. The relative abundance of Ruminococcaceae decreased from an average of 21.3% (TS.1 and TS.2) to approximately 13.3% (TS.3 and TS.4), with the concentration of organic pollutants and toxicity increased in influent (Figure 4a). However, the relative abundance increased by 6.8% upon the hydraulic load increase. This phenomenon may be due to the inhibition of the growth and activity of denitrifying bacteria during denitrification with increases in influent COD and toxicity. Meanwhile, the relative abundance of Lachnospiraceae decreased from an average of 25.4% (TS.1 and TS.2) to approximately 6.3% (TS.3, TS.4, YS.1, and YS.2). Prevotellaceae was also enriched in the TS.4 (5.2%), YS.1 (33.5%), and YS.2 (35.3%) activated sludge samples, respectively (Figure 4b). Ruminococcaceae, Lachnospiraceae, and Prevotellaceae showed the capability of organic degradation and nitrate reduction [32], which played an important role in simultaneous nitrification and denitrification of effluents. Overall, species from these families can form a transition between different stages of loading shocks in the ASSBR and symbiosis with the microbes in each stage. As such, each stage formed a unified whole, which is an important part of the role of these bacteria in hydrolysis, acidification, nitrification, and denitrification.
Furthermore, we found that Tannerellaceae, Pseudomonadaceae, and Bacteroidaceae were relatively dominant at the family level under shock conditions 1, 2, and 3, respectively. In Figure 4b, Tannerellaceae was enriched in TS.1 (20.8%) and TS.2 (22.5%) samples, although it was a minor component in YS.1 (2.7%) and YS.2 (2.5%) samples. The proportions of Bacteroidaceae in TS.3 (12.6%), TS.4 (5.3%), and TS.1 (3.1%) were higher than those in other samples. Similarly, Pseudomonadaceae was present in YW.1 (13.4%) and YW.2 (17.1%) samples. As a result, specialized bacteria that performed different pollution removal tasks were formed in each shock condition. This result agreed with the reports by Li et al., (2017) that the organic load shock may have affected the microbial community [30]. On the results mentioned above, the population of the degrading organic pollutants and the nitrification and denitrification of functional bacteria were activated by adding the SBA, leading to the initial functional microbes being replaced or eliminated.

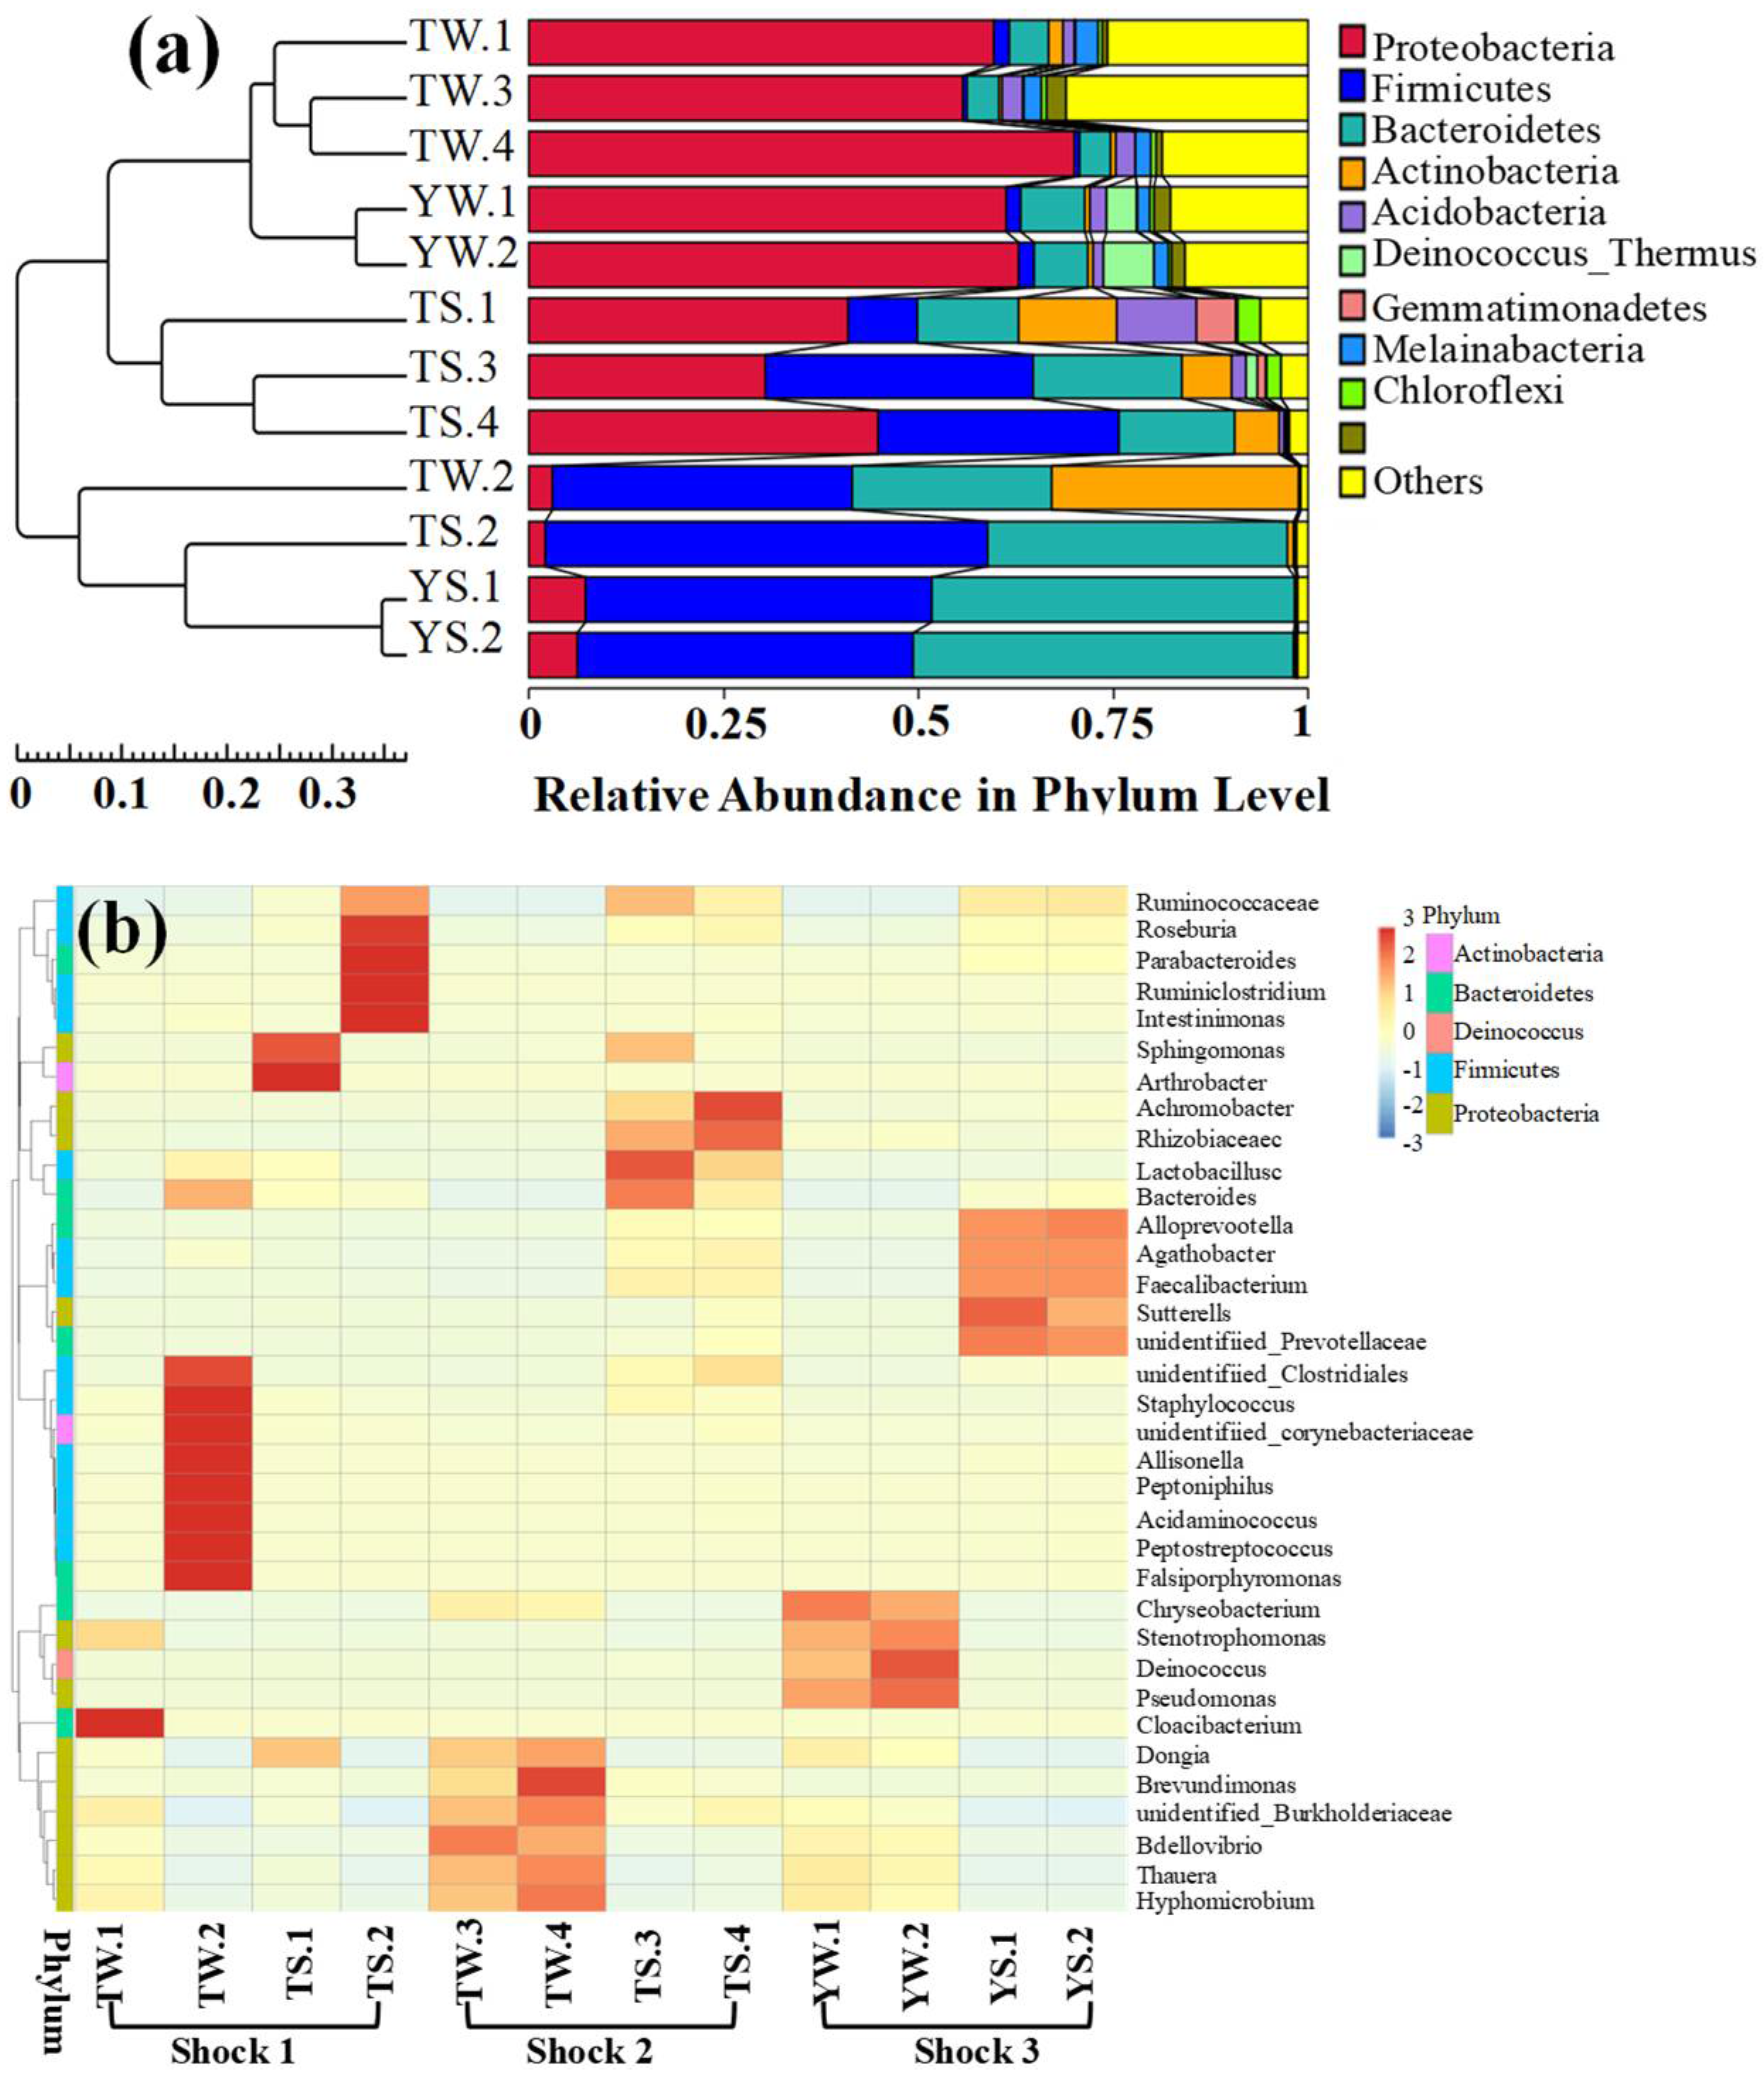
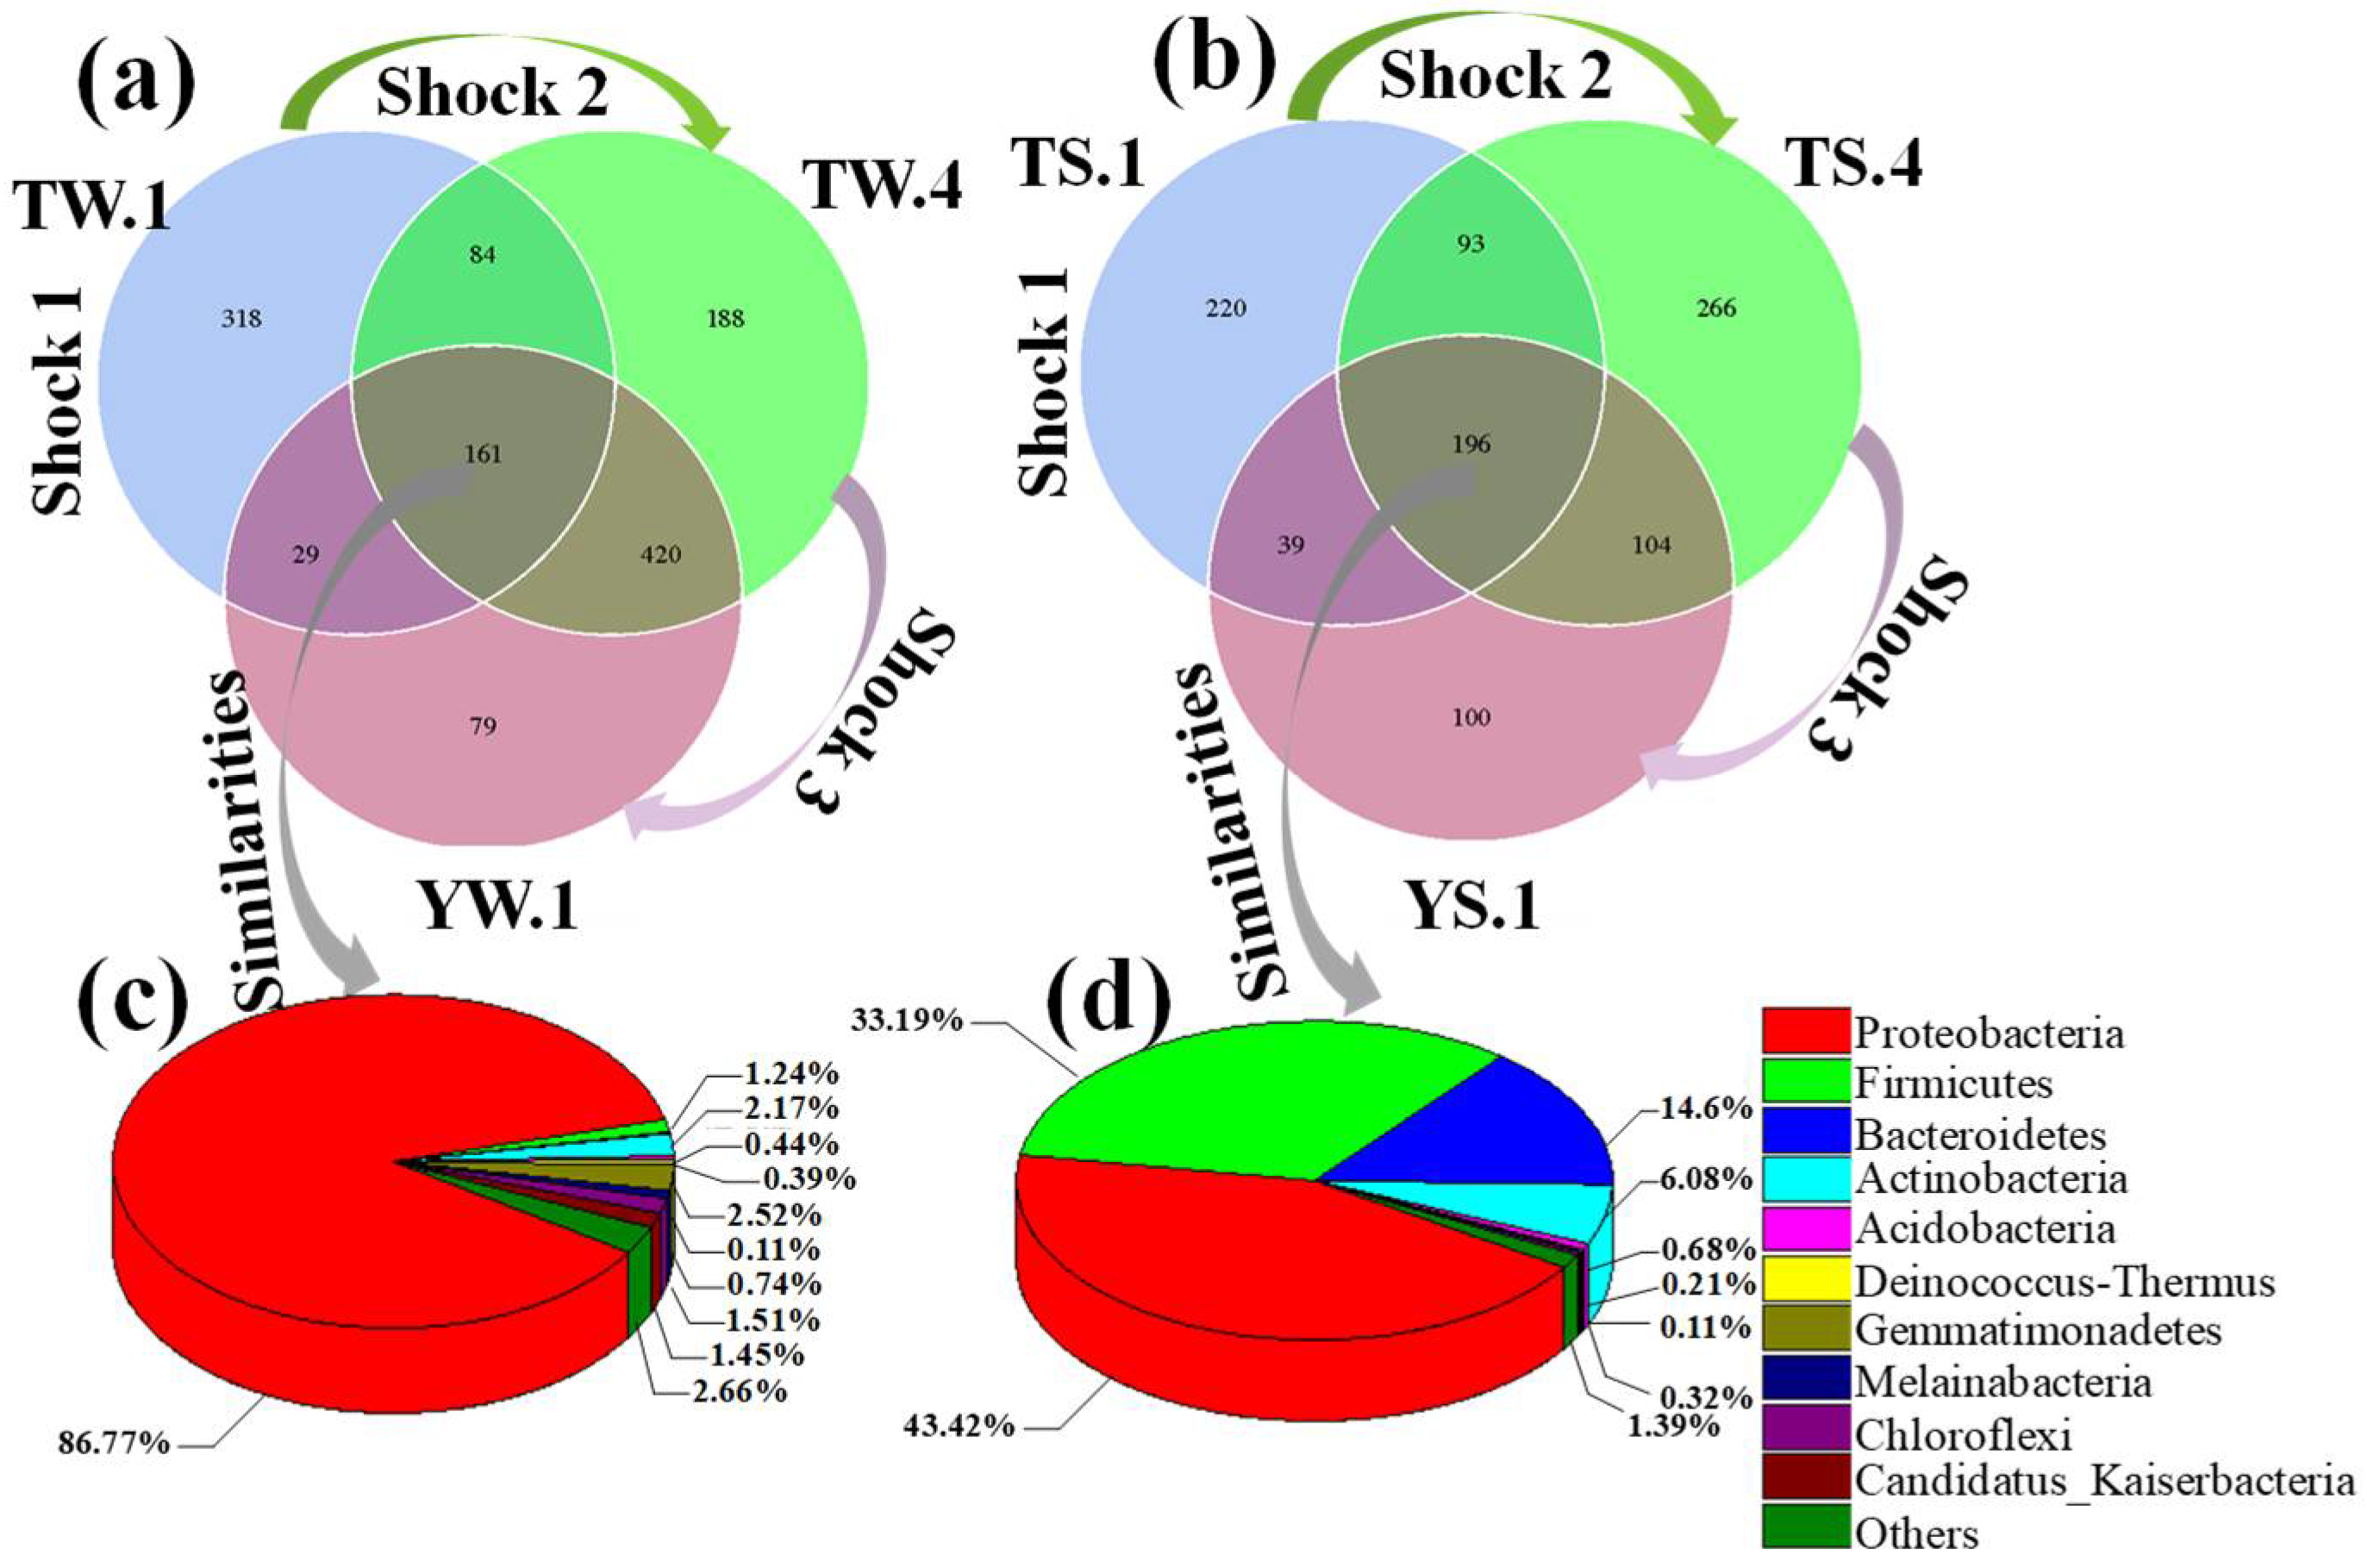
3.2.2. Similarities and Differences between Microbial Communities

To assess the similarities and differences of HORW loading shocks on the microbial community, the microbial abundance and diversity of samples under HORW loading shocks 1, 2, and 3 were compared. The phylogenetic classification of bacterial sequences from wastewater and sludge samples was compared at the phylum and genus level (Figure 5). In Figure 5a, Proteobacteria, Firmicutes, and Bacteroidetes were the dominant phyla in the whole loading shock process for all samples. We found that the proportion of Proteobacteria in wastewater samples decreased first and then increased, and finally decreased again with the increase in HORW loading shock strength. However, the trend of Bacteroidetes and Firmicutes was opposite to that of Proteobacteria. These phenomena proved not only that it is reasonable for the microbial community structure to evolve with the biodegradability changes of HORW, but also that microorganisms adapted to environmental changes in the process of increasing the HORW loading shocks. The Proteobacteria was most abundant across all wastewater samples, accounting for 59.62%, 70.2%, and 61.1% of the total sequences under shock conditions 1, 2, and 3, respectively. Proteobacterium assumed a very important role in ASSBR, so denitrification took place in the system.
In addition, it is worth noting that the dominant position of Proteobacteria in sludge samples was gradually lost with the increasing strength of loading shocks. Conversely, Firmicutes (34.3% and 44.3%) and Bacteroidetes (19.1% and 46.5%) occupied the dominant position in sludge samples under shock conditions 2 and 3, respectively (Figure 5a). Studies have shown that Proteobacteria, Firmicutes, and Bacteroidetes are able to degrade refractory compounds [33]. Furthermore, as for the relationships among the 12 samples, the cluster analysis showed that all the samples could be divided into close relationships with three clustering units. Among them, samples TW.1, TW.3, TW.4, YW.1, and YW.2 clustered together. Samples TS.1, TS3, TW.2, and TS.4 showed similar behavior. In addition, samples TS.2, YS.1, and YS.2 also clustered together in sludge, which may be attributed to selective domestication of microorganisms by bioaugmentation under different patterns of HORW loading shock. On the other hand, the introduction of exogenous functional bacteria (BY2 and BN3) induced the evolution of the microbial community in the reactor.
The microbial community was further compared at the genus level; the community composition of the bacteria is given in Figure 5b. Heatmap illustrated the abundance of the top 35 genera in each sample, and the scale bar showed the range of variation in the normalized abundance of the genera. The noteworthy variations in community structure were observed at the genus level. Many genera represented relatively large proportions in wastewater and sludge samples. Among them, Cloacibacterium (2.9%), Bdellovibrio (5.6%), and Pseudomonas (13.4%) were the dominant genera in the TW.1, TW.4, and YW.1 wastewater samples, respectively. In sludge samples, Sphingomonas (4.2%), Achromobacter (21.3%), and Faecalibacterium (6.5%) were the major genera in TS.1, TS.4, and YS.1, respectively. The results showed that microorganisms gradually evolved to form their unique genera under the induction or reinforcement of SBA.
The similarities and differences between the microbial communities in wastewater (TW.1, TW.4, and YW.1) and sludge (TS.1, TS.4, and YS.1) samples under HORW loading shock conditions 1, 2, and 3 were further analyzed by Venn diagrams (Figure 6). As shown in Figure 6a,b, the mutual OTU of the aforementioned in wastewater and sludge samples were 161 and 196 and accounted for 12.6% and 19.3T of total OTUs, respectively, suggesting that only a few special microbes existed after the HORW loading shocks. This result may be attributed to the sudden shock of high COD and high toxicity on microbial abundance and diversity in community structure [34].Additionally, we also found that the noteworthy variations in community structure were observed at the phylum level with the addition of SBA. Among them, the mutual OTUs at the phylum level in wastewater samples were mainly categorized as Proteobacteria (86.8%) (Figure 6c). Compared to the wastewater samples under loading shock conditions 1, 2, and 3, the relative abundances of Firmicutes (33.2%), Bacteroidetes (14.6%), and Actinobacteria (6.1%) showed a dramatic increase in sludge samples, while the relative abundance of Proteobacteria (43.4%) decreased significantly (Figure 6d). According to the current results, it was concluded that the transient loading shock could evoke a microbial community shift. Previous studies have explored the short-term toxicity of industrial wastewater to the microbial community in sewage treatment [35]. In this study, we found that bioaugmentation by SBA could selectively inhibit or promote the accelerated evolution of some functional microbial communities in ASSBR, and ultimately affect the running performance of the reactor and change the distribution characteristics of microbial community structure.

3.3. Start-Up of the Two ASSBRs

As shown in Figure 7a and Figure 8c, among the characteristics of the instability and large fluctuations of the influent quality during the start-up phase of the two ASSBRs, the concentration ranges of influent COD and NH4+-N were 250–450 and 20–45 mg/L, respectively. This meant that the HORW strongly fluctuated in terms of quantity and quality, increasing the difficulty of bioreactor treatment [36]. The effluent COD concentration of the two ASSBRs decreased gradually and then stabilized (45–60 mg/L) with the degradation of microorganisms, and the removal efficiency became stable above 80% (Figure 7a,b). The effluent NH4+-N concentration also rapidly decreased and then stabilized (about 0.6 mg/L), and the removal efficiency was higher than 95% (Figure 8c). In addition, influent pH was stable at pH 6–9, and the effluent pH range was 7–9 (Figure S2), indicating that the range of fluctuation in HORW quality was relatively stable and that microbe growth was favorable, because suitable pH is essential to maintaining strong microbial metabolic vitality and high stability of the anaerobic system [27]. If pH had severely fluctuated, it would lead to a massive die-off of microorganisms [36]. Thus, the above effluent characteristics of reactor #1 and reactor #2 proved that the two ASSBRs have been successfully started.

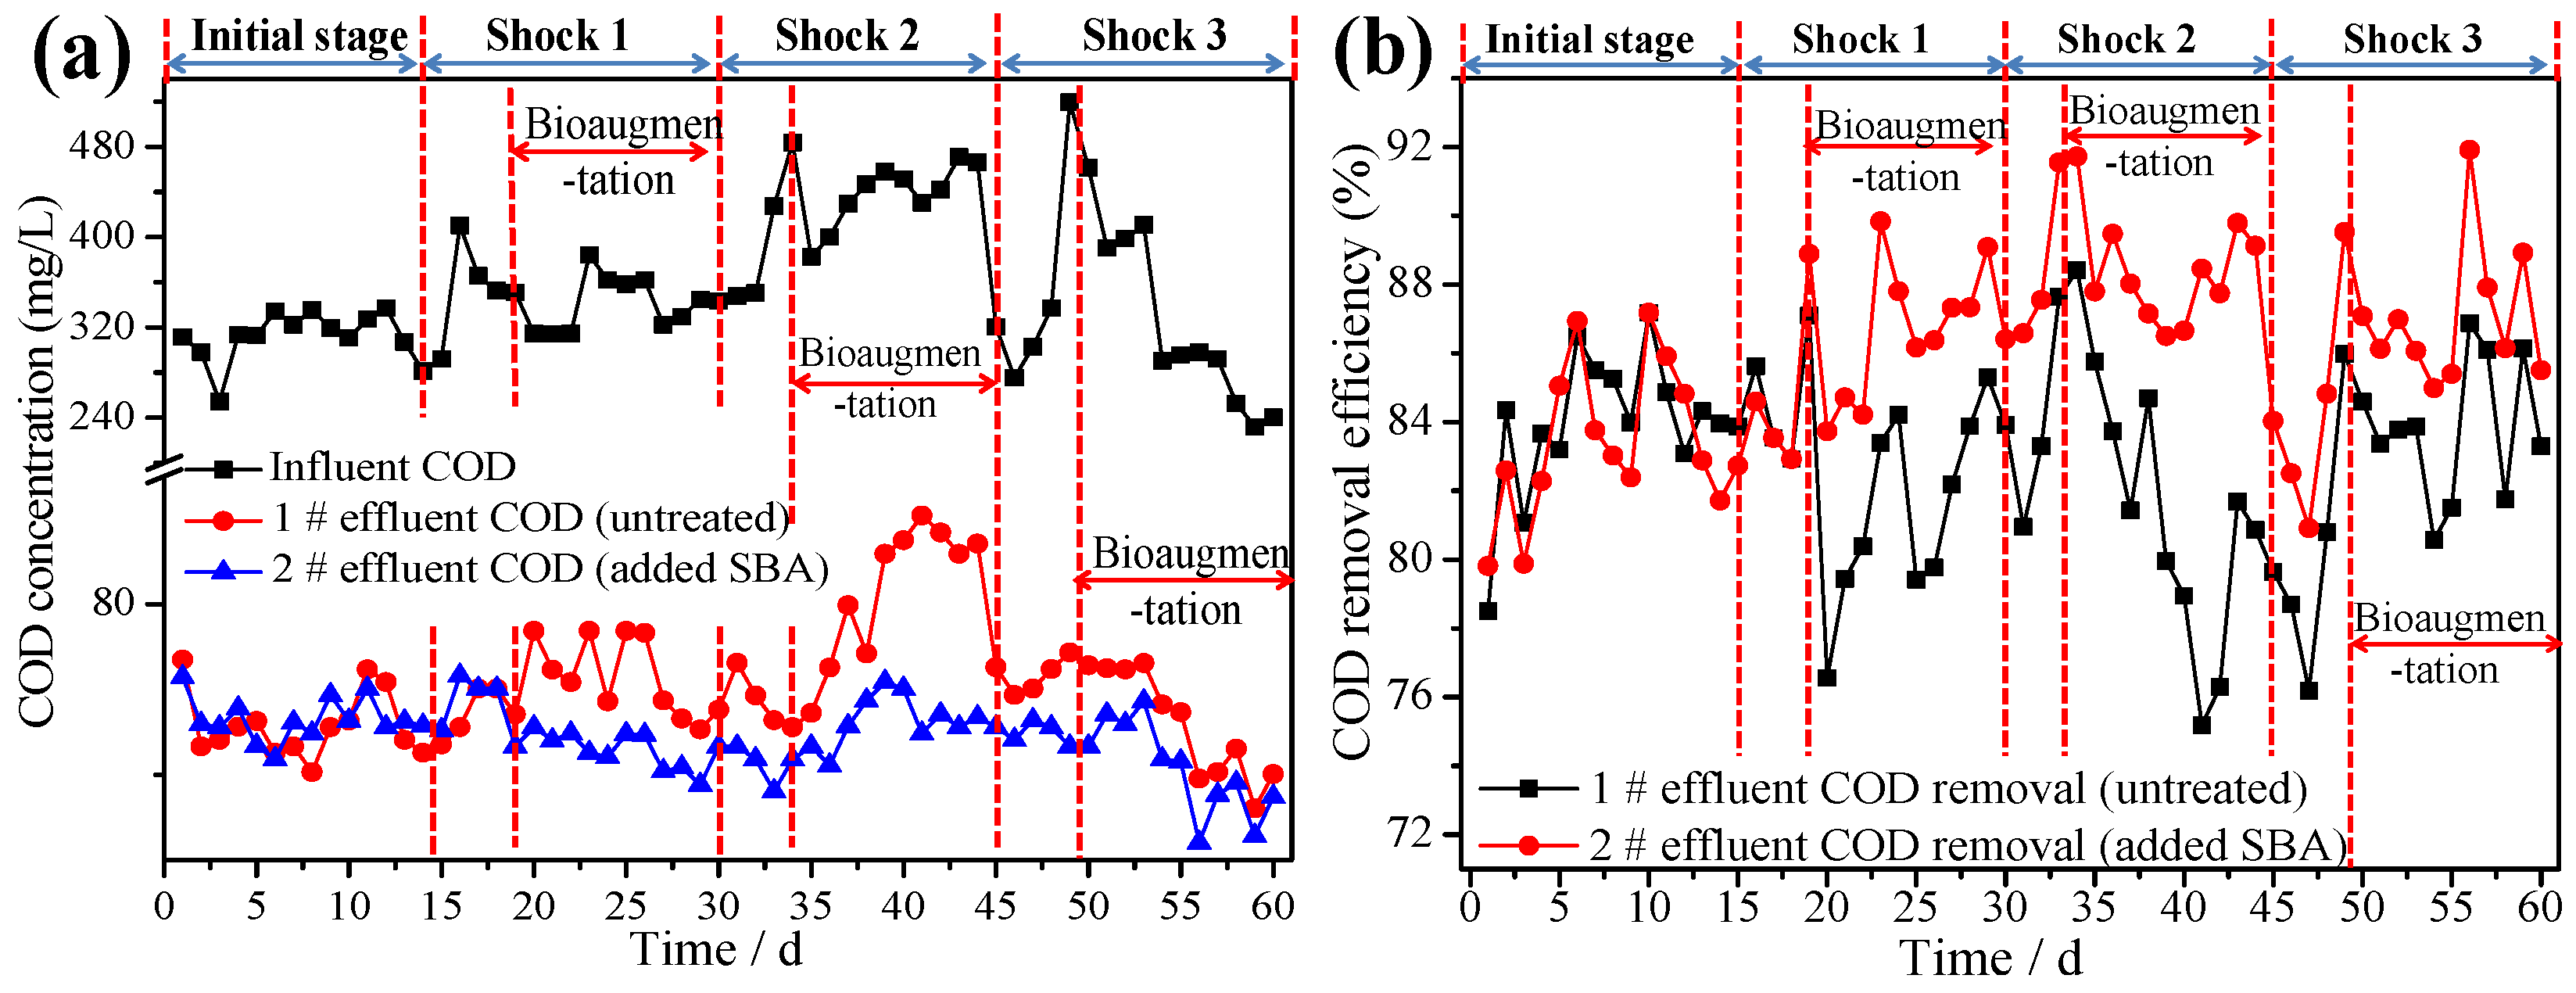
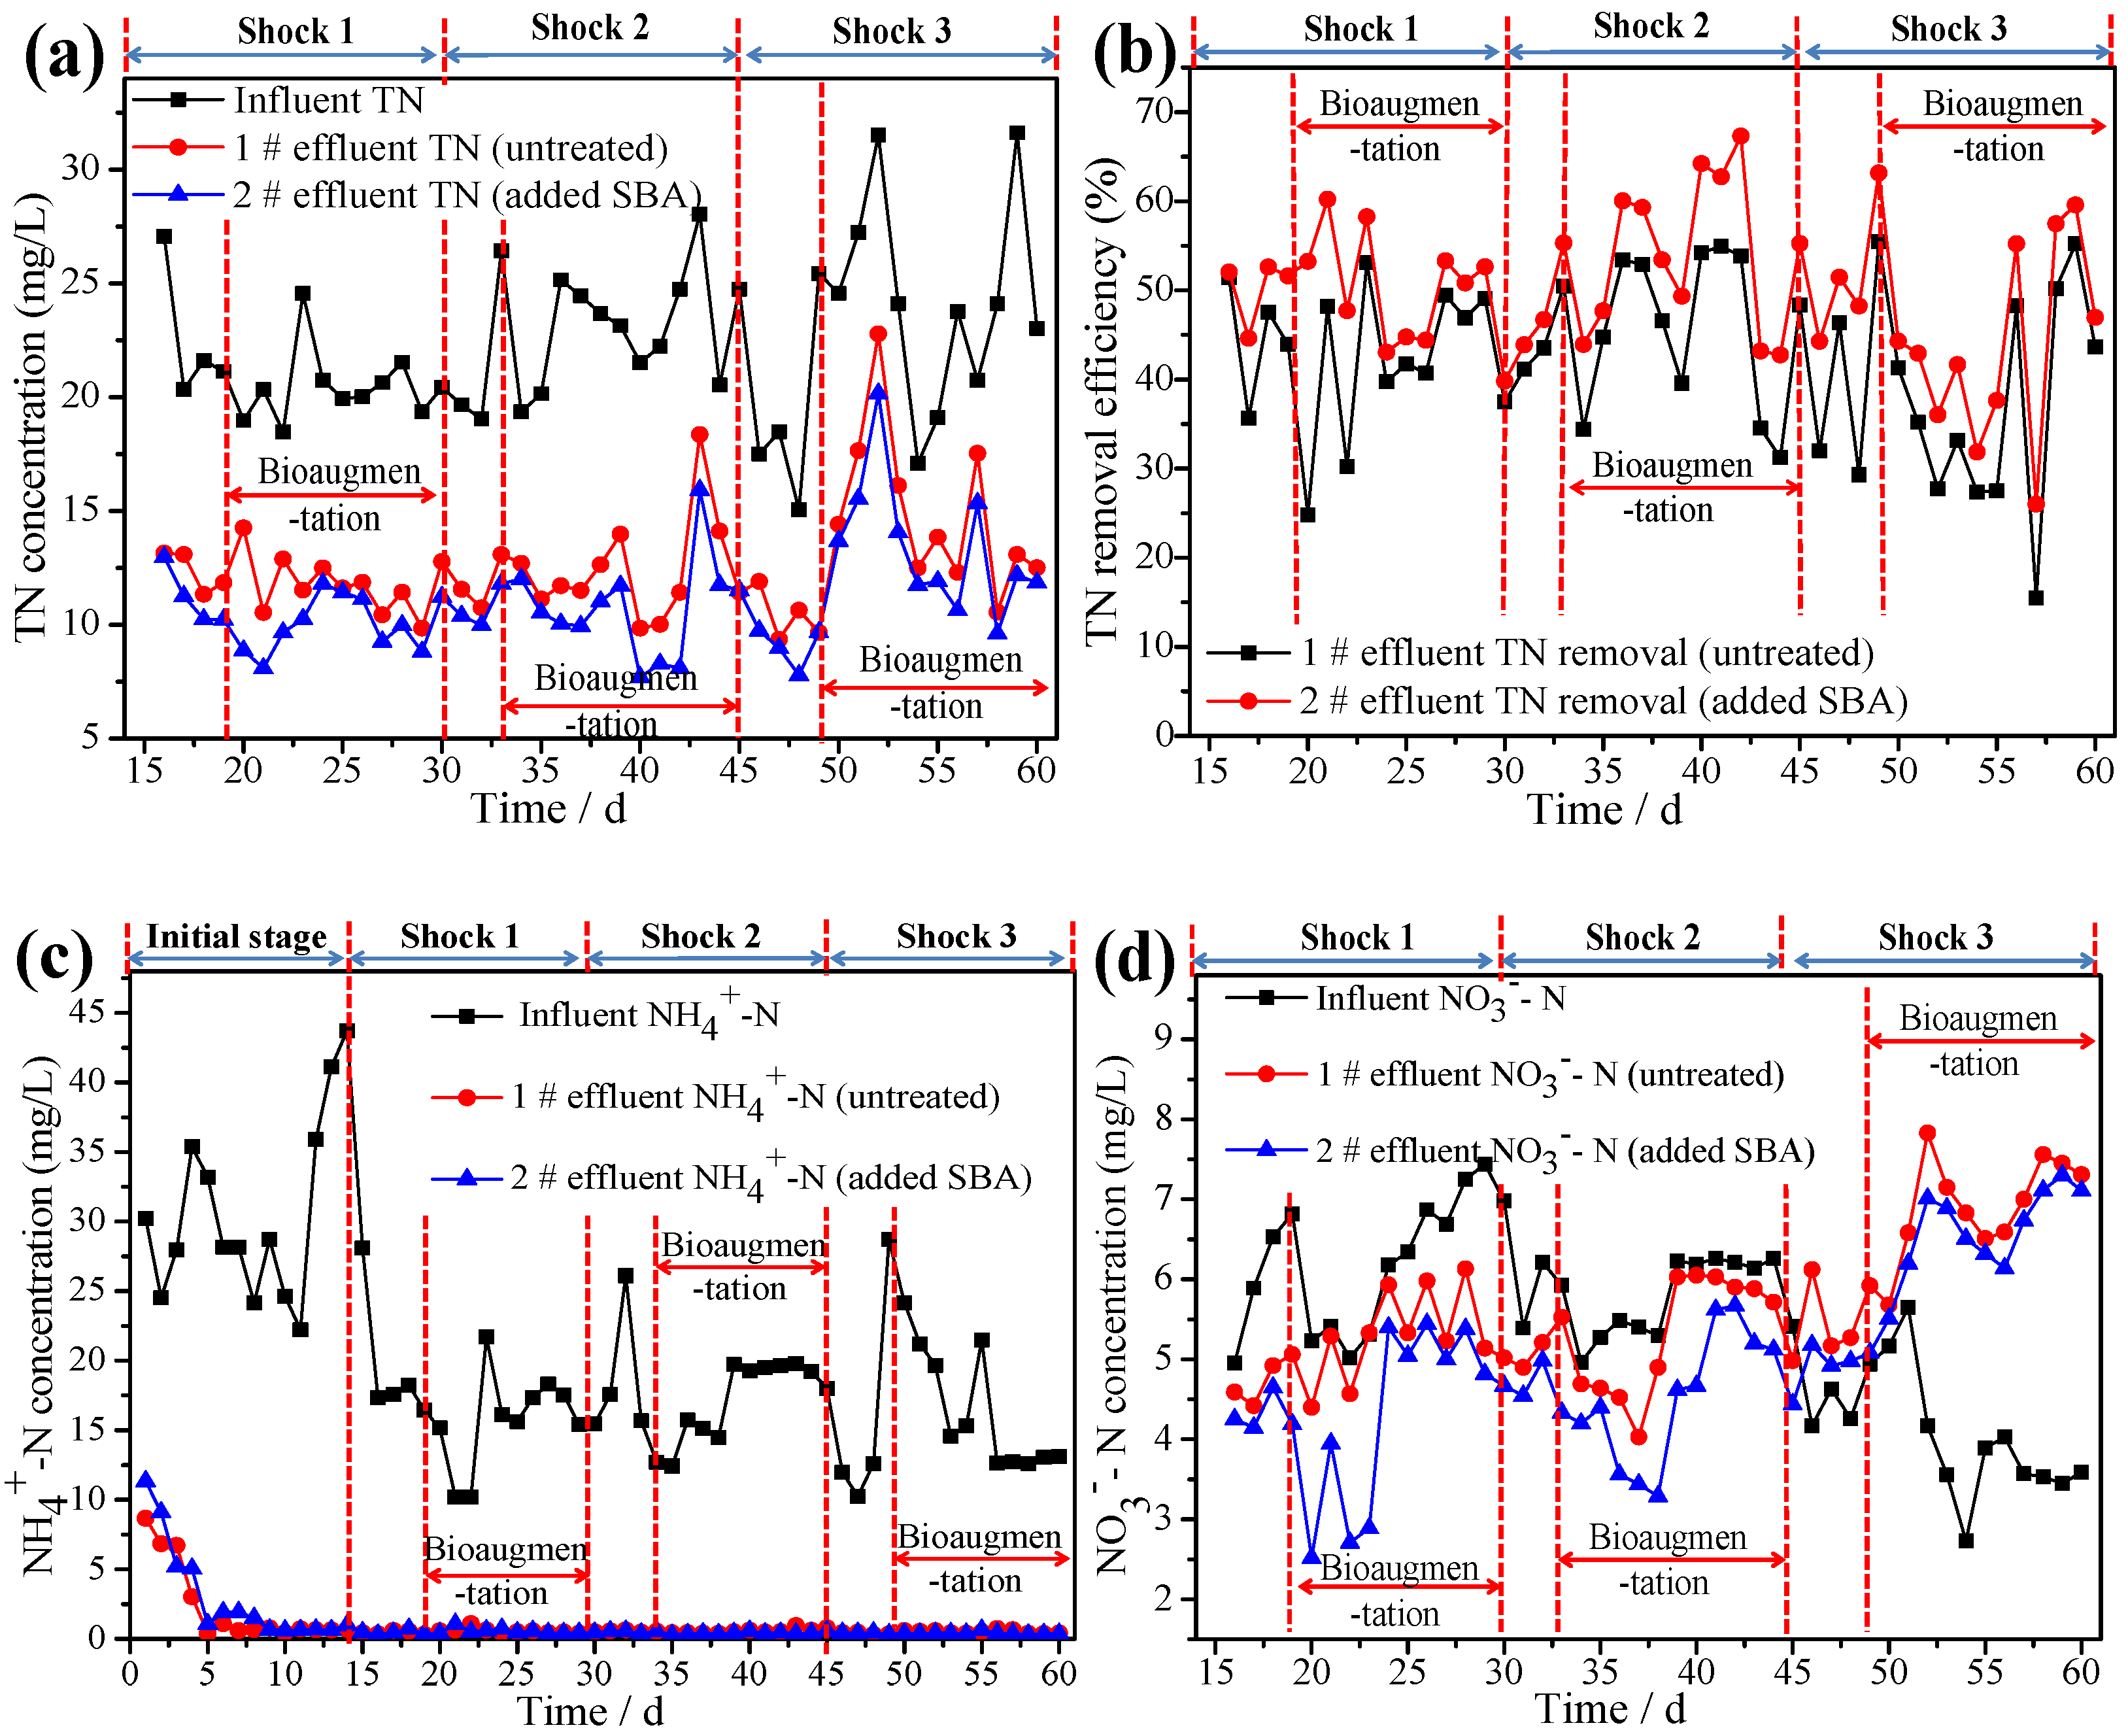
3.4. Reinforcing Effects of Bioaugmentation on ASSBRs Performance

In this study, the removal efficiency of COD and TN were investigated as indicators under HORW loading shocks 1, 2, and 3 to evaluate and verify the effectiveness of SBA (Figure 7 and Figure 8). When the two ASSBRs had been operating for 15 days under loading shock 1, compared with the initial HORW, the average influent COD and TN concentrations increased to 387.1 and 22.9 mg/L, respectively (Figure 7a and Figure 8a). With the prolongation of shock time, the average effluent COD and TN concentrations increased to 57.7 and 11.2 mg/L. These phenomena indicated that the two reactors had been shocked by the higher COD loading of HORW. A total of 0.2% of the SBA was added to reactor #2 at 19 days HRT, and reactor #1 was set as the control. After running the two reactors 2 weeks, the effluent quality continued to deteriorate and seriously exceeded the standard in reactor #1. This demonstrated that the high COD content of HORW had a significant inhibitory effect on microbial activity and ultimately led to poor effluent quality and unstable operation of the reactor. Finally, the concentrations of effluent COD and TN in reactor #1 were increased to 62.4 and 11.7 mg/L, respectively. Additionally, the concentrations of effluent NH4+-N and NO3-N were 0.6 and 5.2 mg/L (Figure 8c,d). These experimental phenomena showed that the dominant functional microorganisms for removing organic pollutions in the reactor changed with the increase in influent COD and TN concentrations. The dominant microbial communities transitioned from Hydrogenophilaceae to Burkholderiaceae, Ruminococcaceae, and Lachnospiraceae in wastewater and activated sludge (Figure 4). Ruminococcaceae and Burkholderiaceae play an important role in the degradation of organic pollution and denitrification of effluents [30,37]. The adjustment of microbial community structure weakened the performance of the reactor.
Compared to reactor #1, the concentrations of effluent COD, NH4+-N, NO3-N, and TN decreased to 47.7, 0.5, 4.5, and 10.5 mg/L, respectively, in reactor #2 (Figure 7a, Figure 8a,c,d), and the removal efficiency of COD and TN increased by 6.4% and 5.7% (Figure 7b and Figure 8b). Results showed that adding a certain amount of SBA to ASSBR could effectively shorten the recovery period of the reactor under the loading shock of high COD concentration HORW. Additionally, we also found that the organic pollutant concentration in reactor #2 effluent showed an obvious decreasing trend on the first day after the SBA was added, and this trend lasted for 8 days. This phenomenon further illustrated that a large number of COD-degrading bacteria and denitrifying bacteria were enriched and stimulated by the addition of SBA, strengthening the dominance of the functional microbial communities. The biomass concentration of Ruminococcaceae and Ruminiclostridium reached 1 × 10³ (Figure 5b), which played an important role in the degradation of COD [38]. Simultaneously, it appeared that the higher COD loading shock inhibited an increase in the diversity of nitrifiers and denitrifying bacteria [39]. Furthermore, the consumption or production of substrates or metabolic intermediates during nitrification and denitrification [40], thereby reducing microbial biomass, As a result, the effluent TN in reactor #1 continued to increase. In the meantime, reactor #2 could still maintain a low effluent TN for 7 days, which may be attributed to the fact that the SBA to some extent supplemented or even strengthened the reduced microbial biomass in reactor #2 and enhanced the shock resistance of the ASSBR.
From shock 1 to 2, the HORW without pretreatment was added to the influent of the two ASSBRs. As shown in Figure 7a, Figure 8a,c,d, the contents of COD, NH4+-N, NO3-N, and TN in influent suddenly increased to 526.7, 15.6, 5.6, and 28.7 mg/L, respectively, when the HRT reached 32–34 days. Then, the SBA was added at this time in the same operation and amount as shock 1, and the running process was operated for 15 days. Compared to shock 1, the contents of effluent COD, NO3-N, and TN in reactor #1 significantly increased to 74.9, 5.7, and 12.1 mg/L, respectively (Figure 7a, Figure 8a,d). The results showed that in the reactor subjected to the loading shock of high toxicity and high COD, the relative abundance of functional bacteria degrading organic pollutants decreased significantly (Figure 4b). Among them, the biomass concentration of Ruminococcaceae and Cloacibacterium decreased to 1 × 101 (Figure 5b), finally leading to failure of the reactor’s HORW treatment capacity. In addition, Figure 8c shows that the concentration of effluent NH4+-N (about 0.5 mg/L) in the two reactors was stable in the shock experiment phase, which was probably due to the achievement of near-complete nitrification with the NH4+-N removal efficiency of 97.5%. Nevertheless, compared to reactor #1, the effluent COD concentration in reactor #2 showed an obvious downtrend within 24 h after adding SBA. In the following 8 days, the reactor #2 effluent COD concentration was always maintained at 40–60 mg/L. These phenomena indicated that the biodegradation process was enhanced by the combination of bioaugmentation and bio-stimulation [41], improving the shock resistance and growth activity of microorganisms, and that the process of biodegradation of organic pollutants was effectively shortened.
By contrast, the contents of effluent COD, NO3-N, and TN in reactor #2 decreased by 22.4, 1.0, and 1.2 mg/L, respectively (Figure 7a, Figure 8a,d), and the removal efficiency of COD and TN increased to 91.3% and 78.5% (Figure 7b, Figure 8b). Although reactor #2 was also shocked, the SBA bioaugmentation effectively promoted the growth of Burkholderiaceae and Bacteroidaceae in activated sludge (Figure 4b). Bacteroidaceae is a well-known family of organic-degrading bacteria [42]. Meanwhile, the newly dominant bacteria may have had better adaptability to the corresponding environment, which was more conducive to the biodegradation of HORW. Additionally, these results also demonstrated that the shock resistance of the ASSBR was gradually enhanced and the original performance was restored within 7 to 8 days by the addition of SBA, and the effluent water quality still conformed to discharge standards [29].
To better investigate the shock 3 experiment, the two ASSBRs were self-recovered for 3 days to eliminate the difference in the operating environment generated by the reactors under loading shock 2. From shock 2 to 3, the flow rate of influent (L/day) in the two ASSBRs was increased by 1.5 times at 45 days HRT for 15 days. The influent COD concentration gradually increased from 280 mg/L to 520 mg/L with prolonged HRT (Figure 7a), and influent TN concentration increased from 14.6 mg/L to 31.4 mg/L (Figure 8a). When the HRT was at 49 days, added SBA in the reactor #2. The concentrations of effluent COD and TN in reactor #1 decreased to 50.1 and 14.2 mg/L, respectively. Compared to reactor #1, the concentrations of effluent COD and TN in reactor #2 decreased to 44.6 and 13.0 mg/L. The removal efficiency of COD and TN increased by 85.6% and 47.3%, respectively (Figure 7b, Figure 8b), indicating that the SBA could effectively improve the ASSBR ability to withstand fluctuations under high flow rate loading shock. However, after 7 days, the effluent COD concentration in the two reactors was almost the same, which may be because bioaugmentation has a limited period of efficacy when the ASSBRs are subjected to loading shocks of high COD, high toxicity, and high flow rate. Meanwhile, the effluent TN concentration increased to 1.5 times with the influent flow rate under the same operating conditions as COD, indicating that toxic and harmful substances in ASSBRs had become the main factor that hindered the growth and reproduction of denitrifying bacteria [41].
Additionally, we also found that the SVI decreased in the two reactors from the initial 26.3% to 15.4%, indicating that the activated sludge was continuously shocked by the high loading and high toxicity of the HORW, causing part of the activated sludge to become disintegrated and deactivated. Because the influent flow rate increased, the diversity of microbial communities decreased significantly and became more singular (Figure 8), which weakened the ability of microbes to assist each other in removing organic pollutions. This further led to the effluent NO3-N concentration (4.2 mg/L and 6.5 mg/L) in the two reactors becoming higher than that of the influent (3.5 mg/L). In summary, the ability of the ASSBR to self-recover would be weakened or even disappear under the continuous shock from the high flow rate HORW. By contrast, adding a certain amount of SBA yielded excellent mitigation capacity in the case of loading shock, allowing the reactors to operate steadily and efficiently. Moreover, these results also showed that the mixed bacteria BY2 and BN3 had stronger viability in high loading shock environments because of interspecific cooperation. Therefore, exogenous mixed microorganisms are suitable as bioaugmentation agents to enhance the effect of HORW treatment.

4. Conclusions

A green and practical bioaugmentation technology was investigated and evaluated by using an industrial-scale ASSBR system. We constructed green and efficient solid biological agents, and the optimal formulation of SBA was as follows: the ratio and addition of mixed bacteria BY2 and BN3 were 3:1 and 3.0%, respectively, and the glucose concentration was 5.0 mg/L. The combination of bioaugmentation agents and ASSBR systems effectively prevented the reactors from being affected by high HORW loading shock for 15 days, and the average removal efficiency of COD and TN reached 86% and 55% within 15 days, respectively. The results of sequencing showed that the diversity of the microbial community decreased gradually during the loading shock process. Proteobacteria, Firmicutes, and Bacteroidetes always maintained a high level of abundance. The current research results can provide a theoretical basis and technical support for evaluating the impact of HORW loading shocks on biological treatment systems, which would be beneficial in facilitating reasonable preventive measures to decrease the adverse effects on bioreactor performance.

Supplementary Materials

The following are available online at https://www.mdpi.com/article/10.3390/w13202822/s1, Figure S1: The morphological features of functional bacteria: (a) Brucella sp. (BN3); (b) Bacillus subtills (BY2), Figure S2: Changes of pH in the two ASSBRs during the whole experiment run, Table S1: The two ASSBRs’ process operating schedule, Table S2: Water samples were collected from different positions in the two ASSBRs.

Author Contributions

Conceptualization, Z.Z. and K.G.; methodology, Q.M. and K.C.; validation, Y.M.; investigation, Q.X. and X.S.; data curation, G.S. and Z.Z.; writing—original draft preparation, K.C.; writing—review and editing, K.G. and Y.M. All authors have read and agreed to the published version of the manuscript.

Funding

This research received no external funding.

Institutional Review Board Statement

Not applicable.

Informed Consent Statement

Informed consent was obtained from all subjects involved in the study.

Data Availability Statement

Not applicable.

Acknowledgments

This research was financially supported by the National Natural Science 654 Foundation of China (No. 51634008), National Key R&D Programs of China (2020YFD1100500), Natural Science Foundation of Shaanxi Province (No. 656 2021JQ-012), and China Postdoctoral Science Foundation General Project (No. 657 2020M683502).

Conflicts of Interest

The authors declare that they have no conflict of interest.

References

  1. Dong, H.H.; Jiang, X.Y.; Sun, S.S.; Fang, L.; Wang, W.; Cui, K.; Zhang, Z.Z.; Fu, P.C. A cascade of a denitrification bioreactor and anaerobic biofilm reactor for heavy oil refinery wastewater treatment. RSC. Adv. 2019, 6, 7495. [Google Scholar] [CrossRef] [Green Version]
  2. Zhuang, H.F.; Han, H.J.; Shan, S.D. Treatment of real coal gasification wastewater using a novel integrated system of anoxic hybrid two-stage aerobic processes: Performance and the role of pure oxygen microbubble. Environ. Sci. Pollut. Res. 2016, 23, 11916. [Google Scholar] [CrossRef]
  3. Li, S.Y.; Fei, X.N.; Cao, L.Y.; Chi, Y.Z. Insights into the effects of carbon source on sequencing batch reactors: Performance, quorum sensing, and microbial community. Sci. Total Environ. 2019, 691, 799–809. [Google Scholar] [CrossRef]
  4. Jaramillo, F.; Orchard, M.; Muñoz, C.; Zamorano, M.; Antileo, C. Advanced strategies to improve nitrification process in sequencing batch reactors—A review. J. Environ. Manag. 2018, 218, 154–164. [Google Scholar] [CrossRef]
  5. Trelles, I.J.; Mahamud, M.M.; Lavín, A.G.; Díaz, M. Sludge settling prediction in sequencing batch reactor plants. J. Clean. Prod. 2017, 152, 115–124. [Google Scholar] [CrossRef]
  6. Ketheesan, B.; Stuckey, D.C. Effects of hydraulic/organic shock/transient loads in anaerobic wastewater treatment: A review. Crit. Rev. Environ. Sci. Technol. 2015, 45, 2693–2727. [Google Scholar] [CrossRef]
  7. Steinberg, L.M.; Regan, J.M. Response of lab-scale methanogenic reactors inoculated from different sources to organic loading rate shocks. Bioresour. Technol. 2011, 102, 8790–8798. [Google Scholar] [CrossRef] [PubMed]
  8. Chen, K.; Ji, F.; Yuan, S.J.; Hao, W.T.; Wang, W.; Hu, Z.H. The performance of activated sludge exposed to arsanilic acid amprolium hydrochloride in sequencing batch reactors. Int. Biodeter. Biodegr. 2017, 116, 260–265. [Google Scholar] [CrossRef] [Green Version]
  9. Ma, Q.; Qu, Y.; Zhang, X.; Liu, Z.; Li, H.; Zhang, Z.; Wang, J.; Shen, W.; Zhou, J. Systematic investigation and microbial community profile of indole degradation processes in two aerobic activated sludge systems. Sci. Rep. 2015, 5, 17674. [Google Scholar] [CrossRef]
  10. Sarkar, P.; Roy, A.; Pal, S.; Mohapatra, B.; Kazy, S.K.; Maiti, M.K.; Sar, P. Enrichment and characterization of hydrocarbon-degrading bacteria from petroleum refinery waste as potent bioaugmentation agent for in situ bioremediation. Bioresour. Technol. 2017, 242, 15–27. [Google Scholar] [CrossRef] [PubMed]
  11. Christou, M.L.; Vasileiadis, S.; Angelidaki, I.; Kotsopoulos, T.A. Effects of organic loading rate and hydraulic retention time on bioaugmentation performance to tackle ammonia inhibition in anaerobic digestion. Bioresour. Technol. 2020, 334, 125246. [Google Scholar] [CrossRef]
  12. Nzila, A. Mini review: Update on bioaugmentation in anaerobic processes for biogas production. Anaerobe 2017, 46, 3–12. [Google Scholar] [CrossRef]
  13. Germany, S.; Favier, L.; Djelal, H.; Taha, S.; Amrane, A. Bioaugmentation: Possible solution in the treatment of bio-Refractory organic compounds (Bio-ROCs). Biochem. Eng. J. 2012, 69, 75–86. [Google Scholar]
  14. Ma, F.; Guo, J.; Zhao, L.; Chang, C.; Cui, D. Application of bioaugmentation to improve the activated sludge system into the contact oxidation system treating petrochemical wastewater. Bioresour. Technol. 2009, 100, 597–602. [Google Scholar] [CrossRef] [PubMed]
  15. Onyia, C.O.; Uyu, A.M.; Akunna, J.C.; Norulaini, N.A.; Omar, A. Increasing the fertilizer value of palm oil mill sludge: Bioaugmentation in nitrification. Water Sci. Technol. 2001, 44, 157–162. [Google Scholar] [PubMed]
  16. Raper, E.; Stephenson, T.; Anderson, D.R.; Fisher, R.; Soares, A. Industrial wastewater treatment through bioaugmentation. Process Saf. Environ. 2018, 118, 178–187. [Google Scholar] [CrossRef] [Green Version]
  17. Wang, C.; Liu, Y.; Wang, C.; Xing, B.; Zhu, S.; Huang, J.; Xu, X.; Zhu, L. Biochar facilitates rapid restoration of methanogenesis by enhancing direct interspecies electron transfer after high organic loading shock. Bioresour. Technol. 2021, 320, 124360. [Google Scholar] [CrossRef]
  18. Cao, W.Z.; Wang, H.R.; Zeng, J.P.; Zhu, Y.; Lu, A.H.; Wang, C.Q. An experimental study on bioreduction of Fe3+ in montmorillonite by Cronobacter Sakazakii. Bull. Mineral. Petrol. Geochem. 2015, 34, 974–980. [Google Scholar]
  19. Huang, L.; Jiang, X.Y.; Xu, Q.S.; Zhang, Z.Z. Screening of efficient degradation bacteria for organic pollutants and their application in petroleum refinery wastewater treatment. Chem. Bioeng. 2018, 10, 44–48. [Google Scholar]
  20. APHA; AWWA; WEF. Standard Methods for the Examination of Water and Wastewater, 22nd ed.; American Public Health Association (APHA): Washington, DC, USA, 2012; p. 1360. [Google Scholar]
  21. Yuan, Y.; Yu, Y.; Xi, H.B.; Zhou, Y.X.; He, X.W. Comparison of four test methods for toxicity evaluation of typical toxicants in petrochemical wastewater on activated sludge. Sci. Total Environ. 2019, 685, 273–279. [Google Scholar] [CrossRef]
  22. Gupta, P.; Sreekrishnan, T.R.; Ahammad, S. Role of sludge volume index in anaerobic sludge granulation in a hybrid anaerobic reactor. Chem. Eng. J. 2016, 283, 338–350. [Google Scholar] [CrossRef]
  23. He, S.; Chen, Y.; Qin, M.; Mao, Z.; Yuan, L.; Niu, Q.; Tan, X. Effects of temperature on anammox performance and community structure. Bioresour. Technol. 2018, 260, 186–195. [Google Scholar] [CrossRef]
  24. Caporaso, J.G.; Kuczynski, J.; Stombaugh, J.; Bittinger, K.; Bushman, F.D.; Costello, E.K.; Fierer, N.; Peña, A.G.; Goodrich, J.K.; Gordon, J.I.; et al. QIIME allows analysis of high-throughput community sequencing data. Nat. Methods 2010, 7, 335–336. [Google Scholar] [CrossRef] [PubMed] [Green Version]
  25. Yanto, D.H.Y.; Hidayat, A.; Tachibana, A. Periodical biostimulation with nutrient addition and bioaugmentation using mixed fungal cultures to maintain enzymatic oxidation during extended bioremediation of oily soil microcosms. Int. Biodeter. Biodegr. 2017, 116, 112–123. [Google Scholar] [CrossRef]
  26. Zhou, J.; Li, H.S.; Chen, X.L.; Wan, D.J.; Mai, W.N.; Sun, C.Q. Cometabolic degradation of low-strength coking wastewater and the bacterial community revealed by high-throughput sequencing. Bioresour. Technol. 2017, 245, 379–385. [Google Scholar] [CrossRef] [PubMed]
  27. Oberoi, A.S.; Huang, H.Q.; Khanal, S.K.; Sun, L.P.; Lu, H. Electron distribution in sulfur-driven autotrophic denitrification under different electron donor and acceptor feeding schemes. Chem. Eng. J. 2020, 404, 126486. [Google Scholar] [CrossRef]
  28. Hosseinlou, D. Determination of design loading rates for simultaneous anaerobic oxidation/partial nitrification-denitrification process and application in treating dairy industry effluent. J. Environ. Chem. Eng. 2021, 9, 105176. [Google Scholar] [CrossRef]
  29. Li, J.; Sun, S.; Yan, P.; Fang, L.; Yu, Y.; Xiang, Y.; Wang, D.; Gong, Y.; Gong, Y.; Zhang, Z. Microbial communities in the functional areas of a biofilm reactor with anaerobic–aerobic process for oily wastewater treatment. Bioresour. Technol. 2017, 238, 7–15. [Google Scholar] [CrossRef] [PubMed]
  30. Hu, B.; Quan, J.; Huang, K.; Zhao, J.; Xing, G.; Wu, P.; Chen, Y.; Ding, X.; Hu, Y. Effects of C/N ratio and dissolved oxygen on aerobic denitrification process: A mathematical modeling study. Chemosphere 2021, 272, 129521. [Google Scholar] [CrossRef] [PubMed]
  31. Guo, Q.; Hu, H.Y.; Shi, Z.J.; Yang, C.C.; Li, P.; Huang, M.; Ni, W.-M.; Shi, M.-L.; Jin, R.-C. Towards simultaneously removing nitrogen and sulfur by a novel process: Anammox and autotrophic desulfurization-denitrification (AADD). Chem. Eng. J. 2016, 297, 207–216. [Google Scholar] [CrossRef]
  32. Yi, X.H.; Wan, J.; Ma, Y.; Wang, Y. Characteristics and dominant microbial community structure of granular sludge under the simultaneous denitrification and methanogenesis process. Biochem. Eng. J. 2016, 107, 66–74. [Google Scholar] [CrossRef]
  33. Ma, F.; Sun, Y.; Li, A.; Zhang, X.; Yang, J. Activation of accumulated nitrite reduction by immobilized Pseudomonas stutzeri T13 during aerobic denitrification. Bioresour. Technol. 2015, 187, 30–36. [Google Scholar] [CrossRef]
  34. He, Y.; Tian, Z.; Luan, X.; Han, Z.; Zhang, Y.; Yang, M. Recovery of biological wastewater treatment system inhibited by oxytetracycline: Rebound of functional bacterial population and the impact of adsorbed oxytetracycline on antibiotic resistance. Chem. Eng. J. 2021, 418, 129364. [Google Scholar] [CrossRef]
  35. Lian, S.; Qu, Y.; Li, S.; Zhang, Z.; Zhang, H.; Dai, C.; Deng, Y. Interaction of graphene-family nanomaterials with microbial communities in sequential batch reactors revealed by high-throughput sequencing. Environ. Res. 2020, 184, 109392. [Google Scholar] [CrossRef]
  36. Dong, H.; Wang, W.; Song, Z.; Dong, H.; Wang, J.; Sun, S.; Zhang, Z.; Ke, M.; Zhang, Z.; Wu, W.M.; et al. A high-efficiency denitrification bioreactor for the treatment of acrylonitrile wastewater using waterborne polyurethane immobilized activated sludge. Bioresour. Technol. 2017, 239, 472–481. [Google Scholar] [CrossRef]
  37. Huang, X.Q.; Liu, L.L.; Zhao, J.; Zhang, J.B.; Cai, Z.C. The families Ruminococcaceae, Lachnospiraceae, and Clostridiaceae are the dominant bacterial groups during reductive soil disinfestation with incorporated plant residues. Appl. Soil. Ecol. 2019, 135, 65–72. [Google Scholar] [CrossRef]
  38. Zhang, Y.; Wu, R.R.; Zhang, Y.M.; Li, R.D.; Wang, G.; Li, K.M. Impact of nutrient addition on diversity and fate of fecal bacteria. Sci. Total Environ. 2018, 636, 717–726. [Google Scholar] [CrossRef] [PubMed]
  39. Zhang, Y.; Yu, Z.; Hu, Y.; Song, C.; Li, F.; He, W.; Wang, X.; Li, Z.; Lin, H. Immobilization of nitrifying bacteria in magnetic PVA–SA-diatomite carrier for efficient removal of NH4+-N from effluents. Environ. Technol. Innov. 2021, 22, 101407. [Google Scholar] [CrossRef]
  40. Wang, M.M.; Cao, G.; Feng, N.X.; Pan, Y.Z. Bioaugmentation of two-stage aerobic sequencing batch reactor with mixed strains for high nitrate-nitrogen wastewater treatment. Chin. J. Chem. Eng. 2020, 28, 3103–3109. [Google Scholar] [CrossRef]
  41. Cai, J.; Zheng, P.; Qaisar, M. Simultaneous sulfide and nitrate removal in anaerobic reactor under shock loading. Bioresour. Technol. 2009, 100, 3010–3014. [Google Scholar]
  42. Martínez-Pachón, D.; Echeverry-Gallego, R.A.; Serna-Galvis, E.A.; Villarreal, J.M.; Botero-Coy, A.M.; Hernández, F.; Torres-Palma, R.A.; Moncayo-Lasso, A. Treatment of wastewater effluents from Bogotá—Colombia by the photo-electro-Fenton process: Elimination of bacteria and pharmaceutical. Sci. Total Environ. 2021, 772, 144890. [Google Scholar] [CrossRef]
Figure 1. Schematic diagram of the process of heavy oil refinery wastewater treatment.
Water 13 02822 g001
Figure 2. A simple schematic diagram of the biotreatment of the HORW in an actual industrial-scale ASSBR. (1) ASSBR influent intermediate buffer tank, (2) ASSBR effluent intermediate buffer tank, (3) pump, (4) electronic mixer, (5) solenoid valve, (6) control center, (7) air compression pump.
Water 13 02822 g002
Figure 3. Construction and optimization of SBA and its effect on the treatment of simulated HORW.
Water 13 02822 g003
Figure 4. Analysis of the richness and regularities of microbial communities at the family level in all samples. (a) Normal operating conditions, (b) under different patterns of HORW loading shock.
Water 13 02822 g004
Figure 5. Phylogenetic analysis of bacterial populations in samples at phylum (a) and genus levels (b) under different patterns of HORW loading shock. (TW.1, TW.2, TW.3, TW.4, YW.1, and YW.2 were derived from the ASSBR #2 wastewater; TS.1, TS.2, TS.3, TS.4, YS.1, and YS.2 were derived from the ASSBR #2 activated sludge.).
Water 13 02822 g005
Figure 6. Imilarities and differences of microbial communities in water samples. (a) Venn diagram of the microbial community in samples TW.1, TW.4, and YW.1. (b) Venn diagram of the microbial community in samples TS.1, TS.4, and YS.1. (c) Phylum-level classification of the mutual OTUs in wastewater. (d) Phylum-level classification of the mutual OTUs in activated sludge.
Water 13 02822 g006
Figure 7. The changes in content and removal efficiency of COD in the effluent and influent under different patterns of HORW loading shock. (a) Changes in COD concentration, (b) changes in COD removal efficiency.
Water 13 02822 g007
Figure 8. Changes in effluent and influent TN content and removal efficiency under different patterns of HORW loading shock. (a) Changes in TN concentration, (b) changes in TN removal efficiency, (c) changes in NH4+-N concentration, (d) changes in NO3-N concentration.
Water 13 02822 g008
Table 1. The design scheme of ASSBR loading shock tests.
Loading Shock PatternASSBR NumberInfluent SourceInfluent
Toxicity Level
Added SBARunning Time (d)Influent
Characteristics
Initial stage#1Primary
ABR effluent
LowUntreated15Normal COD
(55 mg/L)
#2Primary
ABR effluent
Low0.2%15Normal COD
(55 mg/L)
Shock 1#1SDAF effluentMediumUntreated15High COD
(400 mg/L)
#2SDAF effluentMedium0.2%15High COD
(400 mg/L)
Shock 2#1COP
effluent
HeavyUntreated15High COD
+high toxicity
(800 mg/L)
#2COP
effluent
Heavy0.2%15High COD
+high toxicity
(800 mg/L)
Shock 3#11.5 times COP
effluent
HighUntreated15High flow rate
(22.5 L/h)
#21.5 times COP
effluent
High0.2%15High flow rate
(22.5 L/h)
Note: The biological toxicity of simulated HORW is divided into five grades, namely, higher (killing of all microorganisms), high (killing of 80% of microorganisms), heavy (killing of 50% of microorganisms), medium (killing of 30% of microorganisms), and low toxicity (killing of 10% of microorganisms). SDAF, Secondary dissolved air flotation; COP, crude oil pretreatment. The normal influent flow rate was 15 L/h.
Table 2. Effect of different glucose concentrations and mixed functional bacteria (BY2 and BN3) on the biodegradability of simulated HORW.
Sample NumberCOD (mg/L)
(0 h)
BOD5 (mg/L)B/CCOD (mg/L)
(5 d)
COD Removal Efficiency (%)
Blank93.3125.650.2766.3128.95
BY2 + 0 mg/L glucose93.3155.250.5965.2330.09
BY2 + 5 mg/L glucose100.0862.000.6264.7535.30
BY2 + 10 mg/L glucose106.4554.290.5172.3032.08
BY2 + 15 mg/L glucose112.4535.850.3281.8027.26
BY2 + 20 mg/L glucose122.6429.050.2470.0526.88
Blank93.3125.650.2766.3028.95
BN3 + 0 mg/L glucose93.3132.200.3580.1014.16
BN3 + 5 mg/L glucose100.0840.100.4085.6029.76
BN3 + 10 mg/L glucose106.4535.600.3390.1015.36
BN3 + 15 mg/L glucose112.4532.610.2997.9812.87
BN3 + 20 mg/L glucose122.6424.060.20100.0811.07
Note: The amount of microbial liquid added was 1.0% (v/v). The concentration of the bacteria in SBA was 0.42%.
Table 3. The microbial richness and diversity indices of all samples.
SamplesExperimental StageOUTsShannonSimpsonChao1ACEGood’s Coverage
W3.1Initial stage
(ASSBR #1)
7806.9380.976850.678862.9890.995
W3.27946.5560.9561658.7941045.3690.991
W4.18186.9560.9761074.0791020.8770.992
W4.27867.1480.981865.813873.860.995
S3.1Initial stage
(ASSBR #2)
9387.4390.974997.692980.3630.997
S3.214178.9720.9951478.5461469.6950.996
S4.18497.0280.974983.384981.7890.994
S4.28266.3590.944955.412953.9480.994
TW.1Shock 1
(ASSBR #2)
8997.2230.9741043.8271031.8560.994
TW.28657.5510.986944.138949.4430.995
TS.15924.8660.89711.087749.6990.994
TS.26596.5030.947738.222712.0840.997
TW.3Shock 2
(ASSBR #2)
8046.7350.962963.725932.6420.994
TW.48537.1970.981004.2081021.5590.993
TS.35056.980.977594.062572.9490.997
TS.45485.2320.924640.158607.6930.996
YW.1Shock 3
(ASSBR #2)
6726.6660.968723.663733.410.997
YW.26896.3750.955740.528765.9320.996
YS.14075.3450.949530.051543.070.996
YS.24395.4950.949514.333549.4550.996
Note: ACE refers to the index of the OTUs number in the microbial community. Chao 1 is the coefficient of the index that estimates the OTUs number in the community. Simpson is the index of microbial diversity. Shannon represents the richness and evenness of the microbial community. W3.1 and W3.2 were derived from the ASSBR #1 wastewater; S3.1 and S3.2 were derived from the ASSBR #1 activated sludge; W4.1, W4.2, TW.1, TW.2, TW.3, TW.4, YW.1, and YW.2 were derived from the ASSBR #2 wastewater; S4.1, S4.2, TS.1, TS.2, TS.3, TS.4, YS.1, and YS.2 were derived from the ASSBR #2 activated sludge.
Publisher’s Note: MDPI stays neutral with regard to jurisdictional claims in published maps and institutional affiliations.

