
Evaluation of Microbial Communities of Bottled Mineral Waters and Preliminary Traceability Analysis Using NGS Microbial Fingerprints

 , , , , ,
  , and
, and 
Abstract
:1. Introduction
2. Materials and Methods
2.1. Sample Collection and Experimental Design
2.2. Storage Evaluation
2.2.1. Method Selection for the Enumeration of Culturable Microorganisms
2.2.2. DNA Extraction, Amplification and Sanger Sequencing
2.2.3. Next-Generation Sequencing Using Illumina MiSeq and Data Analysis
2.2.4. Physical and Chemical Analysis
2.3. Data Analysis
3. Results and Discussion
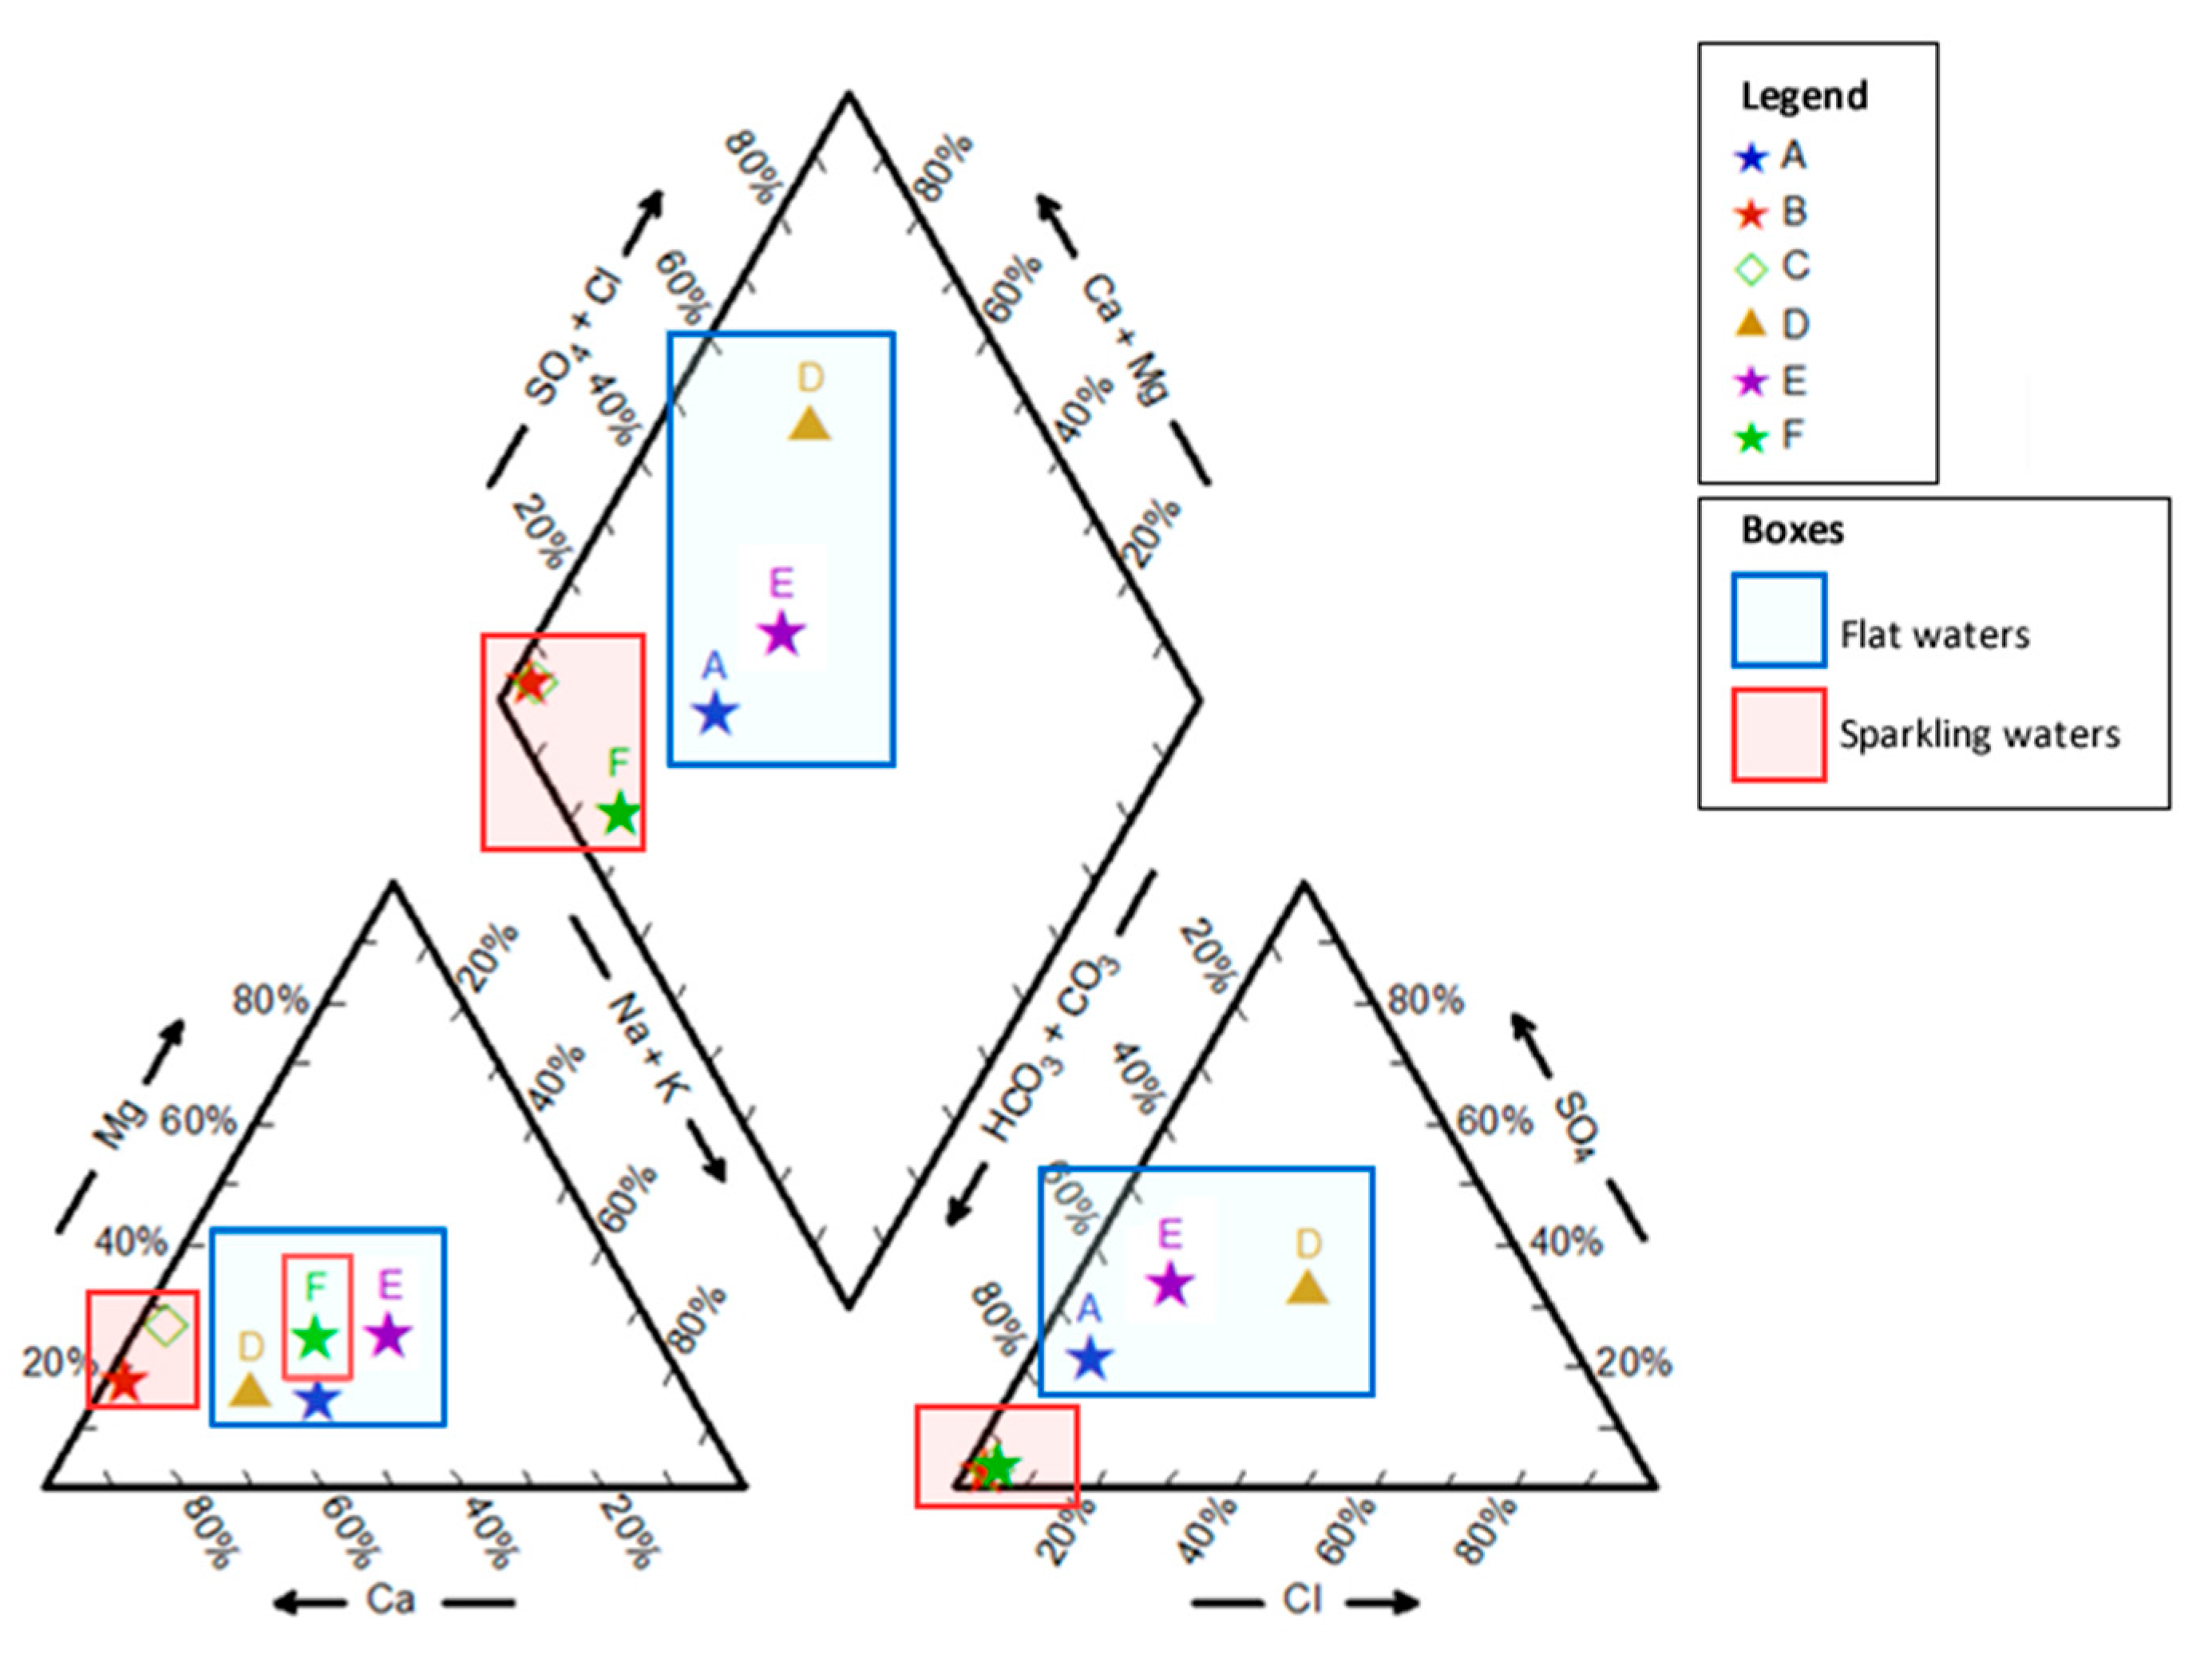
3.1. Physical and Chemical Characterization
3.2. Selection of Microbiological Method
3.3. Bottled Water Storage Evaluation
3.3.1. Microbiological Analysis
3.3.2. Characterization of Isolated Microorganisms
3.4. Next-Generation Sequencing Analysis
3.4.1. Comparison between Sanger Sequencing of Cultivated Bacteria and NGS Results
3.4.2. Comparison with Similar Studies
3.4.3. Definition of Fingerprints for Water Traceability
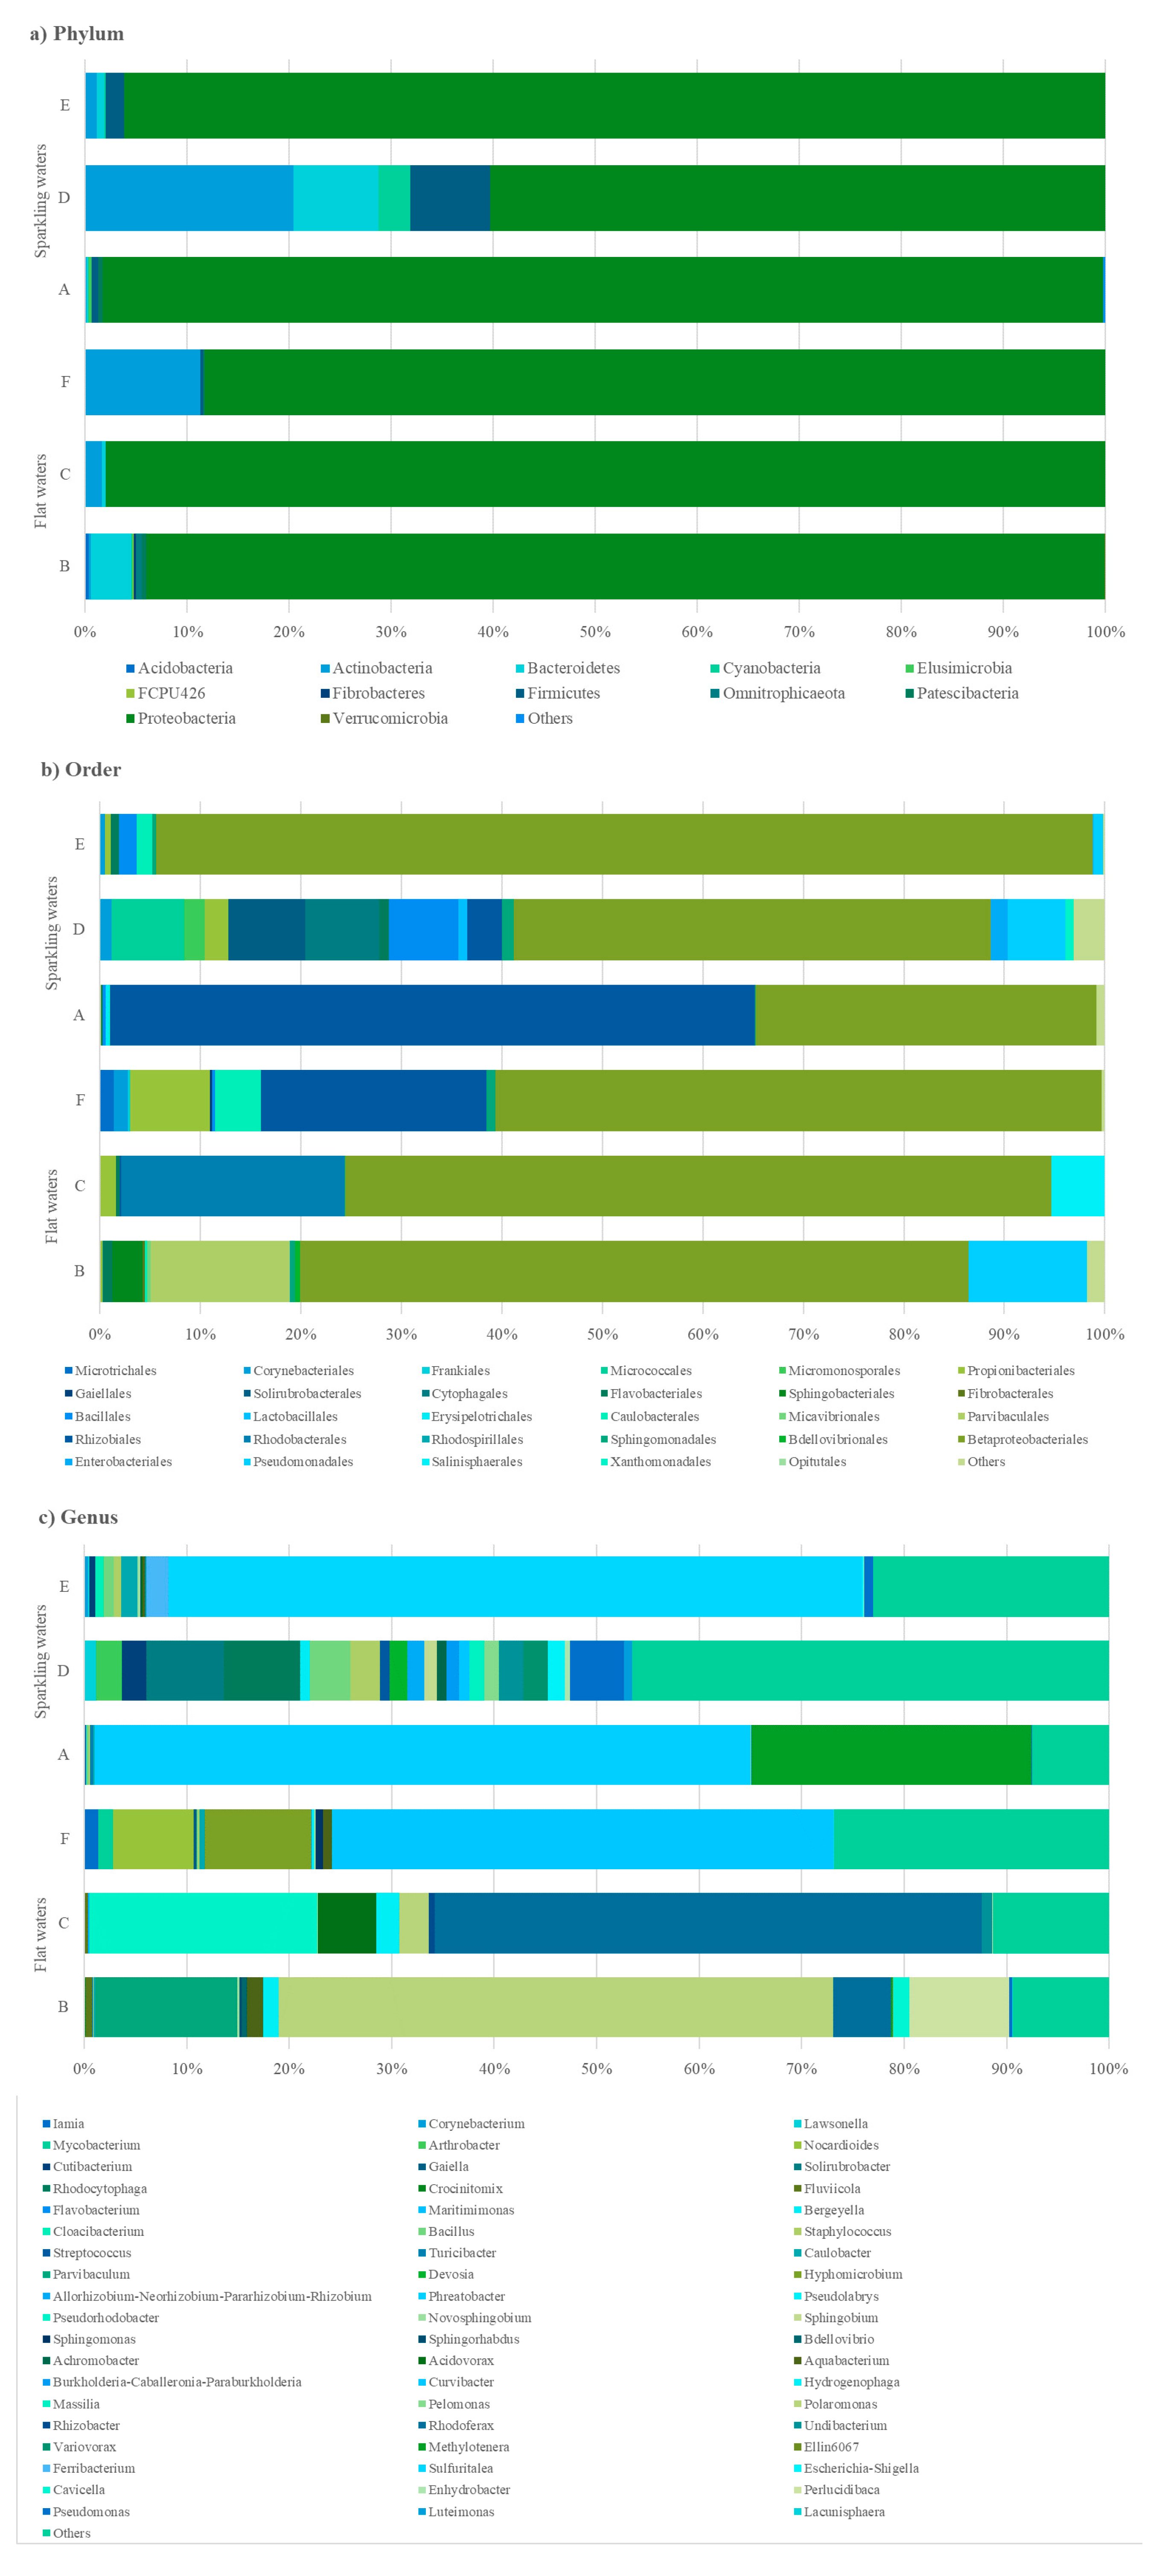
3.5. Metagenomic Analysis
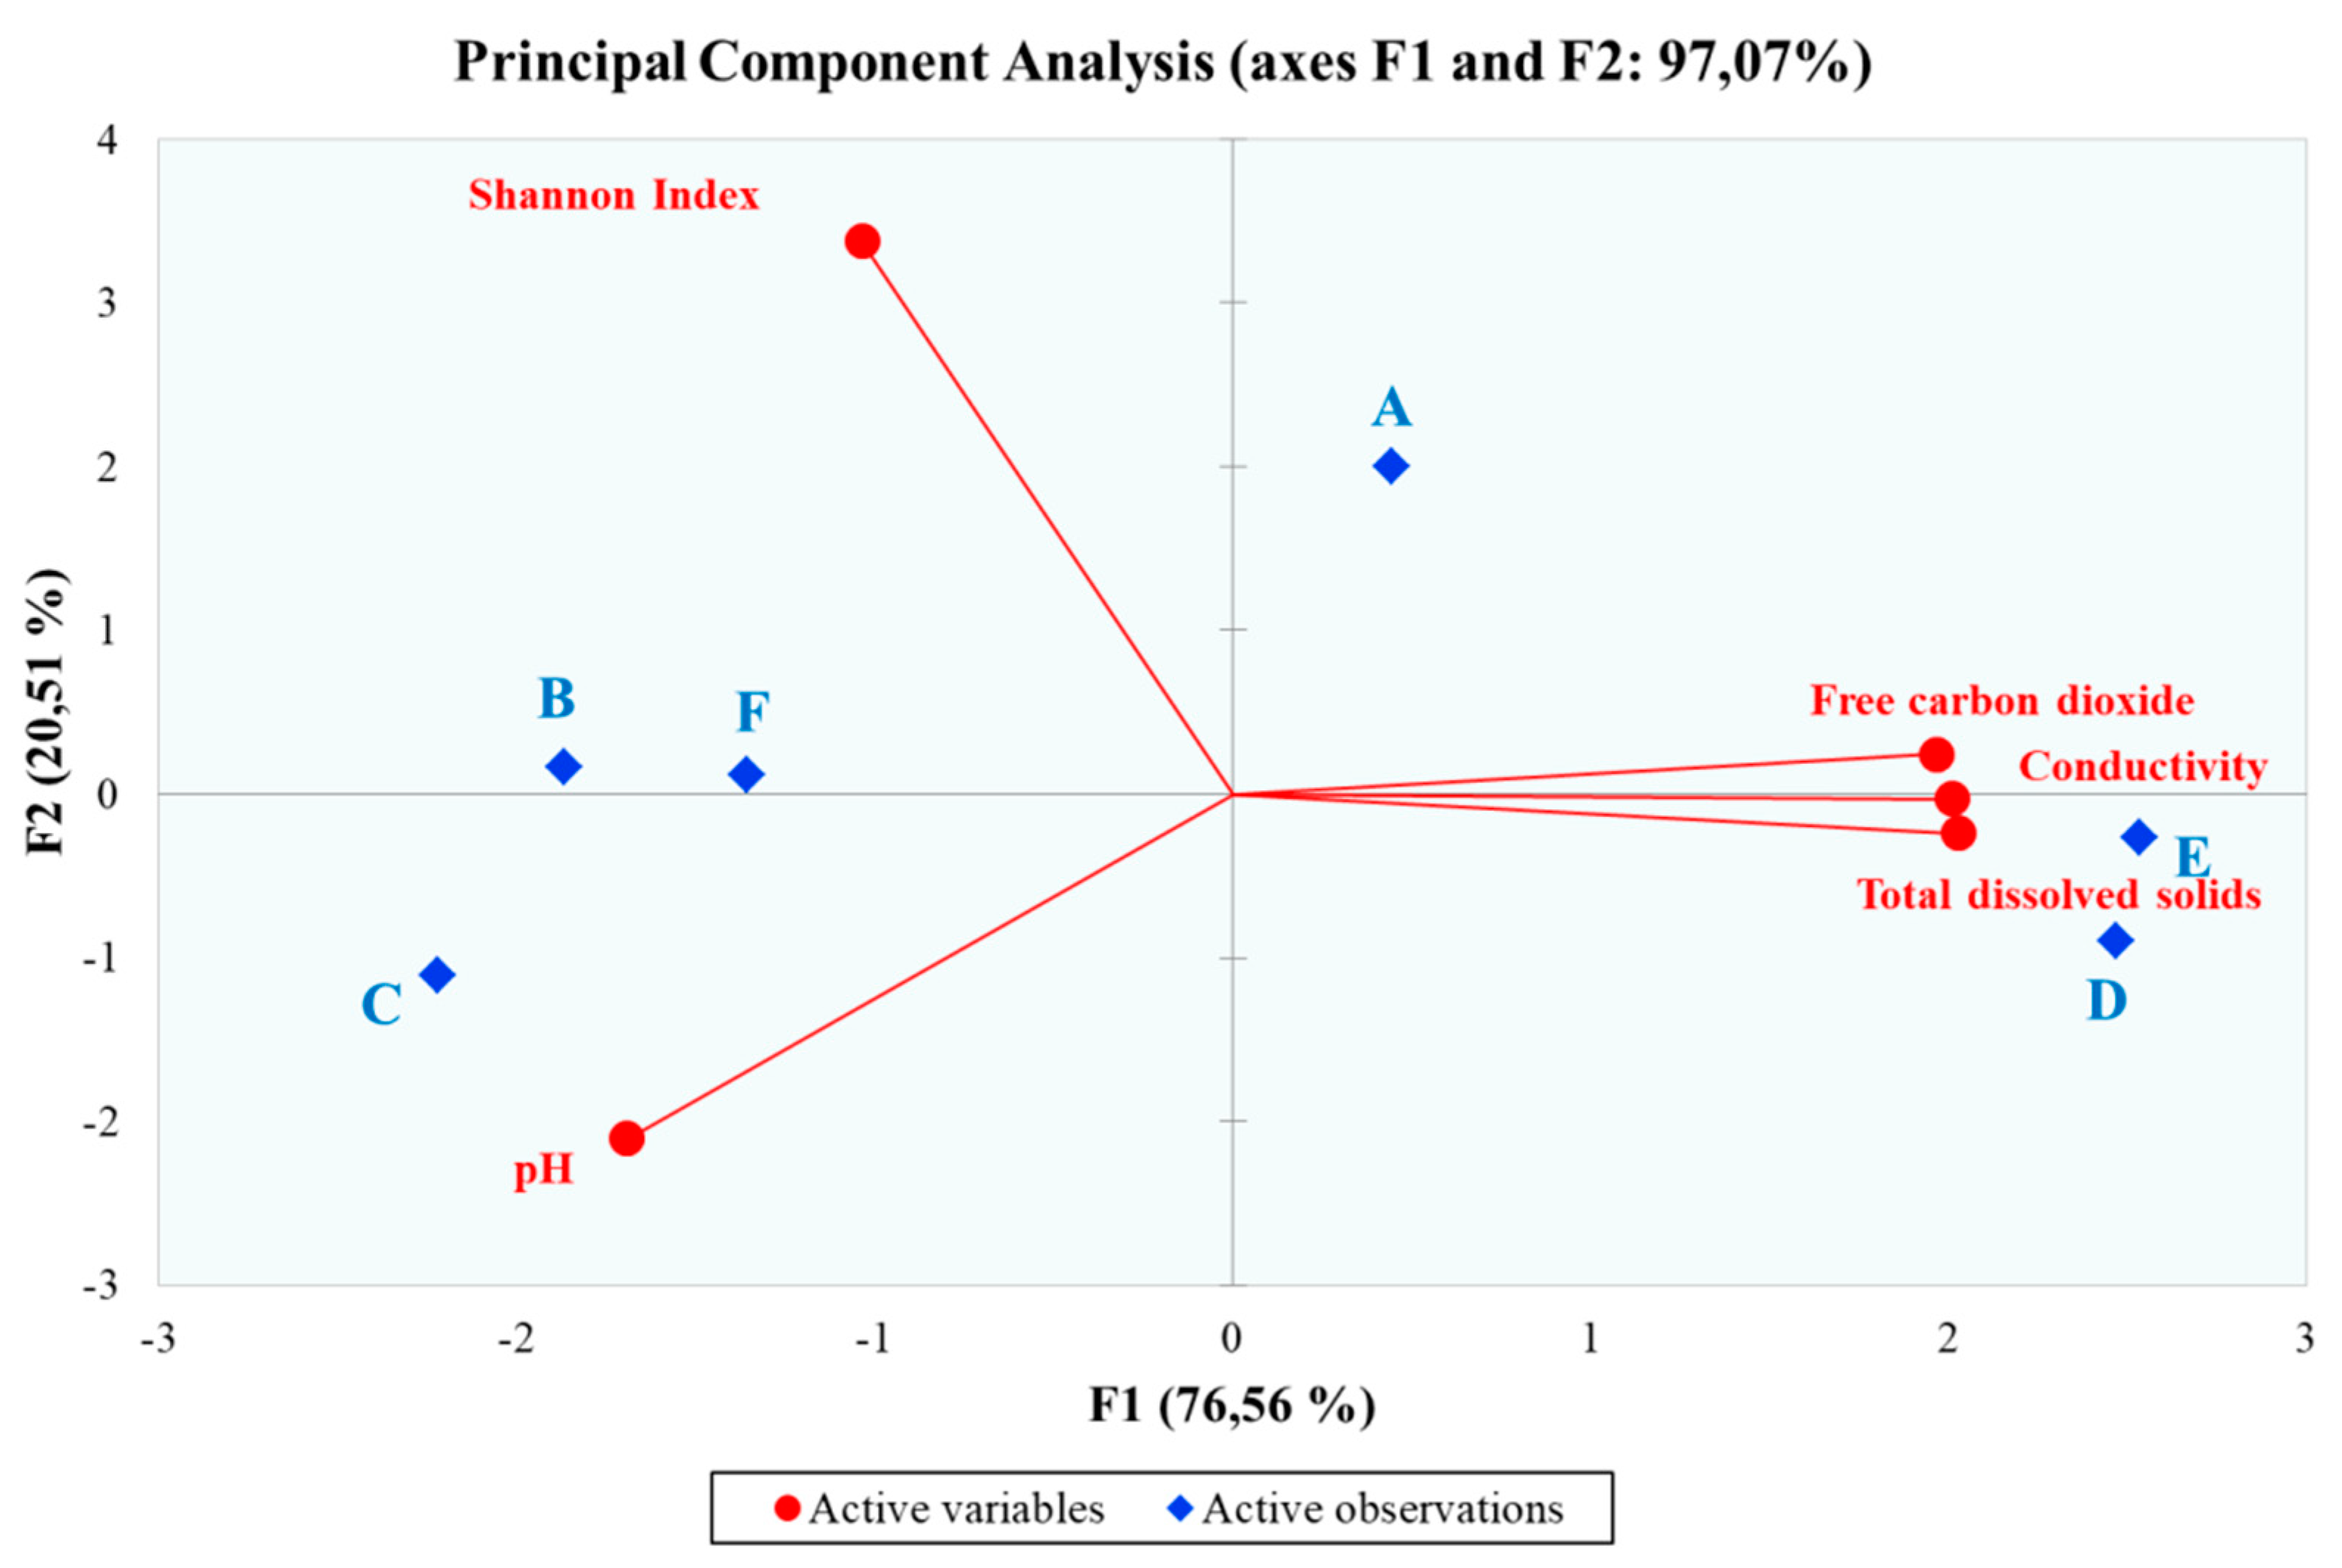
Principal Component Analysis
4. Conclusions
Supplementary Materials
Author Contributions
Funding
Institutional Review Board Statement
Informed Consent Statement
Conflicts of Interest
References
- Zeenat, A.; Hatha, A.A.M.; Viola, L.; Vipra, K. Bacteriological quality and risk assessment of the imported and domestic bottled mineral water sold in Fiji. J. Water Health. 2009, 7, 642–649. [Google Scholar] [CrossRef] [Green Version]
- Casanovas-Massana, A.; Blanch, A.R. Diversity of the heterotrophic microbial populations for distinguishing natural mineral waters. Int. J. Food Microbiol. 2012, 153, 38–44. [Google Scholar] [CrossRef] [PubMed]
- Craun, G.F.; Brunkard, J.M.; Yoder, J.S.; Roberts, V.A.; Carpenter, J.; Wade, T.; Calderon, R.L.; Roberts, J.M.; Beach, M.J.; Roy, S.L. Causes of Outbreaks Associated with Drinking Water in the United States from 1971 to 2006. Clin. Microbiol. Rev. 2010, 23, 507–528. [Google Scholar] [CrossRef] [PubMed] [Green Version]
- European Parliament. Directive 2009/54/EC of the European Parliament and of the Council of 18 June 2009 on the Exploitation and Marketing of Natural Mineral Waters. Off. J. Eur. Union 2009, 164, 45–58. Available online: https://eur-lex.europa.eu/legal-content/EN/ALL/?uri=CELEX%3A32009L0054 (accessed on 5 August 2021).
- U.S. Food and Drugs Administration. Title 21-Food and Drugs Chapter I-Food and Drug Administration Department of Health and Human Services Subchapter B-Food for Human Consumption. Code of Federal Regulations Title 21. 2019; Volume 2. Available online: https://www.accessdata.fda.gov/scripts/cdrh/cfdocs/cfcfr/CFRSearch.cfm?fr=165.110 (accessed on 30 July 2021).
- França, L.; Lopéz-Lopéz, A.; Rosselló-Móra, R.; da Costa, M.S. Microbial diversity and dynamics of a groundwater and a still bottled natural mineral water. Environ. Microbiol. 2015, 17, 577–593. [Google Scholar] [CrossRef]
- Loy, A.; Beisker, W.; Meier, H. Diversity of Bacteria Growing in Natural Mineral Water after Bottling. Appl. Environ. Microbiol. 2005, 71, 3624–3632. [Google Scholar] [CrossRef] [PubMed] [Green Version]
- Sala-Comorera, L.; Blancha, A.R.; Casanovas-Massanaa, A.; Monleón-Getinoa, A.; García-Aljaroa, C. Traceability of different brands of bottled mineral water during shelf life, using PCR-DGGE and next generation sequencing techniques. Food Microbiol. 2019, 82, 1–10. [Google Scholar] [CrossRef] [PubMed]
- Falcone-Dias, M.F.; Farache Filho, A. Quantitative variations in heterotrophic plate count and in the presence of indicator microorganisms in bottled mineral water. Food Control 2013, 31, 90–96. [Google Scholar] [CrossRef]
- Bischofberger, T.; Cha, S.K.; Schmitt, R.; Konig, B.; Schmidt-Lorenz, W. The bacterial flora of non-carbonated, natural mineral water from the springs to reservoir and glass and plastic bottles. Int. J. Food Microbiol. 1990, 11, 51–71. [Google Scholar] [CrossRef]
- British Soft Drinks Association. Guide to Good Bottled Water Standards, 3rd ed.; British Soft Drinks Association: London, UK, 2010; Available online: https://www.britishsoftdrinks.com/write/MediaUploads/Publications/bottled_water_guide Dec10LR.pdf (accessed on 14 June 2021).
- Rizzo, R. Scienza e tecnologia delle acque minerali e delle bevande. In Igiene, Qualità e Sicurezza Nella Produzione Delle Acque Minerali e Delle Bevande, 1st ed.; Chiriotti Editori: Pinerolo, Italy, 2006; Volume VI. [Google Scholar]
- Council Directive for Mineral Waters. Codex Standard for Natural Mineral Waters; CODEX STAN 108-1981; Codex Alimentarius (WHO & FAO): Geneva, Switzerland, 1981. [Google Scholar]
- International Standards Organization. ISO 6222:1999 Water quality—Enumeration of Culturable Micro-Organisms—Colony Count by Inoculation in a Nutrient Agar Culture Medium. 2001. Available online: https://www.iso.org/standard/28960.html (accessed on 18 July 2021).
- Ivanov, D.G.; Bacharov, D.R. Determination of Plasmid Copy Number by the “Boiling” Method. Anal. Biochem. 1986, 165, 137–141. [Google Scholar] [CrossRef]
- Chakravorty, S.; Helb, D.; Burday, M.; Connell, N.; Alland, D. A detailed analysis of 16S ribosomal RNA gene segments for the diagnosis of pathogenic bacteria. J. Microbiol. Methods 2007, 69, 330–339. [Google Scholar] [CrossRef] [PubMed] [Green Version]
- Carraturo, F.; Gargiulo, G.; Giorgio, A.; Aliberti, F.; Guida, M. Prevalence, distribution and diversity of Salmonella spp. in meat samples collected from Italian slaughterhouses. J. Food Sci. 2016, 81, 2545–2551. [Google Scholar] [CrossRef] [PubMed]
- Doyle, J. DNA Protocols for Plants, 1st ed.; Molecular Techniques in Taxonomy; Springer: Berlin/Heidelberg, Germany, 1990; pp. 283–293. [Google Scholar]
- Klindworth, A.; Pruesse, E.; Schweer, T.; Peplies, J.; Quast, C.; Horn, M.; Glöckner, F.O. Evaluation of general 16S ribosomal RNA gene PCR primers for classical and next-generation sequencing-based diversity studies. Nucleic Acids Res. 2013, 41, e1. [Google Scholar] [CrossRef] [PubMed]
- APAT IRSA CNR. Metodi Analitici per le Acque—Volume Primo Sezione 1000—Parte Generale; Sezione 2000—Parametri Chimico-Fisici; Sezione 3000—Metalli; APAT Manuali e Linee Guida 29/2003; APAT-CNR-IRSA: Rome, Italy, 2003. [Google Scholar]
- McMurdie, P.J.; Holmes, S. Phyloseq: An R package for reproducible interactive analysis and graphics of microbiome census data. PLoS ONE. 2013, 8, e61217. [Google Scholar] [CrossRef] [Green Version]
- Lesaulnier, C.C.; Herbold, C.W.; Pelikan, C.; Berry, D.; Gérard, C.; Le Coz, X.; Gagnot, S.; Niggemann, J.; Dittmar, T.; Singer, G.A.; et al. Bottled aqua incognita: Microbiota assembly and dissolved organic matter diversity in natural mineral waters. Microbiome 2017, 5, 126. [Google Scholar] [CrossRef] [Green Version]
- Palleroni, N.J. Pseudomonadaceae. In Bergey’s Manual of Systematic Biology; Kreig, N.R., Holt, J.G., Eds.; Williams and Wilkins Co.: Baltimore, MD, USA, 1984; pp. 141–199. [Google Scholar]
- Elomari, M.; Coroler, L.; Hoste, B.; Gillis, M.; Izard, D.; Leclerc, H. DNA Relatedness among Pseudomonas Strains Isolated from Natural Mineral Waters and Proposal of Pseudomonas veronii sp. nov. Int. J. Syst. Bacteriol. 1996, 46, 1138–1144. [Google Scholar] [CrossRef] [PubMed] [Green Version]
- Kaden, R.; Spröer, C.; Beyer, D.; Krolla-Sidenstein, P. Rhodoferax saidenbachensis sp. nov., a psychrotolerant, very slowly growing bacterium within the family Comamonadaceae, proposal of appropriate taxonomic position of Albidiferax ferrireducens strain T118T in the genus Rhodoferax and emended description of the genus Rhodoferax. Int. J. Syst. Evol. Microbiol. 2014, 64, 1186–1193. [Google Scholar]
- Brooke, J.S. Stenotrophomonas maltophilia: An Emerging Global Opportunistic Pathogen. Clin. Microbiol. Rev. 2012, 25, 2–41. [Google Scholar] [CrossRef] [Green Version]
- Khan, S.T.; Horiba, Y.; Yamamoto, M.; Hiraishi, A. Members of the family Comamonadaceae as primary poly(3-hydroxybutyrate-co-3-hydroxyvalerate)-degrading denitrifiers in activated sludge as revealed by a polyphasic approach. Appl. Environ. Microbiol. 2002, 68, 3206–3214. [Google Scholar] [CrossRef] [Green Version]
- Kalmbach, S.; Manz, W.; Wecke, J.; Szewzyk, U. Aquabacterium gen. nov., with description of Aquabacterium citratiphilum sp. nov., Aquabacterium parvum sp. nov. and Aquabacterium commune sp. nov., three in situ dominant bacterial species from the Berlin drinking water system. Int. J. Syst. Bacteriol. 1999, 49, 769–777. [Google Scholar] [CrossRef] [Green Version]
- Sun, L.N.; Yang, E.N.; Hou, X.T.; Wei, J.C.; Yuan, Z.X.; Wang, W.Y. Caulobacter rhizosphaerae sp. nov., a stalked bacterium isolated from rhizosphere soil. Int. J. Syst. Evol. Microbiol. 2017, 67, 1771–1776. [Google Scholar] [CrossRef] [PubMed]
- Shang, S.A.; Chiu, S.K.; Chan, M.C.; Wang, N.C.; Yang, Y.S.; Lin, J.C.; Chang, F.Y. Invasive Brevundimonas vesicularis bacteremia: Two case reports and review of the literature. J. Microbiol. Immunol. Infect. 2012, 45, 468–472. [Google Scholar] [CrossRef] [Green Version]
- Willems, A.; Falsen, E.; Pot, B.; Jantzen, E.; Hoste, B.; Vandamme, P.; Gillis, M.; Kersters, K.; De Ley, J. Acidovorax, a new genus for Pseudomonas facilis, Pseudomonas delafieldii, E. FALSEN (EF) group 13, EF group 16, and several clinical isolates, with the species Acidovorax facilis comb. nov., Acidovorax delafieldii comb. nov., and Acidovorax temperans comb. nov. Int. J. Syst. Bacteriol. 1990, 40, 384–398. [Google Scholar]
- Wen, A.; Fegan, M.; Hayward, C.; Chakraborty, S.; Sly, L.I. Phylogenetic relationships among members of the Comamonadaceae, and description of Delftia acidovorans (den Dooren de Jong 1926 and Tarnaoka et al. 1987) gen. nov., comb. nov. Int. J. Syst. Bacteriol. 1999, 49, 567–576. [Google Scholar] [CrossRef] [Green Version]
- Jørgensen, N.O.G.; Brandt, K.K.; Nybroe, O.; Hansen, M. Delftia lacustris sp. nov., a peptidoglycan-degrading bacterium from fresh water, and emended description of Delftia tsuruhatensis as a peptidoglycan-degrading bacterium. Int. J. Syst. Evol. Microbiol. 2009, 59, 2195–2199. [Google Scholar] [CrossRef] [Green Version]
- Gavini, F.; Mergaert, J.; Beji, A.; Mielcarek, C.; Izard, D.; Kersters, K.; De Ley, J. Transfer of Enterobacter agglomerans (Beijerinck 1888) Ewing and Fife 1972 to Pantoea gen. nov. as Pantoea agglornerans comb. nov. and Description of Pantoea dispersa sp. nov. Int. J. Syst. Bacteriol. 1989, 39, 337–345. [Google Scholar] [CrossRef]
- Li, D.; Rothballer, M.; Schmid, M.; Esperschutz, J.; Hartmann, A. Acidovorax radicis sp. nov., a wheat-root-colonizing bacterium. Int. J. Syst. Evol. Microbiol. 2011, 61, 2589–2594. [Google Scholar] [CrossRef] [PubMed] [Green Version]
- Lee, J.S.; Shin, Y.K.; Yoon, J.H.; Takeuchi, M.; Pyun, Y.R.; Park, Y.H. Sphingomonas aquatilis sp. nov., Sphingomonas koreensis sp. nov. and Sphingomonas taejonensis sp. nov., yellow-pigmented bacteria isolated from natural mineral water. Int. J. Syst. Evol. Microbiol. 2001, 51, 1491–1498. [Google Scholar] [CrossRef]
- Fritz, I.; Strömpl, C.; Nikitin, D.I.; Lysenko, A.M.; Abraham, W.R. Brevundimonas mediterranea sp. nov., a non-stalked species from the Mediterranean Sea. Int. J. Syst. Evol. Microbiol. 2005, 55, 479–486. [Google Scholar] [CrossRef] [Green Version]
- López, N.I.; Pettinari, M.J.; Stackebrandt, E.; Tribelli, P.M.; Pötter, M.; Steinbüchel, A.; Méndez, B. Pseudomonas extremaustralis sp. nov. a poly(3-hydroxybutyrate) producer isolated from an Antarctic environment. Curr. Microbiol. 2009, 59, 514–519. [Google Scholar] [CrossRef]
- Casida, L.E., Jr. Ensifer adhaerens gen. nov., sp. nov.: A bacterial predator of bacteria in soil. Int. J. Syst. Evol. Microbiol. 1982, 32, 339–345. [Google Scholar] [CrossRef]
- Poehlein, A.; Najdenski, H.; Simeonovab, D.D. Draft Genome Sequence of Flavobacterium succinicans Strain DD5b. Genome Announc. 2017, 5, e01492-16. [Google Scholar] [CrossRef] [Green Version]
- Suzuki, M.; Suzuki, S.; Matsui, M.; Hiraki, Y.; Kawano, F.; Shibayamaa, K. Genome Sequence of a strain of the Human Pathogenic Bacterium Pseudomonas alcaligenes That Caused Bloodstream Infection. Genome Announc. 2013, 1, e00919-13. [Google Scholar] [CrossRef] [Green Version]
- Lee, M.; Ten, L.N.; Lee, H.W.; Woo, O.H.; Im, W.T.; Lee, S.T. Sphingopyxis ginsengisoli sp. nov., isolated from soil of a ginseng field in South Korea. Int. J. Syst. Evol. Microbiol. 2008, 58, 2342–2347. [Google Scholar] [CrossRef] [Green Version]
- Hiraishi, A.; Kuraishi, H.; Kawahara, K. Emendation of the description of Blastomonas natatoria (Sly 1985) Sly and Cahill 1997 as an aerobic photosynthetic bacterium and reclassification of Erythromonas ursincola Yurkov et al. 1997 as Blastomonas ursincola comb. Nov. Int. J. Syst. Evol Microbiol. 2000, 50, 1113–1118. [Google Scholar] [CrossRef] [PubMed]
- Thierry, S.; Macarie, H.; Lizuka, T.; Geißdörfer, W.; Assih, E.A.; Spanevello, M.; Verhe, F.; Ryosuke, P.T.; Monroy, O.; Labat, M.; et al. Pseudoxanthomonas mexicana sp. nov. and Pseudoxanthomonas japonensis sp. nov., isolated from diverse environments, and emended descriptions of the genus Pseudoxanthomonas Finkmann et al. 2000 and of its type species. Int. J. Syst. Evol. Microbiol. 2004, 54, 2245–2255. [Google Scholar] [CrossRef] [PubMed] [Green Version]
- Choi, J.H.; Kim, M.S.; Jung, M.J.; Roh, S.W.; Shin, K.S.; Bae, J.W. Sphingopyxis soli sp. nov., isolated from landfill soil. Int. J. Syst. Evol. Microbiol. 2010, 60, 1682–1686. [Google Scholar] [CrossRef] [PubMed] [Green Version]
- Sanders, J.W.E.; Sanders, C.C. Enterobacter spp.: Pathogens poised to flourish at the turn of the Century. Clin. Microbiol. Rev. 1997, 10, 220–241. [Google Scholar] [CrossRef]
- Burtscher, M.M.; Zibuschka, F.; Mach, R.L.; Lindner, G.; Farnleitner, A.H. Heterotrophic plate count vs. in situ bacterial 16S rRNA gene amplicon profiles from drinking water reveal completely different communities with distinct spatial and temporal allocations in a distribution net. AJOL Water Sa 2009, 35, 495–504. [Google Scholar] [CrossRef] [Green Version]
- Urmeneta, J.; Navarrete, A.; Sancho, J. Isolation and Identification of autochthonous Microbiota from a Granitic Aquifer and Its Variation after the Bottling Process. Curr. Microbiol. 2000, 41, 379–383. [Google Scholar] [CrossRef]
- Brumfield, K.D.; Hasan, N.A.; Leddy, M.B.; Cotruvo, J.A.; Rashed, S.M.; Colwell, R.R.; Hug, A. A comparative analysis of drinking water employing metagenomics. PLoS ONE 2020, 14, e0231210. [Google Scholar]
- Sala-Comorera, L.; Caudet-Segarra, L.; Galofré, B.; Lucena, F.; Blanch, A.R.; García-Aljaro, C. Unravelling the composition of tap and mineral water microbiota: Divergences between next-generation sequencing techniques and culture-based methods. Int. J. Food Microbiol. 2020, 334, 108850. [Google Scholar] [CrossRef] [PubMed]
- European Parliament. Directive (EU) 2020/2184 of the European Parliament and of the Council of 16 December 2020 on the Quality of Water Intended for Human Consumption. Off. J. Eur. Union 2020, L 435. Available online: https://eur-lex.europa.eu/legal-content/EN/TXT/PDF/?uri=CELEX:32020L2184&from=EN (accessed on 30 September 2021).


| Sample Code | Type of Water | Pour Plating (Standard) [CFU/L] | Membrane Filtration [CFU/L] | Filtration + Spread [CFU/L] |
|---|---|---|---|---|
| A | Sparkling | <1 | 8 ± 1.15 | 67 ± 2.96 |
| B | Flat | <1 | 333 ± 6.24 | 19,300 ± 28.14 |
| C | Flat | <1 | <1 | <1 |
| D | Sparkling | <1 | 302 ± 4.58 | 13,200 ± 28.87 |
| E | Sparkling | <1 | <1 | <1 |
| F | Flat | <1 | 14 ± 1.76 | 9260 ± 61.10 |
| Type | Sample | Winter [CFU/L] | Spring [CFU/L] | |||||||||
|---|---|---|---|---|---|---|---|---|---|---|---|---|
| 0 d | 5 d | 10 d | 15 d | 30 d | 0 d | 5 d | 10 d | 15 d | 30 d | |||
| Flat water | B | CT | 1.7 × 10³ ± 76.4 | 2.5 × 10³ ± 137.7 | 7.6 × 10³ ± 120.2 | 8.4 × 10² ± 112.3 | 7.1 × 10³ ± 358.0 | 8 × 10² ± 23.3 | 1.4 × 10⁴ ± 650.9 | 1.4 × 10⁴ ± 217.9 | 2.7 × 10⁴ ± 145.3 | 5.8 × 10³ ± 14.5 |
| VT | 1.7 × 10³ ± 76.4 | 2.1 × 10⁴ ± 504.4 | 1.7 ± 0.3 | 7.6 × 10⁴ ± 881.9 | 3 × 10³ ± 145.3 | 8 × 10² ± 23.3 | 8.3 × 10³ ± 176.4 | 5.6 × 10² ± 29.6 | 1 × 10³ ± 76.4 | 1.7 × 10⁴ ± 175.6 | ||
| C | CT | 4.2 × 10⁴ ± 1193.0 | 6.1 × 10⁴ ± 3527.7 | 3.8 × 10³ ± 48.5 | 8.1 × 10³ ± 58.8 | 4.1 × 10⁴ ± 554.2 | 1.1 × 10³ ± 44.1 | 1.3 ± 0.3 | 6 × 10² ± 20.8 | 1.2 × 10³ ± 17.3 | 2.4 × 10³ ± 44.1 | |
| VT | 4.2 × 10⁴ ± 1193.0 | 4.9 × 10⁵ ± 7535.1 | 1.3 ± 0.3 | 1.7 ± 0.3 | 2.1 × 10³ ± 95.7 | 1.1 × 10³ ± 44.1 | 1.3 ± 0.3 | 6.7 × 10² ± 8.8 | 1.3 × 10³ ± 44.1 | 9.2 × 10² ± 14.5 | ||
| F | CT | 7.7 × 10⁴ ± 2029.9 | 8.0 × 10⁴ ± 1260.1 | 1.2 × 10⁵ ± 6506.3 | 7.2 × 10² ± 9.6 | 1.6 × 10⁵ ± 2274.0 | 1.3 × 10² ± 3.9 | <1 | <1 | 2.4 × 10² ± 9.3 | <1 | |
| VT | 7.7 × 10⁴ ± 2029.9 | 1.8 × 10⁵ ± 1286.3 | 1.3 × 10⁴ ± 400.5 | 2.3 × 10³ ± 140.0 | 4.1 × 10⁴ ± 1037.8 | 1.3 × 10² ± 3.9 | <1 | <1 | <1 | <1 | ||
| Sparkling water | A | CT | <1 | <1 | <1 | <1 | <1 | <1 | <1 | <1 | <1 | <1 |
| VT | <1 | <1 | <1 | <1 | <1 | <1 | <1 | <1 | <1 | <1 | ||
| D | CT | <1 | <1 | <1 | <1 | <1 | <1 | <1 | <1 | <1 | <1 | |
| VT | <1 | <1 | <1 | <1 | <1 | <1 | <1 | <1 | <1 | <1 | ||
| E | CT | <1 | <1 | <1 | <1 | <1 | <1 | <1 | <1 | <1 | <1 | |
| VT | <1 | <1 | <1 | <1 | <1 | <1 | <1 | <1 | <1 | <1 | ||
| Type of Water | Sample | Microorganisms in Winter | Microorganisms in Spring |
|---|---|---|---|
| Flat | B | Acidovorax delafieldii Acidovorax facilis Aquabacterium parvum Brevundimonas vesicularis Caulobacter henricii Pseudomonas fluorescens Pseudomonas veronii Rhodoferax saidenbachensis Stenotrophomonas maltophilia | Acidovorax delafieldii Aquabacterium commune Blastomonas natatoria Delftia acidovorans Ensifer adhaerens Flavobacterium succinicans Pseudomonas alcaligenes Pseudomonas fluorescens Pseudoxanthomonas mexicana Pseudomonas veronii Rhodoferax saidenbachensis Sphingopyxis ginsengisoli Sphingopyxis soli Stenotrophomonas maltophilia |
| C | Acidovorax radicis Brevundimonas mediterranea Delftia acidovorans Delftia lacustris Pantoea agglomerans Sphingomonas aquatilis | Acidovorax radicis Delftia acidovorans Delftia lacustris Pantoea agglomerans Stenotrophomonas maltophilia | |
| F | Acidovorax delafieldii Pseudomonas extremaustralis Pseudomonas veronii Stenotrophomonas maltophilia | Acidovorax delafieldii Blastomonas natatoria Pseudomonas extremaustralis Pseudomonas veronii Stenotrophomonas maltophilia | |
| Sparkling | A | - | - |
| D | - | - | |
| E | - | - |
Publisher’s Note: MDPI stays neutral with regard to jurisdictional claims in published maps and institutional affiliations. |
© 2021 by the authors. Licensee MDPI, Basel, Switzerland. This article is an open access article distributed under the terms and conditions of the Creative Commons Attribution (CC BY) license (https://creativecommons.org/licenses/by/4.0/).
Share and Cite
Carraturo, F.; Del Giudice, C.; Compagnone, M.; Libralato, G.; Toscanesi, M.; Trifuoggi, M.; Galdiero, E.; Guida, M. Evaluation of Microbial Communities of Bottled Mineral Waters and Preliminary Traceability Analysis Using NGS Microbial Fingerprints. Water 2021, 13, 2824. https://doi.org/10.3390/w13202824
Carraturo F, Del Giudice C, Compagnone M, Libralato G, Toscanesi M, Trifuoggi M, Galdiero E, Guida M. Evaluation of Microbial Communities of Bottled Mineral Waters and Preliminary Traceability Analysis Using NGS Microbial Fingerprints. Water. 2021; 13(20):2824. https://doi.org/10.3390/w13202824
Chicago/Turabian StyleCarraturo, Federica, Carmela Del Giudice, Mariacristina Compagnone, Giovanni Libralato, Maria Toscanesi, Marco Trifuoggi, Emilia Galdiero, and Marco Guida. 2021. "Evaluation of Microbial Communities of Bottled Mineral Waters and Preliminary Traceability Analysis Using NGS Microbial Fingerprints" Water 13, no. 20: 2824. https://doi.org/10.3390/w13202824