
Water Demand Management Based on Water Consumption Data Analysis in the Emirate of Abu Dhabi
by
 , and
, and
Shayma Albannay
1, 
Shinobu Kazama
1 ,
,
Kumiko Oguma
1,
Takashi Hashimoto
2 and
Satoshi Takizawa
1,* 1
Department of Urban Engineering, Graduate School of Engineering, the University of Tokyo, 7-3-1 Hongo, Bunkyo-Ku, Tokyo 113-8654, Japan
2
Research Center for Advanced Science and Technology, the University of Tokyo, 4-6-1 Komaba, Meguro-ku, Tokyo 153-8904, Japan
*
Author to whom correspondence should be addressed.
Water 2021, 13(20), 2827; https://doi.org/10.3390/w13202827
Submission received: 11 September 2021
/
Revised: 2 October 2021
/
Accepted: 5 October 2021
/
Published: 12 October 2021
(This article belongs to the Special Issue Water Pollution and Sanitation)
Abstract
:In Abu Dhabi, in the United Arab Emirates (UAE), the population and water demand have nearly tripled in the last two decades. Thus, it has become critical to curtail the growing water demand. This study aimed to evaluate the efficacy of Abu Dhabi’s residential water demand management through the installation of water-saving fittings. The analysis of water consumption time-series data revealed that water consumption of the three water user categories was significantly different. Briefly: water-tariff exempt users consumed 95.19 m3/d/connection in 2019, followed by nationals with 5.14 m3/d/connection, and expats at 0.7 m3/d/connection. Nationals began saving water in 2011, which was earlier than the water tariff revision of 2015. In a newly developed area of Khalifa City, the water consumption of new residents was 46.0% less than that of old residents, indicating the effectiveness of water-saving fittings installed in new homes following the Housing Rules’ requirements. Then, based on the estimated number of new connections and the fittings’ saving efficiencies, we estimated that water-saving fittings contributed to 73.1% of the water savings since 2011. These results strongly recommend the introduction of an incentive or subsidy for owners of old houses to replace their outdated fittings with water-saving ones.
1. Introduction
Energy, water, and food resource scarcity, largely due to rapid population growth, climate change, imbalanced urbanization, and economic diversification, are today’s greatest challenges [1,2,3,4]. By 2050, the world population is projected to reach 9.7 billion, with 1.2 billion people lacking access to safe drinking water and 2.5 billion lacking sanitation facilities [3]. Approximately 1 billion people are considered undernourished, while no less than 1.5 billion live outside the modern energy network [1].
The Gulf Cooperation Council (GCC) countries (Bahrain, Kuwait, Qatar, Oman, the Kingdom of Saudi Arabia (KSA), and The United Arab Emirates (UAE)) are in an arid region with limited natural water resources [5]. The GCC countries control around 40% of global oil and 20% of natural gas reserves [3,6]. Developing resource-rich nations, such as the GCC countries [7], are facing several major challenges that threaten water sector sustainability because of the swift economic and population growth caused by sharp increases in oil revenues [3,5,8].
A large share of the population increases in GCC countries is due to labor importing, which refers to the expatriate population that meets the GCC labor needs [6,9]. Tariffs in the GCC countries are drastically different from the actual production costs of water and electricity, as both are highly subsidized [5,10]. This is one of the reasons behind the GCC nations’ significant increase in water and energy demand [6,9].
The annual per capita water consumption in GCC countries has been reported at 560 L/capita/day (LPCD), compared to the world average of 180 LPCD [3]. Among the GCC nations, the KSA has the largest water consumption, while the UAE has the largest per capita water consumption [11]. In addition, water consumption in fossil fuel production and energy usages, such as cooling, district cooling, and energy-intensive cooling technologies [6,10] is immense. Globally, the GCC countries rank among the top twenty-five nations for the largest CO2 emissions per capita [6,12]. The KSA, the UAE, and Qatar have already been identified as the largest per capita CO2 emitters in the world [13].
These countries depend highly on seawater desalination to meet their growing water demand [3,10,14]. Their collective desalination production capacity exceeds 60% of the world’s total capacity [3], with the majority installed in the KSA (36.4%) and the UAE (34.4%) [3,8]. The desalination capacity in these nations is likely to develop in tandem with the population and economic expansion [3,6]. Currently, the average unit cost of desalinated water in the GCC countries is about $1.45/m3 [3]. On average, 12% of the total sector fuel consumption across the GCC is spent on desalination [9]; 15% of the KSA’s daily oil production is consumed by desalination plants [3]. In the UAE and Qatar, energy use for water production has reached 30% of their total energy consumption [3].
Although water production capacities in the GCC countries have been increased to meet the water demand, the sustainable management of urban water is a viable option [15]. Water demand management (WDM) is a strategic tool for lowering water usage in cities to sustainable levels [2]. WDM has also been described as a policy framework aimed at limiting water use to meet socioeconomic needs without wasting resources or stripping other areas and future generations of critical natural resources [16]. WDM requires instruments and strategies that consider pricing, mandatory water conservation requirements, and the engagement of the public and private sectors [17]. In addition, WDM assists in enabling consumers to adopt more sustainable water consumption behaviors [18].
There are several studies on WDM in developed countries. In a study conducted in an affluent Los Angeles County neighborhood, it was found that, rather than supplying information alone, implicating social norms, social identity, or personal identity led to the provision of more viable water conservation options [19]. Other studies in California showed that stringent mandatory outdoor watering restrictions, when combined with pricing measures, were the most effective in WDM [20], and that price and population had the most significant impact on water usage in the commercial, governmental, industrial, and residential sectors [21].
However, an Australian study demonstrated that residential water demand was price inelastic due to its low relative cost compared to other life essentials [18]. In Singapore, WDM strategies focused not only on fostering public involvement but also on public engagement in governance aspects [17]. These studies suggested that the effectiveness of WDM strategies was strongly dependent on the socioeconomic backgrounds of countries and cities around the world, and thus the effectiveness of WDM approaches would be different in various countries.
In the GCC countries, WDM has not yet been successfully applied to lower water demand [8]. This is partly because of social and political considerations over the removal of subsidies [10]. The GCC countries’ wealth has created a culture in which citizens regard free energy and water to be a birthright [5,8]. However, high subsidies lead to elevated resource consumption [5,10]. Increases in water and electricity tariffs may decrease usage by a considerable amount as has been often claimed by academic, governmental, and industrial experts in the GCC region [10]; however, this has yet to be confirmed in the UAE and other GCC countries.
In 2010, the Abu Dhabi government commenced a new strategy requiring the installation of water-saving fittings to newly constructed homes and recommending their use in existing homes. The government also announced that water-saving devices were to be installed in 100,000 homes and public buildings, reducing the emirate’s overall water consumption by 30–35% [22,23,24,25]. In addition, the Department of Energy (DoE) launched a new plan in 2019 called the Abu Dhabi Demand Side Management and Energy Rationalization Strategy (DSM) 2030, intending to lower water usage by 32% by 2030 [26]. Although the UAE/Abu Dhabi government has promoted water conservation, its progress has yet to be verified.
Therefore, this study aimed to evaluate the effectiveness of various WDM instruments in lowering water consumption in the emirate of Abu Dhabi, one of the seven emirates in the UAE. The historical trend of water usage was initially analyzed, along with population growth, to determine variations in per capita water consumption and its influencing factors. The variables impacting per capita water usage, such as water tariffs, persons per house, and water-saving fittings, were then analyzed to assess their WDM efficacy. The water consumptions of new and old residents in Khalifa City were compared to evaluate the water savings in new homes. In a case study on a national’s house, the cost and effectiveness of water-saving fittings were evaluated, and their contribution to water consumption reduction among nationals between 2011 and 2019 was estimated.
2. Materials and Methods
2.1. Study Area: Emirate of Abu Dhabi
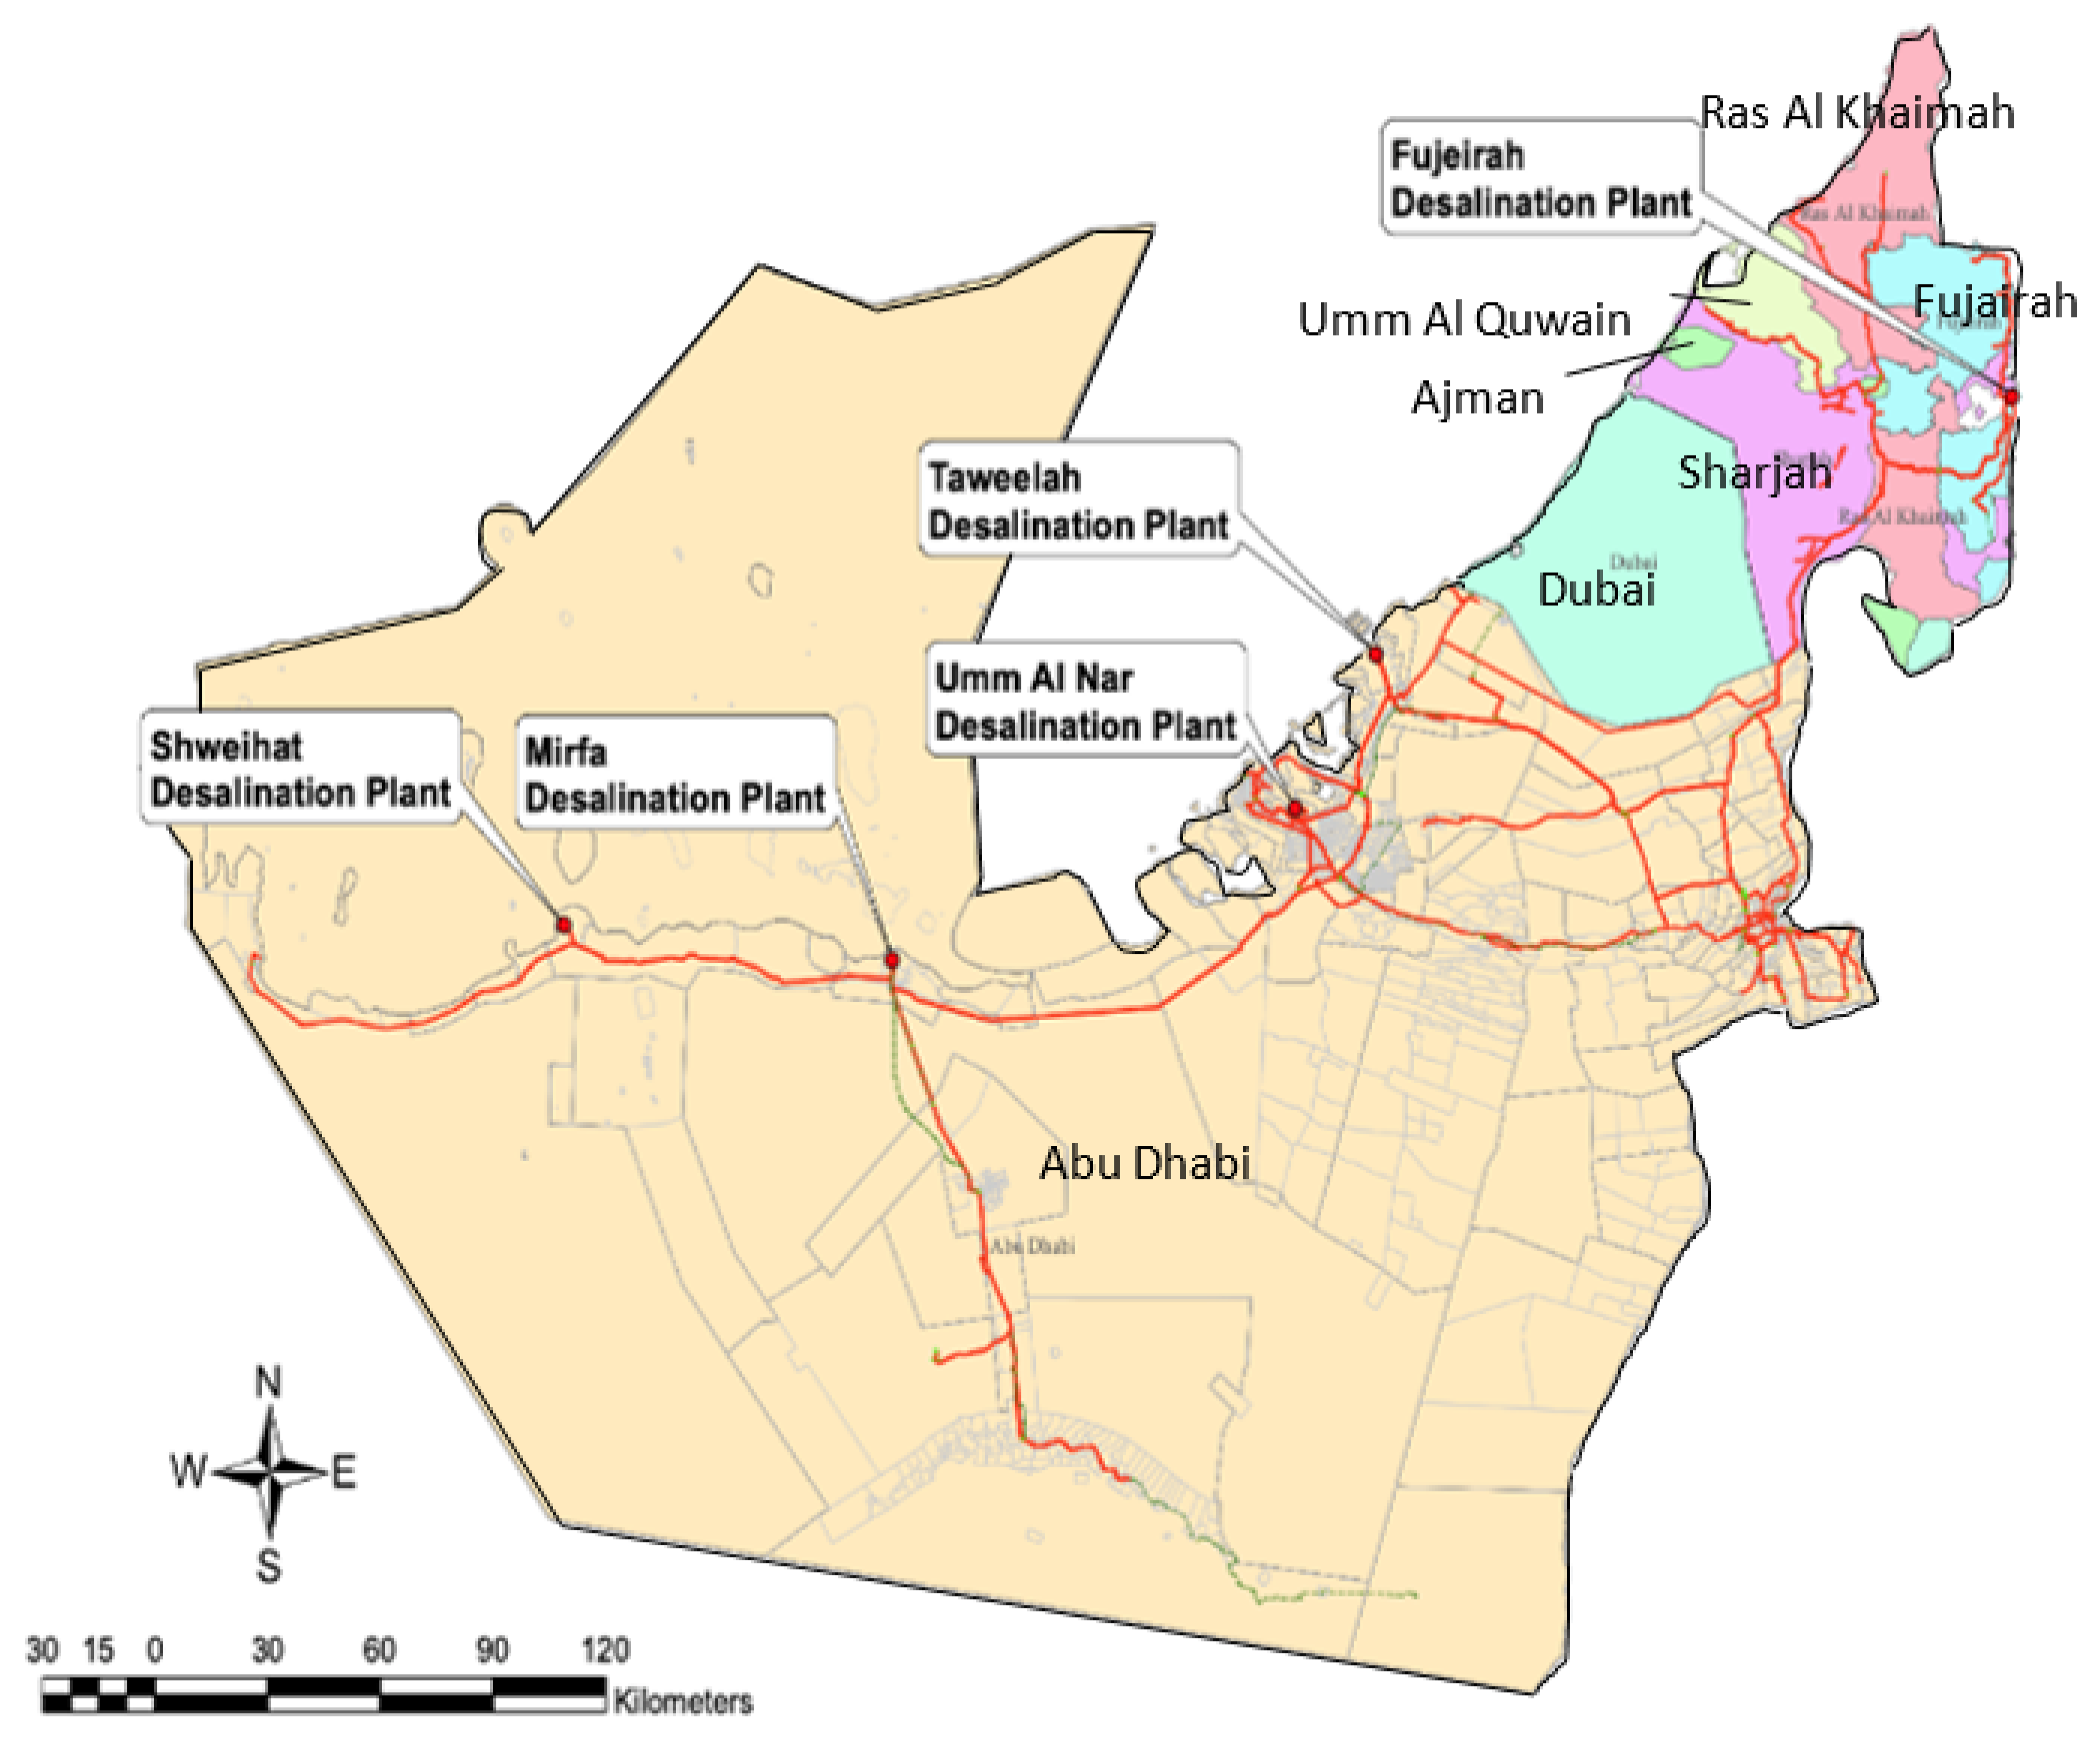
The UAE was established on 2 December 1971, with a total area of 71,023 km2 [27]. Its hydrological climate is hyper-arid, with limited natural water resources. As one of the rapidly growing economies driven by the oil industry, water demand has been rising [28]. The emirate of Abu Dhabi (hereafter called Abu Dhabi) is the capital of the UAE and is highly dependent on seawater desalination as its primary source of potable water. Water and power production is undertaken by the Independent Water and Power Production (IWPP) companies [29]. Abu Dhabi has five desalination plants (Figure 1), and their total capacity in 2019 was 4.14 million m3/day (910 Million Imperial Gallons per Day, MIGD) [30]. The residents of Abu Dhabi consume 590 LPCD of water daily, which is one of the highest, compared to the global average of 180 LPCD [3,31,32].
2.2. Trend Analyis of Water Consumption
The Abu Dhabi Distribution Company (ADDC) provided data on water consumption and the number of connections for each water user category (residential, commercial, government, agriculture, and industrial) from 2010 to 2019 [33,34]. In addition, for the water consumption analysis, demographic data for 2010–2016 and 2017–2019 were supplied by the Statistical Center of Abu Dhabi (SCAD) and the Emirates Water and Electricity Company (EWEC), respectively [35,36]. The water consumption in each category was examined to determine their comparative ratios. Since residential water consumption category was found to be the highest among all the categories at ~47%, it was further analyzed in this study.
There are two types of residents in Abu Dhabi: (1) nationals, who are the local people (Emirati); and (2) expats, who are nonlocal residents working in Abu Dhabi. The emirate used to comprise around 90% expats and only 10% nationals [9]. The nationals usually live in villas with their entire extended family; thus, the number of individuals per home is high at around 14–20 persons. Villas typically have gardens and even swimming pools [23]. However, over the last 10 years, young national families have increasingly preferred to live by themselves in their own smaller villas; hence, the number of people per home has decreased [37].
On the other hand, expats usually live alone or in a group, to share the cost of an apartment/flat that is smaller than a villa. Although residential nationals enjoyed a free water supply until 2015, the government of Abu Dhabi enforced a major tariff reform for water and electricity in that same year for the first time in its history (Table 1). The notable changes included a significant tariff increase for residential expats and the introduction of charges for residential nationals. The third residential water tariff category is the tariff-exempt, who are individuals spared from paying the water tariff. These can be either nationals or expats.
The residential water consumption and the number of connections in each category were analyzed from 2010 to 2019. The consumption per connection was calculated by dividing each category’s yearly consumption by its number of connections. The water consumption per capita was computed by dividing each category’s yearly water consumption by the expat and national populations. However, since the population of the exempt was not disclosed, the per capita water consumption for this category was not calculated. In addition, water expenses for expats and nationals were derived using the tariff rates after the 2015 tariff reform.
2.3. Analyis of Residential Water Consumption
2.3.1. Residential Water Consumption in Khalifa City
Khalifa City is a residential city for nationals, located in the eastern region of the emirate of Abu Dhabi. It started as a small community in 2006 with the establishment of Masdar City. However, Khalifa City has become one of the most popular residential areas in Abu Dhabi because of its easy access and affordable price. To analyze the water consumption reduction of the new homes of the nationals compared to those who lived longer in the same homes, the yearly water consumption data of all the connections between 2018 and 2020 were obtained from ADDC [41].
The exact numbers of used connections—namely, non-zero consumption—increased year by year due to new residents; there were 7326, 7826, and 8234 in 2018, 2019, and 2020, respectively. The connections were considered to have been used by new residents if there was no water consumption in the previous year; and the yearly water consumption of those new residents was compared with the water consumption of the residents who lived there for more than three years.
It is likely that the Housing Rule requiring the use of water-saving fittings reduced the water consumption of new residents. In addition, in order to find the variability of water consumption of the same residents, the numbers of connections that either increased or decreased in water consumption from the previous year were counted for more-than-3-year residents.
2.3.2. Monthly Water Consumption Variation of a National’s Home
The monthly water consumption for a national’s home from 2018 to 2020 was used to characterize the nationals’ water consumption variation [42]. The average, maximum, and minimum months for each year were calculated. In addition, the daily per capita consumption for each month was estimated by dividing the total monthly consumption by the number of days in each month.
2.4. Effectiveness of Water-Saving Fittings
Following the government’s water-saving policy, a corresponding website was launched [23,43]. According to this website, there are several types of water-saving fittings available, including a showerhead, water displacement in a toilet flushing unit, and water flow-regulating porous plates that may be fitted on different types of faucets. The water savings percentage was reported to be about 60% [43] depending on the fixtures and tools.
In this study, information from the UAE water-saving website was used to determine the cost of each type of water-saving fitting [43]. In addition, the Guide to Water Supply Regulation (2017) [44] was used to estimate the water consumption for any new development in Abu Dhabi. The Department of Energy created (and regularly updates) this guide, which provides the breakdown of water use per home based on the home type and the number of bedrooms and residents. Real estate developers and consultants are meant to use this guide to estimate the water demands of their housing projects and obtain approval from the water and town planning authorities.
In addition, to discern the effects of water-saving fittings, the water conservation cost of a national’s house was calculated from the cost of the water-saving fittings. This was done by multiplying the number of fittings by the cost of each one and adding the product to the water conservation cost of dual-flush toilets. Moreover, the cost of a dual-flush toilet was calculated using the UAE market price [45], and the difference between a dual-flush toilet and a conventional full flush toilet was regarded as an additional water conservation cost [46].
The payback period (in months) was also computed by dividing the entire water conservation cost by the difference between the water bills before and after water savings. Two amounts of water consumption were used in this analysis: 350 LPCD [44] for the villa category, as indicated in the Guide to Water Supply Regulation, and 225 LPCD, as written on the November 2020 water bill [42]. The number of individuals per house was assumed to be eight. The water consumption following water-saving fitting installations was estimated by subtracting the water savings of the fittings from the total water usage before the installation of water-saving fittings.
To calculate the overall water savings in the house, the fittings’ water savings were initially determined. First, the water flow and pressure of a tap without water-saving fittings were measured across three different tap openings: full-open, half (1/2)-open, and quarter (1/4)-open. The water weights were measured using a digital balance at constant flow rates, then converted to volume by dividing with the water density. In all experiments, the water pressure was maintained at 300 kPa. These trials were repeated four times, and the average flow rates were derived. The same experiments were subsequently performed using four different types of water-saving fittings (No. 3, 4, 6, and 7) that are commonly used for homes [47]. Afterward, the average water flows, with and without the fittings, were compared to obtain the four fittings’ average water savings (%).
The toilet water savings were calculated separately using the following steps:
- A full flush toilet is considered to use about 11 L per flush. Comparatively, a dual-flush toilet can reduce each full flush to 4.5 L and each half flush to 3 L [46].
- As there are no data on the ratio of full and half flushes used by nationals in Abu Dhabi, we took the average of a dual-flush toilet’s full and half-flushes as (4.5 + 3)/2 = 3.75 L.
- Thus, the water saving (%) for a toilet is (11 − 3.75)/11 × 100 = 65.9%. This water saving rate is very close to the average water saving rate of fittings (65.2%) (See Section 3.4).
- Thus, the actual water saving rate in a home should be between 65.2% and 65.9%, and the margin of error between these values is less than 1%. It was assumed that toilet flushing water was 25% of the total water consumption in homes [48,49], and the average water savings in a home (%) was calculated using the following equation:
[toilet water savings (65.9) × toilet usage (0.25)] + [water-saving fittings based on the experiment × faucet usage (0.75)] (%).
The monthly water consumption for the home was computed by multiplying the LPCD by the total number of persons in the home (i.e., eight) and 30 days. The actual water supply cost in Abu Dhabi was 2.83 $/m3 [4], and nationals paid 0.57 $/m3 or 0.71 $/m3, as per the water tariff. The government subsidy was calculated as the difference between the actual water supply cost and the water tariff.
3. Results
3.1. Trend Analysis of Water Consumption
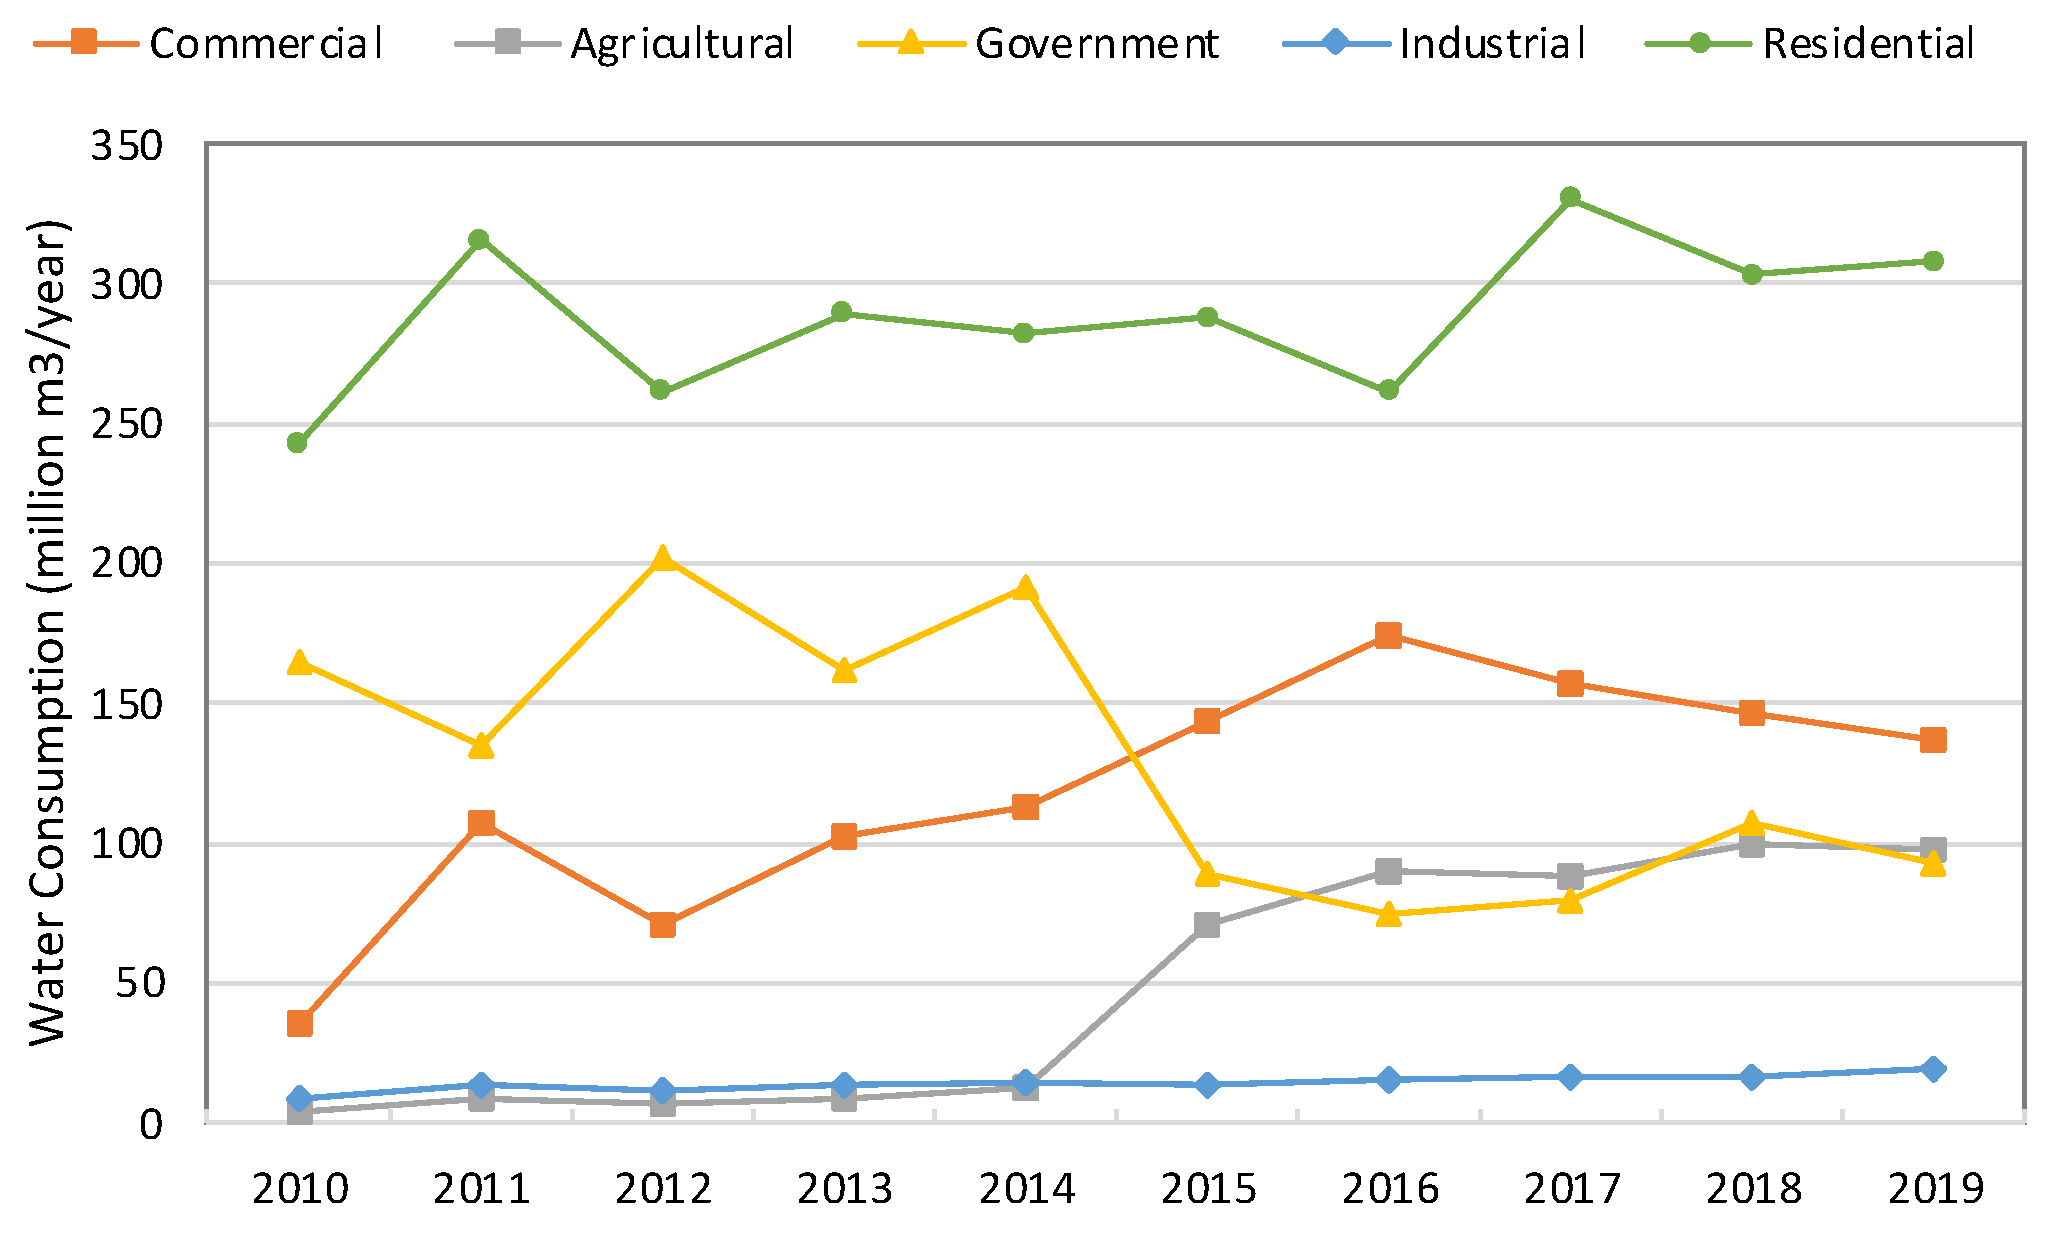
Figure 2 depicts Abu Dhabi’s water use, by category, from 2010 to 2019. In 2015, as part of the tariff reform, the government, commercial, and industry categories were revised, and many consumers were moved from government to commercial. Thus, the government category’s water consumption declined but that of the commercial category soared. Notably, residential water consumption was the highest of all and gradually increased each year. Hence, this study is focused on residential water consumption.
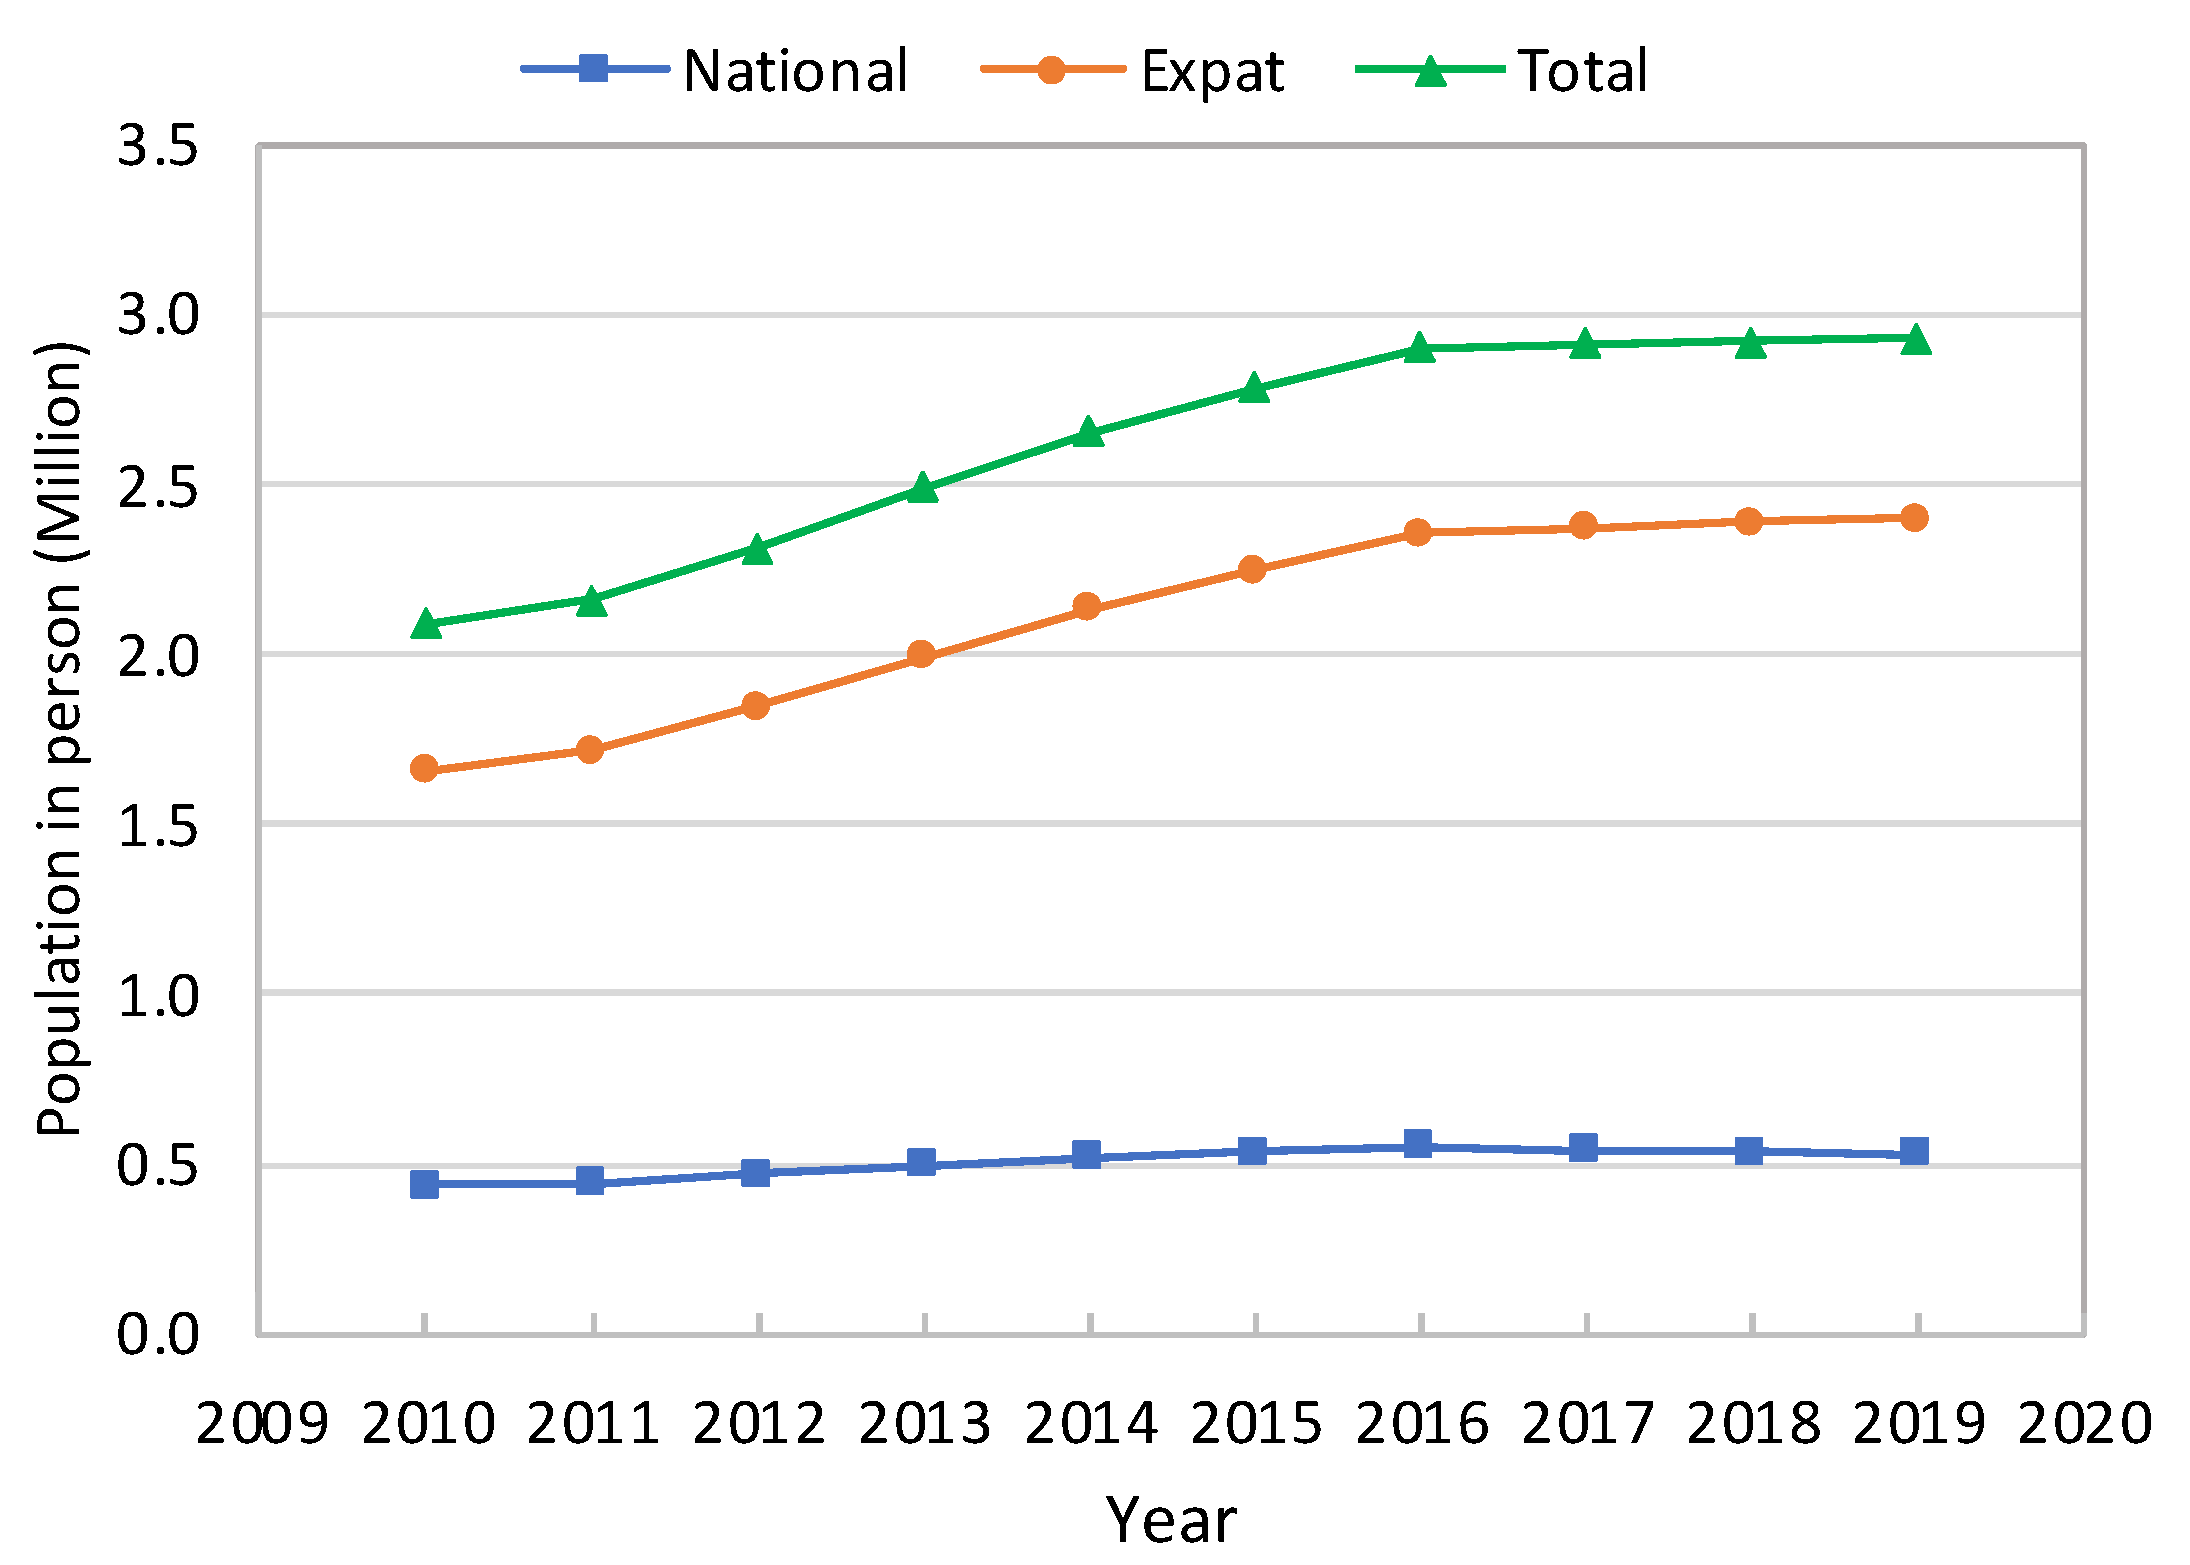
Figure 3 shows the national and expat population. Both of them increased until 2016, but have since leveled off. Abu Dhabi’s expat population (2,404,364, 82%) was nearly five-times greater than that of the national population (527,922, 18%) in 2019.
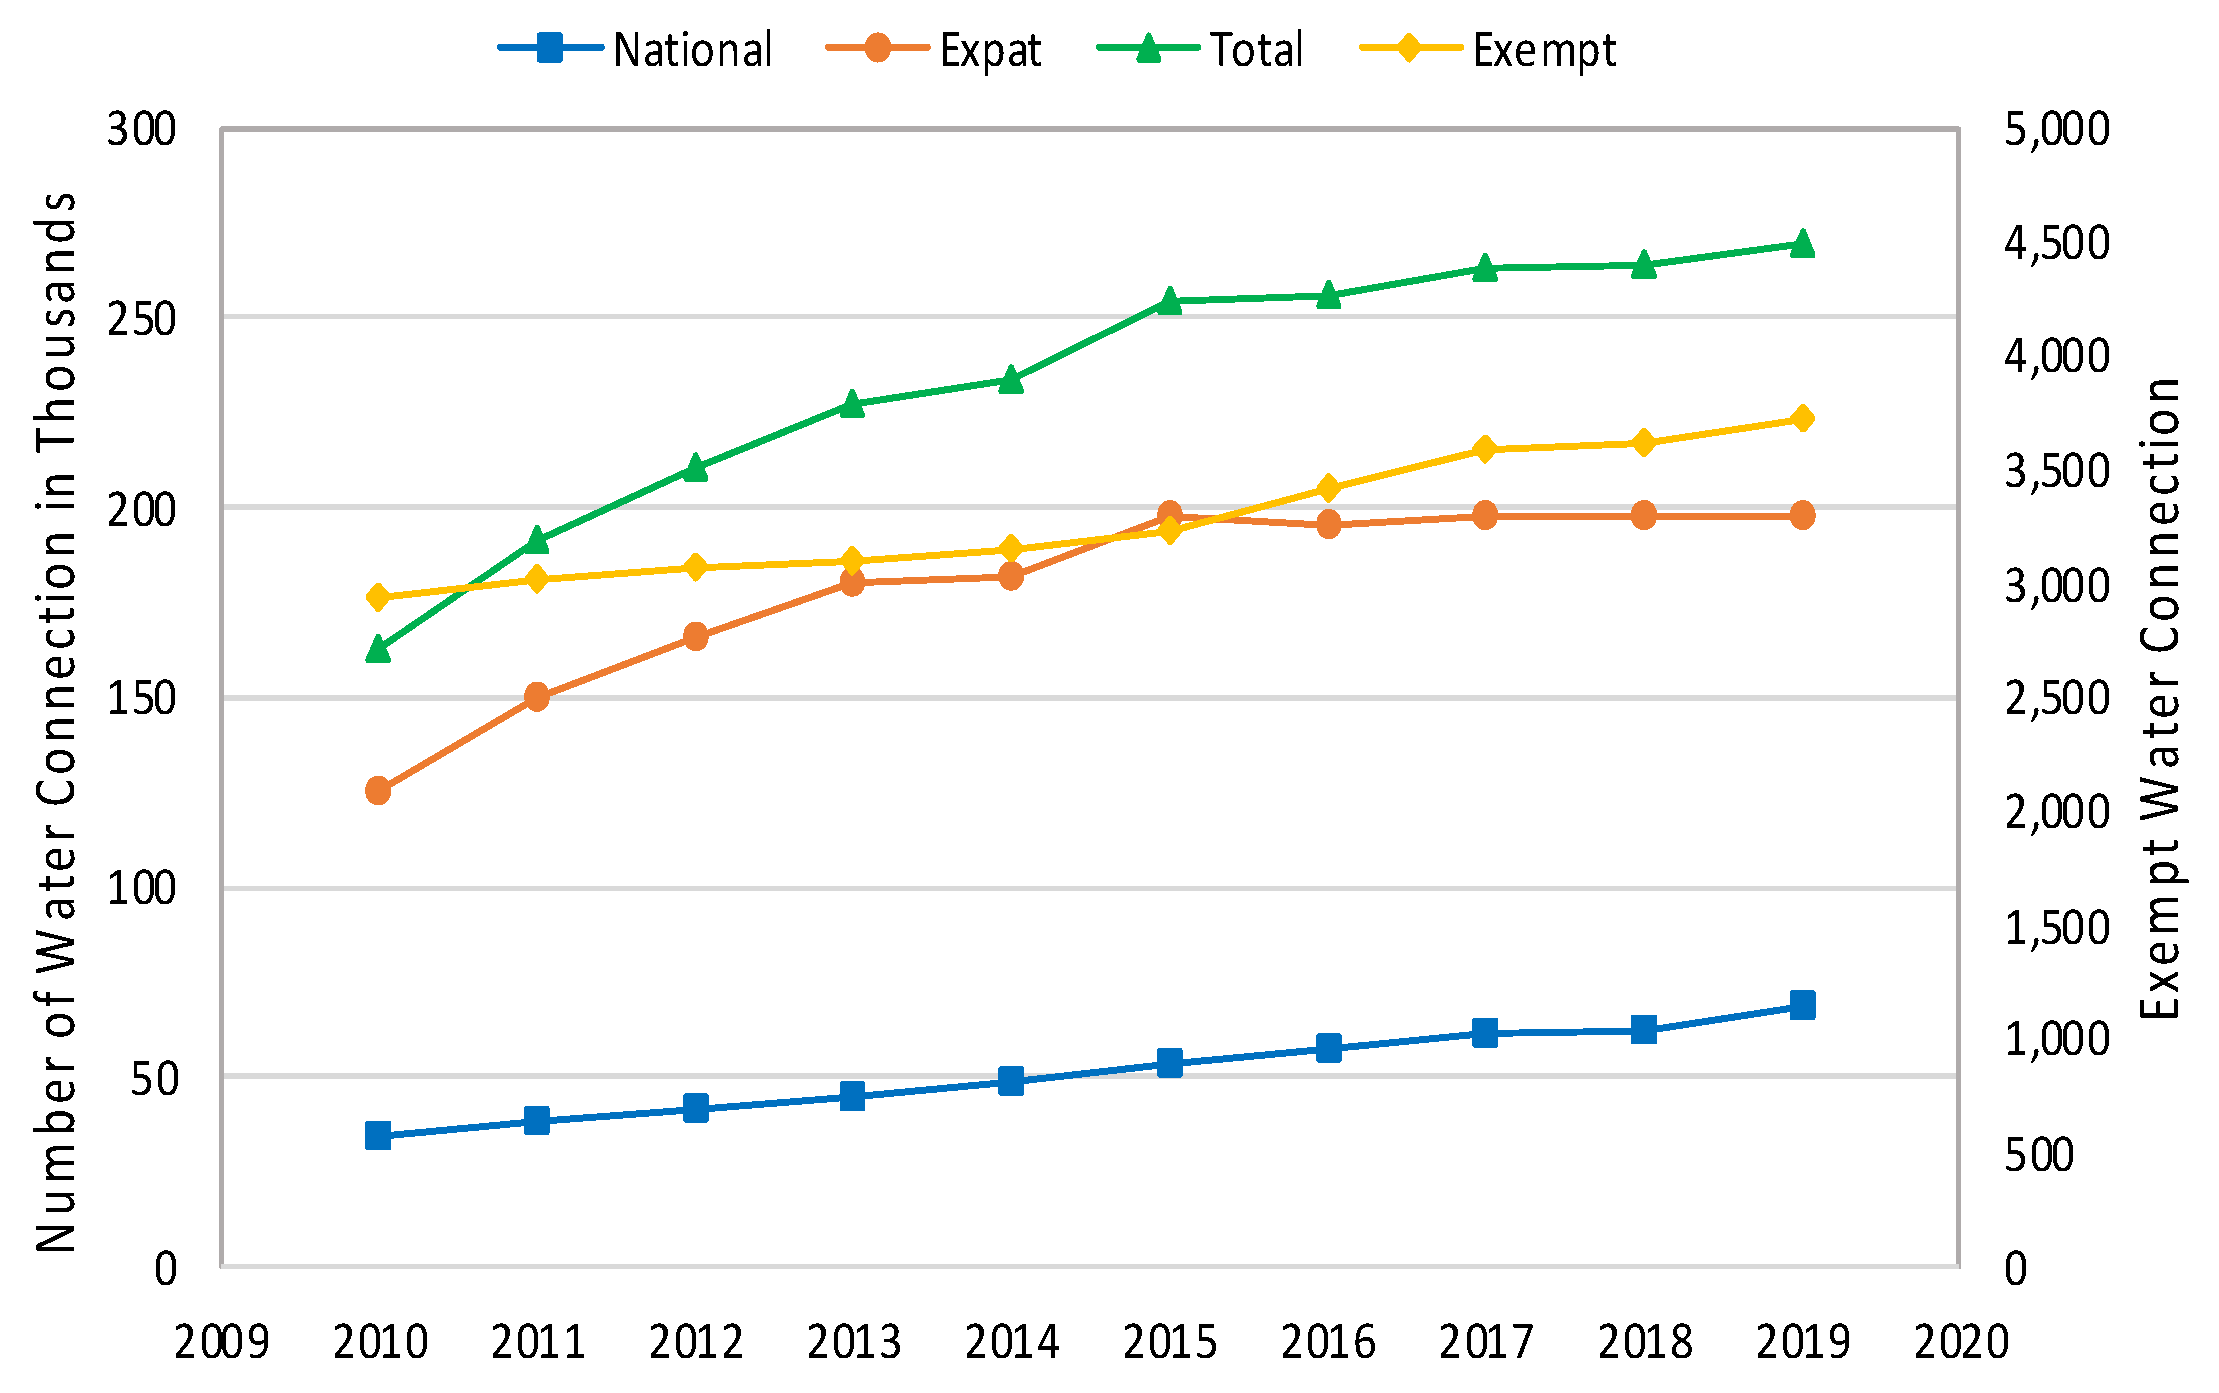
Figure 4 displays the number of water connections for each residential category from 2010 to 2019. In 2019, expats had the greatest number of water connections (~200,000), followed by nationals (~70,000), and finally exempts (~3800). In the last decade, the number of connections increased annually. However, the increasing trend of the expat ceased in 2015, which coincided with the trend of expat population growth (Figure 3). However, the connection numbers of nationals and exempts continued to increase even after 2015, although the population increases nearly halted in that year (Figure 3).
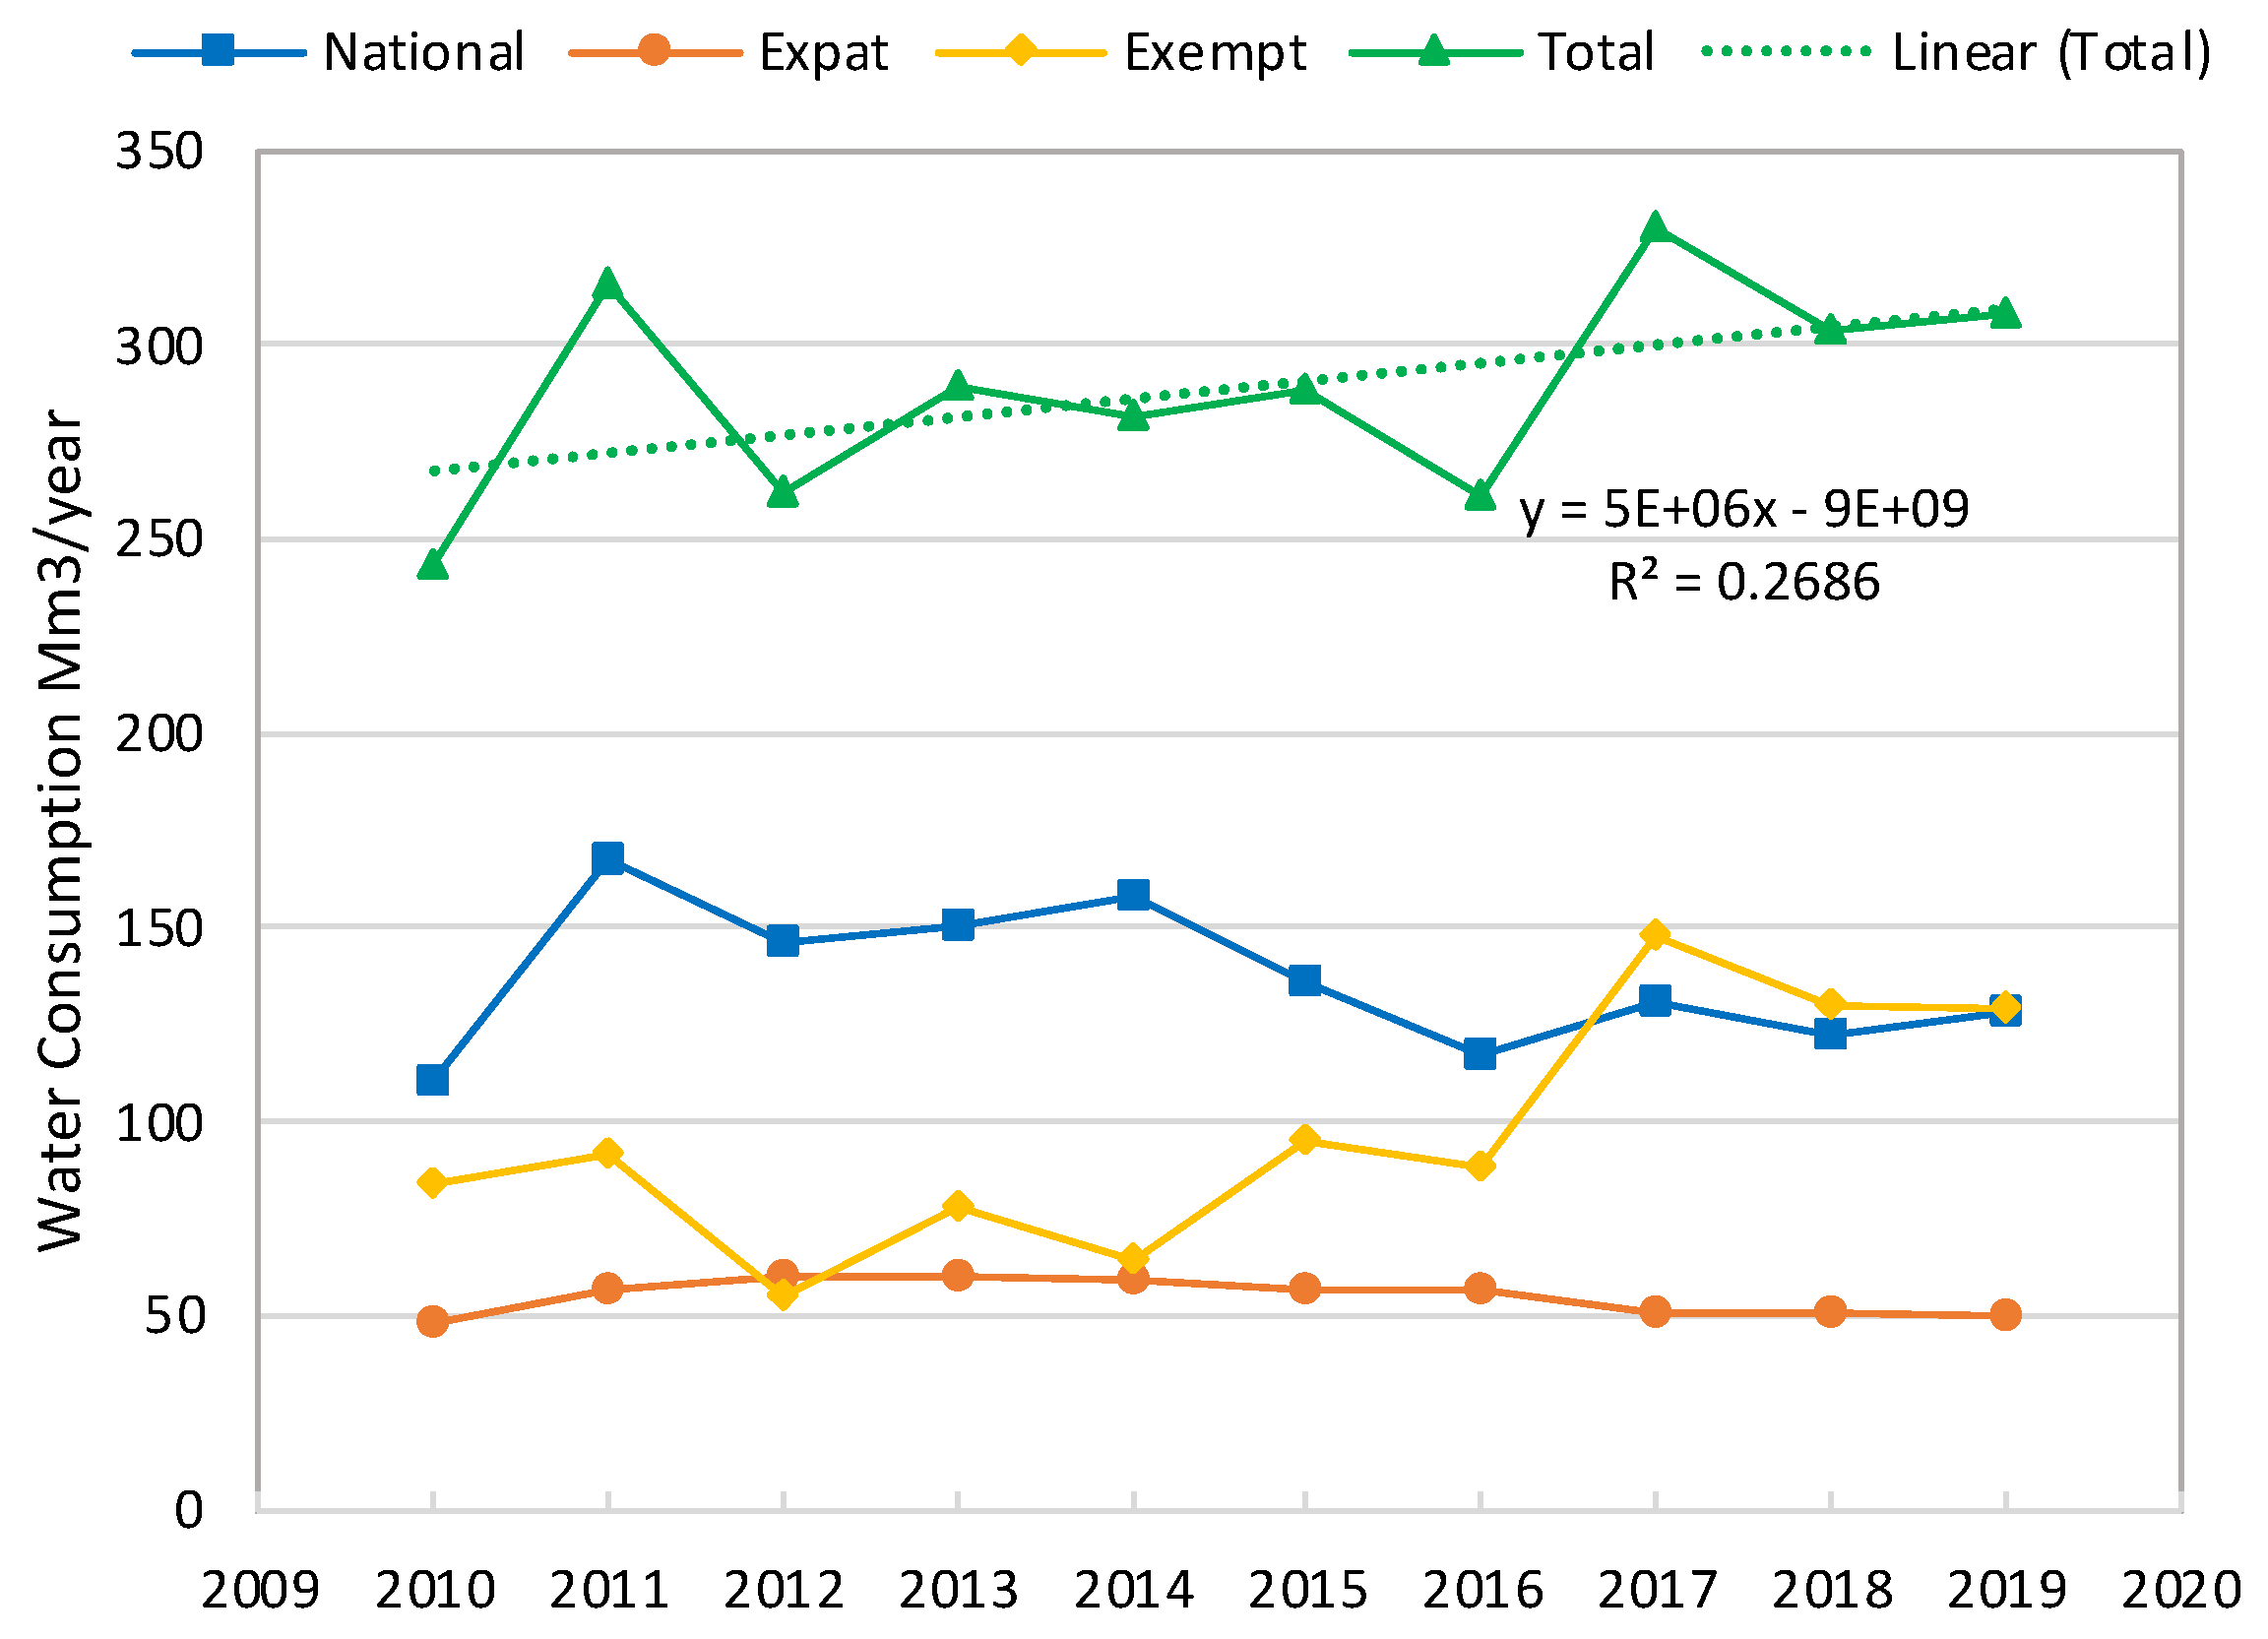
The annual water consumption by category is shown in Figure 5. The total water consumption increased since 2010, rather than declining by 30–35% as projected by the UAE government [21]. The annual water consumption by nationals was the largest, but started to decrease since 2011. However, the tariff reform in 2015 appeared not to have influenced the nationals’ water consumption. This will be discussed in the following sections. The annual water consumption in the exempt category increased significantly since 2013; however, no reason for this could be found, as no details on the exempt have been disclosed. The annual water consumption by expats decreased slightly since 2015, which coincided with the water tariff reform.
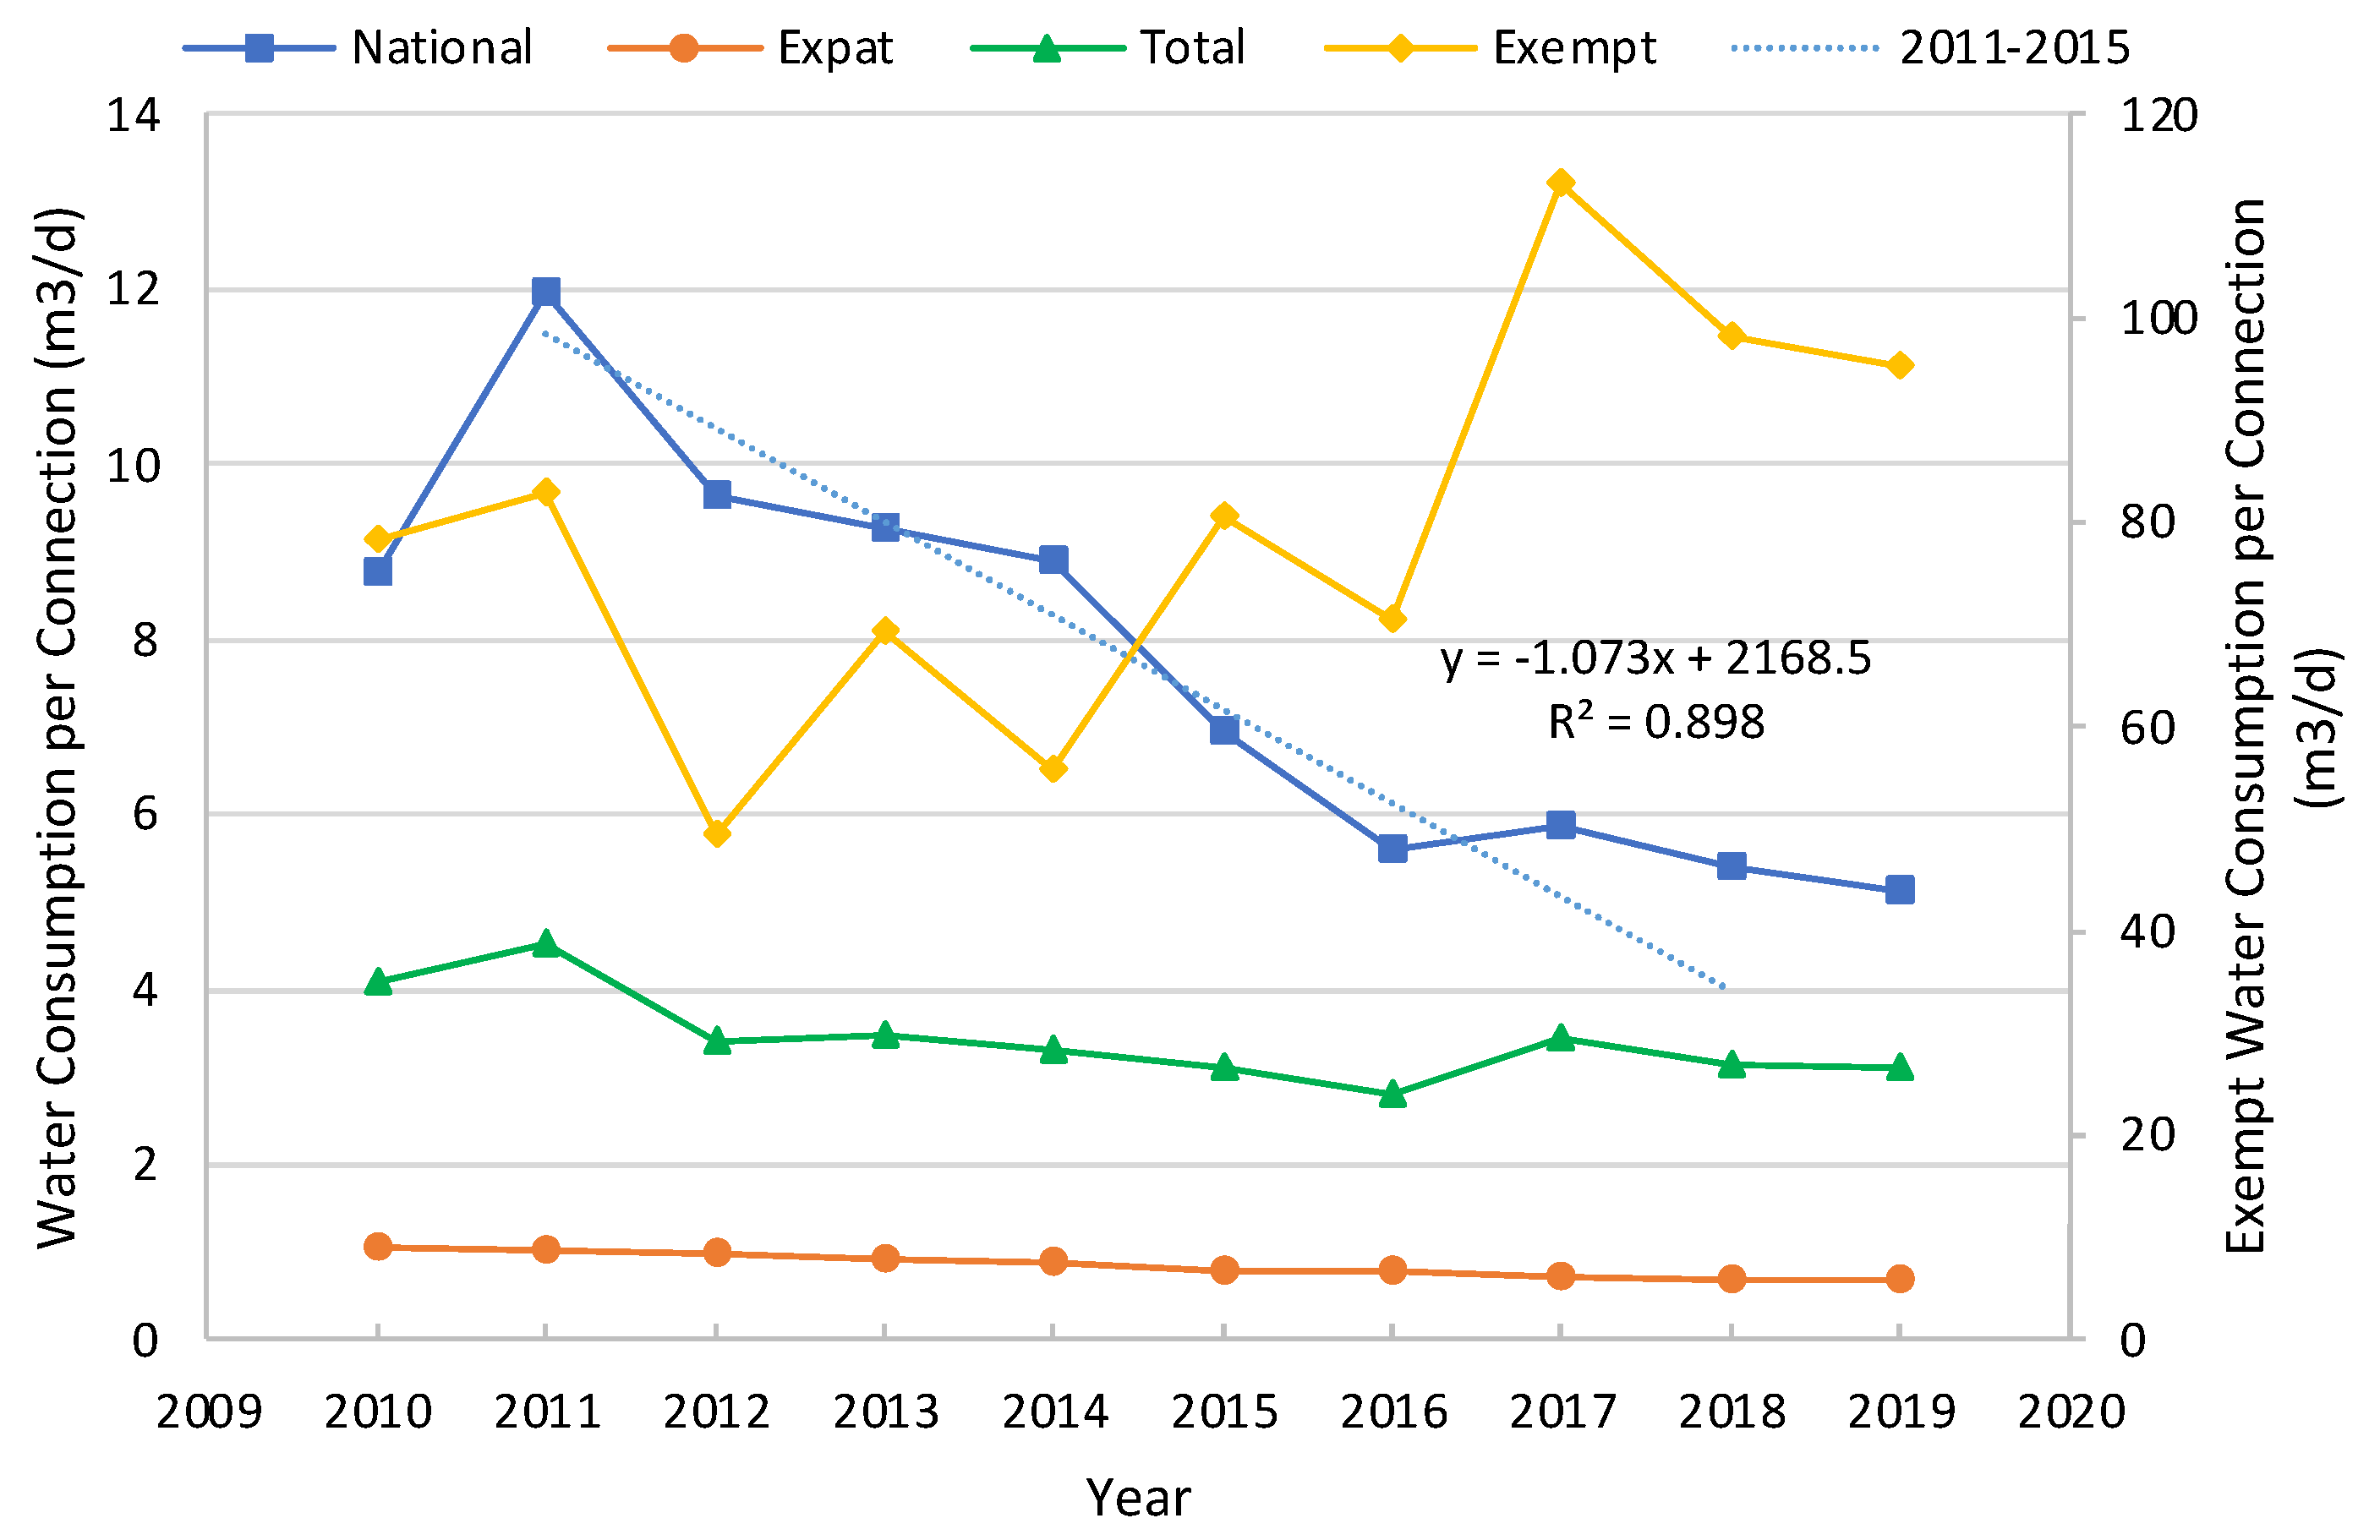
Figure 6 illustrates the water consumption per connection for each residential water user category. Despite having the fewest connections, the exempt category had the highest water consumption per connection (95.19 m3/d/connection in 2019), followed by the nationals (5.14 m3/d/connection), and the expats (0.70 m3/d/connection). The water consumption per connection of the exempt varied significantly, and showed an increasing trend from 2012 onward.
On the other hand, the water consumption per connection steadily decreased for nationals since 2011. Thus, a trend line was drawn from 2011 to 2015 and extended to 2018 to show the decreasing trend. Although the water consumption per connection decreased from 2015 to 2016, the declining trend started earlier, in 2011, and the reduction from 2015 to 2016 followed the trend line, as shown in Figure 6. Therefore, the effects of the water tariff on residential nationals was deemed to be minimal.
Table 2 shows the population per connection for both nationals and expats. It was noted that the persons per connection in the national category decreased from 12.7 to 7.7 persons per connection between 2010 and 2019. However, the expats’ persons per connection remained nearly consistent at an average of 11.8 (max. 13.2 and min. 11.1) during the same period.
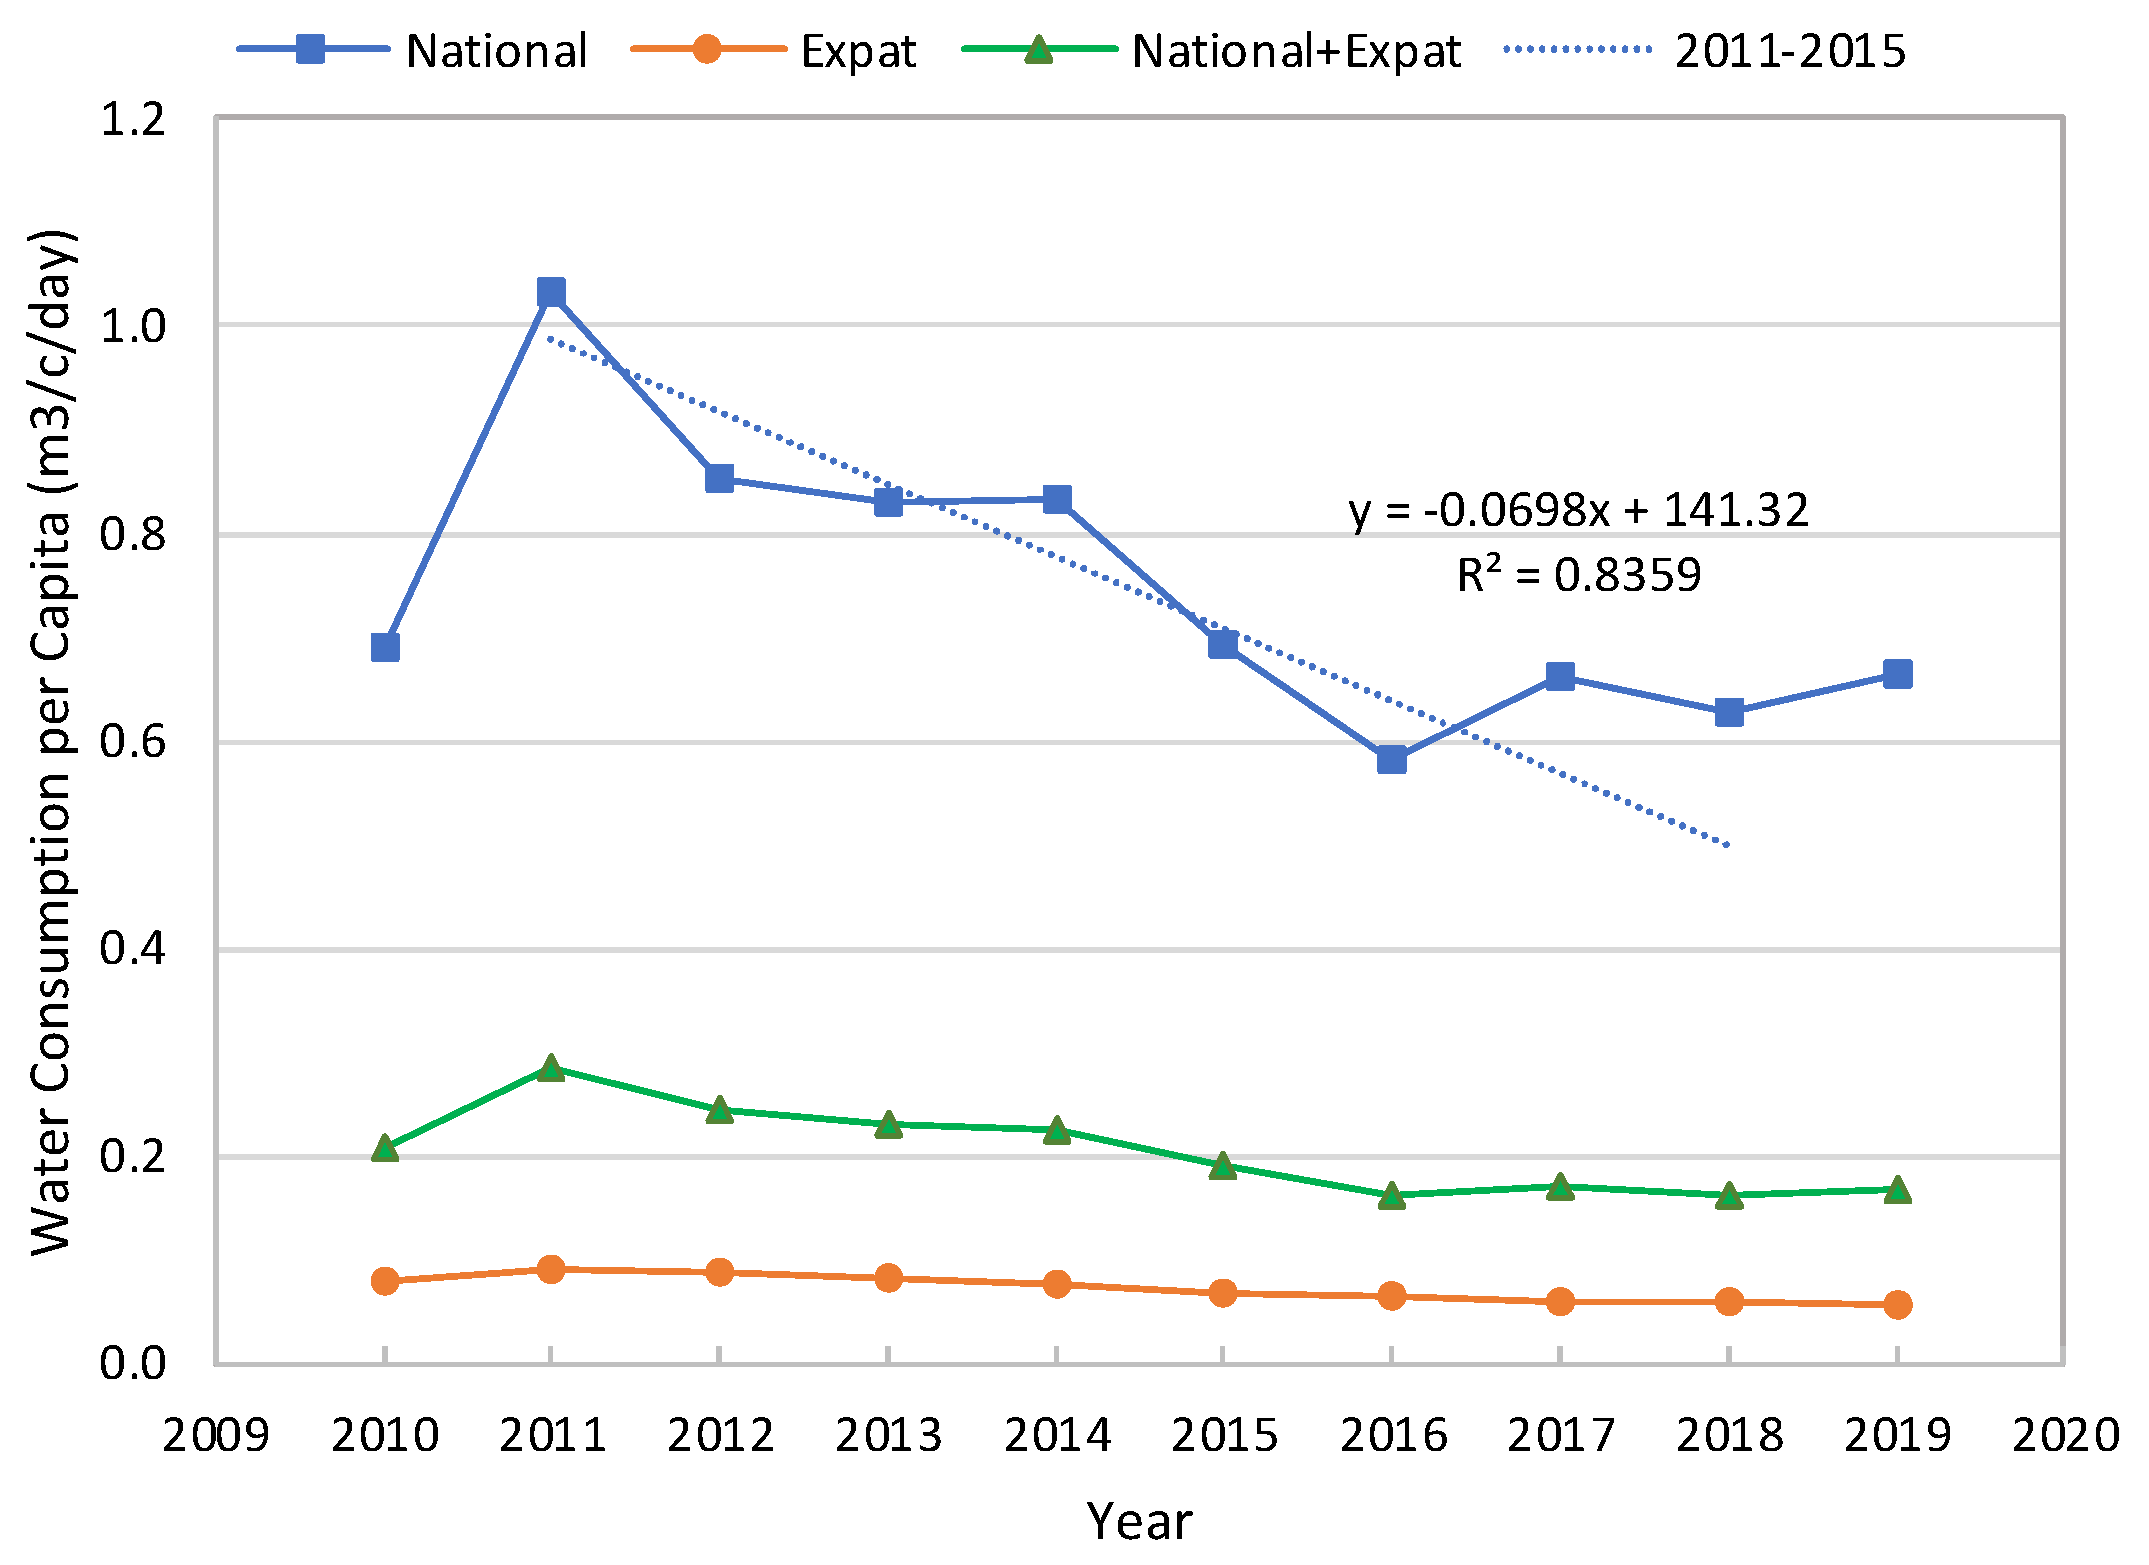
Figure 7 displays the per capita water consumption of the nationals and expats. The nationals’ water consumption per capita was about ten-times greater than that of expats, although both peaked in 2011 and then declined until 2016. The nationals’ water consumption decreased from 1016 to 582 LPCD (42.7% reduction), while expats decreased from 91 to 58 LPCD (36.2% reduction). These results indicated that nationals consumed about three times the global average of 180 LPCD [3], whereas the expats used less than one-third of it in 2019. Such a large difference in per capita water usage might be due to differences in home types (i.e., villa vs. apartment), lifestyles, the duration of time spent at home, and the income and water tariff levels. In any case, there was no additional water-saving margin for expats as it was already low, while nationals could conserve more water.
The trend line was drawn from 2011 to 2015 for nationals and then extended to 2018 to show the decreasing trend. Although the per capita water consumption in 2016 decreased from 2015, it was not significantly lower than the trend line (Figure 7). These results suggested that the 2015 tariff reform had a minimal influence on the nationals’ per capita water use.
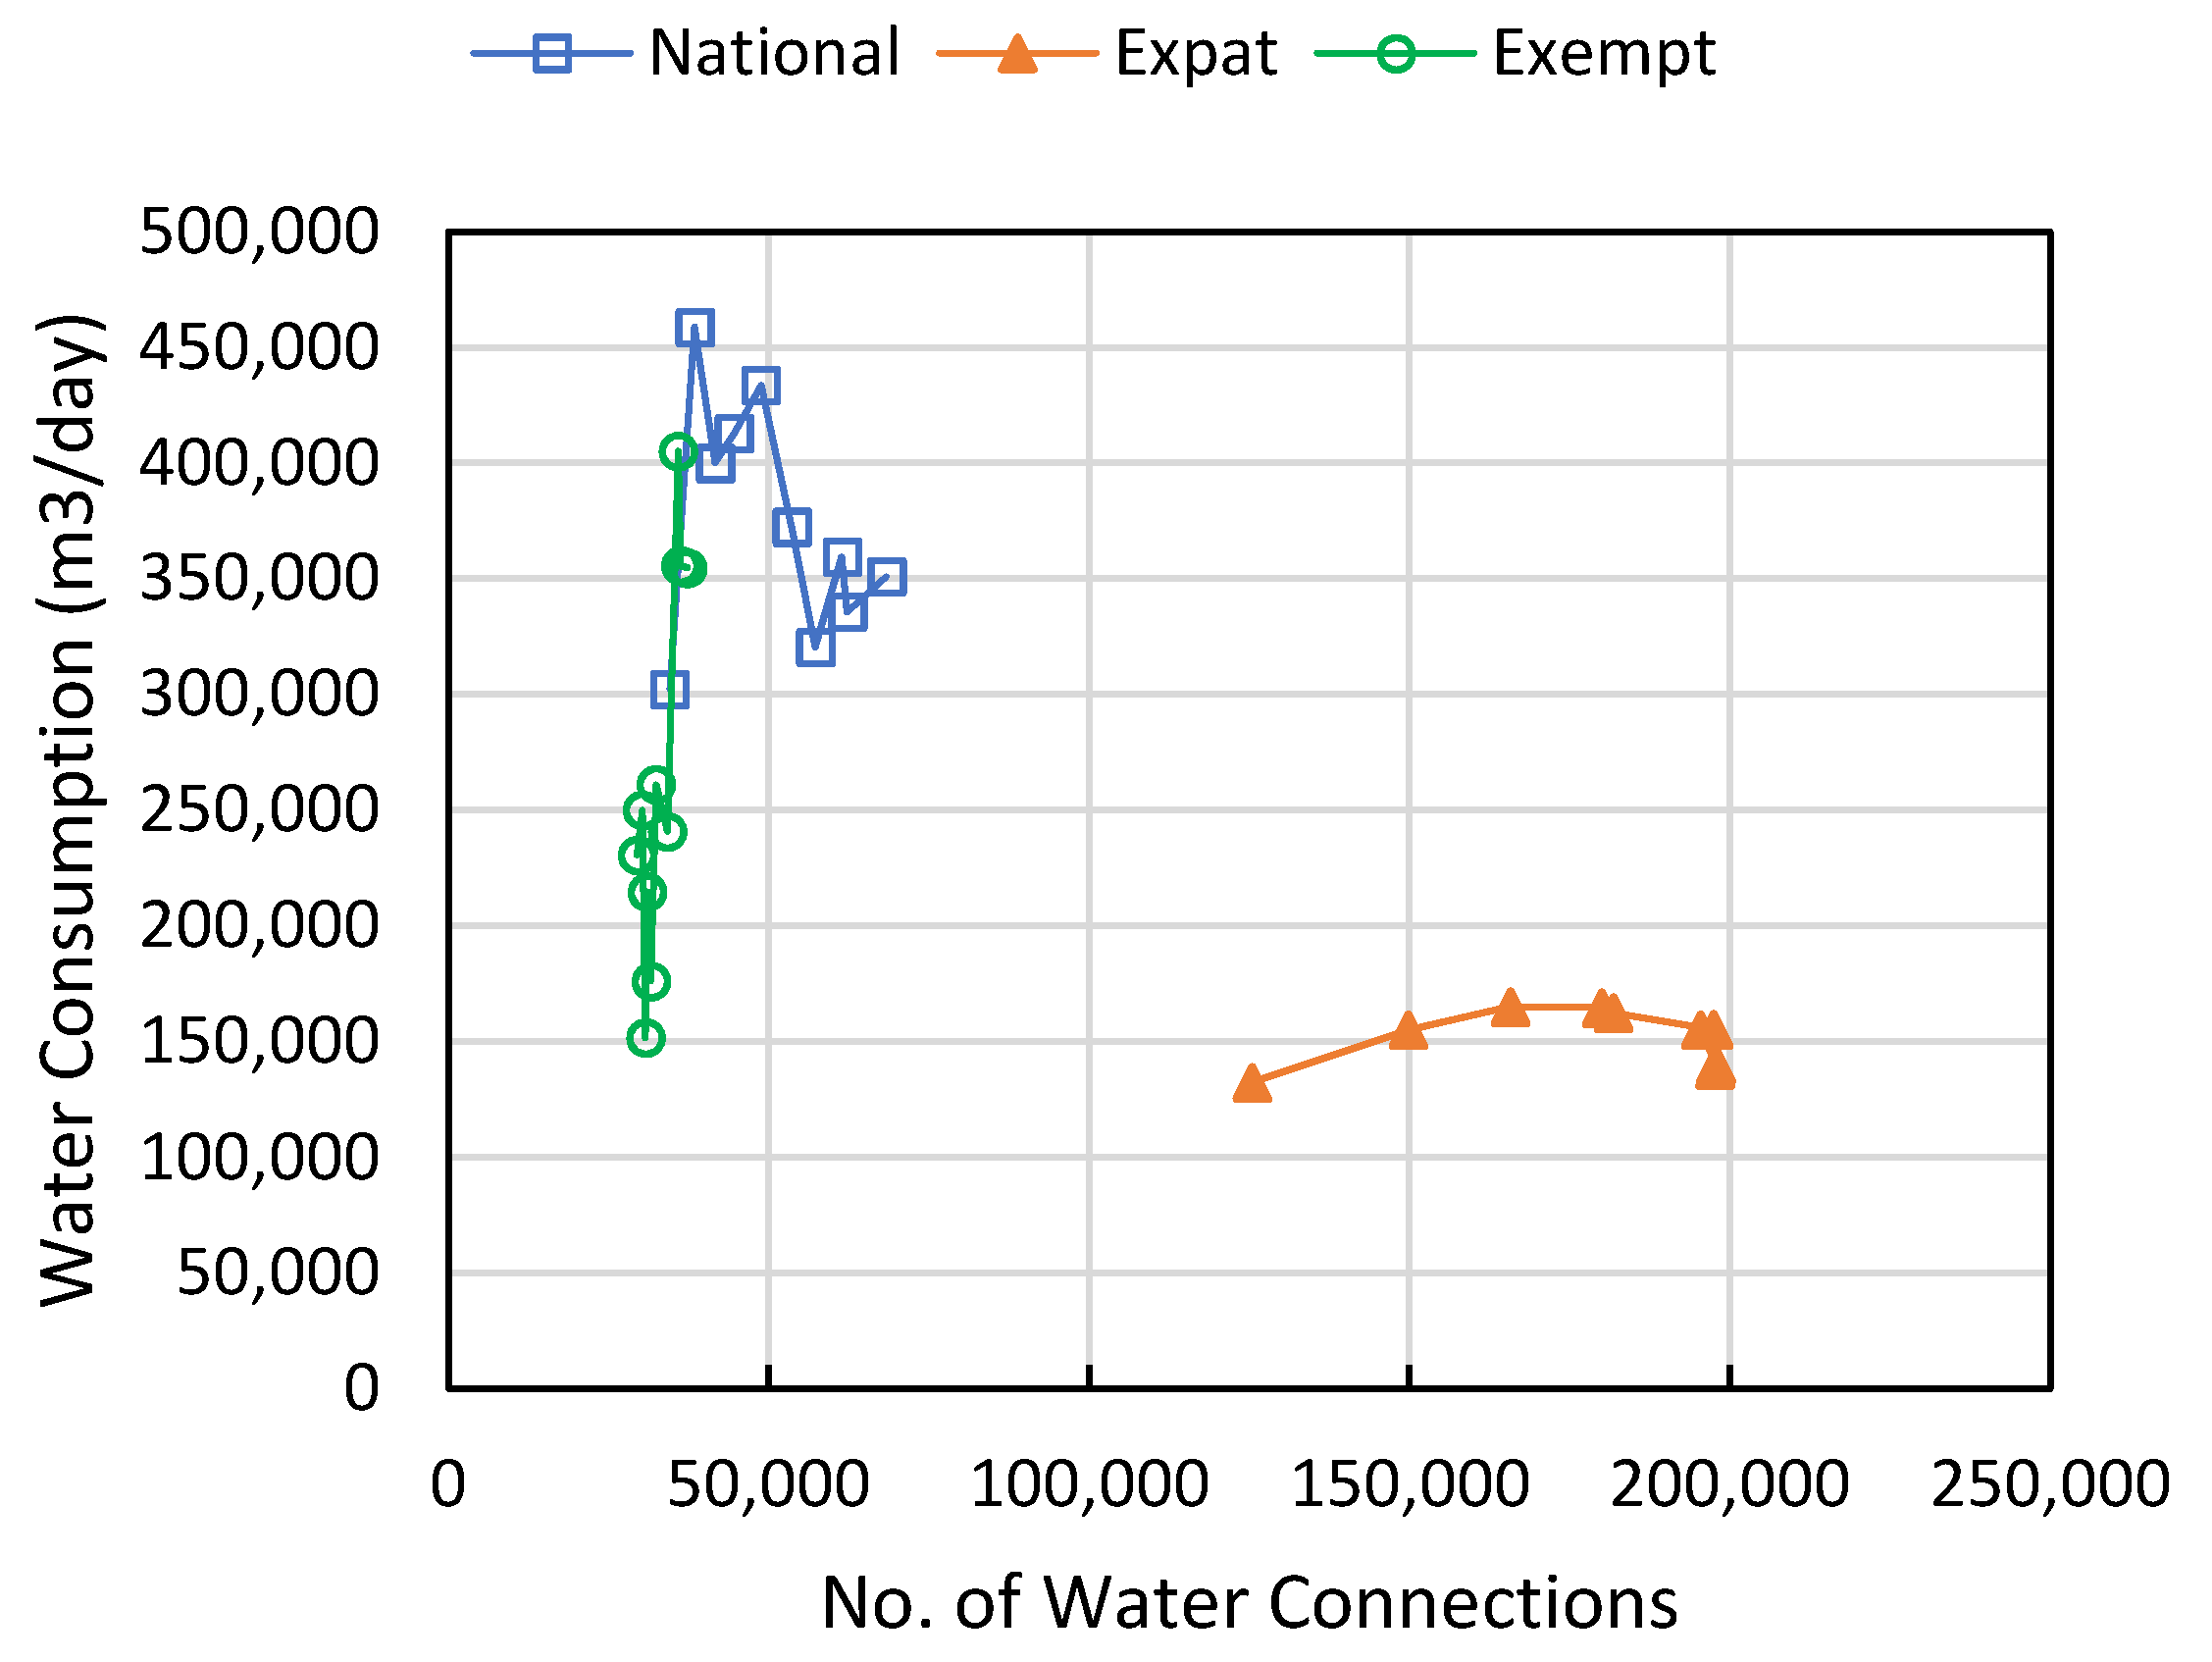
Figure 8 shows the relationship between the numbers of connections and water consumption for the three categories from 2010 to 2019. For nationals, their water consumption rose along with the number of connections, but eventually decreased. Although there were variations in water usage, the declining trend implied that new connections were more efficient in terms of water savings for nationals. For expats, water consumption increased slowly as the number of water connections increased but ultimately decreased slightly.
This suggested that the rise in new connections had a lesser impact on expats than on nationals, perhaps because they were already conserving water. Despite the slight increase in the number of water connections, the exempts’ water use climbed significantly. The results demonstrated that, rather than the number of connections, other factors, such as water conservation, had a greater influence on water consumption.
3.2. Effect of the 2015 Water Tariff Reform
To further verify the impact of the 2015 water tariff reform, the water bills of expats and nationals were compared along with their incomes. The expat salary ranged from 817 to 1360 $/month [50,51,52], while the water tariff for the expats living in apartments was 2.83 $/m3 (Table 1). Assuming a maximum LPCD of 91 LPCD in the past, the amount expats paid for their monthly water consumption was (91 × 30 days)/1000 × 2.83 = 7.73 $/month. This finding implied that the increased water tariff might not be the cause of water conservation.
The same was true for nationals, who had higher salaries and lower water expenses than expats. The salary for nationals ranged between 3300 and 6800 $/month [50,51,52]. With the past maximum water consumption of 1000 LPCD and a water tariff of 0.71 $/m3, the monthly water bill for the nationals living in a villa was (1000 × 30 days)/1000 × 0.71 = 21.3 $/month. As this number represented less than 0.5% of the average national salary, the water tariff increase was not a strong incentive for them to save water. This result was in agreement with an Australian study’s finding, which reported that residential water demand was price inelastic because of its low relative cost compared to other life essentials [18].
To examine whether a water tariff would be an effective tool for WDM if consumers were required to pay the full cost, another calculation was performed. Due to the fact that the actual water production cost (without subsidy) was 2.83 $/m3 [43], nationals would pay (1000 × 30 days)/1000 × 2.83 = 85 $/month without subsidy. Thus, it may be hypothesized that a tariff that caused consumers to pay the full cost of water production could encourage them to save water. However, it could also take many years for consumers to agree with its implementation. Although cross-subsidization through progressive block tariffs is common in many countries, Abu Dhabi has a large number of exempt consumers. Therefore, a water tariff increase may not be a viable option for water conservation, or might take numerous years to take effect in Abu Dhabi.
3.3. Residential Water Consumption
3.3.1. Residential Water Consumption in Khalifa City
Table 3 shows the numbers of connections and water consumption by nationals in the residential area of Khalifa City in 2018–2020 [42]. The term 3-year customer refers to customers who have used the same water connections for at least three years. The new customers are those who started to use water either in 2019 or 2020. The 3-year customer ups/downs show the number of customers who consumed more or less water in comparison with the previous year. Although customers increase or decrease their water consumption year by year, the numbers of increases (ups) and decreases (downs) were almost the same over three years. No clear trend of either increasing or decreasing water consumption could be seen among the 3-year customers.
The number of new customers increased from 2018 to 2020 (at rates of 10.38% from 2018 to 2019 and 8.89% from 2019 to 2020) because Khalifa City is a new development area. The average water consumption for the 3-year customers was higher (1411–1451 m3/year) compared to the average consumption for new customers (362–395 m3/year) in 2019 and 2020; the reduction rate of new customers from 3-year customers was 74.4%. As new customers could have moved into Khalifa City in the middle of a given year, rather than in January, it is understandable that the annual water consumption of new customers was less than that of 3-year customers who lived in the same home throughout a year.
Thus, the average 2020 water consumption of new customers who moved in the previous year, i.e., 2019, was also presented as 762 m3/year in Table 3. This was 46.0% less than the average water consumption of 3-year customers and nearly twice as large as the average water consumption of new customers in the year when they moved (362–395 m3/year). This was quite understandable if we assumed that similar numbers of families moved into Khalifa City in each month.
3.3.2. Variation of Monthly Water Consumption
The national families are typically large households with three generations and siblings. Thus, the number of family members is high, as shown by persons per connection in Table 2. Adults who live with their parents sometimes leave their homes for business and then return to stay together. This kind of family structure makes determining the monthly household water consumption as a basis for water usage studies challenging.
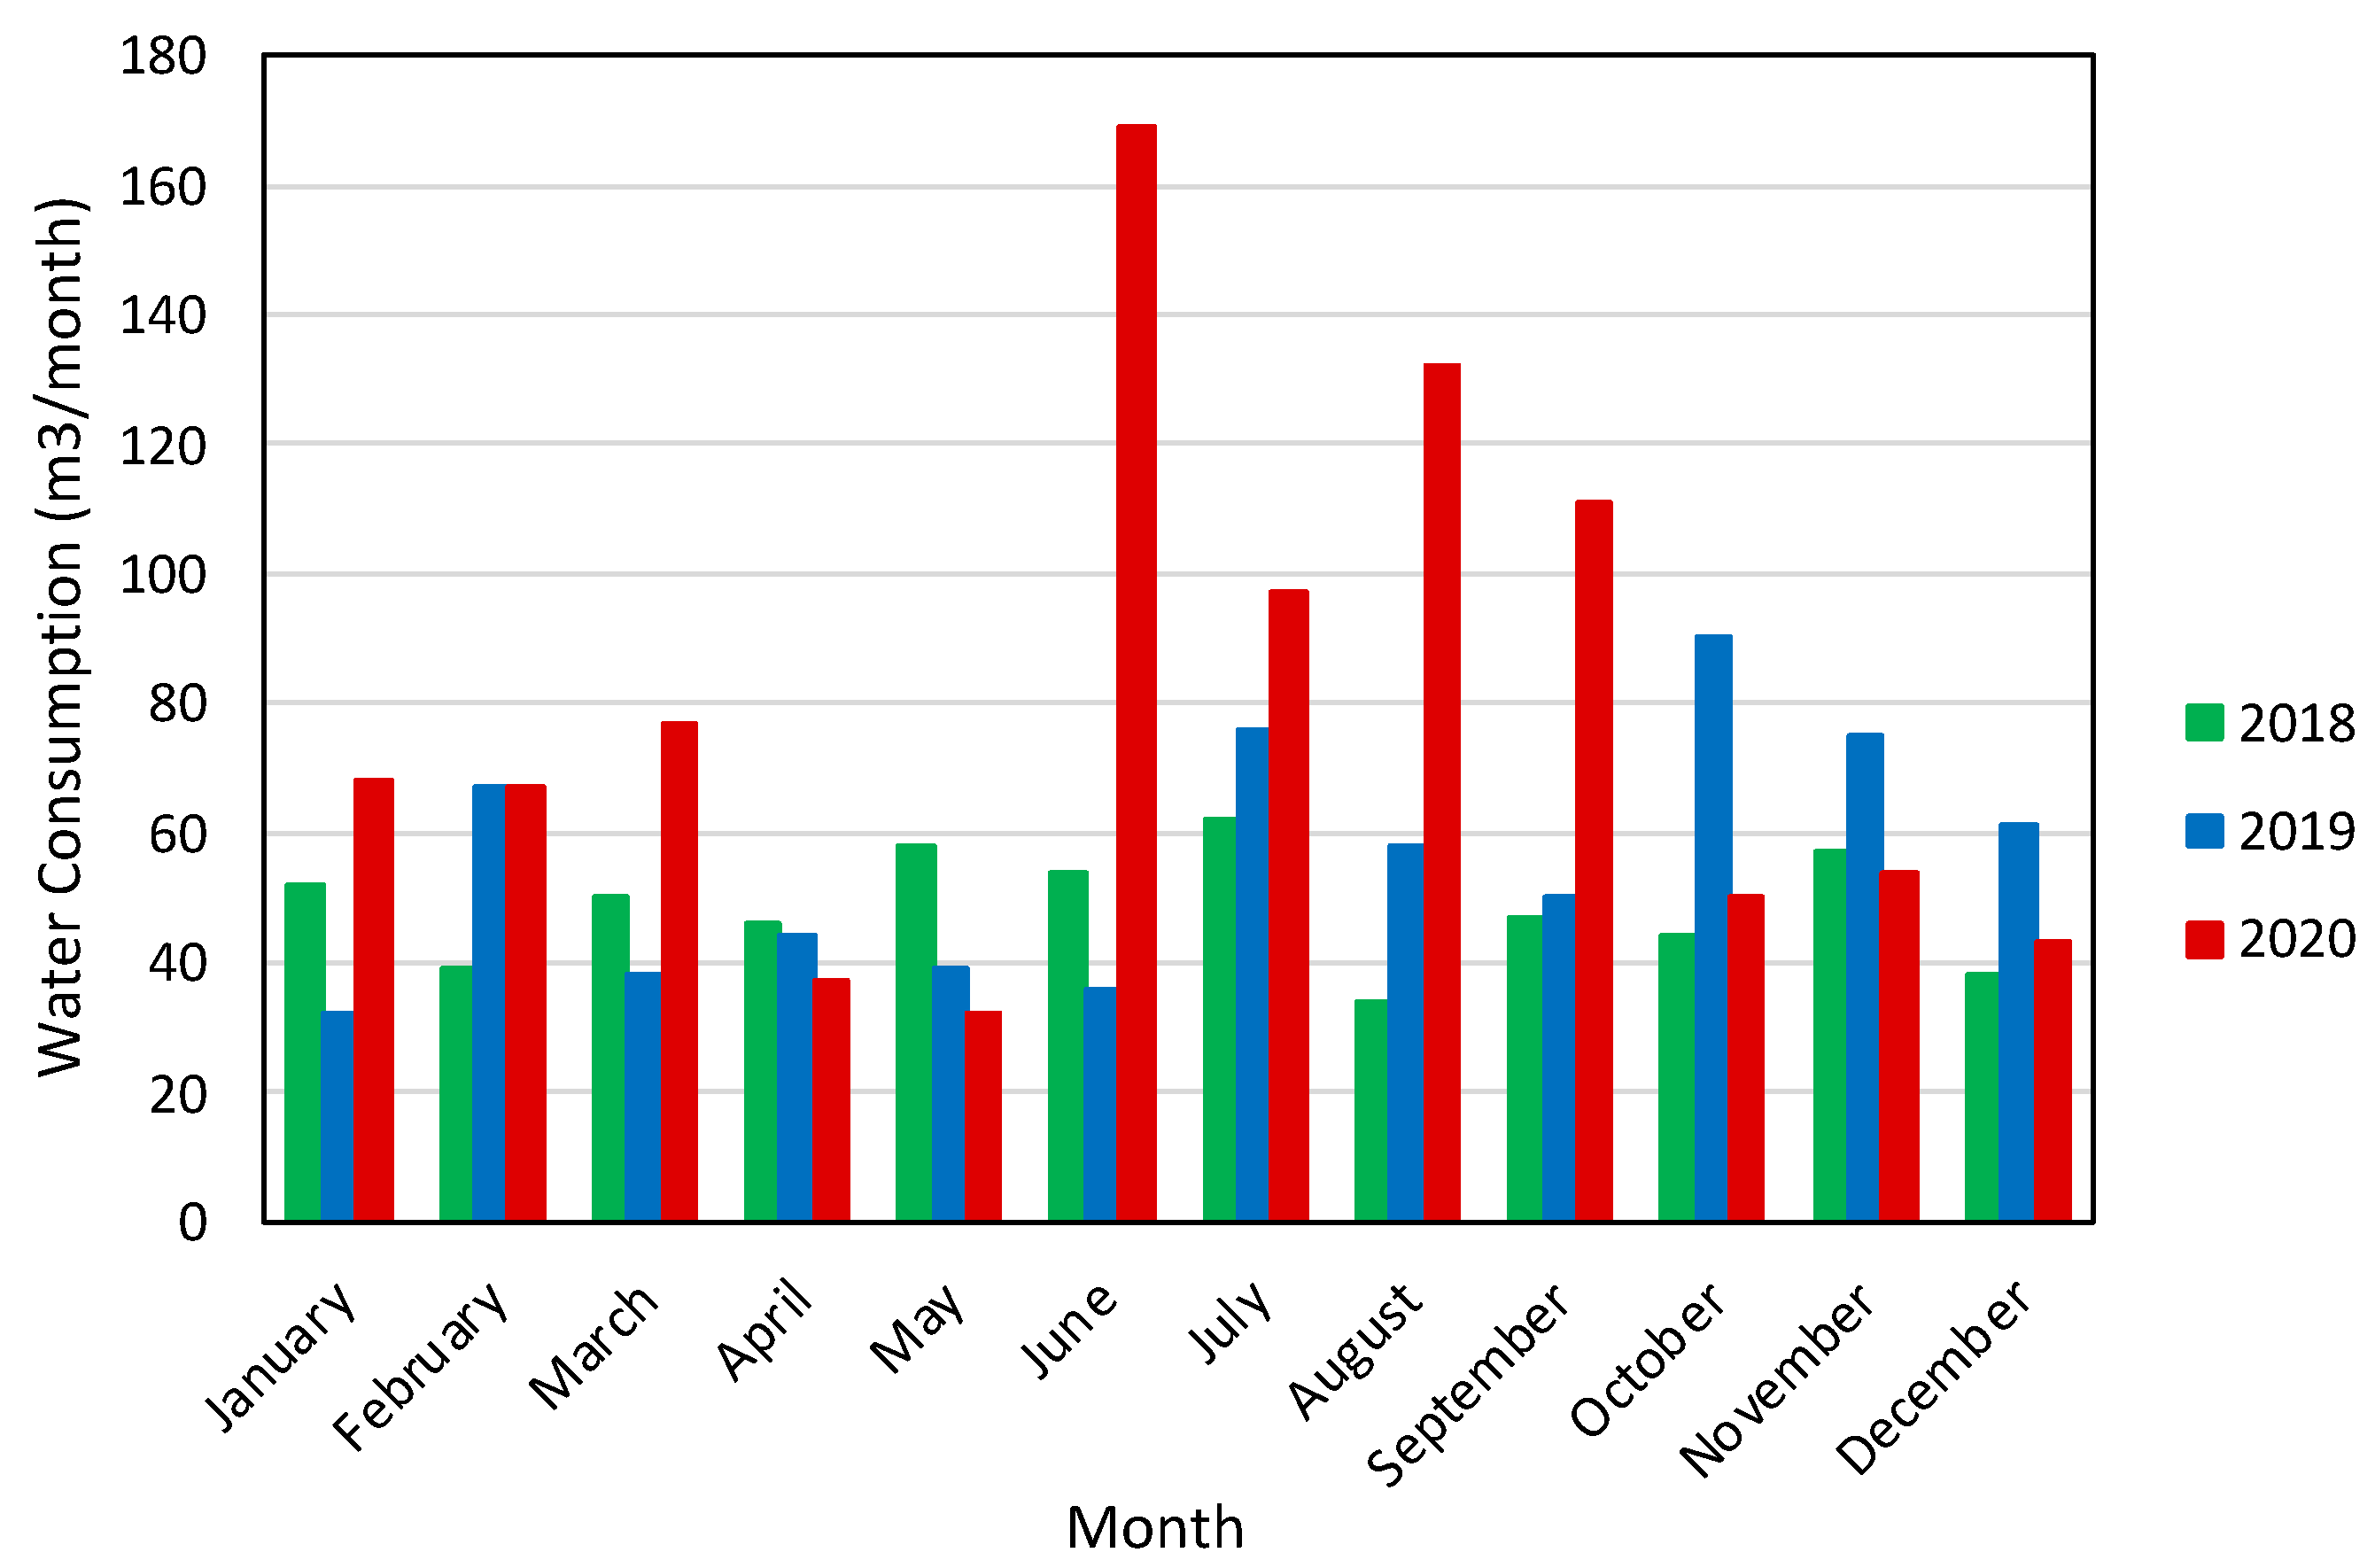
To illustrate such variation in monthly water consumption, the water consumption per connection of a typical national family between 2018 and 2020 is shown in Figure 9. In 2018, the maximum monthly water consumption was 62 m3/month, while the minimum was 34 m3/month; a difference of 28 m3/month, an 80% increase from the minimum to the maximum. In 2019, the minimum was 32 m3/month in January, while the maximum was 90 m3/month in October, a 190% increase.
Monthly water consumption changes in 2020 were exceptional, because family member stayed at home for much of the year due to the COVID-19 pandemic. The UAE government requested that everyone remain at home beginning 23 March 2020 [53]. Therefore, monthly water consumption after March reflects usage during the stay-home alert. The low water consumption in April and May of 2020 was due to the work-at-home policy, during which no meter readings were taken. Conservative (i.e., low) estimated values were recorded on the water bill in those months. The high water usage in June 2020 was determined by an actual meter reading. The water consumptions in 2018, 2019, and 2020 were 581 m3/year, 666 m3/year, and 937 m3/year, respectively; the unusually high water consumption in 2020 was possibly because of the COVID-19 pandemic.
3.4. Effectiveness of the Water-Saving Fittings
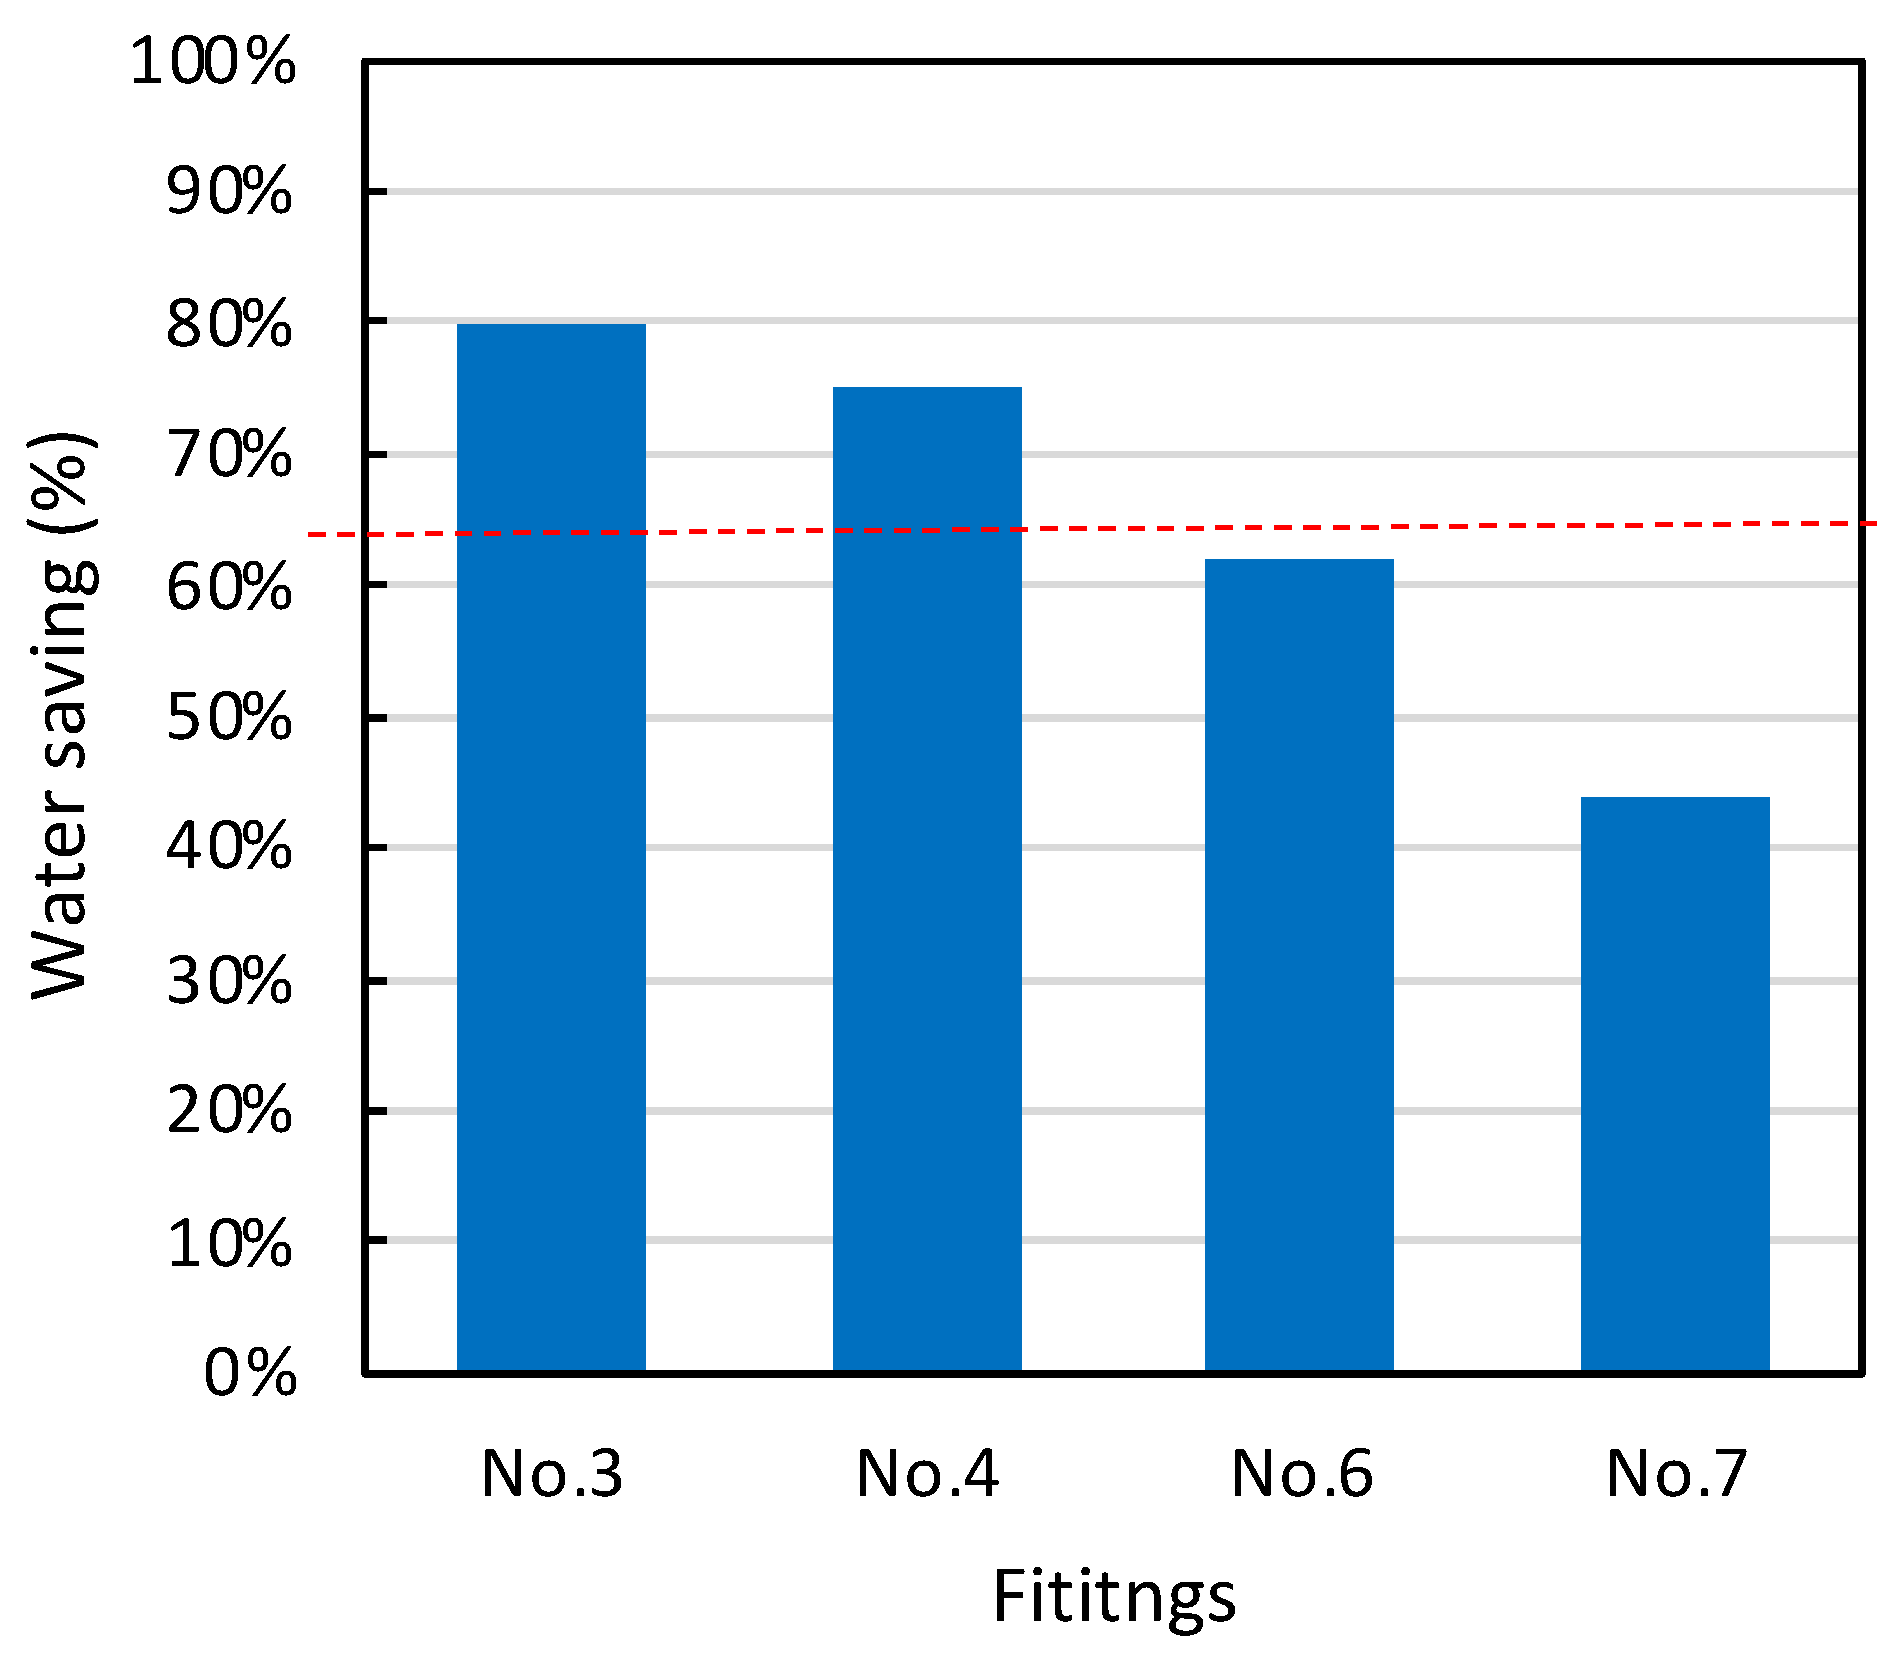
Figure 10 depicts the average water savings for the four types of water-saving fittings based on measurements of quarter-, half-, and full-open water flow. The water saving rates differed depending on the types of the fittings, ranging from the highest savings of 80.0% with No. 3, to the smallest savings of 44.0% with No. 7. Since there was no information on how many of these types of water-saving fittings were in use in Abu Dhabi during the period of study, the red dashed line in Figure 10 was drawn to show the arithmetic mean of these four water-saving fittings as 65.2%.
Figure 11 shows the average water savings for the three different faucet openings. Although the water saving rates varied depending on the fittings, we took an average of these four types of fittings, i.e., 65.2%, as the overall water saving efficiency of these fittings, because there was no information available on how many of them were used in homes in Abu Dhabi. Hence, the weighted average water savings of toilet and fittings was [65.9 × 0.25] + [65.2 × 0.75] = 65.4%. The water consumption after the attachment of water-saving fittings and dual-flush toilets was 100 − 65.4 = 34.6% of the previous total water consumption.
To verify the effectiveness of water-saving fittings, the water and tariff savings for a typical house of an emirate national were calculated. First, the number of toilets and fittings in the home were counted, and the total cost of installing dual-flush toilets and water-saving fittings was calculated (Table 4). The payback period (in months) was then calculated, using two water consumption data measurements: 350 LPCD, as specified in the Guide to Water Supply Regulation, and the actual water consumption rate of 225 LPDC, as noted in the November 2020 water bill (Table 5).
These values were substantially lower than the minimum per capita water consumption of 582 LPCD in Figure 8 because the Guide’s water consumption values reflected the Abu Dhabi government’s strategy to minimize water consumption, and because adults in the home went out for work during the day in the same way as in 2018 (Figure 9). The payback periods for dual-flush toilets and water-saving faucets were computed using the actual water tariff, with and without government subsidies. Table 4 shows that, for 225 LPCD, the payback period with subsidy was calculated to be 33.3 months (7.2 months without subsidy).
For 350 LPCD, it could be as short as 21.7 months with subsidy, or as little as 14.1 months with 582 LPCD of water consumption. Although toilet flushing was estimated to consume 25% of total water consumption, the cost of dual-flush toilets was 51% of the overall cost of the fittings and toilets. If solely water-saving fixtures were used, the payback period (with government subsidy) would be 14.6 months, but the water savings would decrease from 65.4% to 48.9%. Thus, in practice, it may be possible to replace only a few toilets with dual-flush ones, rather than all of them. The short payback periods and high water savings (i.e., 65.4%) revealed that the use of water-saving fittings was a promising method for nationwide water conservation.
4. Discussion
Although a new tariff for full-cost recovery might lead nationals to save water, it would also be politically controversial. Thus, the promotion of water-saving fittings appears to be the most effective means of implementing WDM in Abu Dhabi. To evaluate the effectiveness of water-saving fittings, the reduction in water consumption effected by their use between 2011 and 2019 was estimated, based on the following assumptions:
- Only new homes had water-saving fittings installed.
- The water-saving rate of water-saving fittings was the same as the 65.4% reported in Section 3.4.
- The increased number of connections after 2011 was equal to the increased number of new homes.
- The number of persons per new connection in new homes was 5.7, including a parent and 3.7 children, as reported by the Statistics Center of Abu Dhabi 2019 [54], with each home also hiring one maid.
- The per capita water consumption in 2011 was assumed as the baseline so that we did not have to consider the effect of water-saving fittings in 2011, taking only new homes built after 2011 into consideration for estimation.
The decreased water consumption of Abu Dhabi nationals between 2011 and 2019 due to water-saving fittings was calculated using the following method. First, the total number of persons living in new homes was determined by multiplying the number of people per connection for new homes by the number of new connections of resident nationals. The number of new connections was estimated by subtracting the number of connections in 2011 from the same number in 2019.
Second, to calculate the water savings in 2019, the per capita consumption (LPCD) in 2011 was multiplied by the number of national persons living in new homes in 2019 and added to the water consumption of maids, which was calculated by the number of maids in new homes multiplied by per capita water consumption of expats in 2011 (91 LPCD). Then, the calculated total water consumption was multiplied by the water-saving rate of 65.4%, described in Section 3.4. Next, it was multiplied by 365 days to determine the total estimated water savings for the year.
Third, the difference in water consumption between 2011 and 2019 was calculated. Finally, the total percentage reduction of water consumption achieved through water-saving fittings was obtained by dividing the total water savings in 2019 by the water consumption reduction from 2011 to 2019.
Based on these calculation methods, the nationals’ reduced water consumption between 2011 and 2019 by water-saving fittings was calculated as follows:
- Number of persons in new homes (new connections)
- = 5.7 persons/connection × no. of new connection
- = 5.7 × (68,325 − 38,384) = 170,664 persons
- Number of maids = number of new connections = (68,325 − 38,384) = 29,941
- Water savings in 2019
- = {(per capita water consumption of nationals in 2011) × (national persons in new homes in 2019) + (per capita water consumption of maid in 2011) × (maid numbers in new homes in 2019)} × (water savings)
- = (0.69 m3/d × 179,646 pers. + 0.091 m3/d × 29,941 pers.) × 0.654 = 78,896 m3/d
- Then,
- 78,796 m3/d × 365 d/y = 28,760,540 m3/y
- Water consumption reduction from 2011 to 2019
- = water consumption in 2011 − water consumption in 2019
- = 167,455,695 − 128,089,354 (Figure 5)
- = 39,366,341 m3/y
- Water consumption reduction by water-saving fittings (%)
- = (water savings in 2019/water consumption reduction from 2011 to 2019) × 100
- = 73.1%
Thus, water-saving fittings might be credited with ~73.1% of the water consumption reduction between 2011 and 2019. As shown in the water consumption reduction of 46.0% by new customers (compared with the 3-year customers), there were significant differences in water consumption between old and new homes. Therefore, more water could be conserved in the future if old homes were to be outfitted with water-saving fittings and fixtures.
5. Conclusions
Based on statistical data of water consumption, water supply connection, and service population, the factors affecting water consumption in Abu Dhabi were analyzed, and the efficiency of water demand management was verified.
(1) The residential sector consumes the largest amount of water among all water use sectors. Although both the national and expat populations have grown, water consumption decreased from 2011 to 2016 and remained nearly stable between 2017 and 2019. The exempt consumers had the largest consumption per connection, followed by nationals and expats. The maximum per capita consumption for nationals was 1016 LPCD, which decreased to 582 LPCD in 2019. Notably, the expats’ per capita water consumption was extremely low; the maximum was 91 LPCD, and the minimum was 58 LPCD.
(2) The water tariff imposed in 2015 was too small compared to the incomes of expats and nationals. Therefore, the 2015 water tariff reform appeared to have had no discernible effect on per capita water consumption. This could indicate that imposing a tariff allowing full-cost recovery for water may be necessary to influence water conservation in Abu Dhabi.
(3) We found that commonly used parameters, such as the monthly water consumption per connection, were not representative parameters for the homes of resident nationals due to the high variability in these data every month in Abu Dhabi. A case study revealed that the ratios of the maximum vs. minimum water consumption in a month were 180% in 2018 and 290% in 2019. The COVID-19 pandemic in 2020 also impacted the monthly water consumption. Thus, it was considered essential to use space- and time-averaged water consumption data in Abu Dhabi, such as the annual water consumption in Khalifa City.
(4) New national residents in Khalifa City consumed 46.0% less water than those who lived in their homes for more than 3 years, presumably because of the installation of water-saving fittings in new homes following the new Housing Rule. Therefore, as the number of new homes and residents increased, the per-connection water consumption in Khalifa City decreased, while long-term residents did not significantly reduce their water consumption during the same period.
(5) A case study was conducted to assess the costs and payback periods of water-saving fittings and dual-flush toilets. Using the actual and guideline values of water consumption per capita, i.e., 225 and 350 LPCD, the payback periods for replacing all the fittings in a villa-type house were estimated to be 33.3 and 21.7 months, respectively. Thus, it was found that there was an economic incentive to replace outdated fittings with water-saving ones.
(6) Based on the water consumption, service population, and connection data in 2011 and 2019, it was established that about 73.1% of the observed water consumption reduction could be attributed to the installation of water-saving fittings and dual-flush toilets in new homes. This result proved the effectiveness of water-saving fittings as an instrument for water demand management.
A significant challenge for water demand management is the presence of the exempt group and the low elasticity of water tariffs. Water-saving fittings were found to contribute significantly to water consumption reduction between 2011 and 2019, and efficacy would only increase if they were to be installed in old homes as well as newly developed ones. Hence, promoting the use of water-saving fittings appears to be the most effective strategy for Abu Dhabi to reduce water demand.
Author Contributions
Conceptualization, S.T. and S.A.; methodology, S.K., T.H. and S.T.; validation, K.O., S.K., T.H. and S.T.; formal analysis, S.A. and S.T.; investigation, S.A.; data curation, S.A.; writing—original draft preparation, S.A.; writing—review and editing, K.O., S.K., T.H. and S.T.; supervision, S.T. All authors have read and agreed to the published version of the manuscript.
Funding
This research was funded by the Scholarship Office (SCO), the President of the UAE’s Distinguished Student Scholarship Program (DSS).
Acknowledgments
The authors would like to extend thanks to the Abu Dhabi Distribution Company (ADDC) for providing the data used in this paper.
Conflicts of Interest
The authors declare no conflict of interest.
References
- Mannan, M.; Al-Ansari, T.; Mackey, H.R.; Al-Ghamdi, S.G. Review Quantifying the energy, water, and food nexus: A review of the latest developments based on life-cycle assessment. J. Clean. Prod. 2018, 193, 300–314. [Google Scholar] [CrossRef]
- Stavenhagen, M.; Buurman, J.; Tortajada, C. Saving water in cities: Assessing policies for residential water demand management in four cities in Europe. J. Cities 2018, 79, 187–195. [Google Scholar] [CrossRef]
- Qureshi, A. Challenges and prospects of using treated wastewater to manage water scarcity crises in the Gulf Cooperation Council (GCC) countries. J. Water 2020, 12, 1971. [Google Scholar] [CrossRef]
- Ruddell, D.M.; Dixon, P.G. The energy–water nexus: Are there tradeoffs between residential energy and water consumption in arid cities? J. Int. J. Biometeorol. 2014, 58, 1421–1431. [Google Scholar] [CrossRef] [PubMed]
- Saif, O.; Mezher, T.; Arafat, H.A. Water security in the GCC countries: Challenges and opportunities. J. Environ. Study Sci. 2014, 4, 329–346. [Google Scholar] [CrossRef]
- Al-Saidi, M.; Saliba, S. Water, energy, and food supply security in the Gulf Cooperation Council (GCC) countries—A risk perspective. J. Water 2019, 11, 445. [Google Scholar] [CrossRef] [Green Version]
- Sahin, E.S.; Bayram, I.; Safak, K.C. Demand side management opportunities, framework, and implications for sustainable development in resource-rich countries: Case study Qatar. J. Clean. Prod. 2019, 241, 118332. [Google Scholar] [CrossRef]
- Al-Zubari, W.; Al-Turbak, A.; Zahid, W.; Al-Ruwis, K.; Al-Tkhais, A.; Al-Muataz, I.; Abdelwahab, A.; Murad, A.; Al-Harbi, M.; Al-Sulaymani, Z. An overview of the GCC unified water strategy (2016–2035). J. Desalination Water Treat. 2017, 81, 1–18. [Google Scholar] [CrossRef] [Green Version]
- Griffiths, S. A review and assessment of energy policy in the Middle East and North Africa region. J. Energy Policy 2017, 102, 249–269. [Google Scholar] [CrossRef]
- Abulibdeh, A.; Zaidan, E.; Al-Saidi, M. Development drivers of the water-energy-food nexus in the Gulf Cooperation Council region. J. Dev. Pract. 2019, 29, 582–593. [Google Scholar] [CrossRef]
- Rambo, K.A.; Warsinge, D.M.; Shanbhogue, S.J.; Lienhard, V.J.H.; Ghoniem, A.F. Water-energy nexus in Saudi Arabia. J. Energy Procedia 2017, 105, 3837–3843. [Google Scholar] [CrossRef] [Green Version]
- Hameed, M.; Moradkhani, H.; Ahmadalipour, A.; Moftakhari, H.; Abbaszadeh, P.; Alipour, A. A review of the 221st-centurychallenges in the food-energy-water security in the Middle East. J. Water 2019, 11, 682. [Google Scholar] [CrossRef] [Green Version]
- Salahuddin, M.; Gow, J. Economic growth, energy consumption, and CO2 emissions in Gulf Cooperation Council countries. J. Energy 2014, 73, 44–58. [Google Scholar] [CrossRef]
- Shomar, B.; Hawari, J. Desalinated drinking water in the GCC countries—The need to address consumer perceptions. J. Environ. Res. 2017, 158, 203–211. [Google Scholar] [CrossRef]
- Dubreui, A.; Assoumou, E.; Bouckaert, S.; Selosse, S.; Maizi, N. Water modeling in an energy optimization framework—The water-scarce Middle East context. J. Appl. Energy 2013, 101, 268–279. [Google Scholar] [CrossRef]
- Bithas, K: The European policy on water use at the urban level in the context of the water framework directive: Effectiveness, appropriateness, and efficiency. J. Eur. Plan. Stud. 2008, 9, 1293–1311.
- Tortajada, C.; Joshi, Y.K. Water demand management in Singapore: Involving the public. J. Water Resour. Manag. 2013, 27, 2729–2746. [Google Scholar] [CrossRef]
- Willis, R.M.; Stewart, R.A.; Panuwatwanich, K.; Williams, P.R.; Hollingsworth, A.L. Quantifying the influence of environmental and water conservation attitudes on household end-use water consumption. J. Environ. Manag. 2011, 92, 1996–2009. [Google Scholar] [CrossRef] [Green Version]
- Seyranian, V.; Sinatra, G.M.; Polikoff, M.S. Comparing communication strategies for reducing residential water consumption. J. Environ. Psychol. 2015, 41, 81–90. [Google Scholar] [CrossRef]
- Mini, C.; Hogue, T.S.; Pincetl, S. The effectiveness of water conservation measures on summer residential water use in Los Angeles, California. J. Resour. Conserv. Recycl. 2014, 94, 136–145. [Google Scholar] [CrossRef]
- Ashoori, N.; Dzombak, D.A.; Small, M.J. Modeling the effects of conservation, demographics, price, and climate on urban water demand in Los Angeles, California. J. Water Resour. Manag. 2016, 30, 5247–5262. [Google Scholar] [CrossRef]
- The National News. Water-Saving Devices to Be Installed. Available online: https://www.thenationalnews.com/uae/environment/water-saving-devices-to-be-installed-1.592815 (accessed on 1 March 2021).
- The National News. Homes to Be Fitted with Free Water-Saving Devices. Available online: https://www.thenationalnews.com/uae/environment/homes-to-be-fitted-with-free-water-saving-devices-1.489303?sortOrder=newest (accessed on 1 March 2021).
- Khaleej Times. 2100 Water-Saving Devices Installed in Abu Dhabi. Available online: https://www.khaleejtimes.com/nation/general/2-100-water-saving-devices-8232-installed-in-abu-dhabi (accessed on 1 March 2021).
- Arabian Business. 60,000 Abu Dhabi Buildings to Get Water-Saving Device. Available online: https://www.arabianbusiness.com/60-000-abu-dhabi-buildings-get-water-saving-device-27609.html (accessed on 1 March 2021).
- Department of Energy (DoE). Water Consumption by 32 Percent by 2030. 2019. Available online: https://english.alarabiya.net/business/energy/2019/09/10/Abu-Dhabi-unveils-energy-strategy-to-reduce-electricity-and-water-consumption (accessed on 20 April 2021).
- UAE Government. Available online: https://www.government.ae/en/about-the-uae/the-seven-emirates/abu-dhabi (accessed on 13 November 2018).
- Mannan, M.; Alhaj, M.; Mabrouk, A.N.; Al-Ghamdi, S.G. Examining the life-cycle environmental impacts of desalination: A case study in the State of Qatar. J. Desalination 2019, 452, 238–246. [Google Scholar] [CrossRef]
- McDonnell, R.A. Transformations of energy and water in Abu Dhabi’s hydrosocial cycle. J. Geoforum Circ. 2014, 57, 225–233. [Google Scholar] [CrossRef]
- Emirates Water and Electricity Company (EWEC). Statistical Leaflet. 2019. Available online: https://www.ewec.ae/en/media/statistical-reports (accessed on 11 April 2020).
- Environment Agency—Abu Dhabi (EAD). Advancing Sustainable Groundwater Management in Abu Dhabi, EAD Annual Policy Brief. 2012. Available online: https://www.ifri.org/sites/default/files/atoms/files/water_energy_gcc_parmigiani.pdf (accessed on 12 October 2019).
- Environment Agency—Abu Dhabi (EAD). Dr. Mohamed Al Madfai, Water Resources, Abu Dhabi State of the Environment Report. 2017. Available online: https://www.ead.gov.ae/Media-Centre (accessed on 12 October 2019).
- Abu Dhabi Distribution Company (ADDC). Water Consumption and Category Data, 2010–2019; ADCC: Abu Dhabi, United Arab Emirates, 2019. [Google Scholar]
- Abu Dhabi Distribution Company (ADDC). Water Connection Data, 2010–2019; ADCC: Abu Dhabi, United Arab Emirates, 2019. [Google Scholar]
- Statistics Center Abu Dhabi Publications. Available online: https://www.scad.gov.ae/en/pages/GeneralPublications.aspx (accessed on 20 March 2021).
- Emirates Water and Electricity Company (EWEC). Abu Dhabi Population Data, 2017–2019; EWEC: Abu Dhabi, United Arab Emirates, 2019. [Google Scholar]
- Abu Dhabi Community Facility Planning Standards–Version 02. Available online: https://jawdah.qcc.abudhabi.ae/en/Registration/QCCServices/Services/STD/ISGL/ISGL-LIST/DP-304.pdf (accessed on 10 April 2021).
- Abu Dhabi Distribution Company (ADDC). Abu Dhabi Water and Electricity Tariff before 2015. Available online: https://www.emirates247.com/news/emirates/new-slabs-rates-for-wate-electricity-for-2015-2014-11-13-1.569981 (accessed on 12 March 2021).
- Abu Dhabi Distribution Company (ADDC). Abu Dhabi Water and Electricity Tariff. 2017. Available online: https://www.addc.ae/en-US/residential/Documents/02-English.pdf (accessed on 12 March 2021).
- Data Provided by Morningstar for Currency and Coinbase for Cryptocurrency. Available online: https://www.google.com/intl/en/googlefinance/disclaimer/ (accessed on 27 August 2021).
- Abu Dhabi Distribution Company (ADDC). Khalifa City Water Consumption and Category Data, 2018–2020; ADCC: Abu Dhabi, United Arab Emirates, 2020. [Google Scholar]
- Abu Dhabi Distribution Company (ADDC). National Monthly Water and Electricity Bills and Cost of Water Production, 2018–2020; ADCC: Abu Dhabi, United Arab Emirates, 2020. [Google Scholar]
- UAE Water Saving Web. Available online: https://savewateruae.com (accessed on 18 January 2021).
- Regulation and Supervision Bureau (RSB). Guide to Water Supply Regulations. 2017. Available online: https://jawdah.qcc.abudhabi.ae/en/Registration/QCCServices/Services/STD/ISGL/ISGL-LIST/WA-709.pdf (accessed on 12 November 2020).
- Dual-Flush Toilet Cost in UAE. Available online: https://www.ubuy.ae/en/search/?q=toilet (accessed on 25 April 2021).
- Water Saving Toilet. Available online: https://www.hgtv.com/design/remodel/bathroom-remodel/water-saving-toilets (accessed on 19 April 2021).
- Water-Saving Aerators. Available online: https://www.kludirak.com/pub/media/wysiwyg/PDF_downloads/Water-savingAerators.pdf (accessed on 19 March 2021).
- Indoor Water Uses in UAE. Available online: https://www.epa.gov/sites/production/files/2017-03/documents/ws-facthseet-indoor-water-use-in-the-us.pdf (accessed on 19 April 2021).
- Indoor Water Uses in The Netherlands. Available online: https://www.theconsciouschallenge.org/ecologicalfootprintbibleoverview/water-households (accessed on 19 April 2021).
- UAE Salary. Available online: https://www.guide2dubai.com/living/expat-life/dubai-salary-and-pay-scale (accessed on 23 February 2021).
- Minimum Wages in UAE. Available online: https://wageindicator.org/salary/minimum-wage/united-arab-emirates (accessed on 23 February 2021).
- United Nations, Salaries, and Allowance. Available online: https://www.un.org/Depts/OHRM/salaries_allowances/salaries/uae.htm (accessed on 23 February 2021).
- Gulf News. Coronavirus: UAE Urges People to Stay in Their Homes. Available online: https://gulfnews.com/uae/government/coronavirus-uae-urges-people-to-stay-in-their-homes-1.1584916668613 (accessed on 1 March 2021).
- Statistics Center Abu Dhabi Publications. Abu Dhabi Population in 2019. Available online: https://www.scad.gov.ae/Release%20Documents/Statistical%20Yearbook%20%20Population_2019_Annual_Yearly_en.pdf (accessed on 2 September 2021).
Figure 1.
Map of desalination plants in the United Arab Emirates.

Figure 2.
Water consumption by category in Abu Dhabi over time (2010–2019).

Figure 3.
Abu Dhabi’s population from 2010 to 2019 (nationals and expats).

Figure 4.
Number of residential connections (2010–2019).

Figure 5.
Residential water consumption by category (2010–2019).

Figure 6.
Water consumption per connection for national, expat, and exempt residential categories (2010–2019).
Figure 6.
Water consumption per connection for national, expat, and exempt residential categories (2010–2019).

Figure 7.
The water consumption per capita for national and expat residential category (2010–2019).

Figure 8.
The relationship between water consumption and the number of connections (2010–2019). Note: The exempt water connections were multiplied by 10 to plot in the same graph as the nationals and expats.
Figure 8.
The relationship between water consumption and the number of connections (2010–2019). Note: The exempt water connections were multiplied by 10 to plot in the same graph as the nationals and expats.

Figure 9.
Monthly water consumption per connection (2018–2020).

Figure 10.
Average water savings of fittings (n = 4 for each type). Note: The red dashed line is the average of the four fittings.
Figure 10.
Average water savings of fittings (n = 4 for each type). Note: The red dashed line is the average of the four fittings.

Figure 11.
Average water savings of four types of fittings at different faucet openings (n = 4).


| Category | National | Expat | ||
|---|---|---|---|---|
| before 2015 | after 2015 | before 2015 | after 2015 | |
| Villa | Free | 0.57 $/m3 up to 7 m3 | 0.6 $/m3 | 2.13 $/m3 up to 5 m3 |
| 0.71 $/m3 over 7 m3 | 2.83 $/m3 over 5 m3 | |||
| Apartment | Free | 0.57 $/m3 up to 0.7 m3 | 0.6 $/m3 | 2.13 $/m3 up to 0.7 m3 |
| 0.71 $/m3 over 0.7 m3 | 2.83 $/m3 over 0.7 m3 | |||
Note: Based on the currency exchange rate of 0.27 USD $/AED [40].
Table 2.
Persons per connection for national and expat populations.
| Year | National | Expat |
|---|---|---|
| 2010 | 12.7 | 13.2 |
| 2011 | 11.6 | 11.5 |
| 2012 | 11.3 | 11.1 |
| 2013 | 11.2 | 11.1 |
| 2014 | 10.7 | 11.7 |
| 2015 | 10 | 11.4 |
| 2016 | 9.6 | 12.1 |
| 2017 | 8.9 | 12.0 |
| 2018 | 8.6 | 12.1 |
| 2019 | 7.7 | 12.2 |
Table 3.
The number of connections and water consumption of the nationals in Khalifa City in 2018–2020.
Table 3.
The number of connections and water consumption of the nationals in Khalifa City in 2018–2020.
| Customer Group | Parameters | 2018 | 2019 | 2020 | |
|---|---|---|---|---|---|
| No. of connection | 3-year customer | connections | 6721 | 6721 | 6721 |
| ups | 3469 1 | 3446 2 | 3386 3 | ||
| downs | 3252 1 | 3275 2 | 3335 3 | ||
| New customer | connections | NA | 812 | 739 | |
| percent | NA | 10.38% | 8.89% | ||
| Total | connections | 7326 | 7826 | 8234 | |
| Consumption(m3/year) | 3-year customer | average | 1472 | 1451 | 1411 |
| New customer | average | NA | 395 | 362 (762) 4 | |
| Total | average | 1438 | 1309 | 1256 |
Note ups and downs, 1 from 2018 to 2019, 2 from 2019 to 2020, and 3 from 2018 to 2020. 4 Water consumption in 2020 of customers who moved in 2019. NA: Not available.
Table 4.
Water-saving fitting and dual-flush toilet cost for a national house.
| House Type | Villa (4 + Maid Room) | |
|---|---|---|
| Toilet | Number | 7 |
| Cost | $473 | |
| Fittings | Wash tap | 8 |
| Shower | 5 | |
| Bidet | 7 | |
| Kitchen tap | 1 | |
| Cost | $237 | |
| Total cost of | $710 | |
Table 5.
The payback period for 350 LPCD and 225 LPCD.
| LPCD | 350 | 225 | |
|---|---|---|---|
| Subsidy | Yes | Yes | No |
| Water savings (%) | 65.4 | 65.4 | 65.4 |
| Water consumption (m3) | |||
| daily without savings | 3.025 | --- | --- |
| monthly: without savings | 87.7 | 54.0 | 54.0 |
| monthly: with savings | 30.4 | 18.7 | 18.7 |
| Water Tariff (USD $) | |||
| without savings (government subsidy) | 50.0 | 32.0 (121.3) | 151.8 (0) |
| with saving (government subsidy) | 17.0 (69.0) | 11.0 (42.0) | 53.0 (0) |
| Payback period (month) | 21.7 | 33.3 | 7.2 |
Publisher’s Note: MDPI stays neutral with regard to jurisdictional claims in published maps and institutional affiliations. |
© 2021 by the authors. Licensee MDPI, Basel, Switzerland. This article is an open access article distributed under the terms and conditions of the Creative Commons Attribution (CC BY) license (https://creativecommons.org/licenses/by/4.0/).
Share and Cite
MDPI and ACS Style
Albannay, S.; Kazama, S.; Oguma, K.; Hashimoto, T.; Takizawa, S. Water Demand Management Based on Water Consumption Data Analysis in the Emirate of Abu Dhabi. Water 2021, 13, 2827. https://doi.org/10.3390/w13202827
AMA Style
Albannay S, Kazama S, Oguma K, Hashimoto T, Takizawa S. Water Demand Management Based on Water Consumption Data Analysis in the Emirate of Abu Dhabi. Water. 2021; 13(20):2827. https://doi.org/10.3390/w13202827
Chicago/Turabian StyleAlbannay, Shayma, Shinobu Kazama, Kumiko Oguma, Takashi Hashimoto, and Satoshi Takizawa. 2021. "Water Demand Management Based on Water Consumption Data Analysis in the Emirate of Abu Dhabi" Water 13, no. 20: 2827. https://doi.org/10.3390/w13202827
Note that from the first issue of 2016, this journal uses article numbers instead of page numbers. See further details here.