
Are Rural and Small Community Aerated Wastewater Stabilization Ponds a Neglected Source of Microplastic Pollution?


1
Department of Chemistry and Biochemistry, University of Mississippi, Oxford, MS 38677, USA
2
South China Institute of Environmental Science, Huangpu District, Guangzhou 510530, China
*
Author to whom correspondence should be addressed.
Water 2021, 13(20), 2833; https://doi.org/10.3390/w13202833
Submission received: 14 September 2021
/
Revised: 2 October 2021
/
Accepted: 4 October 2021
/
Published: 12 October 2021
(This article belongs to the Special Issue Analysis and Prevention of Microplastics Pollution in Water: Current Research and Future Directions)
Abstract
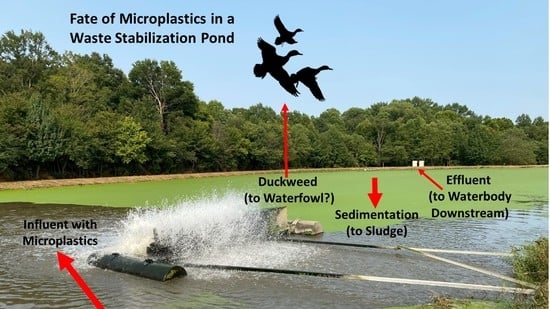
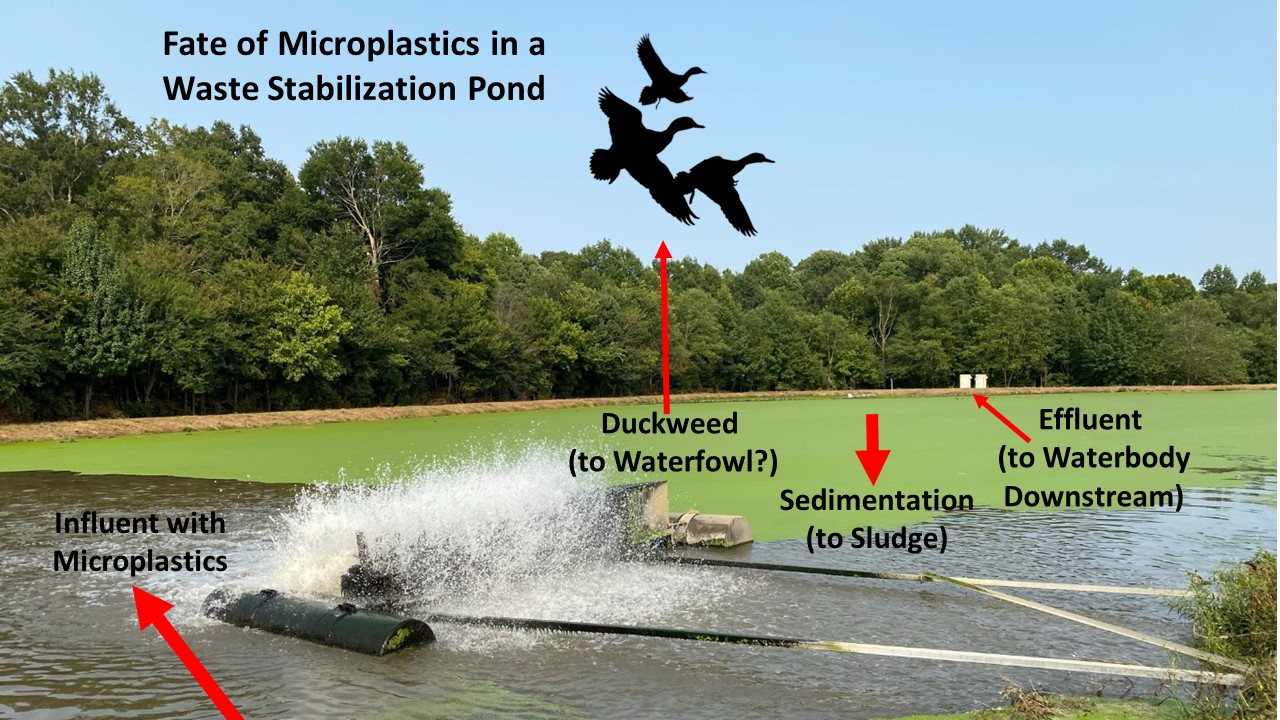
:Wastewater treatment systems collect and treat sewage that includes microplastics (MPs). However, we are not aware of any studies on the occurrence and distribution of MPs in wastewater stabilization ponds (WSPs), which serve small communities worldwide. Here, we characterized MPs (~45 µm–5 mm) in an aerated WSP serving ~500 houses and an adjacent lake. Putative MPs were most abundant in duckweed (Lemna minor) and sludge (75 ± 22 and 12.8 ± 3.1 particles/g, respectively: ±1 standard deviation (SD), n = 6, dry weight). In the water, average concentrations (particles/L ± 1 SD, n = 6) were highest in the pond (4.1 ± 0.6), followed by effluent (3.9 ± 0.5) and the lake (2.6 ± 0.6). Over 20 types of MPs were identified in each different compartment, with the distribution varying somewhat between the water, sludge, and duckweed. Polyester and polyethylene were the predominant types, followed by polyethylene terephthalate, polyacrylate, polyvinyl chloride, polystyrene, and others. Morphologies consisted of fibers (62–71%), fragments (28–37%), and beads (1–6%). High-density polymers were more frequently found in sludge. Potential sources of the MPs include synthetic textiles from laundry and other plastics washed down household drains. Overall, with ~786,000 MPs/day released in the pond effluent and with duckweed a source of food for waterfowl, we demonstrate that WSPs can be point sources of MPs to both aquatic and terrestrial ecosystems and thus deserve further scrutiny.
1. Introduction
Microplastics (MPs), fibers, particles, or fragments of synthetic polymers between 1 µm and 5-mm in size, are pervasive in the natural environment [1,2]. Given their small size and ubiquity in water bodies, their ingestion and impact on both aquatic life and ecosystems is of great concern [3,4,5]. Primary MPs are manufactured small and include fibers, beads, and plastic pellets [6]. Secondary MPs are generated by fragmentations of larger plastic debris through physical, chemical, and biological effects, and are predominant in the environment [7,8]. Major sources of MPs to water bodies include storm water runoff, atmospheric fallout, and wastewater discharge [9,10]. For example, a pair of jeans can release > 50,000 microfibers per wash [11], and microbeads, although banned in some countries and the European Union, may still be on shelves and in use in people’s homes.
As MPs are abundant in both residential and industrial wastewater, wastewater treatment plants (WWTPs) serve as potential point sources of MPs to the environment [12,13,14,15]. Recently, a number of studies have focused on the distribution and fate of MPs in municipal wastewater treatment systems to better understand the role they play in the transport and release of MPs to the environment. Despite not being designed for MPs, WWTPs are generally effective at removing them, with efficiencies ranging from ~64% to >99%, depending on the type of treatment facility and other factors [16]. Nevertheless, given the high loads of MPs entering WWTPs, treated effluents typically increase the MP burden to recipient waters; even tertiary WWTPs, which can effectively remove > 98% of MPs, can still contribute high amounts of MPs due to discharges that are continuously high in volume [9,13,17,18,19]. Additionally, waste sludge, which is abundant in MPs, is commonly used as fertilizer or sent to landfills, both of which can lead to the release of MPs to the environment via runoff or wafting into the air [20,21,22].
Whereas the distribution and fate of MPs in WWTPs have been extensively studied, comparatively little attention has been paid to MPs in wastewater stabilization ponds (WSPs), sometimes called oxidation ponds, which commonly serve rural and small communities worldwide. The WSP treatment strategy uses a single or a series of ponds to reduce organic content and remove pathogens from wastewater through the coaction of bacteria and algae and/or aquatic plants. WSPs are low cost in terms of construction, maintenance, and energy requirements, and are particularly effective in tropical and subtropical regions because sunlight and higher temperatures contribute to a more efficient removal of waste [23]. Moreover, their use in developing nations is projected to grow as the worldwide water crises increases [24]. However, as no preliminary, primary or tertiary wastewater treatment is employed in WSPs, the distribution, transport, and fate of MPs could vary significantly from other wastewater treatment systems. Further, WSPs involve natural treatment processes which require long hydraulic retention time, potentially giving MPs more time to degrade and/or transport out of the system.
Here, we report what we believe to be the first study examining the distribution, transport, and fate of MPs in an aerated WSP serving a small community. We demonstrate the partitioning of MPs into different environmental and biological compartments within the WSP and show that the duckweed and sludge harbor the majority of the MPs. Further, concentrations of MPs in the WSP effluent were higher than a nearby lake, making it a potential source of MP pollution to the receiving waters.
2. Materials and Methods
Table S1 contains a list of polymers and their abbreviations used in the following sections.
2.1. Study Site
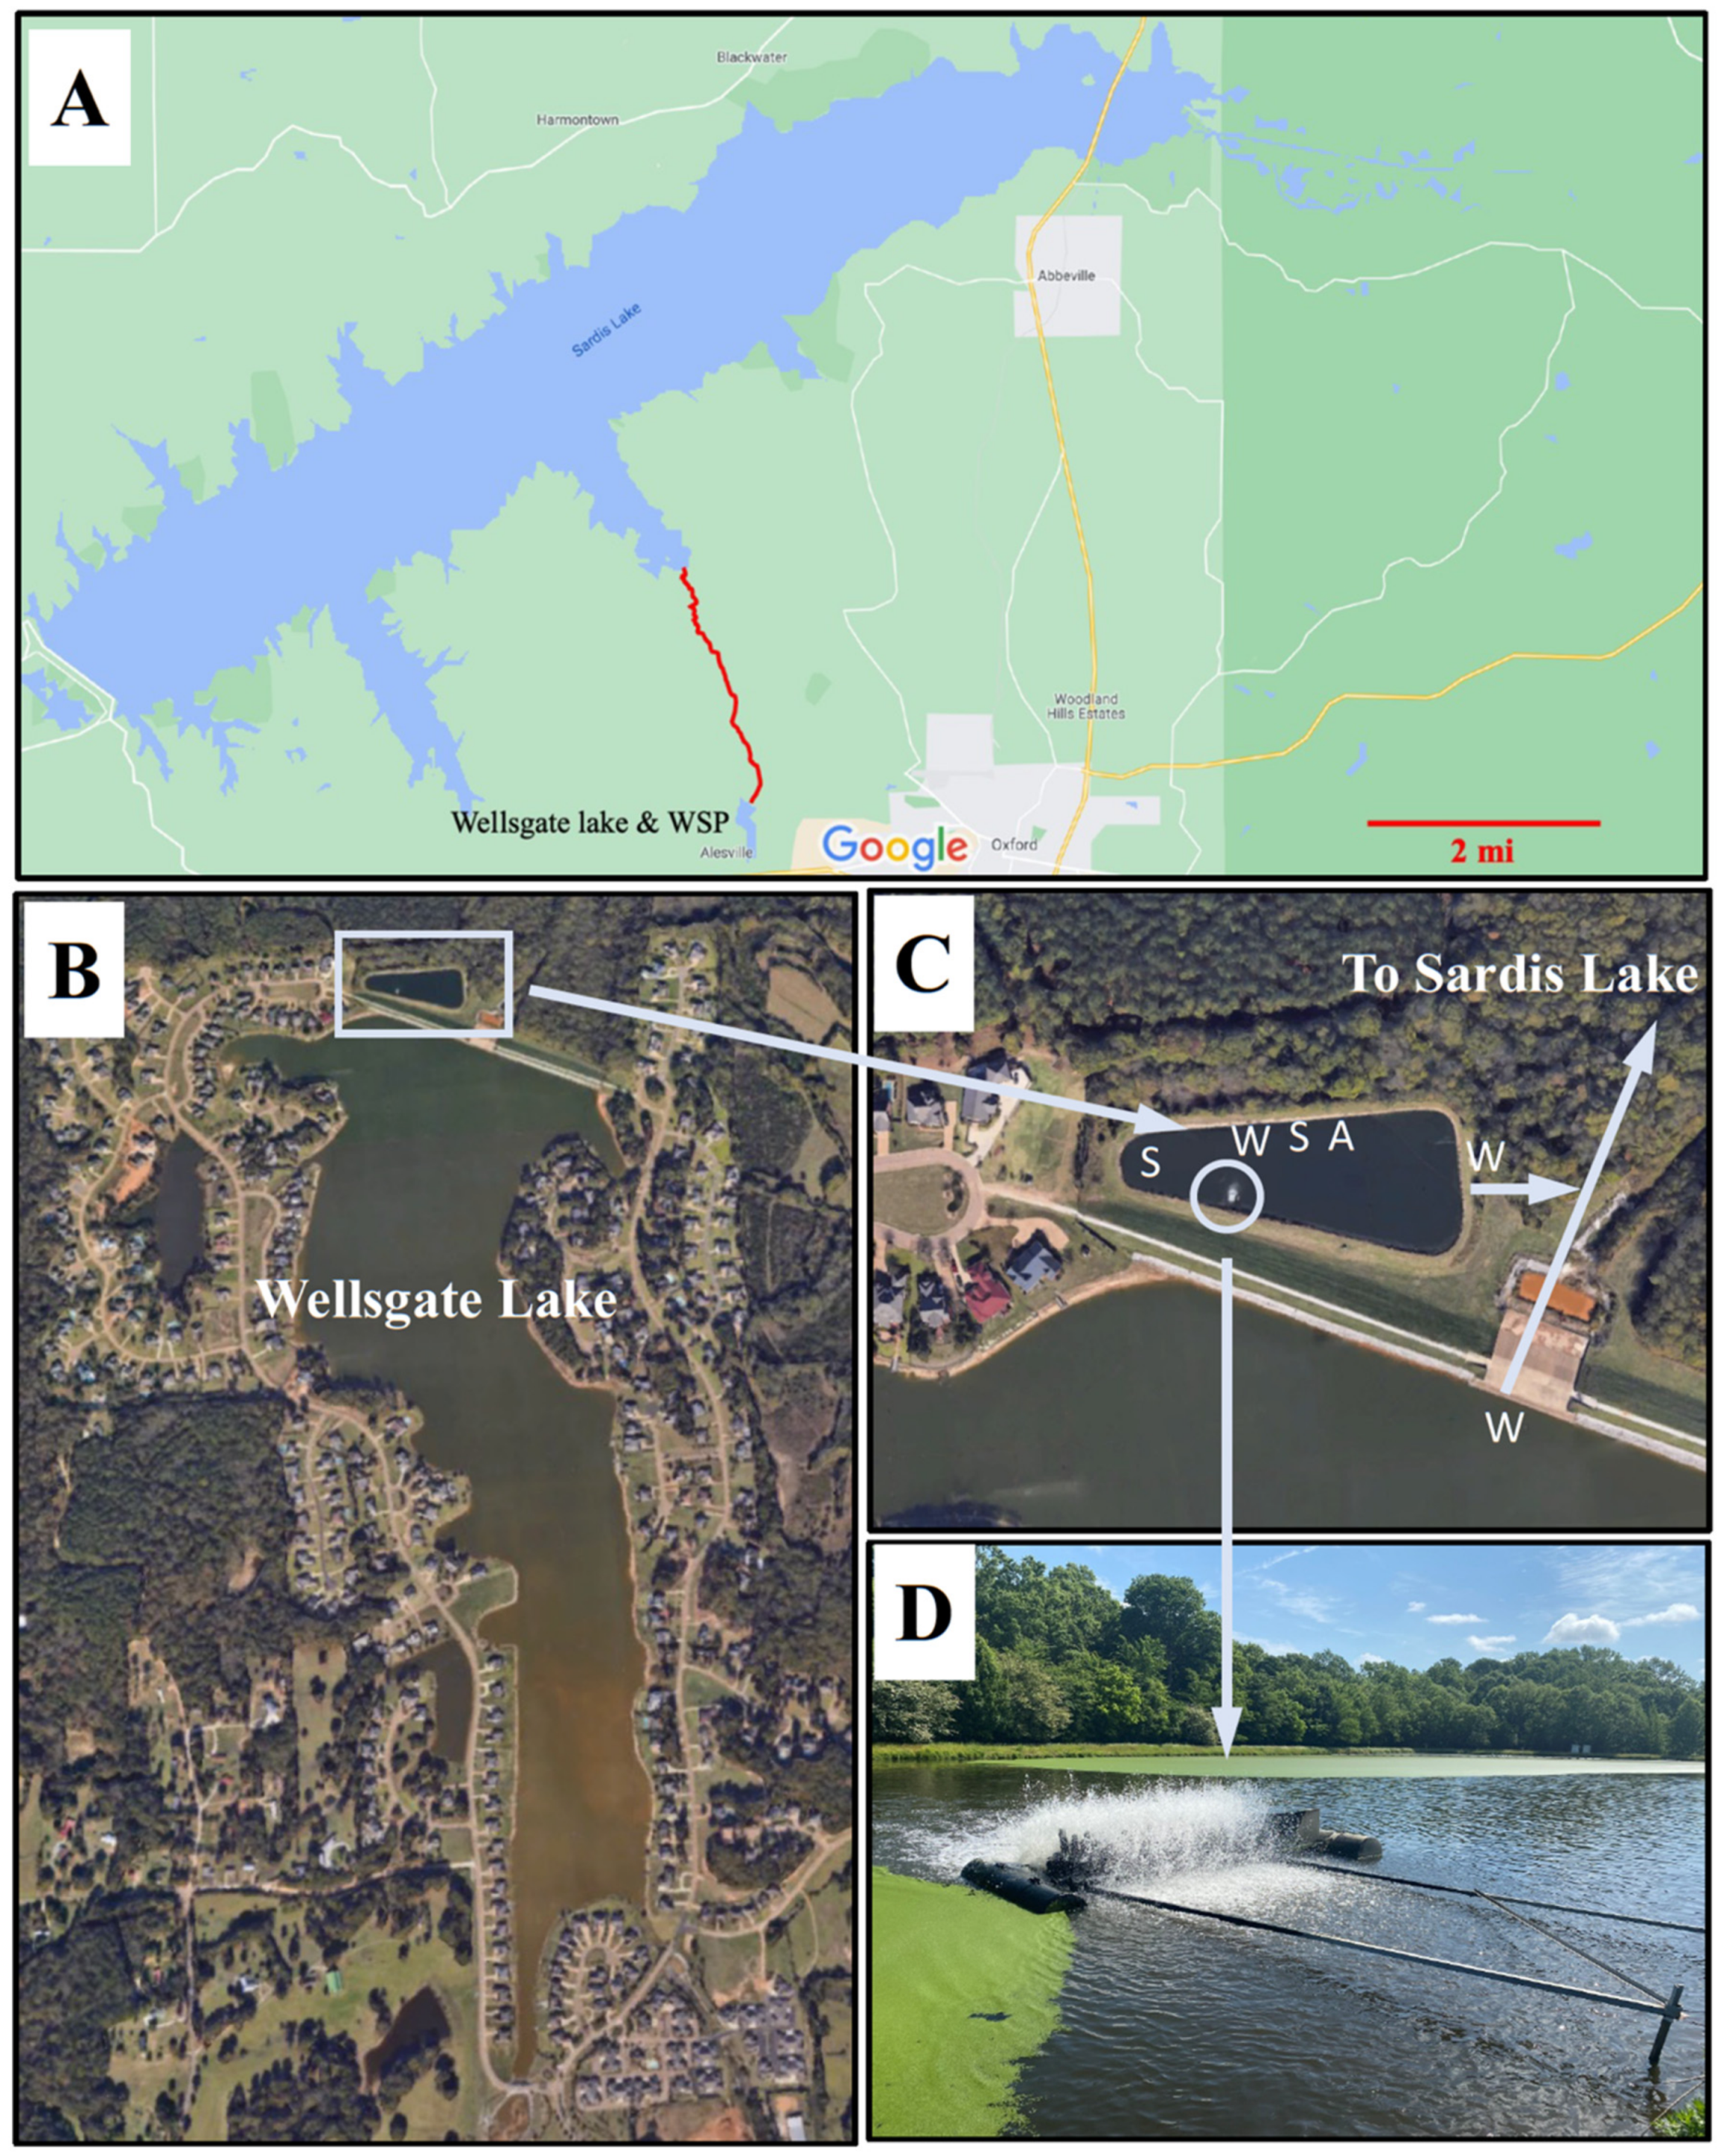
Samples were collected from a single aerated WSP (GPS Coordinates: 34.365375, −89.597248) which serves a community of ~500 households in Oxford, Mississippi (Figure 1). The WSP is situated adjacent to Wellsgate Lake, a ~0.5 km2 freshwater lake formed in 2003 by damming a tributary of Sardis Lake, a much larger reservoir to the north. The WSP is shallow (~1.0 m depth or less) and has ~230 m2 surface area. Aeration aids dissolution of oxygen into the water to facilitate microbial-mediated digestion of the organic waste. The pond is also laden with duckweed, which produces oxygen through photosynthesis, further supporting respiration by aerobic microorganisms in the pond. The treated wastewater is disinfected by chlorine before discharge.
2.2. Sampling and Determining Sludge and Moisture Content
Triplicate water samples were collected from the pond, treated effluent, and the lake in August and December of 2020. The pond was sampled near where water flows away from the aerator, the effluent where it discharges from the pond entering a small stream, and the lake near the dam’s spillway. We were unable to sample the influent as it is released into the center of the pond via two large pipes and there is no access point just upstream of the discharge. Water from each site was rapidly transferred to fill a 50 L polypropylene (PP) carboy container using a water transfer pump and subsequently filtered through a stack of 8″-diameter stainless steel sieves with mesh sizes of 1 mm, 125 µm and 45 µm (Figure S1). Use of the carboy allowed us to filter a large, exact, and reproducible volume of water for replicate analyses. Particles on each sieve were carefully rinsed into a 1 L Mason jar using PTFE squirt bottle containing ultrapure Milli-Q water.
We also collected WSP sludge and duckweed. Sludge samples were collected from the top ~1 cm of sediment at three different locations in the pond and combined. Duckweed was skimmed from the surface directly into Mason jars and stored along with the sludge at ~4 °C until analyses.
Moisture content of sludge was determined by drying at 105 °C for 24 h, while organic matter content was measured by heating the sample at 600 °C for 2 h in a muffle furnace. The average moisture content ranged from 22.2% to 25.6% and the average organic matter content ranged from 1.5% to 2.4% (Table S2).
2.3. Sample Preparation
To isolate and quantify MPs in the water, sludge, and duckweed, we prepared samples following a method outlined by the National Oceanic and Atmospheric Administration (NOAA) [25].
2.3.1. Water Samples
Labile organic matter within each pre-sieved sample was digested using Fenton’s reagent. Briefly, 30% H2O2 (97% purity, Fisher Scientific, Hampton, NH, USA) and 0.05 M Fe(II)SO4 were used to oxidize organic matter for 24 h at room temperature. Following the digestion step, inorganic particles were removed by density separation (three times per sample) using a solution of ZnCl2 (>99% purity, Fisher Scientific, Hampton, NH, USA) with density of 1.6 g/mL. The top layer of the solution was collected and filtered through a 45 µm sieve. Retained particles were rinsed into 25 mL glass vials with 50% ethanol and stored until analyses. Before analyses, the 25 mL vials were filtered through 47 mm (10 µm pore size) polycarbonate track-etched filters (Sterlitech Corp., Kent, WA, USA).
2.3.2. Pond Sludge and Duckweed
Approximately 10 g of dried sludge and 2 g of dried duckweed were digested with Fenton’s reagent as before. Sludge samples were subsequently sieved through 45 µm sieve and the particles rinsed with DI water back to glass jars for density separation with ZnCl2 solution. Duckweed digests were passed through both 1 mm and 45 µm sieves with the residue on the 45 µm sieve being rinsed with DI water back to glass jars for density separation as before. The top layer of solution was collected and filtered through a 45 µm sieve and the particles stored and filtered as before.
2.4. Sample Analyses
The extracted particles on the filters were enumerated under a stereomicroscope with 40× magnification (Carl Zeiss Discovery V12, equipped with an Axiocam 105 color digital camera). Representative MPs were photographed (Figure S2). Objects that were clearly not plastic or that had biological features such as spines or striations were not counted. If in doubt, the object was not counted as plastic. Putative MPs morphologies were categorized as fibers, fragments (particles with sharp edges) and beads (circular objects). Color was also documented.
To identify the types of MPs present, 10 samples were selected, 2 from each of the 5 sampling sites/environmental compartments, one each for winter and summer. Sample particles were transferred to glass vials in 50% ethanol and the solution was evaporated in a clean laminar flow hood. The vials were sealed and shipped to the South China Institute of Environmental Science for FTIR microscopy. There, 5 mL of 50% ethanol was added to each vial and mixed. Next, a 1 mL aliquot was filtered onto gold-coated polycarbonate track-etched filters (25 mm diameter, 0.4 µm pore size; Sterlitech Corp., Kent, WA, USA). Eight 1 mm × 1 mm sections were randomly selected on each filter and analyzed by µ-FTIR imaging using a Perkin Elmer Spotlight 200i. Around 50 particles in each section were chosen and each sample was measured twice. Measurements were conducted in reflectance mode using a mercury cadmium telluride (MCT) detector. Spectrums were taken at 24 scans with wavelengths between 600 and 4000 cm−1 and a spectral resolution of 4 cm−1. Each sample spectrum was compared to the spectra library supplied by Perkin Elmer. Matches were deemed positive with >70% similitude between sample and library spectrum [26]. Representative spectrums from extracted MPs are shown in Figure S3.
2.5. Assessing Microplastic Contamination and Accuracy
Our approach to minimizing and assessing MP contamination is described elsewhere [27]. Briefly, cotton laboratory coats and nitrile gloves were used during sample preparation and analyses. Samples were covered with aluminum foil whenever they were not being actively processed and laboratory surfaces were wiped clean with alcohol prior to use. All equipment was thoroughly rinsed, and plastic materials were avoided as much as possible. Sample filtering was conducted in a laminar flow hood (AirClean system 600 workstation). Blanks were analyzed to assess contamination during pre-treatment and all sample data is blank subtracted.
To assess MP recoveries, we spiked 50 L samples of WSP water and treated effluent with 45 MPs in the 500–1000 µm size range for recovery experiments. The spiked MPs included 15 bright blue particles of weathered PP, 15 royal blue particles of virgin PP, and 15 bright red particles of virgin PMMA. The MPs used for spiking were generated by cryo-milling of larger plastic debris using a freezer/mill (Spex Certiprep Inc., Metuchen, NJ, USA). Weathered MPs stemmed from an aged (brittle) PP container found in the environment at a nearby lake and virgin particles were from new PP bottles and PMMA sheets. Each plastic type was confirmed using FTIR spectroscopy (Cary 550; Agilent Technologies, Santa Clara, CA, USA).
3. Results
3.1. Evaluation of Contamination and Effects of Sample Treatment on Microplastics
Three method blanks, consisting of 50 L of reverse osmosis water added to the carboy and carried through our entire procedure, averaged 0.2 particles/L (9 PEST fibers and 2 PE fragments/50 L), well below the ~4 particles/L (~200 particles/50 L) in the pond water and treated effluent. Nevertheless, the method blank was subtracted from all analyzed samples. Recoveries of MPs spiked into 50 L water samples from each site averaged 93.3% for PMMA, 83.3% for virgin PP, and 60% for weathered PP.
3.2. Microplastics in the Waste Stabilization Pond Samples
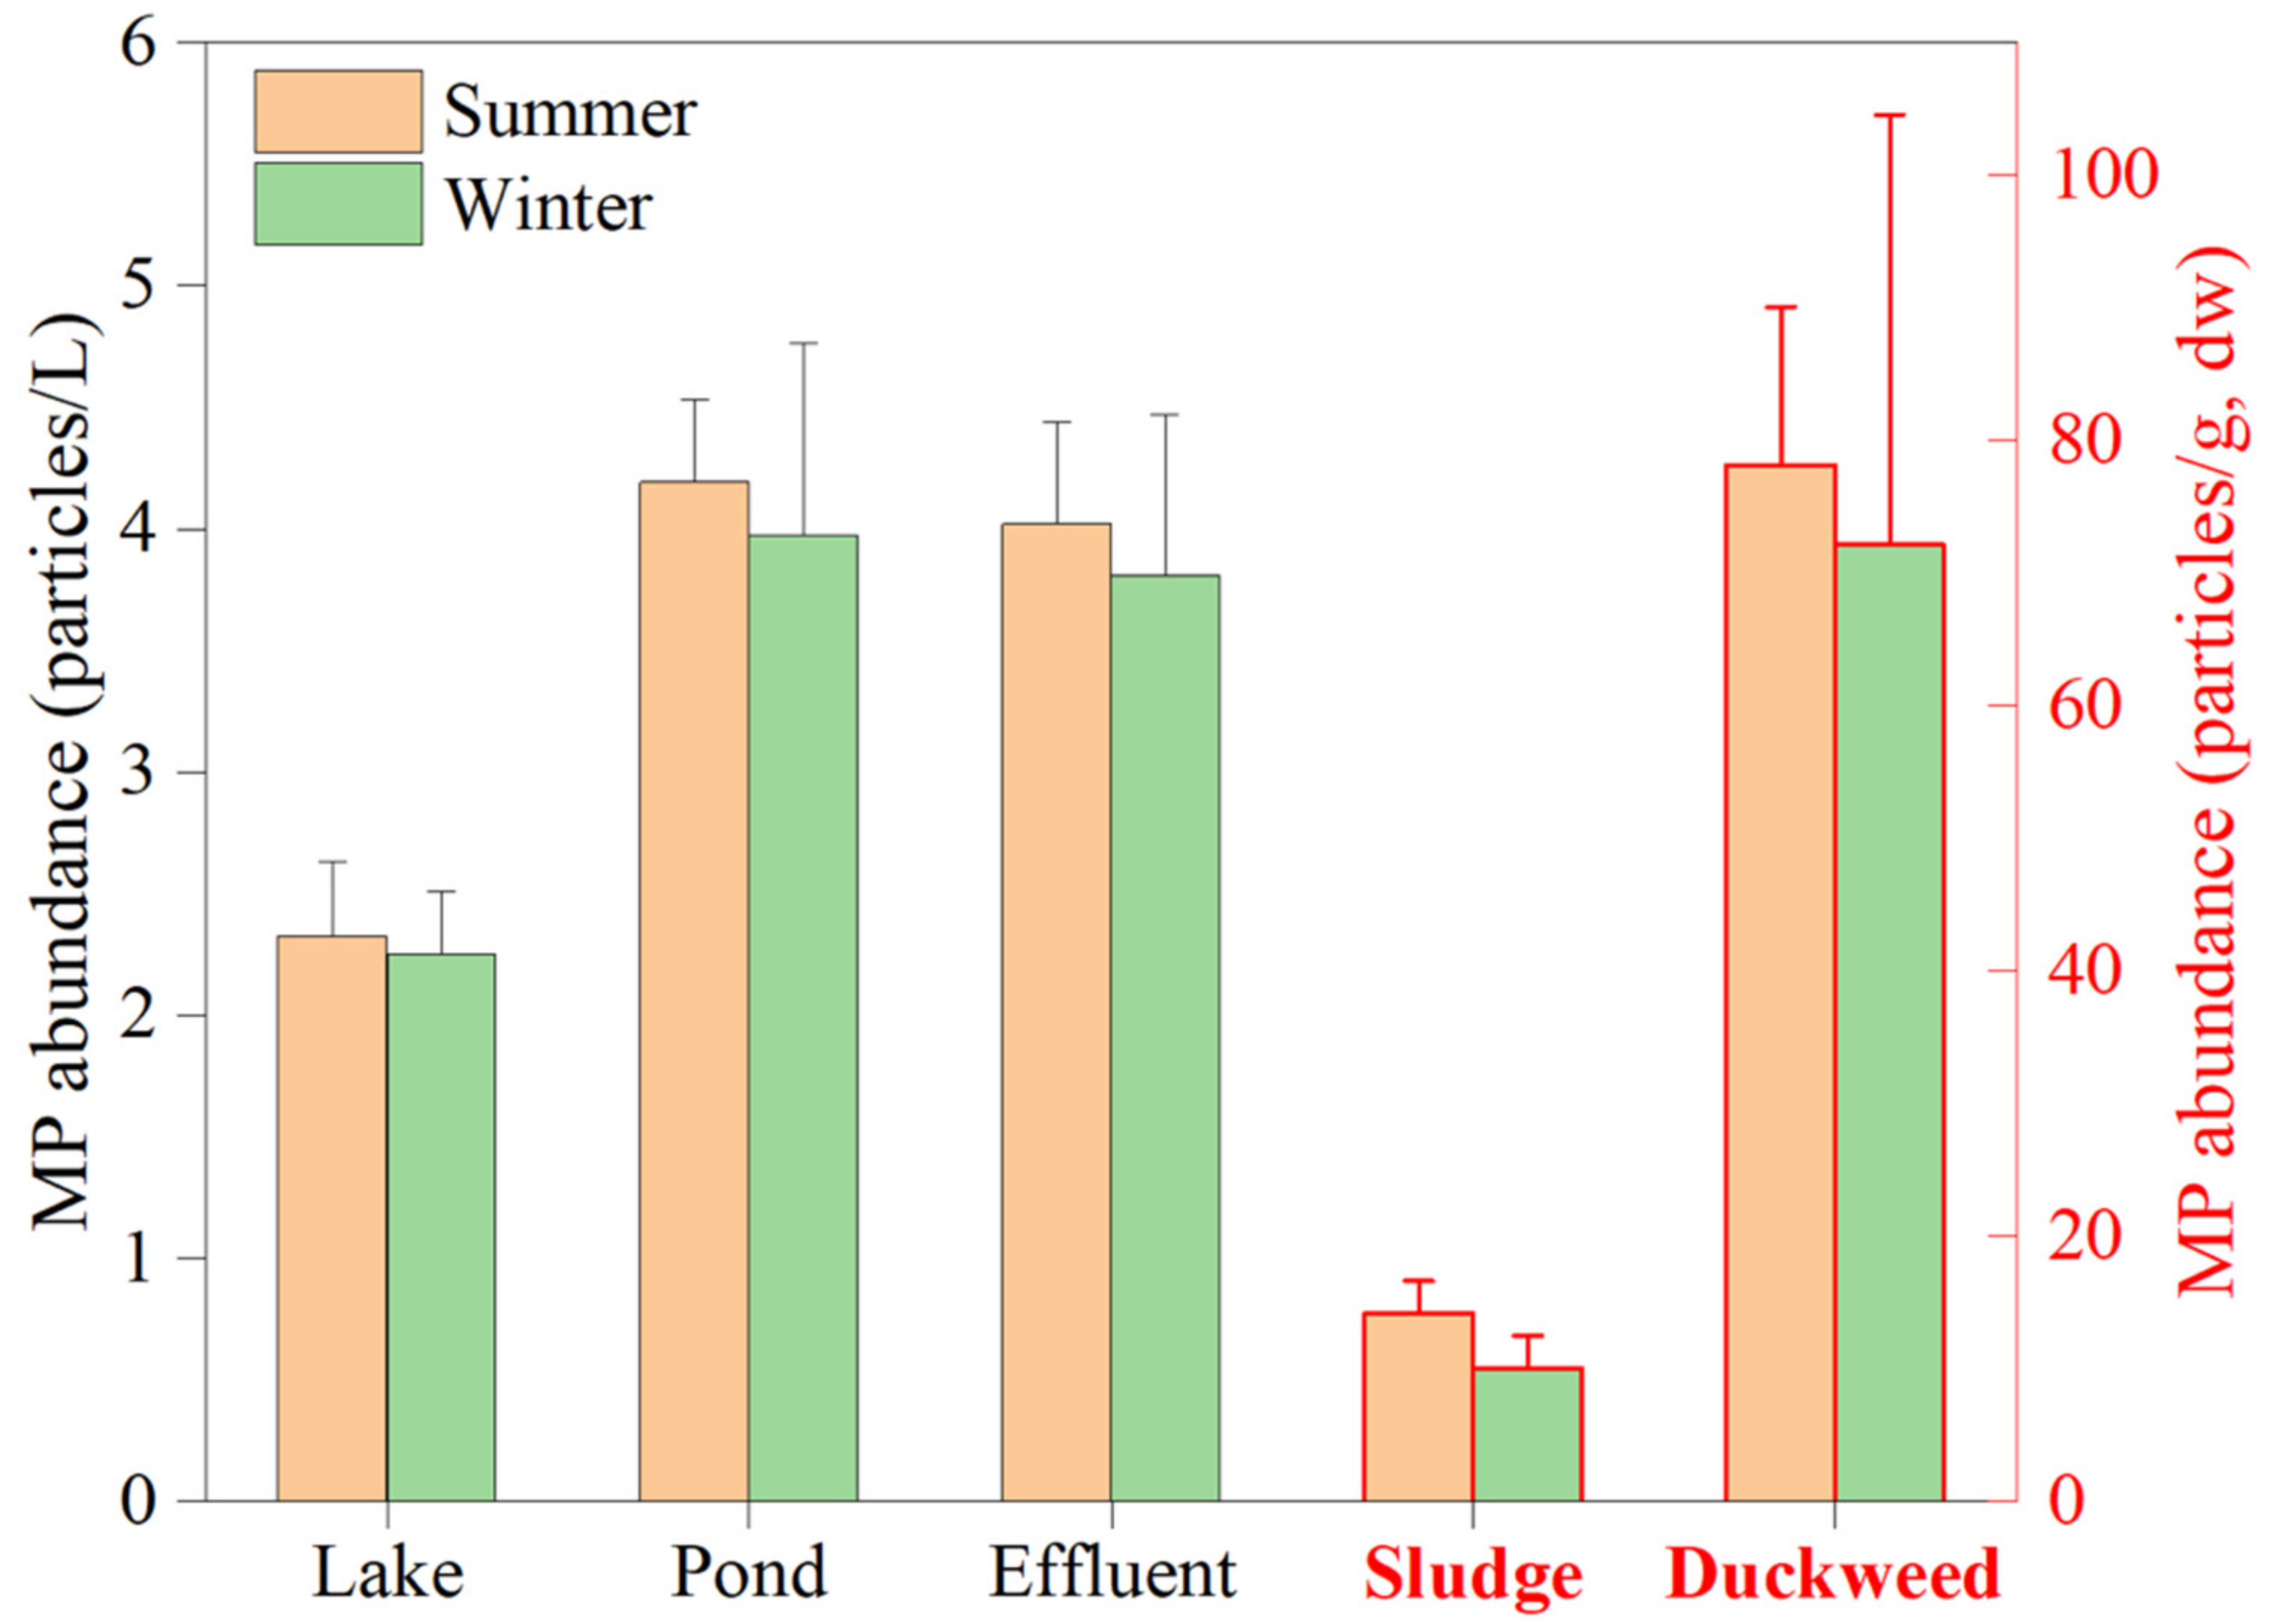
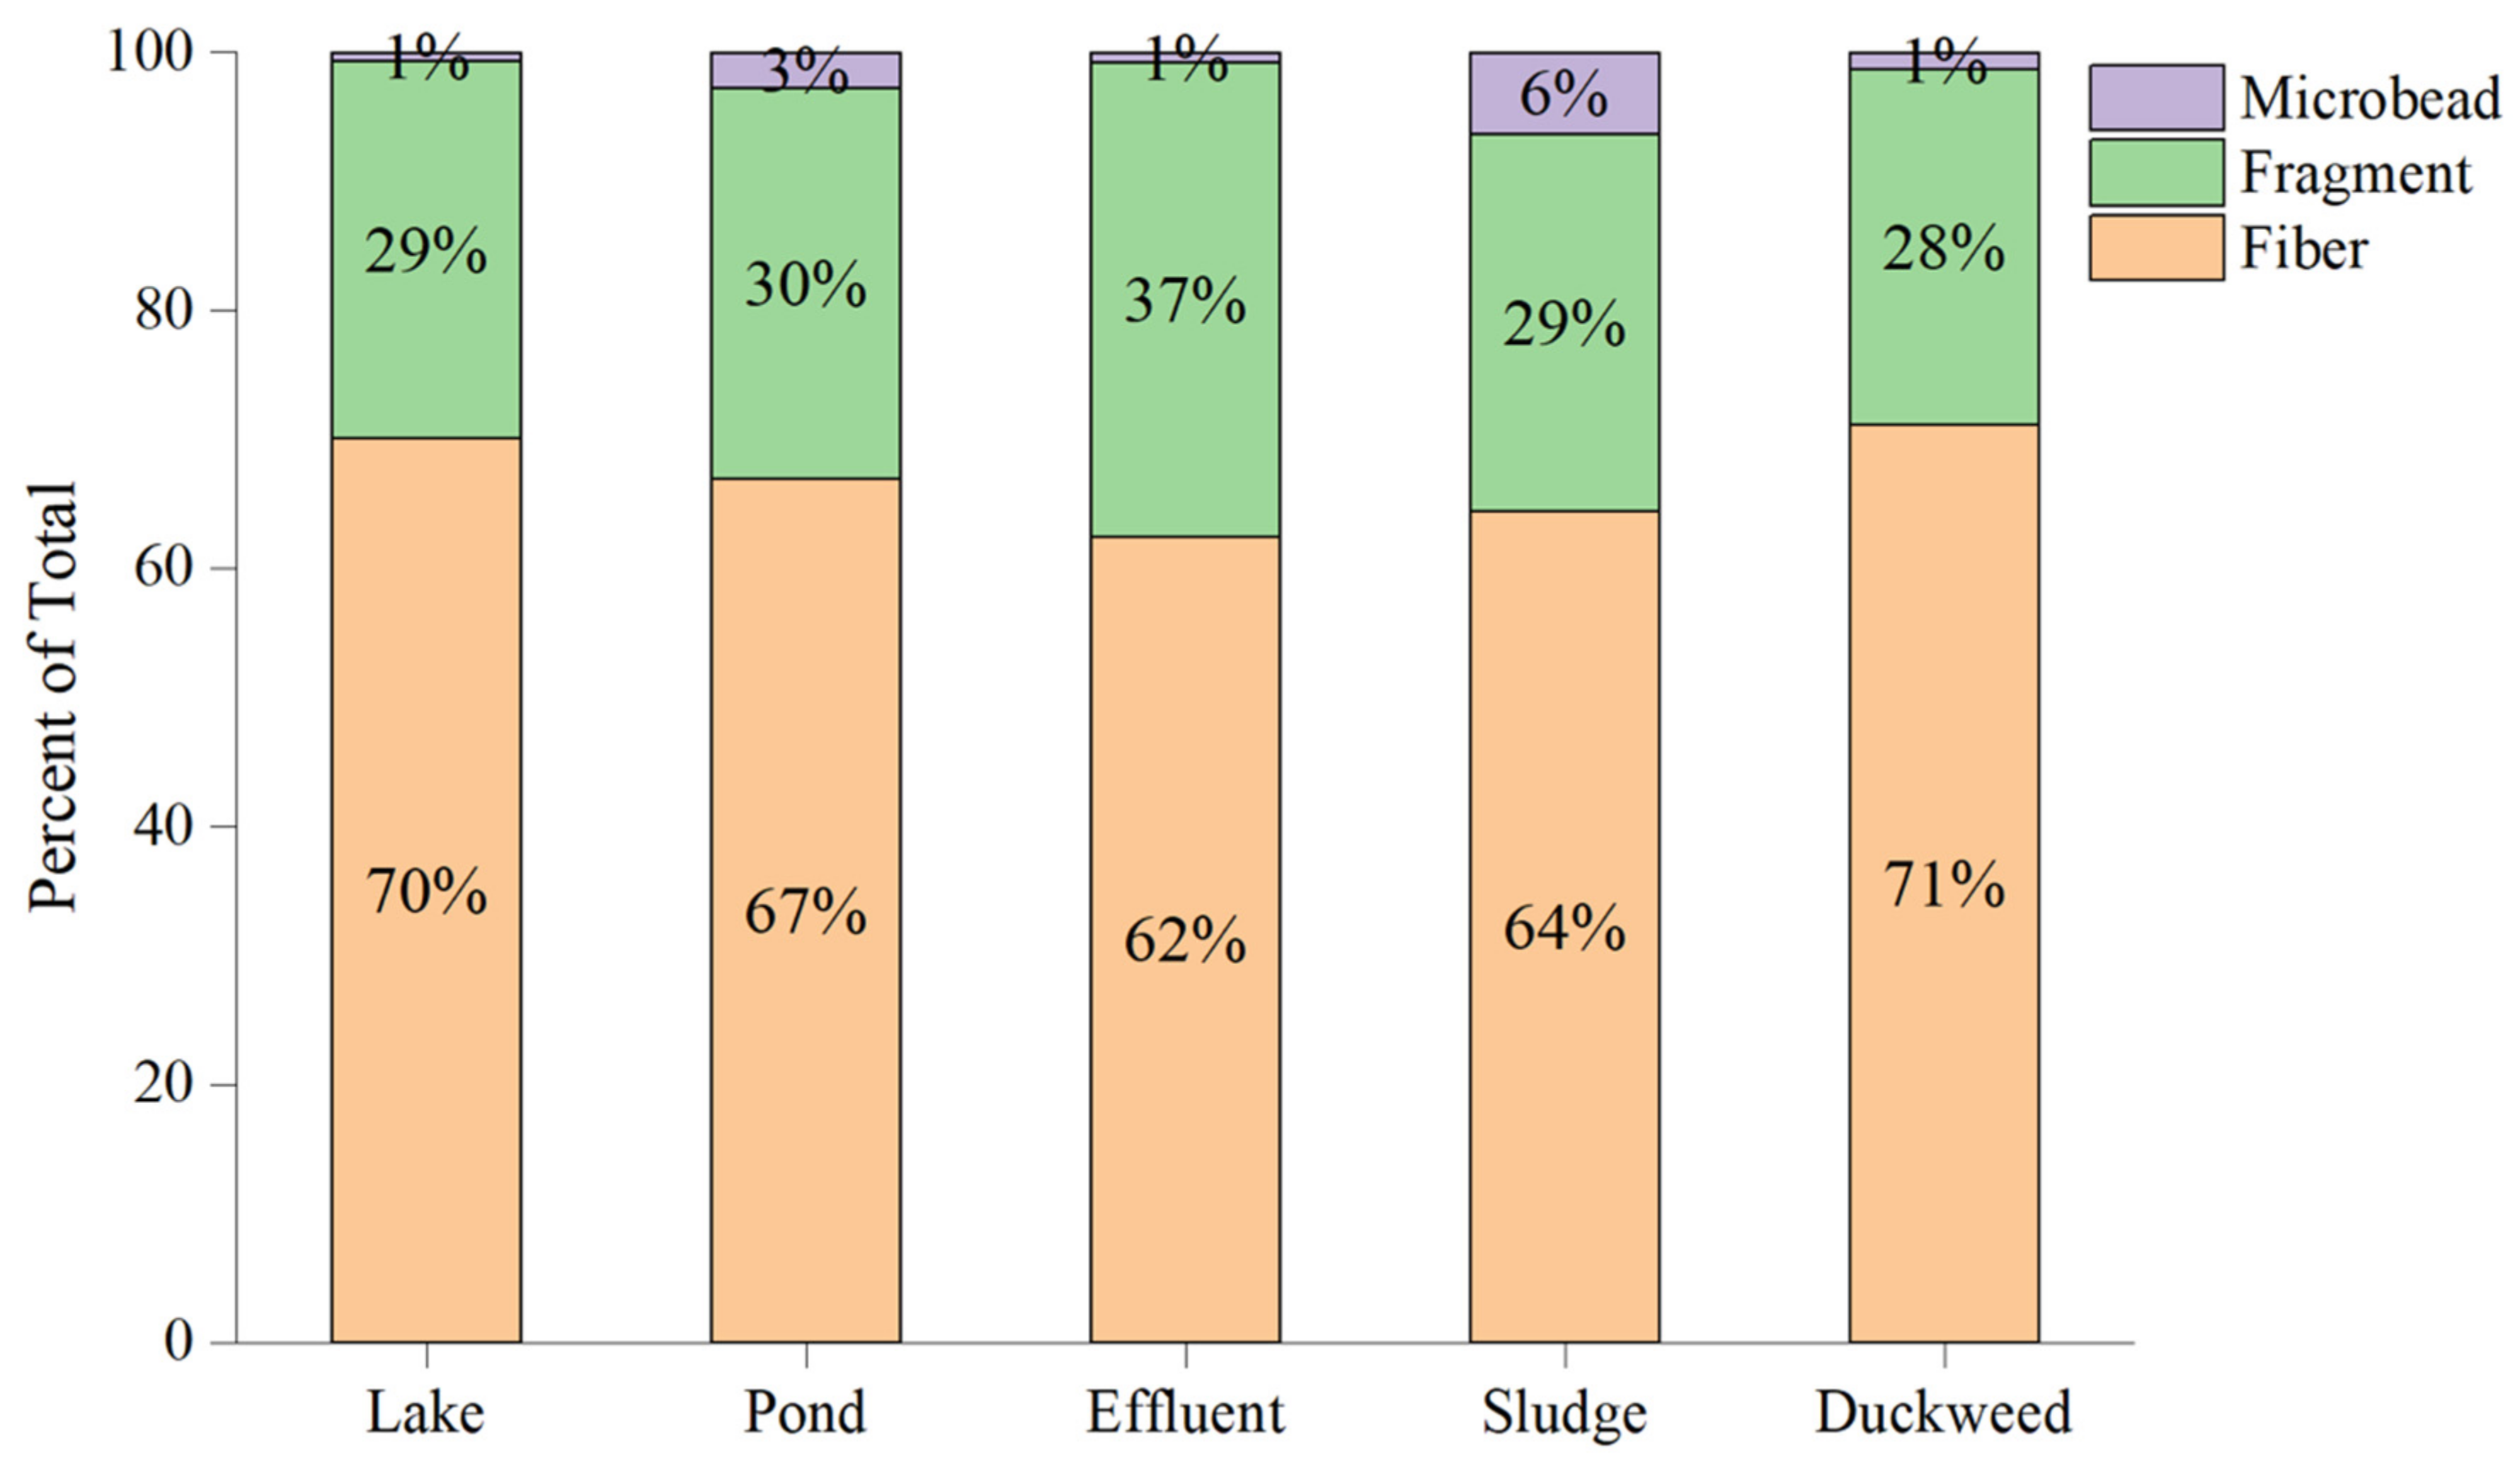
Abundances of MPs in the different environmental and biological compartments measured in this study are shown in Figure 2. Concentrations (particles/L) in the pond water and treated effluent were 4.0 ± 0.8 and 3.8 ± 0.7, respectively, in the winter. Abundances of MPs were slightly higher in summer for both the pond (4.2 ± 0.4 particles/L) and effluent (4.0 ± 0.4 particles/L). Abundances of MPs in the duckweed was 75.2 ± 22.1 particles/g compared to 12.8 ± 3.1 particles/g in the sludge. Most of the MPs were fibers (62–71%), followed by fragments (28–37%), and beads (1–6%) (Figure 3). The majority of these were between 45–125 μm, the smallest size fraction measured (Figure S4).
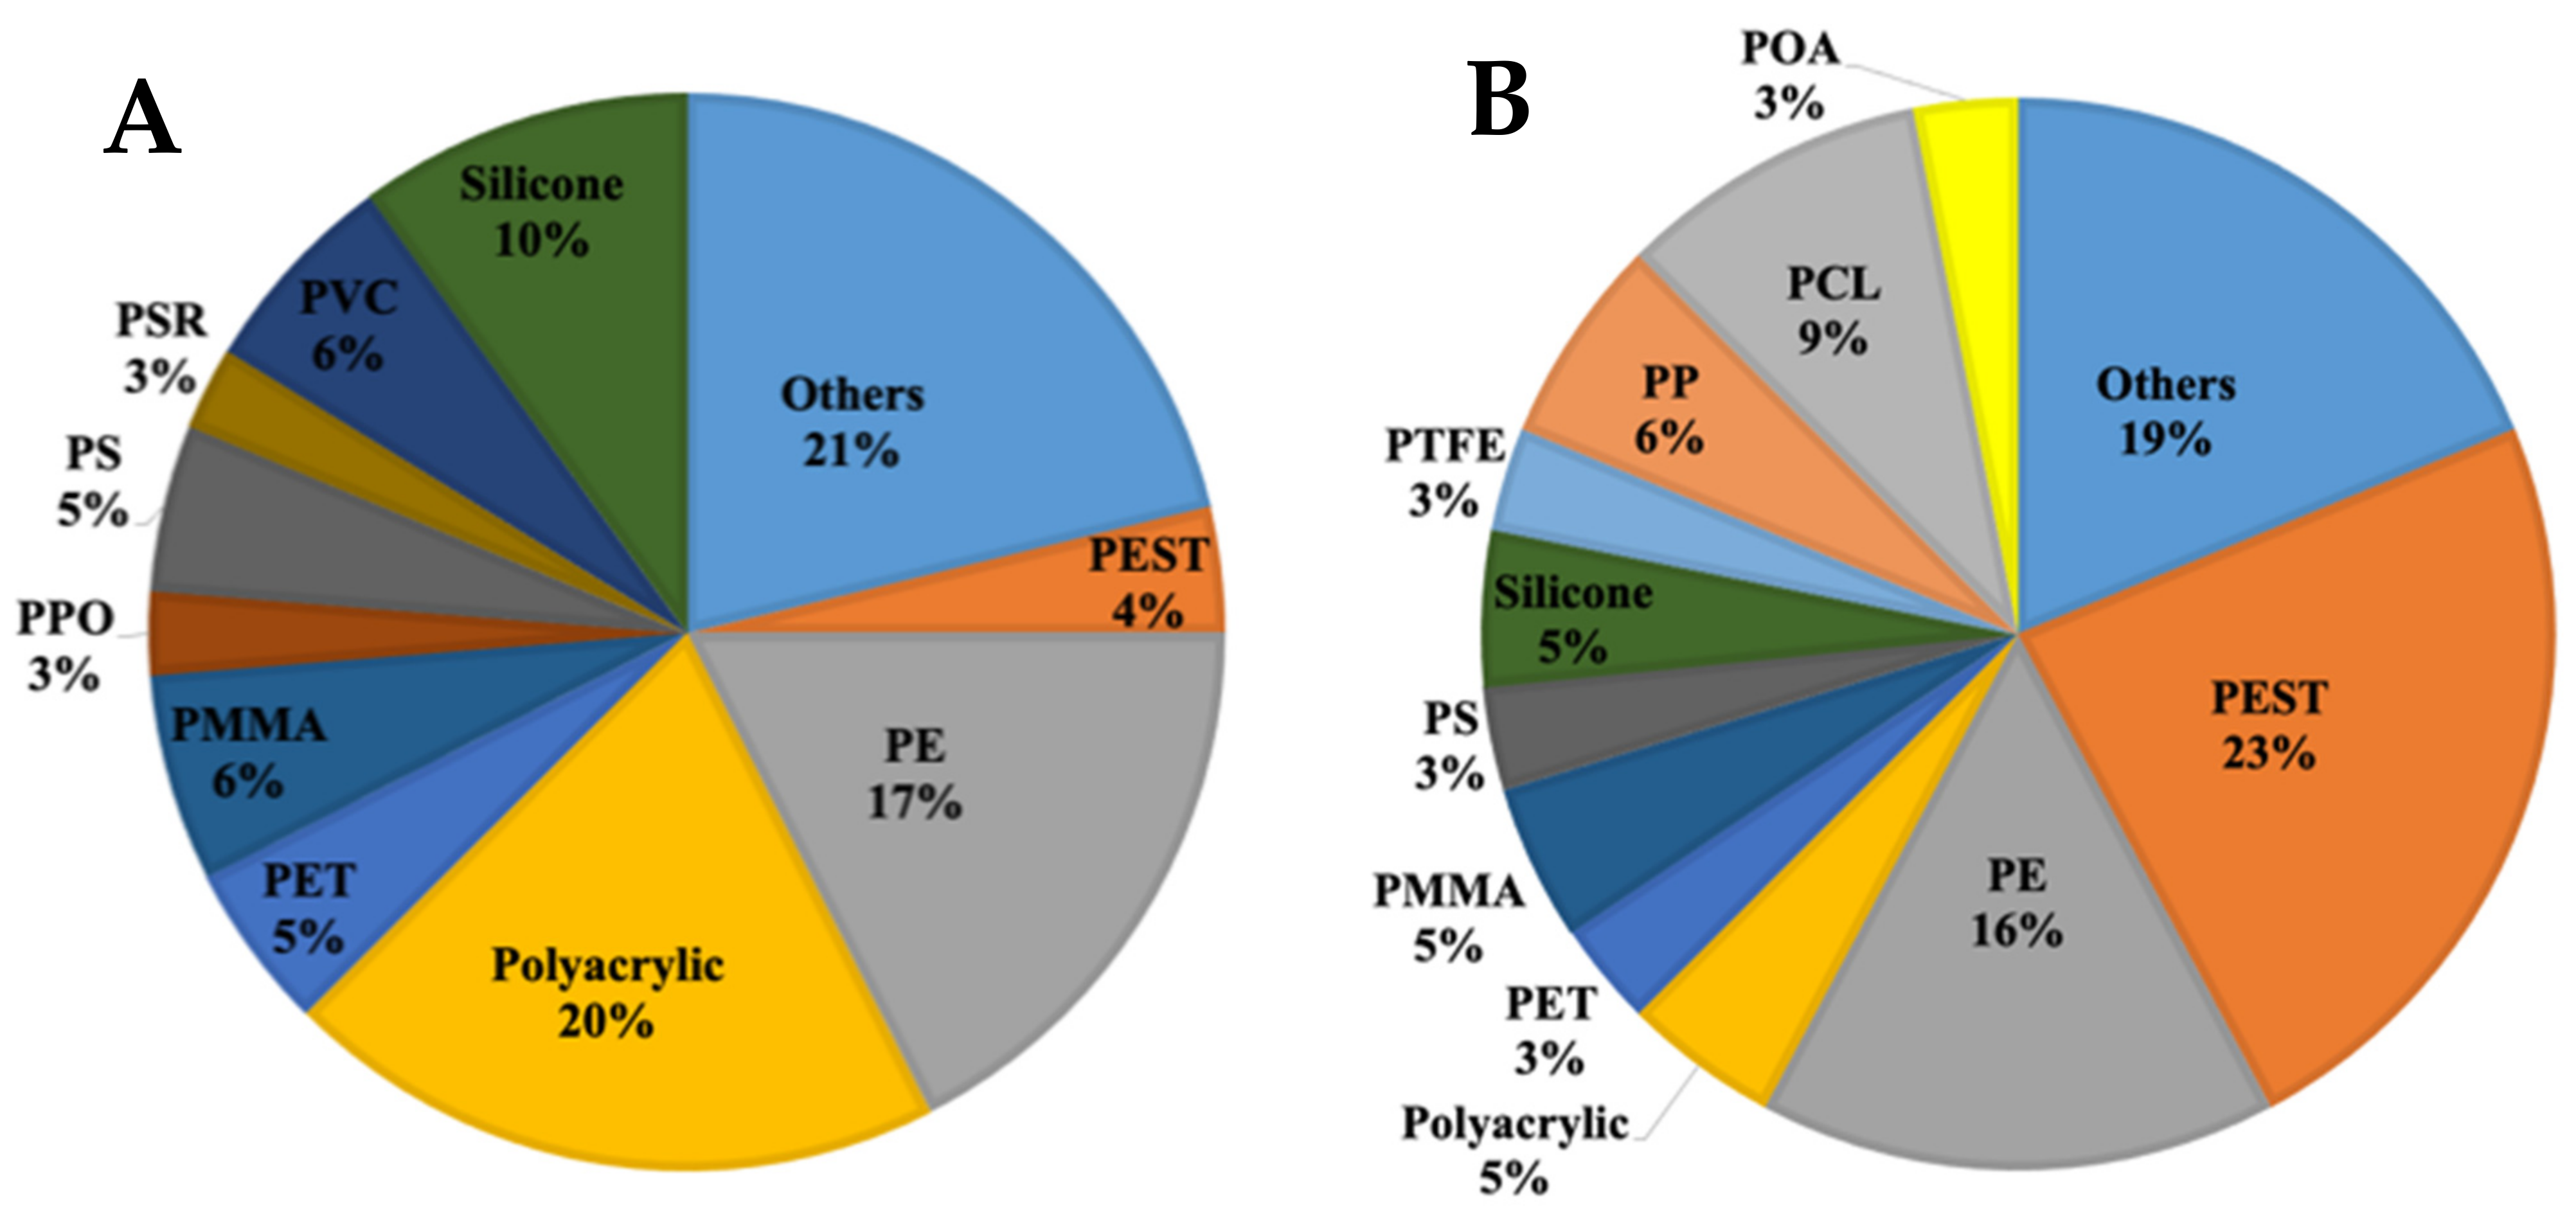
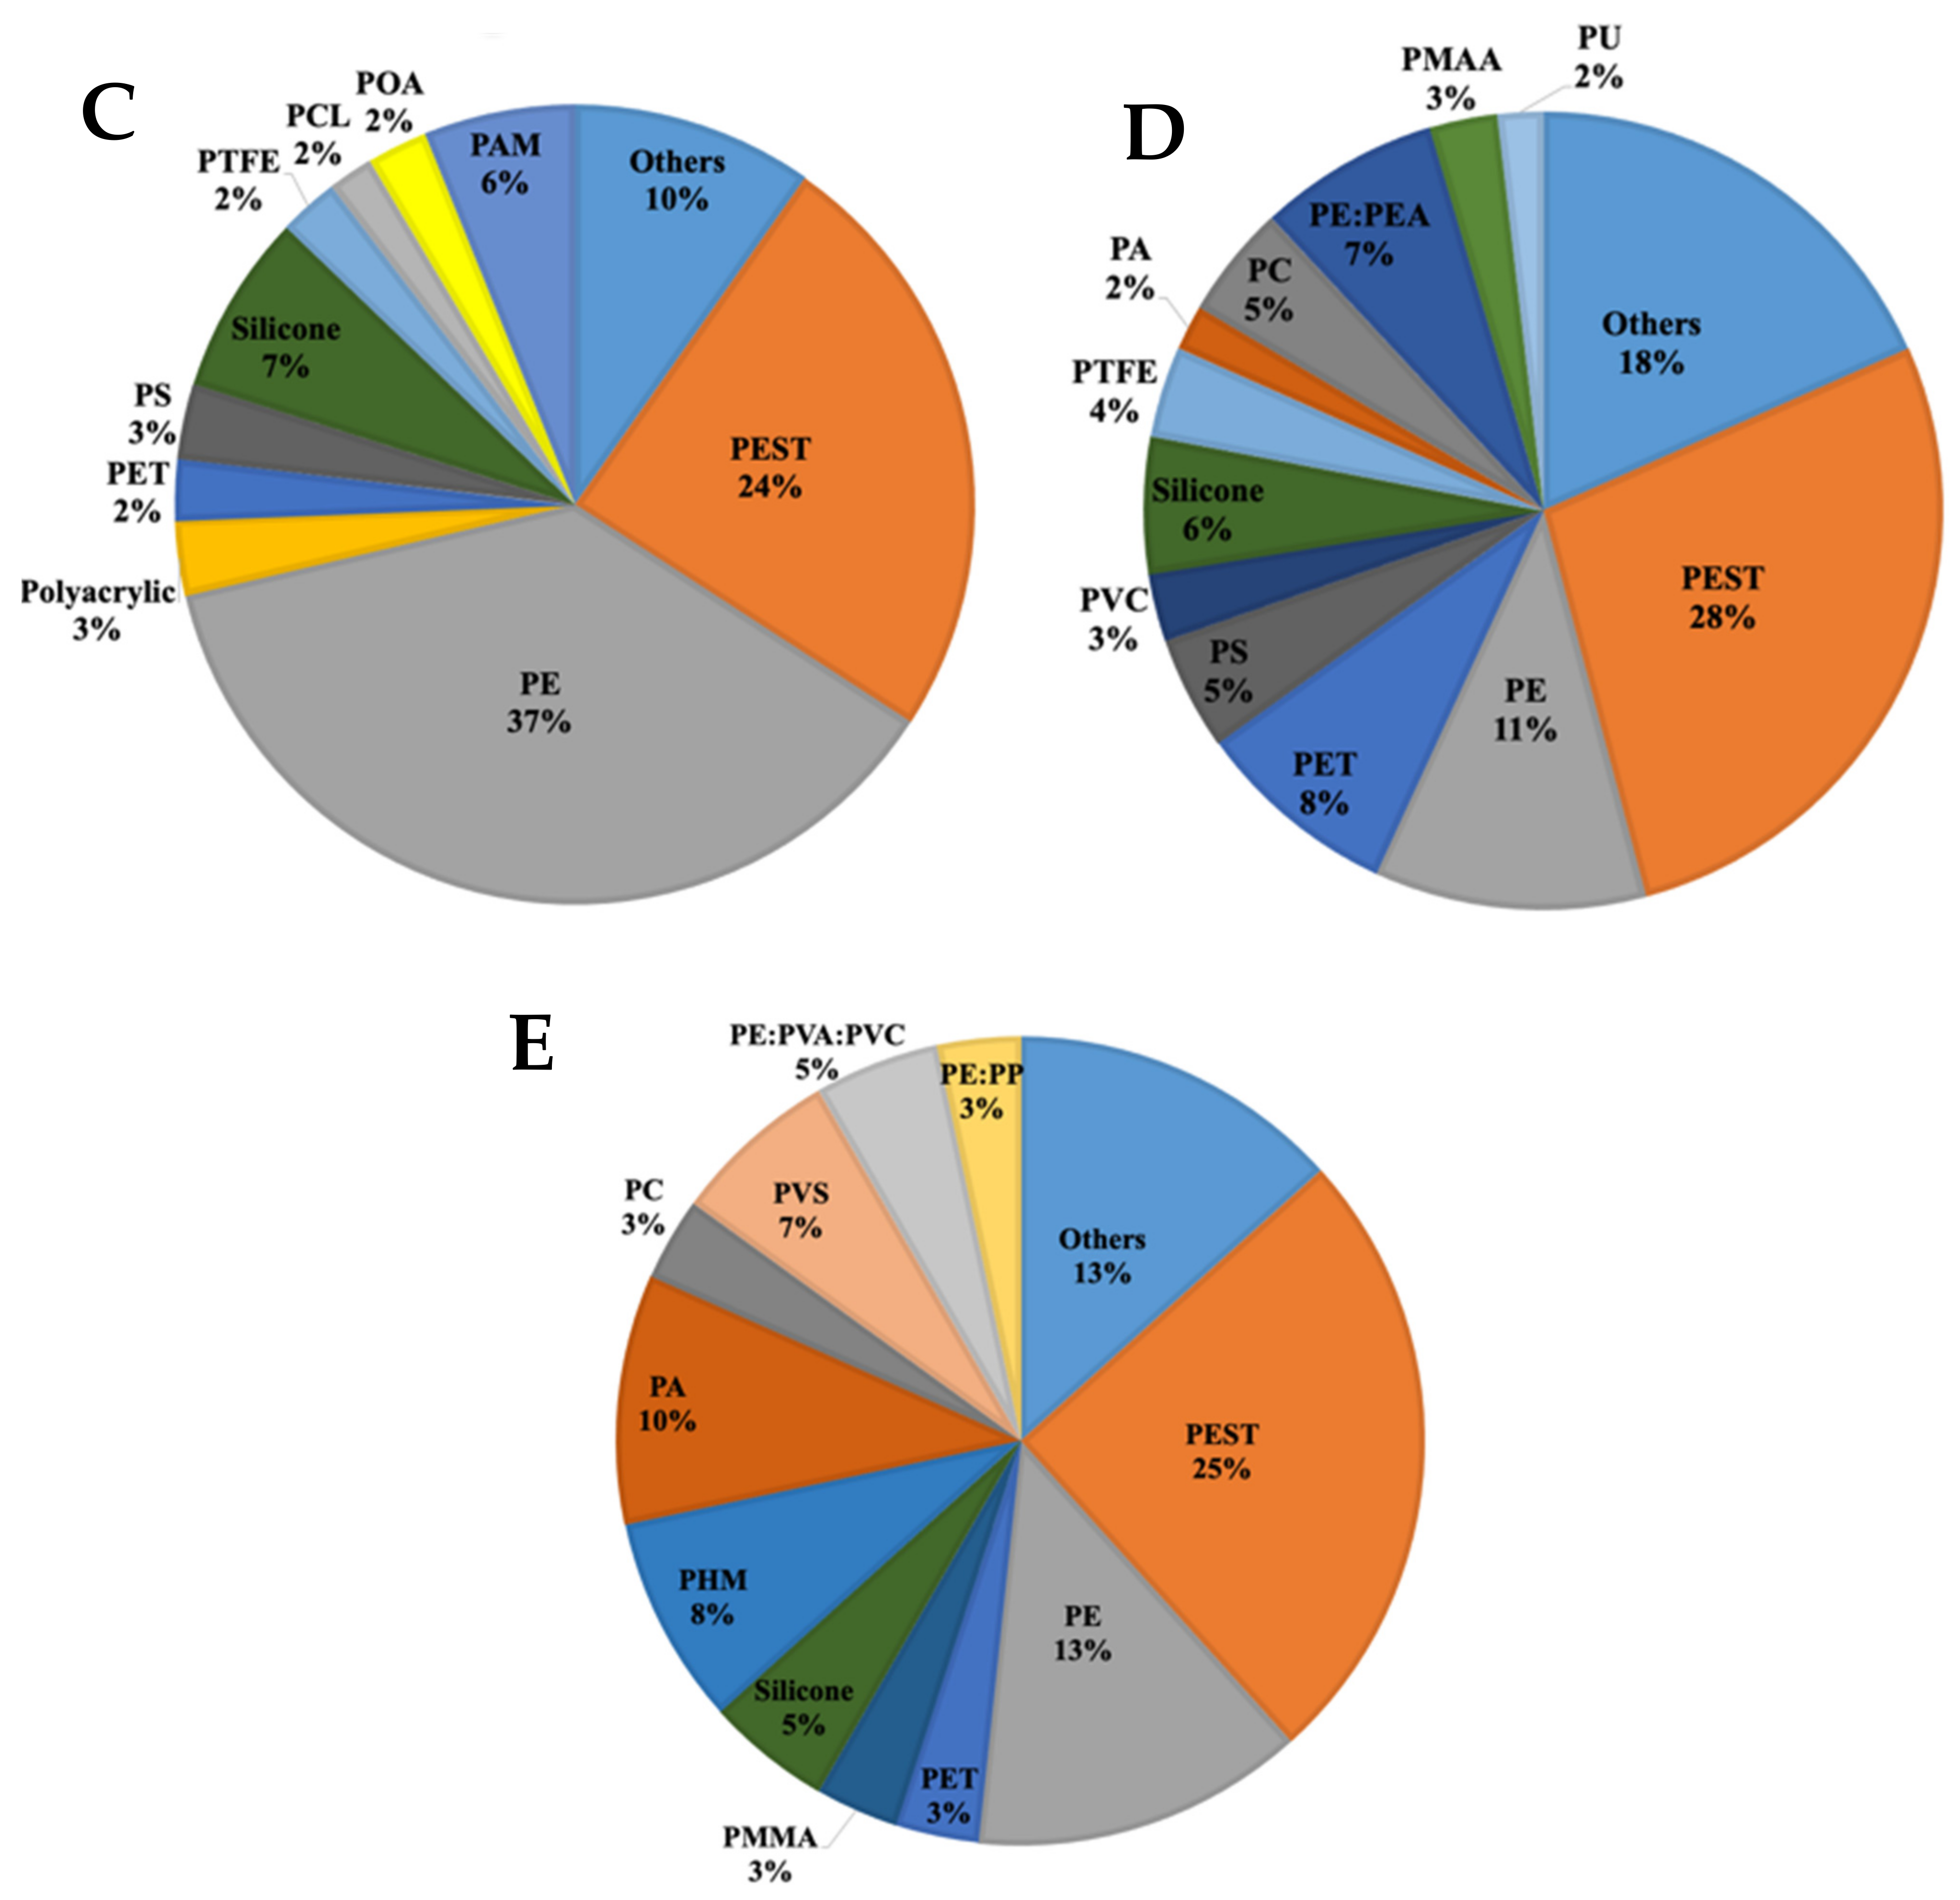
The composition of polymers detected in each type of sample is given in Figure 4. Twenty-two different polymers were detected in the pond water, including (% of total MPs particles identified): PEST (23%), PE (16%), PCL (9%), PP (6%), PMMA (5%), Silicone (5%), PS (3%), and PET (3%). Other polymers detected (at <2% each) include: PAM, polyacrylic, PEA, PEMA, PET, PEI, POA, PVS, polyvinyl alcohol, polylauryl acrylate, and three types of copolymers (PE:PVA:PVC; PMA:PE; PVDF:PHFP). In the treated effluent, 21 kinds of polymers were identified, with PE (37%) and PEST (24%) predominate.
Microplastics were most diverse in the sludge, with 30 different types identified. Not surprisingly, the majority were PEST (28%), followed by PE (11%), PET (8%) and PE:PEA (7%). In addition, 19 different polymers were observed in the duckweed, including PEST (25%), PE (13%), PA (10%), PHM (8%), and PVS (7%). Approximately 12% were copolymers and 86% of them contained PE.
3.3. Microplastics in the Lake Water
Microplastic abundances in the lake water were 2.3 ± 0.3 particles/L in summer and 3.1 ± 0.6 particles/L in winter (Figure 2), with the majority (60.1% and 58.2%, respectively) measured in the lowest size fraction (45–125 µm). Fibers were the most common shape, followed by fragments, and beads (Figure 3). A total of 25 different polymer types were found in the lake water, including polyacrylate (PA) (24%), polyethylene (PE) (17%), silicone (10%), polyvinyl chloride (PVC) (6%), PMMA (6%) and polyethylene terephthalate (PET) (5%). Other polymers occurred sporadically (Figure 4a). With regard to color, 43.5% were transparent, followed by blue/green (29.3%) and brown (10.7%) (Figure S5a).
4. Discussion
4.1. Contamination and Recoveries for Spiked Samples
Filtering water in the field for MPs is commonly used when large volumes are required for analyses. In this study, a water transfer pump was used to rapidly fill a 50 L polypropylene carboy container and then pass the water through 1 mm, 125 µm and 45 µm sieves. As noted, our method blank consisted of 50 L of RO water transferred into the carboy and processed in the same manner as samples. The blank averaged of 0.2 particles/L (9 fibers and 2 fragments/50 L), well below the ~4 particles/L (~200 particles/50 L) in the pond water and treated effluent. Thus, contamination was under control in this study.
We also validated the method using spikes consisting of several different polymers (Table S3). Instead of microbeads, which are often used for recovery tests, we used irregular-shaped and weathered MPs generated by cryomilling to more accurately reflect environmental MPs. Recoveries averaged 93.3% for PMMA, 83.3% for virgin PP, and 60% for weathered PP, demonstrating higher recoveries for the more-dense PMMA compared to PP (Table S4). Because the three plastics used for recovery tests cannot represent the diversity of sizes, shapes, and compositions of MPs in environmental samples, and to avoid introducing bias, we chose not to correct for these recoveries.
Although previous studies have concluded that Fenton’s reagent has negligible effect on many common polymer types [30], we examined its impact on PETG, PLA, CPE, ABS, PETG for ourselves. The mass of MPs was not significantly altered (p = 0.994) and IR spectra were near identical before and after the Fenton’s reagent digestion, suggesting there was minimal impacts to MPs in our samples.
4.2. Microplastics in the Lake Water
The average concentration of MPs in the water of Wellsgate Lake was 2.7 ± 0.6 particles/L. Concentrations were higher in the summer (3.1 ± 0.6 particles/L) than in the winter (2.3 ± 0.3 particles/L), but the difference was not statistically significant (p = 0.092). Wellsgate Lake is primarily fed by storm water runoff and supplemented by pumped ground water. Sources of plastic pollution may include the runoff, carelessly discarded plastic, and atmospheric deposition. Increased outdoor activity by the community, as well as more frequent storm events in the summer, could contribute to the slightly higher abundance of MPs in the lake during the warm season.
The MP concentrations at Wellsgate Lake are also higher than those reported for two other studies of freshwater lakes [31,32], but lower than in storm water runoff [33]. However, comparison of MP data between these different studies is problematic because of different MP sources, lake catchment areas, and population centers, as well as the different sampling, sample preparation, and analysis methods employed.
Approximately 20% of MPs detected in lake water were polyacrylates, commonly found in paints, as well as sunscreen and other personal care products. Its presence is not that surprising given that there is a large number of homes along the lake’s shore and surrounding vicinity, as well as a number of docks and boats that are routinely painted. PE (17%) was also predominant in the lake, similar to other studies of MPs in freshwater bodies [16,34,35]. PVC, PET, and PMMA accounted for 17% of the MPs particles identified in the lake. Most of the MPs were in the form of fibers (67%), often the predominant morphology found in surface water [36,37,38]. Whereas biofouling increases the relative density of many MPs causing them to sink, fibers tend to possess a relatively low surface area for fouling and are more likely to remain in the water column or on the water surface [39].
The MPs we observed were most commonly transparent (43.5%) or blue (29.3%), a color distribution similar to other published freshwater data [2,33,40]. Microplastics can inherit their colors from their parent plastic products, but often their colors can fade or change due to photodegradation and residence time in the water. Such color changes can reflect the degree of weathering [41].
4.3. Microplastics in the Waste Stabilization Pond
Microplastic concentrations averaged 12.8 ± 3.1 particles/g in the WSP sludge, which is similar to concentrations reported in sludge from municipal WWTPs [14,21,22]. Unlike municipal WWTPs which rapidly treats both domestic and industrial wastewater, the WSP in this study treats only domestic wastewater and the sludge can accumulate MPs for years. PEST accounted for 28% of MPs detected in the WSP sludge, followed by PE (11%), PET (8%), and PE:PEA copolymer (7%). PEST microfibers, commonly released in wastewater from the laundering of synthetic garments and shedding of textiles, is also the predominant type of MP found in sludge of municipal WWTPs [15,22,42]. Density is a major factor in the partitioning of MPs into environmental compartments. Although high density polymers were found more frequently in the WSP sludge, we also found low density polymers (PE, PS, and PU). However, this is not unusual as biofilms can increase their apparent density [13,21,43]. All samples collected from the WSP contained silicone; silicones are commonly used or found in households as sealants, adhesives, lubricants, kitchen items, and in thermal and electrical insulation.
We found the highest concentration of MPs in duckweed (75.2 ± 22.1 particles/g), mostly consisting of PEST (25%), PE (13%), and PA (10%). Aerated WSPs exploit symbiotic relationships between bacteria and algae and/or aquatic plants such as duckweed to decompose organic matter and treat wastewater. Zhang et al. (2017) reported that MPs, particularly fibers, can adsorb and aggregate onto algae [44]. Canniff and Hoang (2018) found algae growth was greater in the presence of microbeads and suggested that MPs could potentially serve as substrates for algae [45]. We now show that duckweed, a small aquatic plant that commonly floats on the surface of ponds, captures MPs. This is important because duckweed is a food source for waterfowl. Thus, WSPs may transfer MPs to the terrestrial ecosystem.
Abundances of MPs in the WSP water were similar in the summer and winter (p = 0.653). In the winter, concentrations in the pond and treated effluent were 4.0 ± 0.8 particles/L and 3.8 ± 0.7 particles/L, respectively. Concentrations were slightly higher in summer in both the pond (4.2 ± 0.4 particles/L) and effluent (4.0 ± 0.4 particles/L). Michielssen et al. (2016) and Conley et al. (2019) reported that variation of MPs in the treated effluent over the course of a year did not follow any seasonal pattern [19,46]. On a shorter time-scale, differences are expected to be greater at municipal WWTPs compared to WSPs due, in part, to plant operations, which can affect flow rates. As shown, concentrations of MP were slightly lower in the effluent than the pond water, suggesting a slight loss of particles from the water column as the wastewater travels from influent to the effluent. We speculate that most MPs introduced into the pond in the raw sewage (mixed by the aeration agitators) are either trapped by surface duckweed or deposited on the pond floor, with a smaller portion of the particles flowing with the circulating water under the duckweed, which can blanket the surface of most of the pond.
Not surprisingly, PEST (23%) and PE (16%) were the dominant types of MPs in the pond water. PEST is commonly used in apparel, carpets, and home furnishing materials, and PE is commonly used in consumer products and personal care products. In the pond effluent, the proportion of PE increased to 37%, while PEST remained similar (24%). Compared to sludge, most of detected MPs in the water were low density polymers. Polycaprolactone (PCL), a biodegradable thermoplastic polyester, was also detected in the pond water (9%). PCL is widely used as a drug delivery agent and in the production of polyurethanes.
Fibers accounted for the highest proportion of MPs in wastewater samples (65.2%) and sludge samples (64.4%). Most of the fibers were transparent (57.5%) or blue/green (21.5%). Others have shown that most of blue fibers are from the laundering of denim blue jeans [11]. Potential sources for transparent fibers could also be the shedding of garments and textiles or from materials flushed down toilets [42]. Microbeads in the 45–125 μm were also abundant (1 to 13 particles per 50 L in pond water). Carr et al. (2016) showed that the many MPs in the WWTPs had color, shape, and size similar to the blue PE particles present in toothpaste formulations [13]. Due to the adoption of the US Microbead-Free Waters Act of 2015, microbeads added to personal products have been either significantly reduced or totally replaced by irregular fragments.
Finally, without access to the influent, we were unable to assess concentrations of MPs entering the pond limiting our ability to fully evaluate removal rates. However, given the relatively high concentrations of MPs accumulated in the duckweed and sludge it seems reasonable that they harbor much of the MP burden. Nevertheless, we still estimate ~786,000 particles are discharged in the pond effluent daily, based on averages for both the concentration of MPs in the effluent and discharge flows. Thus, WSPs can indeed contribute MPs to downstream aquatic ecosystems. Given the growing demand on WWTPs and the more than 7000 facultative WSPs in the USA [47,48], the impact of WSPs, especially for those near vulnerable aquatic ecosystems, deserves further scrutiny. Future work should focus on new WSPs or those with access to inflows and flow data to allow mass balance studies. Whereas wastewater treatment is generally efficient at removal of MPs, source reduction remains the most efficient method to reduce contamination [49].
5. Conclusions
This study investigated MPs in a WSP serving a community of ~500 houses, as well as in an adjacent lake. Microplastics were present in all samples. Not surprisingly, the predominant polymers detected were PEST and PE, with varying amounts of other plastics depending on the sample media. Duckweed and sludge had the highest concentration of MPs, and likely harbor the bulk of the MPs in the system. The concentration of MPs in the treated effluent was lower than in the pond water, albeit by a small margin. There was no seasonal difference in MP abundances. Potential sources of the MPs in the WSP include the laundering of clothes, plastics pieces from consumer products washed down the drain, storm water runoff, shedding of paint, and atmospheric fallout. We estimate that the WSP discharges ~786,000 MPs per day in the treated effluent. Moreover, with duckweed harboring MPs that may be consumed by waterfowl, and with effluent containing higher concentrations than the nearby lake, we conclude that WSPs should not be overlooked as a source of MPs to the environment.
Supplementary Materials
The following are available online at https://www.mdpi.com/article/10.3390/w13202833/s1, Figure S1. Photos showing our sampling scheme and sampling sites at Wellsgate Lake (top left), the waste stabilization pond effluent (bottom left), and the waste stabilization pond itself (top and bottom right). Note the 50 L carboy emptying through a stack of sieves with mesh sizes of 1 mm, 125 µm, and 45 µm and the extensive surface duckweed in the pond. The water transfer pump and intake (just below the buoy in the top left) are also shown. Figure S2: Stereomicrograph of representative microplastics isolated from samples. (A) transparent fragment and (B) white fragment extracted from Wellsgate Lake, (C) transparent fragment extracted from pond, (D) white microbead and (E) blue microbead extracted from effluent, (F) blue fiber, (G) white microbead and (H) yellow fragment extracted from duckweed, (I) blue fiber extracted from sludge. Figure S3: Some spectrum of extracted MPs. Figure S4: Size distribution of microplastics extracted from Wellsgate Lake, the pond, and treated effluent. Figure S5: Color distribution of microplastics extracted from (A) Wellsgate Lake, (B) the pond, (C) treated effluent, (D) sludge, and (E) duckweed. Table S1: Abbreviation of polymers. Table S2: Properties of sludge collected from a community WSP. Table S3: Changes in mass of the tested plastic particles following wet peroxidation treatment. Table S4: Recovery of 500–1000 μm of microplastics spiked into lagoon wastewater and final effluent.
Author Contributions
J.V.C. conceptualized, supervised, and administered the project; Z.G. led the sampling and measurement campaign; Z.G., K.W. and J.V.C. analyzed and interpreted the data and authored the manuscript; H.L. analyzed select samples by FTIR microscopy. All authors have read and agreed to the published version of the manuscript.
Funding
This research was partially funded by the U.S. Geological Survey (USGS) under Grant/Cooperative Agreement No. (G16AP00065). The views and conclusions contained in this document are those of the authors and should not be interpreted as representing the opinions or policies of the USGS. Mention of trade names or commercial products does not constitute their endorsement by the USGS.
Institutional Review Board Statement
Not applicable.
Informed Consent Statement
Not applicable.
Data Availability Statement
The data presented in this study are also available on request from the corresponding author.
Acknowledgments
We thank Xichao Chen at SCIES for support with the FTIR microscope. We are also grateful to the Wellsgate community for allowing us access to the site.
Conflicts of Interest
The authors declare no conflict of interest. The funders had no role in the design of the study; in the collection, analyses, or interpretation of data; in the writing of the manuscript, or in the decision to publish the results.
References
- Cole, M.; Lindeque, P.; Halsband, C.; Galloway, T.S. Microplastics as contaminants in the marine environment: A review. Mar. Pollut. Bull. 2011, 62, 2588–2597. [Google Scholar] [CrossRef]
- Hidalgo-Ruz, V.; Gutow, L.; Thompson, R.C.; Thiel, M. Microplastics in the marine environment: A review of the methods used for identification and quantification. Environ. Sci. Technol. 2012, 46, 3060–3075. [Google Scholar] [CrossRef]
- Miranda, D.D.A.; de Carvalho-Souza, G.F. Are we eating plastic-ingesting fish? Mar. Pollut. Bull. 2016, 103, 109–114. [Google Scholar] [CrossRef]
- Sharma, S.; Chatterjee, S. Microplastic pollution, a threat to marine ecosystem and human health: A short review. Environ. Sci. Pollut. Res. 2017, 24, 21530–21547. [Google Scholar] [CrossRef]
- Auta, H.S.; Emenike, C.U.; Fauziah, S.H. Distribution and importance of microplastics in the marine environment: A review of the sources, fate, effects, and potential solutions. Environ. Int. 2017, 102, 165–176. [Google Scholar] [CrossRef]
- Thompson, R.C.; Swan, S.H.; Moore, C.J.; Vom Saal, F.S. Our plastic age. Phil. Trans. R. Soc. B 2009, 364, 1973–1976. [Google Scholar] [CrossRef] [Green Version]
- Gewert, B.; Plassmann, M.M.; MacLeod, M. Pathways for degradation of plastic polymers floating in the marine environment. Environ. Sci. Process. Impacts 2015, 17, 1513–1521. [Google Scholar] [CrossRef] [Green Version]
- Enfrin, M.; Dumée, L.F.; Lee, J. Nano/microplastics in water and wastewater treatment processes—Origin, impact and potential solutions. Water Res. 2019, 161, 621–638. [Google Scholar] [CrossRef]
- Mason, S.A.; Garneau, D.; Sutton, R.; Chu, Y.; Ehmann, K.; Barnes, J.; Fink, P.; Papazissimos, D.; Rogers, D.L. Microplastic pollution is widely detected in US municipal wastewater treatment plant effluent. Environ. Pollut. 2016, 218, 1045–1054. [Google Scholar] [CrossRef]
- Dris, R.; Gasperi, J.; Rocher, V.; Saad, M.; Renault, N.; Tassin, B. Microplastic contamination in an urban area: A case study in Greater Paris. Environ. Chem. 2015, 12, 592–599. [Google Scholar] [CrossRef]
- Athey, S.N.; Adams, J.K.; Erdle, L.M.; Jantunen, L.M.; Helm, P.A.; Finkelstein, S.A.; Diamond, M.L. The widespread environmental footprint of indigo denim microfibers from blue jeans. Environ. Sci. Technol. Lett. 2020, 7, 840–847. [Google Scholar] [CrossRef]
- McCormick, A.; Hoellein, T.J.; Mason, S.A.; Schluep, J.; Kelly, J.J. Microplastic is an abundant and distinct microbial habitat in an urban river. Environ. Sci. Technol. 2014, 48, 11863–11871. [Google Scholar] [CrossRef]
- Carr, S.A.; Liu, J.; Tesoro, A.G. Transport and fate of microplastic particles in wastewater treatment plants. Water Res. 2016, 91, 174–182. [Google Scholar] [CrossRef]
- Mintenig, S.M.; Int-Veen, I.; Löder, M.G.; Primpke, S.; Gerdts, G. Identification of microplastic in effluents of waste water treatment plants using focal plane array-based micro-Fourier-transform infrared imaging. Water Res. 2017, 108, 365–372. [Google Scholar] [CrossRef]
- Talvitie, J.; Mikola, A.; Koistinen, A.; Setälä, O. Solutions to microplastic pollution–Removal of microplastics from wastewater effluent with advanced wastewater treatment technologies. Water Res. 2017, 123, 401–407. [Google Scholar] [CrossRef] [Green Version]
- Park, T.J.; Lee, S.H.; Lee, M.S.; Lee, J.K.; Lee, S.H.; Zoh, K.D. Occurrence of microplastics in the Han River and riverine fish in South Korea. Sci. Total Environ. 2020, 708, 134535. [Google Scholar] [CrossRef]
- Murphy, F.; Ewins, C.; Carbonnier, F.; Quinn, B. Wastewater treatment works (WwTW) as a source of microplastics in the aquatic environment. Environ. Sci. Technol. 2016, 50, 5800–5808. [Google Scholar] [CrossRef] [Green Version]
- Estahbanati, S.; Fahrenfeld, N.L. Influence of wastewater treatment plant discharges on microplastic concentrations in surface water. Chemosphere 2016, 162, 277–284. [Google Scholar] [CrossRef]
- Michielssen, M.R.; Michielssen, E.R.; Ni, J.; Duhaime, M.B. Fate of microplastics and other small anthropogenic litter (SAL) in wastewater treatment plants depends on unit processes employed. Environ. Sci. Water Res. Technol. 2016, 2, 1064–1073. [Google Scholar] [CrossRef] [Green Version]
- Nizzetto, L.; Futter, M.; Langaas, S. Are agricultural soils dumps for microplastics of urban origin? Environ. Sci. Technol. 2016, 50, 10777–10779. [Google Scholar] [CrossRef]
- Mahon, A.M.; O’Connell, B.; Healy, M.G.; O’Connor, I.; Officer, R.; Nash, R.; Morrison, L. Microplastics in sewage sludge: Effects of treatment. Environ. Sci. Technol. 2017, 51, 810–818. [Google Scholar] [CrossRef]
- Lares, M.; Ncibi, M.C.; Sillanpää, M.; Sillanpää, M. Occurrence, identification and removal of microplastic particles and fibers in conventional activated sludge process and advanced MBR technology. Water Res. 2018, 133, 236–246. [Google Scholar] [CrossRef]
- Butler, E.; Hung, Y.T.; Al Ahmad, M.S.; Yeh, R.Y.L.; Liu, R.L.H.; Fu, Y.P. Oxidation pond for municipal wastewater treatment. Appl. Water Sci. 2017, 7, 31–51. [Google Scholar] [CrossRef] [Green Version]
- Mara, D. Waste stabilization ponds: Past, present and future. Desalin. Water Treat. 2012, 4, 85–88. [Google Scholar] [CrossRef] [Green Version]
- Masura, J.; Baker, J.; Foster, G.; Arthur, C. Laboratory Methods for the Analysis of Microplastics in the Marine Environment: Recommendations for Quantifying Synthetic Particles in Waters and Sediments; NOAA Technical Memorandum NOS-OR&R-48; Marine Debris Program, National Oceanic and Atmospheric Administration; U.S. Department of Commerce: Silver Spring, MD, USA, 2015.
- Soltani, N.S.; Taylor, M.P.; Wilson, S.P. Quantification and exposure assessment of microplastics in Australian indoor house dust. Environ. Pollut. 2021, 283, 117064. [Google Scholar] [CrossRef]
- Scircle, A.; Cizdziel, J.V.; Missling, K.; Li, L.; Vianello, A. Single-Pot Method for the Collection and Preparation of Natural Water for Microplastic Analyses: Microplastics in the Mississippi River System during and after Historic Flooding. Environ. Toxicol. Chem. 2020, 39, 986–995. [Google Scholar] [CrossRef]
- Tagg, A.S.; Sapp, M.; Harrison, J.P.; Ojeda, J.J. Identification and quantification of microplastics in wastewater using focal plane array-based reflectance micro-FT-IR imaging. Anal. Chem. 2015, 87, 6032–6040. [Google Scholar] [CrossRef] [Green Version]
- Hurley, R.R.; Lusher, A.L.; Olsen, M.; Nizzetto, L. Validation of a method for extracting microplastics from complex, organic-rich, environmental matrices. Environ. Sci. Technol. 2018, 52, 7409–7417. [Google Scholar] [CrossRef] [Green Version]
- Tagg, A.S.; Harrison, J.P.; Ju-Nam, Y.; Sapp, M.; Bradley, E.L.; Sinclair, C.J.; Ojeda, J.J. Fenton’s reagent for the rapid and efficient isolation of microplastics from wastewater. Chem. Commun. 2017, 53, 372–375. [Google Scholar] [CrossRef] [Green Version]
- Jian, M.; Zhang, Y.; Yang, W.; Zhou, L.; Liu, S.; Xu, E.G. Occurrence and distribution of microplastics in China’s largest freshwater lake system. Chemosphere 2020, 261, 128186. [Google Scholar] [CrossRef]
- Bertoldi, C.; Lara, L.Z.; Fernanda, A.D.L.; Martins, F.C.; Battisti, M.A.; Hinrichs, R.; Fernandes, A.N. First evidence of microplastic contamination in the freshwater of Lake Guaíba, Porto Alegre, Brazil. Sci. Total Environ. 2021, 759, 143503. [Google Scholar] [CrossRef]
- Grbić, J.; Helm, P.; Athey, S.; Rochman, C.M. Microplastics entering northwestern Lake Ontario are diverse and linked to urban sources. Water Res. 2020, 174, 115623. [Google Scholar] [CrossRef]
- Lin, L.; Zuo, L.Z.; Peng, J.P.; Cai, L.Q.; Fok, L.; Yan, Y.; Li, H.X.; Xu, X.R. Occurrence and distribution of microplastics in an urban river: A case study in the Pearl River along Guangzhou City, China. Sci. Total Environ. 2018, 644, 375–381. [Google Scholar] [CrossRef]
- Sighicelli, M.; Pietrelli, L.; Lecce, F.; Iannilli, V.; Falconieri, M.; Coscia, L.; Di Vito, S.; Nuglio, S.; Zampetti, G. Microplastic pollution in the surface waters of Italian Subalpine Lakes. Environ. Pollut. 2018, 236, 645–651. [Google Scholar] [CrossRef]
- Baldwin, A.K.; Corsi, S.R.; Mason, S.A. Plastic debris in 29 Great Lakes tributaries: Relations to watershed attributes and hydrology. Environ. Sci. Technol. 2016, 50, 10377–10385. [Google Scholar] [CrossRef]
- Anderson, P.J.; Warrack, S.; Langen, V.; Challis, J.K.; Hanson, M.L.; Rennie, M.D. Microplastic contamination in lake Winnipeg, Canada. Environ. Pollut. 2017, 225, 223–231. [Google Scholar] [CrossRef]
- Han, M.; Niu, X.; Tang, M.; Zhang, B.T.; Wang, G.; Yue, W.; Kong, X.; Zhu, J. Distribution of microplastics in surface water of the lower Yellow River near estuary. Sci. Total Environ. 2020, 707, 135601. [Google Scholar] [CrossRef] [PubMed]
- Kooi, M.; Besseling, E.; Kroeze, C.; Van Wezel, A.P.; Koelmans, A.A. Modeling the fate and transport of plastic debris in freshwaters: Review and guidance. Freshw. Microplast. 2018, 125–152. [Google Scholar]
- Campanale, C.; Stock, F.; Massarelli, C.; Kochleus, C.; Bagnuolo, G.; Reifferscheid, G.; Uricchio, V.F. Microplastics and their possible sources: The example of Ofanto river in southeast Italy. Environ. Pollut. 2020, 258, 113284. [Google Scholar] [CrossRef] [PubMed]
- Lambert, S.; Wagner, M. Microplastics are contaminants of emerging concern in freshwater environments: An overview. Freshw. Microplast. 2018, 1–23. [Google Scholar]
- Raju, S.; Carbery, M.; Kuttykattil, A.; Senthirajah, K.; Lundmark, A.; Rogers, Z.; Suresh, S.C.B.; Evans, G.; Palanisami, T. Improved methodology to determine the fate and transport of microplastics in a secondary wastewater treatment plant. Water Res. 2020, 173, 115549. [Google Scholar] [CrossRef] [PubMed]
- Edo, C.; González-Pleiter, M.; Leganés, F.; Fernández-Piñas, F.; Rosal, R. Fate of microplastics in wastewater treatment plants and their environmental dispersion with effluent and sludge. Environ. Pollut. 2020, 259, 113837. [Google Scholar] [CrossRef] [PubMed]
- Zhang, C.; Chen, X.; Wang, J.; Tan, L. Toxic effects of microplastic on marine microalgae Skeletonema costatum: Interactions between microplastic and algae. Environ. Pollut. 2017, 220, 1282–1288. [Google Scholar] [CrossRef] [PubMed]
- Canniff, P.M.; Hoang, T.C. Microplastic ingestion by Daphnia magna and its enhancement on algal growth. Sci. Total Environ. 2018, 633, 500–507. [Google Scholar] [CrossRef] [Green Version]
- Conley, K.; Clum, A.; Deepe, J.; Lane, H.; Beckingham, B. Wastewater treatment plants as a source of microplastics to an urban estuary: Removal efficiencies and loading per capita over one year. Water Res. X 2019, 3, 100030. [Google Scholar] [CrossRef]
- United States Environmental Protection Agency. 2002 Edition of the Drinking Water Standards and Health Advisories; EPA/822-R-02/038; Environmental Protection Agency: Washington, DC, USA, 2002.
- American Society of Civil Engineers. 2017 Infrastructure Report Card: Wastewater. 2017. Available online: https://www.infrastructurereportcard.org/wp-content/uploads/2017/01/Wastewater-Final.pdf (accessed on 15 August 2021).
- Prata, J.C. Microplastics in wastewater: State of the knowledge on sources, fate and solutions. Mar. Pollut. Bull. 2018, 129, 262–265. [Google Scholar] [CrossRef] [PubMed]
Figure 1.
Study area showing (A) the distance and pathway (squiggly red line) from the study site to Sardis Lake downstream, (B) Wellsgate Lake and the surrounding community, and (C) overview of the WSP with arrows indicating direction of WSP discharge and overflow from lake, and (D) close-up photo of aeration of the WSP and surface duckweed. Letters in section (C) indicate the general location where samples of water (W), sludge (S), and surface duckweed (A) were collected, with the W just outside of the pond representing the effluent sampling site.

Figure 2.
Microplastic abundances in four different compartments in the waste stabilization pond (pond water, effluent water, sludge, and duckweed) and in water from an adjacent lake during warm and cold seasons. Error bars = ±1 standard deviation.
Figure 2.
Microplastic abundances in four different compartments in the waste stabilization pond (pond water, effluent water, sludge, and duckweed) and in water from an adjacent lake during warm and cold seasons. Error bars = ±1 standard deviation.

Figure 3.
The distribution of microplastic morphologies detected in Wellsgate Lake and the waste stabilization pond (water, effluent, sludge, and duckweed).
Figure 3.
The distribution of microplastic morphologies detected in Wellsgate Lake and the waste stabilization pond (water, effluent, sludge, and duckweed).

Figure 4.
Composition of polymers detected in Wellsgate Lake water (A), wastewater stabilization pond water (B), treated effluent (C), sludge (D), and duckweed (E).
Figure 4.
Composition of polymers detected in Wellsgate Lake water (A), wastewater stabilization pond water (B), treated effluent (C), sludge (D), and duckweed (E).


Publisher’s Note: MDPI stays neutral with regard to jurisdictional claims in published maps and institutional affiliations. |
© 2021 by the authors. Licensee MDPI, Basel, Switzerland. This article is an open access article distributed under the terms and conditions of the Creative Commons Attribution (CC BY) license (https://creativecommons.org/licenses/by/4.0/).
Share and Cite
MDPI and ACS Style
Gao, Z.; Cizdziel, J.V.; Wontor, K.; Lu, H. Are Rural and Small Community Aerated Wastewater Stabilization Ponds a Neglected Source of Microplastic Pollution? Water 2021, 13, 2833. https://doi.org/10.3390/w13202833
AMA Style
Gao Z, Cizdziel JV, Wontor K, Lu H. Are Rural and Small Community Aerated Wastewater Stabilization Ponds a Neglected Source of Microplastic Pollution? Water. 2021; 13(20):2833. https://doi.org/10.3390/w13202833
Chicago/Turabian StyleGao, Zhiqiang, James V. Cizdziel, Kendall Wontor, and Haitao Lu. 2021. "Are Rural and Small Community Aerated Wastewater Stabilization Ponds a Neglected Source of Microplastic Pollution?" Water 13, no. 20: 2833. https://doi.org/10.3390/w13202833
Note that from the first issue of 2016, this journal uses article numbers instead of page numbers. See further details here.