
Wave Impact Loads on Vertical Seawalls: Effects of the Geometrical Properties of Recurve Retrofitting


1
School of Engineering, University of Warwick, Coventry CV4 7AL, UK
2
UCD Dooge Centre for Water Resources Research, School of Civil Engineering, UCD Earth Institute, University College Dublin, D04 V1W8 Dublin 4, Ireland
*
Author to whom correspondence should be addressed.
Water 2021, 13(20), 2849; https://doi.org/10.3390/w13202849
Submission received: 30 August 2021
/
Revised: 5 October 2021
/
Accepted: 9 October 2021
/
Published: 13 October 2021
(This article belongs to the Special Issue Enhancing Resilience to Climate Change by Mitigating Extreme Wave-Induced Hazards on Sea Defences)
Abstract
:This study investigates the variation of wave impact loads with the geometrical configurations of recurve retrofits mounted on the crest of a vertical seawall. Physical model tests were undertaken in a wave flume at the University of Warwick to investigate the effects of the geometrical properties of recurve on the pressure distribution, overall force, and overturning moment at the seawall, subject to both impulsive and non-impulsive waves. Additionally, the wave impact and quasi-static loads on the recurve portion of the retrofitted seawalls are investigated to understand the role of retrofitting on the structural integrity of the vertical seawall. Detailed analysis of laboratory measurements is conducted to understand the effects of overhang length and height of the recurve wall on the wave loading. It is found that the increase in both recurve height and overhang length lead to the increase of horizontal impact force at an average ratio of 1.15 and 1.1 times larger the reference case of a plain vertical wall for the tested configurations. The results also show that the geometrical shape changes in recurve retrofits, increasing the overturning moment enacted by the wave impact force. A relatively significant increase in wave loading (both impact and quasi-static loads) are observed for the higher recurve retrofits, while changes in the overturning moment are limited for the retrofits with longer overhang length. The data generated from the physical modelling measurements presented in this study will be particularly helpful for a range of relevant stakeholders, including coastal engineers, infrastructure designers, and the local authorities in coastal regions. The results of this study can also enable scientists to design and develop robust decision support tools to evaluate the performance of vertical seawalls with recurve retrofitting.
1. Introduction
The combined effects of sea-level rise and intensified extreme storm surges due to climate change will result in the reduction of crest freeboard levels of existing coastal defence infrastructures in the coming decades and increase the vulnerability of coastal defences to erosion and flooding [1,2,3]. Traditionally, coastal flood risk management schemes relied heavily on ‘hard’ engineered coastal defense infrastructures [4,5,6], which are often associated with high costs of design, construction and maintenance. One of the effective methods in enhancing the climate resilience of existing coastal defence infrastructures against wave induced overtopping hazards is retrofitting [7,8,9]. While the retrofitted sea defences may be efficient in mitigating wave overtopping characteristics [10,11], they can be subjected to violent wave impact loads that may cause structural damage, including reduction of structural stability of retrofitted infrastructures [12,13].
Recurve walls are considered as an effective approach in mitigating wave overtopping at vertical seawalls [14,15,16,17,18,19]. The addition of a recurve wall changes the geometrical shape of the seawall structure; therefore, it is essential to fully understand the characteristics of wave impact loads applied on the structure due to the addition of recurve retrofitting, in order to make informed decisions regarding the suitability of the retrofitting design and the stability of the defence structure. Previous research showed that the addition of a recurve wall on the seawall crest increases the wave impact loads at the structure [18,20,21]. Kortenhaus et al. [18] undertook physical modelling experiments on vertical seawalls with different overhang lengths on the crest. They reported an increase factor of around 2.0 for the wave impact force on the recurve parapet. Variations in the geometrical properties of recurve parapet resulted in changes in the measured impact force. Longer overhang length or larger recurve angles were reported to cause more significant increases in the wave impact force [22,23,24,25].
In addition to the influence on the magnitude of impact loads, the pressure profile is also significantly affected by the geometrical properties of the recurve wall, including overhang length and recurve angle. Generally, for the plain vertical seawall, the maximum wave impact pressure occurs at around the still water level [26,27,28]. For a vertical seawall with recurve retrofitting, the location of maximum pressure moves upward vertically along the seawall with the increase of overhang length of the recurve wall. By increasing the overhang length, the location of maximum pressure may move downward towards the toe of the seawall due to the wave-structure interactions and waves bouncing back on the overhang portion of the recurve wall [29,30].
Previous research works also suggest different wave characteristics such as wave periods or wave breaking parameters that led to different interactions between the wave, the bottom topography, structure, and air in the nearshore region [31,32], enacting variable magnitudes of the wave loads (e.g., pressure and total force) on the structure. For example, Ravindar et al. [33] carried out a series of large-scale experiments to investigate the wave impact forces on recurve walls under a range of breaking wave conditions. They observed a relatively significant increase in wave loads for small air entrained between the breaking waves and structures. Similar findings were also reported by Bullock et al. [26], where they reported that larger impact force usually occurs when less air bubbles are entrained in front of the structure.
In recent years, several studies have been devoted to investigating the influence of wave impact loads on vertical breakwaters (e.g., [22,28,33,34]). However, detailed understanding and reliable prediction of violent wave impact loads on vertical seawalls with recurve retrofitting are still limited due to the lack of comprehensive data on the relationship between wave loading and geometrical properties of recurve walls under both swell and extreme wave conditions. This study aims to bridge this existing knowledge gap by performing a comprehensive suite of physical model experiments investigating the wave impact loads for three different shapes of recurve parapets subjected to both swell and storm wave attacks. Detailed analysis of the physical modelling measurements and comparison of the results with the existing predictive methods are conducted to examine the variation of wave impact loads and the overturing moment on the seawall with respect to the geometrical properties of the recurve retrofitting.
2. Materials and Methods
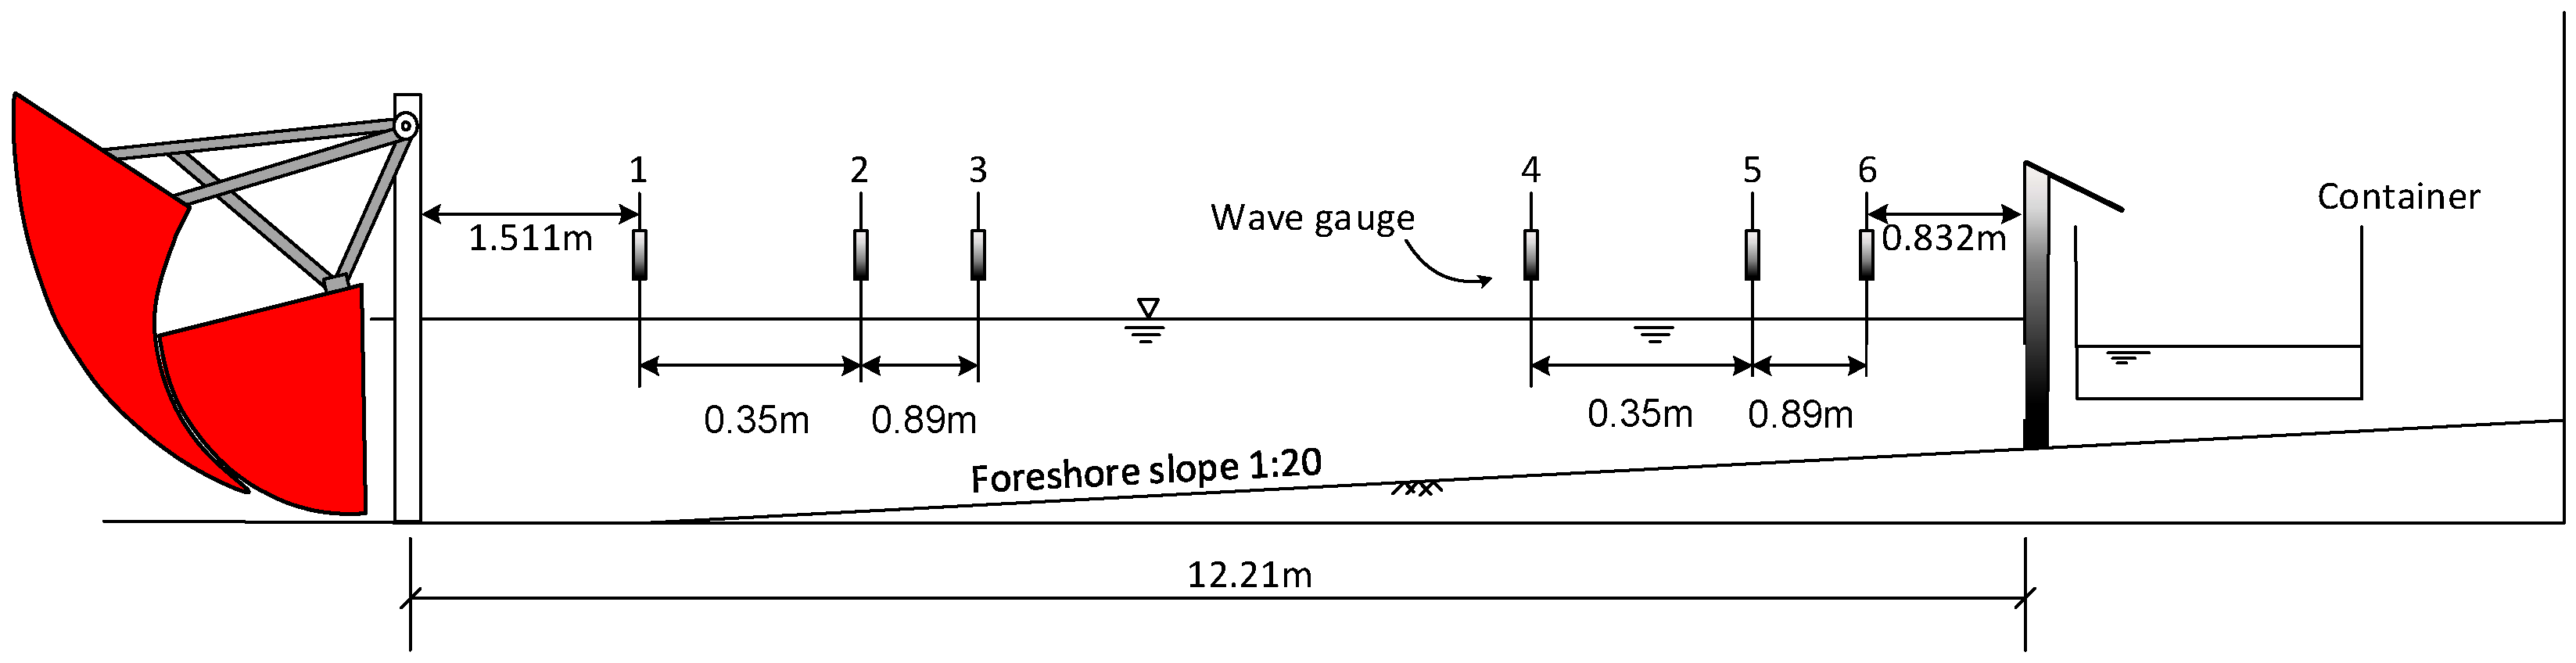
Physical model experiments were undertaken in a wave flume in the School of Engineering at the University of Warwick. The wave channel has dimensions of 22.0(L) × 0.6(W) × 1.0(H) m with a 1:20 smooth foreshore beach (see Figure 1). The flume is equipped with a piston-type wave generator and an active absorption system (AWAS). Each test case consisted of approximately 1000 pseudo-random waves based on the JONSWAP (γ = 3.3) spectrum, at a 1:50 scale.
The inshore wave characteristics, i.e., wave heights and wave periods, in deep water and near the seawall structure were measured by the three-point wave gauging method, adopting Mansard and Funke’s [35] methodology. Additionally, to mitigate any uncertainty that may arise from reflection induced from the structure, calibration experiments were performed in ‘bare’ channel condition, maintaining the same wave gauge profiling, as described by [36,37,38,39,40]. To observe the influence of wave characteristics on wave impact loading on the recurve parapet, deep water nominal wave steepness ranging from sop 2% to 6% were tested in this study. A summary of wave conditions and test configurations investigated in this study is shown in Table 1.
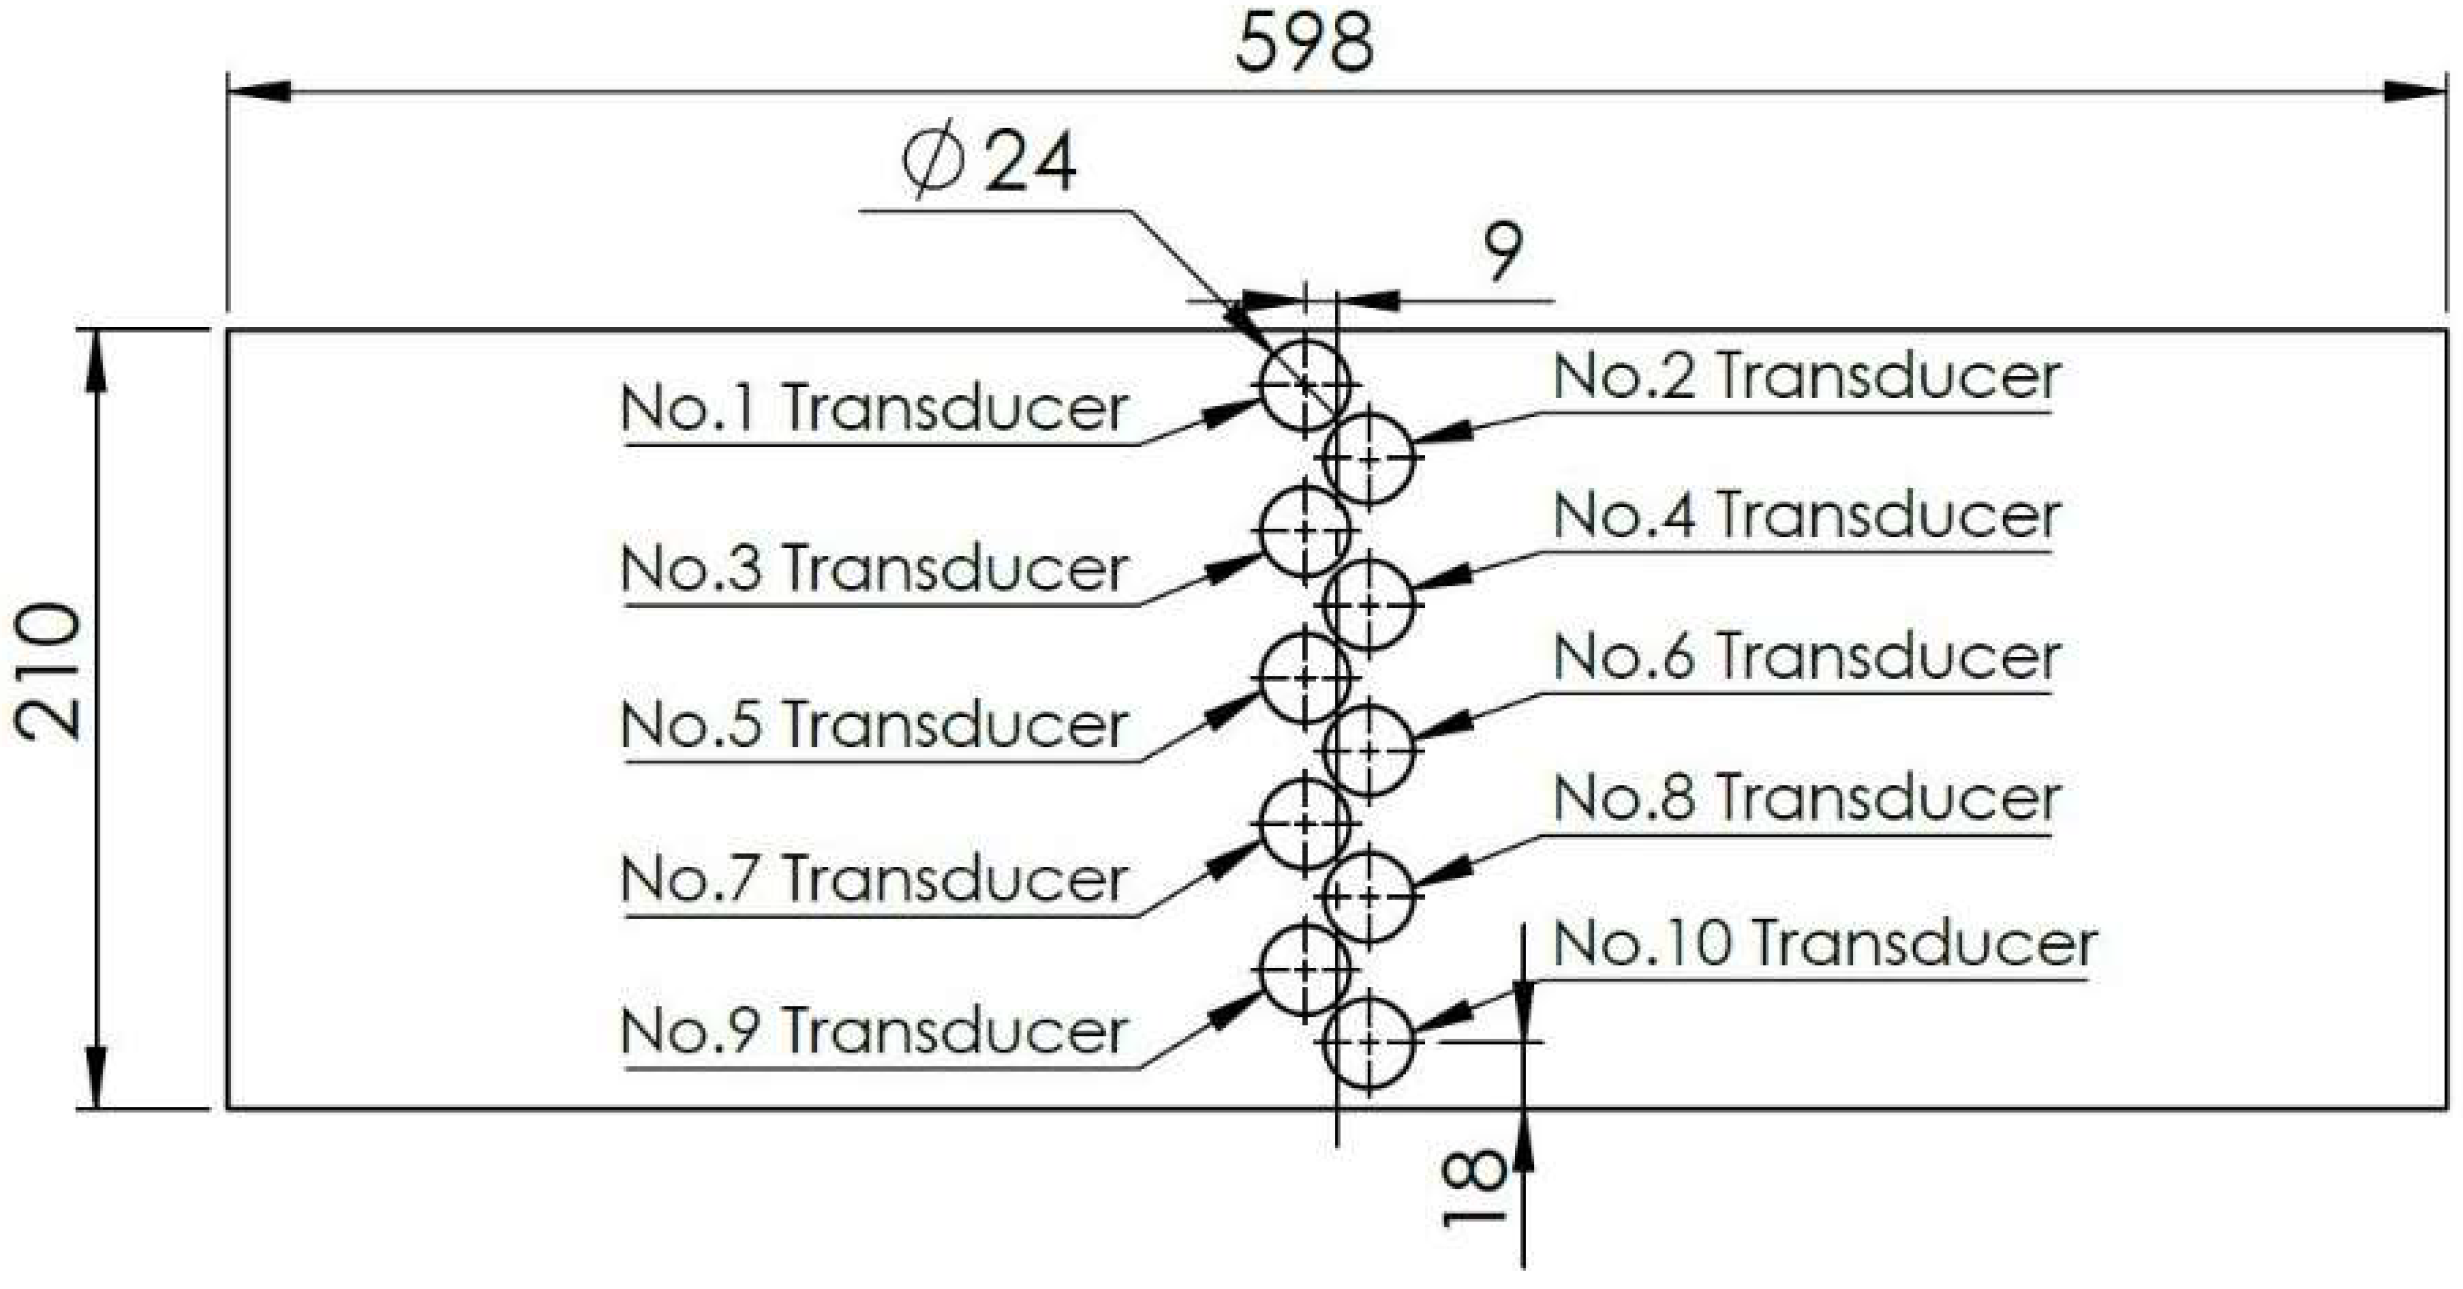
To measure the wave pressure enacted by the incident waves, 10 Trafag ATM.ECON-type transducers with a measuring range of 0–50 kPa were mounted on the seawall. These transducers were installed with a minimum offset of 9.0 mm from the center of the structure (see Figure 2), in order to obtain high resolution pressure measurements along the seawall. The horizontal force was determined by integrating the wave pressure recorded by each transducer and frontal area of these transducers (see Equation (1)). The overturning moment applied on the structure induced by the wave impact pressures was calculated as the integral of horizontal force recorded by each transducer and their torque arm (see Equation (2)).
where, n is the total number of transducers applied, is the pressure results from the No. ith transducer, and is the corresponding torque arm of No. ith transducer. For reference case, is the absolute height from the center of No. ith transducer to the toe of seawall. is the length on the structure covered by each transducer.
In general, = 19.7 mm, and it changes when transducers are mounted on the recurve wall. Both overall force (F) and overturning moment (M) are analyzed at the significant level of 1/250, in order to mitigate the uncertainties for an extreme event. Additionally, pressure transducers were also installed at the bottom side of the tested model recurve walls to measure the wave pressure applied on the recurve. The sampling frequency for each transducer was set at 1.28 kHz to ensure high accuracy during measurements.
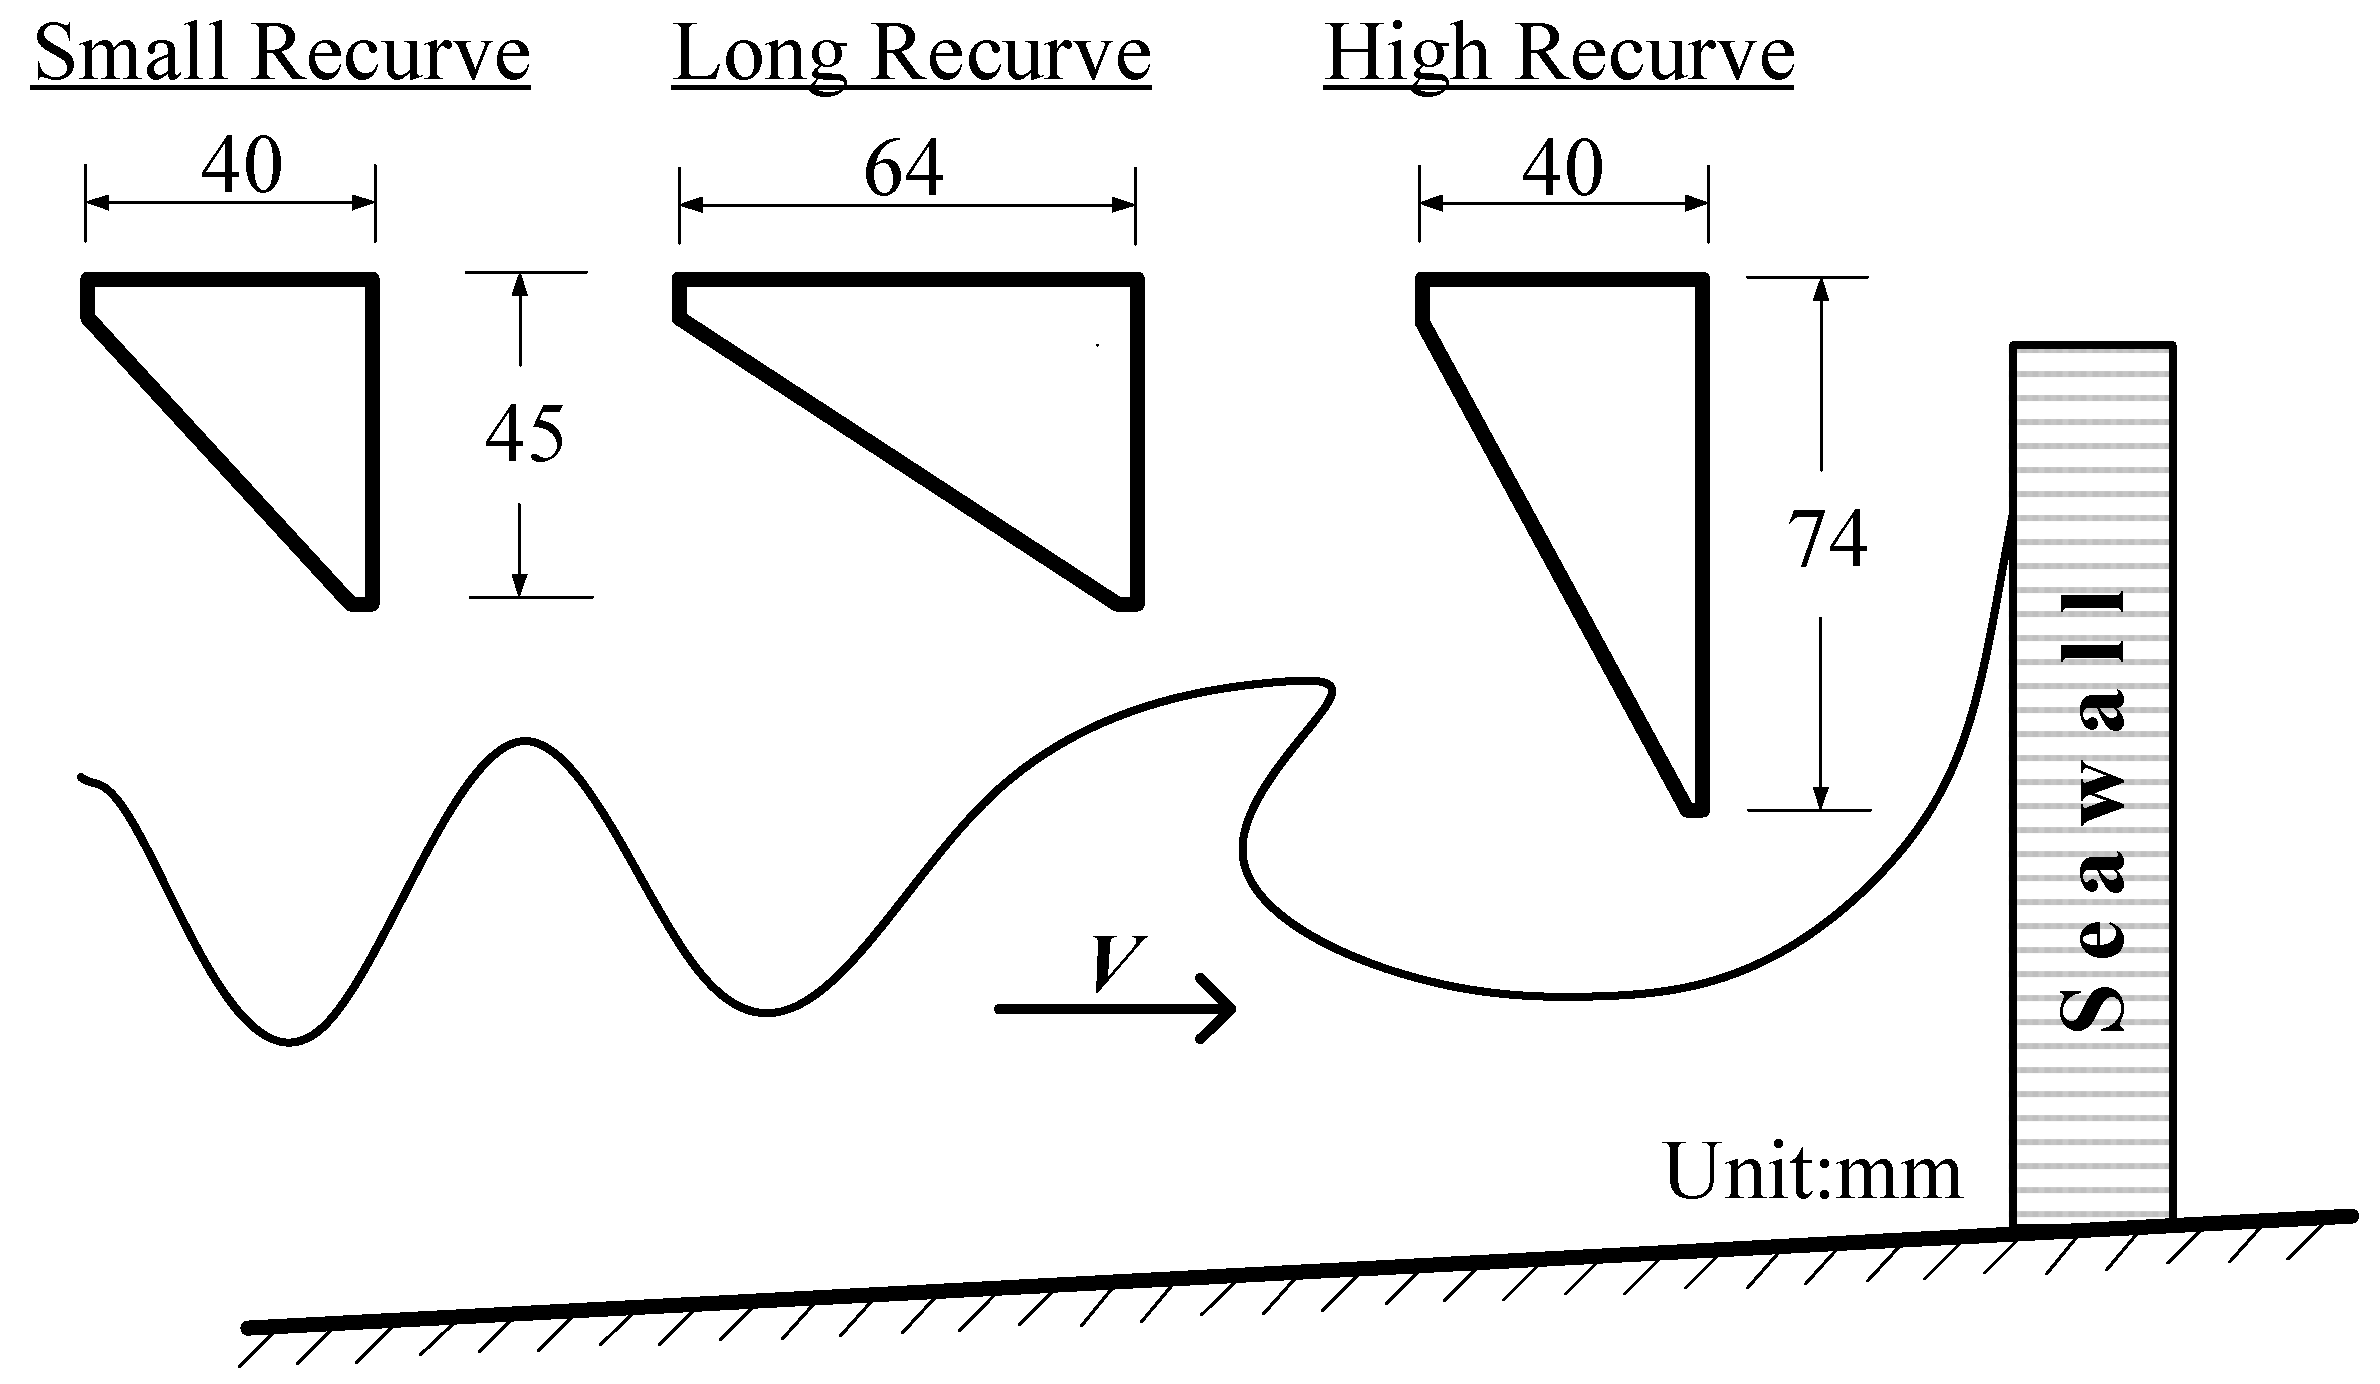
Three different configurations of recurve retrofits with varying overhang length and recurve height were tested in this study (Figure 3). Recurve parapets were designed to include small recurve [SR], long recurve [LR], and high recurve [HR] with a recurve angle at approximately 45, 60, and 30-degrees, respectively (Figure 3). For each configuration, recurve retrofit was installed on the crest of the plain vertical seawall (i.e., reference case). Wave impact forces and the overturning moment induced by the incident wave attack on the seawall were measured with the transducers positioned at fixed locations along the vertical length of the structure.
3. Results and Discussion
3.1. Pressure Distribution up the Wall
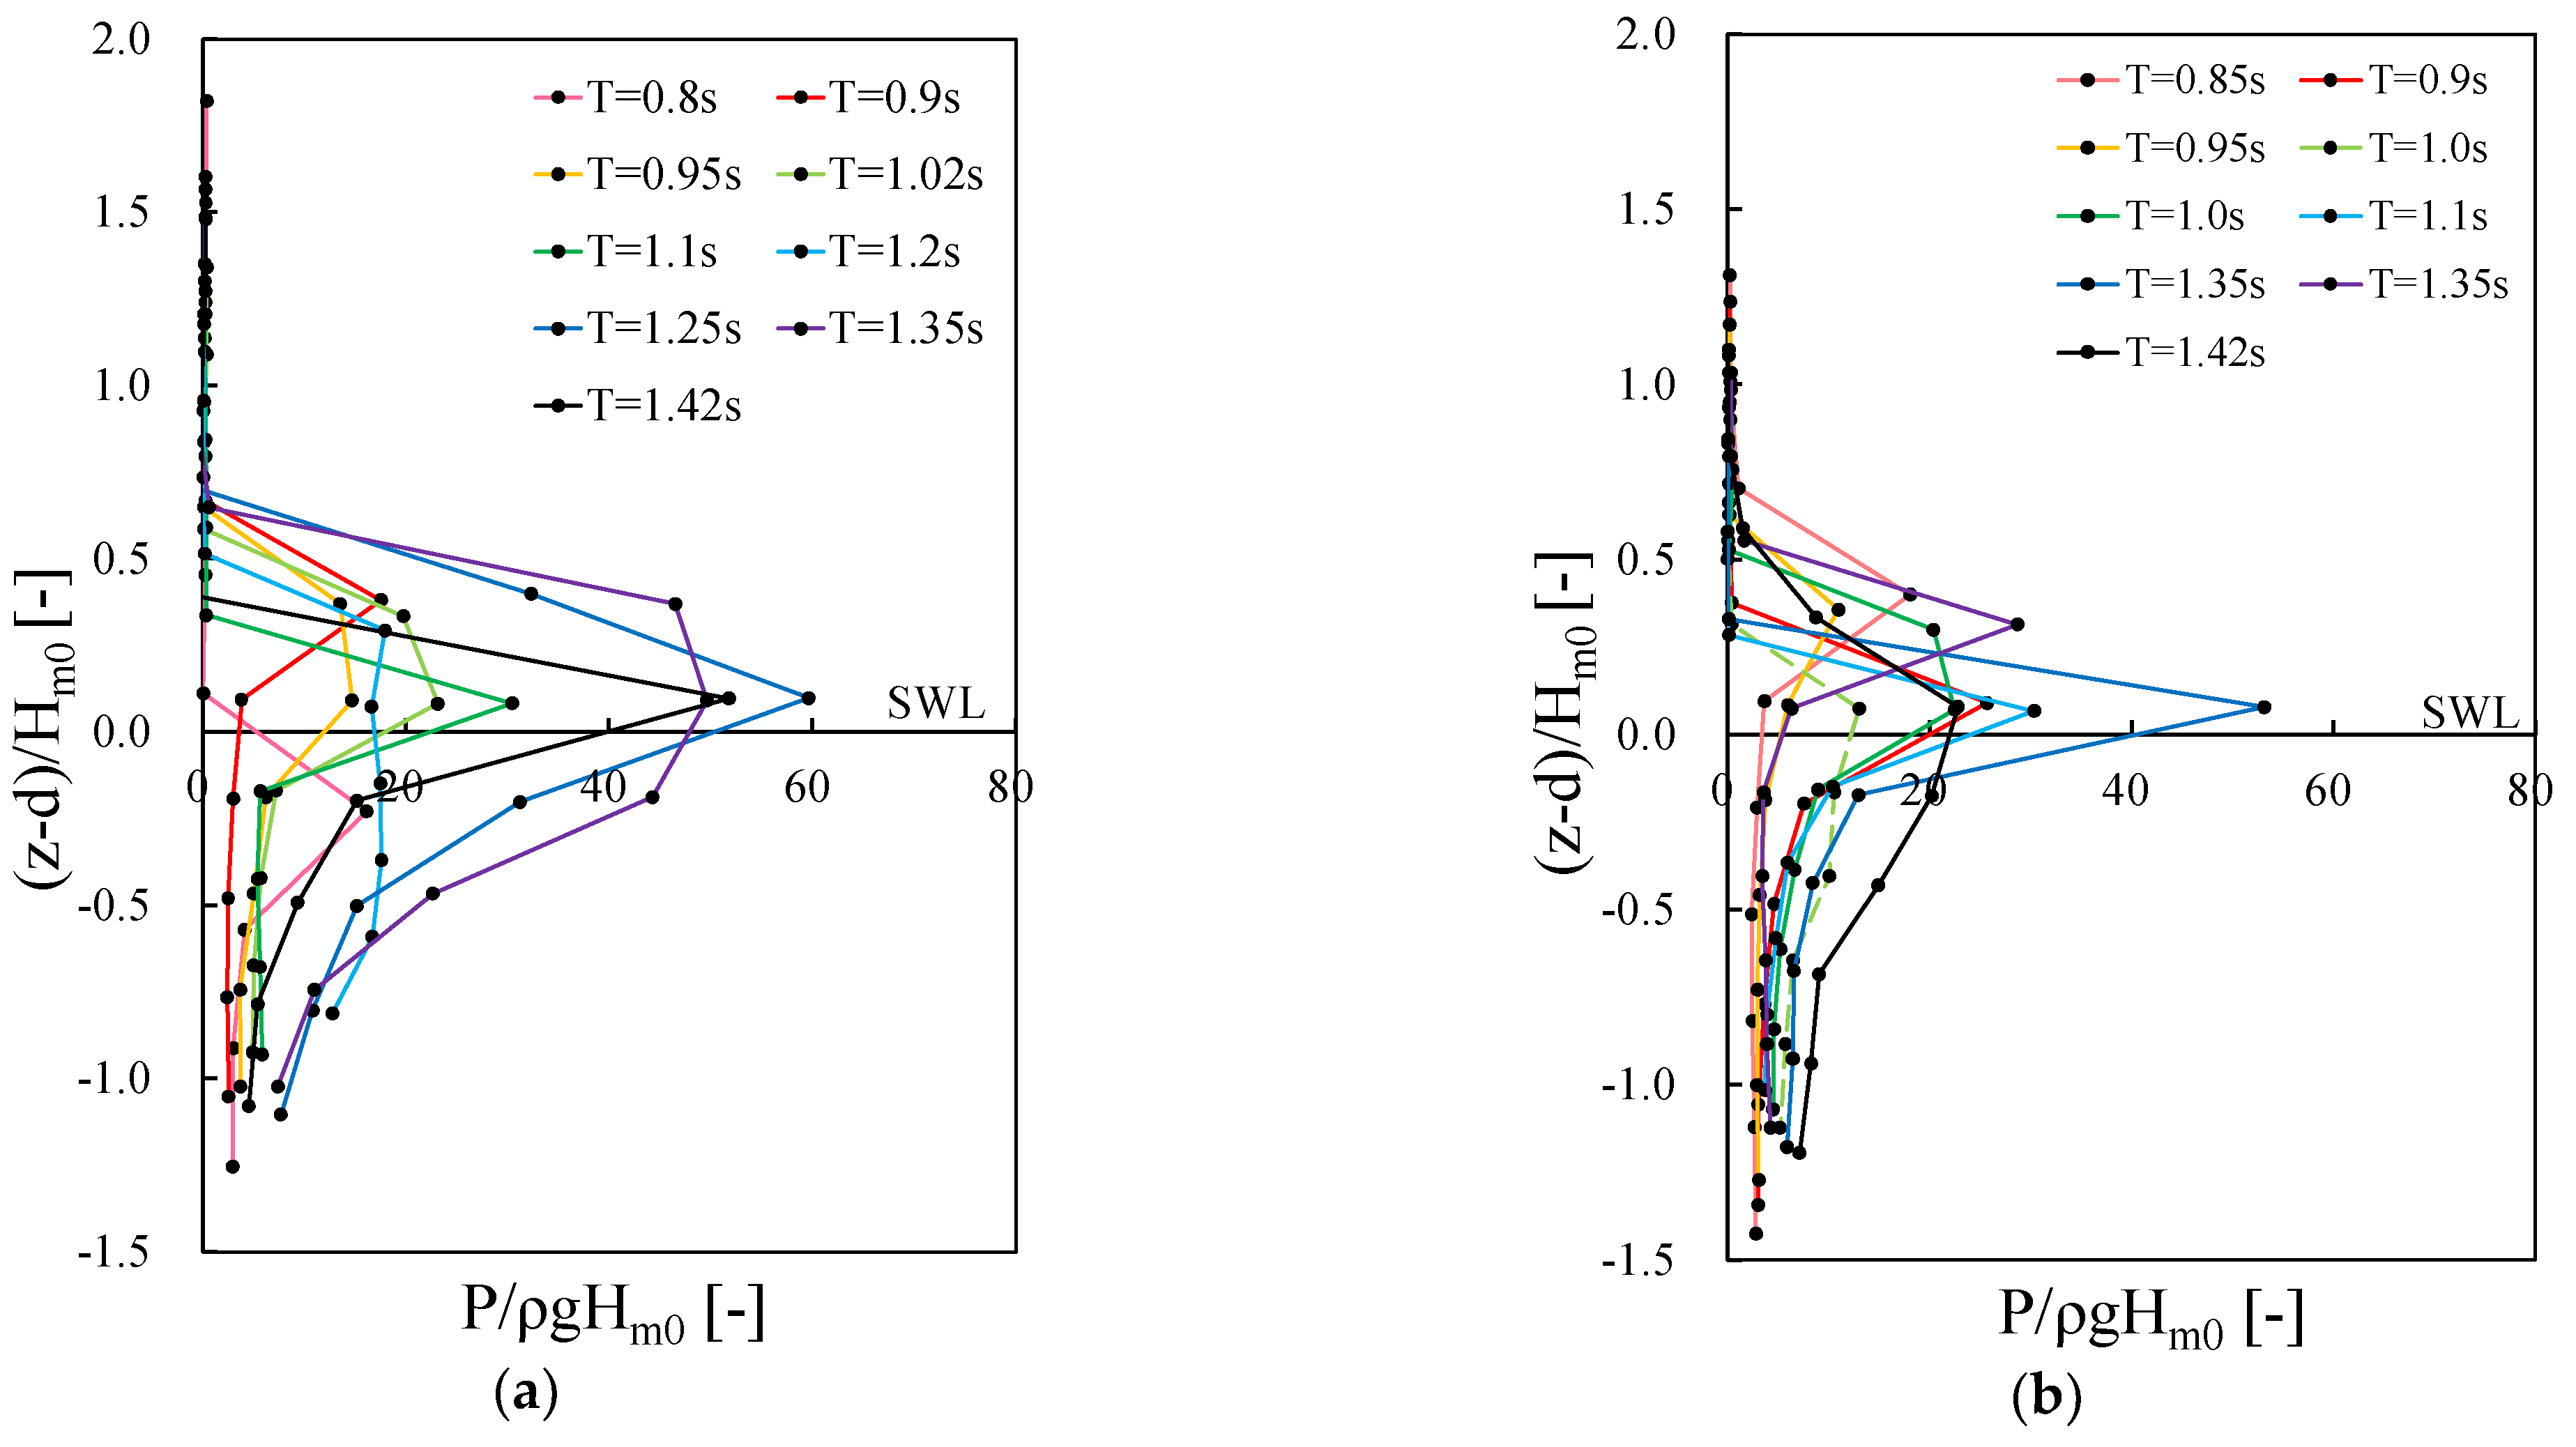
Distribution of wave impact pressure on the seawall is considered as a key factor in the determining of the structural stability of the seawall structure; the location of the maximum wave load plays a particularly important role in the stability assessment of retrofitted coastal structures. In Figure 4, the observed spatial distributions of wave impact pressures on the plain vertical seawall are presented for the two tested toe water depths of hs = 0.09 m and 0.11 m. The X-axis in Figure 4 represents the relative location of the pressure transducers, whereas Y-axis represents non-dimensional wave impact pressure at the seawall. Data presented in Figure 4 show that the peak of the wave impact pressure occurs approximately at the still water level (SWL), confirming the findings of previous research [27,41,42] despite the different structural and test configurations. However, for a few cases, the peak pressure was observed slightly above the SWL which may be attributed to weaker wave breaking and air entrapment above the SWL when waves reach the seawall [42]. Additionally, the distribution of the wave impact pressure above the SWL can be the cause of smaller pressure measured above the SWL for the tested conditions in this study.
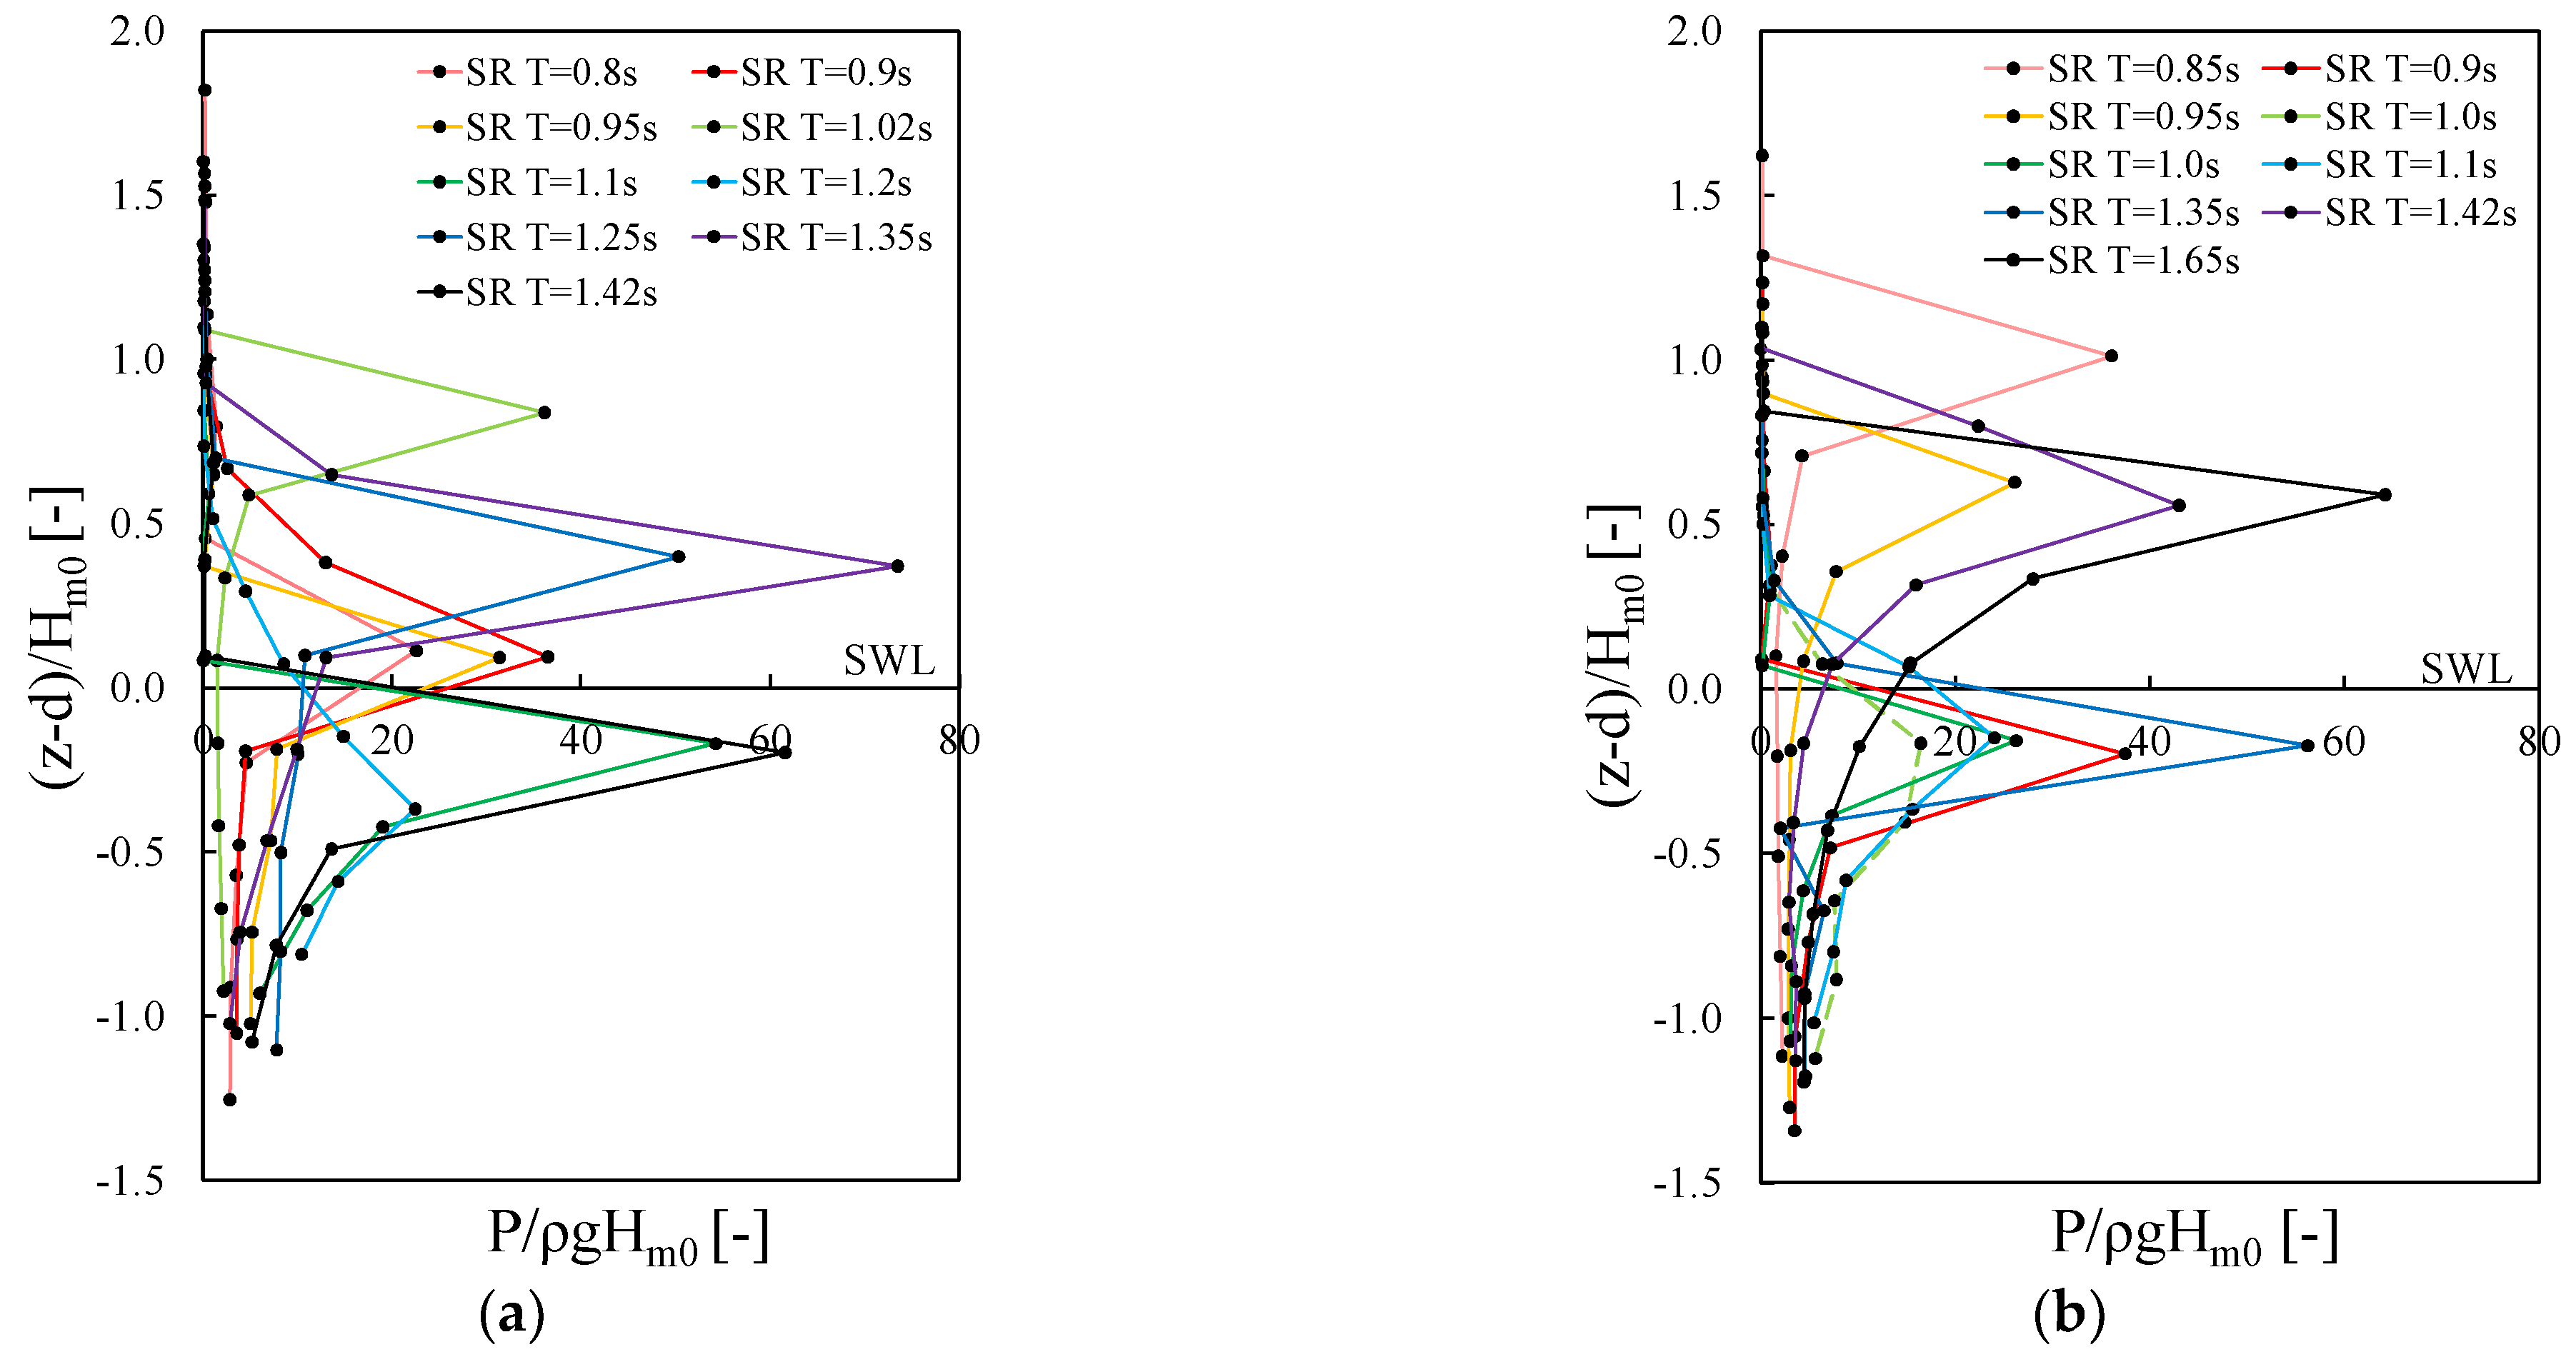
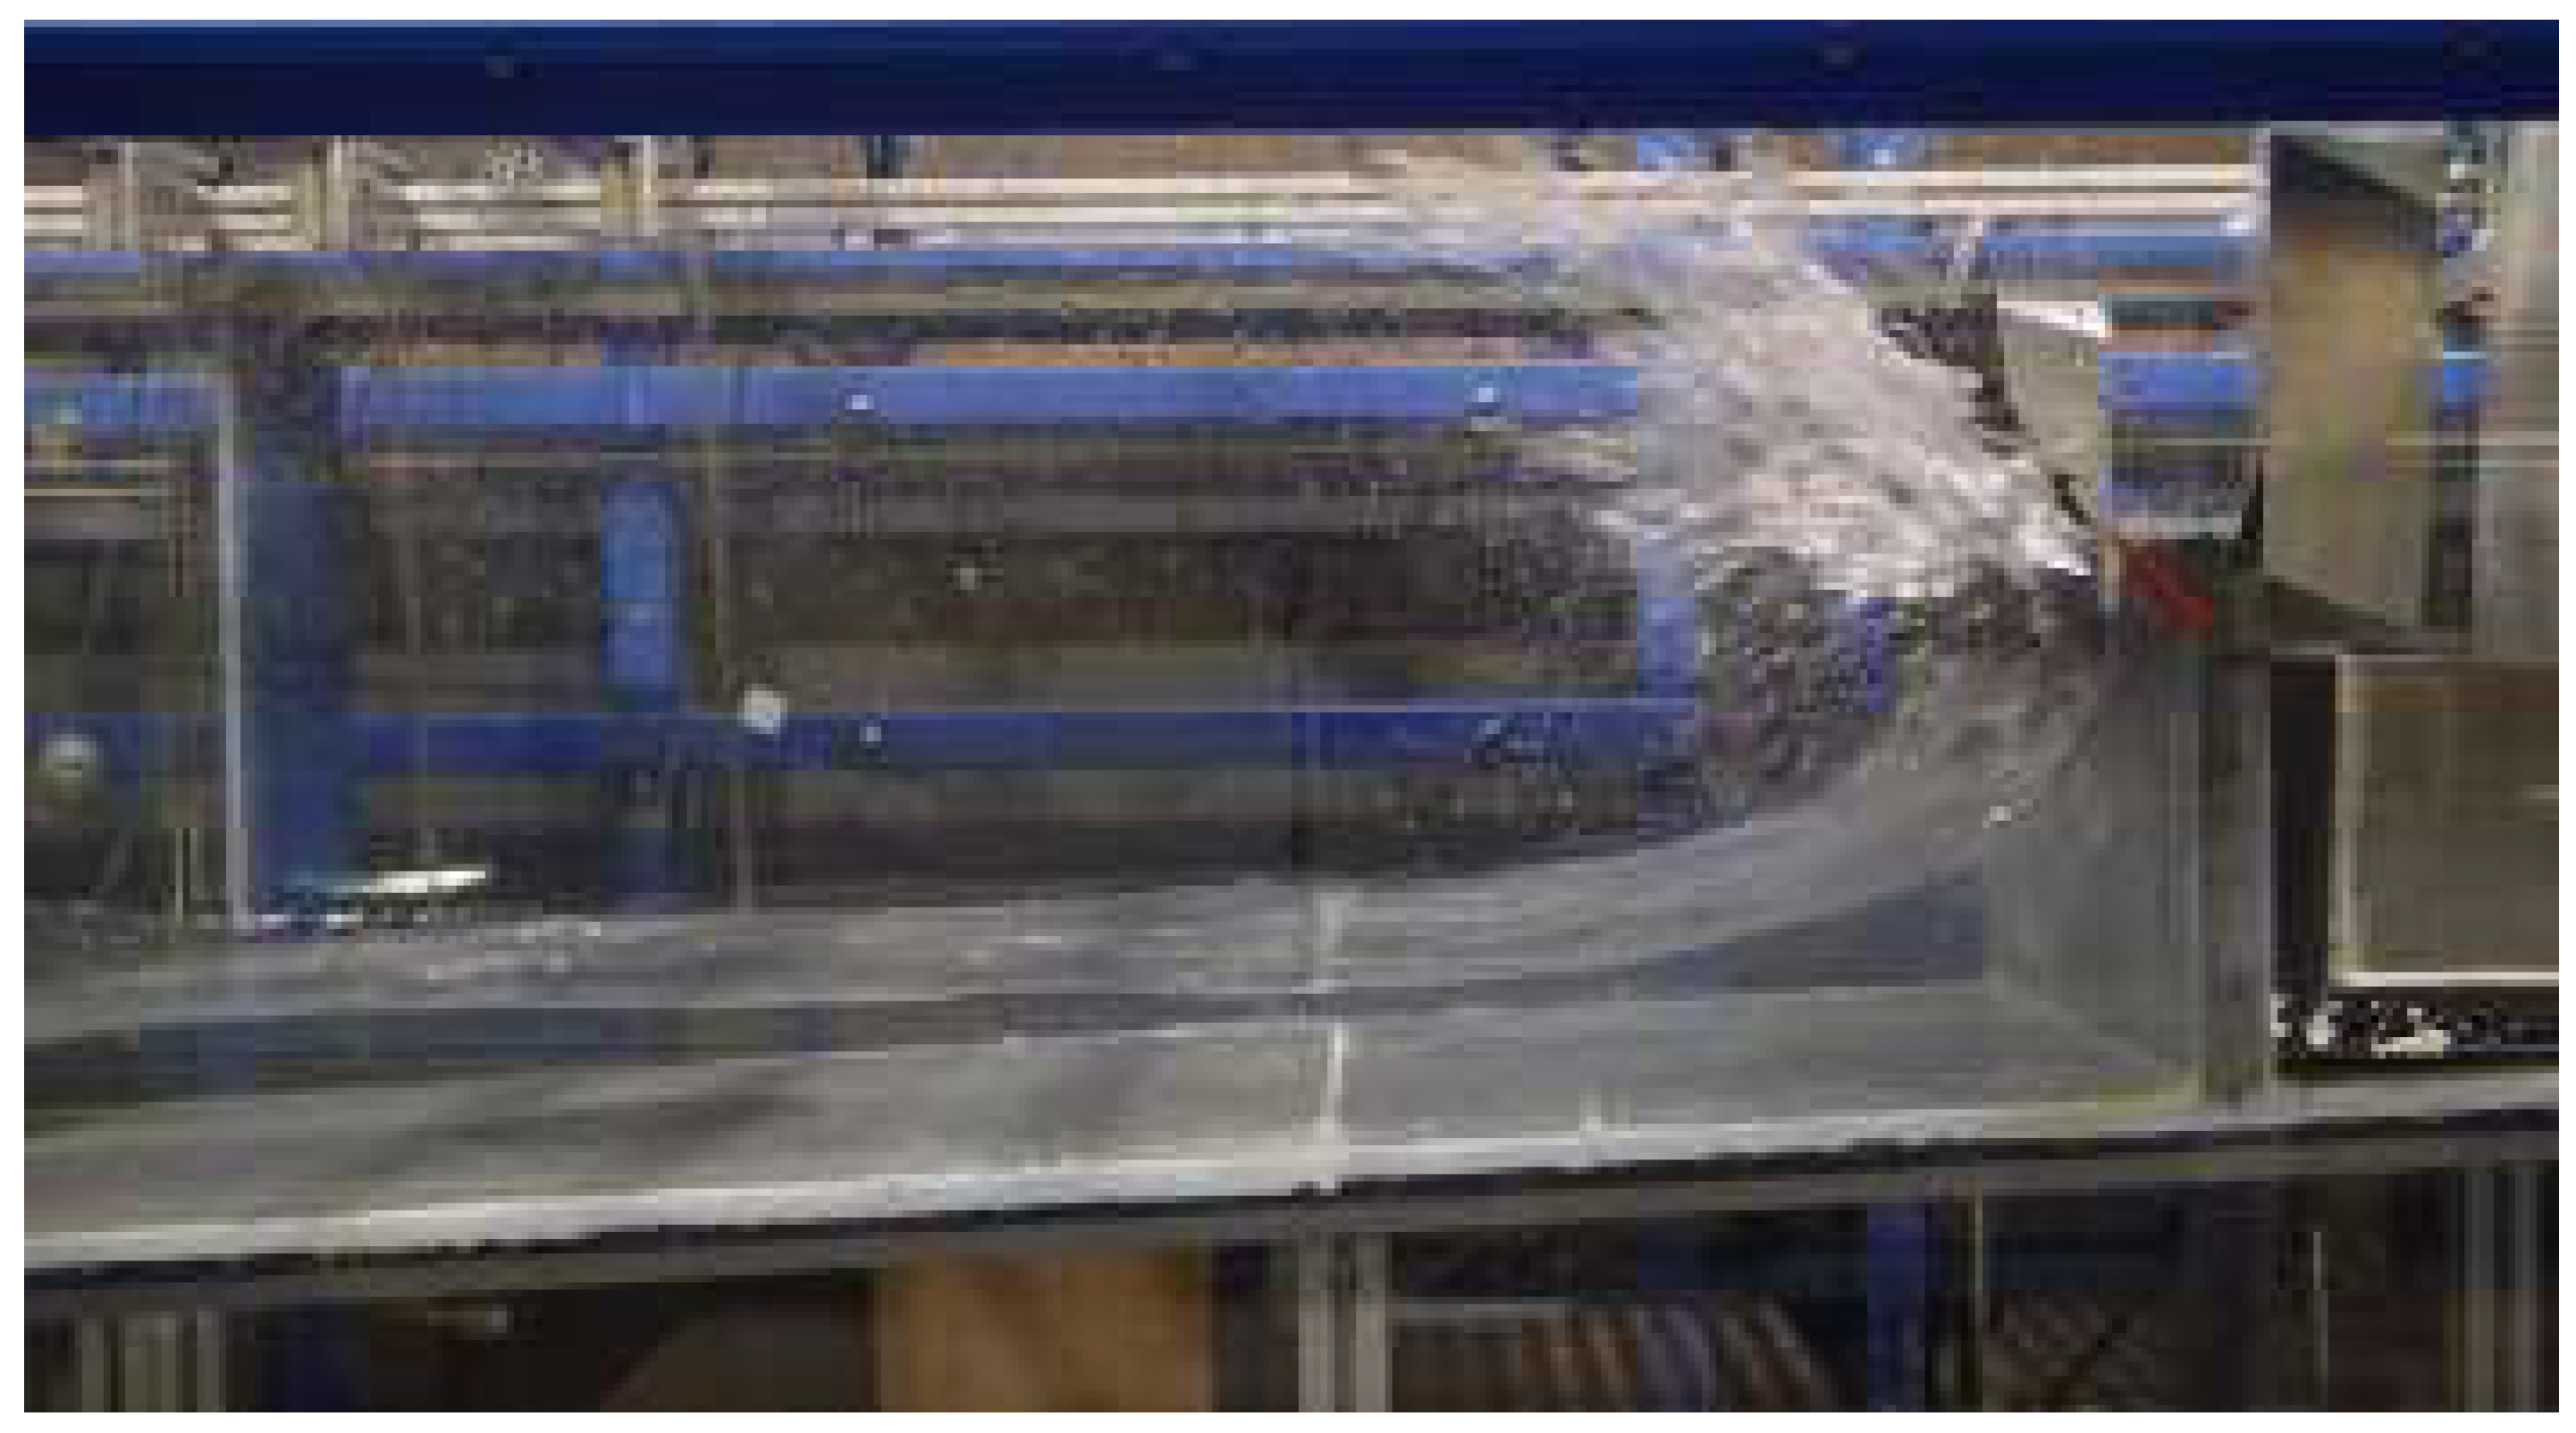
Figure 5 represents the pressure profile of the pmax of the whole structure corresponding to the SR configuration benchmarked with the measurements from the reference case (i.e., plain vertical seawall). The analysis of data presented in Figure 5 demonstrates that the elevation of pmax on the recurve wall shifts upwards when compared with the pressure profile for the plain vertical seawall (Figure 4). When the water depth at the toe of the structure increases from 0.09 m to 0.11 m, it also can be observed that the elevation of pmax moves upwards. As the recurve wall approaches the SWL, the elevation of pmax rises gradually. It can be inferred that incident waves are bounced back or trapped under the recurve wall, as is visually evident in Figure 6, while they are thrown upwards for the reference cases. An additional volume of water gathers around the interception between the recurve wall and the vertical seawall, resulting in a rise in local maximum pressure elevations and the magnitude of wave pressure enacted on the structure. Similar findings were also reported by Kisacik et al. [30].
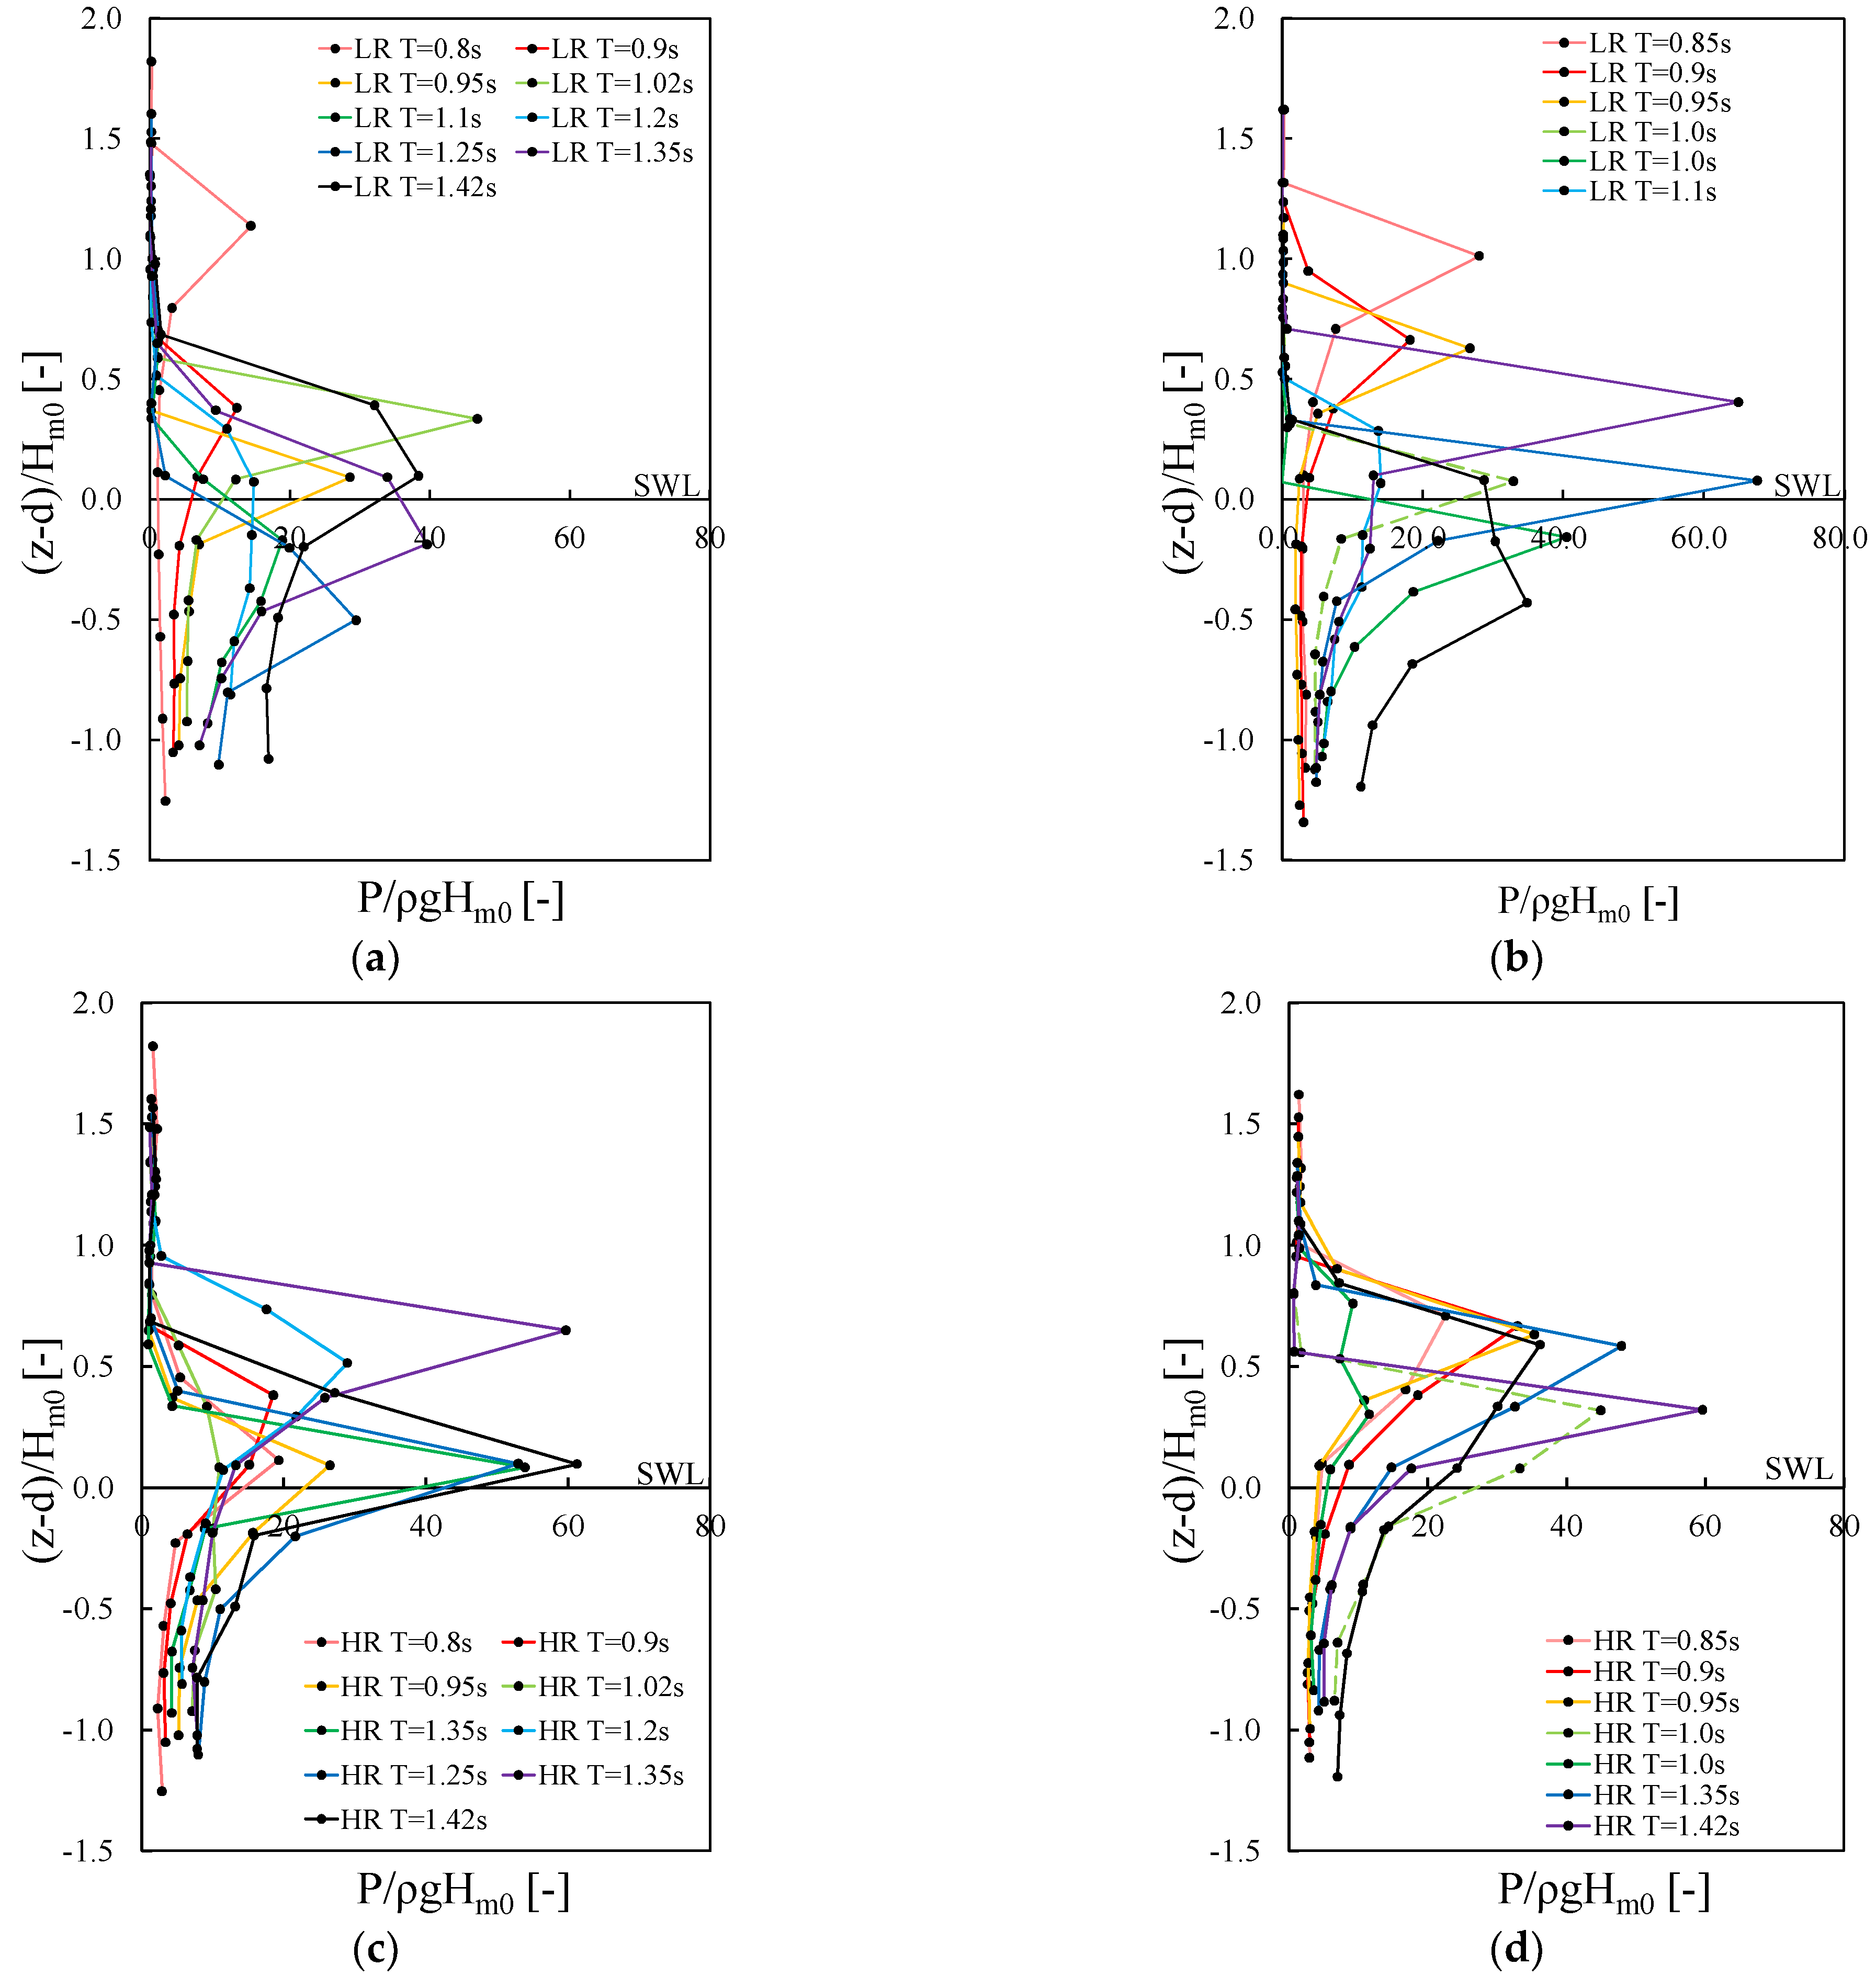
Figure 7 presents the distribution of wave impact pressure for the experiments with LR and HR retrofitting configurations. Overall, it can be observed from Figure 7 that the pmax occur above the SWL for both the LR and HR configurations. It can be also noticed that with the increase of water depth, the elevation of pmax also increases. For the tested LR configuration, the increase in the overhang length causes a decrease in the elevation of pmax, while increases in the height of the recurve wall for the HR configuration results in an increase in the elevation of pmax. It can be inferred that incident waves, especially those with large wavelengths, are bounced downward by the overhang. Hence, the wave crest for the case of LR reaches a relatively lower point compared to the measurement corresponding to the SR configuration (Figure 5). These findings are consistent with Kisacik et al. [29]. The toe of HR is likely to be submerged, causing the crests of more breaking waves o hit the underside of HR with increased jet velocity. Therefore, the maximum wave impact pressure, pmax happens above the SWL and shifts upwards, becoming closer to the toe of HR.
3.2. Impact and Quasi-Static Force
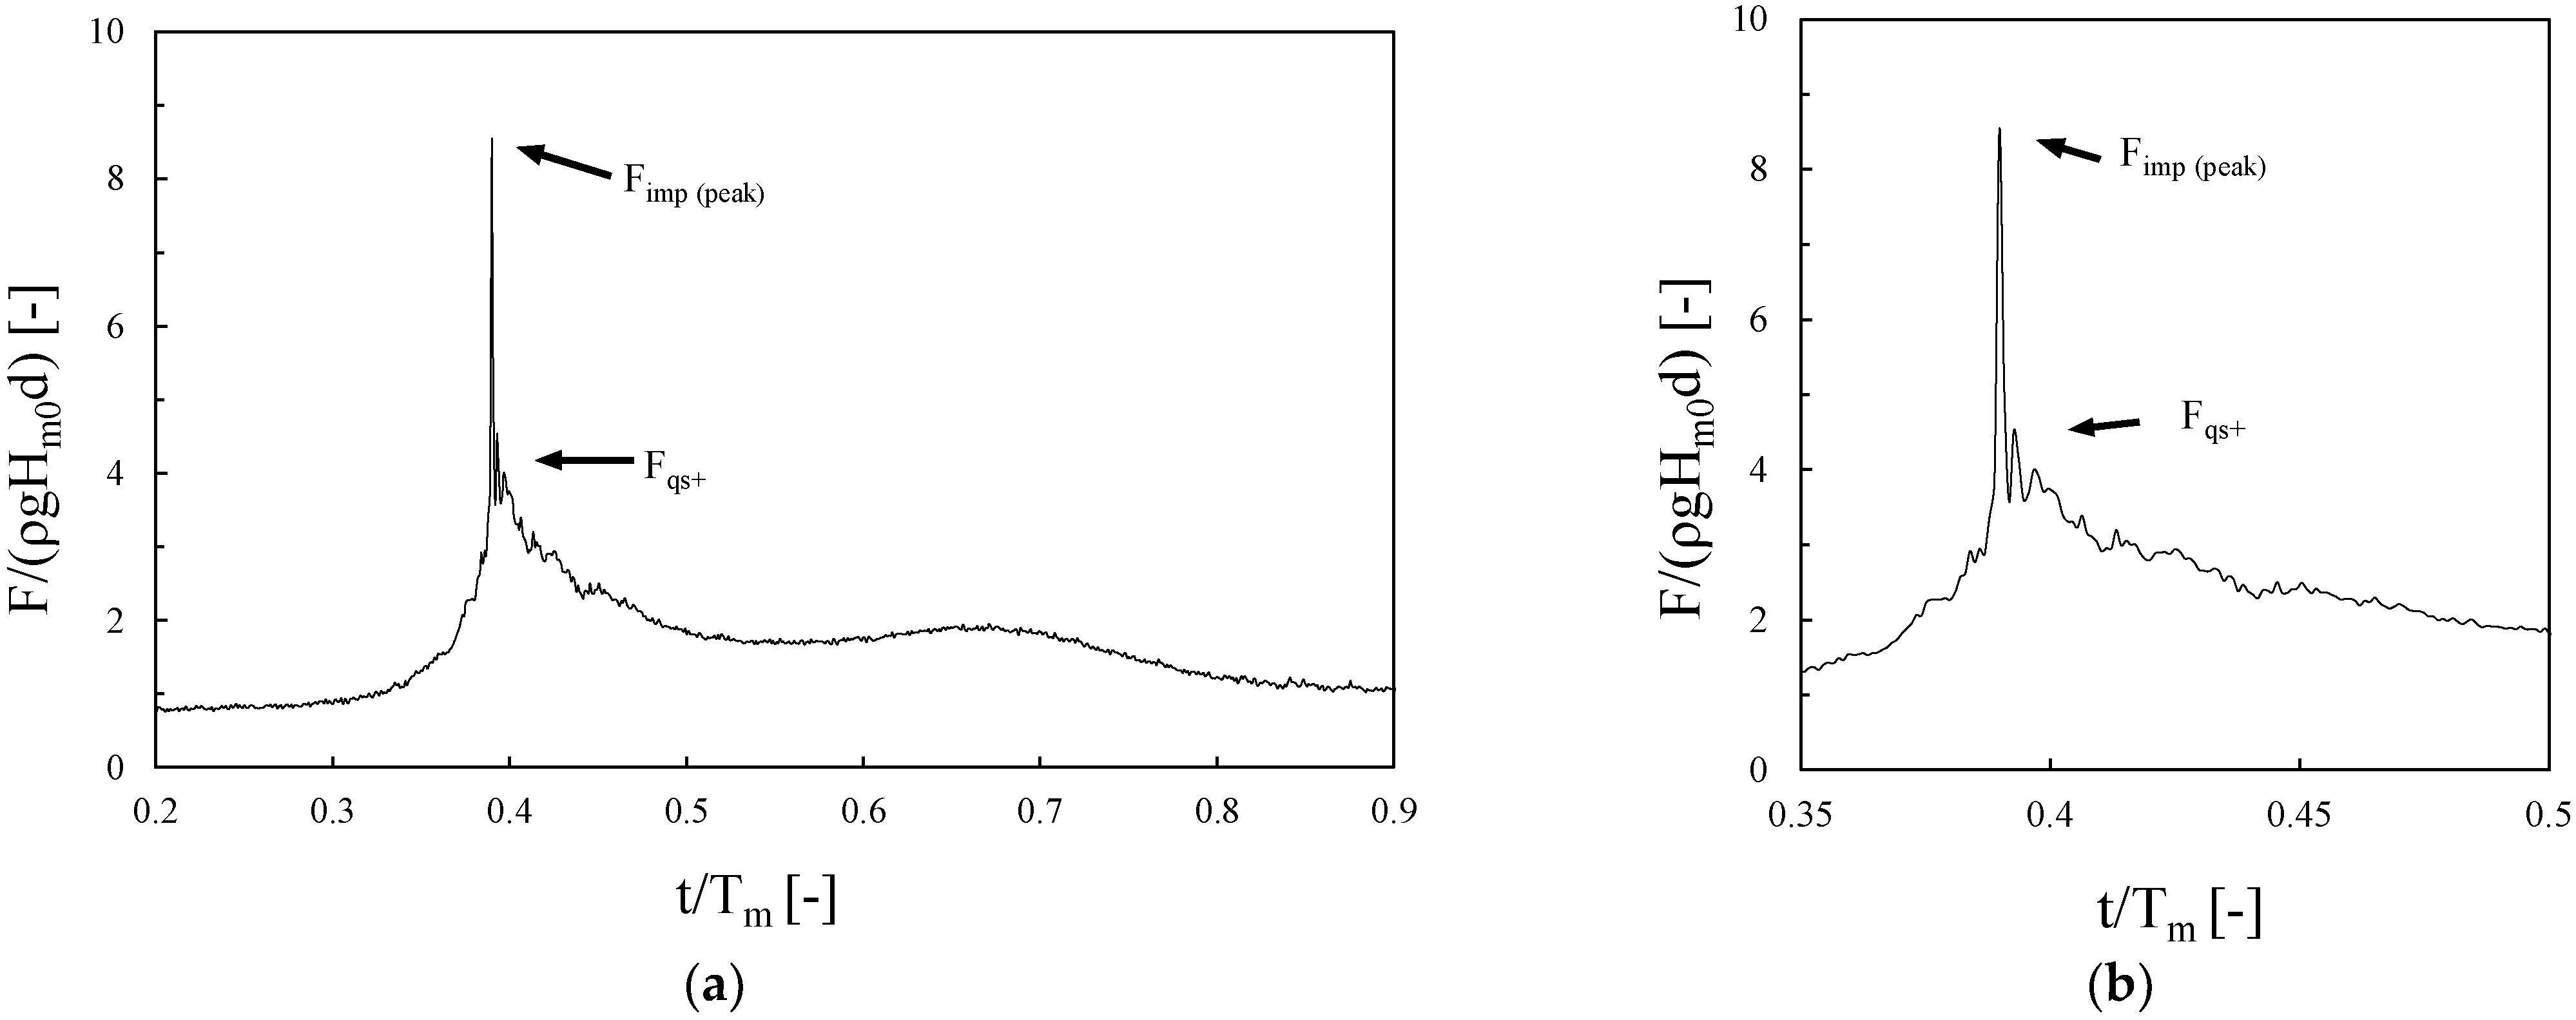
For the conditions tested within this study, it was observed that the impact and quasi-static force occur in one wave event (e.g., see Figure 8), which can be distinguished by the relative duration of the loading. It was particularly noted that the impact loads act on the structure with a large force value but in a short duration, whereas the quasi-static loads act on the structure with much smaller values but more than doubled in the duration of impact loading. Under impulsive wave conditions, a ‘two-peak’ phenomenon was also reported that can be inferred with the generation of wave force, similar to those observed by Peregrine [43]. When a wave arrives and breaks at the seawall, the crest of the wave collides with the structure and runs up with small air pockets and causes the impact loading as shown by the first peak in Figure 8a. Afterwards, subsequent oscillations happen due to the breaking of the incident wave crest and air bubbles remain entrapped in the water, as shown in Figure 8b, while under the effects of gravity, the water is deaccelerated and falls back, causing the second peak, as shown in Figure 8b at around t/Tm = 0.7. These characteristics of impact and quasi-static loading are consistent with the literature available for wave loading at vertical walls [26,44,45].
3.3. Wave Impact Force
This paper mainly investigates the wave impact loads in the horizontal direction, including the horizontal impact force (Fh) and the overturning moment (Mh) generated by the horizontal impact force. To mitigate any potential uncertainties in the recording of the maximum pressure during the tests under impulsive wave conditions, the horizontal wave impact force data was analyzed to determine the averaged value of the maximum four events in a test sequence, recorded as Fh,imp1/250, and the corresponding overturning moment applied on the structure, recorded as Mh,imp1/250.
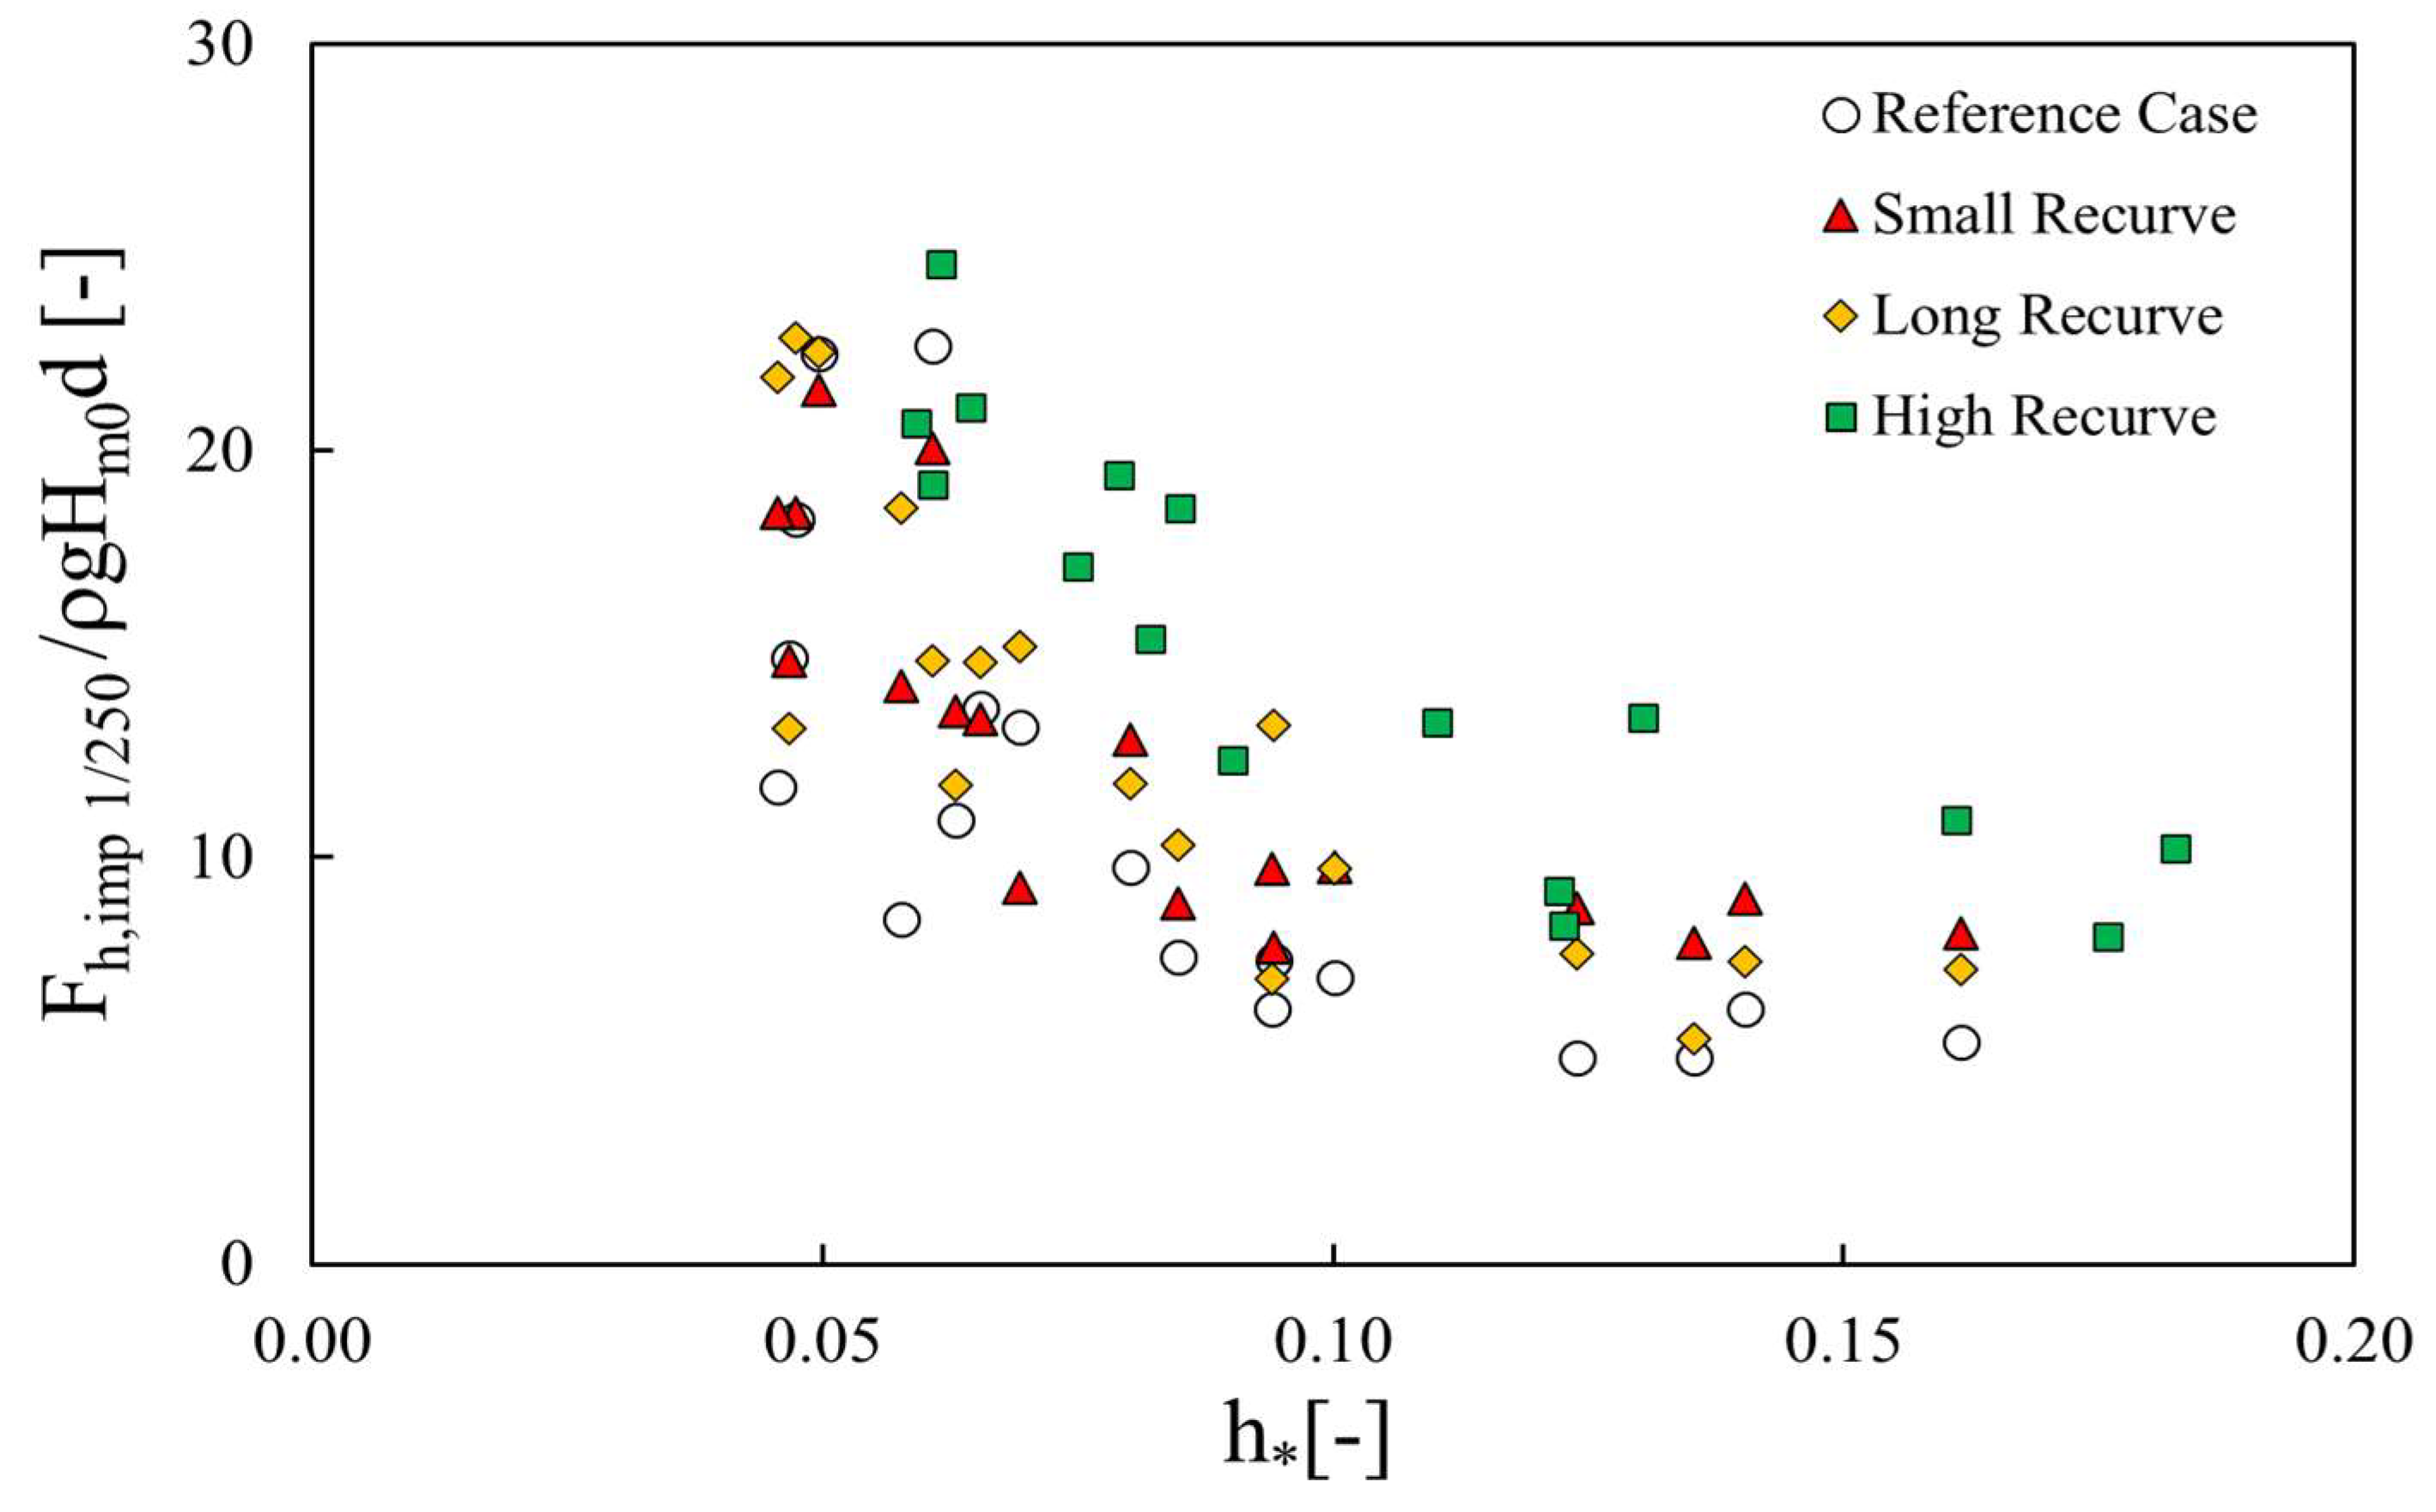
Figure 9 presents a comparison between the measured horizontal force for the reference condition and retrofitted configurations. The graph shows that the measured horizontal impact force increases as the wave becomes more impulsive in nature. When comparing the wave impact forces for the retrofitted conditions with the plain vertical seawall, it can be observed that wave impact force increases with the addition of a recurve wall on the crest of the structure (Figure 9). The magnitude of measured overall horizontal force (Fh,imp1/250) on the seawall moves up for SR configurations, with an increase of 1.3 times the average values, compared to the plain vertical seawall, similar to the findings of [18]. For the LR configuration, Fh,imp1/250 increases only under extreme impulsive wave conditions (low h*), as shown in Figure 9, whereas for the HR configuration, an increase in the measured Fh,imp1/250 can be observed for all the tested conditions presented.
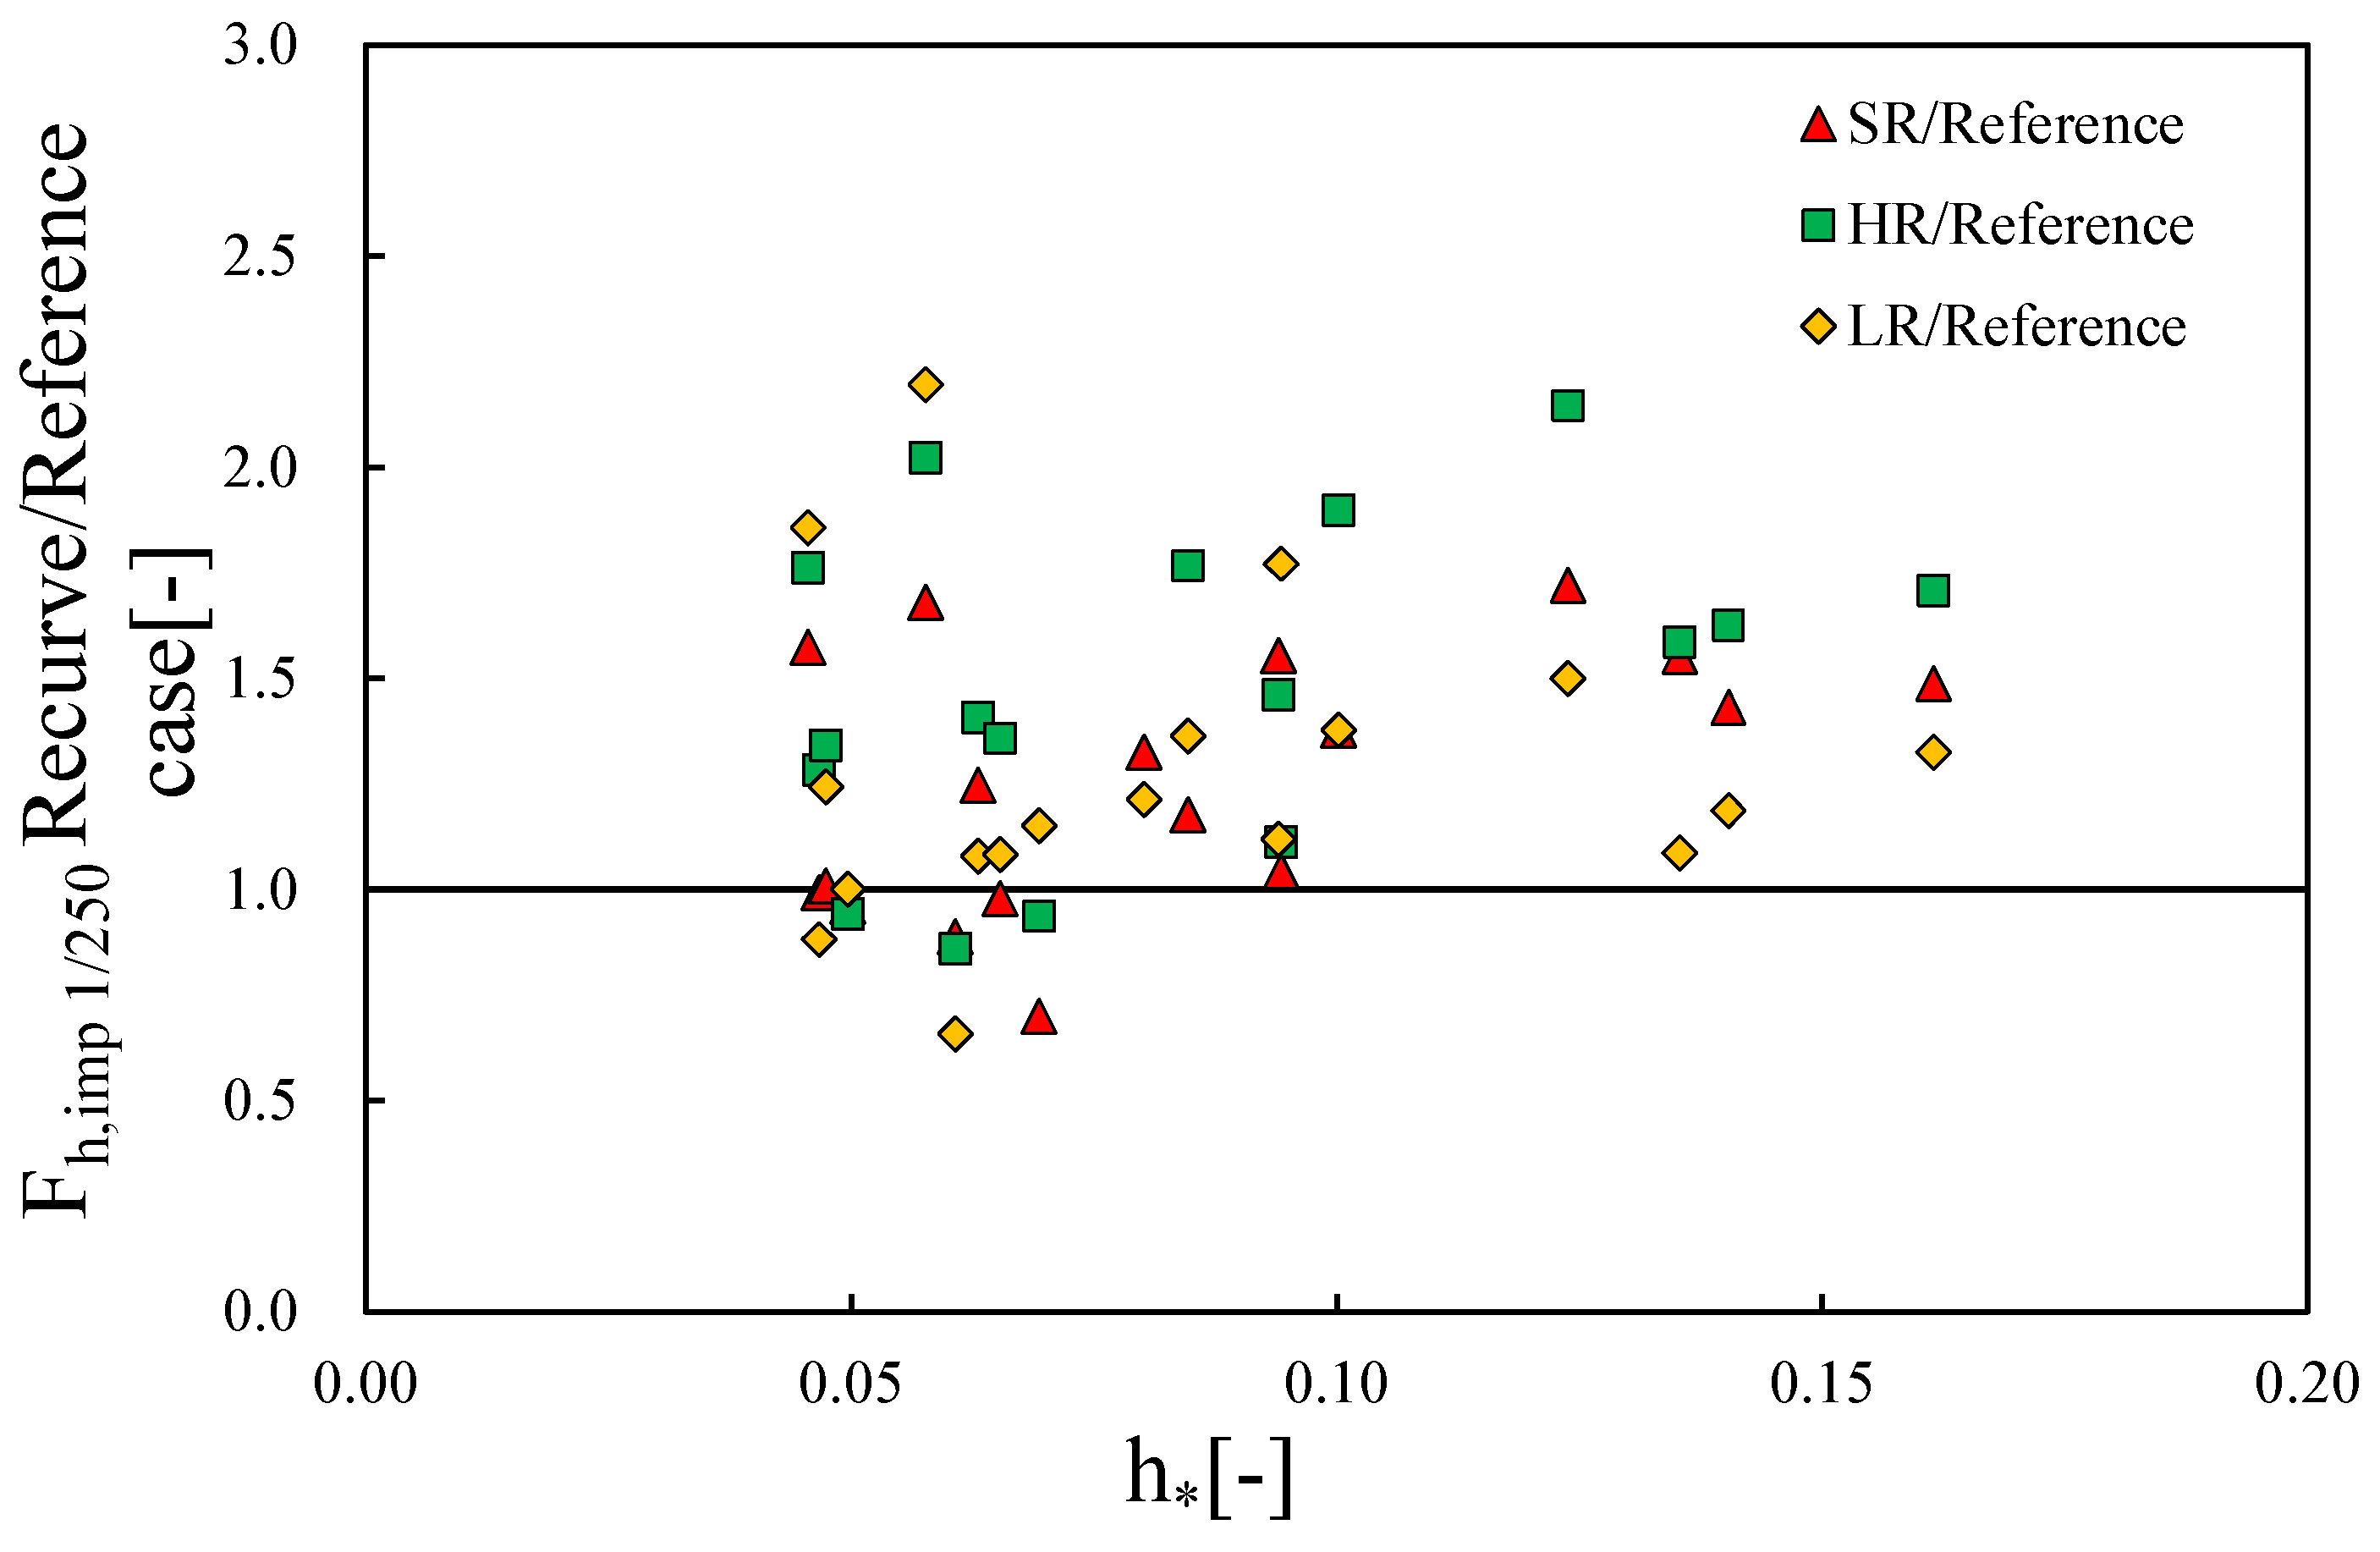
Figure 10 illustrates the increase of Fh,imp1/250 for the three tested recurve retrofits compared to the reference case. Data in Figure 10 show that when h* increases Fh,imp1/250 also increases simultaneously, except for those two cases tested with a relatively long wave period. This increment of impact force with the increase in the impulsiveness parameter confirms the findings reported by [18], demonstrating that non-impulsive wave force increases more significantly compared to the impulsive wave force when a recurve wall is retrofitted on the seawall. For the conditions tested with the SR configuration, the Fh,imp1/250 increases up to 1.7 times the measurements for the benchmark case. A similar magnitude of increase in Fh,imp1/250 can also be observed for experiments with LR and HR retrofits, with an average increase of 1.4 and 1.5 times larger than those values recorded for the plain seawall, respectively. Overall, the maximum increase of Fh,imp1/250 is reported for HR configuration, with a maximum increase of 2.3 times larger compared to the reference case.
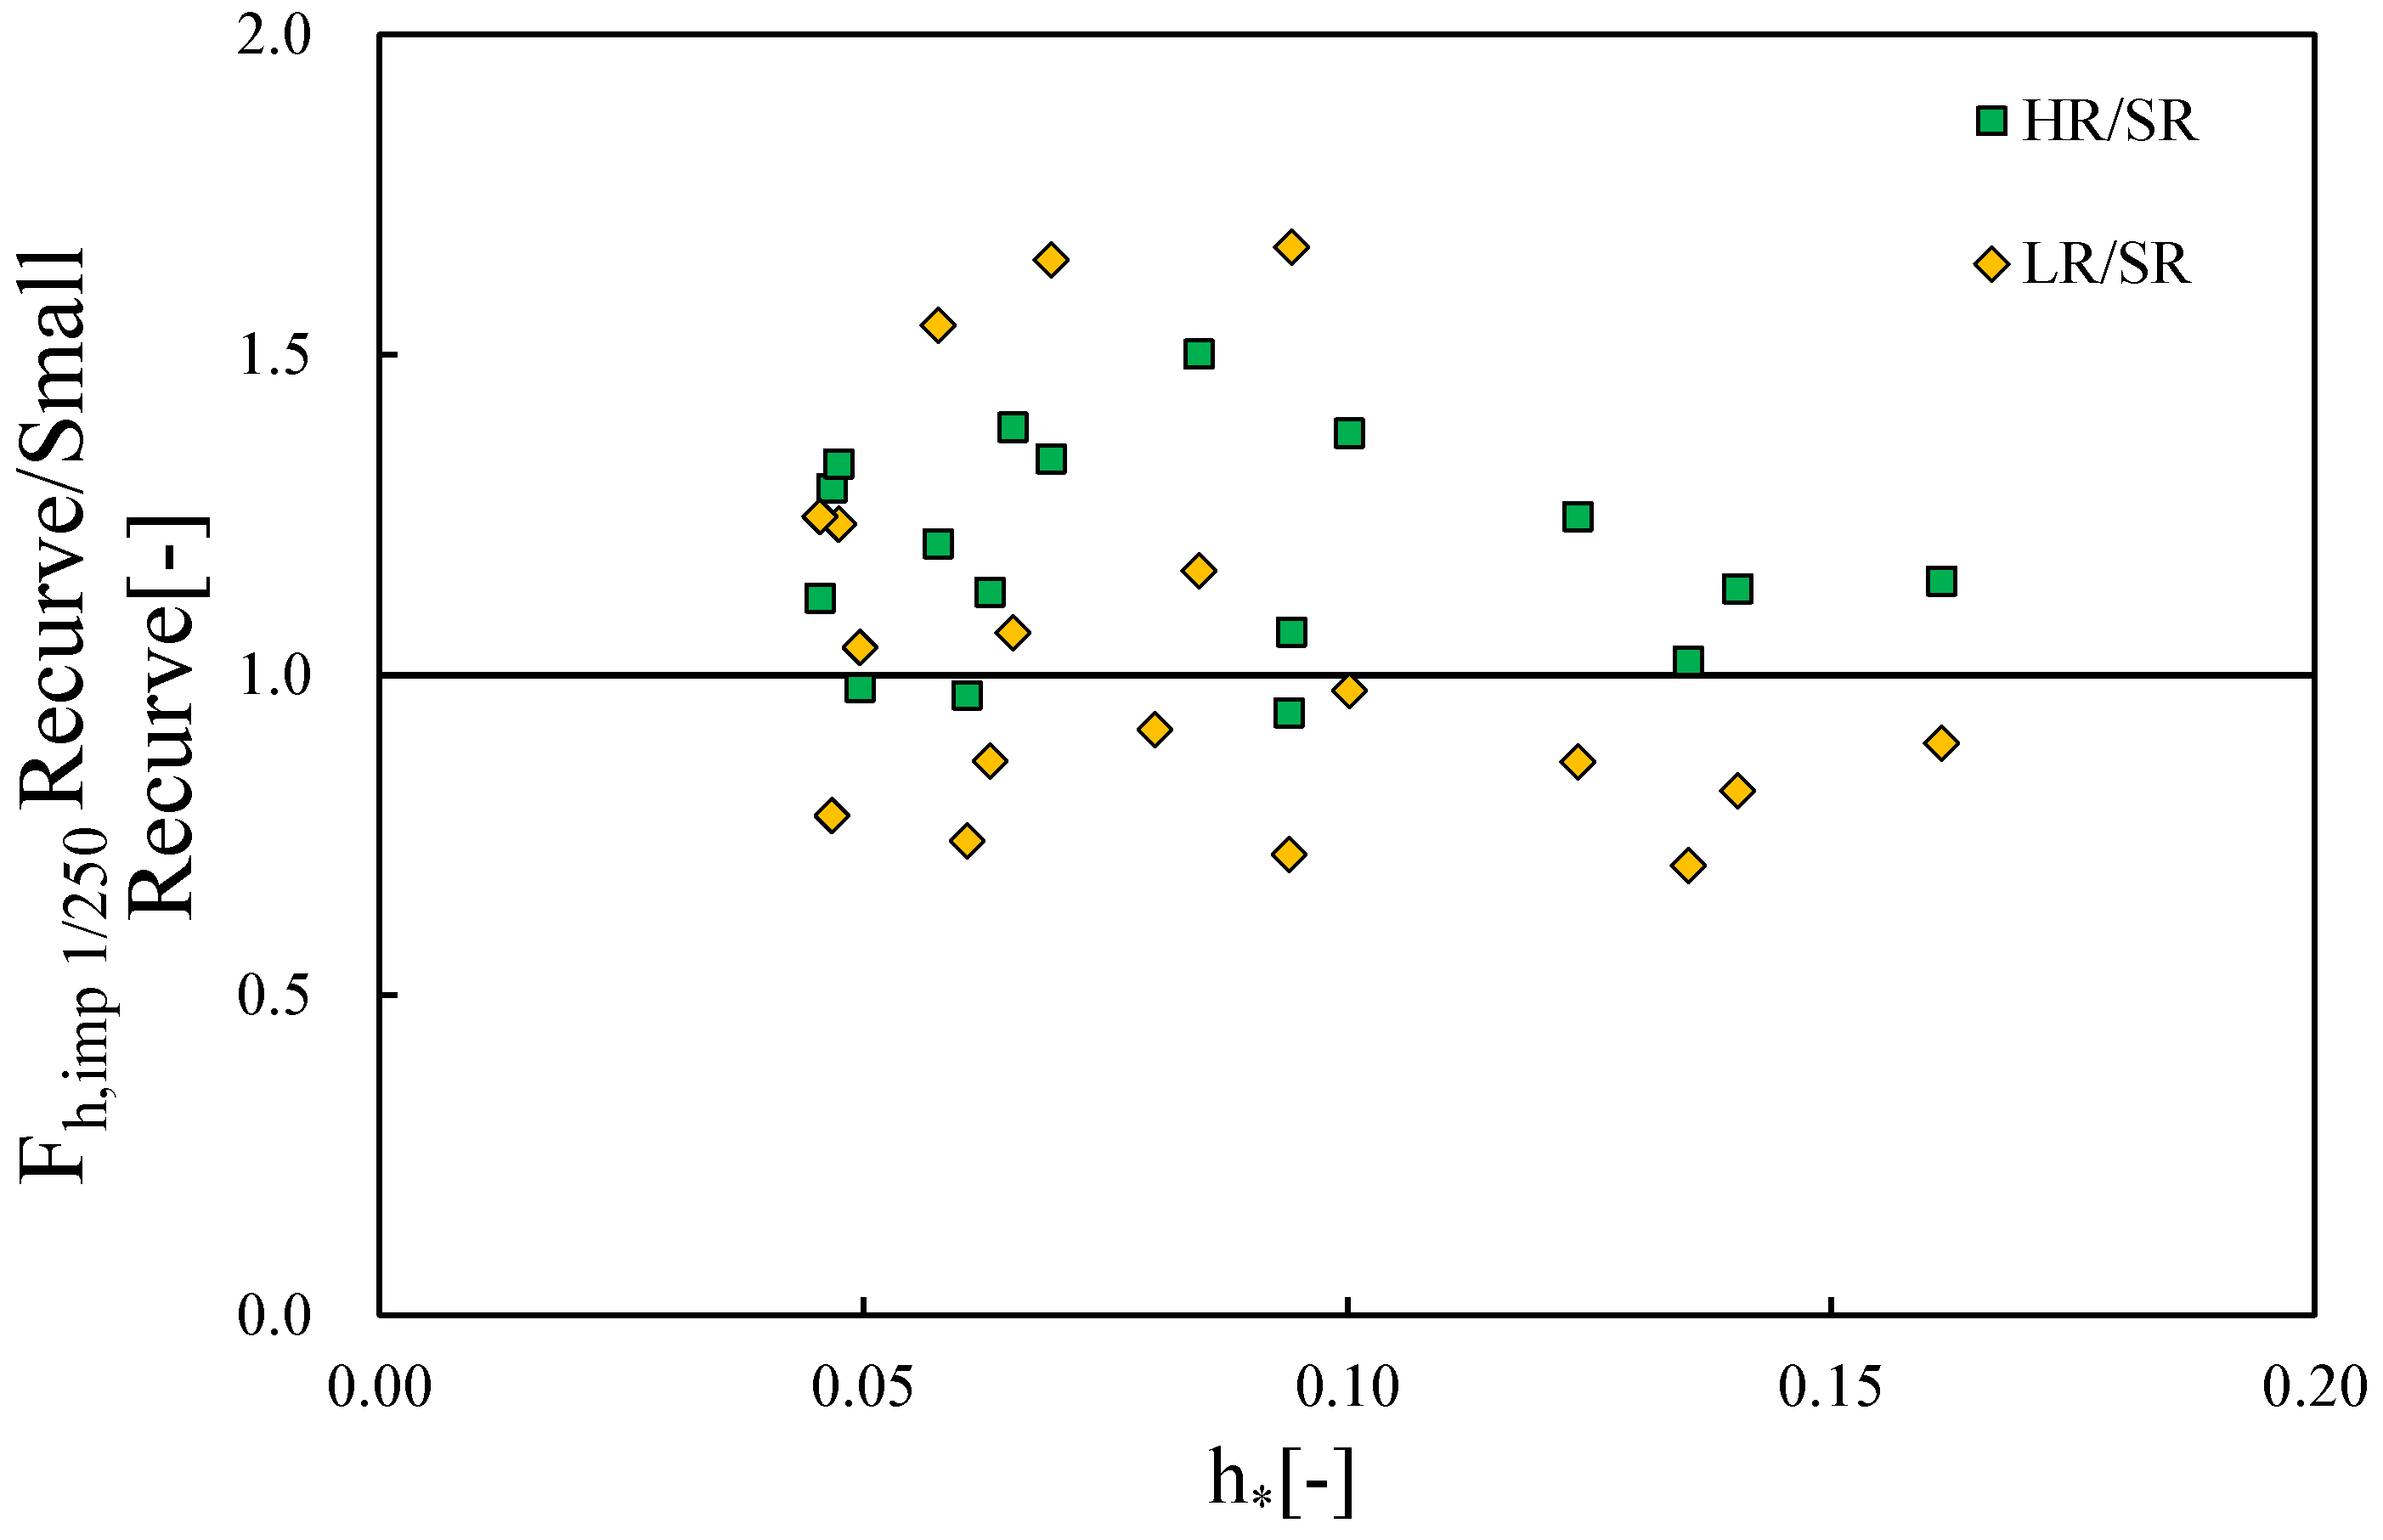
The variation in Fh,imp1/250 with respect to the geometrical properties of recurve parapets is presented in Figure 11, with an increase ratio of Fh,imp1/250 on LR and HR compared to the measurements from the SR configuration (e.g., Fh,imp1/250, LR or HR/Fh,imp1/250, SR). The data points in Figure 11 indicate that the variation of the geometrical shape of recurve wall influence Fh,imp1/250 on the seawall. For the extreme impulsive wave conditions (h* < 0.09), Fh,imp1/250 on LR configurations is found to be larger than SR, with a maximum increase ratio of 1.6, indicating the influence of recurve’s overhang length on impact loading. The recurve height is also found to increase the Fh,imp1/250; as such the measured Fh,imp1/250 for the HR configurations show an average increase of 1.25 times compared to the case of SR. Based on the measurements, it can be concluded that the influence of increasing recurve height should be carefully considered for all the wave conditions, while the overhang length only influences the Fh,imp1/250 under extreme impulsive wave conditions (h* < 0.09).
3.4. Wave Quasi-Static Force
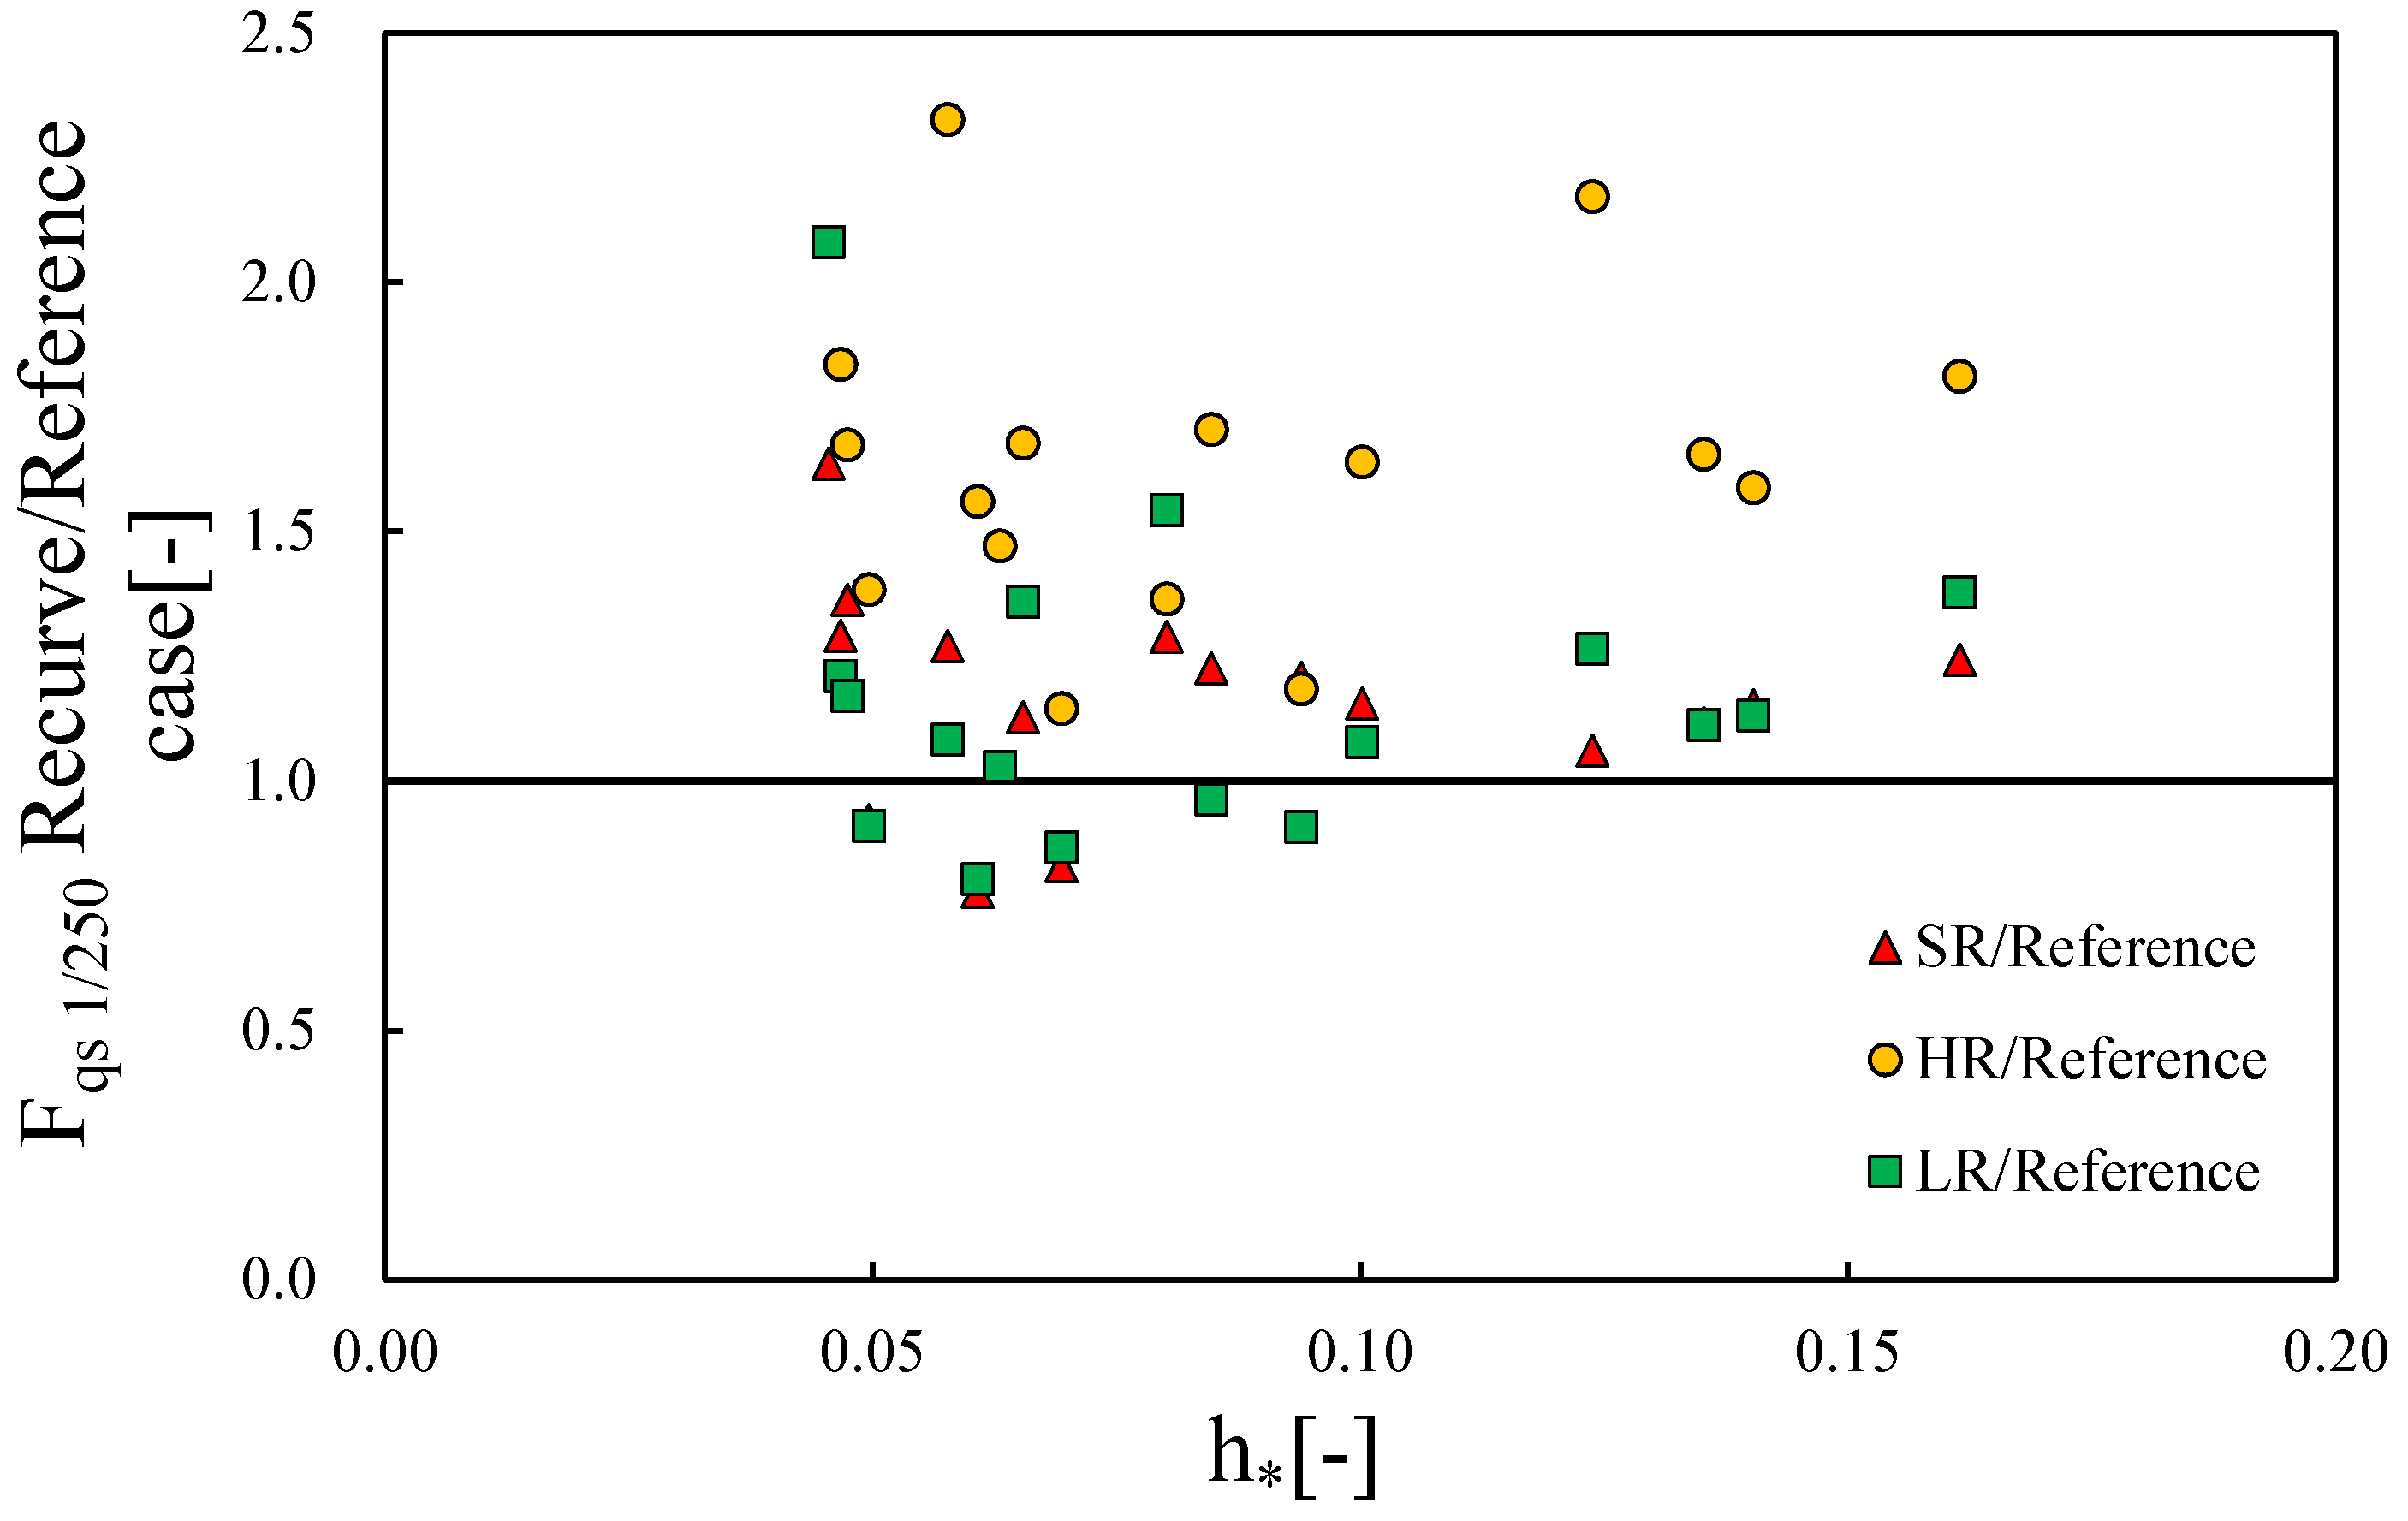
In addition to impact loading, knowledge of the influence of recurve geometry on the overall quasi-static loading on the structure is required to assess the potential risks generated from long-lasting wave loads. For the tested conditions, the extreme large quasi-static forces measured in this study are analysed and discussed as the mean value of the largest four events (Fqs 1/250), adopting the methodology proposed by Cuomo et al., [27], to minimize the uncertainties that may arise from the physical modelling measurements. Figure 12 shows an increase in the quasi-static force (Fqs 1/250) measured for recurve retrofits compared with those observed for the reference case. The results show that the overall Fqs 1/250 is larger when a recurve wall is mounted on the seawall crest. The influence of recurve retrofitting is significant, particularly for the lower range of h∗. Fqs 1/250 for SR configuration becomes up to 1.6 times larger when compared to the measurements from the reference cases for h* value of 0.05. Overall, for the tested retrofits, an average increase of 1.2 from the reference case are observed (see Figure 12). More significant increases in Fqs 1/250 are observed for HR and LR cases, with an average increase of 1.6 and 1.3, respectively, compared to the plain vertical wall.
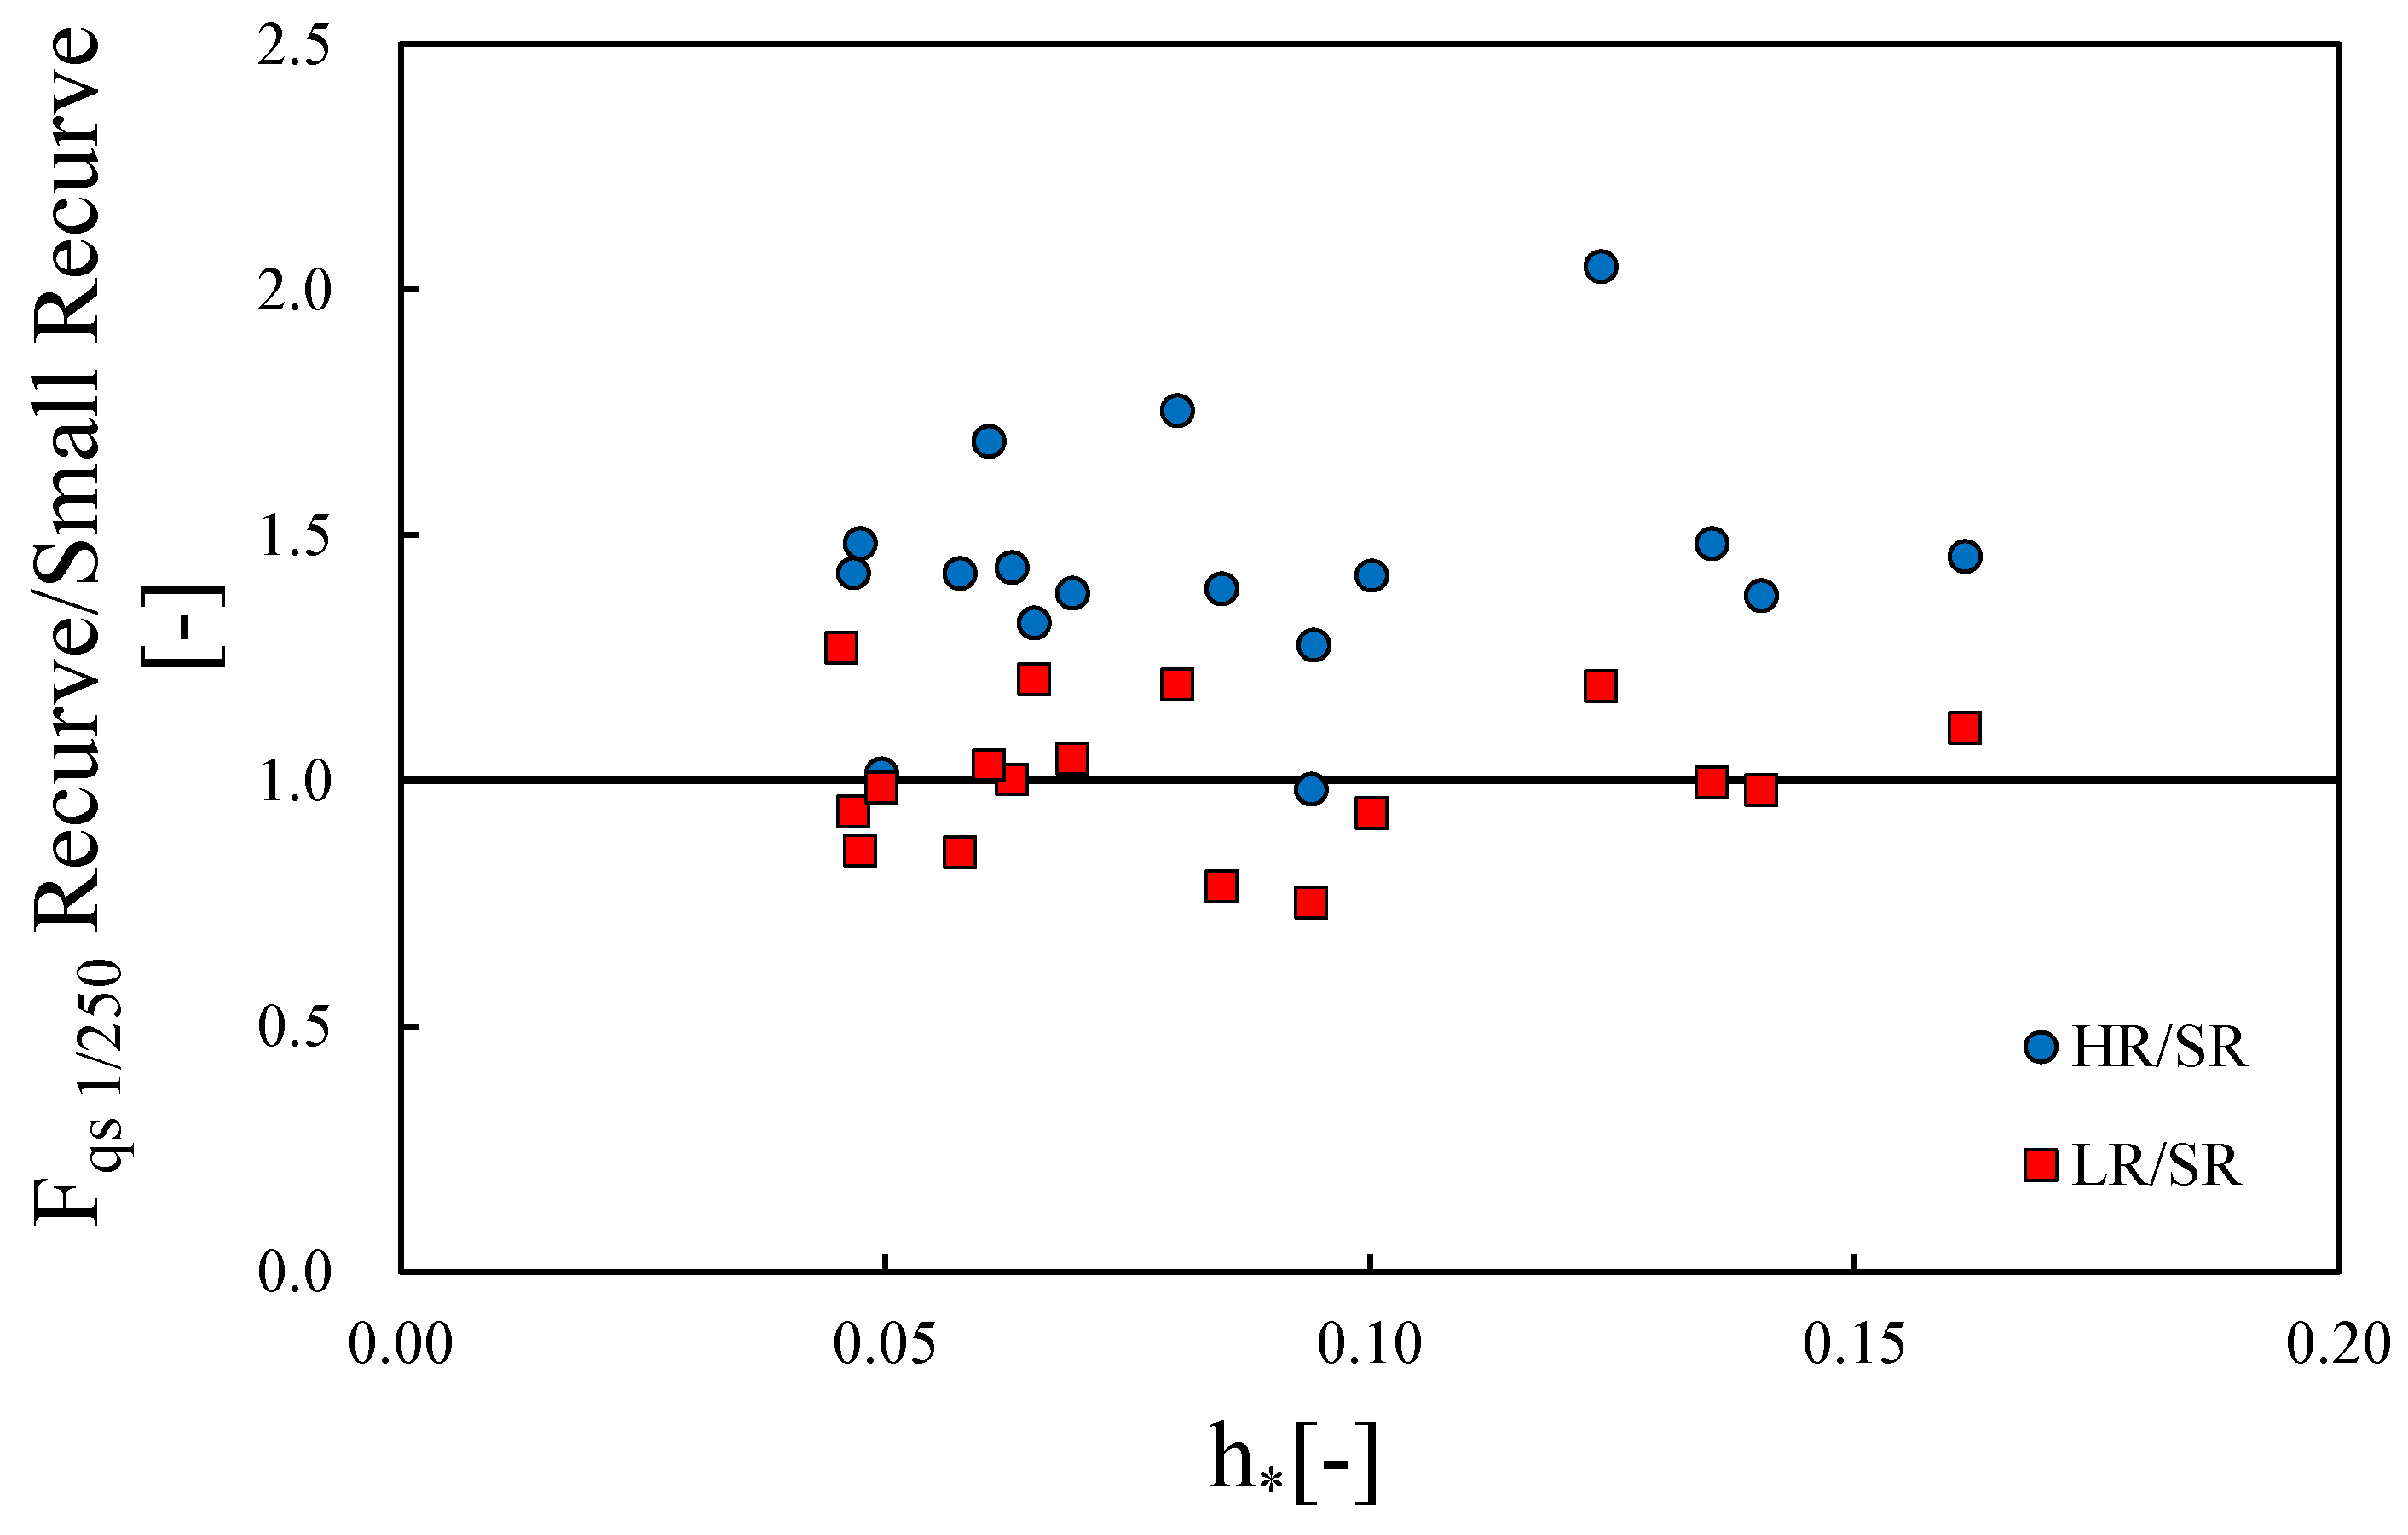
To investigate the influence of recurve geometry on the magnitude of quasi-static loads, measured Fqs 1/250 for LR and HR tested configurations are compared with the measurements corresponding to SR. Figure 13 shows that measured Fqs 1/250 for LR are in similar magnitude of those observed for the SR case. When comparing measured values of Fqs 1/250 from HR with SR, it can be reported that Fqs 1/250 values of HR configuration are larger than the values from SR, with an average increase of around 1.5. Hence, for the conditions tested within this study, the influence of increased recurve height on the quasi-static force was significant compared to the influence that was observed for the increased overhang length.
3.5. Overturning Moment
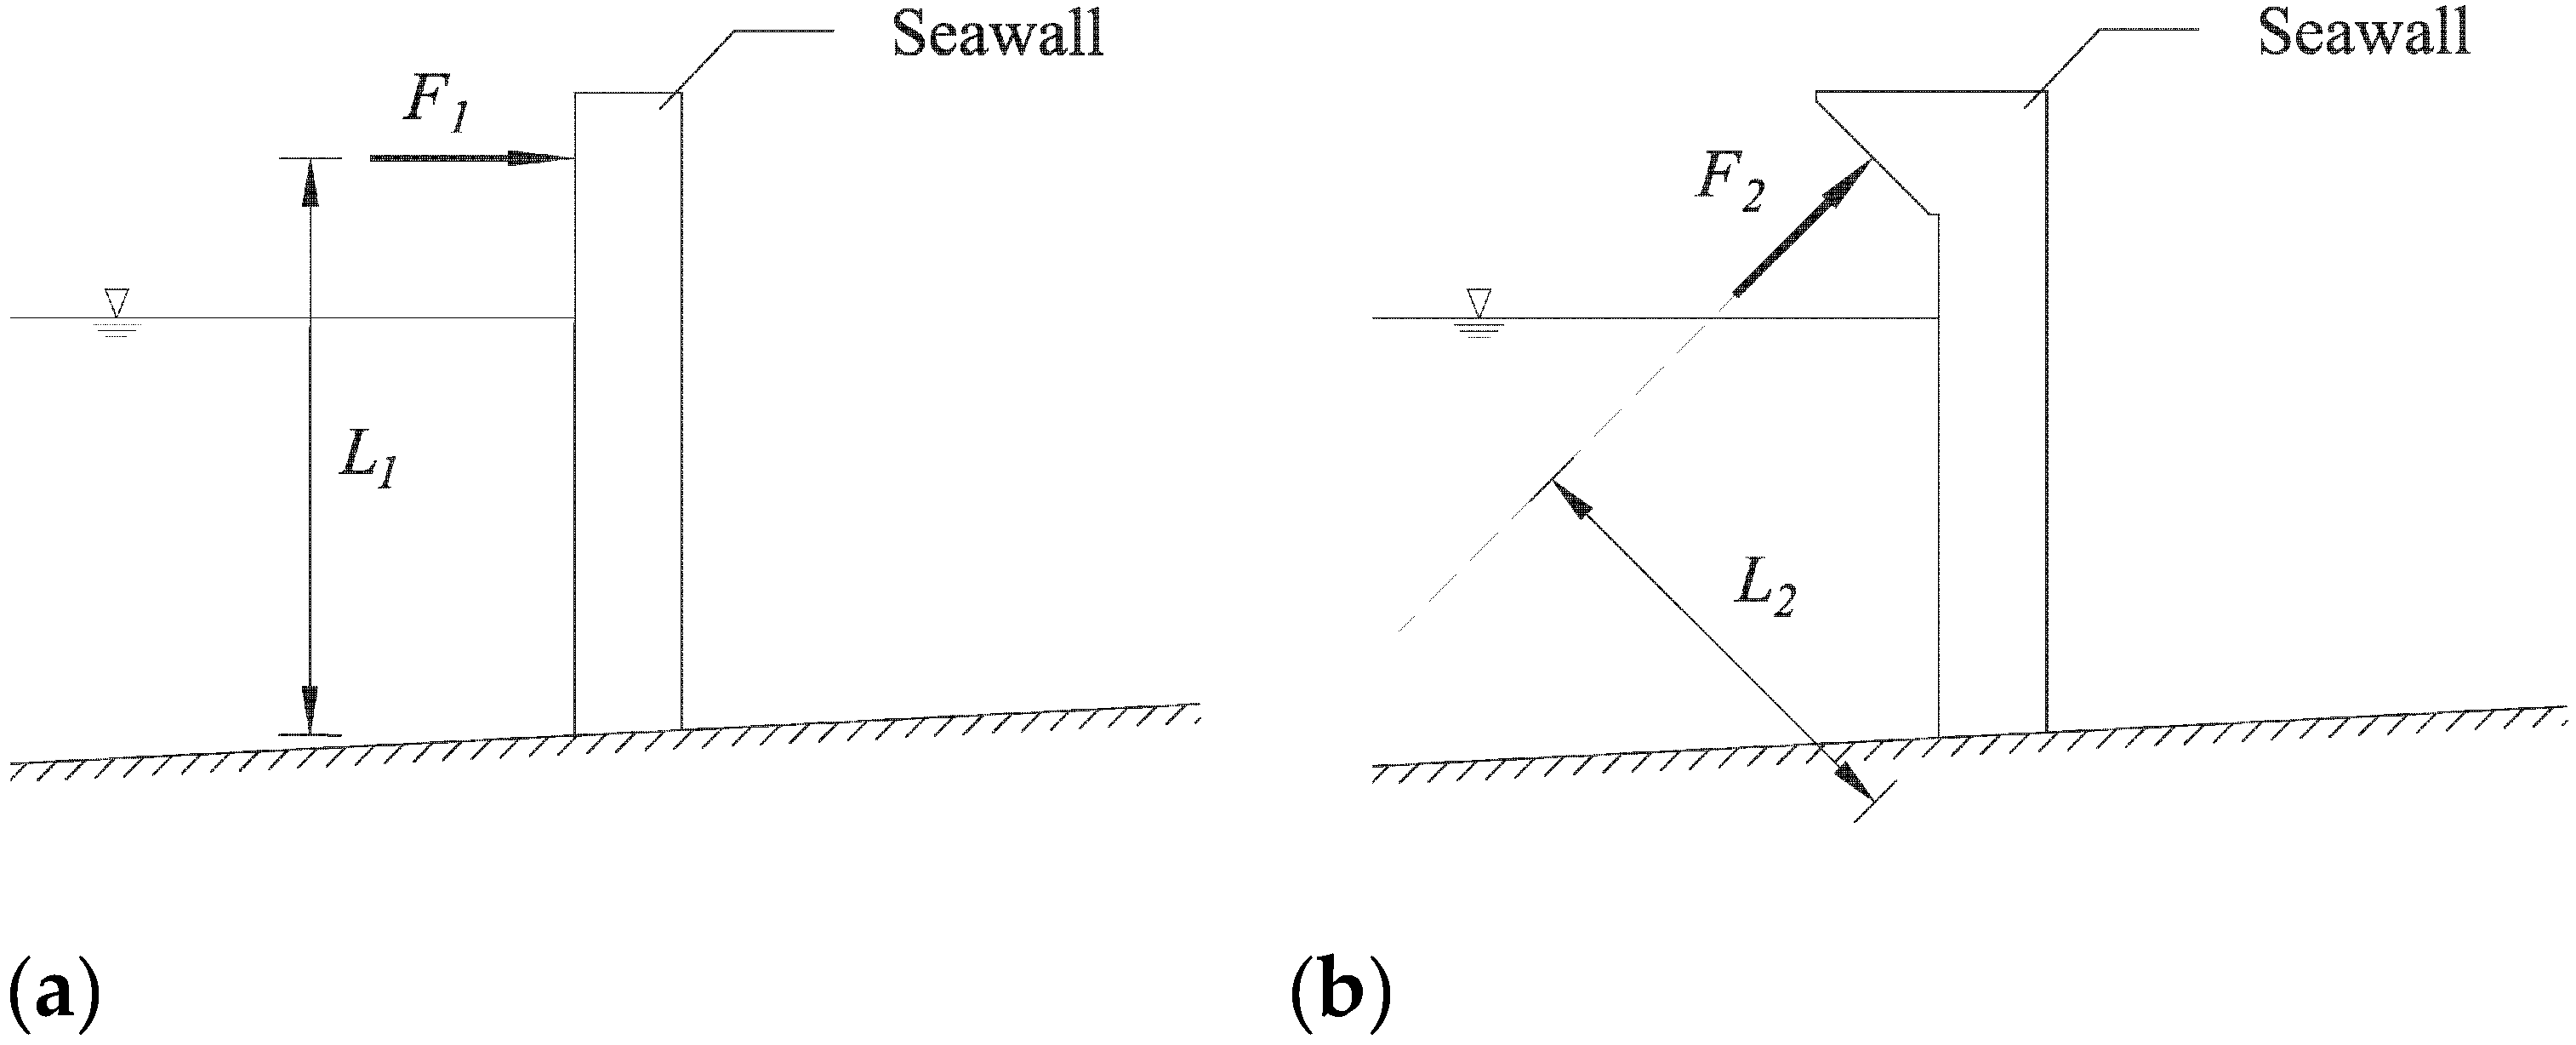
The overturning moment (Mz,imp) generated by the wave impact force was also investigated in this study to analyze the influence of impact force on the stability of the seawall structure. With regard to the stability concern, the structure must counterbalance the applied overturning moment with its strength and any additional support provided from the shoreward structures. The overturning moment was calculated by integrating the individual generated wave impact force and the corresponding torque arm (see Equation (2)), for both the plain vertical seawall and the SR configuration. Figure 14 highlights that the torque arm for the applied wave impact force changes with the change of the structural configuration i.e., from vertical seawall to the recurve retrofitting.
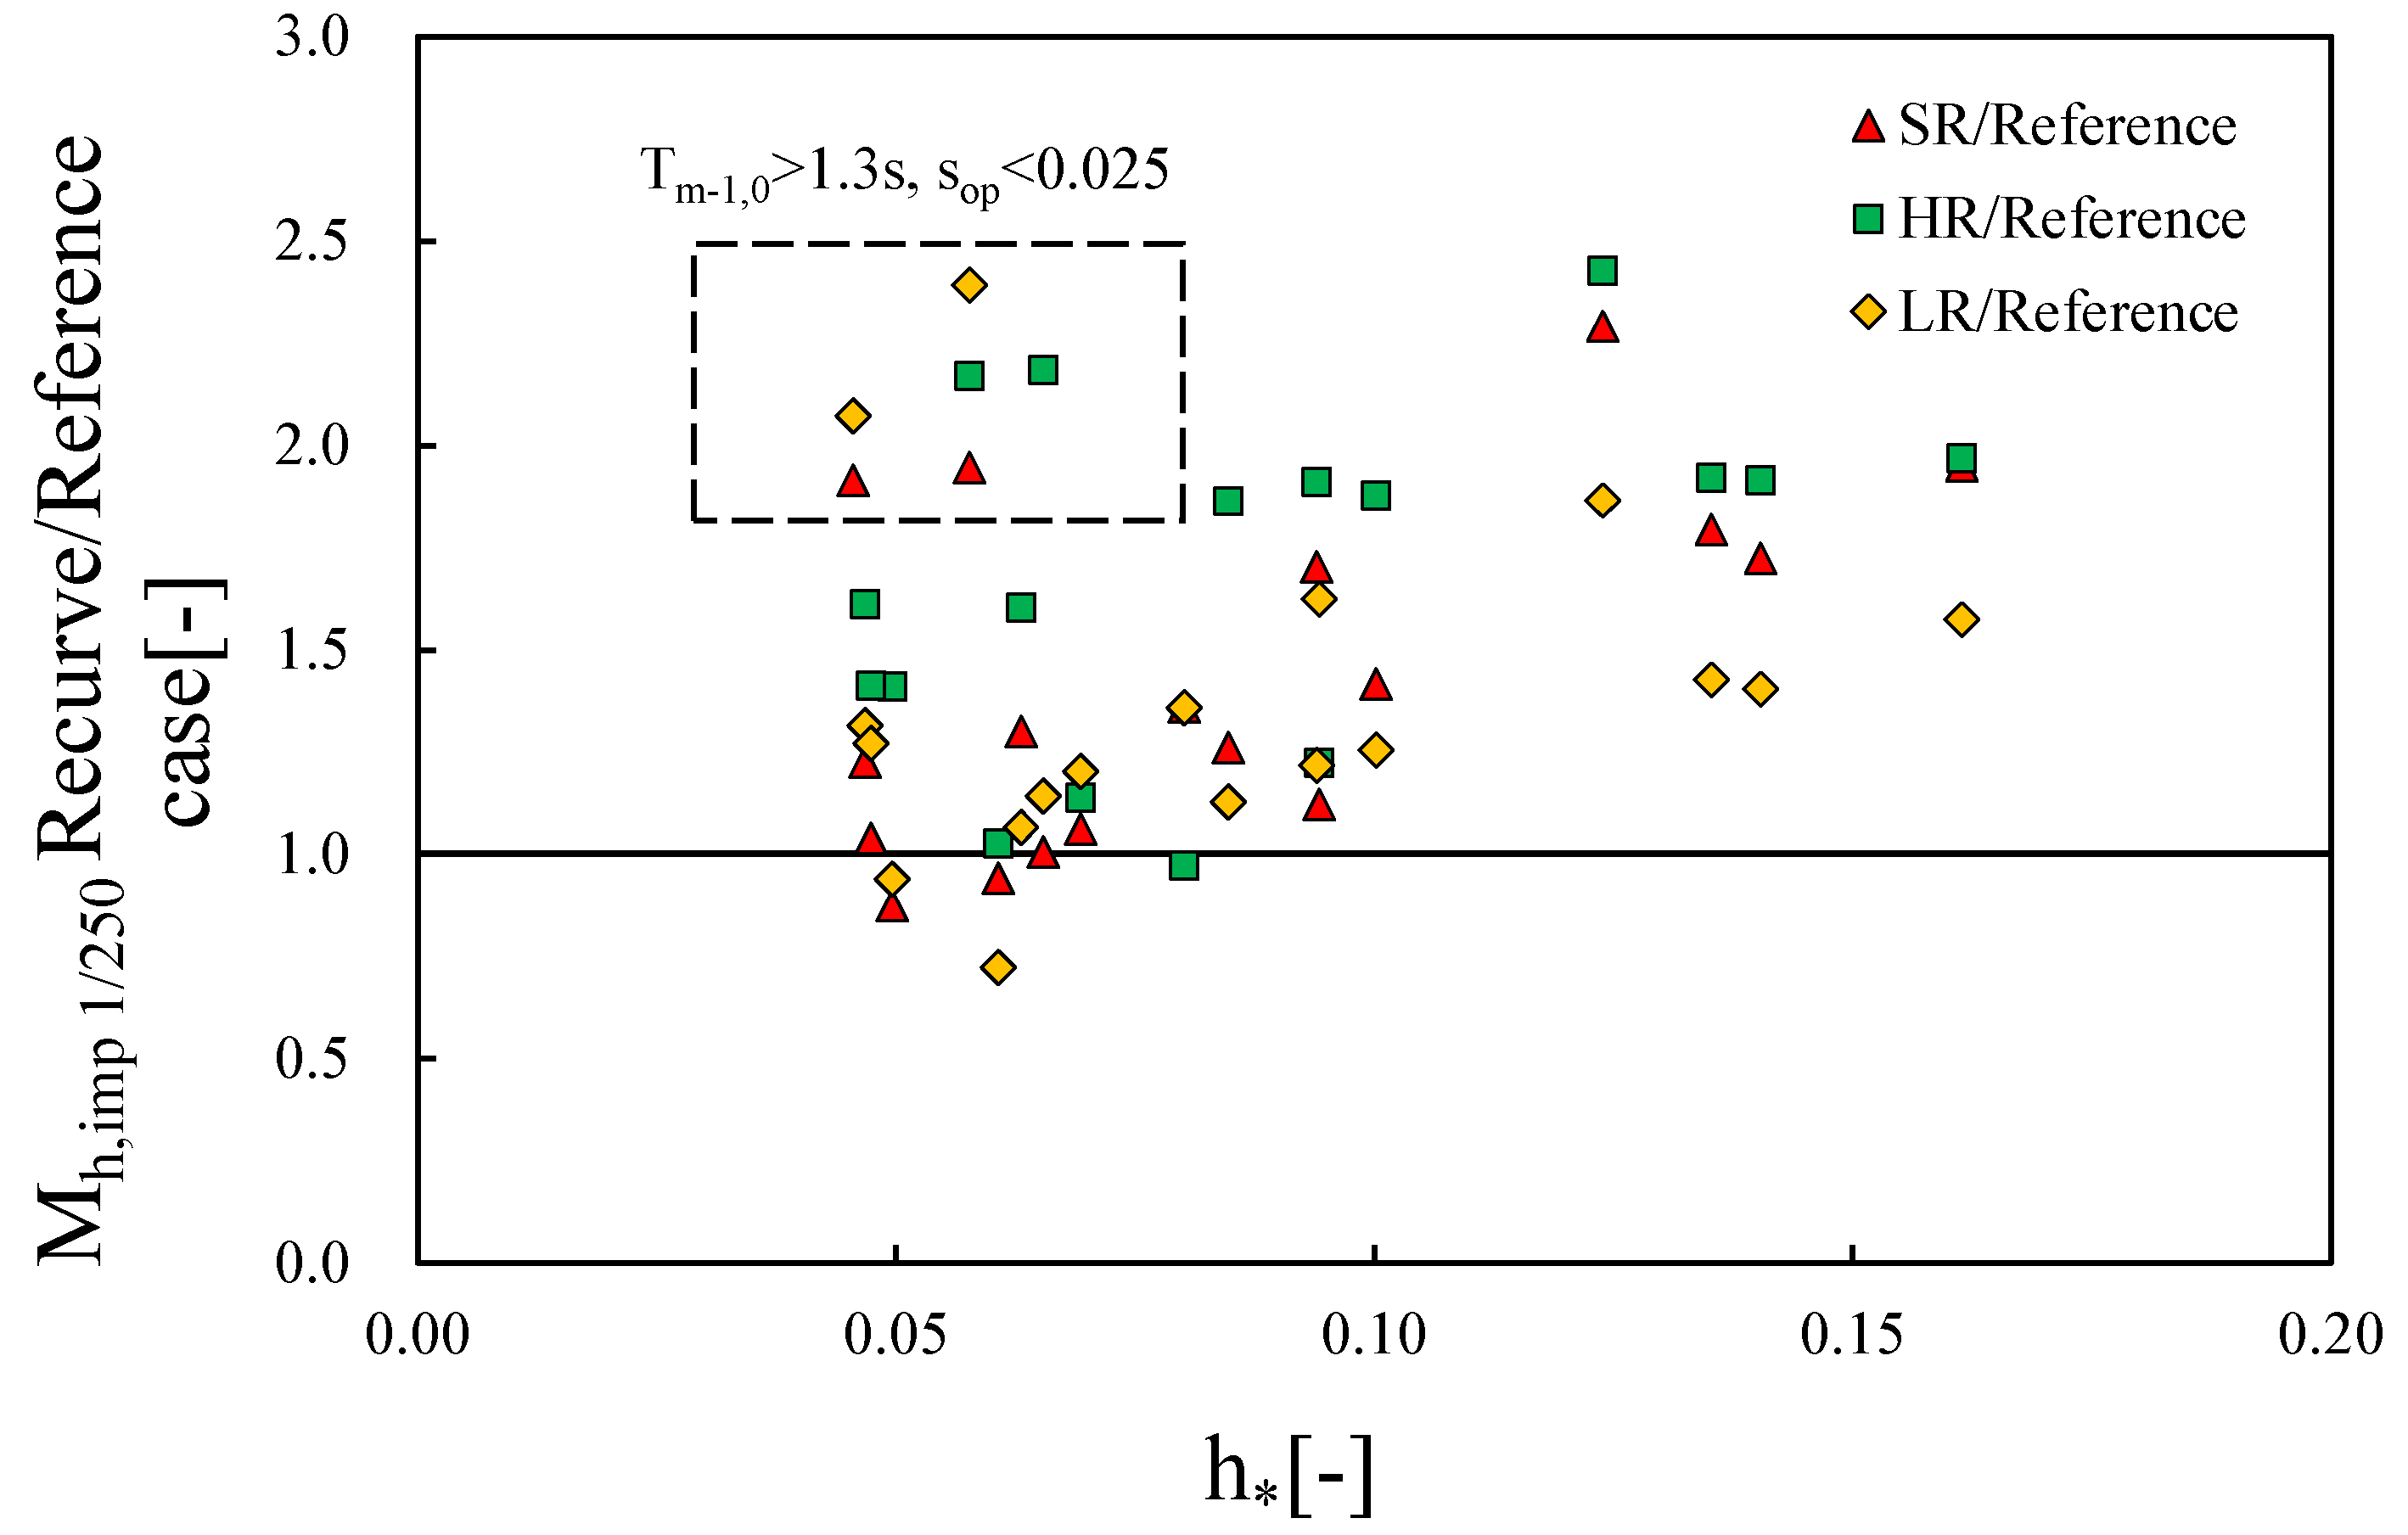
In Figure 15, measured Mh,imp1/250 for the tested recurve configurations are compared with those determined for the reference case. The data corresponding to the recurve retrofits are found to be larger when compared with those of the plain vertical wall (Figure 15). It was found that for the SR configuration, similar to the reference case, the values of Mh,imp1/250 decrease with the increase of h∗. In Figure 15, the increase ratio of Mh,imp1/250 rises with h∗, from 1.0 up to 2.4 for the retrofitted configurations tested within this study. However, different scenarios can be observed for the six tests highlighted in Figure 15, where a large increase ratio of up to 2.5 is observed with low h∗. These tests were all conducted with Tm−1,0 > 1.3 s and sop < 0.025. Overall, it can be concluded that the measured Mh,imp1/250 increases with h* in each tested configuration, and both the longer overhang and height of recurve wall leads to larger Mh,imp1/250. Based on the parametric analyses of the measurements, a possible reason for this phenomenon is the combined influence of long wavelength and low crest freeboard. The elevation of pmax is found to increase for these two highlighted cases, indicating an increased torque arm that results in a larger overturning moment generated on the whole structure.
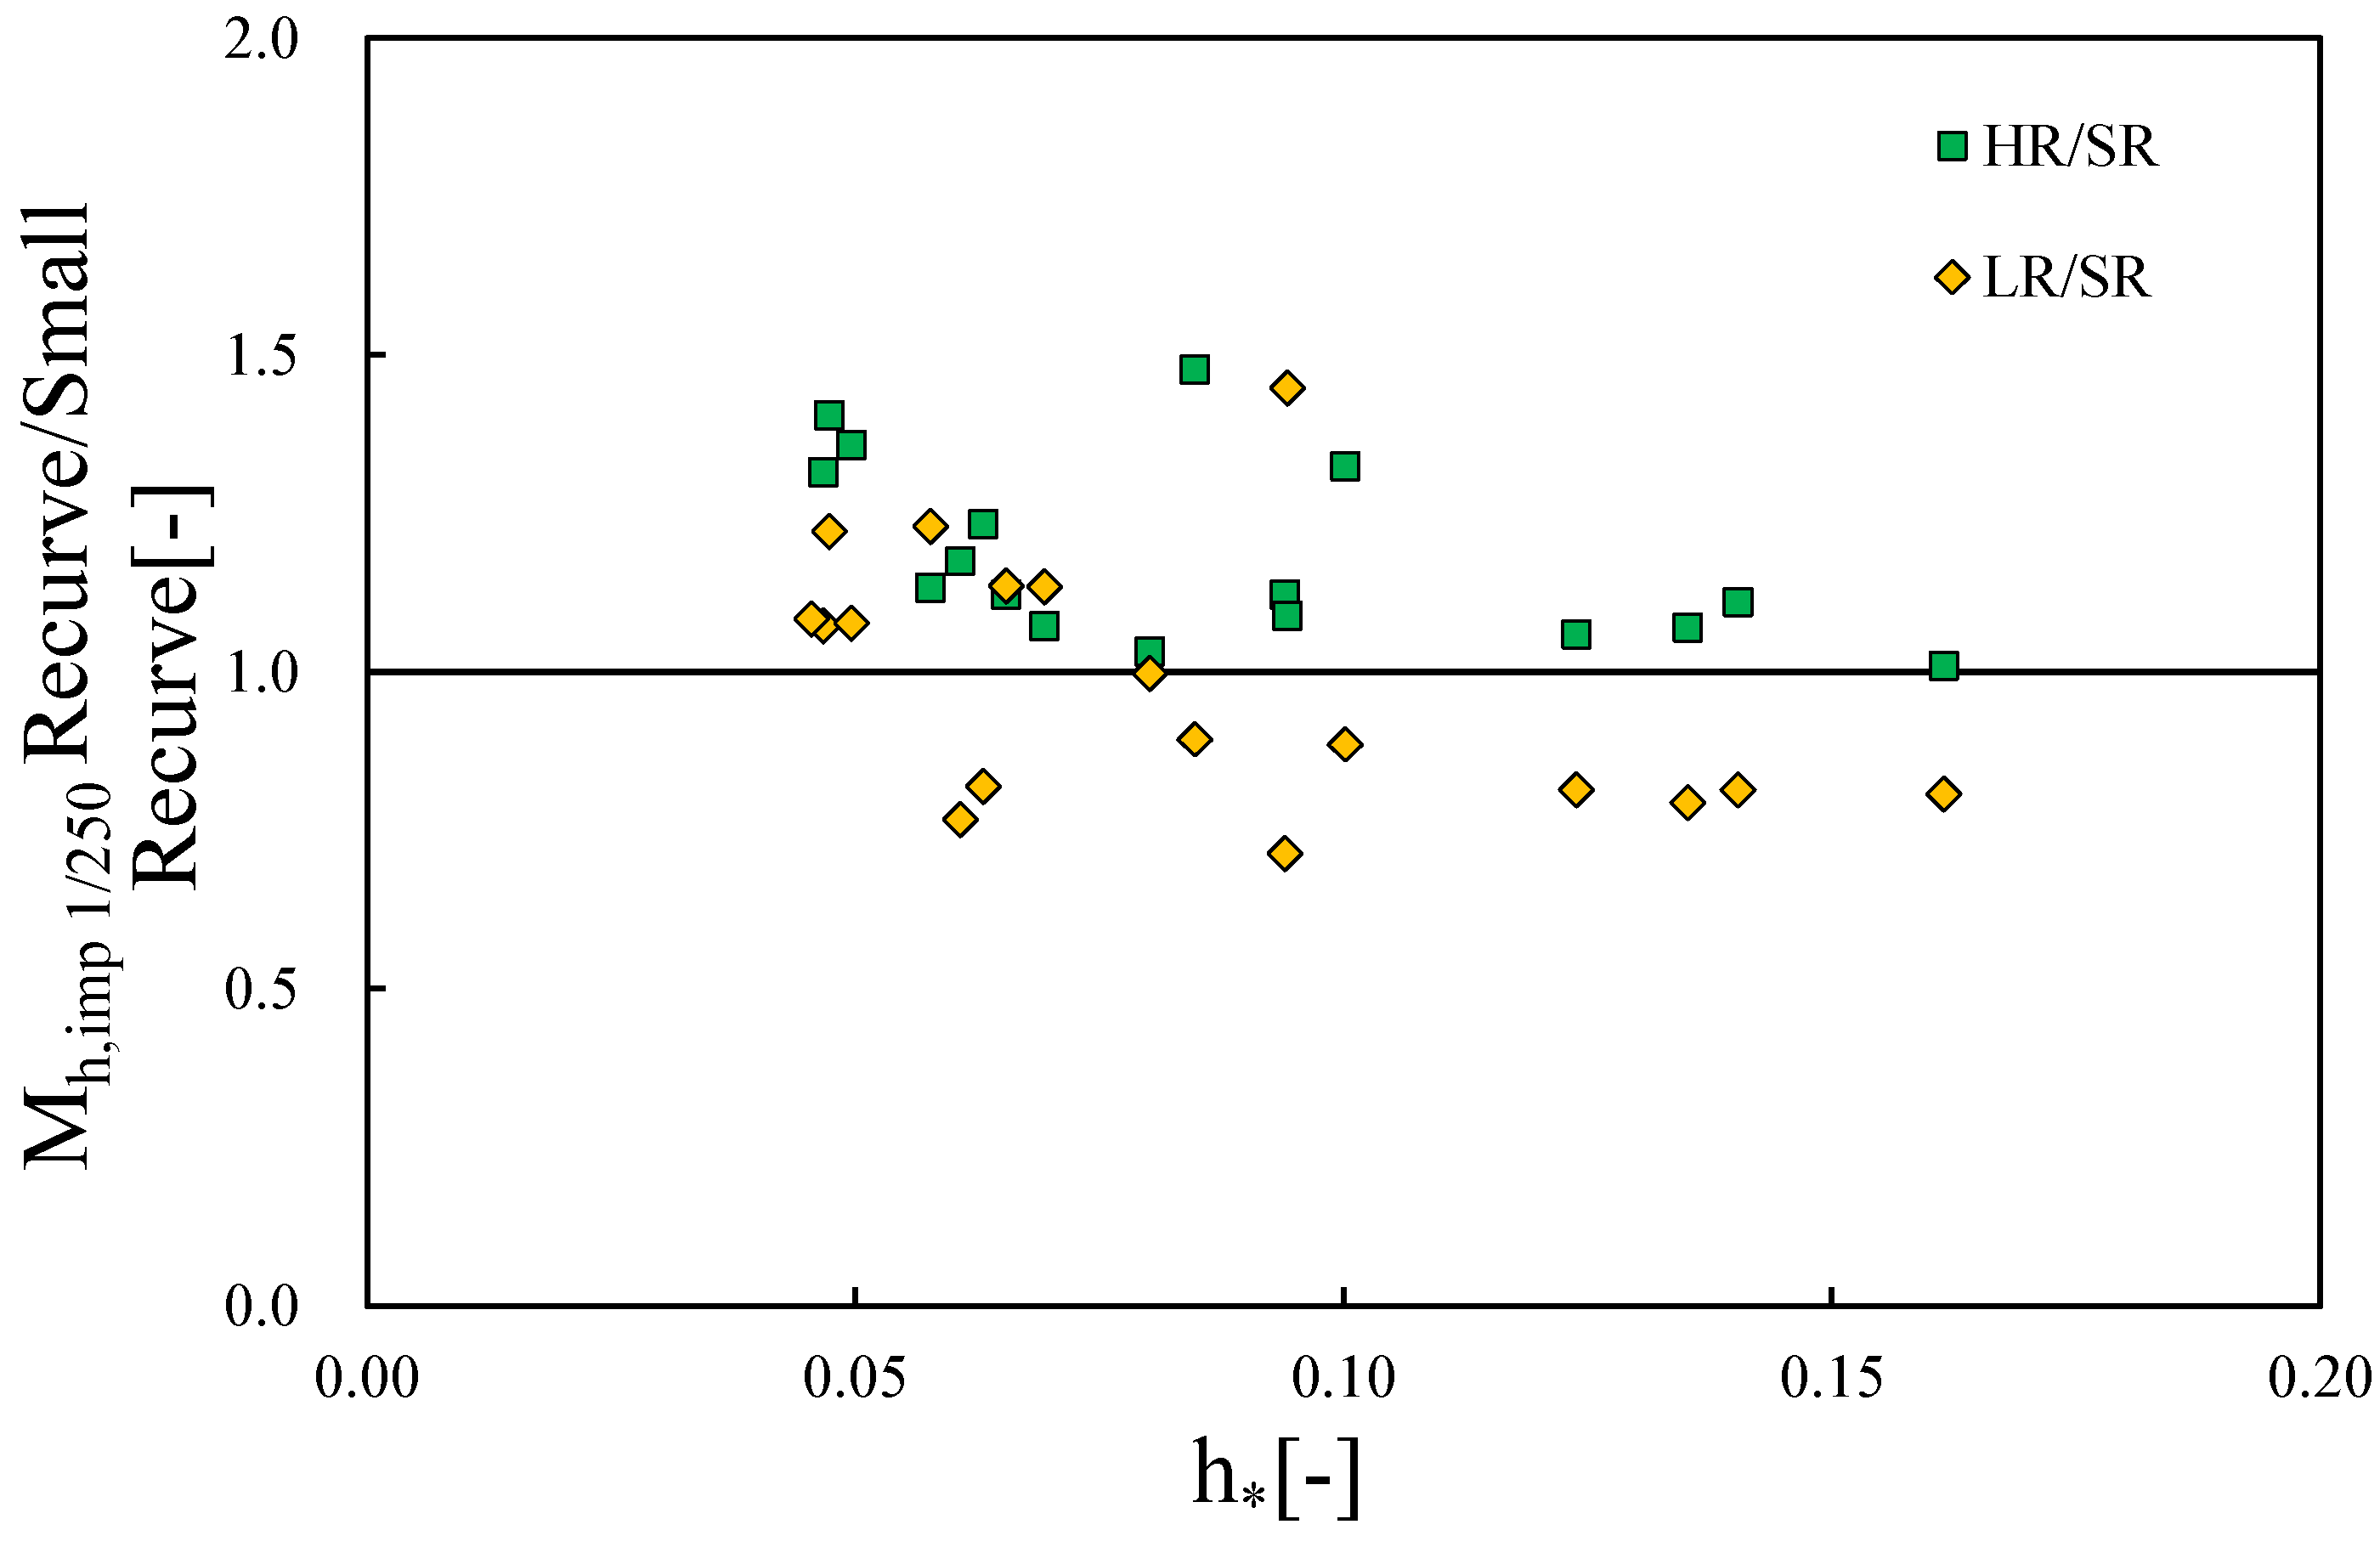
Figure 16 compares the overturning moment determined for the case of LR and HR configurations with those obtained from the SR configuration. The overturning moments observed on LR are generally found to be almost similar when compared with the values of SR, while there are three cases that show an increase of around 1.3 times greater than SR values. This can be associated with the similarities in the impact wave force measured for the LR and SR recurve cases. More significant increases are observed for the experiments corresponding to the HR configuration. When the height of the recurve wall increases, Mh,imp1/250 becomes larger than the value corresponding to SR for almost all of the tested cases. An average increase of around 1.15 times is observed, highlighting the limited but non-negligible influence of the recurve height on the overturning moment applied on the seawall.
4. Conclusions
A comprehensive suite of physical modelling tests was undertaken to evaluate the increase in the wave impact loads generated on the seawalls due to the addition of recurve retrofitting on the crest of the seawall. Detailed measurement and analysis were carried out to determine the distribution of wave impact pressure, the horizontal impact force and the overturning moment generated from the wave impact force. For the conditions covered within this study, test results demonstrate that the overall increase in the magnitude of horizontal impact wave loads for recurve retrofits is within a factor of 1.3 to 1.5 when compared to the measurements for the plain vertical seawall, leading to an approximate increase of 1.5 times the overturning moment generated by wave impact forces.
The magnitude of wave loads (both impact and quasi-static force) acting on the structure was primarily influenced by the recurve geometrical properties. It was found that with the increase of overhang length or height of the recurve wall, wave impact force and the overturning moment generated at the structure also increased simultaneously. Recurve walls with a long overhang with a low crest freeboard can be particularly hazardous due to the significant increase in the horizontal impact force under impulsive wave conditions. For the quasi-static wave loading, it was found that variation of the height of the recurve parapet significantly influences the wave loading on the seawall structure compared to the limited influence observed for the overhanging length.
Additionally, it was observed that the location of maximum wave impact pressure varies with the geometrical shape of the recurve parapet. For the tested conditions, it was found that with the increase of overhang length or height of the recurve wall, the elevation of the maximum pressure moves upwards. The experimental set-up of this study was designed using the established guidelines for a typical two-dimensional wave flume investigation ass outlined by EurOtop, see [46]. It is therefore believed that outcomes of this study would be comparable to the prototype measurements. However, any further validation of datasets through performing large-scale measurements would be clearly desirable. Data and information generated from this study provide new knowledge on the influence of recurve retrofitting on the wave impact force and structural stability of vertical seawalls, which can directly benefit coastal engineers, managers, and stakeholders to make risk-informed decisions regarding the design of the geometrical properties of the recurve configurations considering the probable increase in wave impact loading.
Author Contributions
Conceptualization, S.D., M.S., S.A. and J.P.; Methodology, S.D., M.S., S.A. and J.P.; Data curation, S.D.; Formal analysis, S.D.; Writing—original draft preparation, S.D., M.S. and S.A.; Supervision, J.P.; Writing—review and editing, S.D., M.S., S.A. and J.P. All authors have read and agreed to the published version of the manuscript.
Funding
This research received no external funding.
Institutional Review Board Statement
Not applicable.
Informed Consent Statement
Not applicable.
Data Availability Statement
Data presented in this study are available on request from the corresponding author.
Acknowledgments
Shudi Dong acknowledges the financial support from China Scholarship Council during this study.
Conflicts of Interest
The authors declare no conflict of interest. The funders had no role in the design of the study; in the collection, analyses, or interpretation of data; in the writing of the manuscript, or in the decision to publish the results.
References
- IPCC. Global Warming of 1.5 °C: An IPCC Special Report on the Impacts of Global Warming of 1.5 °C above Pre-industrial Levels and Related Global Greenhouse Gas Emission Pathways. In The Context of Strengthening the Global Response to the Threat of Climate Change, Sustainable Development, and Efforts to Eradicate Poverty; Intergovernmental Panel on Climate Change: Geneva, Switzerland, 2018. [Google Scholar]
- Abolfathi, S.; Yeganeh-Bakhtiary, A.; Hamze-Ziabari, S.M.; Borzooei, S. Wave runup prediction using M5′ model tree algorithm. Ocean. Eng. 2016, 112, 76–81. [Google Scholar] [CrossRef]
- Abolfathi, S.; Dong, S.; Borzooei, S.; Yeganeh-Bakhtiari, A.; Pearson, J.M. Application of smoothed particle hydrodynamics in evaluating the performance of coastal retrofit structures. Coast. Eng. Proc. 2018, 1, 109. [Google Scholar] [CrossRef] [Green Version]
- Fitri, A.; Hashim, R.; Abolfathi, S.; Maulud, K.N.A. Dynamics of sediment transport and erosion-deposition patterns in the locality of a detached low-crested breakwater on a cohesive coast. Water 2019, 11, 1721. [Google Scholar] [CrossRef] [Green Version]
- Yeganeh-Bakhtiary, A.; Houshangi, H.; Hajivalie, F.; Abolfathi, S. A numerical study on hydrodynamics of standing waves in front of caisson breakwaters with WCSPH model. Coast. Eng. J. 2017, 59, 1750005-1–1750005-31. [Google Scholar] [CrossRef] [Green Version]
- Yeganeh-Bakhtiary, A.; Houshangi, H.; Abolfathi, S. Lagrangian two-phase flow modeling of scour in front of vertical breakwater. Coast. Eng. J. 2020, 62, 252–266. [Google Scholar] [CrossRef]
- O’Sullivan, J.J.; Salauddin, M.; Abolfathi, S.; Pearson, J.M. Effectiveness of eco-retrofits in reducing wave overtopping on seawalls. Coast. Eng. Proc. 2020, 36, 13. [Google Scholar] [CrossRef]
- Salauddin, M.; O’Sullivan, J.J.; Abolfathi, S.; Pearson, J.M. Extreme wave overtopping at ecologically modified sea defences. In Proceedings of the EGU General Assembly, Online, 4–8 May 2020. EGU2020-6162. [Google Scholar] [CrossRef]
- Salauddin, M.; O’Sullivan, J.J.; Abolfathi, S.; Dong, S.; Pearson, J.M. Distribution of individual wave overtopping volumes on a sloping structure with a permeable foreshore. Coast. Eng. Proc. 2020, 36, 54. [Google Scholar] [CrossRef]
- Dong, S.; Abolfathi, S.; Salauddin, M.; Pearson, J.M. Spatial distribution of wave-by-wave overtopping behind vertical seawall with recurve retrofitting. Ocean Eng. 2021, 238, 109674. [Google Scholar] [CrossRef]
- Salauddin, M.; Pearson, J.M. Laboratory investigation of overtopping at a sloping structure with permeable shingle foreshore. Ocean Eng. 2020, 197, 106866. [Google Scholar] [CrossRef]
- Allsop, N.W.H.; Vicinanza, D.; McKenna, J. Report SR 443; HR Wallingford: Wallingford, UK, 1996. [Google Scholar]
- Allsop, N.W.H.; Mckenna, J.E.; Vicinanza, D.; Wittaker, T.T.J. New design methods for wave impact loading on vertical Breakwaters and seawalls. In Proceedings of the 25th ICCE, Rome, Italy, 16–22 June 2017; pp. 2508–2521. [Google Scholar]
- Pearson, J.; Bruce, T.; Allsop, W.; Kortenhaus, A.; Van der Meer, J.W. Effectiveness of recurve walls in reducing wave overtopping on seawalls and breakwaters. Coast. Eng. 2004, 4, 4404–4416. [Google Scholar] [CrossRef] [Green Version]
- Dong, S.; Salauddin, M.; Abolfathi, S.; Tan, Z.H.; Pearson, J.M. The Influence of Geometrical Shape Changes on Wave Overtopping: A Laboratory and SPH Numerical Study, in Coasts, Marine Structures and Breakwaters 2017: Realising the Potential; ICE Publishing: London, UK, 2018; pp. 1217–1226. [Google Scholar] [CrossRef]
- Dong, S.; Abolfathi, S.; Salauddin, M.; Tan, Z.H.; Pearson, J.M. Enhancing climate resilience of vertical seawall with retrofitting-A physical modelling study. Appl. Ocean. Res. 2020, 103, 102331. [Google Scholar] [CrossRef]
- Dong, S.; Abolfathi, S.; Salauddin, M.; Pearson, J.M. Spatial distribution of wave-by-wave overtopping at vertical seawalls. Coast. Eng. Proc. 2020, 36, 17. [Google Scholar] [CrossRef]
- Kortenhaus, A.; Pearson, J.; Bruce, T.; Allsop, N.; Van der Meer, J.W. Influence of parapets and recurves on wave overtopping and wave loading of complex vertical walls. Coast. Struct. 2003, 369–381. [Google Scholar] [CrossRef]
- Salauddin, M.; O’Sullivan, J.J.; Abolfathi, S.; Pearson, J.M. Eco-Engineering of Seawalls—An Opportunity for Enhanced Climate Resilience from Increased Topographic Complexity. Front. Mar. Sci. 2021, 8, 674630. [Google Scholar] [CrossRef]
- Oh, S.; Jang, S.; Lee, J. Wave Overtopping and Loading for the Recurved Parapets on the Crest of Rubble Mound Breakwater. In Proceedings of the Coasts, Marine Structures and Breakwaters, Liverpool, UK, 5–7 September 2017. [Google Scholar] [CrossRef]
- Van Doorslaer, K.; De Rouck, J.; Trouw, K.; van der Meer, J.W.; Schimmels, S. Wave forces on storm walls, small and large scale experiments. In Proceedings of the COPEDEC VIII, Chennai, India, 20–24 February 2012. [Google Scholar]
- Castellino, M.; Lara, J.L.; Romano, A.; Losada, I.J.; De Girolamo, P. Wave loading for recurved parapet walls in non-breaking wave conditions: Analysis of the induced impulsive forces. Coast. Eng. Proc. 2018, 1, 34. [Google Scholar] [CrossRef] [Green Version]
- Castellino, M.; Sammarco, P.; Romano, A.; Martinelli, L.; Ruol, P.; Franco, L.; De Girolamo, P. Large impulsive forces on recurved parapets under non-breaking waves:A numerical study. Coast. Eng. 2018, 136, 1–15. [Google Scholar] [CrossRef]
- Martinelli, L.; Ruol, P.; Volpato, M.; Favaretto, C.; Castellino, M.; De Girolamo, P.; Sammarco, P. Experimental investigation on non-breaking wave forces and overtopping at the recurved parapets of vertical breakwaters. Coast. Eng. 2018, 141, 52–67. [Google Scholar] [CrossRef]
- Swart, E. Effect of the Overhang Length of a Recurve Seawall in Reducing Wave Overtopping; Stellenbosch University: Stellenbosch, South Africa, 2016. [Google Scholar]
- Bullock, G.; Obhrai, C.; Peregrine, D.; Bredmose, H. Violent breaking wave impacts. Part 1: Results from large-scale regular wave tests on vertical and sloping walls. Coast. Eng. 2007, 54, 602–617. [Google Scholar] [CrossRef]
- Cuomo, G.; Allsop, N.W.H.; Bruce, T.; Pearson, J.M. Breaking wave loads at vertical seawalls and breakwaters. Coast. Eng. 2010, 57, 4. [Google Scholar] [CrossRef] [Green Version]
- Stagonas, D.; Lara, J.L.; Losada, I.J.; Higuera, P.; Jaime, F.F.; Muller, G. Large scale measurements of wave loads and mapping of impact pressure distribution at the underside of wave recurves. In Proceedings of the HYDRALAB IV Joint User Meeting, Lisbon, Portugal, 2–4 July 2014. [Google Scholar]
- Kisacik, D.; Troch, P.; Van Bogaert, P. Experimental study of violent wave impact on a vertical structure with an overhanging horizontal cantilever slab. Ocean. Eng. 2012, 49, 1–15. [Google Scholar] [CrossRef]
- Kisacik, D.; Troch, P.; Van Bogaert, P. Description of loading conditions due to violent wave impacts on a vertical structure with an overhanging horizontal cantilever slab. Coast. Eng. 2012, 60, 201–226. [Google Scholar] [CrossRef]
- Abolfathi, S.; Pearson, J.M. Solute dispersion in the nearshore due to oblique waves. Coast. Eng. Proc. 2014, 34, 49. [Google Scholar] [CrossRef] [Green Version]
- Abolfathi, S.; Pearson, J.M. Application of smoothed particle hydrodynamics (SPH) in nearshore mixing: A comparison to laboratory data. Coast. Eng. Proc. 2017, 1, 16. [Google Scholar] [CrossRef]
- Ravindar, R.; Sriram, V.; Schimmels, S.; Stagonas, D. Characterization of breaking wave impact on vertical wall with recurve. ISH J. Hydraul. Eng. 2017, 25, 153–161. [Google Scholar] [CrossRef]
- Stagonas, D.; Ravindar, R.; Sriram, V.; Schimmels, S. Experimental Evidence of the Influence of Recurves on Wave Loads at Vertical Seawalls. Water 2020, 12, 889. [Google Scholar] [CrossRef] [Green Version]
- Mansard, E.P.D.; Funke, E.R. The measurement of incident and reflected spectra using a least squares method. Coast. Eng. 1980, 154–172. [Google Scholar] [CrossRef] [Green Version]
- Pearson, J.M.; Bruce, T.; Allsop, N.W.H. Prediction of wave overtopping at steep seawalls—Variabilities and uncertainties. In Proceedings of the Fourth International Symposium on Ocean Wave Measurement and Analysis, San Francisco, CA, USA, 2–6 September 2001; pp. 1797–1808. [Google Scholar]
- Salauddin, M.; Pearson, J.M. A laboratory study on wave overtopping at vertical seawalls with a shingle foreshore. Coast. Eng. Proc. 2018, 1, 56. [Google Scholar] [CrossRef] [Green Version]
- Salauddin, M.; Pearson, J.M. Wave overtopping and toe scouring at a plain vertical seawall with shingle foreshore: A Physical model study. Ocean Eng. 2019, 171, 286–299. [Google Scholar] [CrossRef] [Green Version]
- Salauddin, M.; Pearson, J.M. Experimental Study on Toe Scouring at Sloping Walls with Gravel Foreshores. J. Mar. Sci. Eng. 2019, 7, 198. [Google Scholar] [CrossRef] [Green Version]
- Salauddin, M.; Peng, Z.; Pearson, J. The effects of wave impacts on toe scouring and overtopping concurrently for permeable shingle foreshores. In Proceedings of the EGU General Assembly, Online, 19–30 April 2021. EGU21-548. [Google Scholar] [CrossRef]
- Goda, Y. Random Seas and Design of Maritime Structures; World Scientific: London, UK, 2000. [Google Scholar]
- Hull, P.; Müller, G. An investigation of breaker heights, shapes and pressures. Ocean Eng. 2002, 29, 59–79. [Google Scholar] [CrossRef]
- Peregrine, D. Water-wave impact on walls. Annu. Rev. Fluid Mech. 2003, 35, 23–43. [Google Scholar] [CrossRef]
- Bullock, G.N.; Crawford, A.R.; Hewson, P.J.; Walkden, M.J.A.; Bird, P.A.D. The influence of air and scale on wave impact pressures. Coast. Eng. 2001, 42, 291–312. [Google Scholar] [CrossRef]
- Wood, D.J.; Peregrine, D.H.; Bruce, T. Wave impact on a wall using pressure-impulse theory I: Trapped air. J. Waterw. Port Coast. Ocean Eng. 2000, 126, 182–190. [Google Scholar] [CrossRef]
- EurOtop. Manual on Wave Overtopping of Sea Defences and Related Structures, 2nd ed.; 2018; Available online: http://www.overtopping-manual.com (accessed on 10 December 2020).
Figure 1.
Schematic of the test set-up designed for this study (adopted from [10]).
Figure 1.
Schematic of the test set-up designed for this study (adopted from [10]).

Figure 2.
Schematic of the position of transducers on the face of the plain vertical seawall (Units: mm).
Figure 2.
Schematic of the position of transducers on the face of the plain vertical seawall (Units: mm).

Figure 3.
Schematic of geometrical properties of the recurve retrofitting tested in this study.

Figure 4.
Distribution of wave impact pressure for experiments with benchmark configuration (plain vertical seawall). (a) hs = 0.09 m, (b) hs = 0.11 m. Lines with different color represent the pressure distribution from cases with different wave periods.
Figure 4.
Distribution of wave impact pressure for experiments with benchmark configuration (plain vertical seawall). (a) hs = 0.09 m, (b) hs = 0.11 m. Lines with different color represent the pressure distribution from cases with different wave periods.

Figure 5.
Distribution of wave impact pressure for experiments with SR configurations: (a) hs = 0.09 m (b) hs = 0.11 m.
Figure 5.
Distribution of wave impact pressure for experiments with SR configurations: (a) hs = 0.09 m (b) hs = 0.11 m.

Figure 6.
Incident waves interactions with the seawall and thrown-back by the recurve retrofitting.

Figure 7.
Distribution of wave impact pressure for experiments with LR and HR configurations: (a) Long Recurve hs = 0.09 m (b) Long Recurve hs = 0.11 m (c) High Recurve hs = 0.09 m (d) High Recurve hs = 0.11 m.
Figure 7.
Distribution of wave impact pressure for experiments with LR and HR configurations: (a) Long Recurve hs = 0.09 m (b) Long Recurve hs = 0.11 m (c) High Recurve hs = 0.09 m (d) High Recurve hs = 0.11 m.

Figure 8.
Example of time series data for impact and quasi-static force measured from one wave event during the physical modelling experiments: (a) The force history of a whole wave event. (b) The impact force and oscillation occur after the wave event due to the trapped air between the wave and structure.

Figure 9.
Comparison of the horizontal impact force (Fh,imp1/250) measured for the reference and retrofitted configurations. h* is the wave impulsiveness defined as .
Figure 9.
Comparison of the horizontal impact force (Fh,imp1/250) measured for the reference and retrofitted configurations. h* is the wave impulsiveness defined as .

Figure 10.
Increase in the horizontal impact force (Fh,imp1/250) measured for recurve retrofits compared with those measured for plain vertical wall.
Figure 10.
Increase in the horizontal impact force (Fh,imp1/250) measured for recurve retrofits compared with those measured for plain vertical wall.

Figure 11.
Increase in the horizontal impact force (Fh,imp1/250) measured for HR and LR compared with those measured for SR.
Figure 11.
Increase in the horizontal impact force (Fh,imp1/250) measured for HR and LR compared with those measured for SR.

Figure 12.
Increase in the quasi-static force (Fqs 1/250) measured for recurve retrofits compared with measurements for plain vertical wall.
Figure 12.
Increase in the quasi-static force (Fqs 1/250) measured for recurve retrofits compared with measurements for plain vertical wall.

Figure 13.
Increase in the quasi-static force (Fqs 1/250) measured for HR and LR compared with measurements for SR.
Figure 13.
Increase in the quasi-static force (Fqs 1/250) measured for HR and LR compared with measurements for SR.

Figure 14.
Schematic of force direction on plain vertical seawall and SR configurations, showing changes in torque arm. F1 and F2 represent wave force applied on plain vertical seawall (a) and recurve walls (b), respectively. The torque arm for F1 and F2 are shown as L1 and L2, respectively.
Figure 14.
Schematic of force direction on plain vertical seawall and SR configurations, showing changes in torque arm. F1 and F2 represent wave force applied on plain vertical seawall (a) and recurve walls (b), respectively. The torque arm for F1 and F2 are shown as L1 and L2, respectively.

Figure 15.
Increase in overturning moment measured for recurve retrofits compared with those observed for plain vertical wall.
Figure 15.
Increase in overturning moment measured for recurve retrofits compared with those observed for plain vertical wall.

Figure 16.
Influence of geometrical shapes in overturning moment applied on the seawall structure.


Table 1.
Nominal wave conditions and structural configurations used for the physical modelling tests.
Table 1.
Nominal wave conditions and structural configurations used for the physical modelling tests.
| hs [m] | Hm0 [m] | Tp [s] | Lp [m] | sop [−] | Rc [m] | Rc/Hm0 [−] |
|---|---|---|---|---|---|---|
| 0.07 | 0.05 | 0.79 | 0.98 | 0.054 | 0.14 | 2.67 |
| 0.07 | 0.06 | 0.88 | 1.20 | 0.054 | 0.14 | 2.17 |
| 0.07 | 0.07 | 0.94 | 1.38 | 0.050 | 0.14 | 2.01 |
| 0.09 | 0.06 | 0.79 | 0.98 | 0.059 | 0.12 | 2.08 |
| 0.09 | 0.07 | 0.88 | 1.20 | 0.057 | 0.12 | 1.75 |
| 0.09 | 0.07 | 0.94 | 1.38 | 0.051 | 0.12 | 1.70 |
| 0.09 | 0.08 | 1.03 | 1.66 | 0.047 | 0.12 | 1.53 |
| 0.09 | 0.08 | 1.10 | 1.90 | 0.041 | 0.12 | 1.54 |
| 0.09 | 0.09 | 1.21 | 2.28 | 0.039 | 0.12 | 1.35 |
| 0.09 | 0.07 | 1.26 | 2.46 | 0.027 | 0.12 | 1.83 |
| 0.09 | 0.07 | 1.36 | 2.90 | 0.024 | 0.12 | 1.70 |
| 0.09 | 0.07 | 1.46 | 3.31 | 0.020 | 0.12 | 1.79 |
| 0.09 | 0.07 | 1.73 | 4.67 | 0.014 | 0.12 | 1.82 |
| 0.11 | 0.06 | 0.88 | 1.20 | 0.054 | 0.10 | 1.54 |
| 0.11 | 0.07 | 0.88 | 1.20 | 0.057 | 0.10 | 1.45 |
| 0.11 | 0.07 | 0.94 | 1.38 | 0.052 | 0.10 | 1.38 |
| 0.11 | 0.08 | 0.99 | 1.51 | 0.054 | 0.10 | 1.22 |
| 0.11 | 0.08 | 0.94 | 1.38 | 0.057 | 0.10 | 1.26 |
| 0.11 | 0.08 | 1.36 | 2.90 | 0.027 | 0.10 | 1.27 |
| 0.11 | 0.08 | 1.46 | 3.31 | 0.025 | 0.10 | 1.22 |
| 0.11 | 0.08 | 1.73 | 4.67 | 0.017 | 0.10 | 1.29 |
| 0.12 | 0.08 | 1.00 | 1.56 | 0.051 | 0.09 | 1.13 |
| 0.11 | 0.09 | 0.99 | 1.51 | 0.057 | 0.10 | 1.16 |
| 0.11 | 0.09 | 1.10 | 1.90 | 0.048 | 0.10 | 1.10 |
| 0.11 | 0.09 | 1.12 | 1.97 | 0.048 | 0.10 | 1.05 |
| 0.12 | 0.10 | 1.10 | 1.90 | 0.051 | 0.09 | 0.93 |
| 0.12 | 0.11 | 1.31 | 2.66 | 0.040 | 0.09 | 0.86 |
Publisher’s Note: MDPI stays neutral with regard to jurisdictional claims in published maps and institutional affiliations. |
© 2021 by the authors. Licensee MDPI, Basel, Switzerland. This article is an open access article distributed under the terms and conditions of the Creative Commons Attribution (CC BY) license (https://creativecommons.org/licenses/by/4.0/).
Share and Cite
MDPI and ACS Style
Dong, S.; Salauddin, M.; Abolfathi, S.; Pearson, J. Wave Impact Loads on Vertical Seawalls: Effects of the Geometrical Properties of Recurve Retrofitting. Water 2021, 13, 2849. https://doi.org/10.3390/w13202849
AMA Style
Dong S, Salauddin M, Abolfathi S, Pearson J. Wave Impact Loads on Vertical Seawalls: Effects of the Geometrical Properties of Recurve Retrofitting. Water. 2021; 13(20):2849. https://doi.org/10.3390/w13202849
Chicago/Turabian StyleDong, Shudi, Md Salauddin, Soroush Abolfathi, and Jonathan Pearson. 2021. "Wave Impact Loads on Vertical Seawalls: Effects of the Geometrical Properties of Recurve Retrofitting" Water 13, no. 20: 2849. https://doi.org/10.3390/w13202849
Note that from the first issue of 2016, this journal uses article numbers instead of page numbers. See further details here.