Article

Technology for Upgrading the Tailwater of Municipal Sewage Treatment Plants: The Efficacy and Mechanism of Microbial Coupling for Nitrogen and Carbon Removal

1
School of Life and Environmental Sciences, Hangzhou Normal University, Hangzhou 311121, China
2
Agriculture Ministry Key Laboratory of Healthy Freshwater Aquaculture, Key Laboratory of Fish Health and Nutrition of Zhejiang Province, Zhejiang Institute of Freshwater Fisheries, Huzhou 313001, China
*
Authors to whom correspondence should be addressed.
Water 2021, 13(20), 2850; https://doi.org/10.3390/w13202850
Submission received: 14 August 2021 / Revised: 3 October 2021 / Accepted: 10 October 2021 / Published: 13 October 2021
(This article belongs to the Section Wastewater Treatment and Reuse)

Abstract

:
The efficient removal of carbon (COD) and nitrogen (NH3-N) is vital to improving tailwater from municipal wastewater treatment plants. In this study, denitrification and decarburization bacteria with stable removal efficiencies were introduced into a membrane bioreactor (MBR) for 45 days of field experiments in a QJ Wastewater Treatment Plant (Hangzhou, China) to enhance carbon and nitrogen removal. After adding the decarbonization microorganisms into the denitrification reactor, COD removal increased from 31.2% to 80.2%, while compared to the same MBR with only denitrification microorganisms, the removal efficiency of NH3-N was greatly increased from 76.8% to 98.6%. The results of microbial analysis showed that the cooccurrence of Proteobacteria and Bacillus with high abundance and diverse bacteria, such as Chloroflexi, with autotrophic decarburization functions might account for the synchronous high removal efficiency for NH3-N and COD. This technology could provide a reference for industrial-scale wastewater treatment with the goal of simultaneous nitrogen and carbon removal.

Highlights

  • Coupling nitrogen and carbon removal microorganisms in an MBR is a promising technology for improving the tailwater of municipal sewage treatment plants.
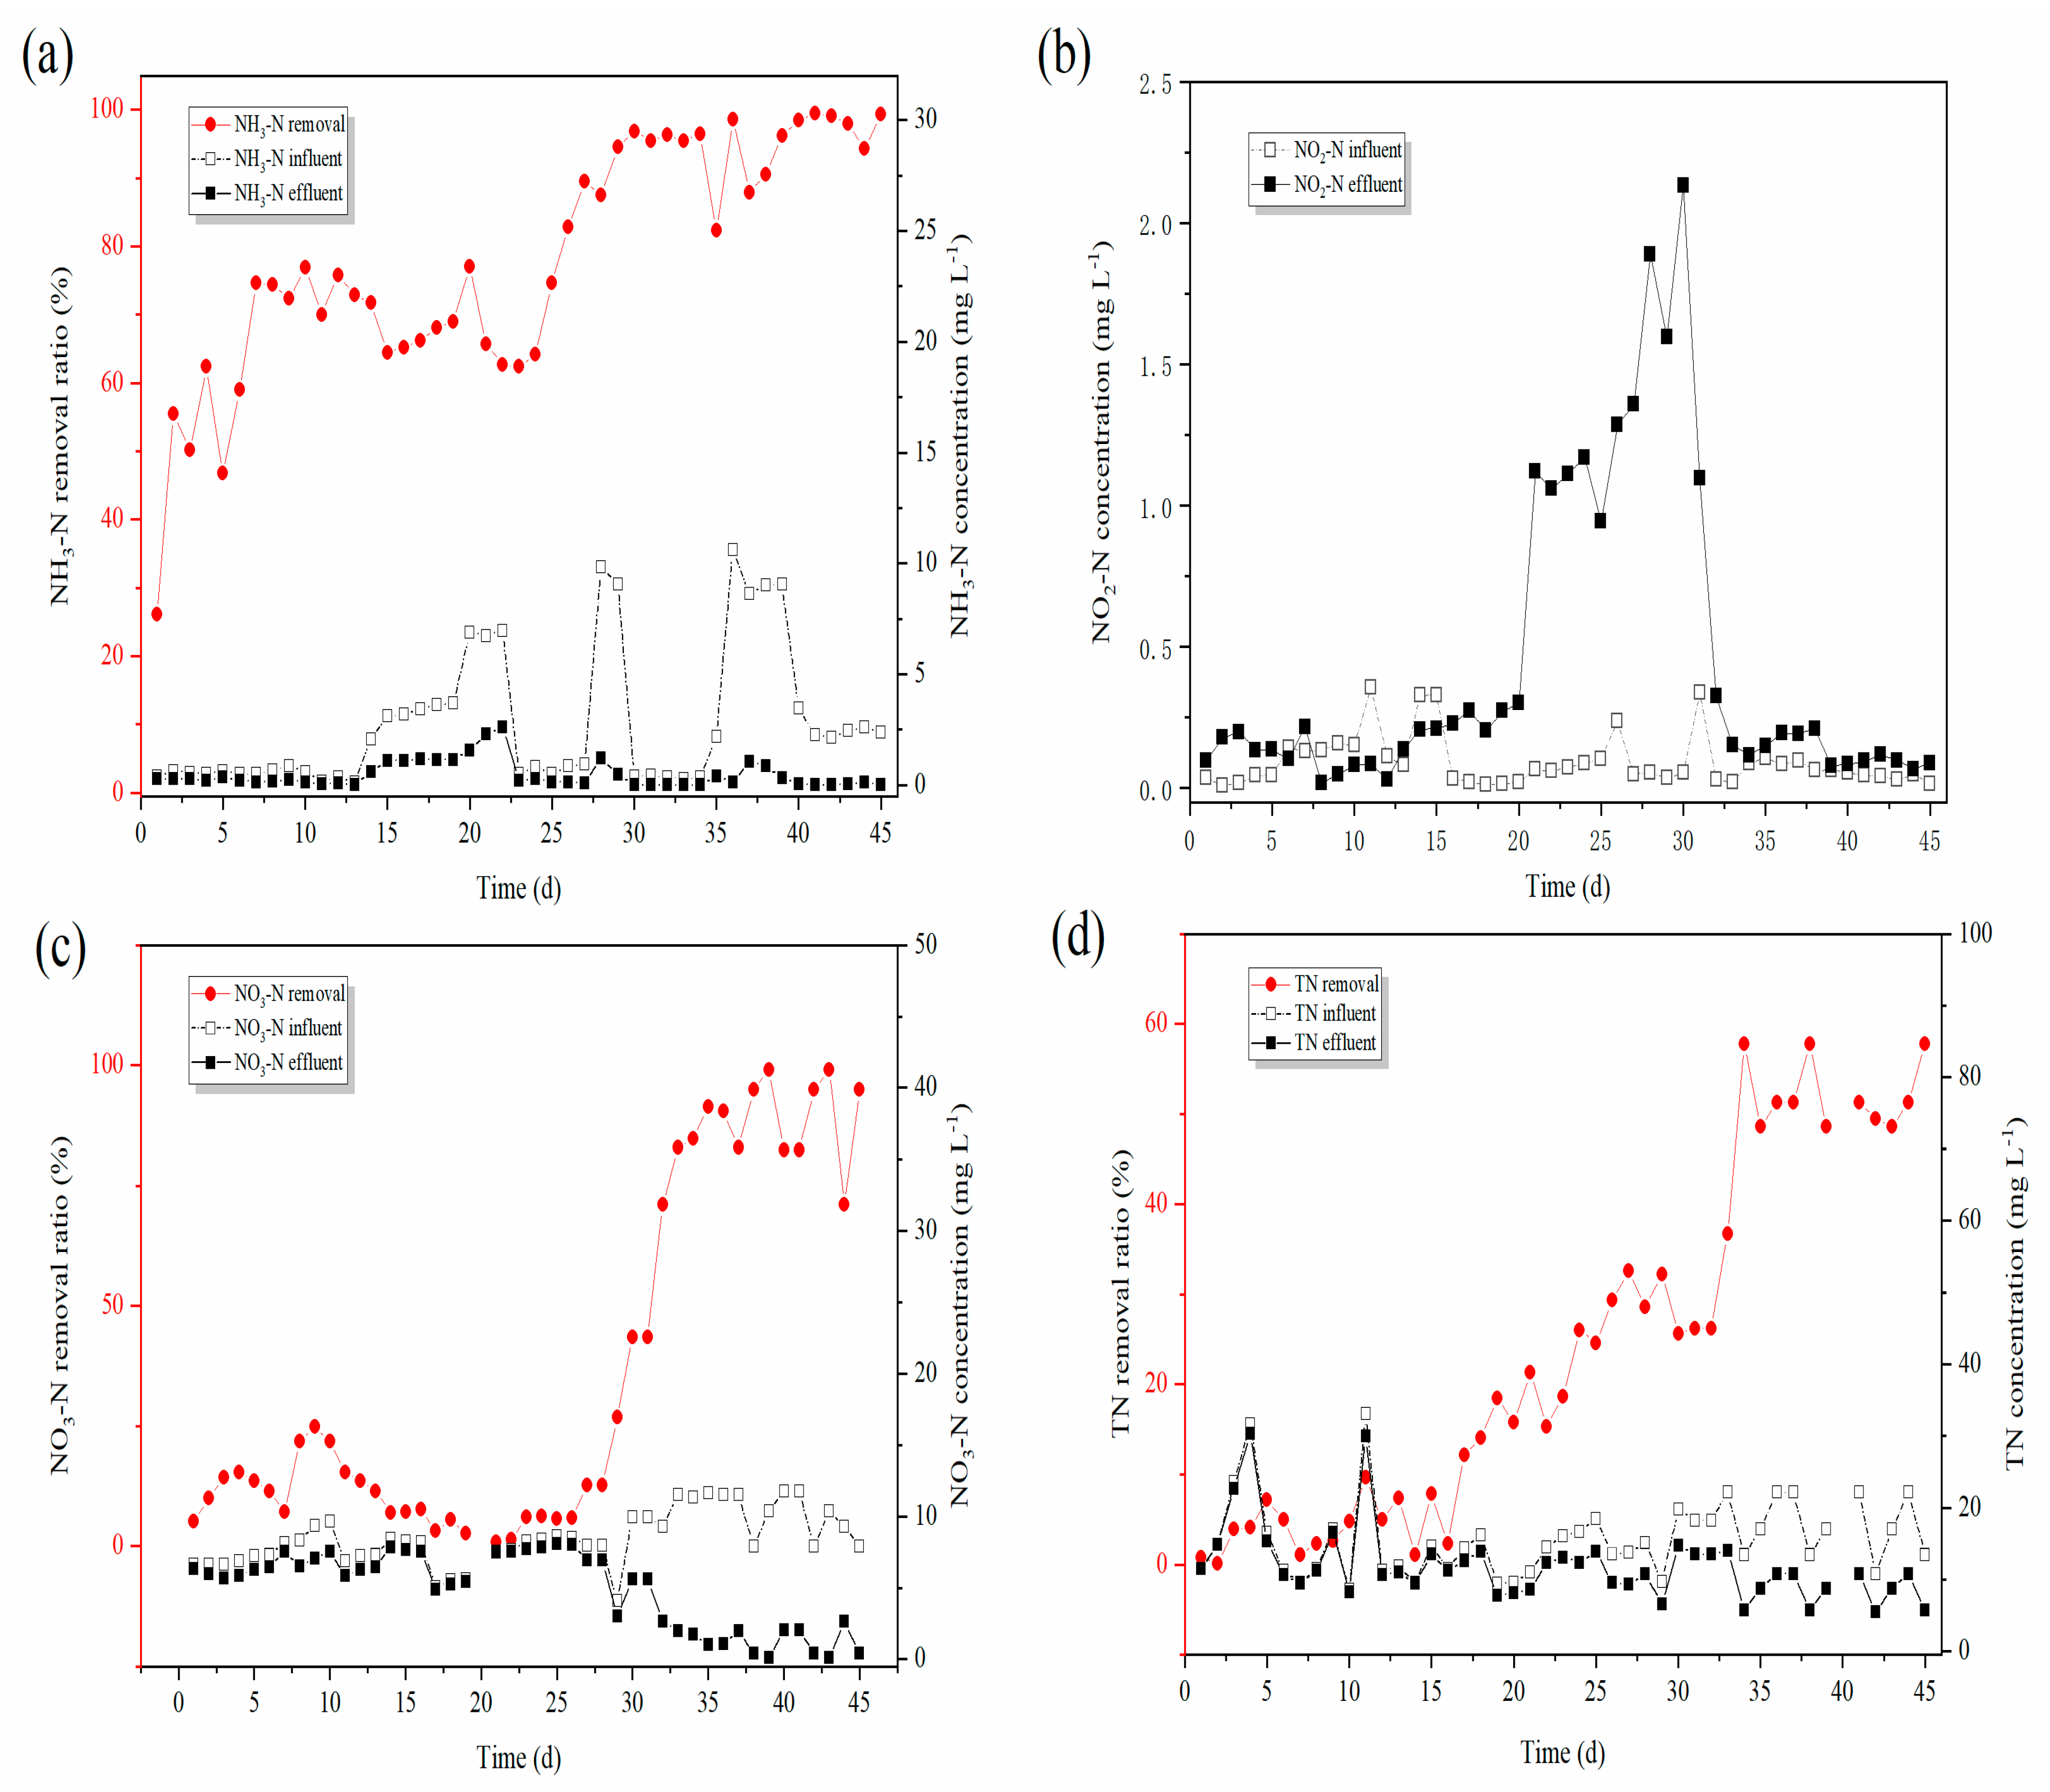
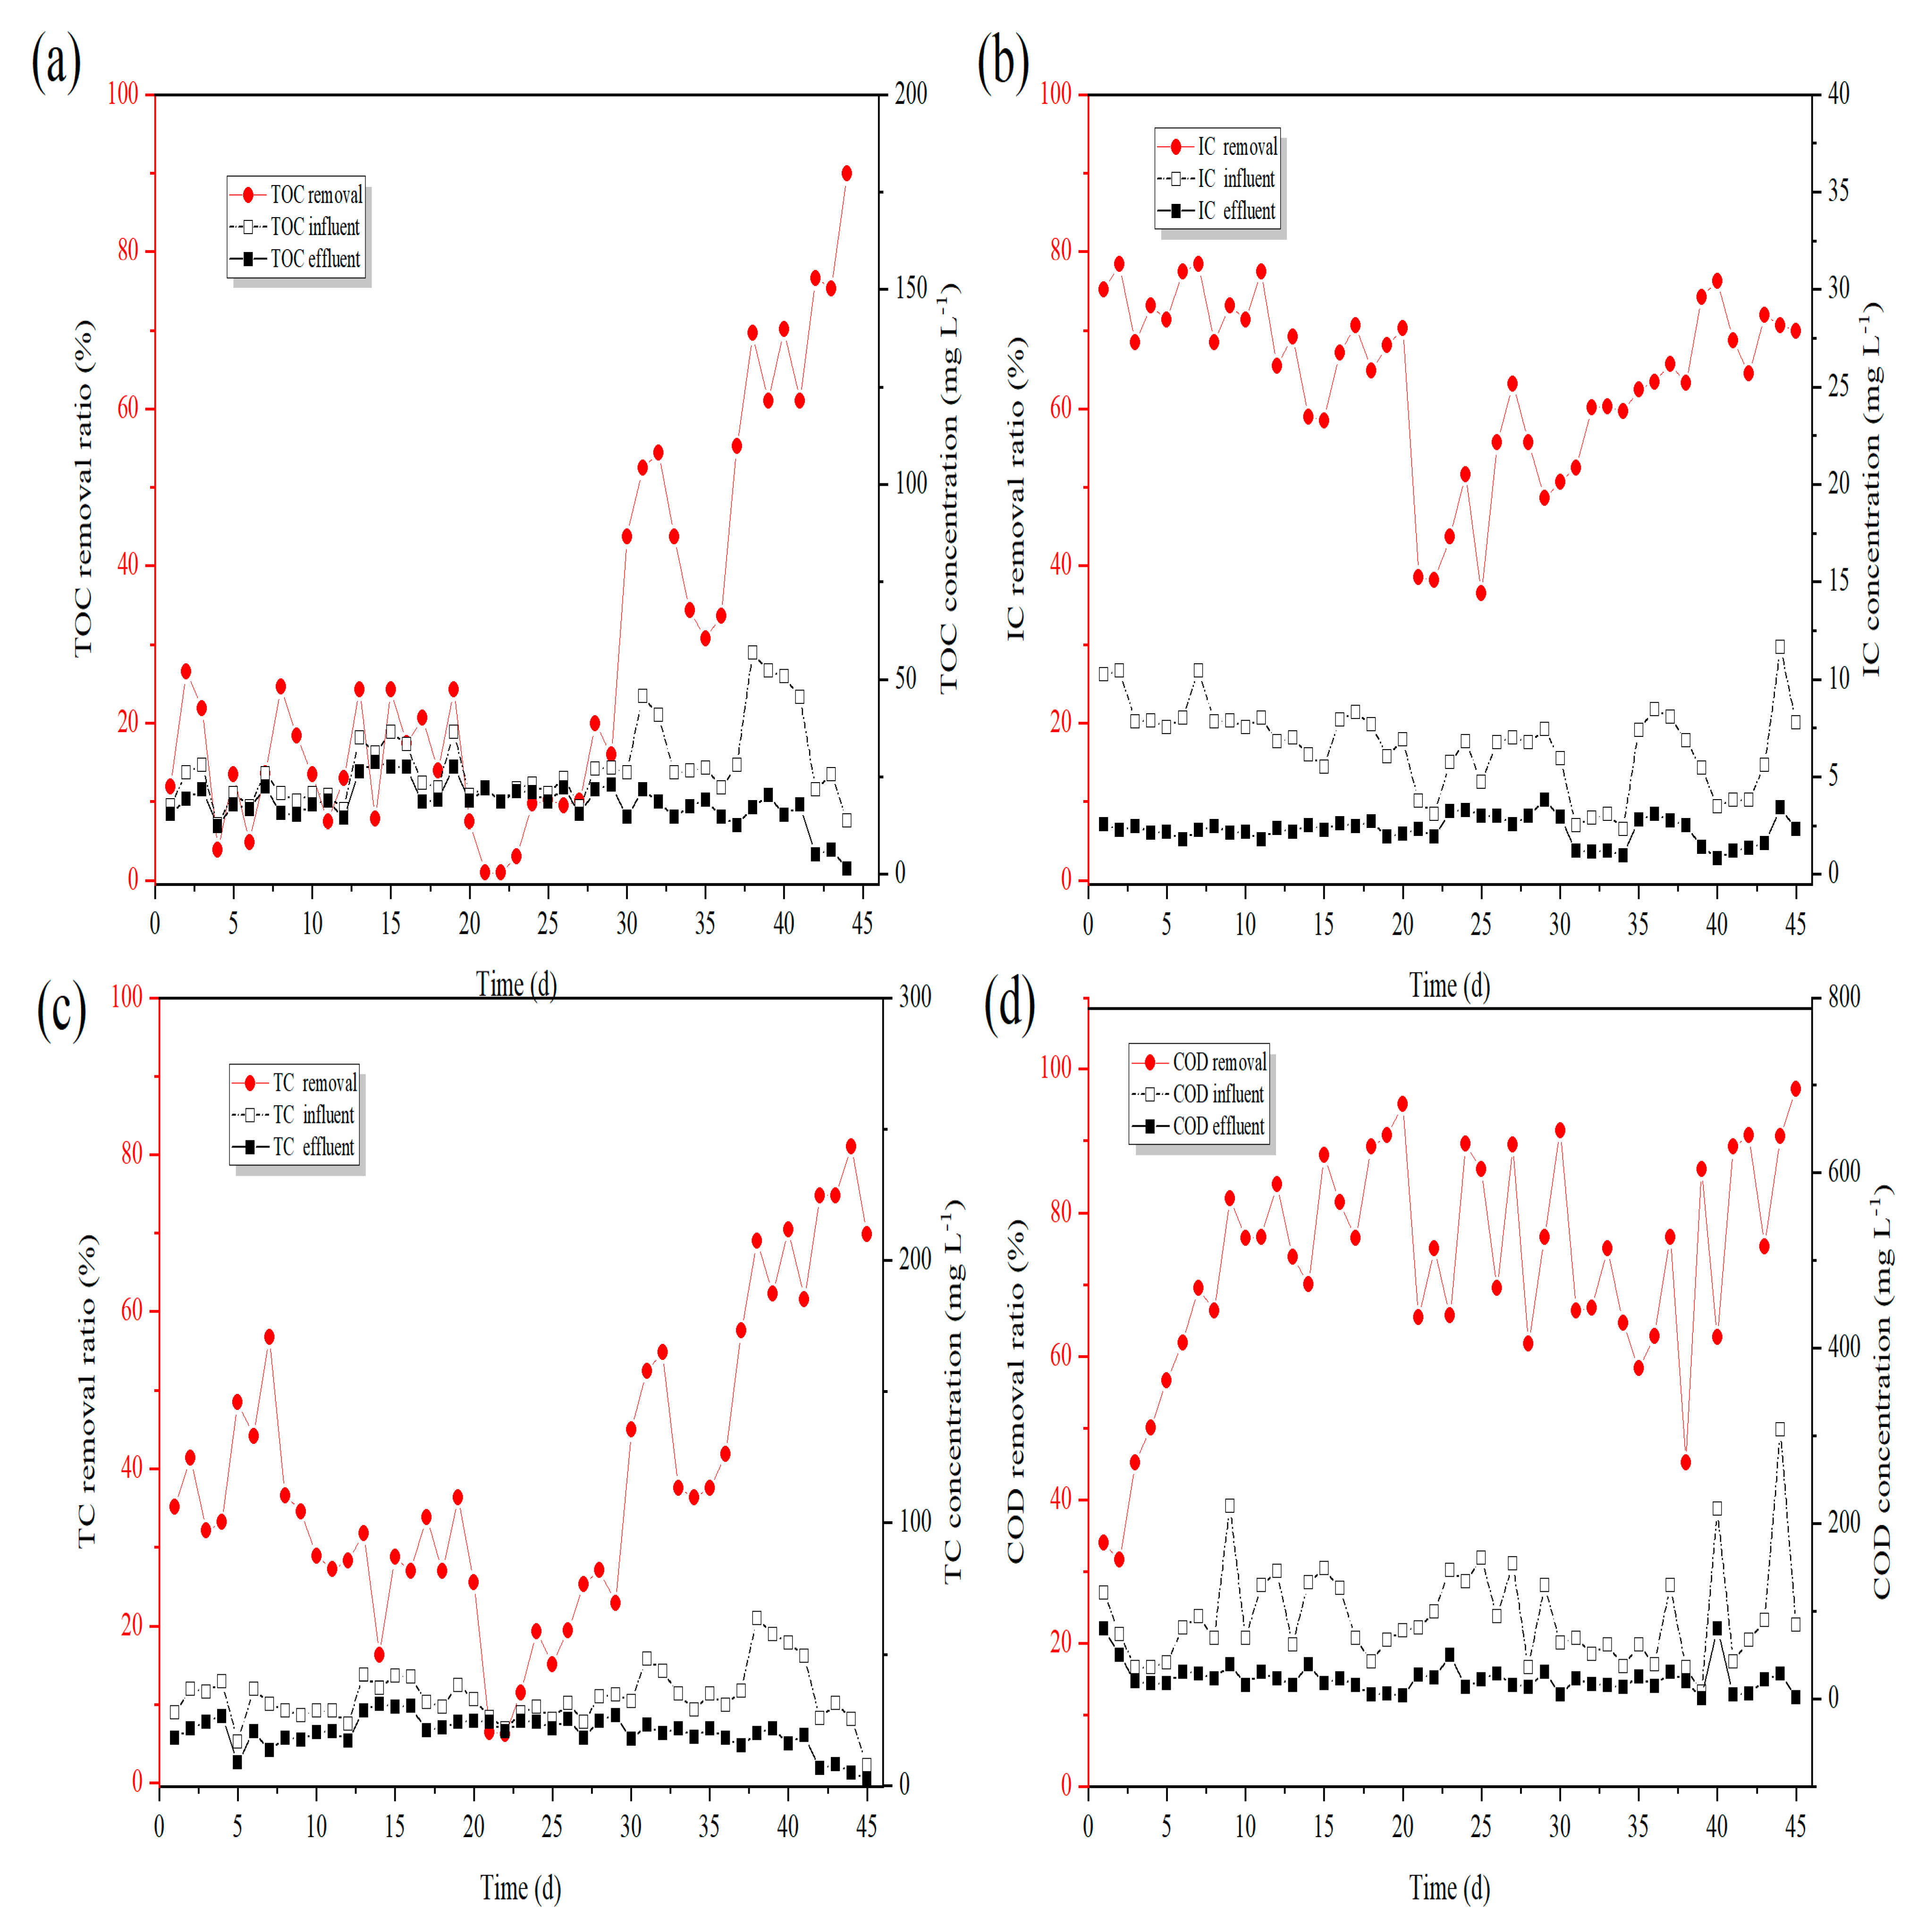
  • The reactor showed stable simultaneous denitrification and carbon removal functions. The removal of NH3-N was 98.63%, and the removal of COD was 80.2%.
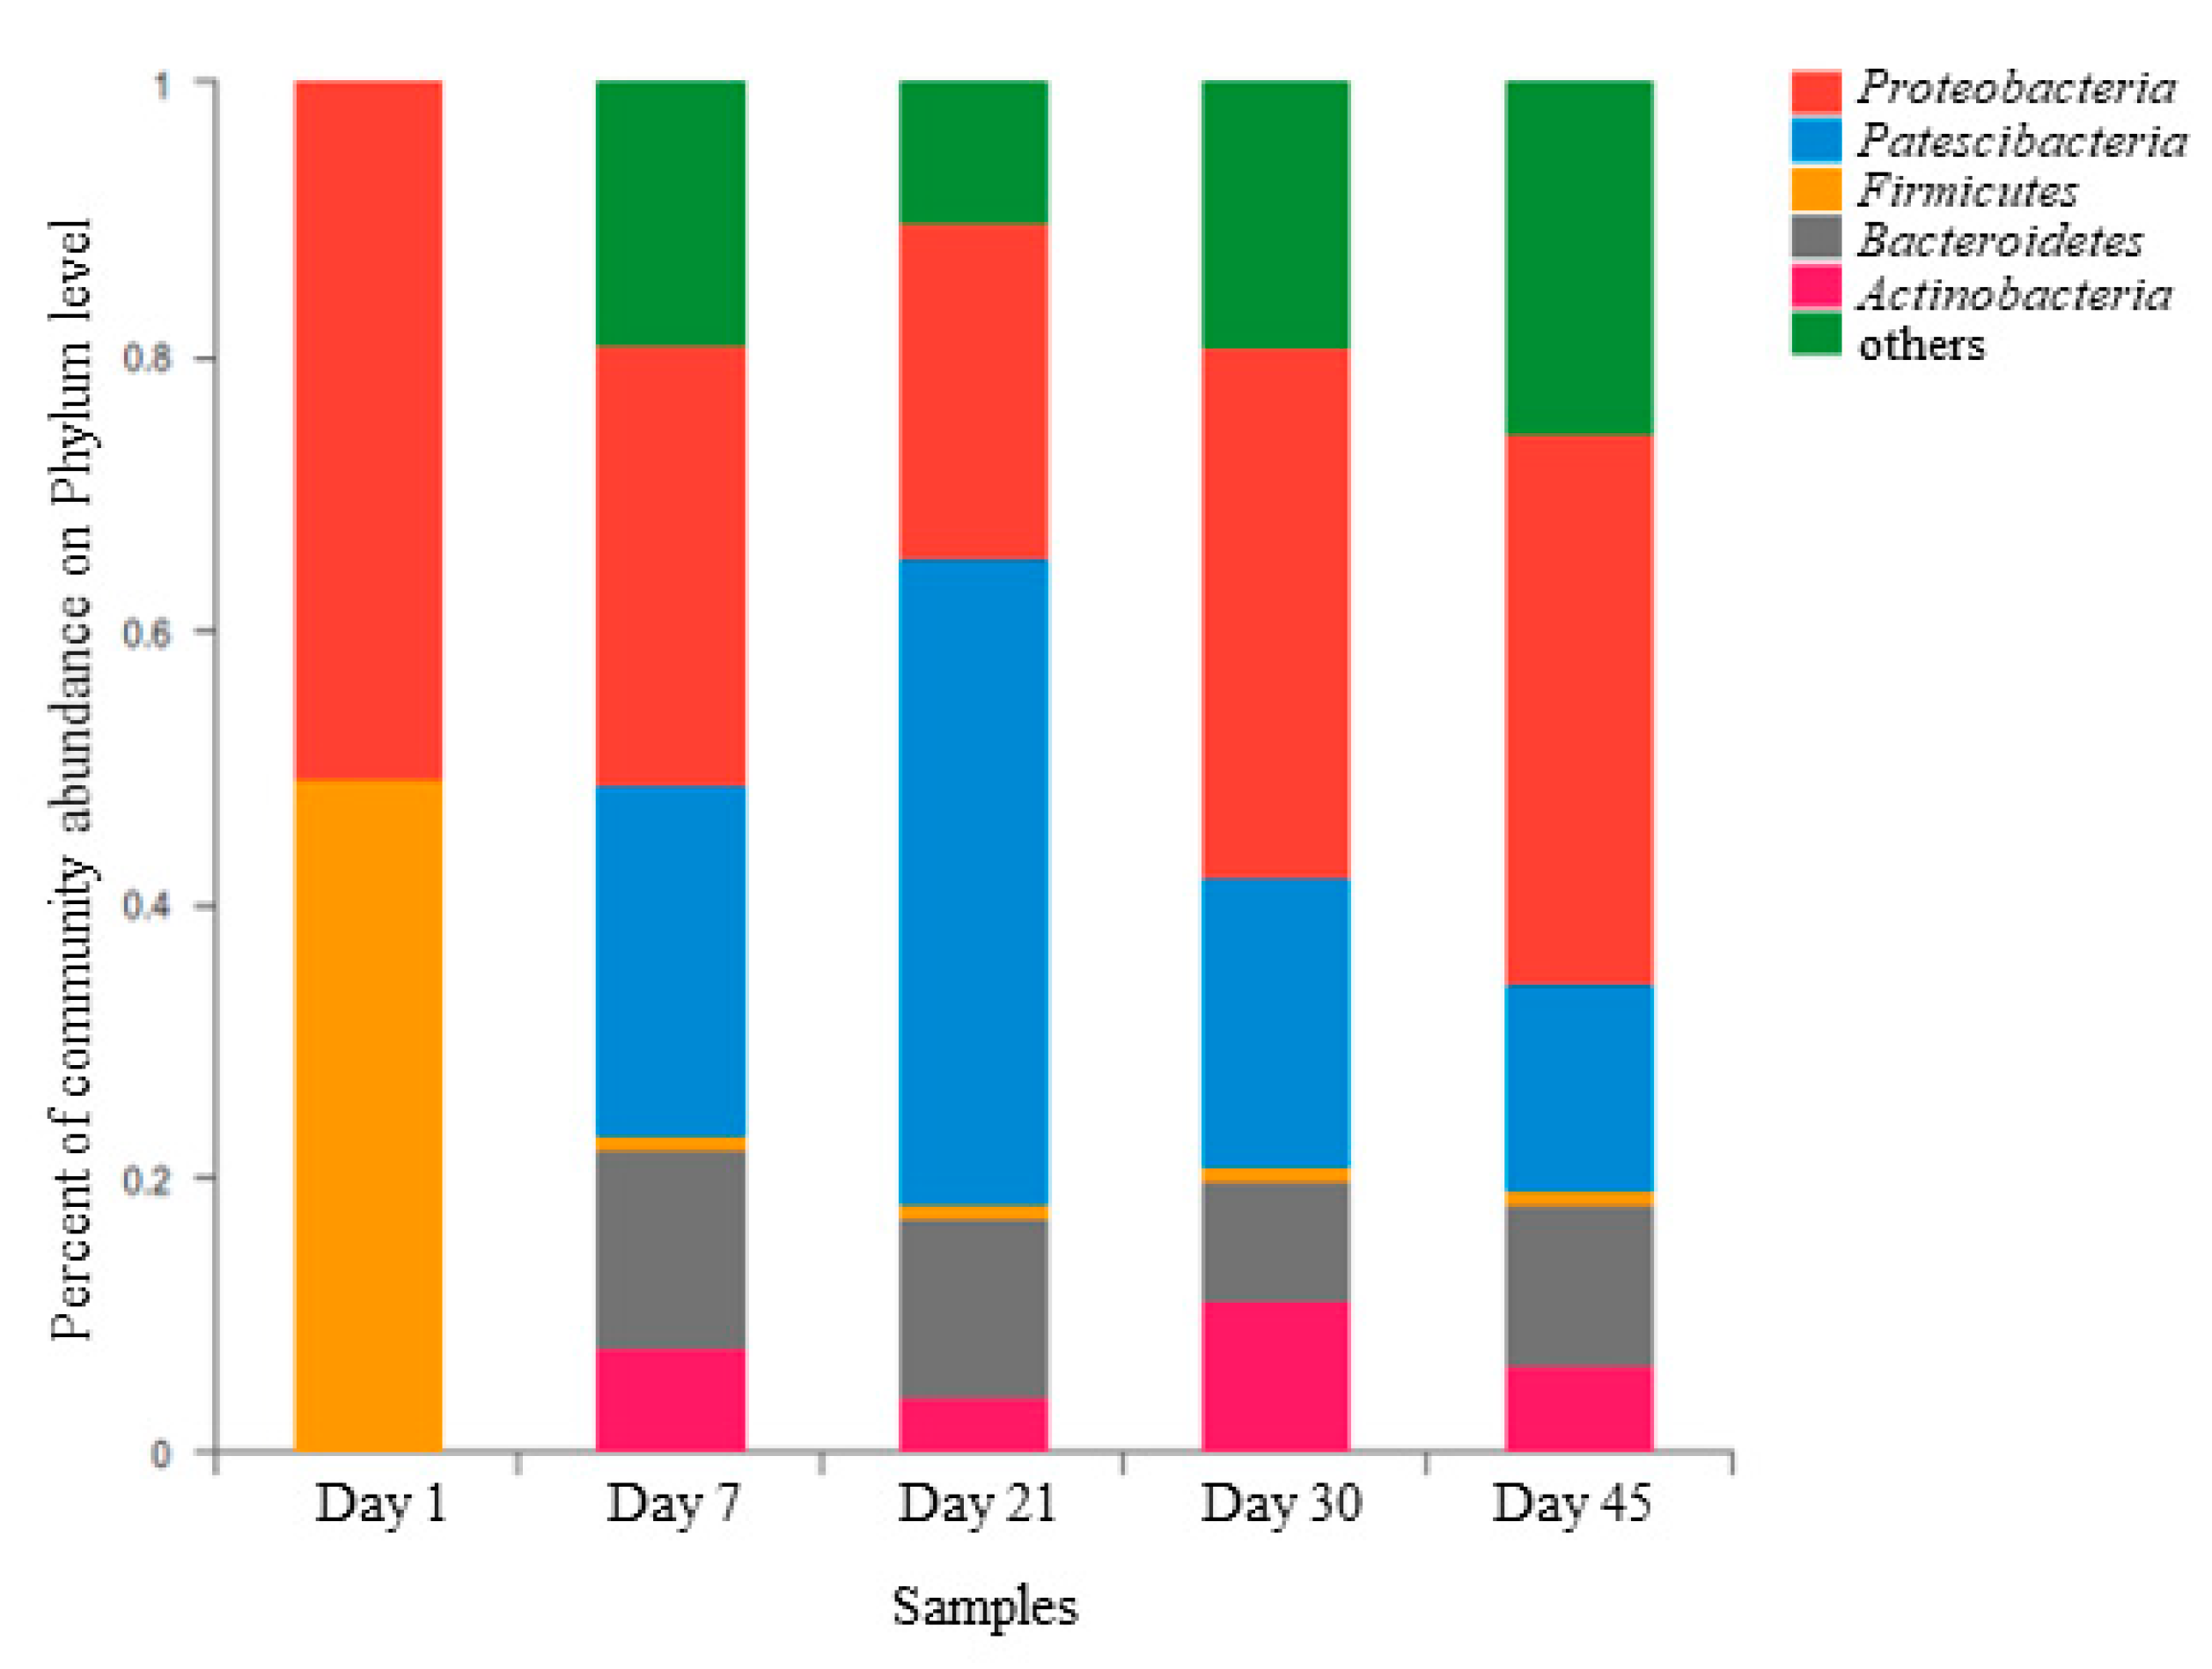
  • The two microorganisms coexisted in the reactor to form a relatively rich microbial community.
  • The cooccurrence of Proteobacteria and Bacillus with Chloroflexi might have accounted for the synchronous high removal efficiency of NH3-N and COD.

1. Introduction

Since 2013, China has successively promulgated a number of laws and regulations to solve a series of environmental problems, including water pollution, and set clear standards for the emissions of nutrients, such as carbon and nitrogen, in terms of water quality management. Zhejiang Province has a well-developed river network, and as water consumption has gradually increased with rapid economic development, water pollution in this area has become increasingly serious. Therefore, Zhejiang Province was the first province in China to propose “five water treatments” and has been improving the management model to enhance the quality of the aquatic environment to a certain extent in recent years. At present, there is only one municipal sewage treatment plant in each city of Zhejiang Province, and all tailwater is discharged into natural water bodies directly after reaching the standards. For example, the sewage treatment plant in Hangzhou (the QJ sewage plant) has a water treatment capacity of 300,000 t d−1. Although the concentrations of pollutants in wastewater reach the required standards, the total discharge of NH3-N and COD reaches 1.48 × 10³ g d−1 and 1.47 × 10⁴ g d−1, respectively, which is a huge amount that could cause serious eutrophication. To ensure the ecological safety of receiving water bodies, there is currently an important demand for technology and equipment that enable denitrification and decarbonization.
Recently, scholars have conducted in-depth and extensive research in the field of biological denitrification and made breakthroughs over traditional theories and technologies. Bioaugmentation [1,2], as an effective biological treatment technology, can significantly improve the degradation of specific pollutants by adding specific microorganisms to the biological treatment system. Crini et al. [3] added aerobic denitrifying bacteria acclimated under low-temperature conditions to a pilot plant for bio-enhancement and found that after enhancement, the NH3-N effluent stabilized at 1 mg L−1; another study [4] also found that the total nitrogen (TN) effluent stabilized at 10 mg L−1, and compared with that under the sewage treatment plant, the removal of NH3-N and TN increased by 3.71% and 23.18%, respectively. With the invention of biological membrane reactors or membrane bioreactors (MBRs) [5], wastewater treatment technology climbed to another level. Technologies based on MBRs can be used for many applications [6], such as industrial and municipal wastewater treatment, as well as water treatment [7]. Hu et al. [8] simultaneously combined nitrifying and denitrifying bacteria and aerobic denitrifying bacteria in MBRs to form a microecological inoculant, which was added directly to micro-polluted water for in-situ bio-enhancement, and the removal rate of nitrate and TN improved significantly. The MBRs not only has high quality of treated wastewater [9] but also has smaller reactor volume due to the higher sludge concentration used and smaller amount of extra sludge produced. MBRs are currently the best available technology (BAT) for wastewater treatment [10,11]. Combine it with functional denitrification and carbon removal microorganisms, and there will be unexpected new discoveries in the treatment of actual sewage.
Therefore, there is a certain theoretical basis for the application of specific microorganisms in water treatment technology [12]. However, current related studies have mainly focused on the removal of nitrogen or carbon [13,14]. The small number of studies on the simultaneous removal of nitrogen and carbon have utilized small-scale laboratory tests [15,16]; there are few reports at the scale of pilot and factory tests, and it is more practical to realize the simultaneous removal of carbon and nitrogen with certain equipment in a complex and changeable actual environment [17].
To understand the changes in the denitrification and carbon removal performance of the reactor before and after the coupling of functional microorganisms under actual wastewater treatment conditions as well as the evolution of the dominant bacteria in the system, this study conducted a continuous flow experiment in the reactor of the QJ Sewage Treatment Plant. Nitrogen, carbon, and chemical oxygen demand (COD) removal as well as the abundance and diversity of microbial communities and other aspects and the changes in the coupled denitrification and decarbonization biofilm reactor were studied. The results aid in a better understanding of the mechanism of simultaneous nitrogen and carbon removal in MBR systems. The development of a suitable and high-efficiency, upgraded sewage treatment technology can minimize water pollution, which is of great significance to protect aquatic resources and promote the coordinated development of resources and the environment.

2. Materials and Methods

2.1. MBR Setup and Operation

The actual wastewater treatment process was conducted in an MBR. The effluent of the sewage plant was connected to the inlet of the MBR. The reaction volume of the MBR was 100 L (60 × 140 × 70 cm). Five hollow-fiber membrane modules composed of polyethylene were installed in the MBR. The mean pore size of the hollow-fiber membranes was less than 0.1 μm. An aeration system (aeration rate of 0.2 m3 h−1) was placed at the bottom of the reactor to maintain the dissolved oxygen (DO) concentration at 2–4 mg L−1. With a focus on start-up time, the hydraulic residence time (HRT) of the MBR was maintained at 1 h, and the suction mode was 8-min “start” and 2-min “stop”. When the membrane pressure of the MBR reached 1.0 kPa, the membrane was physically cleaned with pure water to remove the bio-cake layer and recover its permeability.

2.2. Seed Microbial Community

The main denitrification and decarburization microbial community was obtained from the denitrification reactor and decarburization reactor in our laboratory. Denitrification microorganisms were added to the MBR, and the day (day 1) was recorded at the start of the experiment. From day 21 onwards, the same volume of decarburization microorganisms was added to the MBR. The amount of inoculated sludge was 500 mL.

2.3. Water Quality Analytical Parameters

The experiment continued for 45 days. Water samples from the influent and the effluent were collected every day for physical and chemical analyses, and the ammonia nitrogen (NH3-N), nitrous nitrogen (NO2-N), nitrate nitrogen (NO3-N), total nitrogen (TN), total organic carbon (TOC), inorganic carbon (IC), total carbon (TC) and chemical oxygen demand (COD) concentrations were determined following the Standard Methods for the Examination of Water and Wastewater [18]; pH was measured by a digital acidity meter (pHS-9 V); and dissolved oxygen (DO) was detected with a dissolved oxygen meter (YSI550A). The above indicators are all abbreviated below.

2.4. Microbial Community Analysis

The bacteriological analysis was performed on samples taken from the MBR and included qualitative and quantitative evaluation of the microbial community. Five microbial samples were collected during the experimental period. The samples were named by the sampling time point: on the first day of operation, denitrification microorganisms were added to the reactor (day 1); the denitrification reactor was running stably (day 7), decarbonization microorganisms were added (day 21), the coupled microbial reactor was stabilized (day 30), and the experiment was ended (day 45).
The microbial communities were analyzed using high-throughput sequencing via the method implemented by Huang et al. [19]. The V3–V4 region of the bacterial 16S ribosomal RNA gene was amplified by polymerase chain reaction (PCR) using the 515F (5′-GTGCCAGCMGCCGCGG-3′) and 907R (5′-CCGTCAATTCMTTTRAGTTT-3′) primers. High-throughput sequencing analysis was conducted by Persona Bio Company (Shanghai, China). We used an Illumina MiSeq platform to sequence the amplicons. All the data were analyzed on the free online platform at https://www.genescloud.cn (accessed on 30 December 2020).

3. Results

3.1. The Performance of the MBR in Nitrogen and Carbon Removal

3.1.1. Changes in Denitrification Performance

During the test period, the NH3-N, NO2-N, NO3-N, and TN of the reactor influent and effluent water were tested. The changes in the nitrogen removal rate are shown in Figure 1. As shown in Figure 1a, the change in NH3-N shows an overall steady upward trend. In the early stage of reactor operation, the removal rate of NH3-N continued to increase. From the 7th day, the removal rate of NH3-N was maintained at approximately 76.8%. After the 21st day (addition of decarburization microorganisms), the removal rate of NH3-N by the reactor declined to a certain extent but then showed an upward trend. Starting at 30 days, the NH3-N removal rate stabilized and increased significantly. The effluent NH3-N content was significantly reduced, with an average removal rate of 95.6% and a maximum removal rate of 98.6%. As shown in Figure 1c, the removal rate of NO3-N basically remained at a stable low level before 21 days, and the average removal rate was approximately 10%. After 21 days, the removal rate of NO3-N showed an upward trend. After 30 days, it remained at 80.2%. As shown in Figure 1d, the TN removal rate and NO3-N had a similar trend, gradually increasing from 21 days, and finally, the average removal rate of TN stabilized at 59.9%. As shown in Figure 1b, during this period, the NO2-N concentration in the effluent from the reactor was maintained at a low value and only accumulated from 21 to 30 days. After 30 days, the NO2-N in the effluent was basically below the detection limit.

3.1.2. Changes in Decarburization Performance

For the removal of carbon elements, as shown in Figure 2a–c, the average removal rate of TOC (Figure 2a) was maintained at approximately 9.5% before day 21. Starting from day 21, it first decreased and then continued to rise to 89.2%. The removal (Figure 2b) basically remained in a stable state during the reaction period and quickly returned to the original level after a slight decrease on day 21, and the average removal rate remained at 62.5%. The trend of TC was basically the same as that of TOC. The average removal rate was approximately 37.6% before day 21. Starting from day 21, the removal rate of TC continued to rise, reaching a maximum of 80.2%.
The COD changes are shown in Figure 2d. Under actual conditions, the COD of wastewater influent fluctuates between 80–300 mg L−1. When the reactor just started operating, the COD removal rate was only 31.2%. The removal rate gradually increased and rose to a stable value around the 9th day. After the addition of decarburization microorganisms on day 21, the COD removal rate decreased slightly, but it quickly recovered steadily, and subsequently, the COD changes in the influent water did not cause severe fluctuations in the effluent concentration. The COD concentration of the effluent in this experiment was stabilized at approximately 23.8 mg L−1, and the average removal rate of COD was maintained at approximately 82%.
In this experiment, after the co-processing of denitrification and decarbonization bacteria, the indicators of the effluent of the reactor were kept at a low level, which already fulfills the pollutant emission standards implemented in China (effluent NH3-N ≤ 5 mg L−1, COD ≤ 80 mg L−1).

3.2. Analysis of the Microbial Community

3.2.1. Diversity of the Microbial Community

In this experiment, the coverage rates of the five groups of microbial sequencing samples were all greater than 0.99, ensuring the accuracy of the sequencing results. Shannon and Simpson indices were utilized to represent sample diversity, and Ace and Chao indices were used to represent sample richness. The values of the α-diversity indices (Chao, Shannon, Simpson, and ACE) are shown in Table 1. The Shannon index first increased from 2.04 (day 1) to 6.13 (day 7); on day 21, it fell to 5.52 and then increased from 5.78 (day 30) to 6.09 (day 45). The Simpson index changed from 0.18 (day 1) to 0.01 (day 7) to 0.02 (day 30). The ACE and Chao1 values had a similar trend as the Shannon index and increased from 42.57 and 40.25 to 2644.82 and 2631.45, respectively.

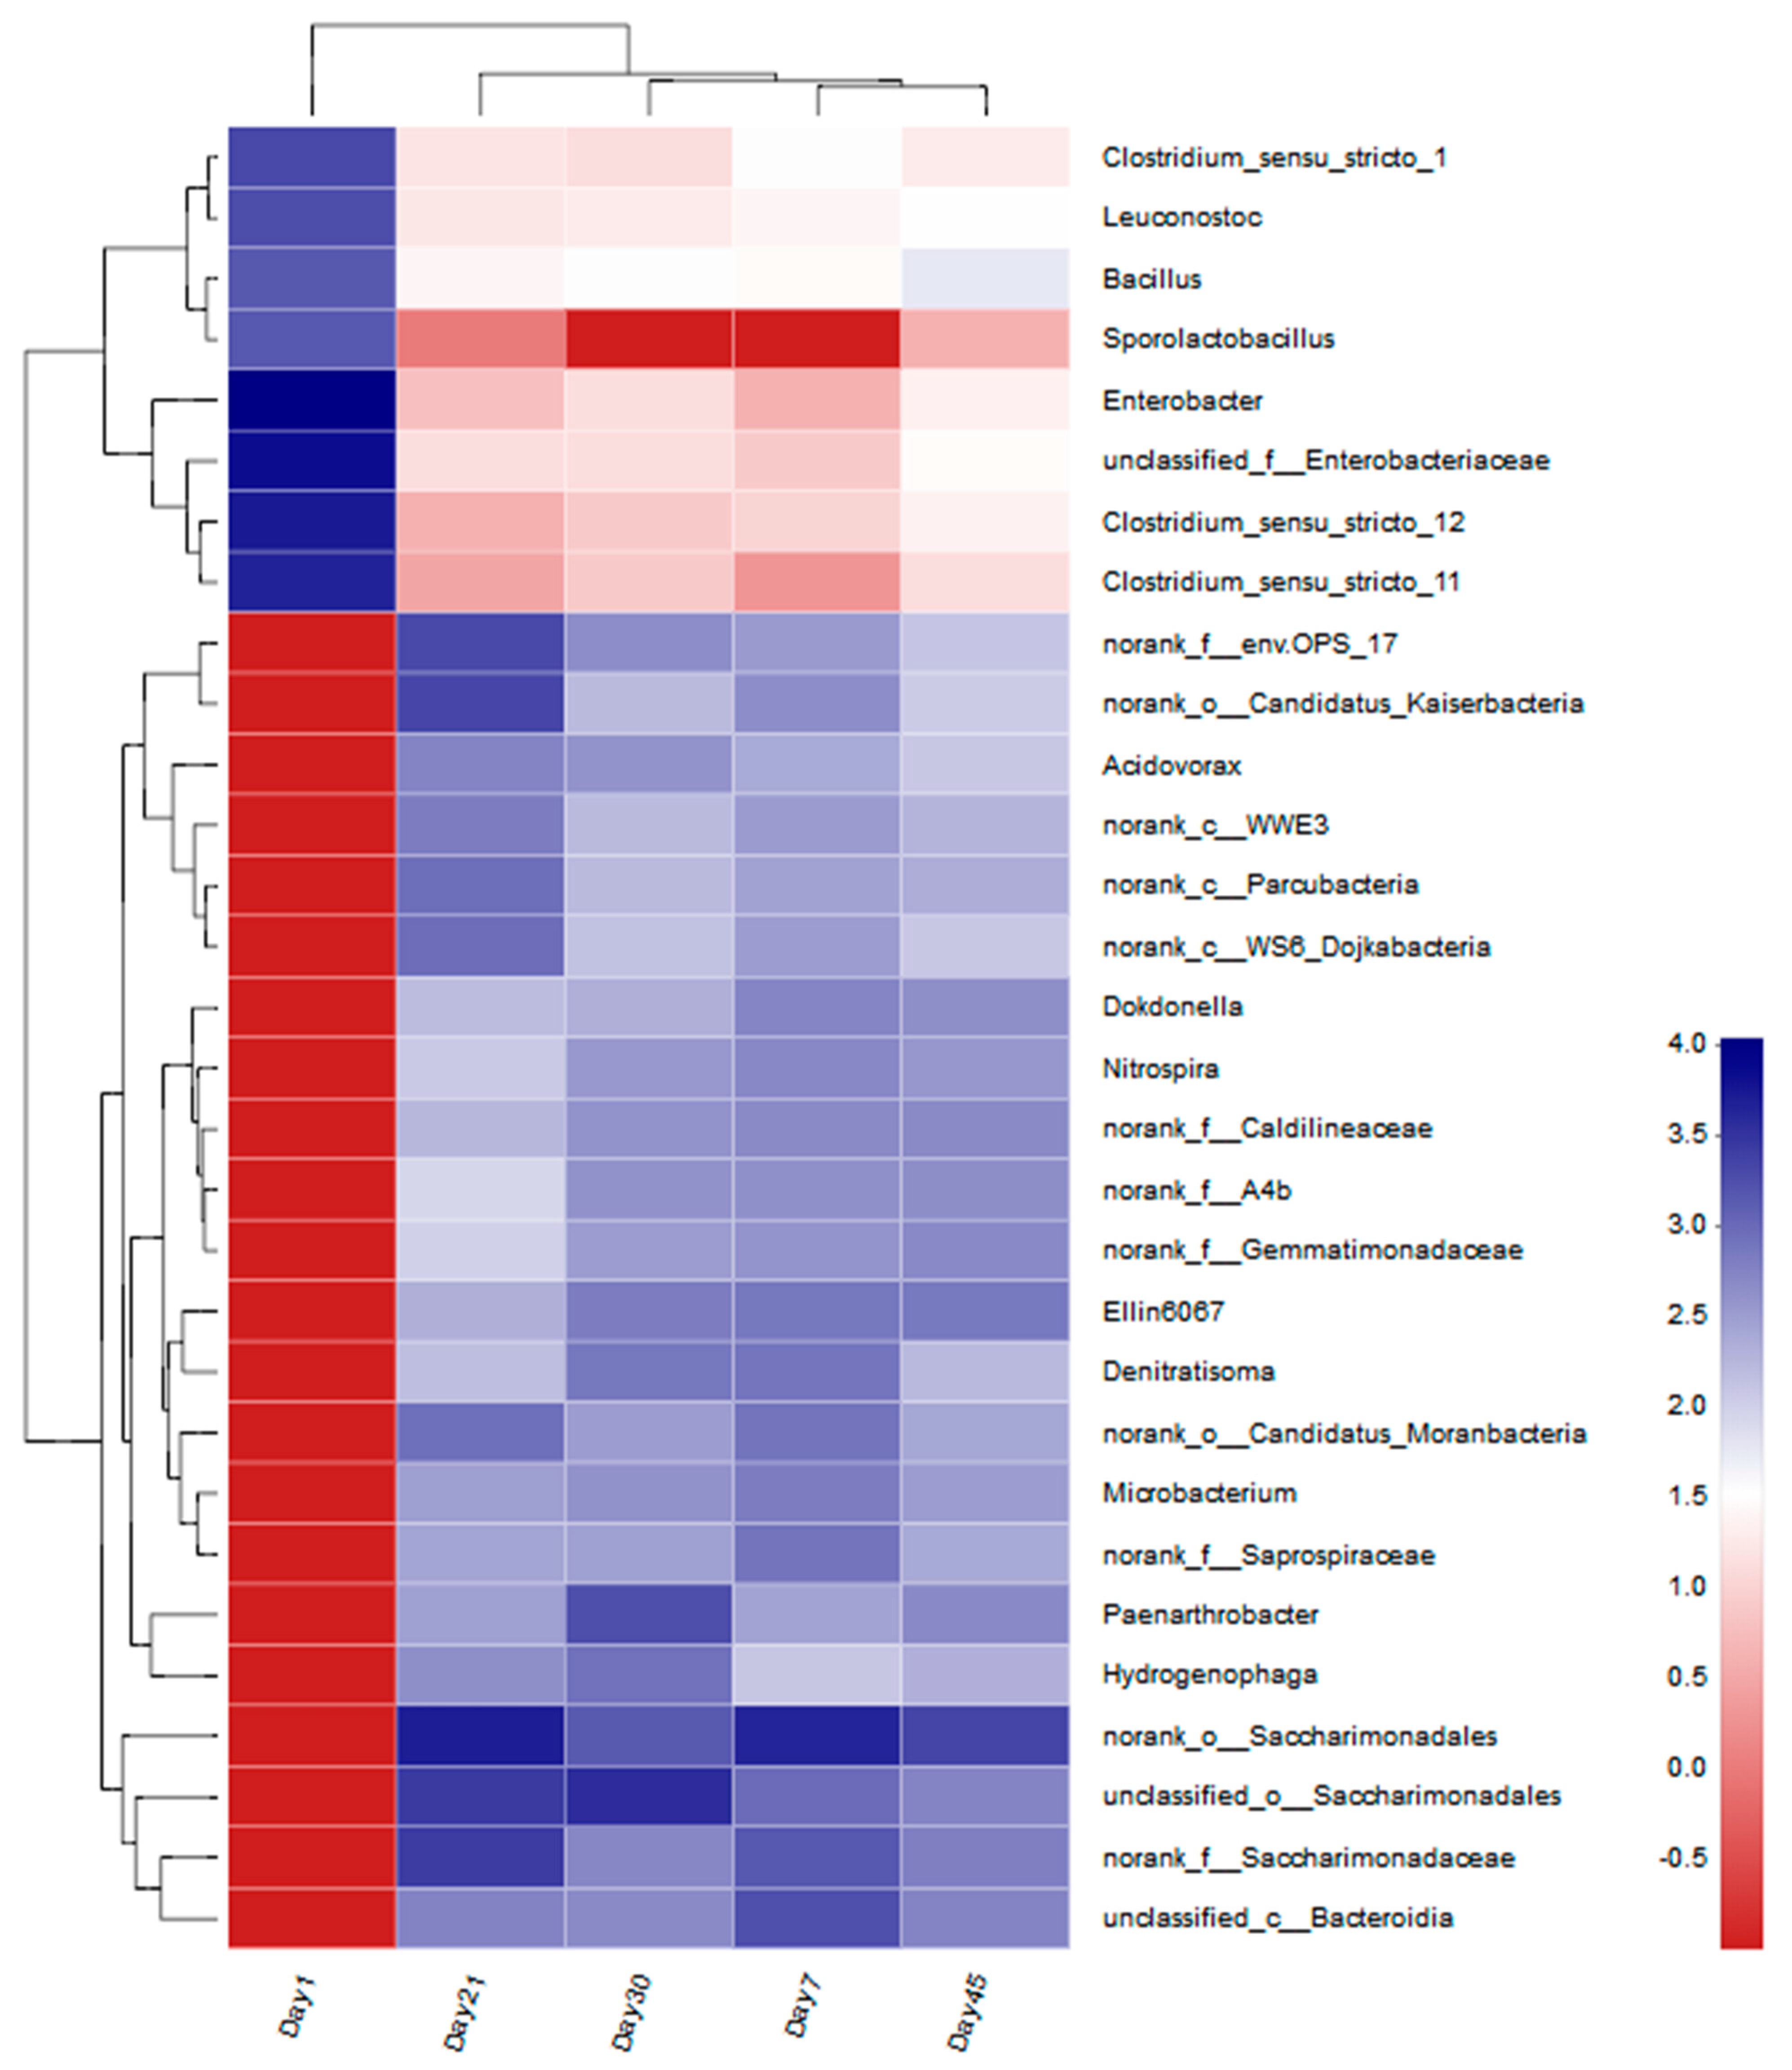
3.2.2. Composition of the Microbial Community

The microbial phyla detected at a relative abundance > 1% were considered the main phyla, and the community species composition information and relative abundance information of microorganisms at the phylum level in different experimental stages are shown in Figure 3. During the entire experiment, the composition and abundance of microorganisms underwent major changes. The dominant bacterial phyla changed from Proteobacteria and Firmicutes to Proteobacteria, Patescibacteria, Firmicutes, Bacteroidetes, and others. However, while the abundance of other bacterial phyla gradually increased, the abundance of Firmicutes decreased significantly.
Figure 4 shows the changes in the composition and structure of the dominant bacteria in different samples more clearly. The main dominant bacteria were Proteobacteria, Patescibacteria, Firmicutes, Bacteroidetes, Acitinobacteroidetes, Chloroflex, and Acidobacteria. In the early stage of reactor operation (day 1), the predominant phyla were Proteobacteria and Firmicutes, and their relative abundances were 51.1% and 48.9%, respectively. On day 7, the dominant bacterial composition of the microorganisms changed significantly. The abundance of Proteobacteria in microbial samples decreased to 32%, the abundance of Firmicutes decreased to 0.88%, and other dominant bacteria began to appear, such as Patescibacteria (26%), Bacteroidetes (15%), Acitinobacteroidetes (7.5%), Chloroflex (7.2%), and Acidobacteria (4.5%).
When the reactor was fed decarburization microorganisms (day 21), the abundance of the dominant microorganisms changed significantly: the abundance of Proteobacteria decreased from 32% to 24%, the abundance of Patescibacteria increased from 26% to 47%, the abundance of Firmicutes was maintained at 0.83%, the abundance of Bacteroidetes decreased from 15% to 13%, the abundance of Acitinobacteroidetes decreased from 7.5% to 3.9%, the abundance of Chloroflexi was reduced from 7.2% to 3.9%, and the abundance of Acidobacteria decreased from 4.5% to 1.6%.
When the denitrification and decarburization microorganisms in the reactor had adapted for a period of time (day 30), the dominant bacterial composition of the microorganisms remained unchanged, but the abundance changed significantly. The abundance of Proteobacteria increased from 24% to 39%, the abundance of Patescibacteria decreased from 47% to 21%, the abundance of Firmicutes increased from 0.83% to 0.95%, the abundance of Bacteroidetes decreased from 13% to 8.7%, the abundance of Acitinobacteroidetes increased from 3.9% to 11%, the Chloroflexi abundance increased from 3.9% to 6%, and the abundance of Acidobacteria decreased from 1.6% to 3.8%.
At the end of the experiment (day 45), there was no significant change in the composition of the microbial community. The abundance of Proteobacteria increased slightly from 39% to 40%, the abundance of Patescibacteria decreased from 21% to 15%, that of Firmicutes decreased from 0.95% to 0.88%, while that of Bacteroidetes increased from 8.7% to 12%, the abundance of Acitinobacteroidetes decreased from 11% to 6.2%, the abundance of Chloroflex increased from 6% to 7.5%, and the abundance of Acidobacteria decreased from 3.8% to 6.8%.

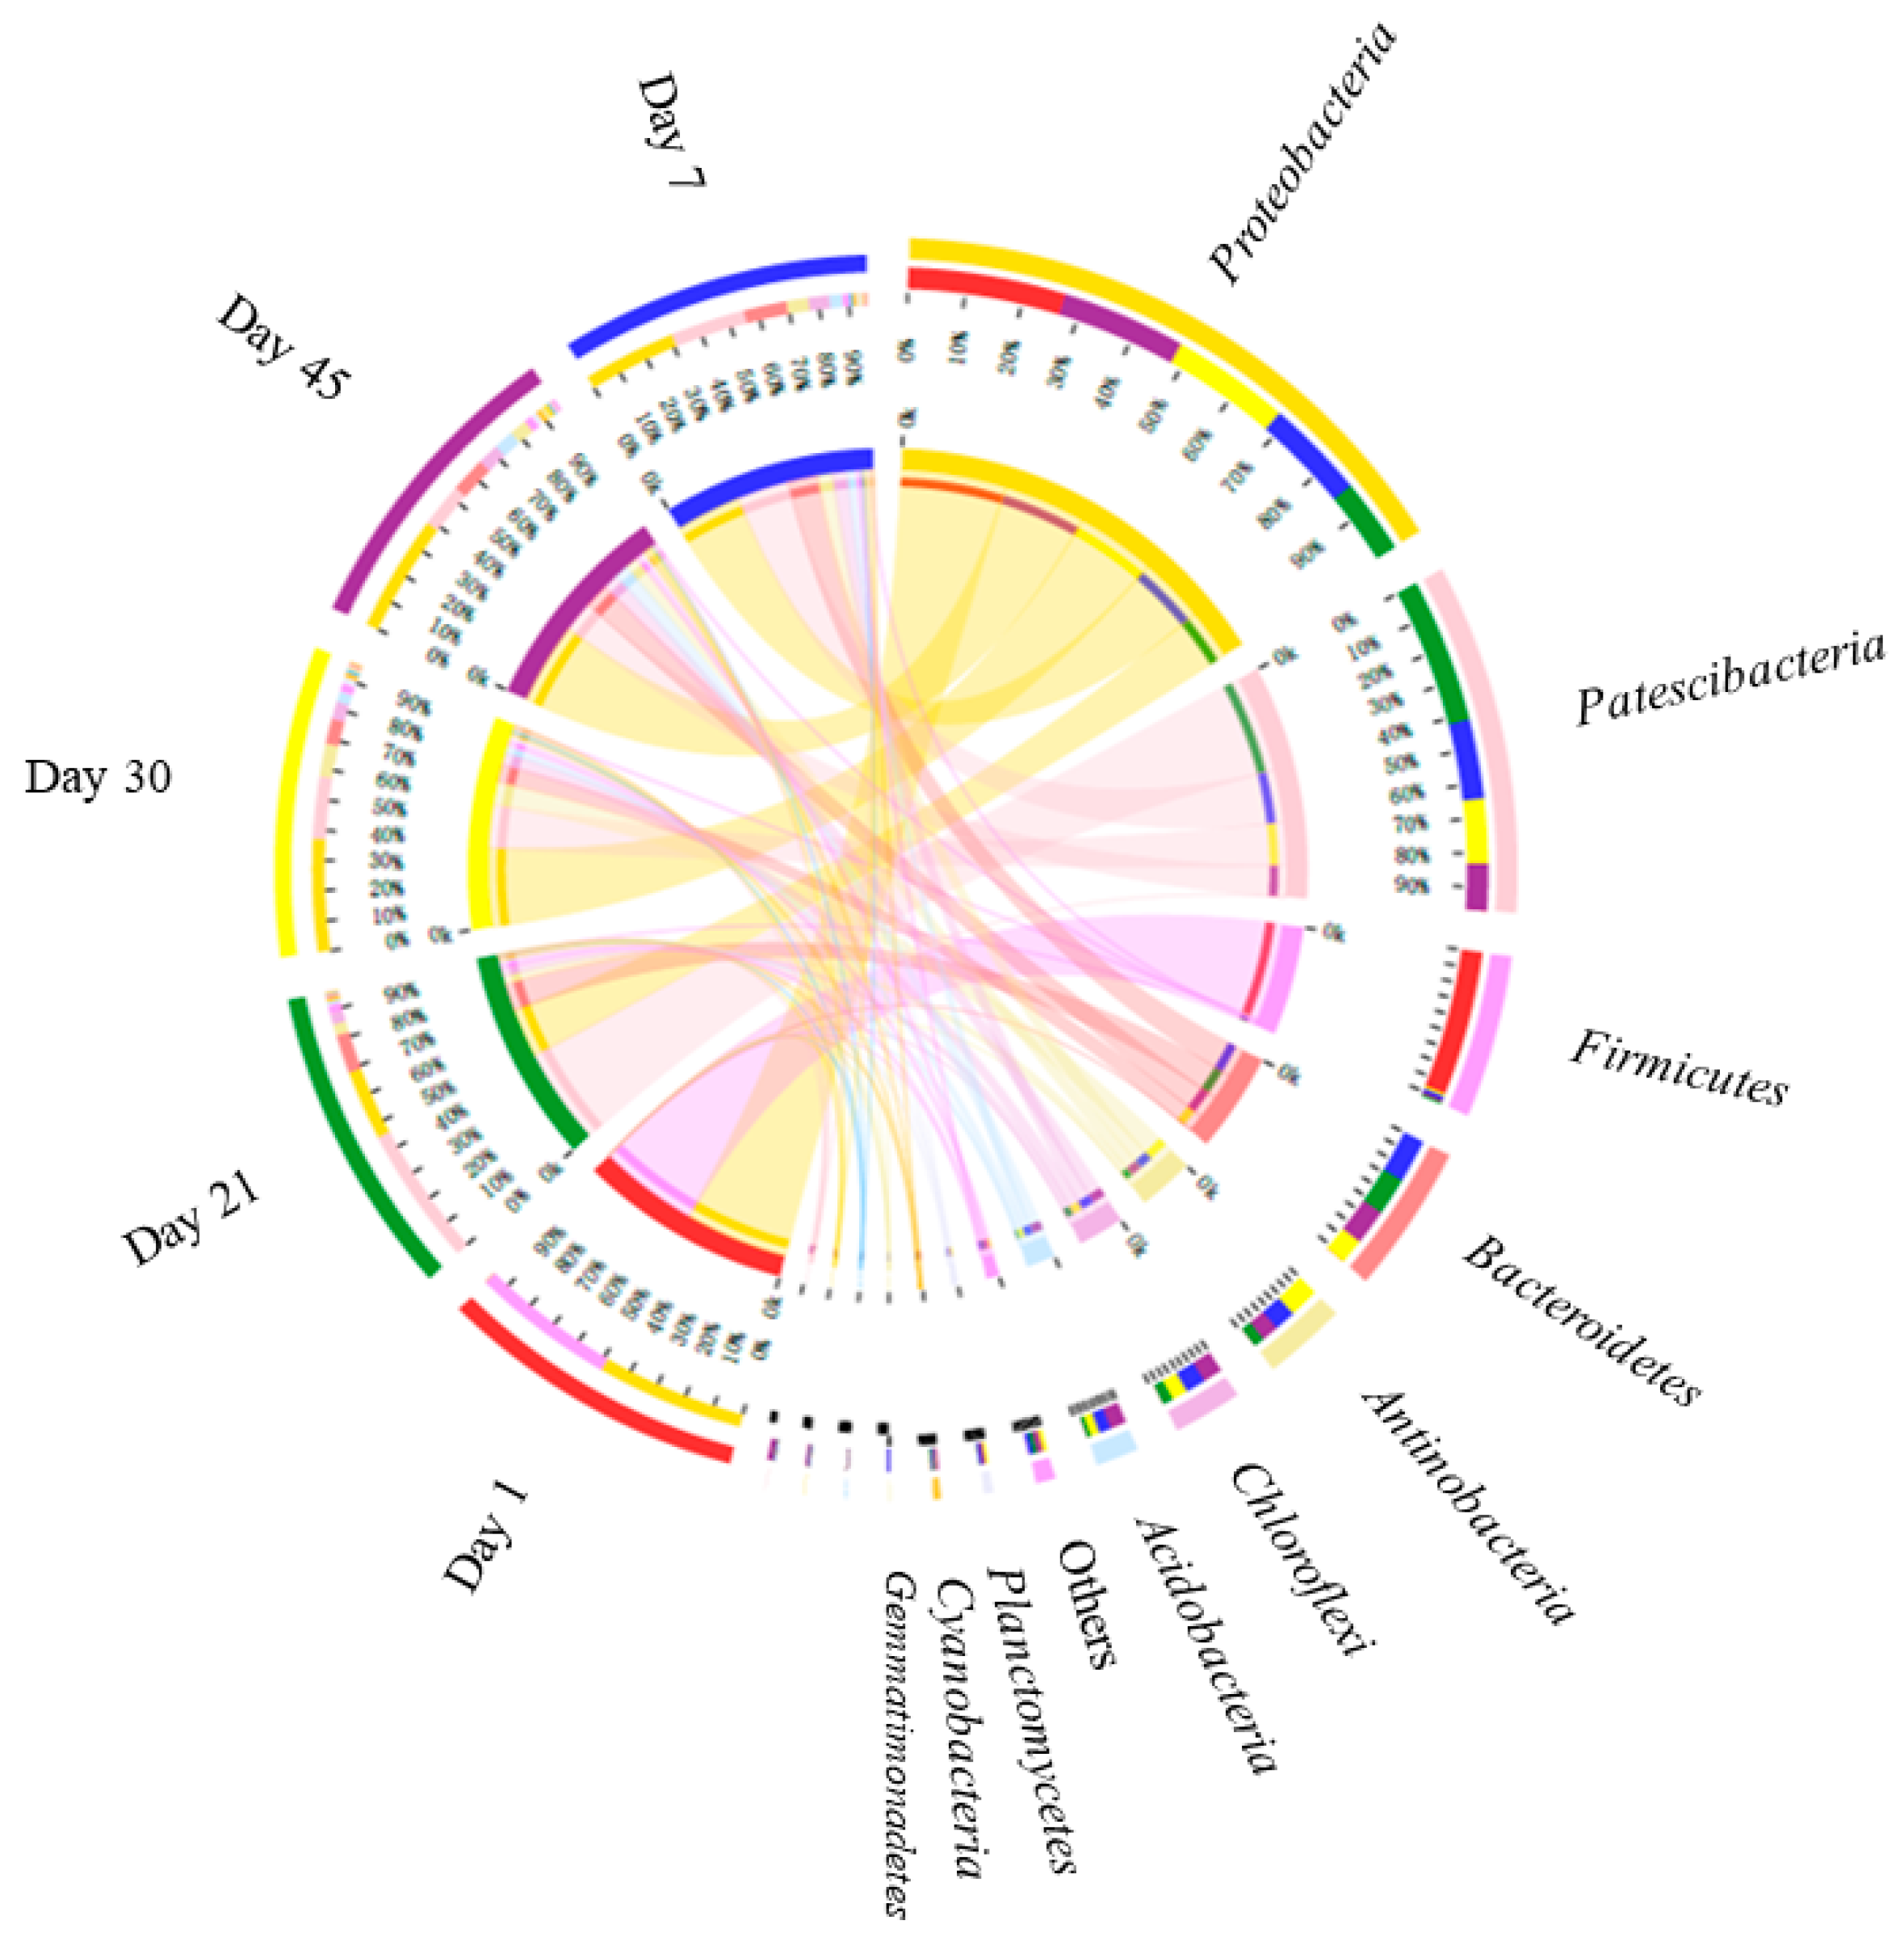
3.2.3. Microbial Genetic Relationship Analysis at the Genus Level

Based on the sequencing results and annotated OTU data, cluster abundance, and similarity between samples, a heatmap showing the hierarchical classification of the microbial community at the genus level was constructed, and the abundances were expressed as gradient changes of different colors. The heatmap of microbial genera showed that the 30 genera shown in Figure 5 were mainly from five phyla. The results show that the dominant genera of microorganisms in the microbial samples were different, and most of the dominant genera belonged to Proteobacteria. By analyzing the heatmap and sample-clustering tree of the horizontal species composition of the bacterial community in the five experimental stages, the dominant genus composition of the microbial samples from day 45 and day 7 were similar, and the dominant phylum composition of the microbial samples from day 1, day 21, and day 45 were different. The composition of the dominant genera of microorganisms on day 1 was different from that at other times.

3.3. Microbial Environment Relevance

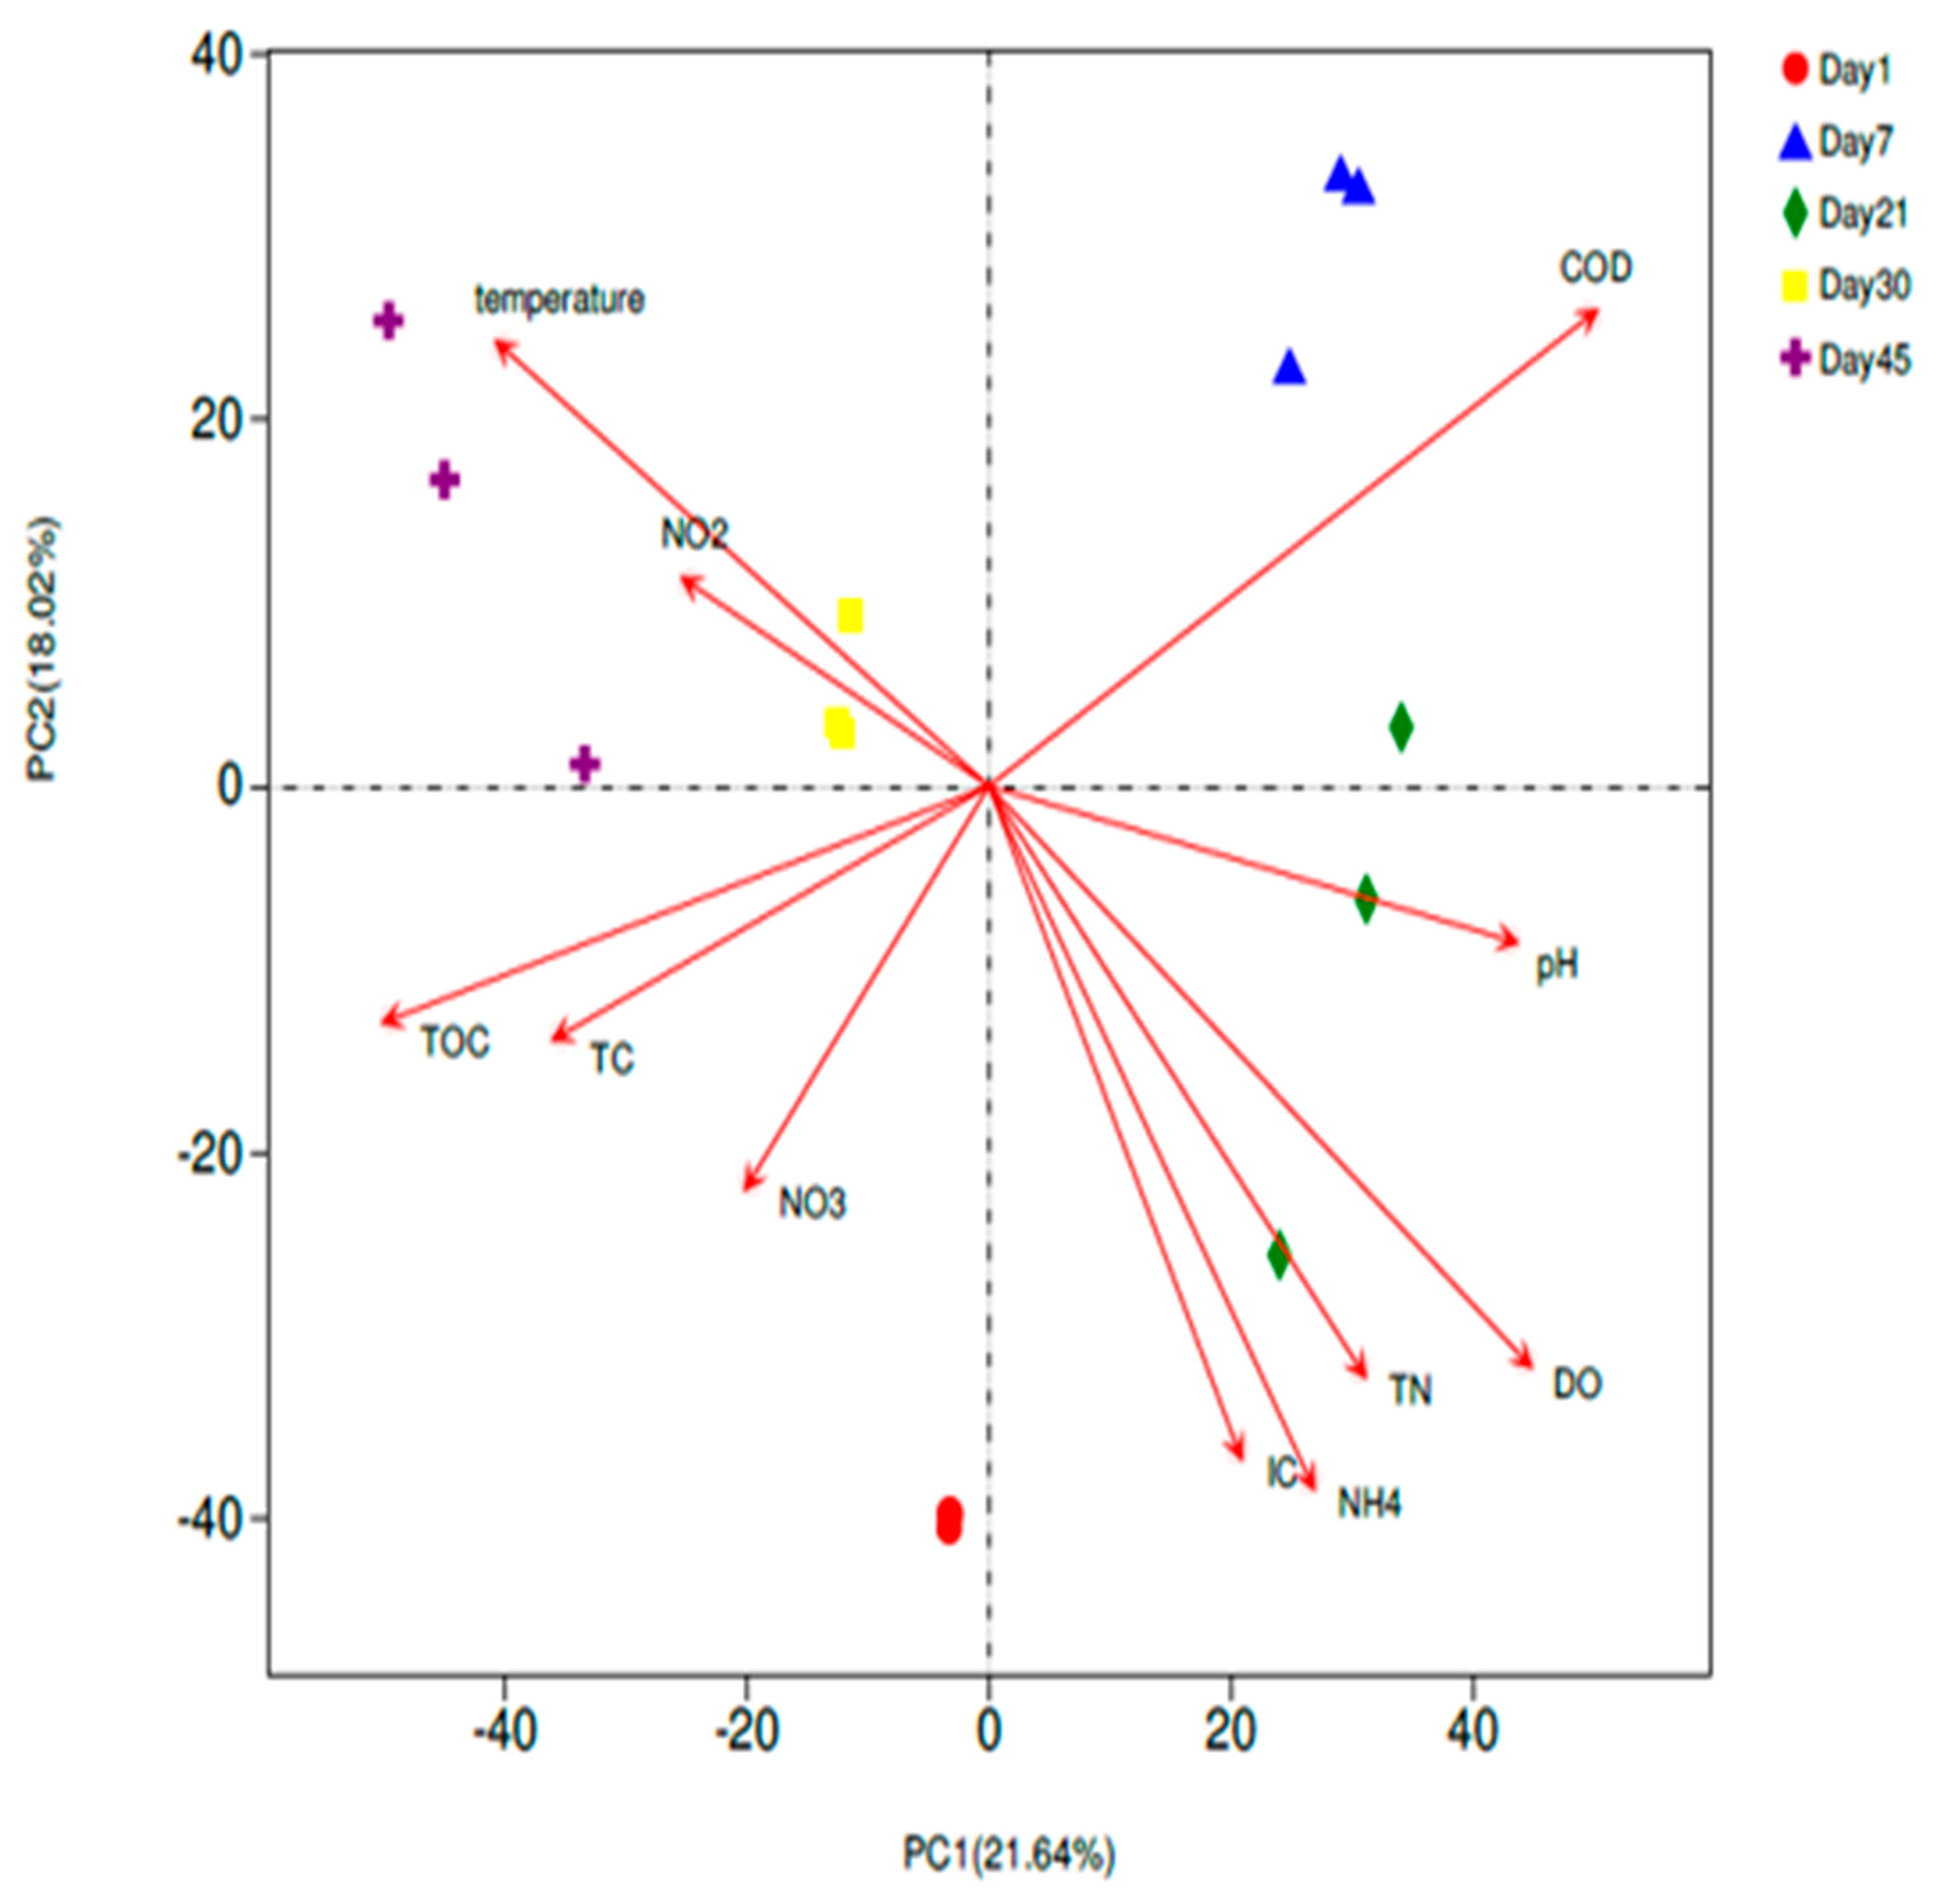
3.3.1. Principal Component Analysis (PCA)

As shown in Figure 6, the biological samples at the five time points in the figure have no overlapping parts, and the sample points are far away, indicating that the community structure composition in the reactors was not similar; the cumulative contribution of the X-axis (21.64%) and the Y-axis (18.02%) reached 39.66%, which shows that environmental factors can explain the different composition of the microbial community between the two samples. TOC, TC, and NO3 affected the bacterial community composition on day 1, the COD content mainly affected the bacterial community composition on day 7; TN affected the bacterial community composition on day 21; and NO2-N mainly affected the bacterial community composition at day 30 and day 45.

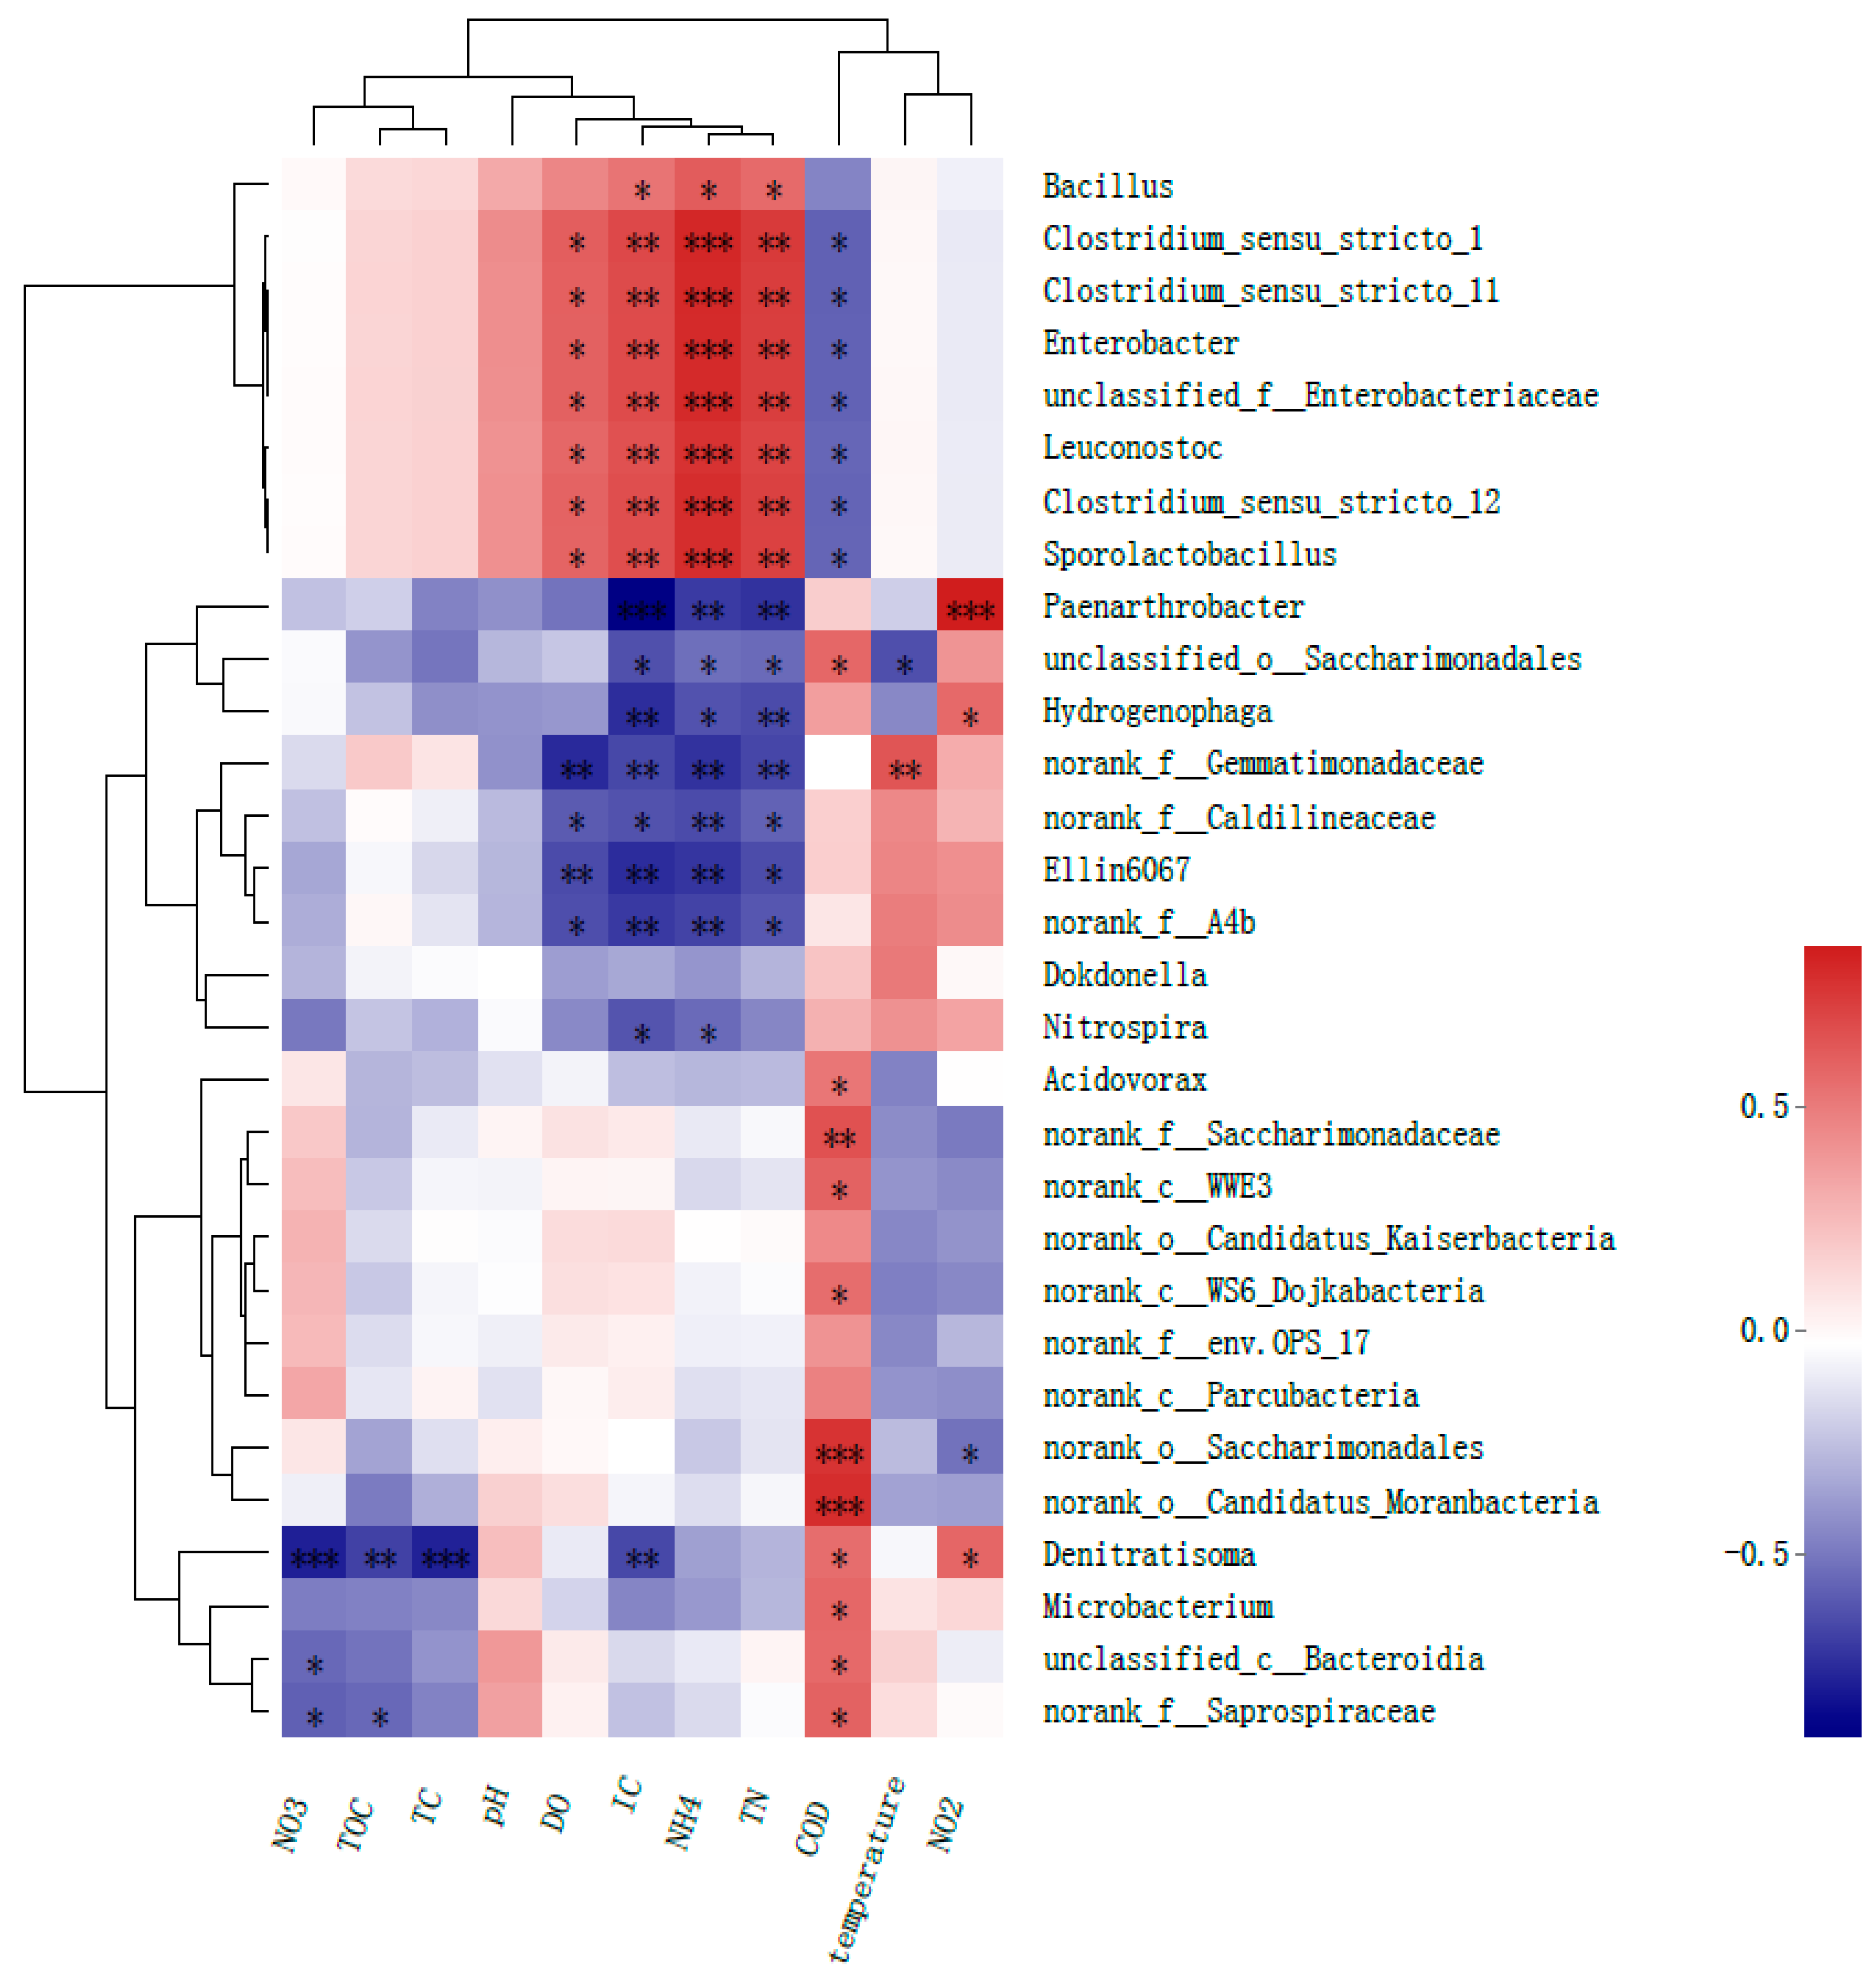
3.3.2. Correlation Heatmap Analysis

As shown in Figure 7, the correlation heatmap analysis results showed that Enterobacter (Pearson correlation coefficient r = −0.5689, p = 0.0269), Sporolactobacillus (Pearson correlation coefficient r = −0.5585, p = 0.0305), Bacillus (Pearson correlation coefficient r = −0.4544, p = 0.0888), and Leuconostoc (Pearson correlation coefficient r = −0.5534, p = 0.0324) were negatively correlated with the COD content; Candidatus Moranbacteria (Pearson correlation coefficient r = 0.7979, p = 0.0004), Acidovorax (Pearson correlation coefficient r = 0.5256, p = 0.0421), and Leuconostoc total bacterial loads were positively correlated (Pearson correlation coefficient r = 0.4561, p = 0.056); and Nitrospira (Pearson correlation coefficient r = 0.2941, p = 0.0324) was positively correlated with the COD content, but the correlation coefficient was not significant (r = 0.4561, p = 0.056). Co-occurrence analysis showed that the two bacterial clusters appeared similar, but the degree of correlation was different. At the genus level, 76 of the top 30 bacteria were positively correlated, and 51 of them were negatively correlated. In the middle and late stages of reactor operation, Patescibacteria and Proteobacteria appeared to have the most positive correlations (the r2 values were 0.598 and 0.519, respectively). The microorganisms in the middle and late stages of reactor operation were mainly composed of Patescibacteria and Proteobacteria.

4. Discussion

Transforming laboratory-scale bioaugmentation technology to practical applications is the ultimate goal of biological wastewater treatment. Therefore, this experiment was conducted at the QJ sewage treatment plant in Hangzhou, Zhejiang Province for a 45-day experimental period to investigate the performance of MBR reactors under actual wastewater conditions. The denitrification and simultaneous nitrogen and carbon removal efficiency results showed that when carbon removal microorganisms were added to the original denitrification microorganism system, the MBR showed a certain decarbonization effect, and the original stable denitrification rate also increased significantly. The results of the analysis at the microbial level showed that the type and abundance of the dominant flora changed accordingly with the change in the reaction system and finally formed a stable microbial structure. This study not only provides practical application data for the interaction of different functional microorganisms but also provides guidance for the use of MBRs coupled with denitrification and decarbonization microorganisms as a technology for improving the tailwater of urban sewage treatment plants.
The change in water quality can most intuitively reflect the effects of functional microorganisms [20]. In this experiment, functional denitrification microorganisms were first added to the reactor. The change trends of ammonia nitrogen, nitrous nitrogen, nitrate nitrogen, and total nitrogen were particularly obvious. In the denitrification stage (day 1–day 20), as the microorganisms gradually adapted to the environment, the removal rate of ammonia nitrogen increased; and with the addition of functional microorganisms (day 21), the environment where the microorganisms were located changed. As a result, the growth and reproduction of the original microorganisms were inhibited, and cell autolysis occurred [21], releasing a large amount of ammonia nitrogen, which is oxidized by ammonia oxidizing bacteria to nitrous nitrogen [22]. This is in line with the increase in the concentration of ammonia nitrogen in the effluent from 21–30 days in the water quality results. The increase in nitrate concentration was consistent. It is worth noting that after the addition of decarburization microorganisms, while the decarburization effect was improved, the originally stable denitrification rate eventually increased to a higher value [23], which also indicates that a deeper exploration of the interrelationship between the microbial denitrification and decarburization mechanisms is needed.
Changes in water quality affect the structure of the microbial community, and the study by Xuan et al. [24] found that the planktonic bacterial community is mainly controlled by water pollution. According to the results of microbial sequencing, the microbial richness and diversity in the reactor were related to the microbial community. The structure and composition changed to a certain extent. As the microorganisms adapted to the reactor over time, the richness and diversity were significantly improved. Only at day 21 (with the addition of decarburization microorganisms) did these parameters decline. Interestingly, this showed a similar trend to changes in water quality parameters.
As the reaction progressed, the structure of the microbial community gradually became richer and more diverse. According to the results of microbial sequencing, we found that most anaerobic or aerobic heterotrophic bacteria in the microbial community could convert or reduce nitrate to nitrite or nitrogen. Proteobacteria, Bacteroidetes, and Chloroflexi were all especially abundant bacterial phyla. During the experiment, the relative abundance of Proteobacteria significantly increased from 22.56% to 61.02%, and that of Bacteroidetes and Chloroflexi changed to different degrees. Some studies [25,26,27] have shown that Proteobacteria occupies a dominant position in most denitrification systems, among which the β-Proteobacteria class covers almost all types of AOB, which also explains the reason for the increased denitrification efficiency in this experiment, from a microbiological perspective. Chloroflexi is a common bacterial phylum in anammox systems and includes autotrophic microorganisms that can use carbon sources. Wang Yaoqi and others also found a high abundance of Chloroflexi in anammox systems. Chen et al. [28] found that Chloroflexi is a facultative anaerobe that is beneficial to the formation of granular sludge. Kindaichi et al. [29] investigated whether Chloroflexi can decompose some dead microorganisms and found that its filamentous structure is conducive to the formation of biofilms. It has been widely recognized that Chloroflexi plays an important role in denitrification systems. From the analysis results at the genus level, the bacterial genera with a significant increase in abundance included Denitratisoma [30] and Bacillus [31], which can degrade organic matter and have denitrification functions. Among them, Bacillus has a stronger affinity for ammonia nitrogen and nitrous nitrogen in addition to a faster growth rate, making it the dominant genus [32].
The abundant denitrifying heterotrophic bacteria in the reaction system can use nitrate and other oxygen-containing mineral nitrogen compounds as the final electron acceptor, and the presence of nitrifying bacteria reduces the content of ammonia nitrogen. In this work, when microorganisms were added to the reactor, after a period of adaptation, the heterologous bacterial culture colonized the environment [33], quickly adapted, multiplied, and formed stable activated sludge [34]. The special microorganisms used in this experiment were effective denitrification and decarburization microorganisms collected from actual wastewater from sewage treatment plants; these organisms may be highly adapted and grow exclusively on nitrogen and carbon sources [35]. This seems to best explain why denitrification and decarburization microorganisms could grow under actual wastewater conditions cooperatively, and when the coupled microbes adapted to the environment, the removal rates of carbon and nitrogen were improved significantly [36].
This study corresponded to the pilot stage of this technology under actual conditions. If this technology is used, based on the total population of Hangzhou city, the annual reduction in ammonia nitrogen and COD in this city can reach 1.4 × 10¹² mg L−1 year−1 and 7.64 × 10¹² mg L−1 year−1, respectively. If applied throughout the whole province, total reductions can be achieved separately. Therefore, the use of MBRs coupled with denitrification and decarbonization microorganisms is a very valuable and promising technology for water pollution control.

5. Conclusions

The fact that this investigation was completed in an actual sewage treatment plant highlights the innovative features of this work. In this study, we used the denitrification and decarburization bacteria selected in our previous experiment as the inoculum for an MBR; when decarburization microorganisms were added to the MBR reactor containing only denitrification microorganisms, the reactor not only obtained better carbon removal capacity, but the original denitrification effect was also increased, and the COD removal efficiency increased to 80.9%. Moreover, compared to the same MBR with only denitrification microorganisms, the removal efficiency of NH3-N was greatly increased from 76.8% to 98.6%. Therefore, microorganisms in related stages were sequenced in order to analyze potential interactions between microorganisms. Microbial analysis showed that Proteobacteria, Patescibacteria, Bacteroidetes, and Acinetobacter were the main bacteria involved in N removal. High abundances of Proteobacteria and Bacillus may play an essential role in NH3-N removal, while the coexistence of diverse bacteria, such as Chloroflexi, with autotrophic decarburization functions might account for the high removal efficiency for NH3-N and COD. This technology using two functional microbial couplings for bioaugmentation will provide a reference for industrial-scale treatment with the goal of simultaneous nitrogen and carbon removal.

Author Contributions

H.Z.: Investigation, resources, writing—review and editing; Y.Z.: writing—original draft; S.L.: software; J.D.: formal analysis; Y.F.: investigation; K.Y.: data curation; X.Y.: validation, conceptualization, methodology, project administration, funding acquisition. All authors have read and agreed to the published version of the manuscript.

Funding

This work was financially supported by the Open Fund of Zhejiang Institute of Freshwater Fisheries (Grant No. ZJK201805) and the Social development research initiative design project of Hangzhou (Grant No. 20180417A05).

Institutional Review Board Statement

Not applicable.

Informed Consent Statement

Not applicable.

Data Availability Statement

Data are contained within the article.

Conflicts of Interest

The authors declare no conflict of interest. The funders had no role in the design of the study; in the collection, analyses, or interpretation of data; in the writing of the manuscript, or in the decision to publish the results.

References

  1. Bagchi, S.; Behera, M. Bioaugmentation using Pseudomonas aeruginosa with an approach of intermittent aeration for enhanced power generation in ceramic MFC. Sustain. Energy Technol. Assess. 2021, 45, 101138. [Google Scholar]
  2. Albina, P.; Durban, N.; Bertron, A.; Albrecht, A.; Robinet, J.-C.; Erable, B. Influence of hydrogen electron donor, alkaline pH, and high nitrate concentrations on microbial denitrification: A review. Int. J. Mol. Sci. 2019, 20, 5163. [Google Scholar] [CrossRef] [PubMed] [Green Version]
  3. Crini, G.; Lichtfouse, E. Advantages and disadvantages of techniques used for wastewater treatment. Environ. Chem. Lett. 2019, 17, 145–155. [Google Scholar] [CrossRef]
  4. Di Bella, G.; Mannina, G. Intermittent aeration in a hybrid moving bed biofilm-reactor for carbon and nutrient biological removal. Water 2020, 12, 492. [Google Scholar] [CrossRef] [Green Version]
  5. Velkova, Z.; Kirova, G.; Stoytcheva, M.; Kostadinova, S.; Todorova, K.; Gochev, V. Immobilized microbial biosorbents for heavy metals removal. Eng. Life Sci. 2018, 18, 871–881. [Google Scholar] [CrossRef] [Green Version]
  6. Skoczko, I.; Puzowski, P.; Szatyłowicz, E. Experience from the Implementation and Operation of the Biological Membrane Reactor (MBR) at the Modernized Wastewater Treatment Plant in Wydminy. Water 2020, 12, 3410. [Google Scholar] [CrossRef]
  7. Wang, J.; Chu, L. Biological nitrate removal from water and wastewater by solid phase denitrification process. Biotechnol. Adv. 2016, 34, 1103–1112. [Google Scholar] [CrossRef]
  8. Hu, Z.; Lotti, T.; De Kreuk, M.; Kleerebezem, R.; Loosdrecht, M.V.; Kruit, J.; Jetten, M.S.M.; Kartal, B. Nitrogen removal by a nitritation-anammox bioreactor at low temperature. Appl. Environ. Microbiol. 2013, 79, 2807–2818. [Google Scholar] [CrossRef] [Green Version]
  9. Zhao, B.; Ran, X.C.; Tian, M. Assessing the performance of a sequencing batch biofilm reactor bioaugmented with P. stutzeri strain XL-2 treating ammonium-rich wastewater. Bioresour. Technol. 2018, 270, 70–79. [Google Scholar] [CrossRef]
  10. Liao, R.H.; Miao, Y.; Li, J.; Li, Y.; Zhu, W.; Du, J.; Li, Y.M.; Li, A.M.; Shen, H.J. Temperature dependence of denitrification microbial communities and functional genes in an expanded granular sludge bed reactor treating nitrate-rich wastewater. RSC Adv. 2018, 8, 42087–42094. [Google Scholar] [CrossRef] [Green Version]
  11. Schlegel, S.; Koeser, H. Wastewater treatment with submerged fixed bed biofilm reactor systems—Design rules, operating experiences and ongoing developments. Water Sci. Technol. 2009, 55, 83–89. [Google Scholar] [CrossRef]
  12. Hamdani, A.; Mountadar, M.; Assobhei, O. Comparative study of the efficacy of three coagulants in treating dairy factory waste water. Int. J. Dairy Technol. 2005, 58, 83–88. [Google Scholar] [CrossRef]
  13. Ibrahim, R.S.; Sabeen, A.H.; Noor, Z.Z.; Ahmad Mutamim, N.S. Comparative study of suspended and attached growth in membrane bioreactors for wastewater treatment. Water Environ. J. 2020, 34, 273–289. [Google Scholar] [CrossRef]
  14. Hamdani, A.; Mountadar, M.; Assobhei, O. Simultaneous nitrate and organic matter removal from a dairy effluent by biodenitrification. Rev. Sci. Eau. 2018, 3, 97–107. [Google Scholar] [CrossRef] [Green Version]
  15. Sun, L.; Tian, Y.; Zhang, J.; Cui, H.; Zuo, W.; Li, J. A novel symbiotic system combining algae and sludge membrane bioreactor technology for wastewater treatment and membrane fouling mitigation: Performance and mechanism. Chem. Eng. J. 2018, 344, 246–253. [Google Scholar] [CrossRef]
  16. Hobbie, J.E.; Daley, R.J.; Jasper, S. Use of nuclepore filters for counting bacteria by fluorescence microscopy. Appl. Environ. Microbio. 1977, 33, 1225–1228. [Google Scholar] [CrossRef] [Green Version]
  17. Kargi, F.; Pamukoglu, M.Y. Aerobic biological treatment of pre-treated landfill leachate by fed-batch operation. Enzym. Microb. Technol. 2003, 33, 588–595. [Google Scholar] [CrossRef]
  18. APHA. Standard Methods for the Examination of Water and Wastewater, 20th ed.; AWWA, WEF, IPB University: Bragança, Portugal, 2012. [Google Scholar]
  19. Huang, H.; Peng, C.; Peng, P.C.; Lin, Y.; Zhang, X.X.; Ren, H.Q. Towards the biofilm characterization and regulation in biological wastewater treatment. Appl. Microbiol. Biotechnol. 2019, 103, 1115–1129. [Google Scholar] [CrossRef] [PubMed]
  20. Echevarria, C.; Valderrama, C.; Cortina, J.L.; Martin, I.; Arnaldos, M.; Bernat, X.; Boleda, M.R.; Vega, A.; Teuler, A.; Castellvi, E. Technoeconomic evaluation and comparison of PAC-MBR and ozonation-UV revamping for organic micropollutants removal from urban reclaimed wastewater. Sci. Total. Environ. 2019, 671, 288–298. [Google Scholar] [CrossRef] [PubMed]
  21. Wang, Z.; Wang, Y.; Xie, F.L.; Chen, S.W.; Li, J.H.; Li, D.S.; Chen, X. Improvement of acetoin reductase activity enhances bacitracin production by Bacillus licheniformis. Process. Biochem. 2014, 49, 2039–2043. [Google Scholar] [CrossRef]
  22. Ding, L.J.; Xu, P.; Zhang, W.Y.; Yuan, Y.; He, X.P.; Su, D.Q.; Shi, Y.T.; Naman, C.B.; Yan, X.J.; Wu, B.; et al. Three New Diketopiperazines from the Previously Uncultivable Marine Bacterium Gallaecimonas mangrovi HK-28 Cultivated by iChip. Chem. Biodiversity 2018, 17, e2000221. [Google Scholar] [CrossRef]
  23. Huang, H.K.; Tseng, S.K. Nitrate reduction by Citrobacter diversus under aerobic environment. Appl. Microbiol. Biotechnol. 2001, 55, 90–94. [Google Scholar] [CrossRef]
  24. Xuan, L.; Sheng, Z.; Lu, J.; Qiu, Q.; Chen, J.; Xiong, J. Bacterioplankton community responses and the potential ecological thresholds along disturbance gradients. Sci.Total Environ. 2019, 696, 134015–134024. [Google Scholar] [CrossRef]
  25. Vijay, A.; Chhabra, M.; Vincent, T. Microbial community modulates electrochemical performance and denitrification rate in a biocathodic autotrophic and heterotrophic denitrifying microbial fuel cell. Bioresour. Technol. 2019, 272, 217–225. [Google Scholar] [CrossRef] [PubMed]
  26. Wang, C.; Liu, Y.; Lv, W.; Xia, S.; Han, J.; Wang, Z.; Yu, X.; Cai, L. Enhancement of nitrogen removal by supplementing fluidized-carriers into the aerobic tank in a full-scale A(2)/O system. Sci. Total Environ. 2019, 660, 817–825. [Google Scholar] [CrossRef] [PubMed]
  27. Ji, B.; Yang, K.; Zhu, L.; Jiang, Y.; Wang, H.Y.; Zhou, J.; Zhang, H.N. Aerobic denitrification: A review of important advances of the last 30 years. Biol. process. Eng. 2019, 20, 643–651. [Google Scholar] [CrossRef]
  28. Chen, C.J.; Huang, X.X.; Lei, C.X. Effect of organic matter strength on anammox for modified greenhouse turtle breeding wastewater treatment. Bioresour. Technol. 2013, 148, 172–179. [Google Scholar] [CrossRef]
  29. Kindaichi, T.; Yuri, S.; Ozaki, N.; Ohashi, A. Ecophysiological role and function of uncultured Chloroflexi in an anammox reactor. Water Sci. Technol. 2012, 66, 2256–2261. [Google Scholar] [CrossRef] [Green Version]
  30. Zhan, X.; Yang, Y.Q.; Chen, F.R. Treatment of secondary effluent by a novel tidal-integrated vertical flow constructed wetland using raw sewage as a carbon source: Contribution of partial denitrification-anammox. Chem. Eng. J. 2020, 395, 125165. [Google Scholar] [CrossRef]
  31. Yang, X.; Lai, J.L.; Li, J.; Zhang, Y.; Luo, X.G.; Han, M.W.; Zhu, Y.B.; Zhao, S.P. Biodegradation and physiological response mechanism of Bacillus aryabhattai to cyclotetramethylenete-tranitramine (HMX) contamination. J. Environ. Manag. 2021, 288, 112247. [Google Scholar] [CrossRef]
  32. Li, Y.; Yang, Y.; Feng, Y.R.; Pu, J.; Hou, L.A. Combined effects of Pseudomonas quinolone signal-based quorum quenching and graphene oxide on the mitigation of biofouling and improvement of the application potential for the thin-film composite membrane. Sci. Total Environ. 2021, 760, 143348. [Google Scholar] [CrossRef] [PubMed]
  33. Liu, T.; He, X.; Jia, G. Simultaneous nitrification and denitrification process using novel surface-modified suspended carriers for the treatment of real domestic wastewater. Chemosphere 2021, 247, 125831. [Google Scholar] [CrossRef]
  34. Liu, T.; Mao, Y.J.; Shi, Y.P.; Xie, Q. Start-up and bacterial community compositions of partial nitrification in moving bed biofilm reactor. Appl. Microbiol. Biotechnol. 2017, 101, 2563–2574. [Google Scholar] [CrossRef] [PubMed]
  35. Su, L.; Aga, D.; Chandran, K.; Khunjar, W.O. Factors impacting biotransformation kinetics of trace organic compounds in lab-scale activated sludge systems performing nitrification and denitrification. J. Hazard. Mater. 2015, 282, 116–124. [Google Scholar] [CrossRef] [PubMed]
  36. Wu, P.; Zhang, X.X.; Wang, C.C. Feasibility of applying intermittent aeration and baffles for achieving granular nitritation in a continuous short-cut denitrifying phosphorus removal system. Sci. Total Environ. 2020, 715, 137023. [Google Scholar] [CrossRef] [PubMed]
Figure 1. Denitrification efficiency of the MBR based on the NH3-N (a), NO2-N (b), NO3-N (c), and TN (d) concentrations.
Water 13 02850 g001
Figure 2. Decarburization efficiency of the MBR based on the TOC (a), IC (b), TC (c), and COD (d) concentrations.
Water 13 02850 g002
Figure 3. Circos plot of microbial community (abundance greater than 1%) dynamics of the biofilm samples during different phases at the phylum level.
Water 13 02850 g003
Figure 4. The composition of dominant species in the reactor at different periods and their distribution in the samples (the left half circle shows the species composition in the sample, the color of the outer ribbon represents the group from which it comes, the color of the inner ribbon represents the species, and the length represents the relative abundance of the species in the corresponding sample. The right half circle shows the distribution of the species in different samples at the taxonomic level, the outer ribbon represents the species, the color of the inner ribbon represents different groups, and the length represents the distribution of the species in a given sample.).
Water 13 02850 g004
Figure 5. Heat map of the microbial community (abundance greater than 1%) at the genus level.
Water 13 02850 g005
Figure 6. Principal component analysis (PCA).
Water 13 02850 g006
Figure 7. Correlation heatmap analysis. (0.5 < p < 0.1: *; 0.01 < p < 0.5: **; p < 0.01: ***).
Water 13 02850 g007
Table 1. Species’ richness and diversity indicators of the microbial communities of samples.
ShannonSimpsonAceChao1
Day 1average2.04 0.18 42.57 40.25
Day 7average6.13 0.01 2638.87 2640.29
Day 21average5.52 0.02 2342.74 2316.22
Day 30average5.78 0.02 2682.57 2667.27
Day 45average6.09 0.01 2644.82 2631.45
Publisher’s Note: MDPI stays neutral with regard to jurisdictional claims in published maps and institutional affiliations.

