
Incorporation of COVID-19-Inspired Behaviour into Agent-Based Modelling for Water Distribution Systems’ Contamination Responses


Faculty of Civil and Environmental Engineering, Technion-Israel Institute of Technology, Haifa 32000, Israel
*
Author to whom correspondence should be addressed.
Water 2021, 13(20), 2863; https://doi.org/10.3390/w13202863
Submission received: 9 September 2021
/
Revised: 30 September 2021
/
Accepted: 9 October 2021
/
Published: 13 October 2021
Abstract
:Drinking water contamination events in water networks are major challenges which require fast handling by the responsible water utility manager agent, and have been explored in a variety of models and scenarios using, e.g., agent-based modelling. This study proposes to use recent findings during the COVID-19 pandemic outbreak and draw analogies regarding responses and reactions to these kinds of challenges. This happens within an agent-based model coupled to a hydraulic simulation where the decision making of the individual agents is based on a fuzzy logic system reacting to a contamination event in a water network. Upon detection of anomalies in the water the utility manager agent places mobile sensor equipment in order to determine endangered areas in the water network and warn the consumer agents. Their actions are determined according to their social backgrounds, location in the water network and possible symptoms from ingesting contaminated water by utilising a fuzzy logic system. Results from an example application suggest that placing mobile equipment and warning consumers in real time is essential as part of a proper response to a contamination event. Furthermore, social background factors such as the age or employment status of the population can play a vital role in the consumer agents’ response to a water event.
1. Introduction
Ensuring the distribution of high-quality drinking water has been one of the biggest achievements for public health in recent history. Water distribution systems (WDSs) are critical infrastructure in delivering water at desired quantities to a system’s consumers. While the quality of water is usually monitored at the source, it is not feasible to track all relevant water quality parameters in a WDS in real time. In the case of a harmful contamination event, toxic substances might be transported to unsuspecting consumers. For monitoring the water quality throughout the water distribution system (WDS), fixed water quality sensors which are placed at strategically important locations have proved to be effective [1]. Various parameters including pH, residual chlorine conductivity and turbidity are constantly measured with the aforementioned sensors, which makes them important in the daily operations of water utilities [2]. To enable economical and strategical optimisation of the sensor placement, algorithms have been developed to identify locations for optimal contamination detection. This way, consumers will not ingest contaminated drinking water if the alarm on a water quality anomaly can be rung quickly. Among these algorithms are genetic algorithms [3,4], which help establish early warning systems with high probabilities of detecting anomalies in water quality. Inline mobile sensors which sample water flowing inside the water network and transmit these data [5] have proved to be rather ineffective compared to conventional sensors, considering the performance per cost [6,7]. Additional studies have explored the effect of the placement of mobile sensor equipment on its ability to collect information on the contamination plume in real time and transmit it to the utilities [8]. Various machine learning methodologies have been used recently to determine drinking water quality by evaluating specific water quality input parameters to determine the global water quality state in a water network. For this, artificial and convolutional neural networks (ANNs/CNNs) or support vector machines (SVMs) have been used to either determine specific harmful water quality parameters in drinking water or to detect whether there is a contamination event in the WDS [9,10,11]. Artificial intelligence was also used in [12] and in [13] to develop a methodology determining pipe break rates in addition to considering the operational and physical factors of the system and to predict longitudinal dispersion coefficients in water pipes, respectively.
Furthermore, in [14] as well as in [15,16,17], agent-based modelling (ABM) is utilised to represent the highly nonlinear relationship between the hydraulic system, water consumers and the utility manager during a contamination event. ABM is highly suitable for simulating these complex adaptive systems (CASs) [16], and can be a strong foundation for simulating a social system which is supposed to represent the dependencies and feedbacks of all involved stakeholders which interact during a contamination event in a water network. This involves consumers, utilities, policy makers, health officials and conventional as well as social media.
ABM is a powerful tool where a system is modelled by defining agents which make decisions and assess their situation autonomously following predefined rules, equations or thresholds [18]. These models can capture emergent phenomena which common modelling approaches can rarely deliver, and thus results can be observed which are not predictable [18]. These phenomena can be intensified through agents that are able to learn via, e.g., machine learning algorithms.
Agent-based modelling has been used in the field of water resources for various applications, such as estimating residual water demand or household water-consuming behaviour [19,20]. Ref. [19] developed a model for evaluating water-pricing policies to support policy makers in their decisions. Furthermore, ABM was used to simulate and point out the risks of current management strategies in water supply systems [21], involving stakeholders such as consumers, political actors, water utility companies and infrastructure, where the model was validated with real data from utilities. It was also used to model water resource allocation in the Nile river basin by using evolutionary algorithms to optimise a fair redistribution of resources according to the contribution of each agent to a central solution [22].
Furthermore, [15] evaluated the reaction of a multi-agent system to contamination in a water distribution system and developed new approaches for threat management through manipulating a set of hydrants to flush the system. The ABM framework is coupled with evolutionary algorithms to identify an optimal strategy for manipulating hydrants with the objective of maximising the number of non-contaminated consumers. Later, the authors incorporated various physical attributes of consumer agents or their ability to move in-between nodes [16]. The ABM approach modelled a sociotechnical water event with interactions between the utility manager and the consumer agents. Simulations between the consumer agents themselves showed the dynamic and adaptive interactions that social agents have on the consequences of a water quality event [14,23].
The interactions of consumers of various water systems in agent-based models is commonly represented by statistical models. One example for this is given in [16], where the compliance of consumers with warnings from the utility manager and the media is determined by the use of a compliance variable which can be derived with a conditional probability distribution which incorporates, for example, the trustworthiness of the source. While many studies base their statistical communication models on assumptions, a survey has been conducted which tested the perceptions and reactions of consumers to water events, and was used for the aforementioned compliance model [15,16].
Generally, modelling human behaviour is not trivial because humans are not random entities, and have diverse abilities and knowledge [24]. Furthermore, the latter study explains that humans are generally rational decision-making beings, but their behaviour is also influenced by factors such as emotions and intuitive or unconscious decision-making processes [24].
The COVID-19 pandemic, which broke out in December 2019 in Wuhan, China and lead to a global health crisis, is the most recent example of a disaster where the reactions of the population on the social and behavioural levels can be explored. The effect of a disaster situation on the psychological states of individuals from different societal backgrounds and their tendency to believe and spread misinformation was investigated in some recent studies [25,26]. A large social and behavioural study has been conducted on the influence and importance of science communication, moral decision making and leadership for an effective response to the COVID-19 pandemic [27]. One evidently very successful approach to respond to the coronavirus was a method entitled “contact tracing”, which involved tracking people down who might be infected via the information given to authorities by already-infected patients or location-tracking apps. Furthermore, there are various newly developed numerical and agent-based models that explore COVID-19 outbreaks, their dynamics and assess interventions [28,29], in addition to models that assess the effects of these interventions on health and economics [30]. Ref. [31] developed a machine learning algorithm to predict poor prognosis and morbidity of COVID-19 patients by sampling their blood and using matrix factorisation (MF) methods as well as random forest (RF) algorithms. The authors of ref. [32] and ref. [33] also utilised blood sampling to predict the severity of the course of COVID disease and utilised various machine learning methods such as naïve Bayesian classifiers, neural networks, random forests or support vector machines.
This study aims to connect the findings from social and behavioural data during the COVID-19 pandemic with an agent-based models to explore the response of consumer agents during a contamination event in a water distribution system. While an event in a WDS is not a disaster in the same magnitude of a global pandemic or a natural catastrophe, the findings from behavioural, social and psychological studies can enrich the understanding of decision-making processes, interactions and communication between consumer agents after contamination of a water distribution system occurred. The combination of the hydraulic simulations and the utilisation of social science for an agent-based model forms an important approach for the field of water distribution system analysis and gives more realistic prospects of the importance of the interactions of individual agents as well as the reaction to and compliance with information and directions from authorities and utility managers. Furthermore, there will be analogies drawn between the contact tracing methods used during the COVID-19 pandemic and the response of utility managers to contamination events, where mobile sensor equipment is used to divide the water network into contaminated and safe divisions.
The rest of this study includes a literature review, a description of the developed modelling framework, an example application, conclusions and future work.
2. Modelling Framework
An agent-based modelling framework is built to represent the sociotechnical foundation needed to explore the consumer’s actions during a contamination event according to their social background.
2.1. ABM Framework and Connection to the Hydraulic Simulation
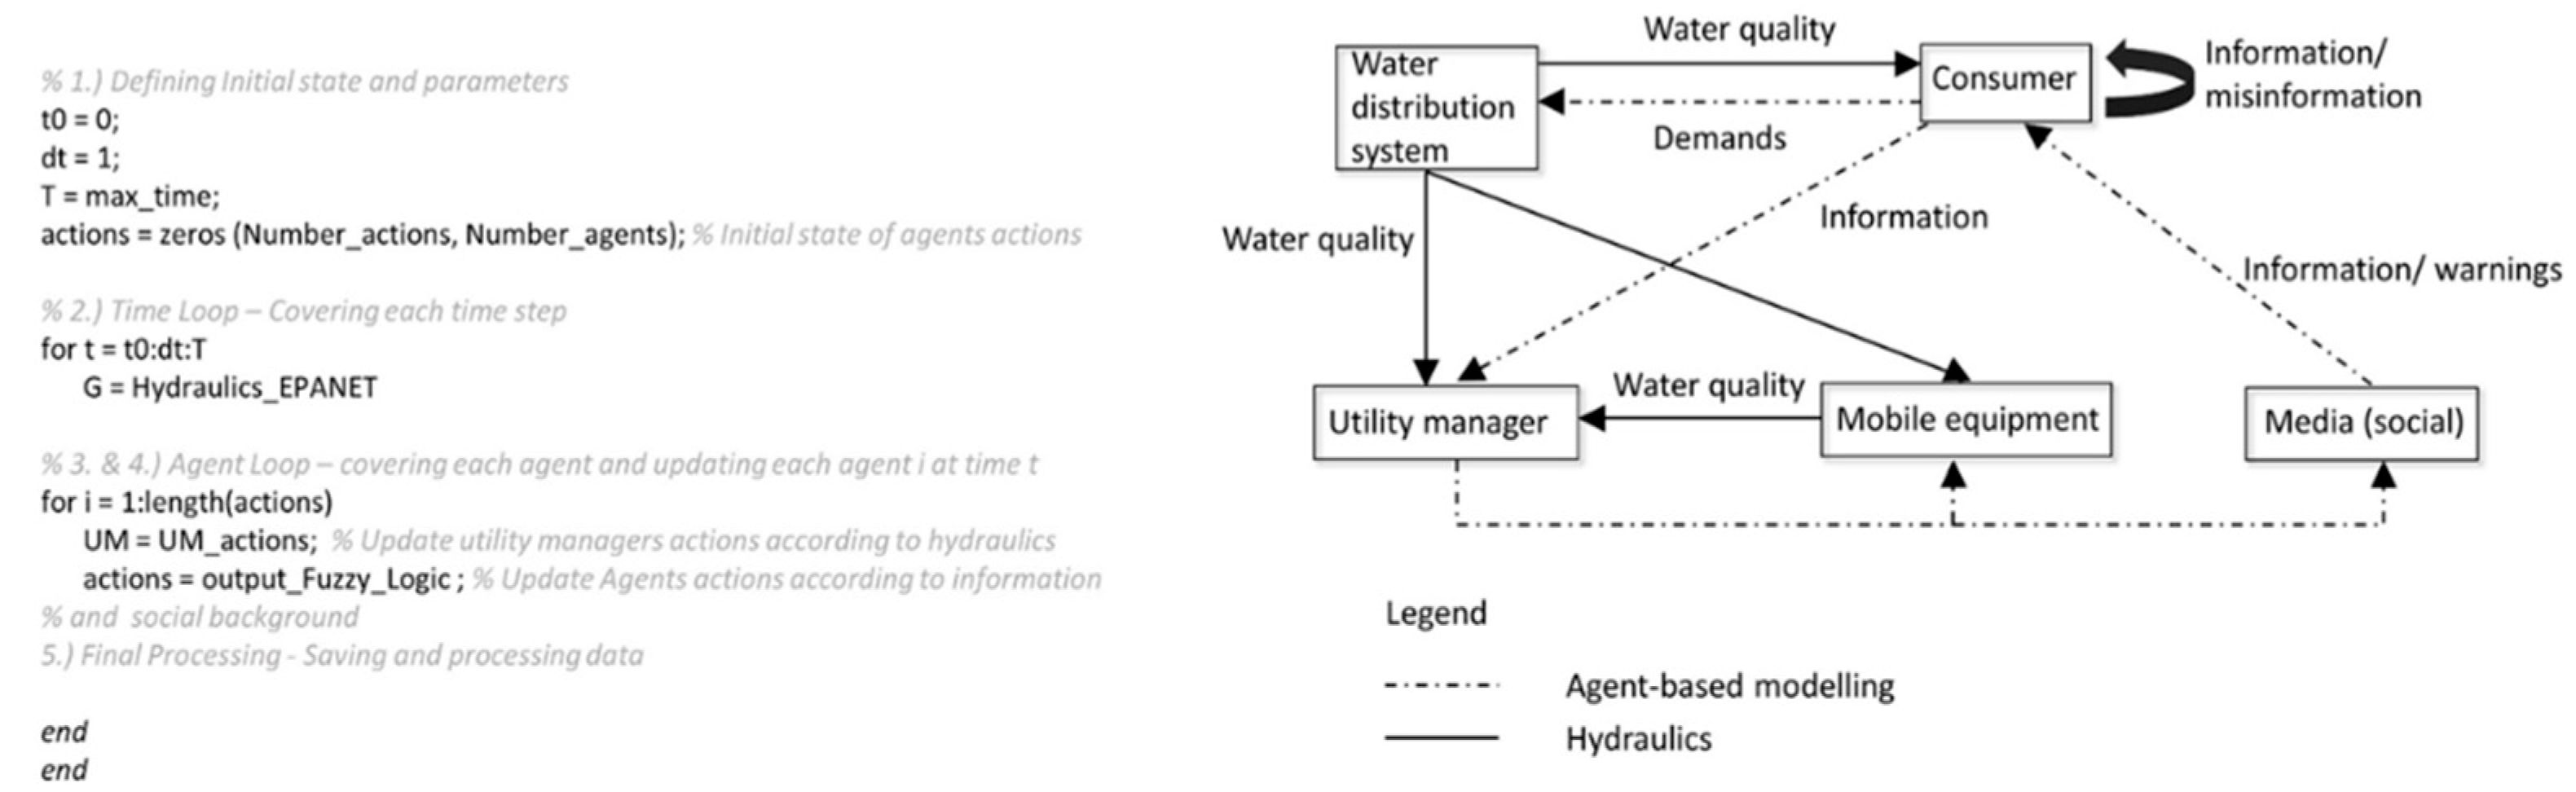
Coding an ABM simulator involves five steps [34]: (1) initialisation of the parameters, environment and the initial state of the agents, (2) a time loop for processing each time step, (3) an agent loop to route the agents, (4) updating each agent behaviour at each time step and (5) saving the data for further analysis. The hydraulic and water quality simulations are conducted with EPANET 2.0 [35], including the according multispecies extension for EPANET [36]. The latter software is used through an EPANET–MATLAB toolkit [37], which can embed into the ABM framework’s time loop so that every part of the simulation is accessible with MATLAB, as shown in Figure 1. The water quality information is therefore incorporated into the ABM model and is adjusted and processed at every time step. Furthermore, the figure shows the concept of the built ABM framework to simulate a water contamination event while incorporating the actions and reactions of the consumer agents as well as the utility manager.
There are a variety of advantages with the used approach. As the ABM framework is written from scratch in MATLAB without any proprietary or pre-built agent-based software, the user is in full control of any agent or system parameter. Moreover, as there is a link between the open-source hydraulic simulation software EPANET and MATLAB, the coupling of the hydraulic system and the agent-based model is conducted instantly, and the synchronisation is conducted in real time. Furthermore, it is possible to solve any kind of optimisation problem within MATLAB in real time during the simulation. The chosen EPANET water network, Net3, is chosen as a medium-sized network to reduce the computing time for this initial proof of concept, while still being complex enough to see the capture of the emergent phenomena that this study is aiming to prove.
The model is initialised with a hydraulic simulation and a random injection at one of its network nodes. The hydraulic simulation then passes the water quality information on to the ABM which leads to consumers ingesting contaminated water and fixed water quality sensors detecting anomalies in water quality measurements. The role of the water utility upon detection is to identify multiple grab sampling locations at which to place mobile equipment by utilising, e.g., evolutionary algorithms, demand-based heuristics, supervised learning methods or through engineering judgement. Thus, with every time step the utilities gather more information on the spread and can determine the right measures, such as treatment of contaminated parts and more importantly communicating the warnings to water consumers via, e.g., social media.
In particular, the information on the geographical spread in the network will be relevant to determine the distress level of the consumers and will have a big effect on their actions. Consumer agents will take various actions based on their location in the network, social background, their corresponding tendency to feel distress, their availability through social media and whether they experience symptoms of any kind after ingesting contaminated water. Furthermore, based on their social background, consumer agents might lean more towards sharing or believing correct or “fake” information with fellow consumers and are able to identify trustworthy sources and comply with them.
According to consumer actions, such as calling the utilities or going to a medical facility because of alleged or actual symptoms, the utility manager receives more information on the possible spread and consequences of the contamination event.
2.2. Model Cycle
- Firstly, the EPANET and MSX input files are processed, and the model is initialised.
- The water quality data are transmitted to the ABM.
- In each time step, the individual state of each agent is updated.
- The reading of the fixed sensors indicates an anomaly in water quality to the utility manager, who determines the best placement of mobile equipment in order to gather additional information on the spread of possible contamination. At first, a global warning for all consumers in the network is issued.
- The consumer agents who receive the message have various options to react, according to their social backgrounds. Their changed consumer/demand behaviour influences the hydraulics in the system and distressed consumers might call the utilities or consult a physician or medical facilities because of alleged symptoms of possibly ingesting contaminated water. Furthermore, consumer agents might believe or share correct or fake information and subsequently distress or misinform other consumers.
- The utility manager processes the received information. The readings are of the mobile equipment as well as information provided by consumers concerning the possible geographical locations. The uncertainty of the latter will have to be considered. The utility manager continues to determine locations to place mobile equipment in order to further exclude regions with no contamination, so that those households can be cleared to use the water again or, on the contrary, uphold the warning where there still might be toxic substances in the system. The placement which enables that will be determined by graph algorithms, engineering sense or supervised learning methods.
- As more information is provided to the consumer agents, they might either be reassured or more distressed depending on their location in the network and whether this region of the WDS is declared as “cleared” or a “dangerous” location, and react accordingly.
2.3. Role of the Utility Manager Agent
The utility manager agent is informed about anomalies in the water quality in the WDS by simulated fixed water sensors. These are placed in predefined nodes in the network. While, in reality, water quality parameters such as the pH value of the water, turbidity, conductivity and alkalinity can be measured in the water network by the sensors, for this study the concentration of an undefined contaminant is calculated at each node for every time step. The fixed sensors will alert the utility manager as soon as the contaminant concentration is greater than zero:
where c represents the contaminant concentration at any node, N, with a fixed sensor, s.
Alert if ∑ (cN)t > 0, ∀ N, s
2.4. Placing Mobile Equipment
The utility manager will try to place mobile equipment to gather more information on the spread as it evolves. Several mobile sensors will be placed in the water network as the contamination event evolves. The utility manager´s objective is to zero in on the source and to identify the regions of the network without and with any contamination as soon as possible. The subsequent secondary objective is to enable as many consumers as possible to drink water again after issuing a clearing for their geographical location. Clearing the issued warnings is also intended to decrease the distress which the initial warning might cause in consumers.
This study uses engineering sense and graph theory to identify optimal locations for multiple grab samplings. The directed network, G, with the nodes, N, and edges, E, represents the whole of the water network (Equation (2)). The direction of the flow determines the direction of the edges. The objective of placing the mobile sensor equipment is to find a network, G′ (Equation (3)), where the placed equipment represents the sources and the sinks of G′ in which there are no detectable harmful substances. This will enable the utilities to clear the households in network G′ to consume water again. Furthermore, network G′ can also involve the actual sources of the WDS where the water quality is monitored, while the sinks are represented by the mobile equipment. Network G″ (Equation (4)) involves at least one node, N″, where there is a contaminant concentration of c > 0 detected.
Hence, the primary optimisation objective of the utility manager is given in Equations (5)–(7):
Subject to:
where tclear describes the time until all non-endangered consumers are cleared to drink water again, x the mobile equipment placement locations and Ts represents the time vector of the simulation time steps. Therefore, the objective of the utility manager is to enable as many consumers as possible to use the water from the WDS again once it is declared a cleared zone. Furthermore, the secondary objective is obviously to minimize the number of consumers exposed to the contaminant during that process (Equations (8)–(10)):
Subject to:
where twarn describes the time when the first warning about the contamination event is issued and Cex is the number of exposed consumers.
2.5. Issuing Warnings and Updates through Social Media
Additional to traditional media, this study aims to simulate the issuing of warnings concerning contamination events through social media. The availability of consumer agents depends on their social background, e.g., their age, employment or educational status. The number of consumers reached by warnings through social media, considering the communication in-between consumer agents themselves, will be determined for every time step with an exponential function (Equation (11)):
where Cre represents the number of consumers reached in every time step, t represents the time steps of the simulation and b as well as a are constant factors which depend on the social background of the consumers. As during the time of the coronavirus crisis, the updates on the location of the contamination spread can be checked online as soon as there are validated data available which will be shared through all possible social media channels. This represents a more transparent contact tracing for the consumers of the water network.
2.6. Consumer Agents
The number of consumer agents in the system will be determined by the demands of the network. It is assumed that, on average, one consumer uses 130 L water per day. The consumers will be divided into three society types. These types are classified by state variables which represent the social background of the individual consumers as given in Table 1. Furthermore, Table 1 shows the possible actions which can be taken by the individual consumers. In every time step the consumer agent can take specific actions based on their state of information, social background, their geographical location and whether they show symptoms of any kind after ingesting possibly contaminated water. After the consumer agents are informed about the contamination event, their consumer behaviour will change. The adjustment of the demands in the system are adjusted as in Equation (12):
where D represents the demand in the respective time step, C the number of consumers drinking water from the WDS and N the nodes in the network.
2.7. Social Background and Distribution in the Network
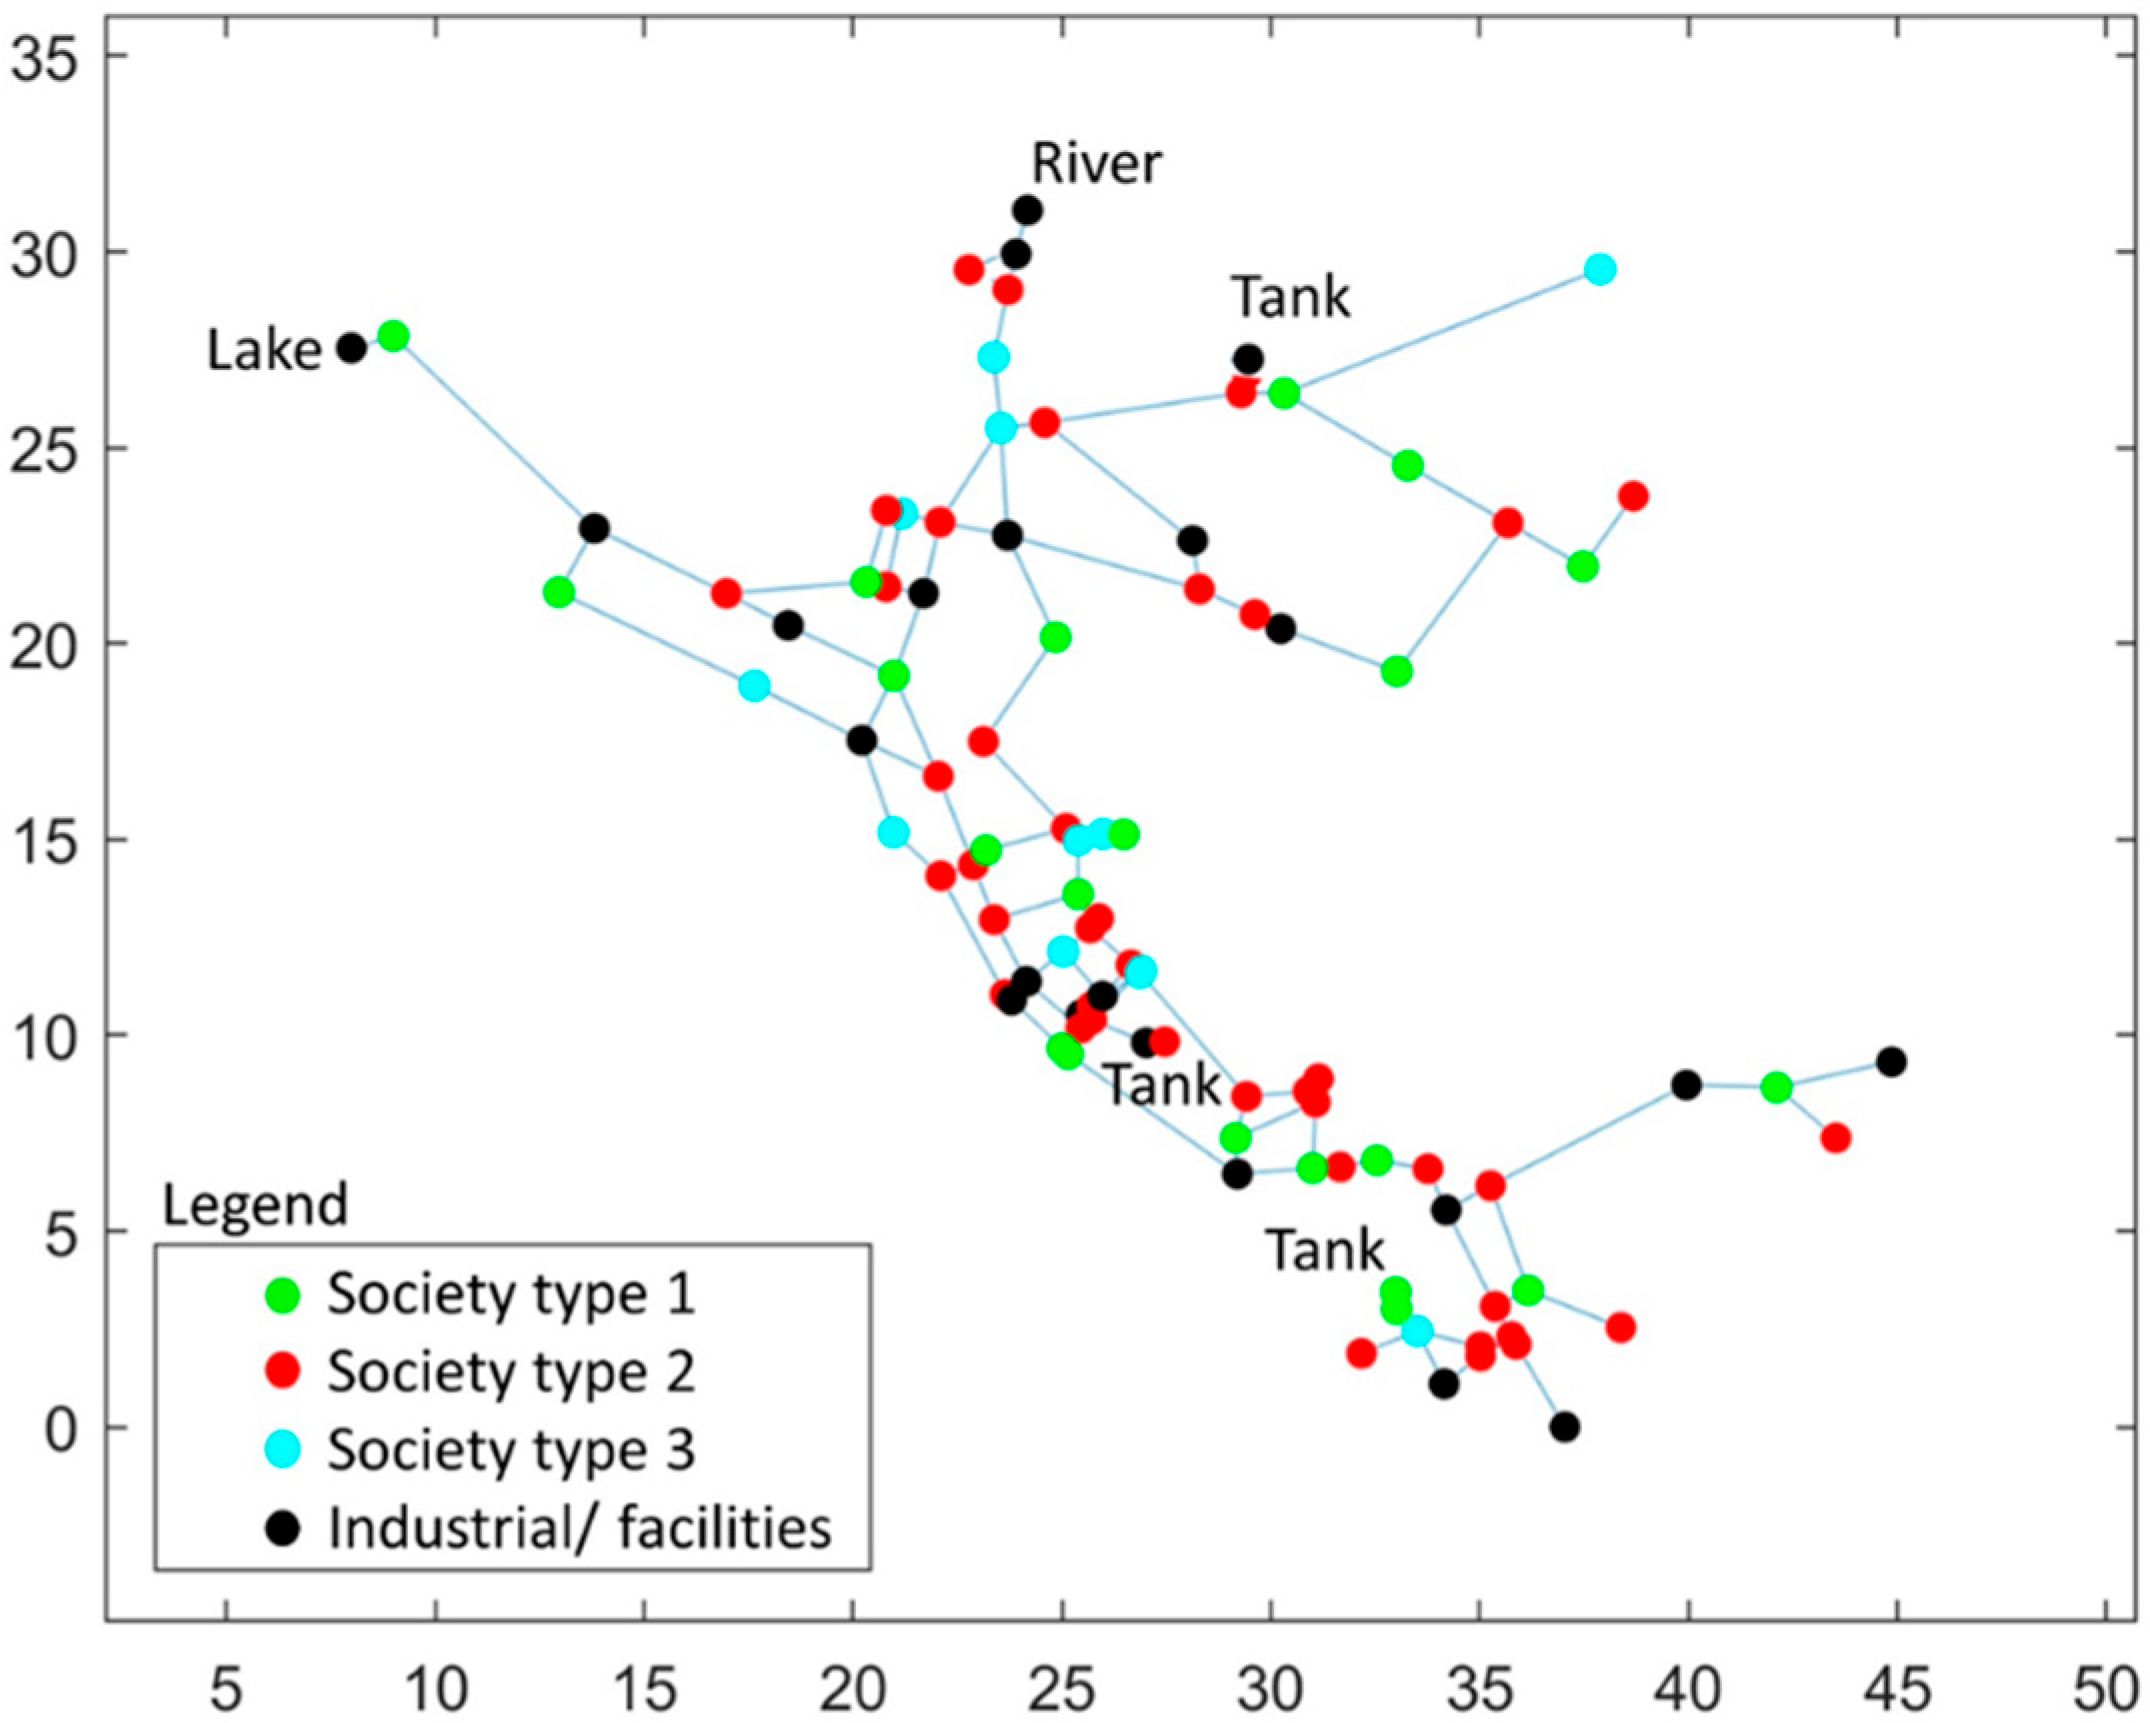
The classification of the social backgrounds was almost exclusively taken from [25]. The society is divided into three types. These types are randomly distributed over the network with the following percentages: Type 1 = 25%, Type 2 = 45% and Type 3 = 10%, as shown in Figure 2. Additionally, 20 percent of the nodes are considered to be industrial nodes where no consumer agents reside. The distribution of these three consumer agent types seemed the most appropriated to representatively describe a society leaning on [25], while considering a variety of age, education, etc. structures in a realistic society. The validity of this assumption is considered and discussed in the Results section. Furthermore, the black nodes in Figure 3 represent industrial, private, governmental and water utility facilities where the consumer agents exert water demands, but which are not incorporated into the behaviour analysis as they are assumed to be occupied by a heterogenous mass of agents.
2.8. Fuzzy Logic for Determining Consumers’ Actions
The assignment of the various actions of the consumers is done by utilising fuzzy logic. Fuzzy logic is an extension of formal logic which was introduced by [38]. It formulises the “approximate reasoning” used by humans in daily life [39]. Instead of traditional Boolean logic where only false (0) and true (1) values are processed, fuzzy logic recognizes all values in-between zero and one. The available information (or fuzzy set) is represented by specific membership functions which assign a value between one and zero to each input object. These fuzzy sets are processed by a predefined set of rules and are assigned to an output, which is also given as a fuzzy set. These outputs are then defuzzified into crisp values which can be processed by the system. Therefore, the fuzzy set, A, can be represented as given in Equations (13) and (14):
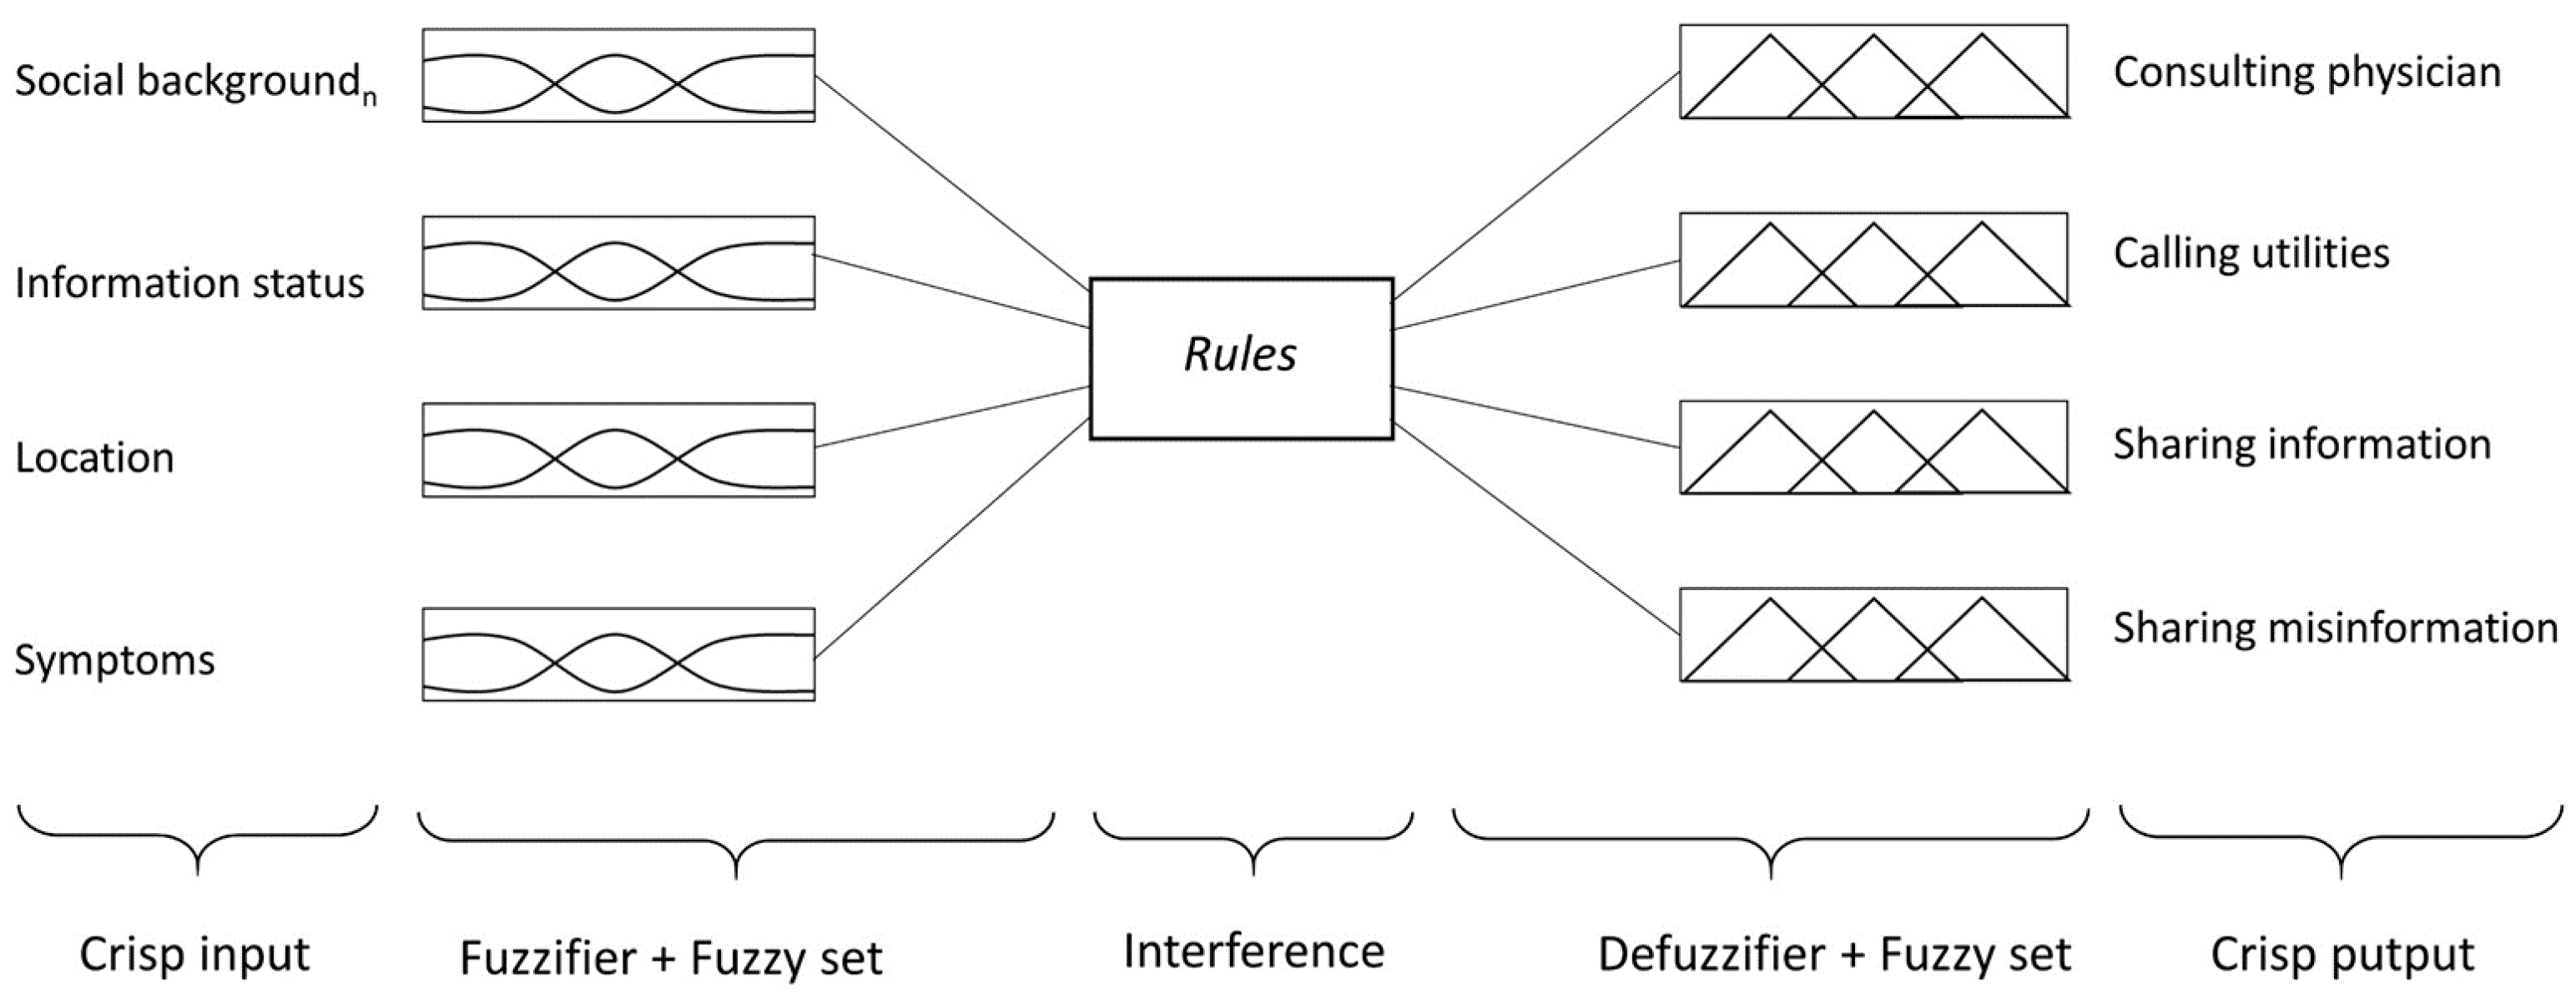
where y is an element in the fuzzy set, A, and µA(y) represents the membership of y in A. The input values for the fuzzy logic system are the various state variables of the social background, the geographical location of the consumers and whether they have symptoms from ingesting possibly contaminated water (Figure 3). The shown membership function graphics are not representative for the actual functions used for the fuzzy logic system. They are solely used for the visualisation of the used fuzzy logic system principles as described and depicted in the MATLAB 2020a documentation of the integrated fuzzy logic toolbox.
The rules for the interference engine are determined by the probability of specific actions for specific input variables. Furthermore, the output is the probability of various actions for the individual agent for each time step based on their state of information paired with additional state variables. The assumption made at Equation (11) that the information spread concerning the contamination event is exponential involves communication and information updates through social media. It is assumed that once the information on an event reaches a household, all members are notified.
3. Example Application
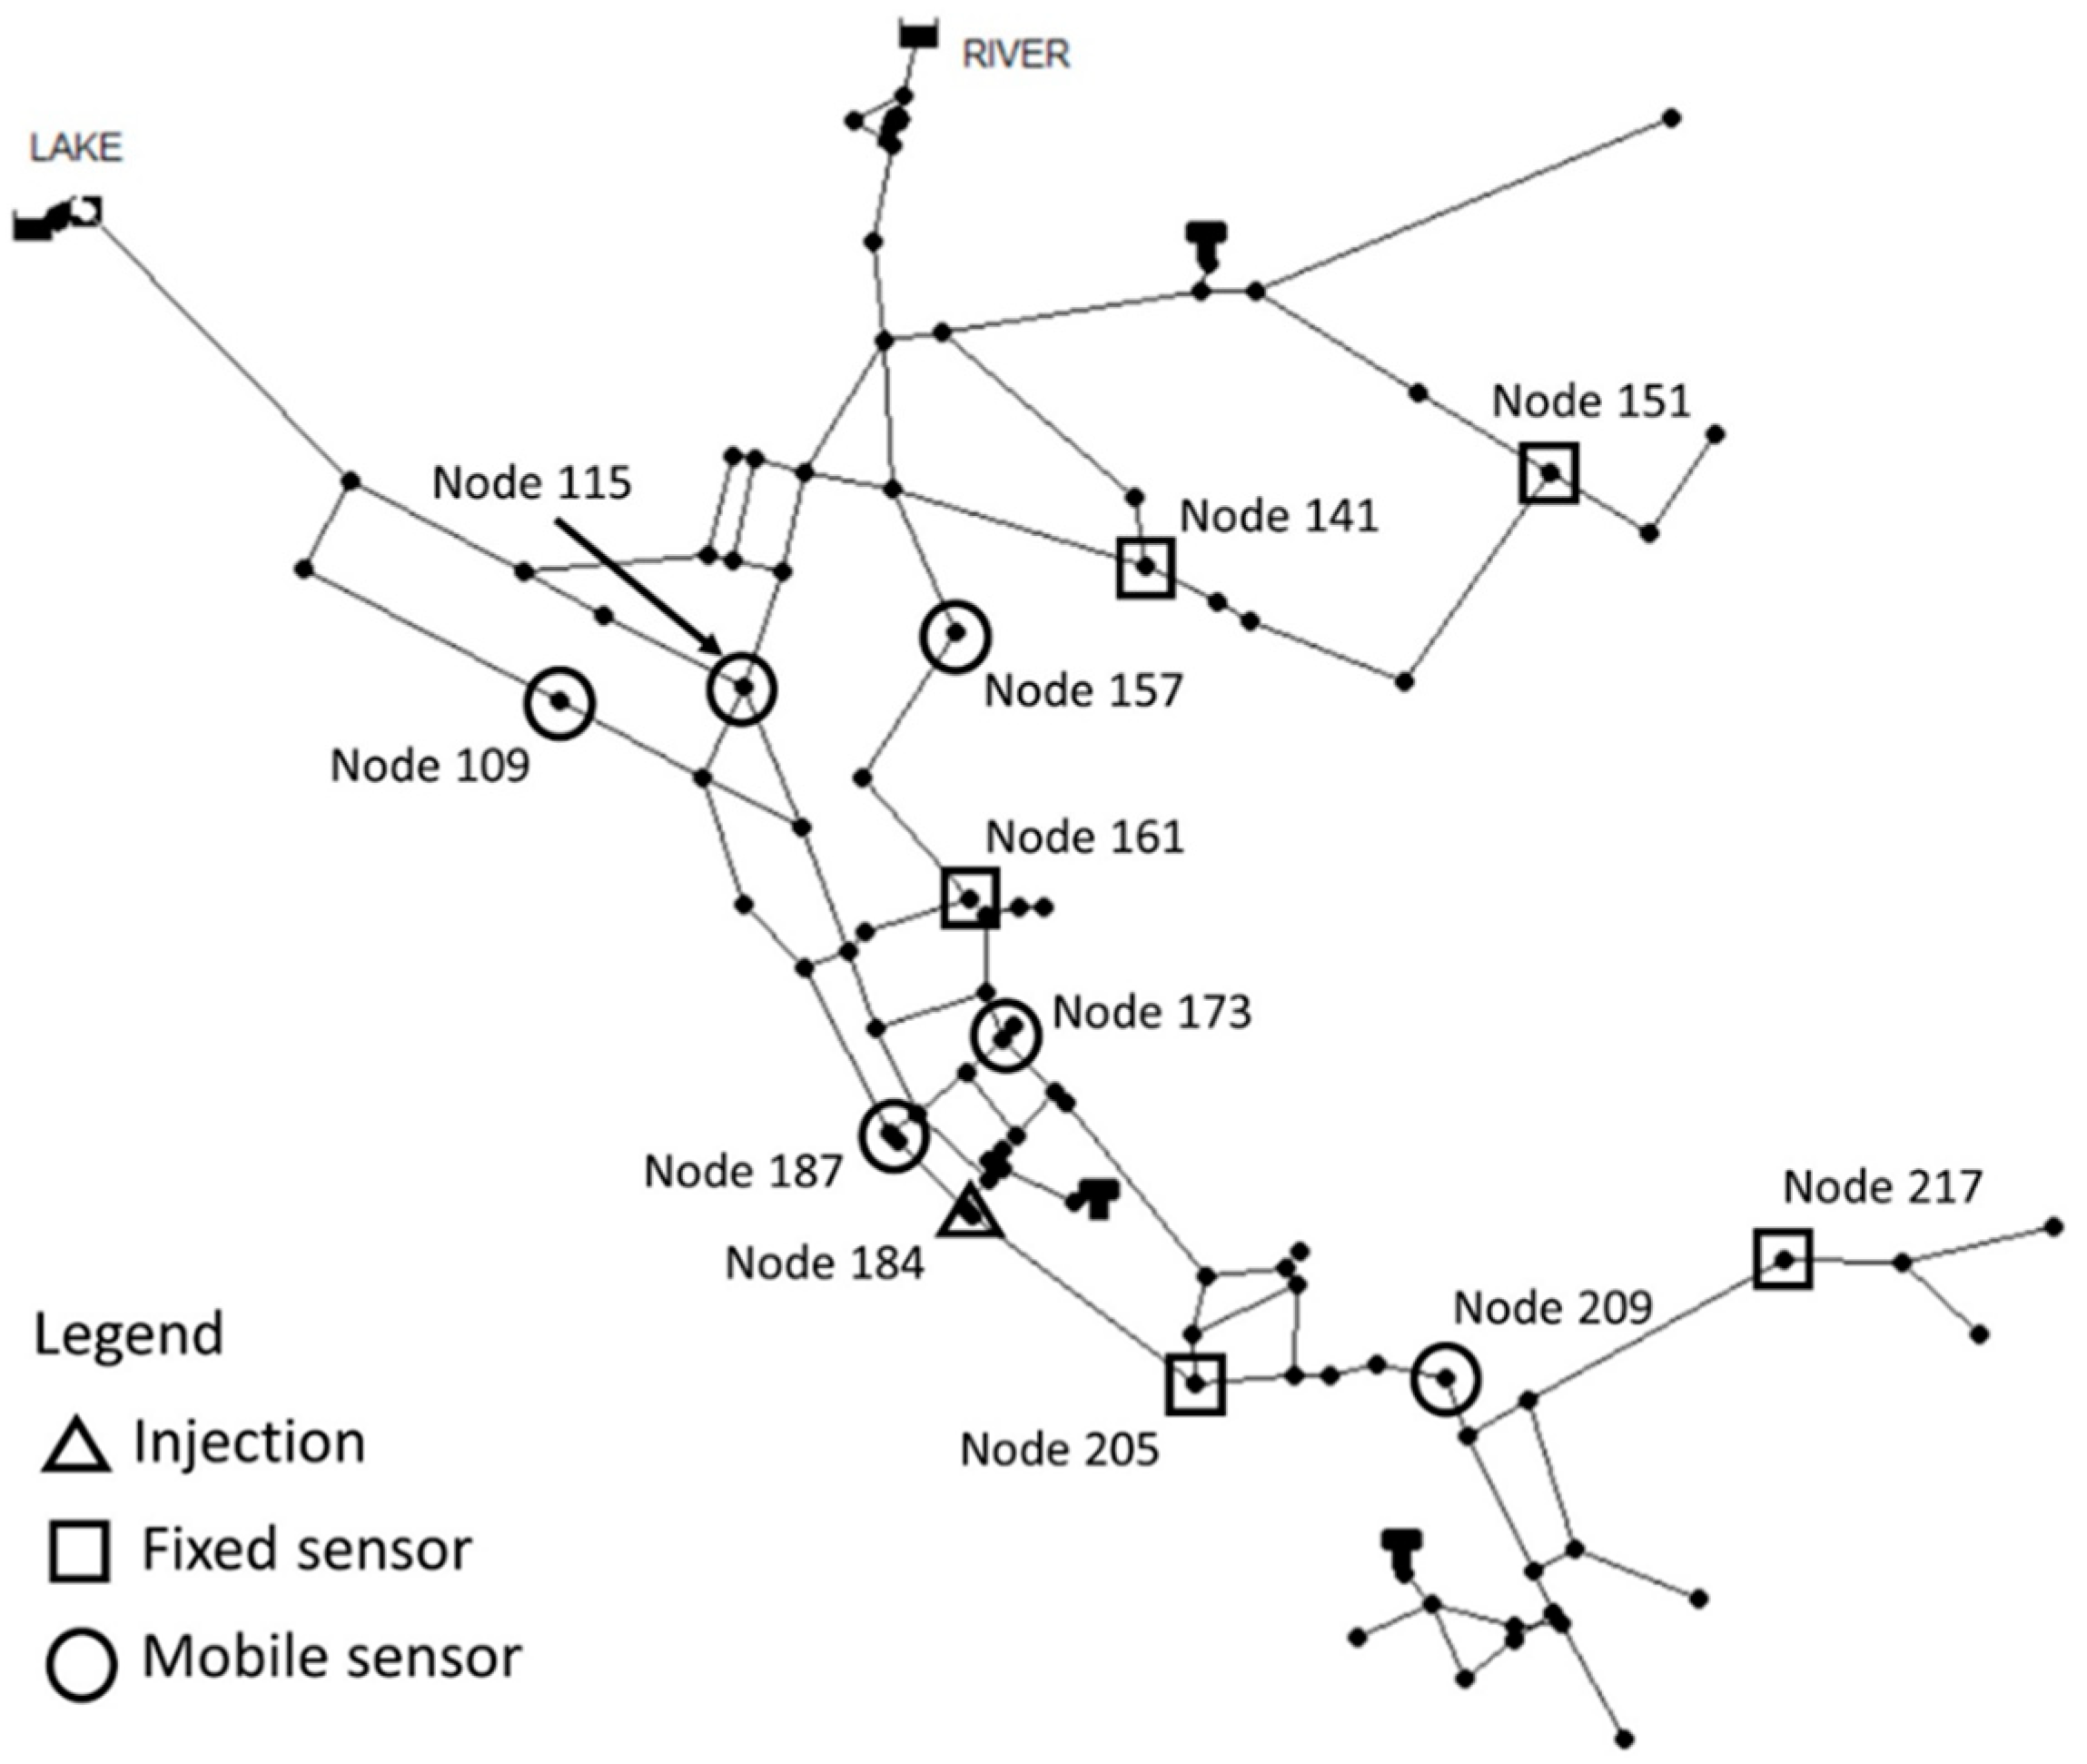
EPANET Net3 is used as an example application for this study (Figure 2). It is comprised of two pumping stations, 92 nodes, three tanks and two constant head sources. The system is subject to a demand loading of 24 h. It is assumed to have fixed water quality sensors in the network at junctions 205, 141, 161, 151 and 217. The majority of these sensor locations were adapted from [40]. The information gathered by the fixed sensors can be an additional supportive source for the utility manager in the process of warning consumers about the contamination event and placing of mobile sensor equipment.
3.1. Injection Scenario
The simulation duration is 24 h. For the first two hours of the simulation an unknown contaminant is injected into the system at junction 184 (Figure 4). The fixed water quality sensor at junction 205 detects the contaminant concentration approximately one hour after the start of the simulation and injection. As aforementioned, the simplification of this approach involves the assumption that the water quality sensors can measure a specific contamination concentration promptly. Obviously, in situ sensors in a WDS can at most detect indicators for water quality anomalies, such as changed pH values, turbidity or conductivity in the system. The simulated water quality sensors in this study alert the utility manager once the condition c (mg/L) > 0 is attained.
3.2. Mobile Equipment Placement
As indicated above, the problem of multiple grab samplings is solved here using graph theory as well as engineering judgement. A directed graph, G, is created with the example application, Net3. The flow directions determine the direction of the edges of G. For this study, it is assumed that the flow directions are constant and do not change in the course of the simulation. As soon as the contamination is detected by the fixed sensor in junction 205 (Figure 4), it is the utility manager’s responsibility to place the mobile equipment in such a way that as many nodes and regions as possible can be cleared to drink water again or warned to continue halting the usage of water from the WDS.
From the definitions in Equations (2)–(4), it follows that networks, G′n, have to be identified where the mobile equipment represents the sources and the sinks of that specific network. Furthermore, the actual sources, e.g., water tanks, reservoirs or actual fixed sensors, can also represent a sink or source of the graph, G′n, because water quality is assumed to be monitored in these nodes as well.
For the utility manager to be able to issue a clearance or uphold a warning concerning the contamination event for the specific region of G′n, the nodes which shape the sink and source nodes have to either show no evidence of water quality anomalies or detect a contamination concentration, respectively. A secondary objective for placing the mobile sensor equipment in the system is to detect the source of the contamination as soon as possible. By excluding regions of the network from the possibility of contamination, the utility manager can pinpoint the approximate location of the contamination source as time progresses. The placement of mobile equipment is hereby an iterative process which is strongly dependent on the network structure. This example comprises the placement of six pieces of mobile equipment, approximately two hours after the initial detection of the contamination event. The mobile equipment is placed at junctions 209, 115, 157, 109, 187 and 173 (Figure 4).
As shown in Figure 4, the grab sampling through the mobile sensor equipment, which was positioned at node 209, given the detection point, is tactically critical because it is the root of a tree in the network and every junction and pipe downstream of that node might be cleared or not, depending only on the measurement of an individual node. As it is downstream of the first detection point, a measurement can give clear evidence of possible contamination in the rest of the network downstream.
Following this rationale, the network can be divided into seven different zones as presented in Figure 5. The measurements of the mobile equipment which are shown in Figure 6 indicate that zones 1–4 and 6 are contamination-free after the sensor placement, three hours after the start of the simulation. Zone 5, where the contamination was detected initially, and zone 7 count as “contaminated” networks, and the utility manager must communicate that evidence accordingly. The additional information gathered by the fixed sensors is mostly neglected in the process of placing mobile sensor equipment.
3.3. Issuing Warnings to Consumer Agents
The utility manager warns consumers through social media. The coefficients in Equation (11) of the consumer agents depend on their social background, more closely on the educational attainment, age, and employment status of the individual consumer. Herein, the availability was assigned to the consumer agents in a deterministic approach.
It is assumed that the information obtained by the utility manager from the mobile equipment is instantly transmitted to the consumer agents. Thus, after one hour of the simulation, the utility manager issues a warning for the whole water network so that the agents which receive that warning will stop using the water from the WDS and start communicating the contamination event. Three hours into the simulation, after the zones of contamination were identified, the utility manager updates the information and communicates the geographical locations in which there might be still contaminated water in the system and gives clearance for the other parts.
3.4. Consumer Agent Actions
The consumers’ tendency towards certain actions depends on their social background as well as on their geographic location, which can count as possibly contaminated. In addition, their actions also depend on whether the agents experience any symptoms from ingesting contaminated water.
The sensitivity analysis in this example will differentiate three scenarios to explore how the consumers’ actions change for every scenario. Table 2 shows the three scenarios and what they include. Scenario one incorporates exclusively the social background into the fuzzy logic system which is utilised to determine the consumers’ actions during a contamination event. Scenario two considers the social background as well as the location of the individual agents in the system. Scenario three includes the social background, the location of the individual agent as well as whether possible symptoms from ingesting contaminated water have occurred.
3.5. Fuzzy Logic for Assigning Actions to Consumer Agents
The various input variables, as seen in Table 1, are assigned to certain output variables which represent the actions of the consumer agents. Utilising the fuzzy logic toolbox from MATLAB 2020a®, in each time step the agents which are informed about the contamination event are assigned an action according to their social background, location or health status, as well as a pre-defined set of rules. The input variables consist of membership functions which show the value range and the according function for each variable class. Table 3 shows the number of membership functions of each input variable and each scenario.
The tendency for sharing truthful information or misinformation can be related to the educational attainment of the consumer agents [26]. Furthermore, the tendency for consulting a physician can be related to the age of the consumer agents or the household size.
The defuzzified output from the fuzzy logic system are values between zero and one. The magnitude of the output of a specific action, Oan, determines whether the action is taken by the specific consumer agent, maybe taken or not taken (Equations (15)–(17)):
If Oan < 0.35 then action is not taken
If 0.35 < Oan < 0.65 then action is maybe taken
If Oan > 0.65 then action is taken
The uncertainties of various key factors for the actions which are maybe taken will be explored during the sensitivity analysis.
4. Results
4.1. Results Scenario One
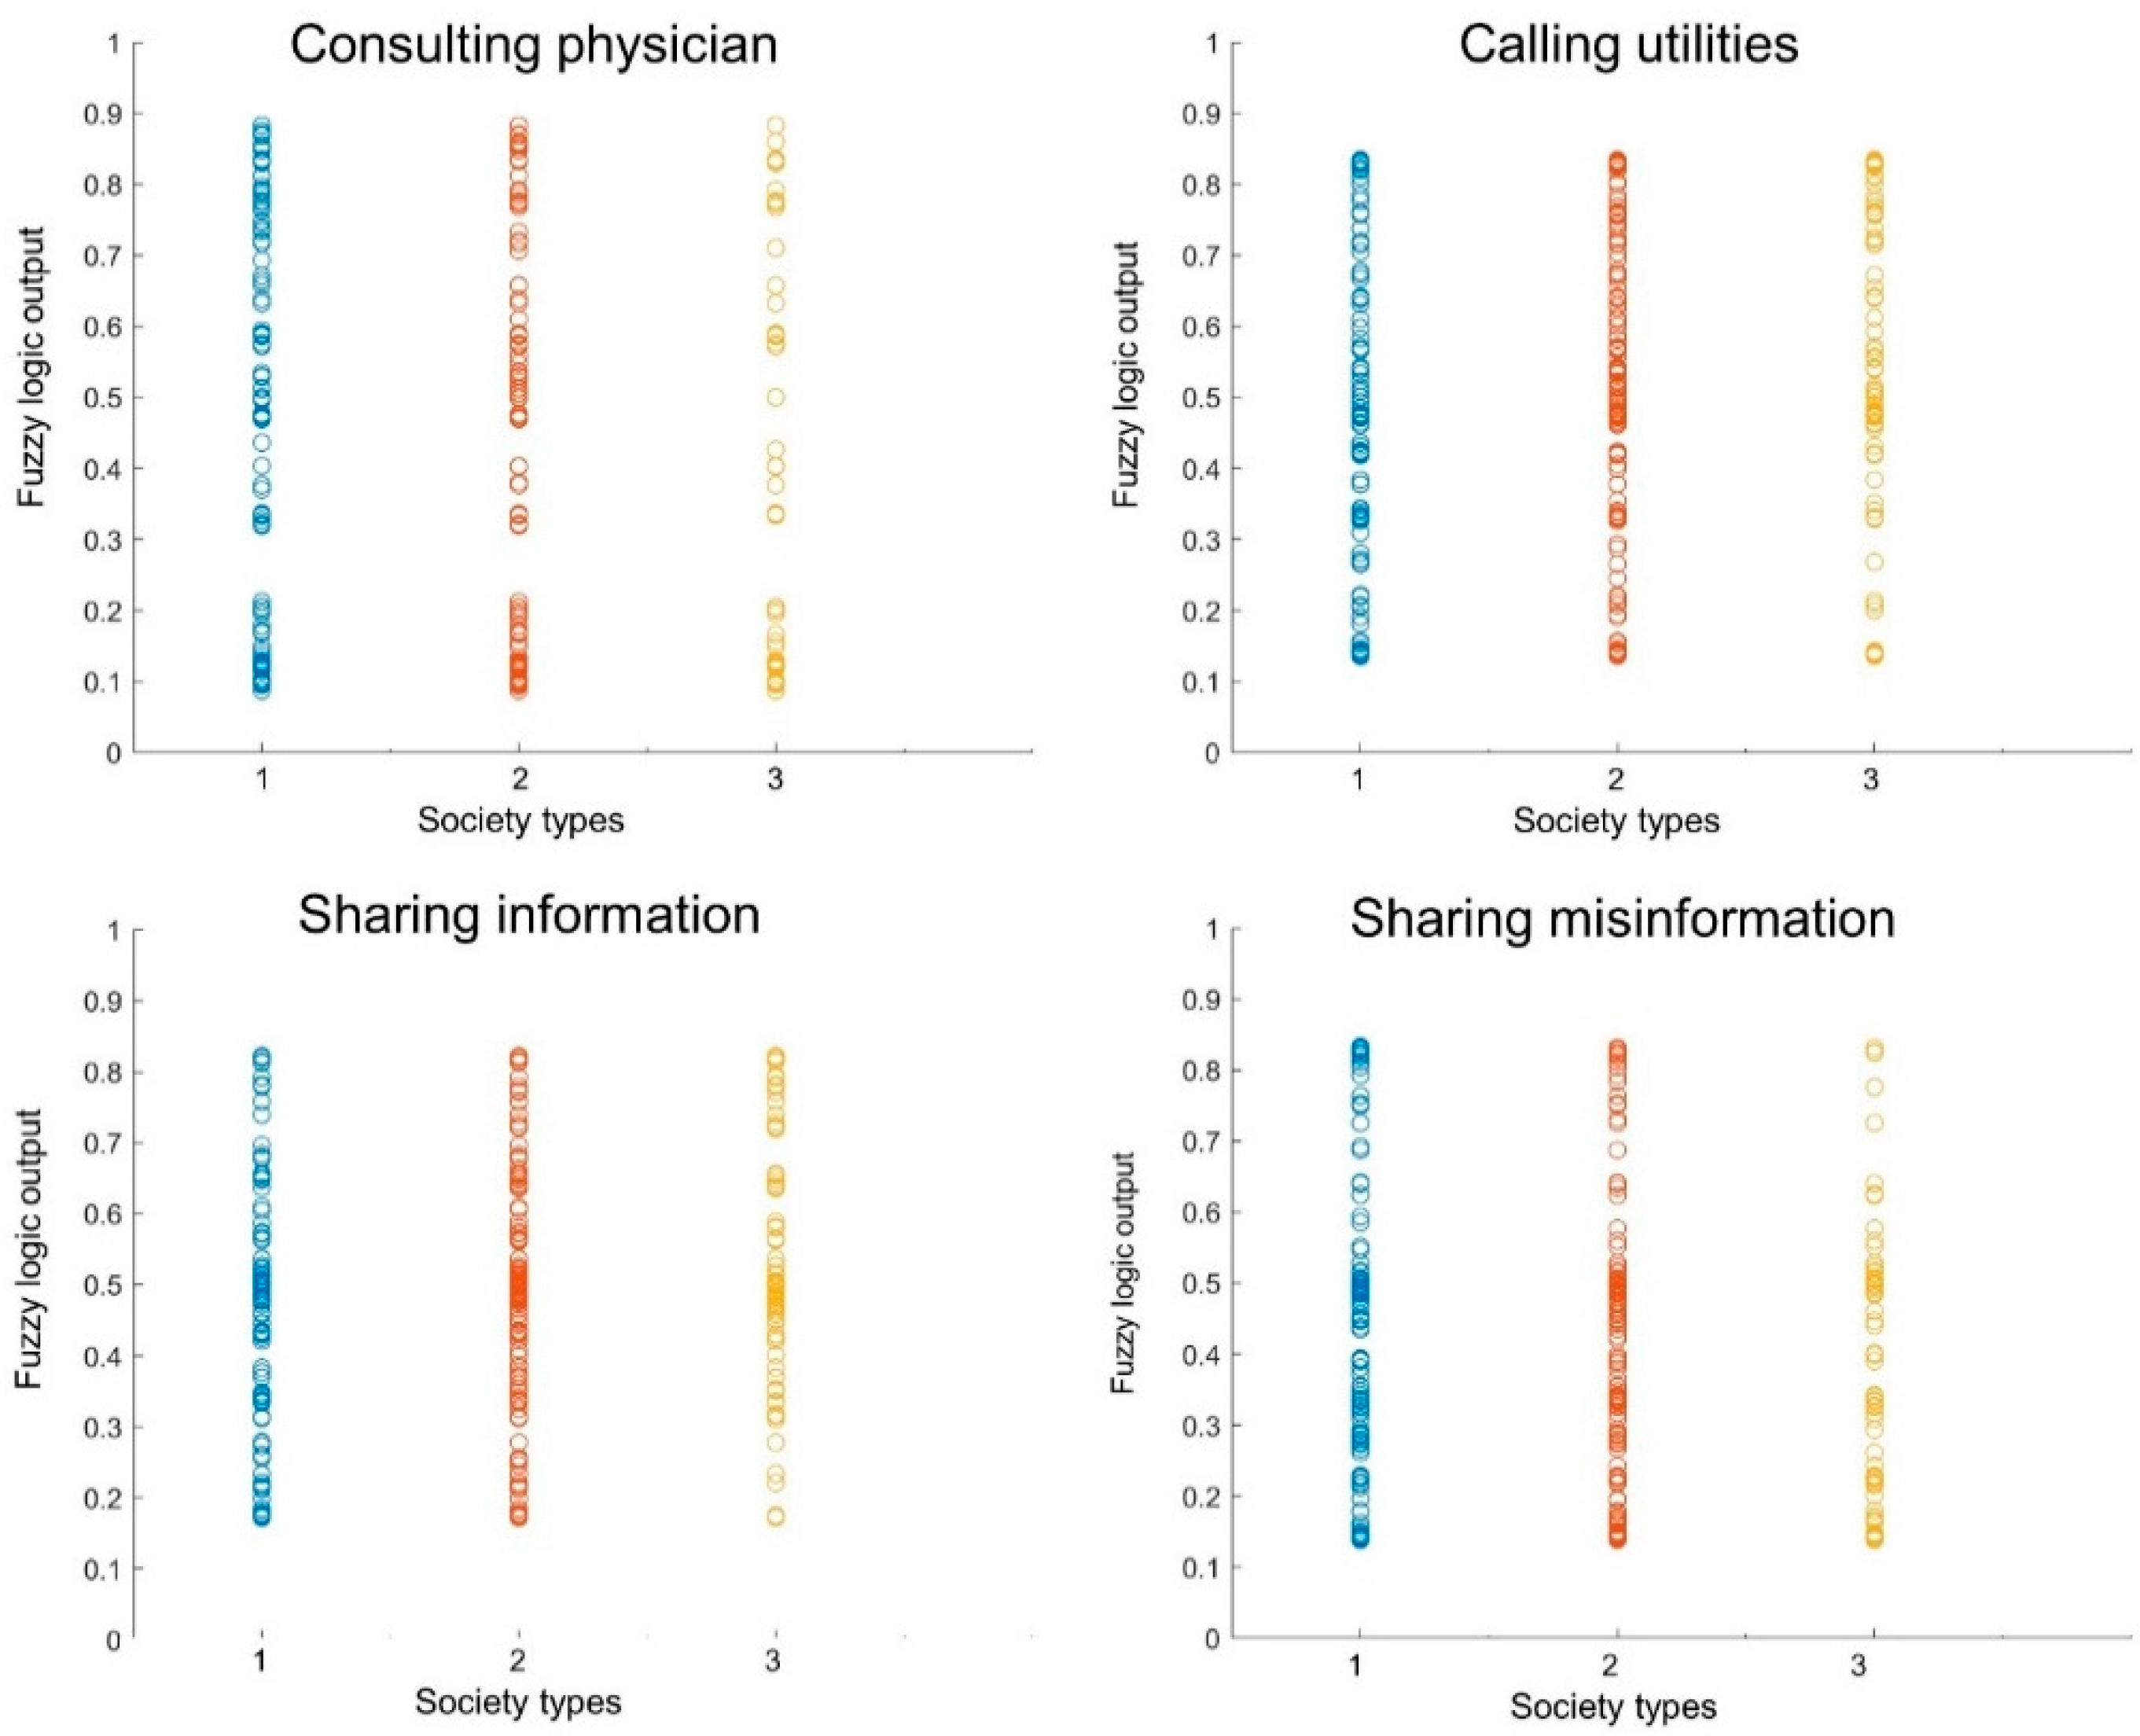
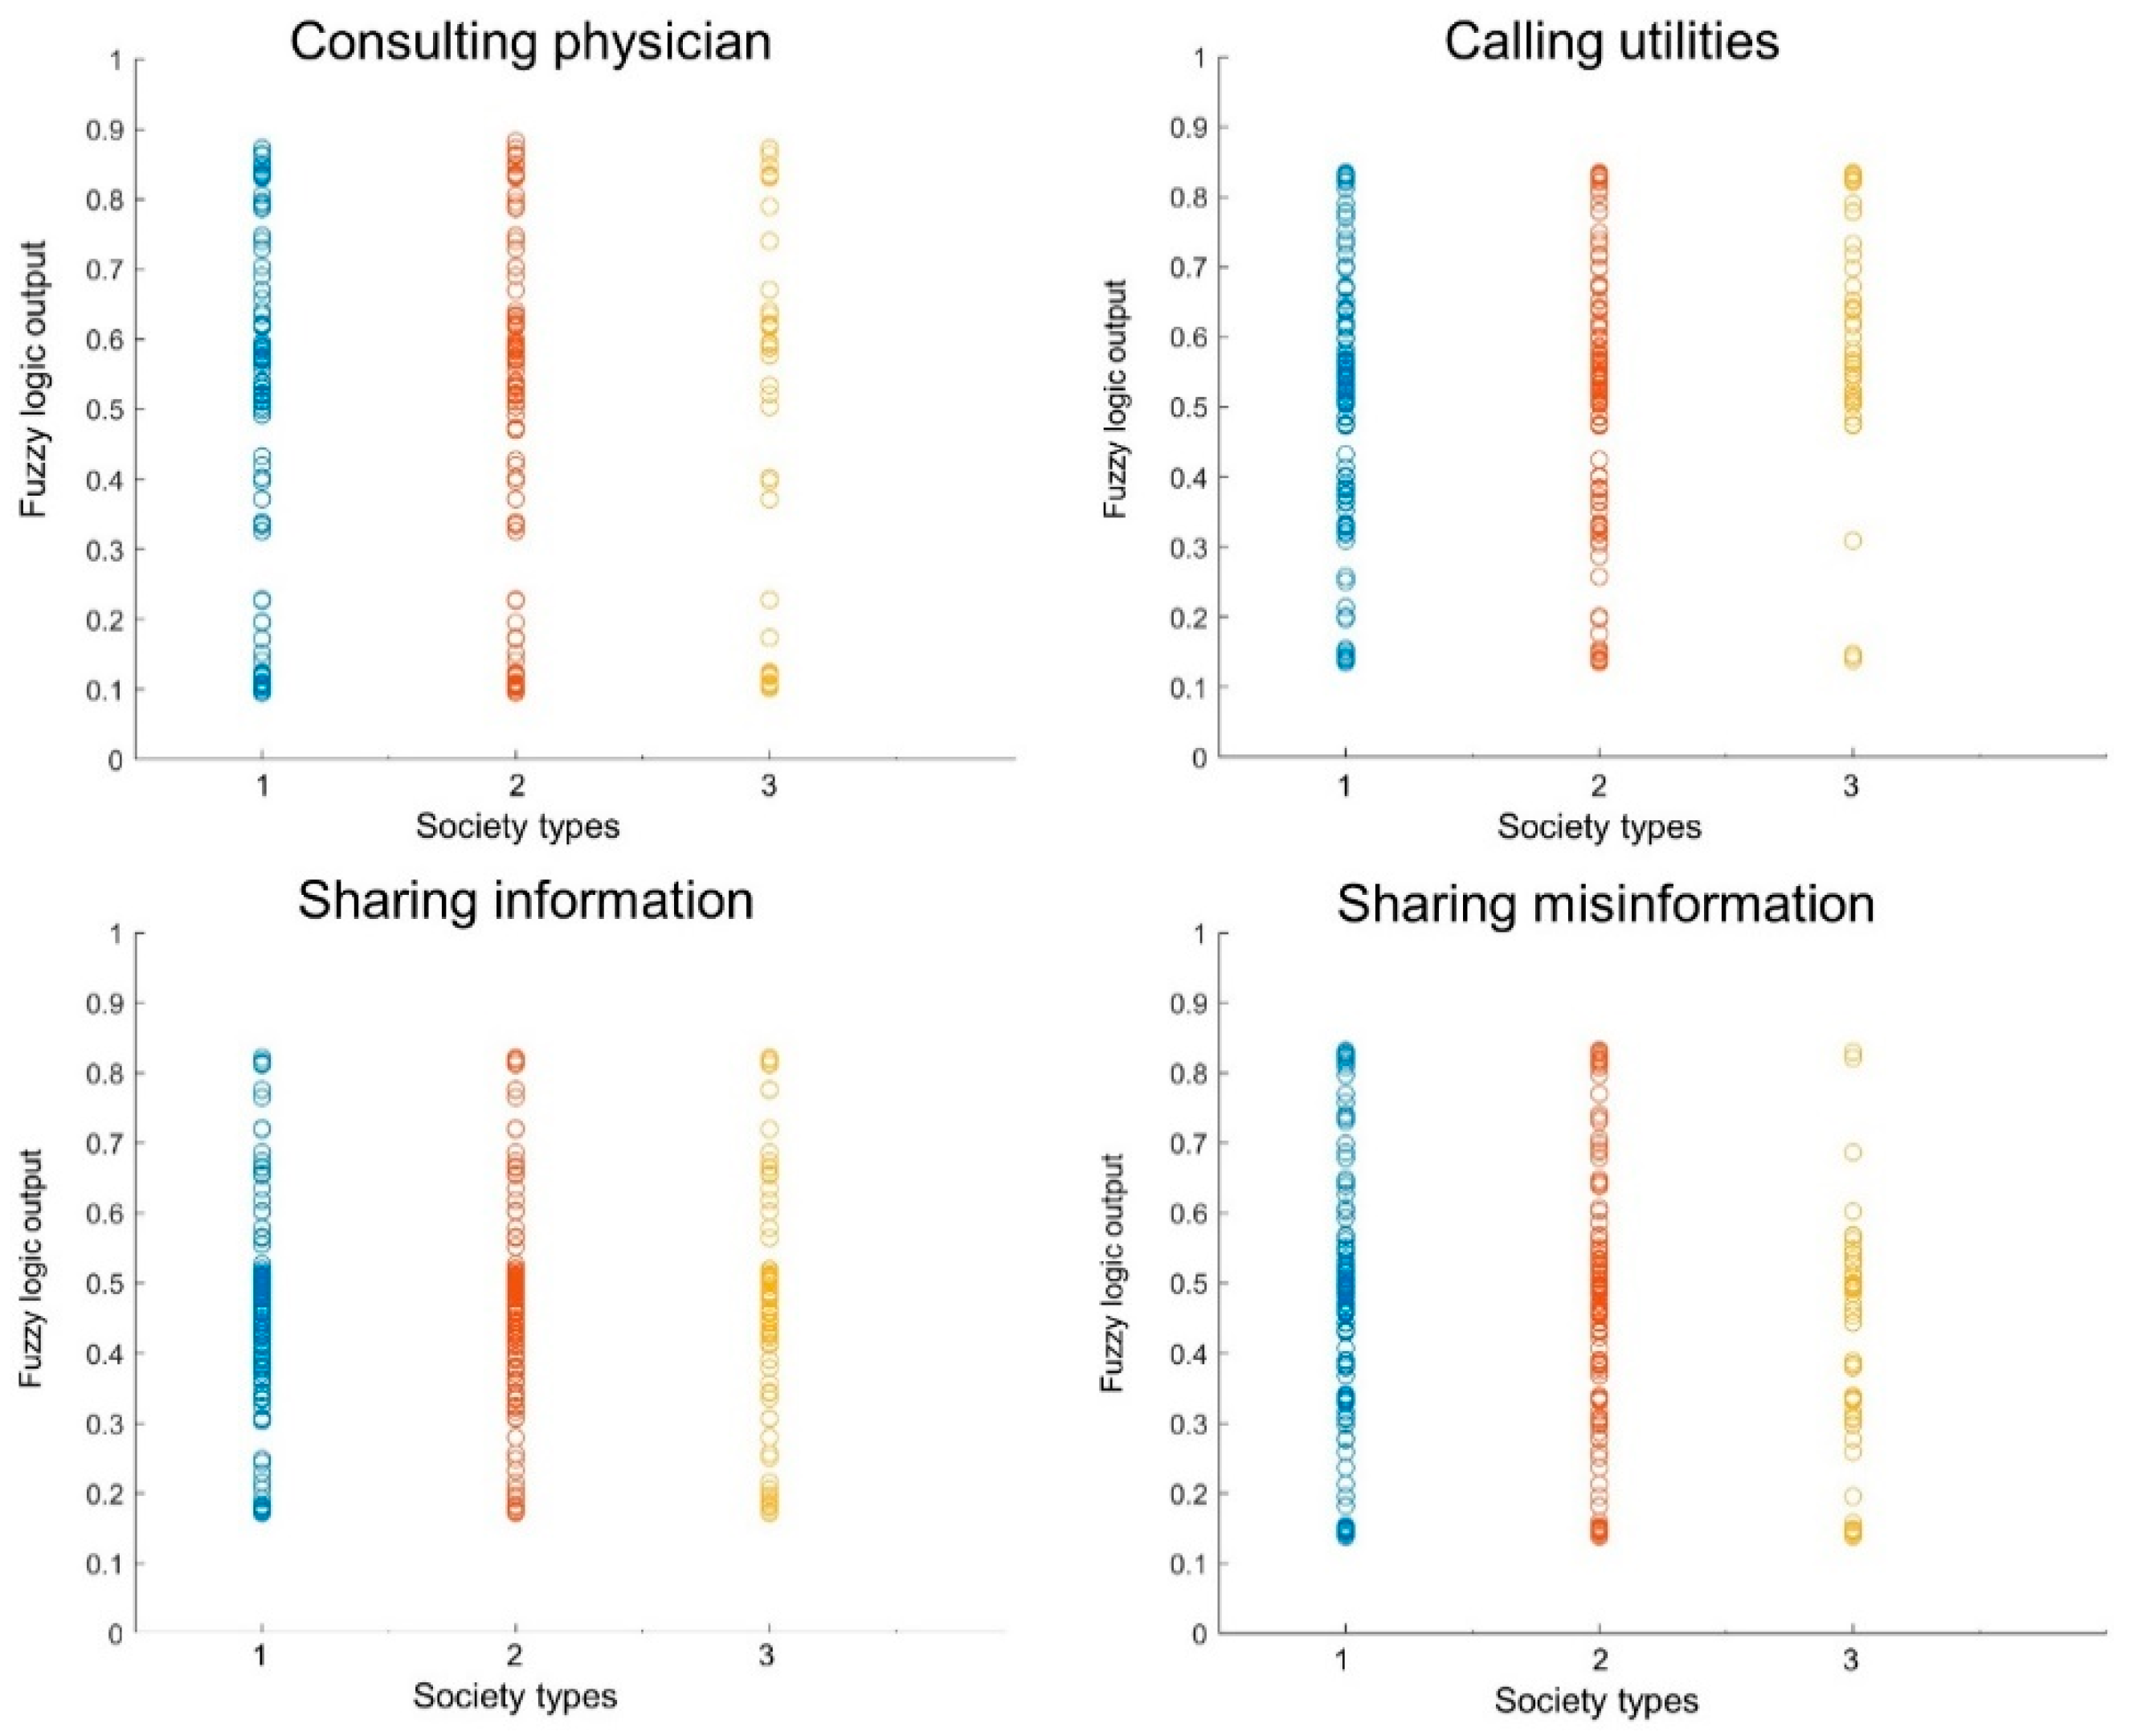
The first scenario solely considers the social background of the consumer agents as input variables in the fuzzy logic system for generating the output. The generated output determines which actions the consumer agents might take after an initial warning from the utility manager concerning a contamination event in the water distribution system. Figure 7 shows the scatter plot of the fuzzy logic output of the actions taken by the consumer agents in scenario one. The plots are divided into individual actions taken by consumer agents in the three different society types. As the consumers’ behaviour is mostly deterministic, there will be no uncertainty analysis needed for the results and analysis of the sensitivity analysis.
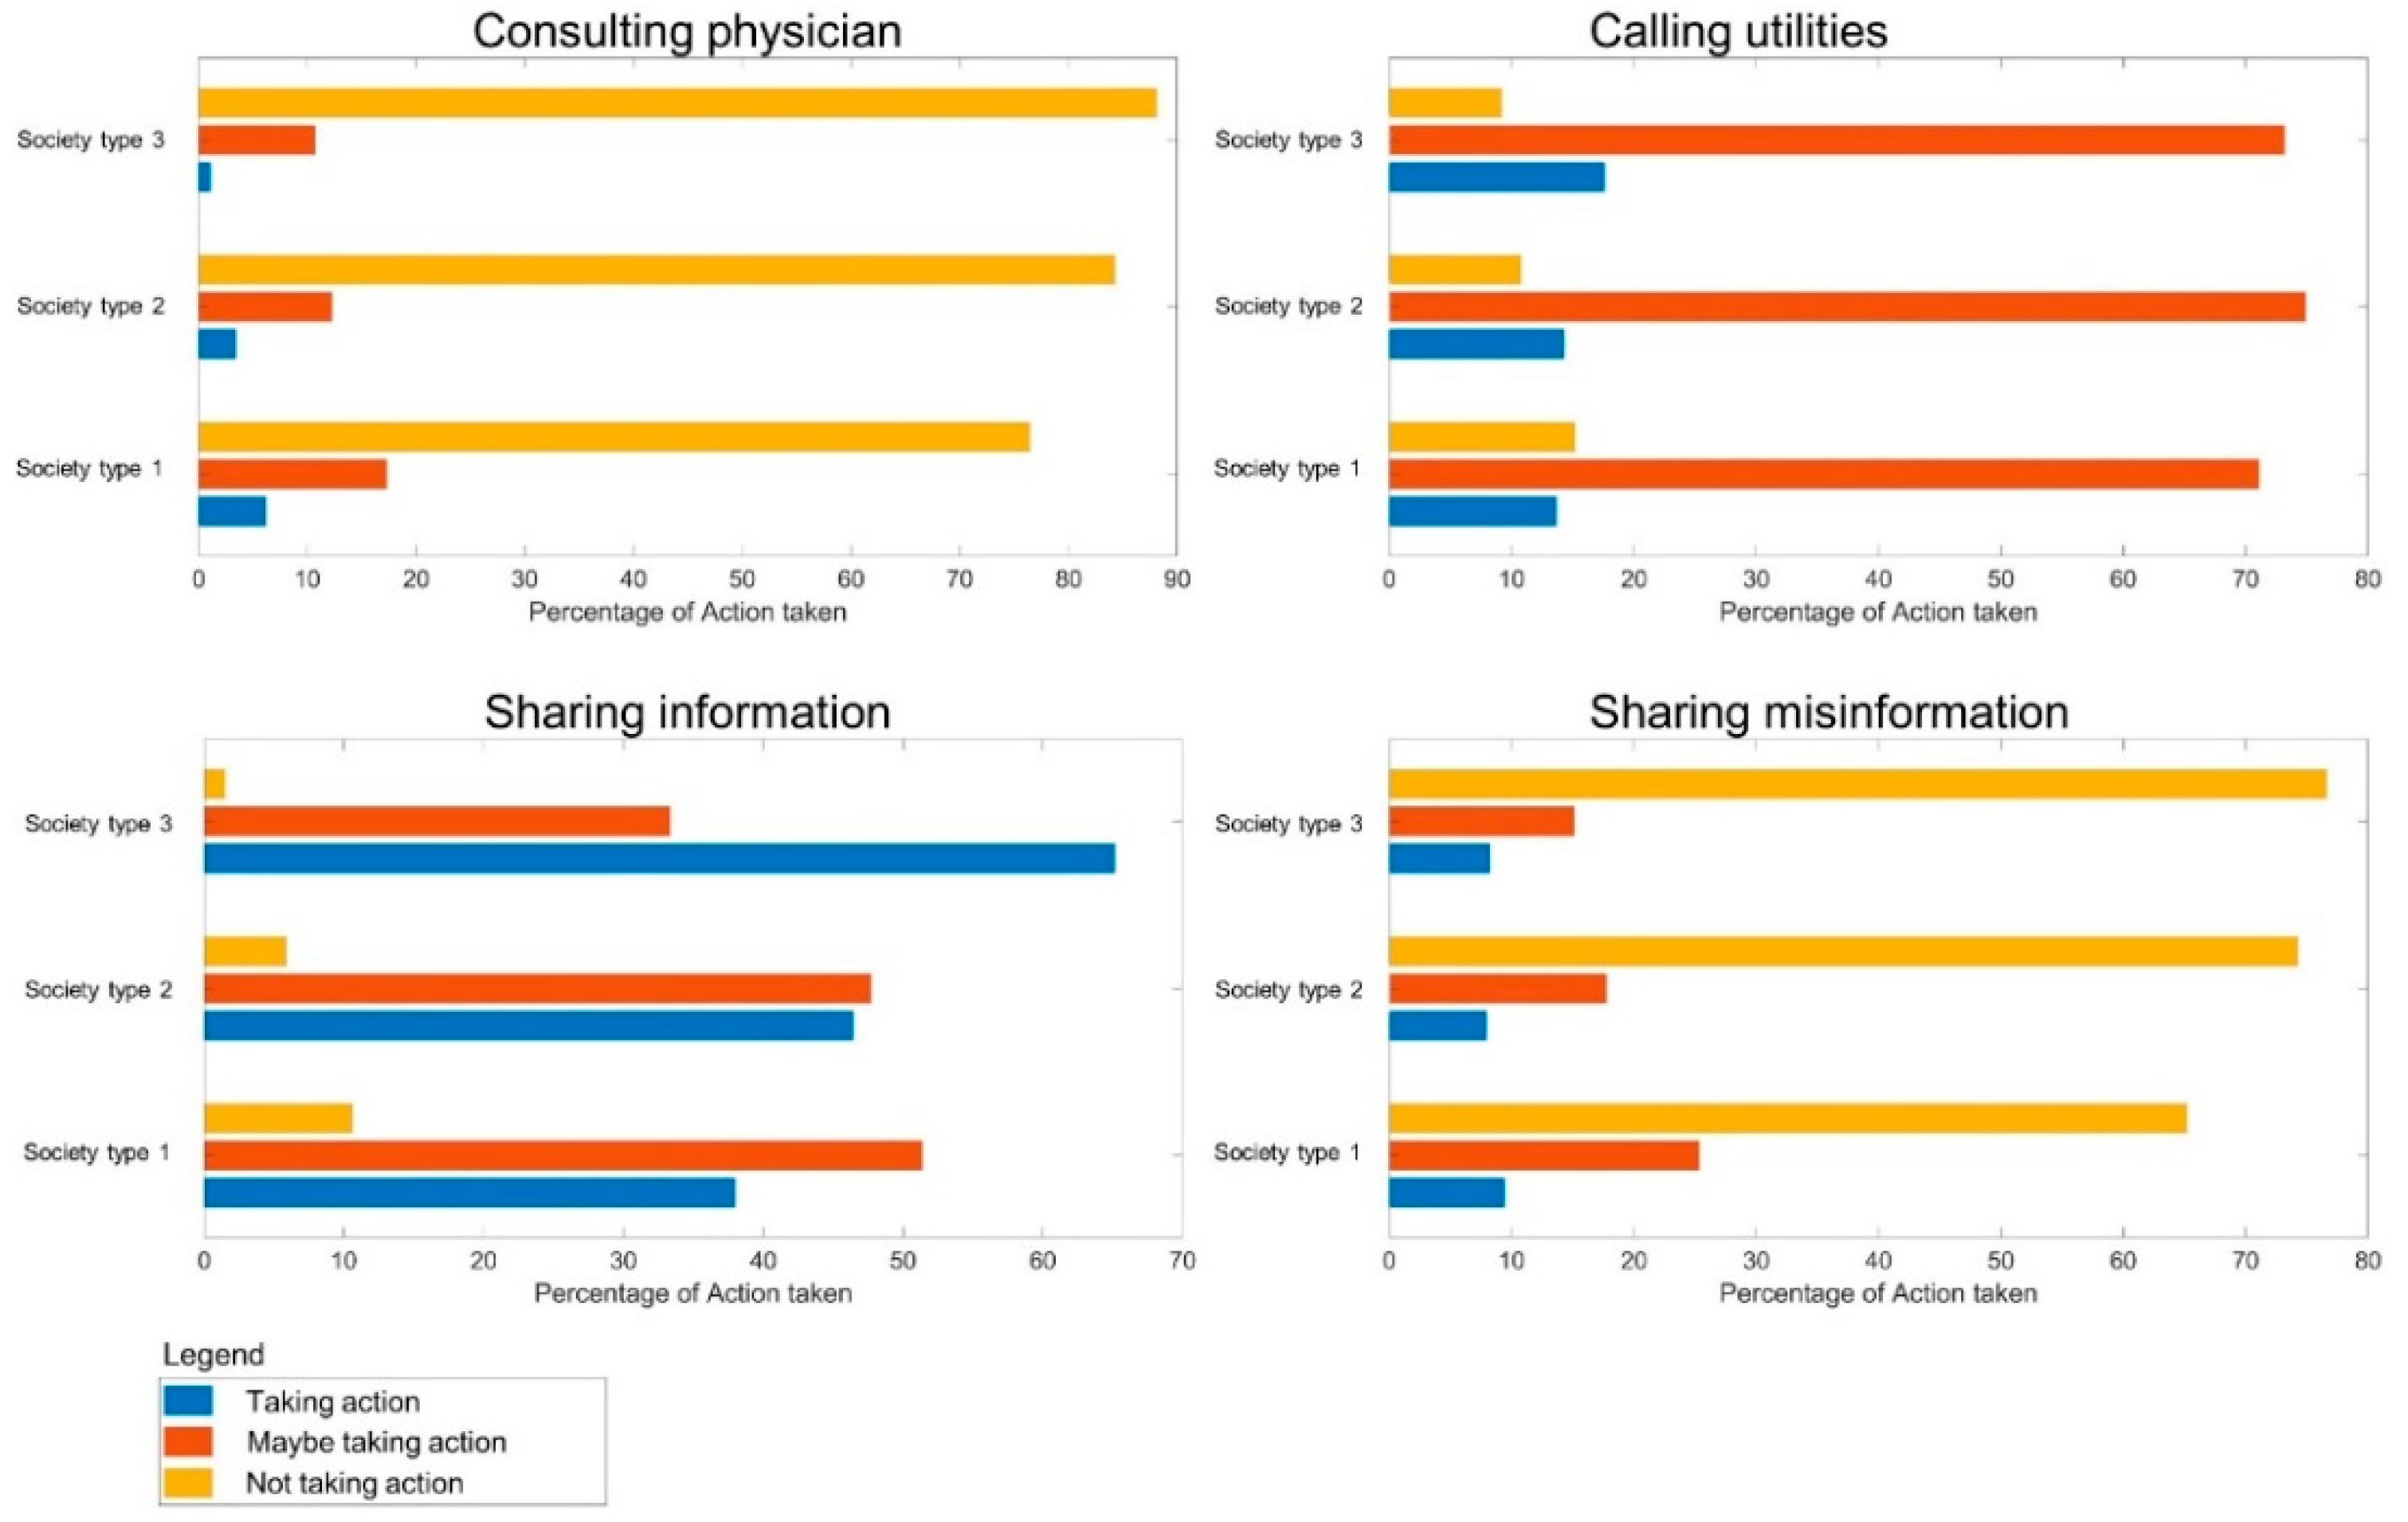
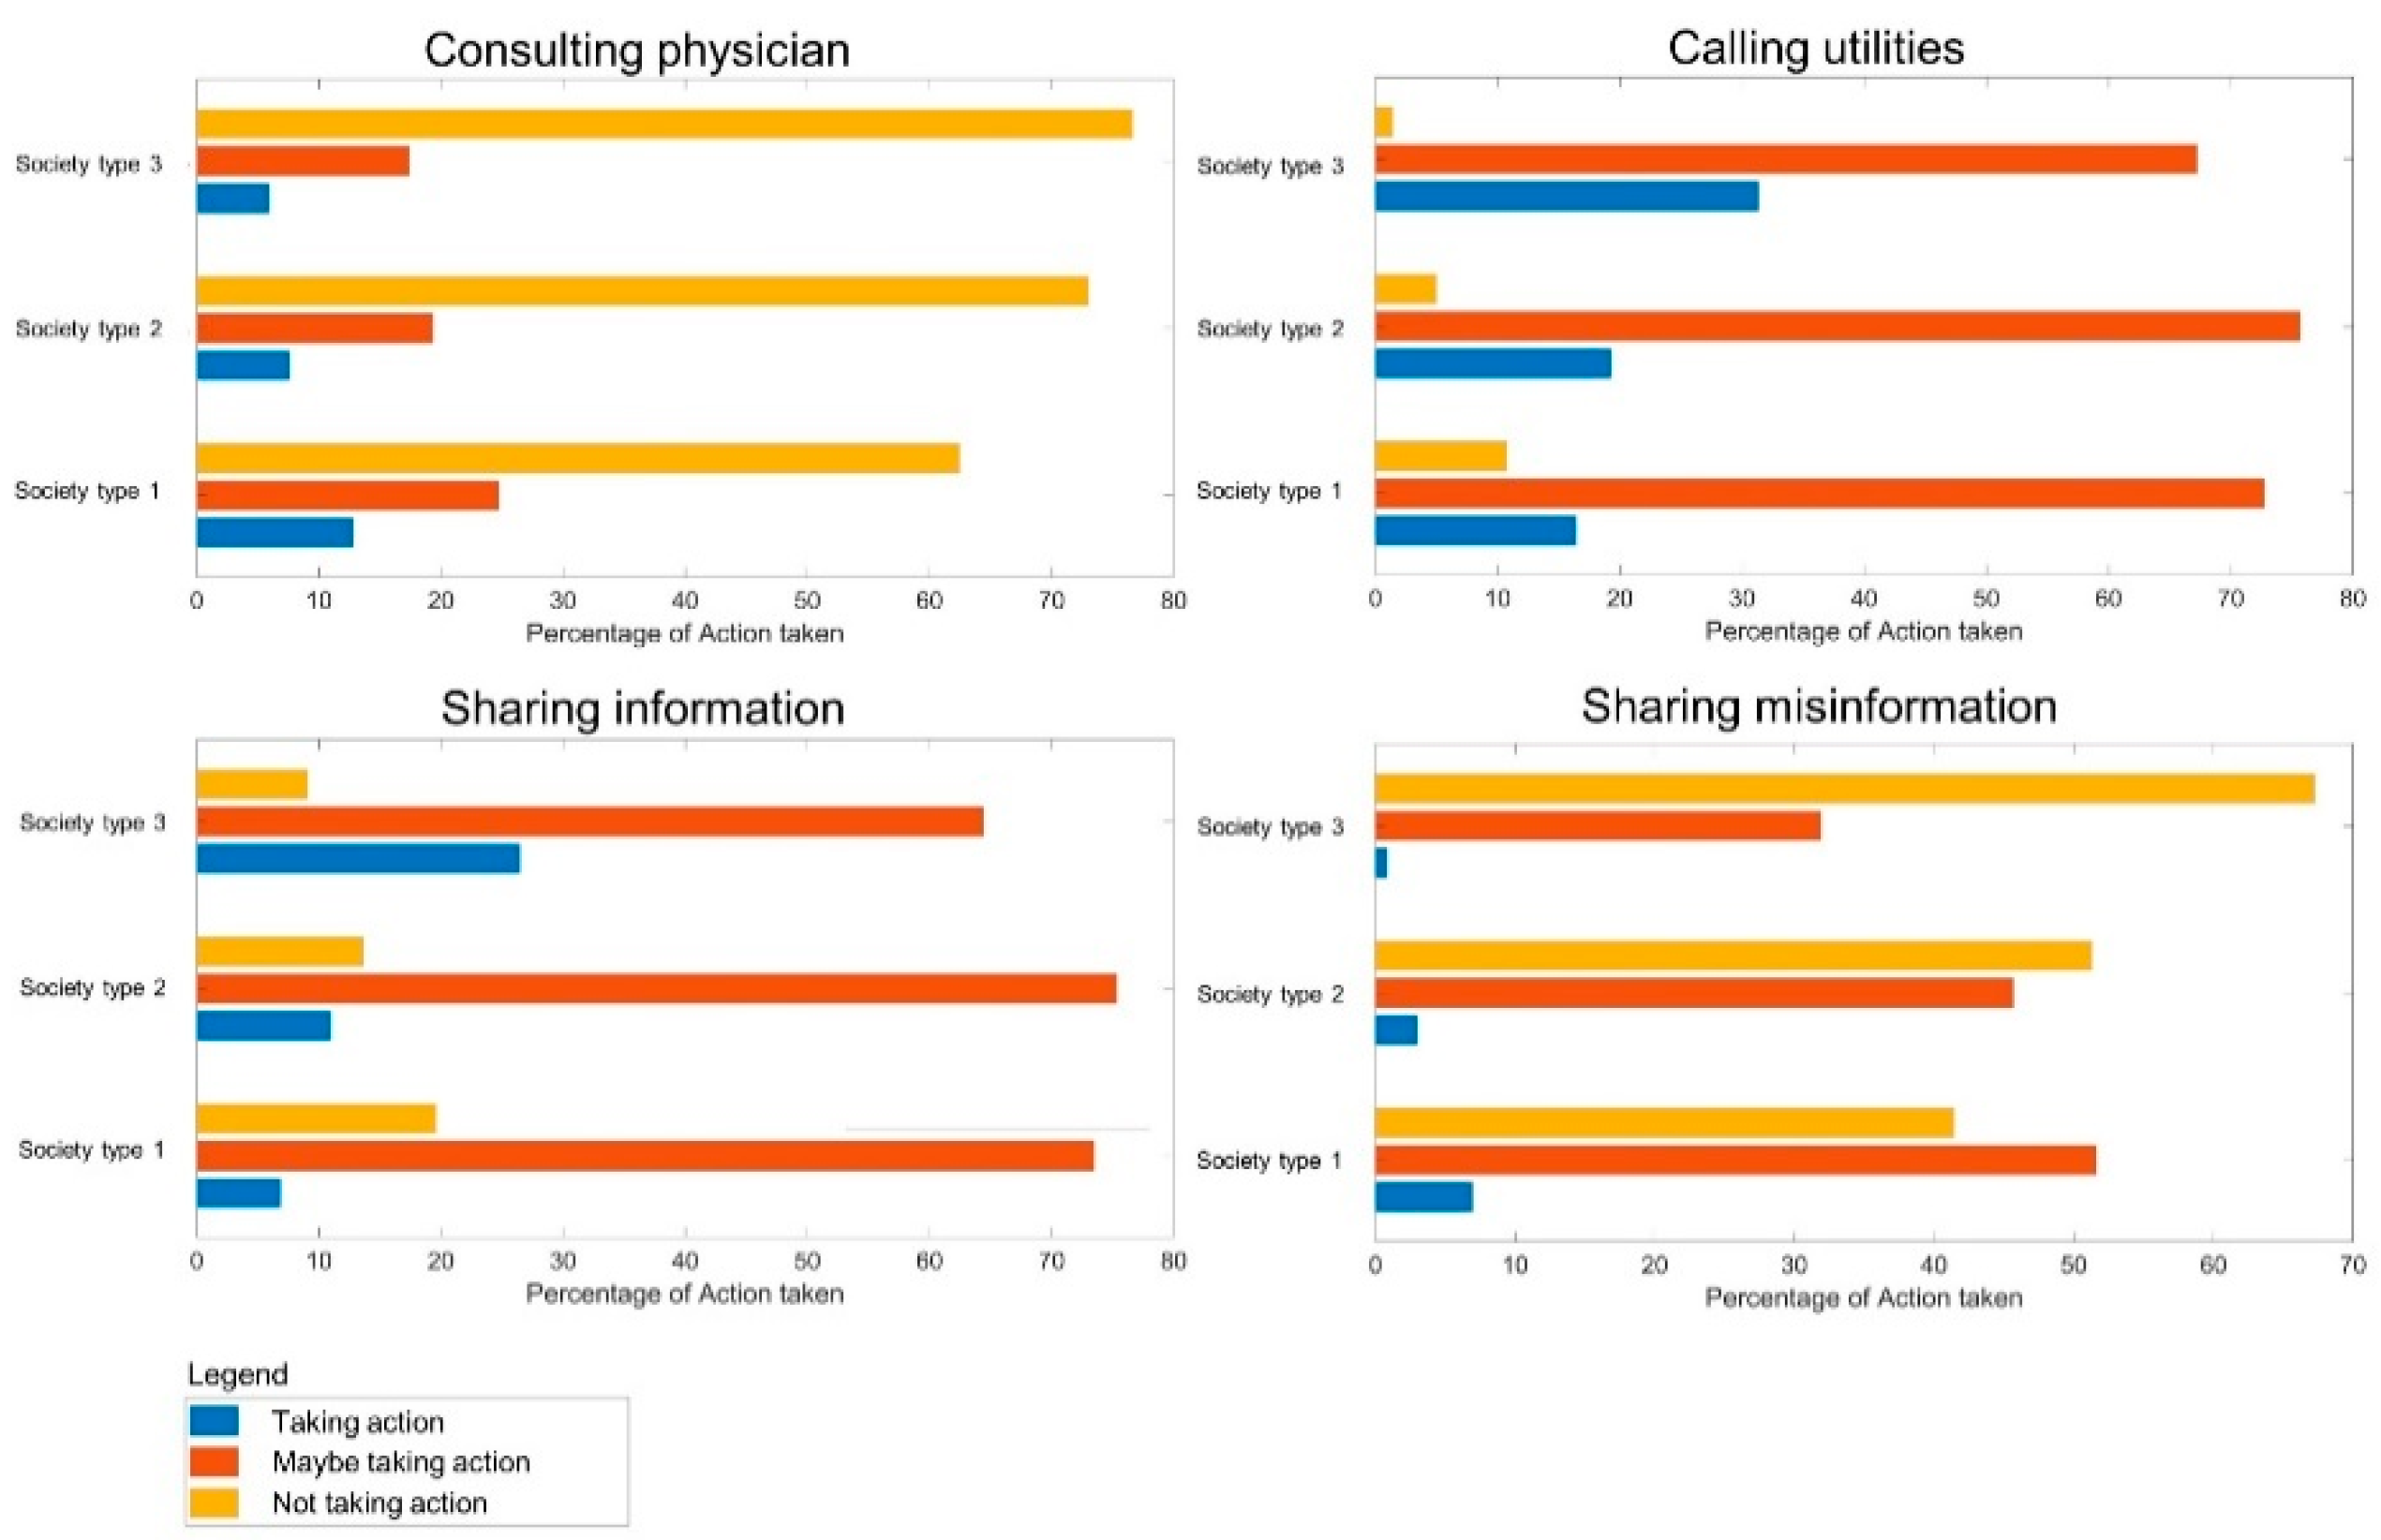
Furthermore, Figure 8 shows the percentage of each action taken by each individual society type over the course of 24 h. Because there is no information available on the geographical spread of the contamination, the actions are considered to be distributed equally throughout the network.
Few consumer agents take the action of consulting a physician through the different society types. The highest share of consumers which consult a physician during the contamination event are in society type 1, which can be explained by the higher amount of elderly people and the consequential poorer health status of fractions of that consumer population. Additionally, while there is no information on the geographical spread, a very high share of the consumer agents are willing to share information on the contamination event with their fellow consumers, with the largest percentages in society type 3, which can be attributed to the higher education status of that group. In addition, a higher part of the latter group called the utilities to either provide or receive information while most consumer agents stayed ambivalent about that particular action. Most of the consumers did not choose to share misinformation while around ten percent from society type 1 took that action. While it can be related to the education status of that specific group, the minor difference of group one to the groups three and five is evident.
4.2. Results Scenario Two
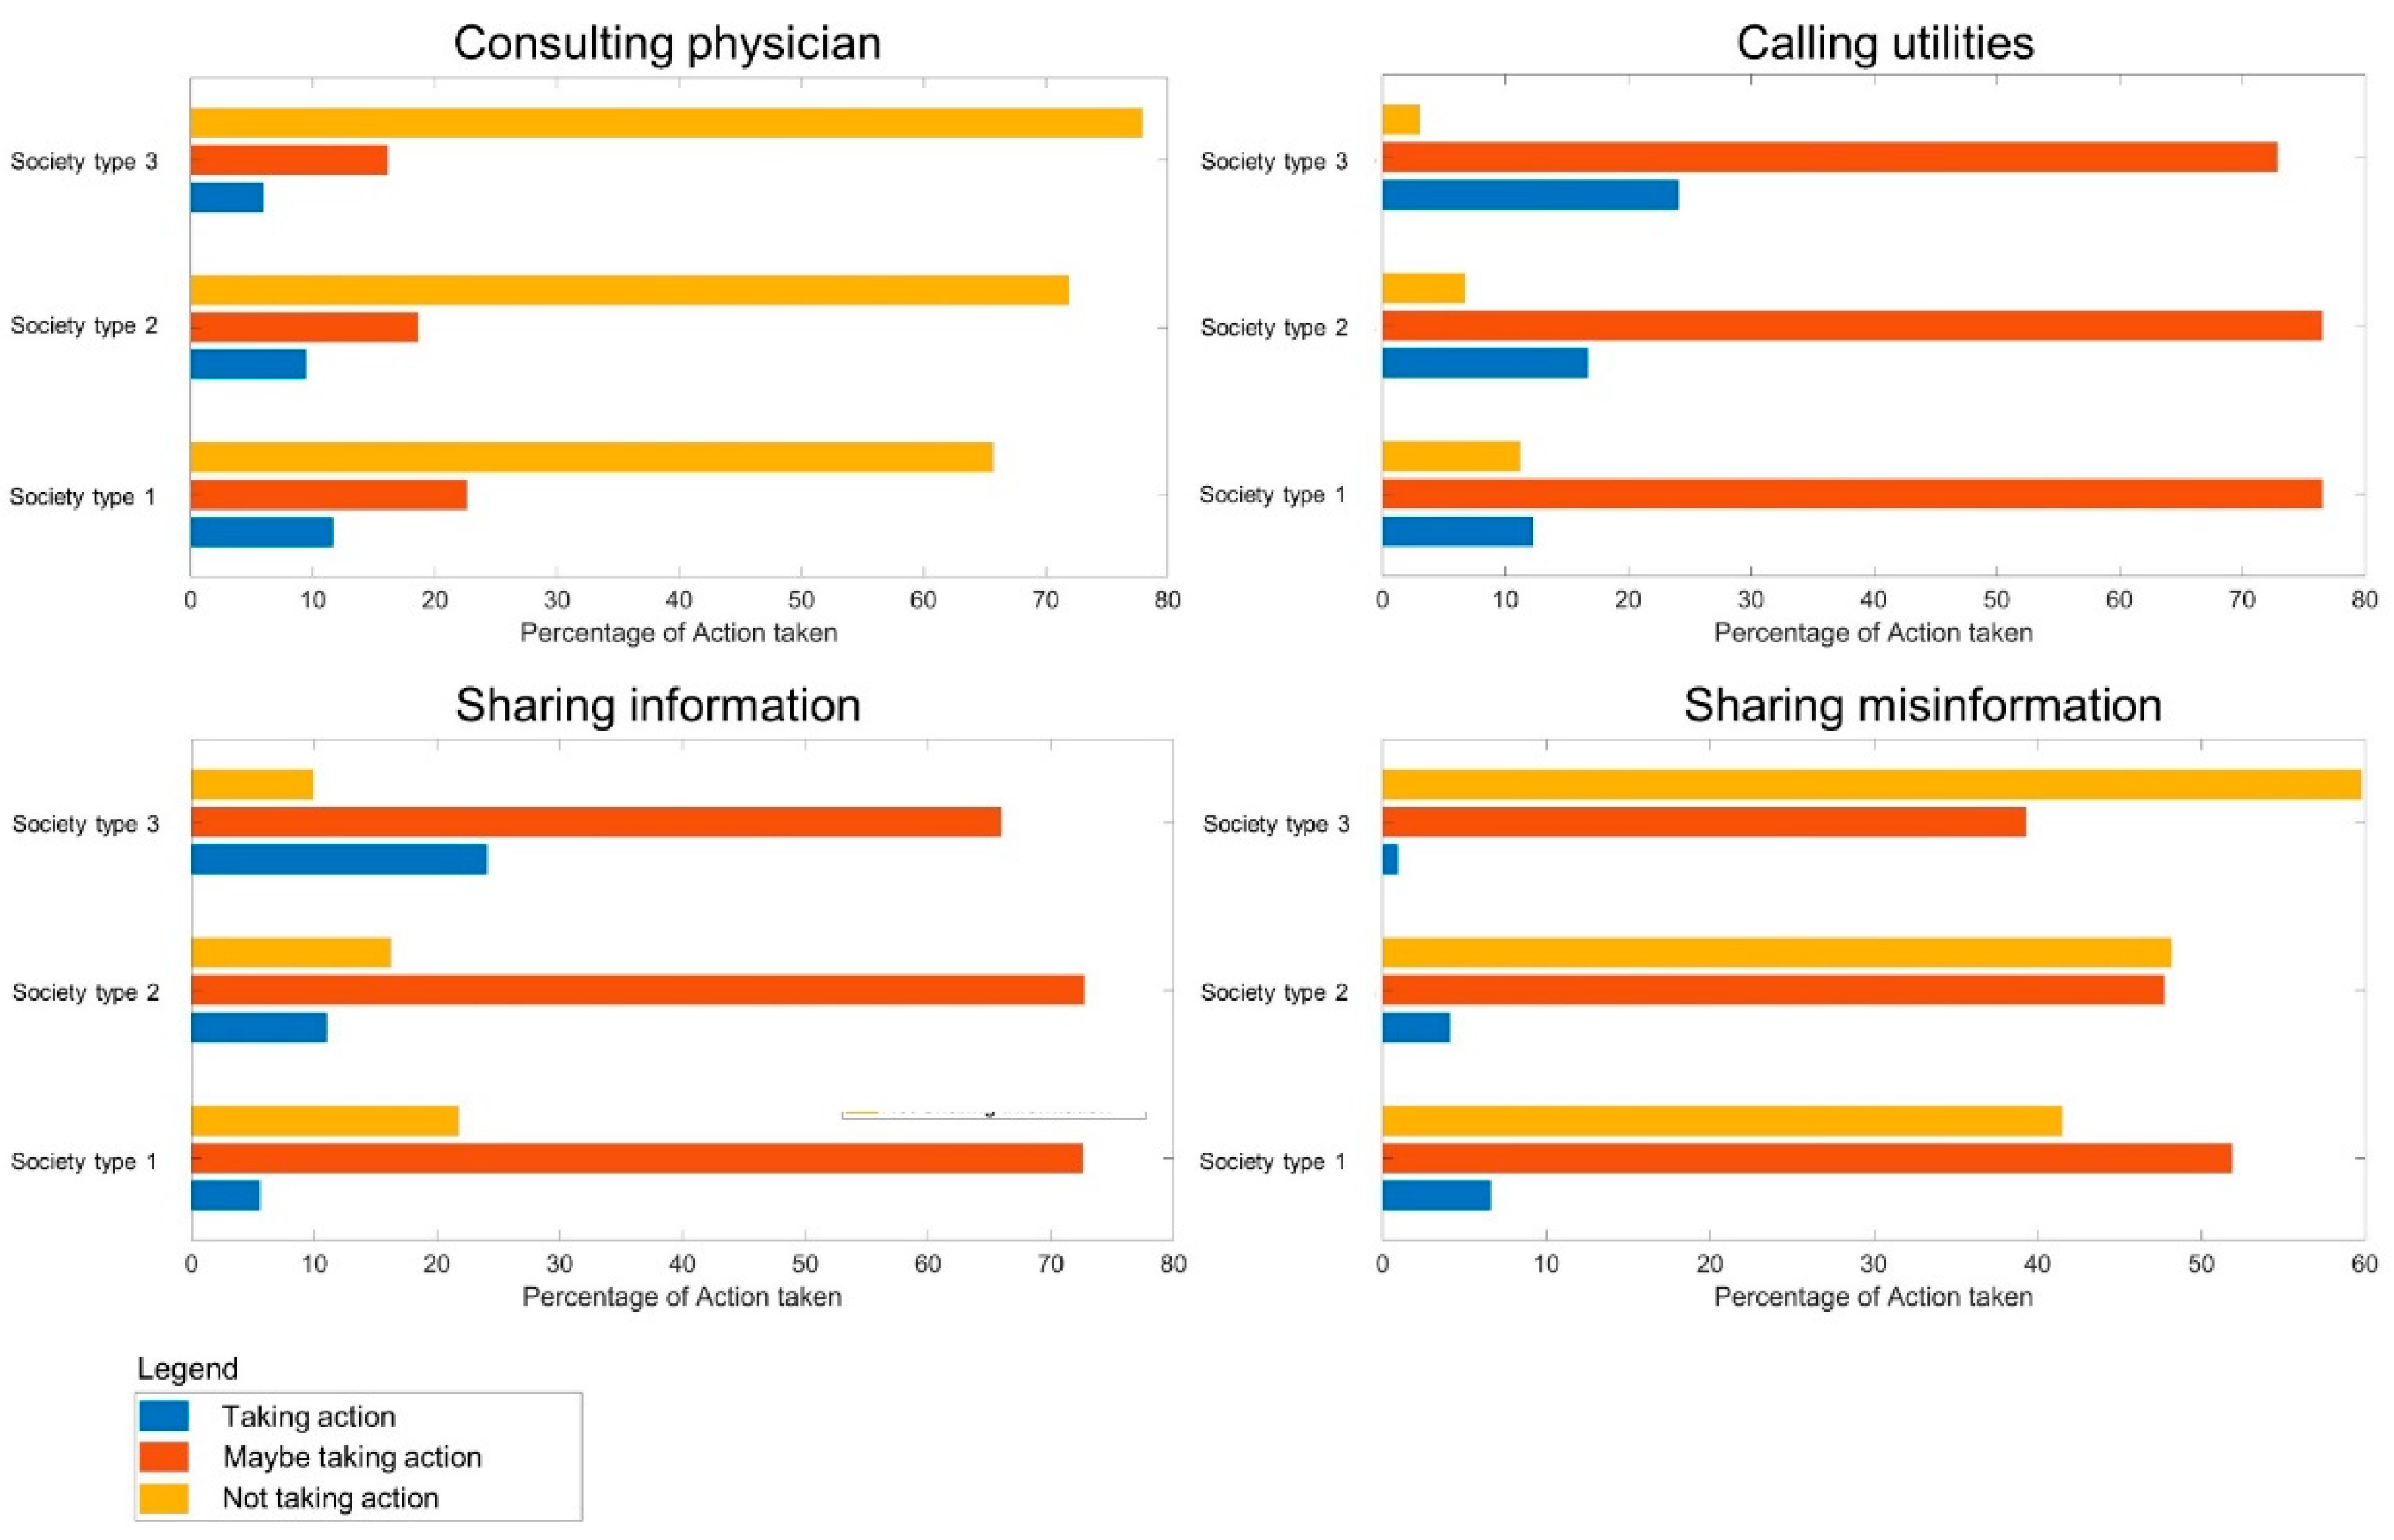
In scenario two, the location of the consumer agents in the network is considered as an input variable of the fuzzy logic system, hence relevant to the decision-making process of the consumer agents. This way, the geographical information on the contamination spread is transmitted to the consumer agents by the utility manager, and they can react according to their individual location in the network. Two hours after the initial and general warning concerning the contamination event, the information on which locations in the network are safe for consuming water and which are endangered is spread by the utility manager. Approximately 19% of the consumers are possibly affected by the contamination event in the WDS. Figure 9 shows the scatter plot of the fuzzy logic system’s output for the various actions of the consumer agents.
As seen in Figure 10, the location of the individual consumer agents does play a role in how these agents react to the information of a contamination event. The fuzzy logic rules have been accordingly weighted to consider the location of consumers. The share of consumers consulting a physician has approximately doubled, which evidently can be explained by distressed consumers located in the endangered areas. Interestingly, the number of consumers which might share information or misinformation has dramatically decreased. As most of the consumers (81%) are not affected by the contamination event and get this information two hours after the initial issuing of the warning, the interest for the majority of the agents is not as high as it was when the contamination event could have affected any place in the network. The highest percentage of consumer agents which consult a physician are still in the society type 1, while the difference to other society types is not significant. The society type 1 agents have a higher percentage of being inclined to share misinformation in the case of a contamination event with geographical spread information available, while the agents in society type 3, as in scenario one, are more likely to share correct information on the spread or call the utilities.
4.3. Results Scenario Three
For the third scenario, an additional input variable determines whether the individual consumer agents show possible symptoms from ingesting contaminated water. Therefore, it is assumed that ten percent of the consumer agents inside the endangered area might show relevant symptoms for which they have to consult with a physician. Figure 11 shows the scatterplot of the fuzzy logic output, and Figure 12 the percentage of the actions taken by the consumer agents.
Evidently, there is not substantial change from the second scenario. The fraction of consumers which are actually affected by ingesting contaminated water is not majorly significant and there might still be a threshold for the consumer agents to consult a physician in the first 24 h after contamination. Thus, the difference of the third scenario to the second scenario is not noticeably significant. Furthermore, the information status of the consumer agents that not only ingested contaminated water but also experience symptoms has a big influence on the actual percentage of the agents which consider sharing the information or will try to get help. A slight increase in consumer agents which consult physicians can be observed, which can be explained by the consumers with symptoms from possibly ingesting contaminated water seeking medical help. Furthermore, possibly as a result of the gravity of the situation of an event which can have effect on consumer health, there is also an increase in calls to the utilities as well as in sharing information on the event with fellow consumers in the network. The relationship of the distribution of actions in-between the society types is not different from scenarios 1 and 2. Agents in society type 1 are still more likely to consult a physician or share misinformation while consumer agents in society type 3 are more likely to share correct information or call the utilities.
5. Conclusions
Prior work has documented the use of inline mobile sensors during contamination events in a WDS as well as the utilisation of agent-based modelling for exploring, e.g., consumer reactions to the policies of utility managers, such as flushing rules or broadcasting warnings. In addition, various studies have used interdisciplinary approaches which involve psychology and computer science to simulate agents’ behaviour during panic situations. Most previous studies which use agent-based models to simulate contamination events in a WDS use statistical and mathematical models as well as assumptions regarding the behaviour and decision-making of the consumer agents.
In this study, social background and how the possibly correlated psychological states might influence consumer agents’ actions upon a warning about a contamination event through traditional and social media are explored. Moreover, analogies to the COVID-19 pandemic response of “contact tracing” were drawn to set up a scheme of placing mobile equipment to trace the contamination spread in the network, while issuing warnings and clearances of endangered or safe zones in the network to the consumer agents in real time.
Additionally, the consumer’s social background, their location in the network as well as possible symptoms from ingesting contaminated water were incorporated into a fuzzy logic system to determine their actions. The actions incorporate their tendency to consult a physician, call the utilities, share information on the ongoing situation or share “fake news” due to warnings concerning the contamination event. Furthermore, the consumer agents have been divided into three society types in order to represent different socioeconomic backgrounds. The society types were further characterised by different fractions of the social background input variables in the respective groups.
It was found that it is important to consider the social background and the structure of the population when dealing with a major water quality event in a WDS. In particular, the age structure of the population seems to be a good factor in predicting the tendency to consult physicians or call the utilities. As other agent-based studies in water resource management focus on interaction of stakeholders under certain conditions, e.g., [19,21], this study shows that it is crucial to explore the implications which a detailed analysis of a consumer’s/stakeholder agent´s background can have on the results of the model.
While the consideration of the individual location of each agent in the network as well as possible symptoms slightly increased the number of agents consulting a physician, the number of consumers sharing information or misinformation on the event decreased dramatically. This shows that consumers which are not affected by the contamination event have less interest in sharing necessary information on the event. This is subsequently due to the division of the network into “safe” and “endangered” zones by the placement of mobile sensor equipment by the utility manager. This allows the utility manager to track and trace the contamination spread and issue clearances for parts of the system where consumer agents can continue using water while others do not. While other studies dealt with, e.g., optimising the information flow of water advisories [23] or flushing methodologies [16] upon a contamination event in a water network, this work has shown that considering the geographical spread of the contamination plume is just as critical in a contamination response and recovery strategy for water utilities.
It is shown in this study that placing mobile equipment can be an essential part of the response and recovery to a contamination event while considering the population structure of any given society. In particular, the real-time information on the geographical spread of the contamination event helps to control the response of the consumer agents to the contamination event. Placing mobile sensor equipment in real time to divide the network into various clusters and to predict and follow up on the fate of the contamination in the water network has shown to be very effective, and is a good additional alternative to the usage of solely fixed sensors [1] or inline water quality sensors [7,41].
Future work should not only consider social backgrounds but also model psychological processes and dynamics, which were mostly neglected in this fuzzy logic system. Accordingly, for simulating the warnings of the utility manager, a more comprehensive social network has to be established. This can be accomplished by using a graph which describes the interconnectivity of the social contacts of each agent, including family and friends, which are described by the individual nodes in the network. Additionally, the influence of real and fake information distribution on the consumer agents shall be modelled and processed depending on their social backgrounds. The assumptions taken for the societal types can be expanded by using actual census data for a specific town or even a virtual town where data on the population structure can be found. Furthermore, the movement of various agent types into industrial nodes as well as their exact reactions to a contamination event while exerting water demands there can be incorporated into future work. Additionally, more methodological ways of solving the classification problem of the various input characteristics that are influencing the consumer agent’s decision-making, such as support vector machines (SVMs) or random forests (RFs) should be explored in future work. This way, the weight of the single parameters on the decision-making processes can be singled out and classified more thoroughly. Furthermore, while consumer behaviour was mostly deterministic, future work should include uncertainty and reliability analysis.
Future studies should involve the change in flow direction in the water network in response to the event. Furthermore, while the consideration of pipe break and dispersion are very important for simulating how the contaminants in the system are moving, an advection assumption is used for the current hydraulic simulation framework. While the study does not take pipe breaks in the system into account, the system assumption includes leakages at random positions in the water network. A pipe break approach as well as considerations of longitudinal dispersion coefficients will be considered in a future stage of this study.
The medical and geographical information given by the consumers to the medical facilities and to the utility manager during the event have to be considered and processed in the model while considering the uncertainty of parts of this information. COVID pattern-detection algorithms, such as those introduced in the beginning of this study, are a type of consideration that will be added to this study in the future as an enriching aspect.
Additionally, the information gathered by the fixed sensors during the contamination event will have to be considered and processed during the process of placing mobile equipment and warning the public.
One way for the utility manager to process the incoming data can be conducted through utilising supervised learning algorithms. A support vector machine or a dependent number of features and training examples of a neuronal network can be used as a decision support tool for placing mobile sensor equipment with the objectives used in this study and for processing possible uncertainties as well as information submitted by consumer agents through calls to the utilities. Information given to physicians and their integration into the wholesome process of collecting and distributing the correct information in real time should be incorporated as well.
Author Contributions
Conceptualisation, L.K. and A.O.; Methodology, L.K. and A.O.; Writing—Original Draft Preparation, L.K.; Writing—Review and Editing, L.K. and A.O.; Supervision, A.O.; Project Administration, A.O.; Funding Acquisition, A.O. All authors have read and agreed to the published version of the manuscript.
Funding
This research was supported by a grant from the United States–Israel Binational Science Foundation (BSF), Jerusalem, Israel (grant no. 2024160).
Institutional Review Board Statement
Not applicable.
Informed Consent Statement
Not applicable.
Data Availability Statement
The data presented in this study are available on request from the corresponding author.
Acknowledgments
This research was supported by a grant from the United States–Israel Binational Science Foundation (BSF).
Conflicts of Interest
The authors declare no conflict of interest.
References
- Janke, R.; Murray, R.; Uber, J.; Taxon, T. Comparison of Physical Sampling and Real-Time Monitoring Strategies for Designing a Contamination Warning System in a Drinking Water Distribution System. J. Water Resour. Plan. Manag. 2006, 132, 310–314. [Google Scholar] [CrossRef]
- Hall, J.; Zaffiro, A.D.; Marx, R.B.; Kefauver, P.C.; Radha Krishnan, E.; Haught, R.C.; Herrmann, J.G. On-line water quality parameters as indicators of distribution system contamination. J. Am. Water Work. Assoc. 2007, 99, 66–77. [Google Scholar] [CrossRef]
- Ostfeld, A.; Asce, M.; Salomons, E. Optimal Layout of Early Warning Detection Stations for Water Distribution Systems Security. J. Water Resour. Plan. Manag. 2004, 130, 377–385. [Google Scholar] [CrossRef]
- Ostfeld, A.; Über, J.G.; Salomons, E.; Berry, J.W.; Hart, W.E.; Phillips, C.A.; Watson, J.P.; Dorini, G.; Jonkergouw, P.; Kapelan, Z.; et al. The battle of the water sensor networks (BWSN): A design challenge for engineers and algorithms. J. Water Resour. Plan. Manag. 2008, 134, 556–568. [Google Scholar] [CrossRef] [Green Version]
- Wu, L.; Wan Salim, W.W.A.; Malhotra, S.; Brovont, A.; Park, J.H.; Pekarek, S.D.; Banks, M.K.; Porterfield, D.M. Self-powered mobile sensor for in-pipe potable water quality monitoring. In Proceedings of the 17th International Conference on Miniaturized Systems for Chemistry and Life Sciences, Freiburg, Germany, 7–31 October 2013; Volume 1, pp. 14–16. [Google Scholar]
- Perelman, L.; Arad, J.; Housh, M.; Ostfeld, A. Event detection in water distribution systems from multivariate water quality time series. Environ. Sci. Technol. 2012, 46, 8212–8219. [Google Scholar] [CrossRef]
- Sankary, N.; Ostfeld, A. Inline mobile sensors for contaminant early warning enhancement in water distribution systems. J. Water Resour. Plan. Manag. 2016, 143, 1–12. [Google Scholar] [CrossRef]
- Kadinski, L.; Rana, M.; Boccelli, D.; Ostfeld, A. Water Distribution Systems Analysis. In Proceedings of the World Environmental and Water Resources Congress 2019, Pittsburgh, PA, USA, 19–23 May 2019; American Society of Civil Engineers: Reston, VA, USA, 2019; pp. 536–542. [Google Scholar]
- Post, C.; Brülisauer, S.; Waldschläger, K.; Hug, W.; Grüneis, L.; Heyden, N.; Schmor, S.; Förderer, A.; Reid, R.; Reid, M.; et al. Application of laser-induced, deep uv raman spectroscopy and artificial intelligence in real-time environmental monitoring—solutions and first results. Sensors 2021, 21, 3911. [Google Scholar] [CrossRef]
- Asheri Arnon, T.; Ezra, S.; Fishbain, B. Water characterization and early contamination detection in highly varying stochastic background water, based on Machine Learning methodology for processing real-time UV-Spectrophotometry. Water Res. 2019, 155, 333–342. [Google Scholar] [CrossRef]
- Ashwini, C.; Singh, U.P.; Pawar, E. Shristi Water quality monitoring using machine learning and iot. Int. J. Sci. Technol. Res. 2019, 8, 1046–1048. [Google Scholar]
- Amiri-Ardakani, Y.; Najafzadeh, M. Pipe Break Rate Assessment While Considering Physical and Operational Factors: A Methodology based on Global Positioning System and Data-Driven Techniques. Water Resour. Manag. 2021, 3703–3720. [Google Scholar] [CrossRef]
- Saberi-Movahed, F.; Najafzadeh, M.; Mehrpooya, A. Receiving More Accurate Predictions for Longitudinal Dispersion Coefficients in Water Pipelines: Training Group Method of Data Handling Using Extreme Learning Machine Conceptions. Water Resour. Manag. 2020, 34, 529–561. [Google Scholar] [CrossRef]
- Zechman, E.M. Agent-based modeling to simulate contamination events and evaluate threat management strategies in water distribution systems. Risk Anal. 2011, 31, 758–772. [Google Scholar] [CrossRef] [PubMed]
- Ehsan Shafiee, M.; Zechman, E.M. An agent-based modeling framework for sociotechnical simulation of water distribution contamination events. J. Hydroinformatics 2013, 15, 862–880. [Google Scholar] [CrossRef] [Green Version]
- Shafiee, M.E.; Berglund, E.Z. Complex adaptive systems framework to simulate the performance of hydrant flushing rules and broadcasts during a water distribution system contamination event. J. Water Resour. Plan. Manag. 2017, 143, 1–14. [Google Scholar] [CrossRef]
- Shafiee, M.E.; Berglund, E.Z.; Lindell, M.K. An Agent-based Modeling Framework for Assessing the Public Health Protection of Water Advisories. Water Resour. Manag. 2018, 32, 2033–2059. [Google Scholar] [CrossRef]
- Bonabeau, E. Agent-based modeling: Methods and techniques for simulating human systems. Proc. Natl. Acad. Sci. USA 2002, 99, 7280–7287. [Google Scholar] [CrossRef] [PubMed] [Green Version]
- Athanasiadis, I.N.; Mentes, A.K.; Mitkas, P.A.; Mylopoulos, Y.A. A Hybrid Agent-Based Model for Estimating Residential Water Demand. Simulation 2005, 81, 175–187. [Google Scholar] [CrossRef] [Green Version]
- Linkola, L.; Andrews, C.J.; Schuetze, T. An agent based model of household water use. Water 2013, 5, 1082–1100. [Google Scholar] [CrossRef]
- Tillman, D.E.; Larsen, T.A.; Pahl-Wostl, C.; Gujer, W. Simulating development strategies for water supply systems. J. Hydroinformatics 2005, 7, 41–51. [Google Scholar] [CrossRef] [Green Version]
- Ding, N.; Erfani, R.; Mokhtar, H.; Erfani, T. Agent based modelling forwater resource allocation in the transboundary Nile river. Water 2016, 8, 139. [Google Scholar] [CrossRef]
- Shafiee, M.E.; Berglund, E.Z. Agent-based modeling and evolutionary computation for disseminating public advisories about hazardous material emergencies. Comput. Environ. Urban Syst. 2016, 57, 12–25. [Google Scholar] [CrossRef]
- Kennedy, W.G. Modelling Human Behaviour in Agent-Based Models. In Agent-Based Models of Geographical Systems; Springer: Dordrecht, The Netherlands, 2012; pp. 167–179. ISBN 9789048189274. [Google Scholar]
- Wang, C.; Pan, R.; Wan, X.; Tan, Y.; Xu, L.; Ho, C.S.; Ho, R.C. Immediate psychological responses and associated factors during the initial stage of the 2019 coronavirus disease (COVID-19) epidemic among the general population in China. Int. J. Environ. Res. Public Health 2020, 17, 1729. [Google Scholar] [CrossRef] [Green Version]
- Pennycook, G.; McPhetres, J.; Zhang, Y.; Rand, D. Fighting COVID-19 misinformation on social media: Experimental evidence for a scalable accuracy nudge intervention. Psychol. Sci. 2020, 1–24. [Google Scholar] [CrossRef]
- Van Bavel, J.J.; Baicker, K.; Boggio, P.S.; Capraro, V.; Cichocka, A.; Cikara, M.; Crockett, M.J.; Crum, A.J.; Douglas, K.M.; Druckman, J.N.; et al. COVID-19 pandemic response. Nat. Hum. Behav. 2020, 4. [Google Scholar] [CrossRef]
- Spearing, L.A.; Thelemaque, N.; Kaminsky, J.A.; Katz, L.E.; Kinney, K.A.; Kirisits, M.J.; Sela, L.; Faust, K.M. Implications of Social Distancing Policies on Drinking Water Infrastructure: An Overview of the Challenges to and Responses of U.S. Utilities during the COVID-19 Pandemic. ACS ES&T Water 2021, 1, 888–899. [Google Scholar] [CrossRef]
- Maziarz, M.; Zach, M. Agent-based modelling for SARS-CoV-2 epidemic prediction and intervention assessment: A methodological appraisal. J. Eval. Clin. Pract. 2020, 26, 1352–1360. [Google Scholar] [CrossRef]
- Silva, P.C.L.; Batista, P.V.C.; Lima, H.S.; Alves, M.A.; Guimarães, F.G.; Silva, R.C.P. COVID-ABS: An agent-based model of COVID-19 epidemic to simulate health and economic effects of social distancing interventions. Chaos Solitons Fractals 2020, 139. [Google Scholar] [CrossRef] [PubMed]
- Saberi-Movahed, F.; Mohammadifard, M.; Mehrpooya, A.; Rezaei-Ravari, M.; Berahmand, K.; Rostami, M.; Karami, S.; Najafzadeh, M.; Hajinezhad, D.; Jamshidi, M.; et al. Decoding Clinical Biomarker Space of COVID-19: Exploring Matrix Factorization-based Feature Selection Methods. medRxiv 2021. [Google Scholar] [CrossRef]
- Luo, J.; Zhou, L.; Feng, Y.; Li, B.; Guo, S. The selection of indicators from initial blood routine test results to improve the accuracy of early prediction of COVID-19 severity. PLoS ONE 2021, 16, 1–18. [Google Scholar] [CrossRef] [PubMed]
- Karthikeyan, A.; Garg, A.; Vinod, P.K.; Priyakumar, U.D. Machine Learning Based Clinical Decision Support System for Early COVID-19 Mortality Prediction. Front. Public Health 2021, 9, 1–13. [Google Scholar] [CrossRef] [PubMed]
- Helbing, D.; Farkas, I.; Vicsek, T. Simulating dynamical features of escape panic. Nature 2000, 407, 487–490. [Google Scholar] [CrossRef] [PubMed] [Green Version]
- Rossman, L.A. EPANET 2 Users Manual EPA/600/R-00/57. Water Supply Water Resour. Div. U.S. Agency Environ. Prot. 2000. Available online: https://www.epa.gov/water-research/epanet (accessed on 10 July 2021).
- Shang, F.; Uber, J.G. Epanet Multi-Species Extension User’ S Manual. 2011. Available online: https://cfpub.epa.gov/si/si_public_record_report.cfm?Lab=NHSRC&dirEntryId=218488 (accessed on 10 July 2021).
- Eliades, D.G.; Kyriakou, M.; Vrachimis, S.; Polycarpou, M.M. EPANET-MATLAB Toolkit: An Open-Source Software for Interfacing EPANET with MATLAB. 1–8. Available online: https://doi.org/10.5281/zenodo.437751 (accessed on 20 April 2019).
- Zadeh, L.A. Fuzzy sets. Inf. Control 1965, 8, 338–353. [Google Scholar] [CrossRef] [Green Version]
- Gerla, G. Effectiveness and multivalued logics. J. Symb. Log. 2006, 71, 137–162. [Google Scholar] [CrossRef]
- Schwartz, R.; Lahav, O.; Ostfeld, A. Integrated hydraulic and organophosphate pesticide injection simulations for enhancing event detection in water distribution systems. Water Res. 2014, 63, 271–284. [Google Scholar] [CrossRef] [PubMed]
- Sankary, N.; Ostfeld, A. Multiobjective Optimization of Inline Mobile and Fixed Wireless Sensor Networks under Conditions of Demand Uncertainty. J. Water Resour. Plan. Manag. 2018, 144, 1–13. [Google Scholar] [CrossRef]
Figure 1.
Pseudocode (left) and conceptual flowchart (right) of the agent-based modelling framework.
Figure 1.
Pseudocode (left) and conceptual flowchart (right) of the agent-based modelling framework.

Figure 2.
Distribution of three society types, including industrial and facility nodes in the EPANET example application network, Net3.
Figure 2.
Distribution of three society types, including industrial and facility nodes in the EPANET example application network, Net3.

Figure 3.
Fuzzy logic system to determine consumer agents’ actions.

Figure 4.
EPANET network example application, Net3, including the position of the placed mobile sensors, the injection node of the contamination injection as well as the fixed sensor that initially detected the contamination.
Figure 4.
EPANET network example application, Net3, including the position of the placed mobile sensors, the injection node of the contamination injection as well as the fixed sensor that initially detected the contamination.

Figure 5.
Division of network into zones which are monitored by mobile equipment in order to declare endangered and cleared parts of the water network.
Figure 5.
Division of network into zones which are monitored by mobile equipment in order to declare endangered and cleared parts of the water network.

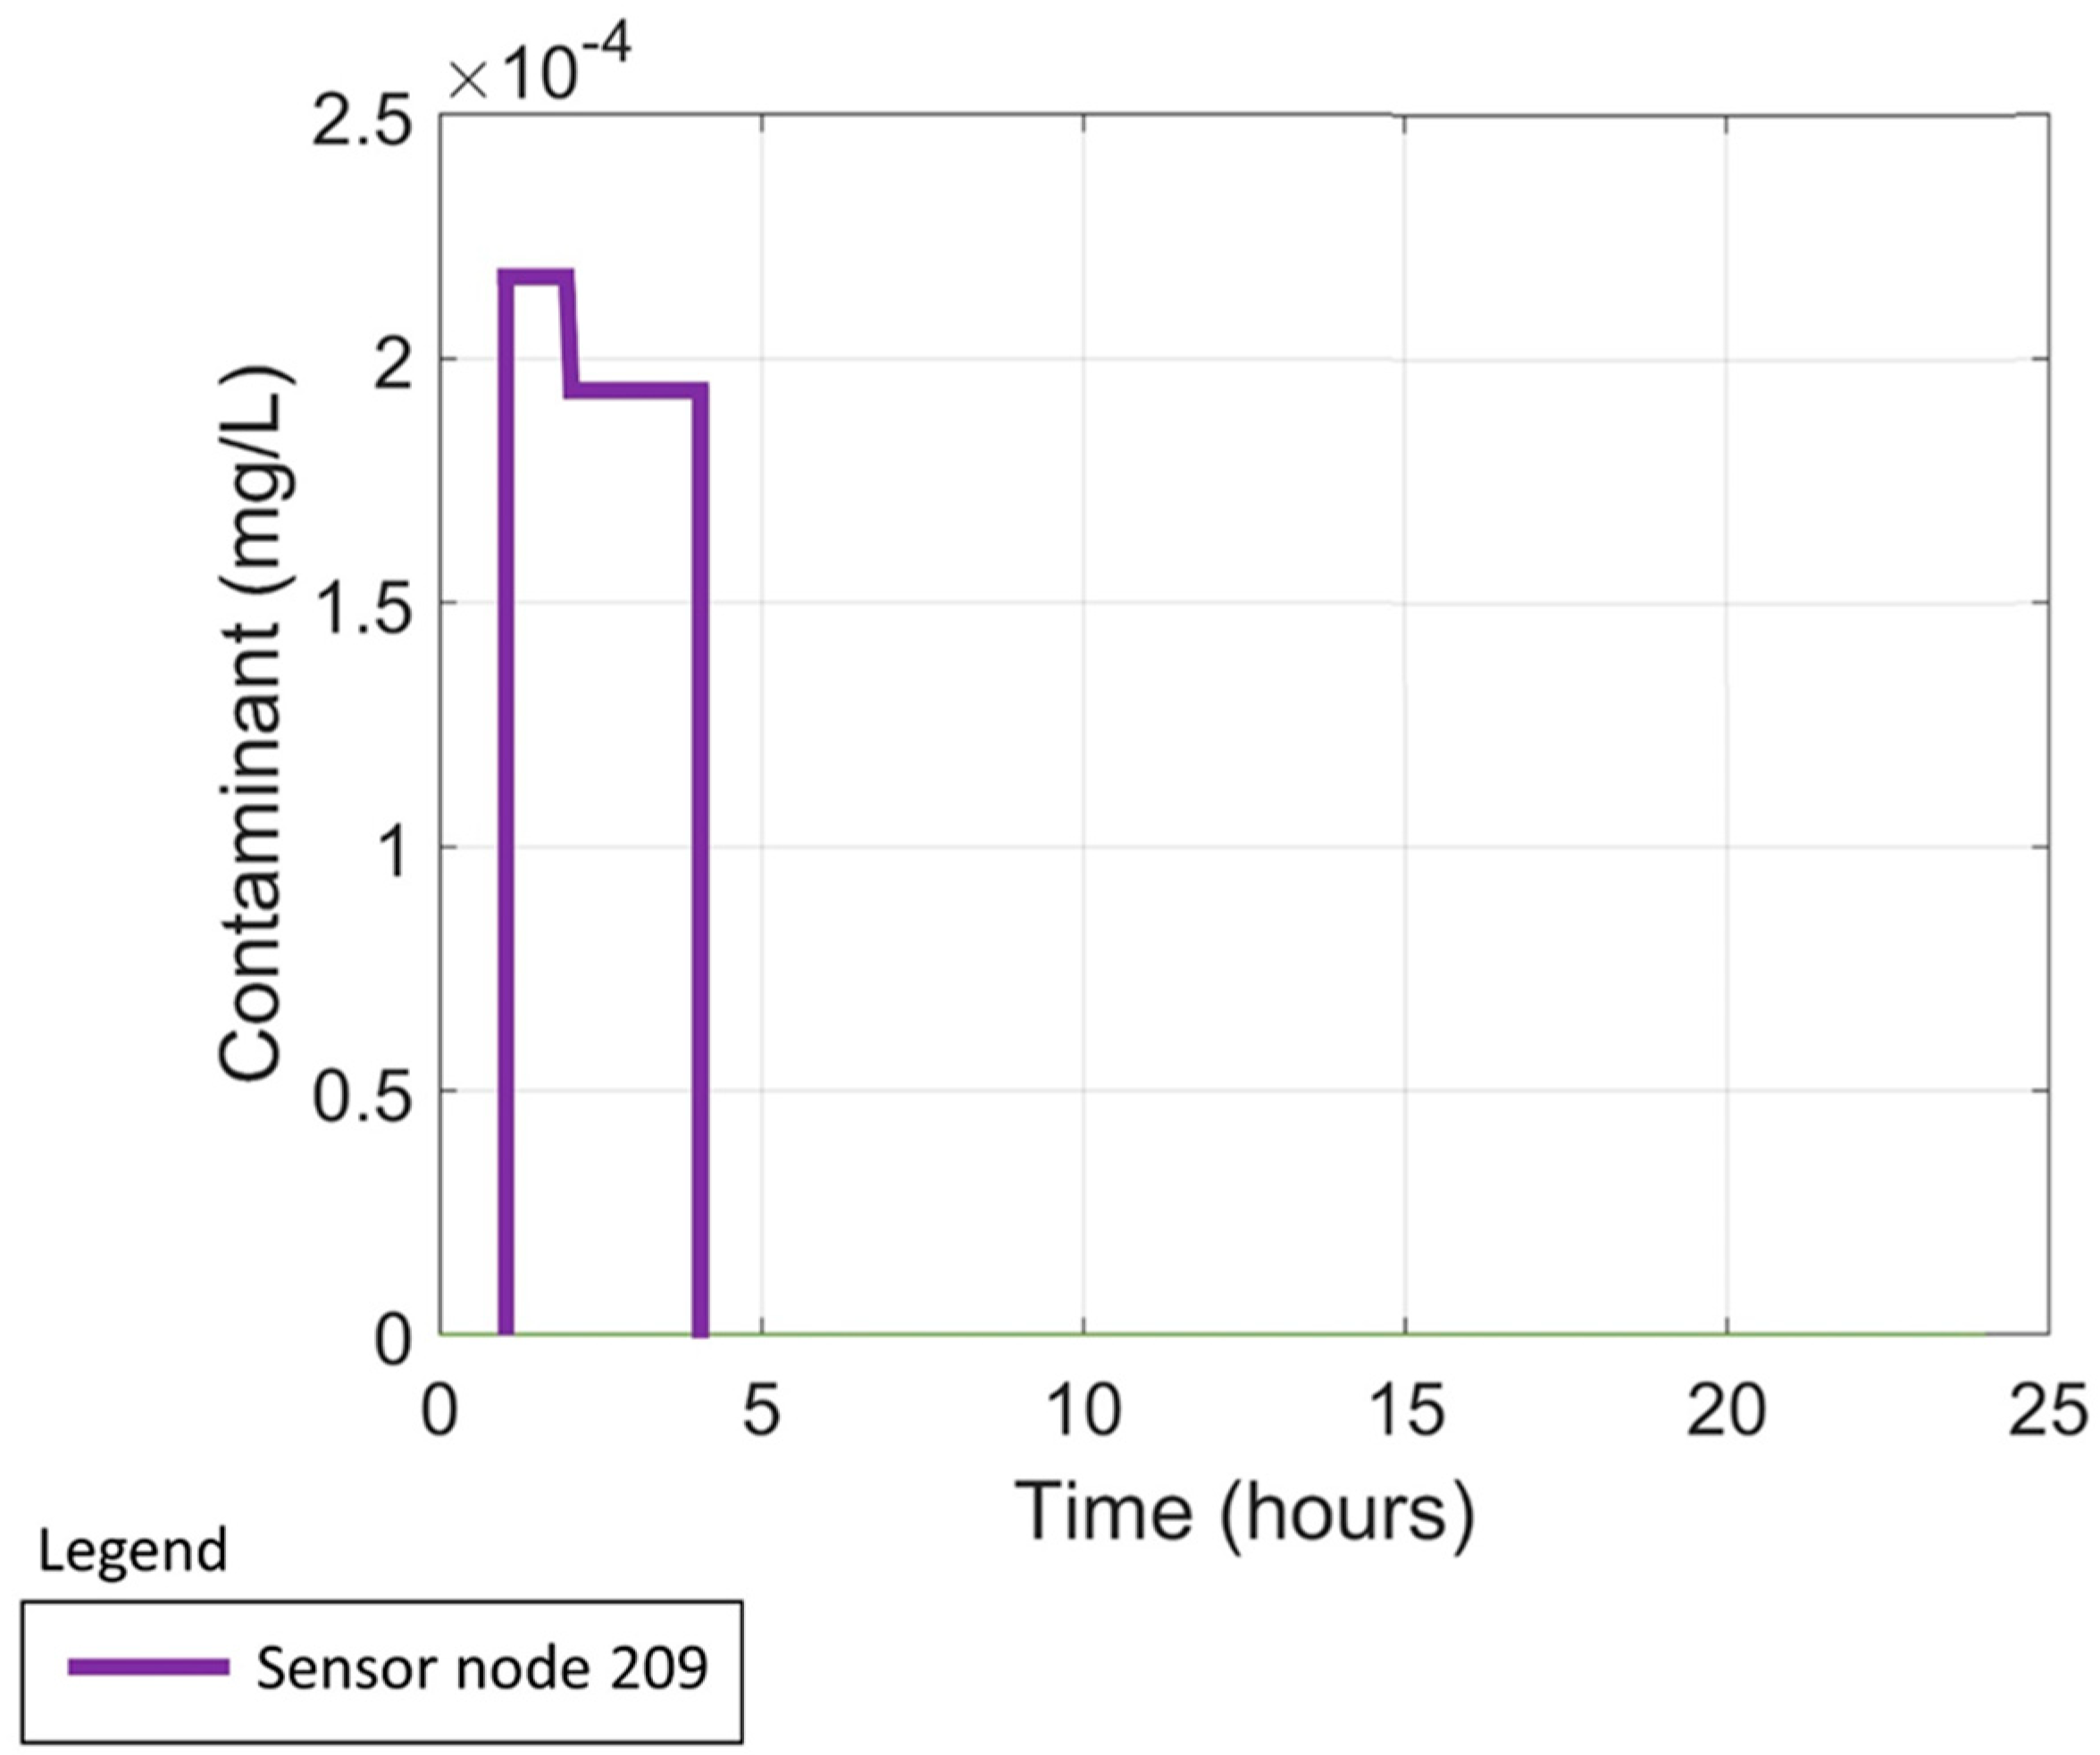
Figure 6.
Contaminant concentration measured by the placed mobile sensor equipment over the course of the 24 h simulation. Except for the sensor at node 209, no contaminant concentration was measured. All other measurements from mobile equipment did not detect any contaminations or anomalies in the water.

Figure 7.
Scatter plot of the fuzzy logic system output in scenario one for the three different society types and the four different possibly taken actions.
Figure 7.
Scatter plot of the fuzzy logic system output in scenario one for the three different society types and the four different possibly taken actions.

Figure 8.
Percentages of the actions taken, maybe taken or not taken by the consumer agents for each society type for scenario one.
Figure 8.
Percentages of the actions taken, maybe taken or not taken by the consumer agents for each society type for scenario one.

Figure 9.
Scatter plot of the fuzzy logic system output in scenario two for the three different society types and the four different possibly taken actions.
Figure 9.
Scatter plot of the fuzzy logic system output in scenario two for the three different society types and the four different possibly taken actions.

Figure 10.
Percentages of the actions taken, maybe taken or not taken by the consumer agents for each society type for scenario two.
Figure 10.
Percentages of the actions taken, maybe taken or not taken by the consumer agents for each society type for scenario two.

Figure 11.
Scatter plot of the fuzzy logic system output in scenario three for the three different society types and the four different possibly taken actions.
Figure 11.
Scatter plot of the fuzzy logic system output in scenario three for the three different society types and the four different possibly taken actions.

Figure 12.
Percentages of the actions taken, maybe taken or not taken by the consumer agents for each society type for scenario three.
Figure 12.
Percentages of the actions taken, maybe taken or not taken by the consumer agents for each society type for scenario three.


Table 1.
Relevant social background characteristics of consumer agents divided into three society types and the distribution in every society type.
Table 1.
Relevant social background characteristics of consumer agents divided into three society types and the distribution in every society type.
| Social Background | Type 1 | Type 2 | Type 3 |
|---|---|---|---|
| Gender | % | ||
| Male | 47.1 | 47.1 | 47.1 |
| Female | 52.9 | 52.9 | 52.9 |
| Age | NA | NA | NA |
| 0–12 | 11.7 | 10.5 | 9.5 |
| 12–21 | 12.5 | 11.6 | 7.4 |
| 21–30 | 8.6 | 10.9 | 11.9 |
| 30–40 | 13.4 | 15.7 | 19.3 |
| 40–49 | 18.4 | 21.8 | 23.8 |
| 49–59 | 12.1 | 13 | 14.7 |
| 59–70 | 13.3 | 9 | 9.8 |
| 70–85 | 10 | 7.5 | 3.6 |
| Parent status | NA | NA | NA |
| Child < 16 | 25.6 | 22 | 16.4 |
| Child > 16 | 57 | 54.3 | 43.9 |
| No children | 17.4 | 23.7 | 39.7 |
| Marital status | NA | NA | NA |
| Single | 21 | 25.1 | 30.9 |
| Married | 73.3 | 68.9 | 62.7 |
| Divorced/separated | 5.7 | 6 | 6.4 |
| Household size | NA | NA | NA |
| ≥ 6 | 9 | 8.3 | 7 |
| 3–5 | 77.6 | 80.6 | 83.6 |
| 2 | 11.9 | 10.6 | 7.5 |
| 1 | 1.5 | 0.5 | 1.9 |
| Employment status | NA | NA | NA |
| Unemployed | 10.3 | 5 | 1.2 |
| Retired | 8.5 | 5.1 | 4.3 |
| Student | 26.3 | 27.3 | 36.7 |
| Employed | 54.9 | 62.6 | 57.8 |
| Educational attainment | NA | NA | NA |
| None | 1.3 | 0.7 | 0.1 |
| Primary school | 6.7 | 3.1 | 0.2 |
| Lower secondary school | 21.5 | 15 | 2.3 |
| Upper secondary school | 50.6 | 55 | 22 |
| University—bachelors | 14.3 | 17.2 | 33.3 |
| University—masters | 5.4 | 8.2 | 38.5 |
| University—doctorate | 0.2 | 0.8 | 3.6 |
Table 2.
Three different scenarios for a sensitivity analysis. Each scenario incorporates an additional input variable into the fuzzy logic system in order to determine the consumer agents’ actions.
Table 2.
Three different scenarios for a sensitivity analysis. Each scenario incorporates an additional input variable into the fuzzy logic system in order to determine the consumer agents’ actions.
| Scenario | Incorporation into Fuzzy Logic | ||
|---|---|---|---|
| Input variables | Input variables | Input variables | |
| 1 | Social background | NA | NA |
| 2 | Social background | Location in network | NA |
| 3 | Social background | Location in network | Possible symptoms |
Table 3.
Amount of membership functions for each input variable of the fuzzy logic system.
| Scenarios | Variables | Membership Functions |
|---|---|---|
| 1,2,3 | Age | 3 |
| 1,2,3 | Parent status | 3 |
| 1,2,3 | Marital status | 3 |
| 1,2,3 | Household size | 4 |
| 1,2,3, | Employment status | 4 |
| 1,2,3 | Educational attainment | 6 |
| 2,3 | Geographical location | 2 |
| 3 | Symptoms | 2 |
Publisher’s Note: MDPI stays neutral with regard to jurisdictional claims in published maps and institutional affiliations. |
© 2021 by the authors. Licensee MDPI, Basel, Switzerland. This article is an open access article distributed under the terms and conditions of the Creative Commons Attribution (CC BY) license (https://creativecommons.org/licenses/by/4.0/).
Share and Cite
MDPI and ACS Style
Kadinski, L.; Ostfeld, A. Incorporation of COVID-19-Inspired Behaviour into Agent-Based Modelling for Water Distribution Systems’ Contamination Responses. Water 2021, 13, 2863. https://doi.org/10.3390/w13202863
AMA Style
Kadinski L, Ostfeld A. Incorporation of COVID-19-Inspired Behaviour into Agent-Based Modelling for Water Distribution Systems’ Contamination Responses. Water. 2021; 13(20):2863. https://doi.org/10.3390/w13202863
Chicago/Turabian StyleKadinski, Leonid, and Avi Ostfeld. 2021. "Incorporation of COVID-19-Inspired Behaviour into Agent-Based Modelling for Water Distribution Systems’ Contamination Responses" Water 13, no. 20: 2863. https://doi.org/10.3390/w13202863
Note that from the first issue of 2016, this journal uses article numbers instead of page numbers. See further details here.