Article

Stormwater Runoff Modelling in an Urban Catchment to Plan Risk Management for Contaminant Spills for Stormwater Harvesting

1
Science Technology, Engineering and Maths (STEM), Scarce Resources and Circular Economy (ScaRCE), Mawson Lakes Campus, University of South Australia, Mawson Lakes, SA 5095, Australia
2
CSIRO Land and Water, Waite Laboratories, Waite Rd., Urrbrae, SA 5064, Australia
*
Author to whom correspondence should be addressed.
Water 2021, 13(20), 2865; https://doi.org/10.3390/w13202865
Submission received: 27 August 2021 / Revised: 29 September 2021 / Accepted: 8 October 2021 / Published: 14 October 2021
(This article belongs to the Special Issue Hydrological Modeling in Urban Water Management)

Abstract

:
Water quality is a key consideration for urban stormwater harvesting via aquifers. This study assessed catchment spill management options based on a calibrated dynamic wave routing model of stormwater flow in an urban catchment. The study used measured travel times, pluviometer and gauging station observations from 21 storms to calibrate a stormwater model to simulate transport of pollutants from spill locations to the point of harvest. The simulations considered the impact of spill locations, spill durations, storm intensities and storm durations on the pollutant concentration at the point of harvest and travel time of a pollutant spill to the harvesting point. During dry weather, spill events travelled slower than spills occurring during wet weather. For wet weather spills, the shortest travel times tended to occur in higher intensity storms with shorter duration, particularly when a spill occurred in the middle of the storm. Increasing the intensity of rainfall reduced the peak concentration of pollutant at the harvest point via dilution, but it also reduced the time of travel. On a practical level, due to the short response times in urban catchments, management of spills should be supported by automated detection/diversion systems to protect stormwater harvesting schemes.

1. Introduction

Water quality is an important consideration in the harvesting and reuse of stormwater for higher end uses such as drinking. Unlike traditional urban water supply systems which tend to harvest water from protected rural catchments, urban stormwater harvesting schemes collect water downstream of urbanised residential, commercial and/or industrial catchment areas which are typically drained using engineered road-side gutters and stormwater pipe networks. As a result, urban stormwater is potentially affected by both point and diffuse sources of pollution which vary depending on several factors, particularly land use [1,2,3]. Many of these systems have also been integrated with Managed Aquifer Recharge (MAR) schemes for inter-seasonal storage [4,5]. For this reason, urban stormwater harvesting schemes have adopted a variety of treatment mechanisms to improve water quality including constructed wetlands [6] and biofiltration systems [7,8,9].
Risk-based water quality management guidelines [1,2,10] advocate that potential hazardous events should also be considered. These hazardous events include accidents such as tanker spills (chemical hazards) and sewer overflows (microbial hazards) which can lead to a highly concentrated point-source of pollutants entering the harvesting system. Hossain and Imteaz [11] reported that vehicular transport is the major source of spills to the surface waters.
There have been some studies investigating scenarios of hazard travel time in natural drainage systems. For example, Rivord et al. [12] estimated the travel time of a pollutant plume in the Truckee River in the United States which was at risk of spills due to its proximity to roadways and rail corridors. The study was based on flow through a 103 km natural channel and assessed the impact of tanker spills across a large catchment area. Similar work was conducted for the Uberaba region of the State of Minas Gerais, Brazil, where Siqueira et al. [13] reported that the soil type was a key parameter to watercourse catchment vulnerability to contamination by road spills. By contrast there are few studies which assess the travel time of pollutant spills in urbanised stormwater catchments with subsurface drainage pipes [14]. Examples do exist—Sämann et al. [15] reported the use of a model (HYSTEM EXTRAN 2D) to predict the travel path and travel time of contaminant spills but scenarios were restricted to flash flood conditions only.
In the study reported here, we assess the potential impact of several scenarios and estimate the time available to respond to a potential spill event in a stormwater catchment for a harvesting scheme and the peak concentration. The key factors considered include: (1) the travel time of the pollutant spill through the urban drainage network to the point of harvesting; (2) the dilution of the pollutant during transport. It is intended that the proposed methodology will be broadly transferable to other stormwater harvesting schemes internationally. The PCSWMM model (www.pcswmm.com, accessed on 9 March 2021), a commercial variant of the US EPA SWMM model, was selected for use in this study to develop transport and dilution scenarios of pollutant spills. PCSWMM uses the same algorithms as the US EPA SWMM model (Version 5.01) which has been widely applied for modelling surface runoff processes and flow characteristics from urban catchments and through pipes and channels [16,17,18,19]. The PCSWMM model can produce hydrographs at short time steps (<1 min) and has been used in the limited available studies which examine the travel time of pollutant spills within a catchment [14].

2. Materials and Methods
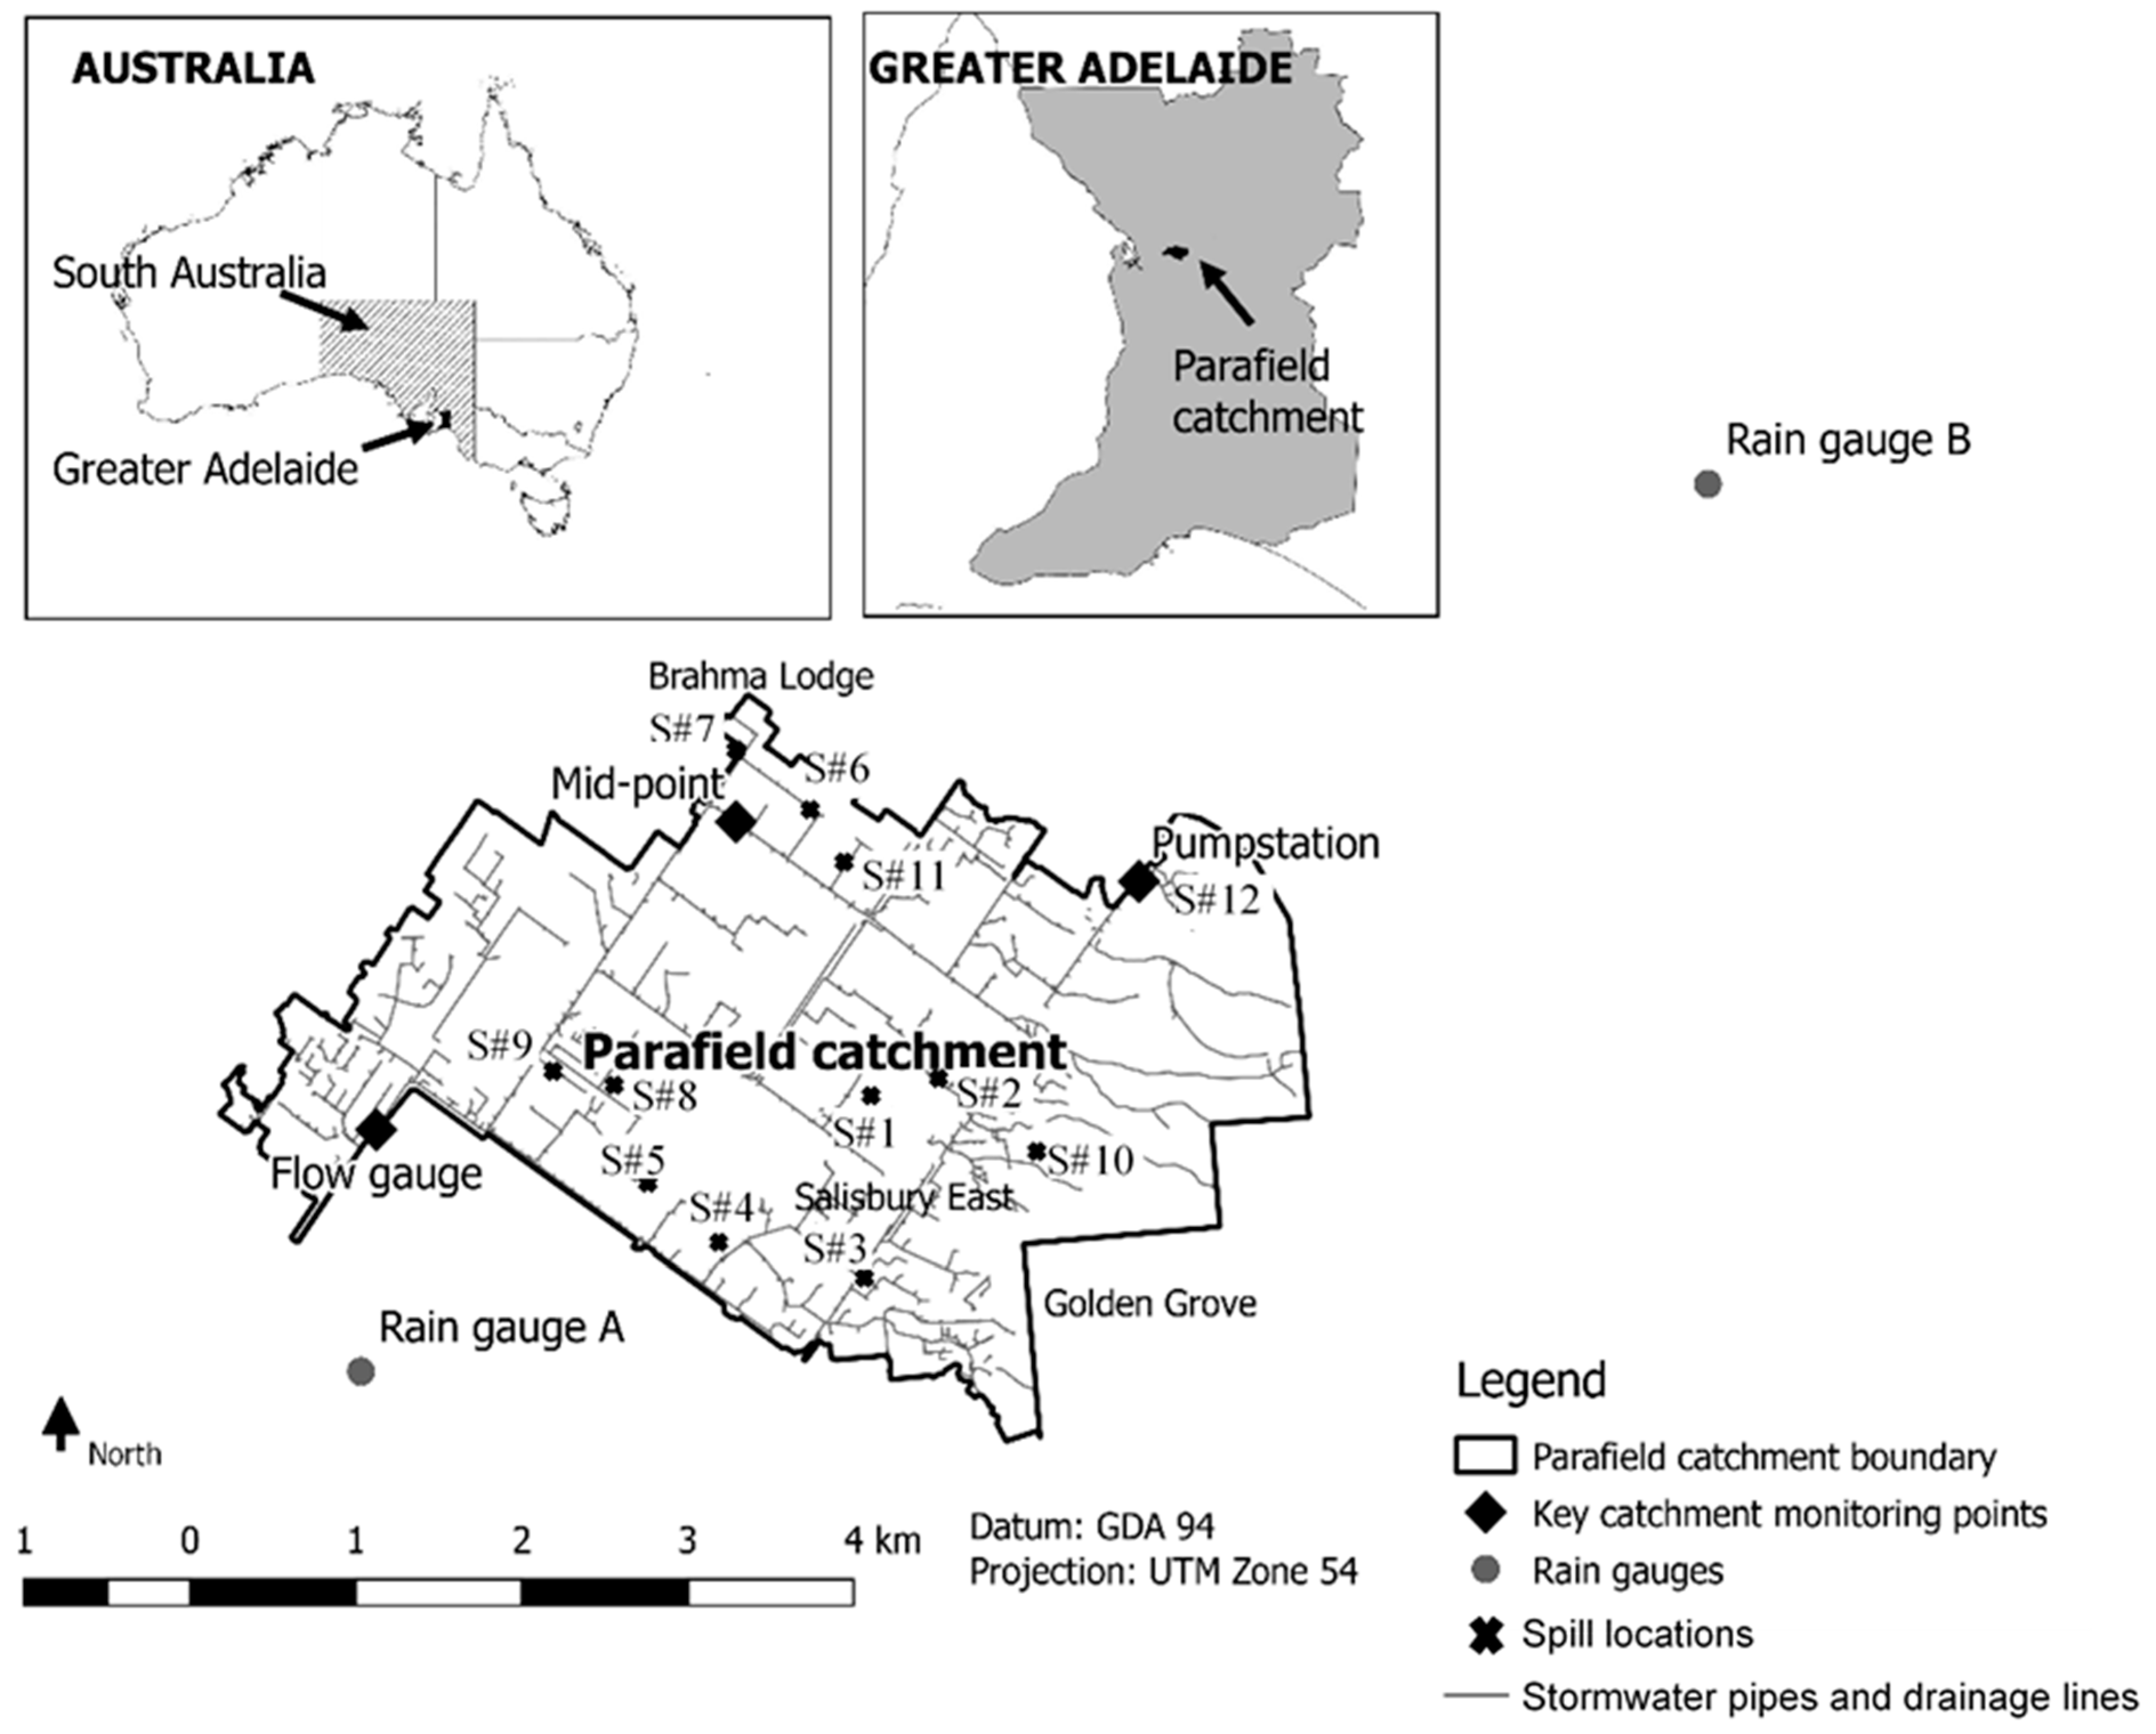
To examine hazardous event scenarios in an urban catchment, the travel time of spills was determined under a variety of scenarios. A hydrological and hydraulic model was constructed, calibrated and validated using observed stormwater flow data. This model was then used to examine various plausible scenarios. The resulting travel times and estimated pollutant concentrations were then used to identify scenarios which presented higher risk at the point of stormwater collection as well as potential risk management options to protect human health and the environment.

2.1. Study Site

The Parafield stormwater harvesting, and MAR scheme is operated by the City of Salisbury, a local government in South Australia, Australia. The MAR scheme has been detailed previously, with further information on stormwater quality hazards also identified [4,5,20,21]. The scheme is typical of many in Australia and harvests urban stormwater from the Parafield catchment (Figure 1) and Cobbler Creek catchment which is adjacent but not naturally connected to the catchment. The Parafield catchment is 1590 ha and includes residential, commercial, industrial and rural living development. At the end of the Parafield catchment (800 m downstream of the flow gauge marked on Figure 1), stormwater is collected from an open drain via a diversion weir into the harvesting scheme. Runoff from the adjacent 1017 ha Cobbler Creek catchment proceeds to a flood detention basin located west of the pump station in Figure 1. Outflow from this basin is not hydrologically connected to the Parafield catchment, but to increase harvestable volumes in the system since 2010, a portion of the dam outflow is collected via pump, and transferred at a fixed flow rate (~50 L/s, average value of measured flow rates) into the Parafield catchment drainage system. Flows from the Cobbler Creek catchment are therefore a point inflow to the Parafield catchment and are treated as such for the purposes of this study.

2.2. Hydrological Modelling

Modelling of this catchment has been performed by Swierc et al. [22] and by Clark et al. [23] using daily hydrological models to assess contaminant risks and reliability of stormwater harvesting under climate change, respectively. However, these models gave inadequate temporal resolution to determine likely effectiveness of intervention measures.
The layout and elevation of drainage system components was acquired from the local authorities (City of Salisbury) and imported into the PCSWMM model. Sub-catchments were then defined and their hydrological properties for SWMM modelling estimated based on the recommendations of the SWMM User Manual [24].
Observed rainfall data was applied to the model at a six-minute timestep based on data from two rainfall pluviometers, Gauge A and B (Figure 1). Gauge A (9.5 m elevation, 454 mm mean annual rainfall) represents the Parafield Airport pluviometer operated by the Australian Bureau of Meteorology (Ref 023013). Gauge B (149.2 m elevation, 592 mm mean annual rainfall) represents the Little Para pluviometer, operated by the South Australia Water Corporation (Ref A5040528). To capture rainfall variation across the catchment these rain gauges were assigned to sub catchments on the basis of elevation. All stormwater sub-catchments located <90 m elevation were represented by Gauge A while those with an elevation >90 m elevation were represented by Gauge B. Observed flow data was available from a flow gauge (v-notch weir, SA Government ref A5041049, Starflow Ultrasonic Doppler, Model 6526, Water Data Services Pty Ltd., Adelaide, Australia) installed in the open drain at the end of the Parafield catchment (Figure 1). The weir reported the drain flow rate at a six-minute time step and calibration was conducted using a six-minute timestep.

2.3. Model Calibration and Validation

The PCSWMM model of the catchment was developed based on stormwater pipe, drainage pit, sub-catchment area, slope and imperviousness data provided Local Government (City of Salisbury). Calibration was undertaken by focussing on parameters most critical to stormwater travel time and flow volume. This included the roughness of the drainage pipe system, the reported percentage of impervious area, catchment width, catchment surface roughness, depression storage and Horton infiltration parameters.
Through an experiment conducted in the field, time of travel for water through the drainage system was determined by manipulating flow (a continuous flow rate of 50 L/s) from the Cobbler Creek pump station (Figure 1) during a two-hour trial. The flow path along the main drainage line from the Cobbler Creek pump was therefore able to be examined by using the gauge at the end of the catchment, and by direct observation of flow through a pit where flow was safely observed within the catchment. The times of travel were determined to points 3550 m and 6810 m along the stormwater network. The latter is at the flow gauge, which is an open channel 800 m upstream of the stormwater harvesting diversion point.
The properties of the PCSWMM hydraulic model were then adapted to match the results of simulating this pumped flow without rainfall input. Based on these results, conduit roughness was adopted uniformly across the catchment as 0.01, slightly lower than the 0.011 to 0.015 range recommended for concrete pipes and channels by Rossman [24].
Calibration of the PCSWMM hydrological parameters was then undertaken based on continuous simulation of runoff based on observed rainfall data. Simulated flows were compared to measured flow data from the flow gauge at the end of the catchment (Figure 1) collected between June 2003 and June 2005. Twenty-one storm events from this time series were selected for calibration and validation and summarized in Table 1. These events were selected to represent a range of peak flow rates (0.1 m3/s to 7.2 m3/s), flow durations (6.5 h to 106 h) and seasons (i.e., occurrence of rainfall in drier ‘summer’ months and wetter ‘winter’ months). Initial parameters for catchment surface width, roughness, depression storage and Horton infiltration were selected based on recommendations for an urbanised catchment with clay loam soils from Rossman [24]. The fitness of the model to observed data was assessed using the Nash–Sutcliffe efficiency (r2, Equation (1)) statistic. Calibration was considered complete when the simulated flow data for a majority of the selected events presented a good fit with the observed flow rate data on a calibration plot, and when the Nash–Sutcliffe calibration statistic r2 was found to be more than 0.7, a value considered ‘good’ in a review of published fitting parameters by Moriasi et al. [25]. Further, in accordance with the recommendations of the ASCE [26] for presenting data for single event runoff simulation, the simple percent error in peak (PEP, Equation (2)) and the sum of squared residuals (G, Equation (3)) were also determined.
r 2 = 1 i = 1 n ( O i P i ) 2 i = 1 n ( O i O ) 2
P E P = O p e a k P p e a k O p e a k × 100
G = i = 1 n ( O i P i ) 2
where n represents the number of observed flow data; Oi represents the observed flow at time i; O represents the mean observed flow over the period of the data; Pi represents the predicted flow at time i; Opeak represents the observed peak flow during the event and Ppeak represents the predicted peak.

2.4. Hazardous Event Catchment Spill Simulation

Page et al. [27] developed qualitative and quantitative water quality risk assessments performed on the Parafield stormwater harvesting system. In developing the risk assessment, catchment land uses were assessed using a geographical information system (GIS) based approach for all catchments connected to the Parafield stormwater harvesting system. Land uses were ranked according to the likelihood and severity of potential impacts to water quality. The nearest drainage system inlet points to locations categorised as ‘Extreme’ risk for spills or flow contamination by Page et al. [27] were adopted for this study and these are presented in Figure 1.
Hazardous event scenarios were developed by conducting PCSWMM model runs of the catchment with two assumed spill volumes of 20 kL and 40 kL at each spill location. The 20 kL spill simulated spillage from 100 ‘44-gallon drums’ while the 40 kL spill simulated spillage from 200 ’44-gallon drums’, or the volume of a small tanker truck. The pollutant used in each analysis was assumed to consist of an aqueous generic contaminant with the same density as water and with a concentration of 106 mg/L (i.e., 1 kg/L) for chemical hazards. The contaminant characteristics for worst case (shortest travel time and maximum peak concentration) were assumed to be for conservative pollutants with no adsorption to stormwater system components, no volatilisation losses, no biodegradation during the travel time, and having the same density as water, and hence no fractionation in the diversion structure. While scenarios with contaminant sorption would prolong the clean-up of stormwater systems and extend the need to bypass harvesting facilities, these contaminants are also more capable of removal by remedial measures, and were not further considered in this analysis. Spill events were simulated to occur during dry and wet weather conditions. Dry weather spill vents were simulated in the absence of any contributing rainfall, while wet weather events were run during rainfall. Pollutant spills were simulated to occur over 12 min with a peak at 12:00 (midday) on the first day of the simulation. The travel time of the pollutant was determined based on the time between the beginning of the spill and the appearance of the pollutant at the harvest point (>1 mg/L at the harvest point).
In wet weather, spill characteristics and the timing of spill in relation to rainfall was determined from a preliminary analysis which examined the effect of storm intensity and durations, spill timing in relation to storm events and spill durations on the travel time and pollutograph of a contaminant at the harvesting point. Findings were used to determine the spill event conditions resulting in the earliest breakthrough and highest peak concentrations to ensure that the risk assessment was conservative. Various model scenarios were produced based on two locations (1) the Cobbler Creek pump station (S12) and (2) the mid-point (~half way to the harvest point). There were 48 model scenarios (24 scenarios per location) produced to compare the effect of these variables, summarised in Table 2.
Each scenario was conducted using a selected storm event beginning at midday on day one of a five-day simulation period. Storm events were represented as ‘design storm events’ determined in accordance with local stormwater design guidelines [28] with an assumed average recurrence interval (ARI) and storm duration. A pollutant spill can be simulated in one of two ways in PCSWMM: (1) Concentration—assuming an inflow of water has a pollutant concentration (mg/L) representing the spill to a stormwater pit, and (2) Mass-assuming the addition of a dry pollutant mass (mg) which is added to a stormwater pit and carried downstream by stormflow. The ‘concentration input’ method provides a slightly more conservative estimate of travel time under the low flow conditions compared to the mass input method (Table S1, Supplementary data). Consequently, for both dry and wet weather spill scenarios, the ‘concentration input’ method has been used.
To compare the impact of the pollutant spill scenarios listed in Table 2, the hydrograph and pollutograph characteristics were examined at the point of harvest by recording the travel time of the pollutant from the location of the simulated spill to point of harvest, the duration of the pollutograph at the point of harvest, the event mean concentration and the time taken between the beginning of the spill and the occurrence of the peak pollutant concentration at point of harvest. Hydrographs and pollutographs were reported to the nearest minute for travel time estimates. The duration of the pollutograph refers to the elapsed time when the pollutant concentration was > 1 mg/L at the harvest point. The event mean concentration refers to the mean concentration of the pollutant during the stormwater runoff event. The stormwater runoff event was defined as the period over which flow was > 1 L/s at the harvest point.

3. Results and Discussion

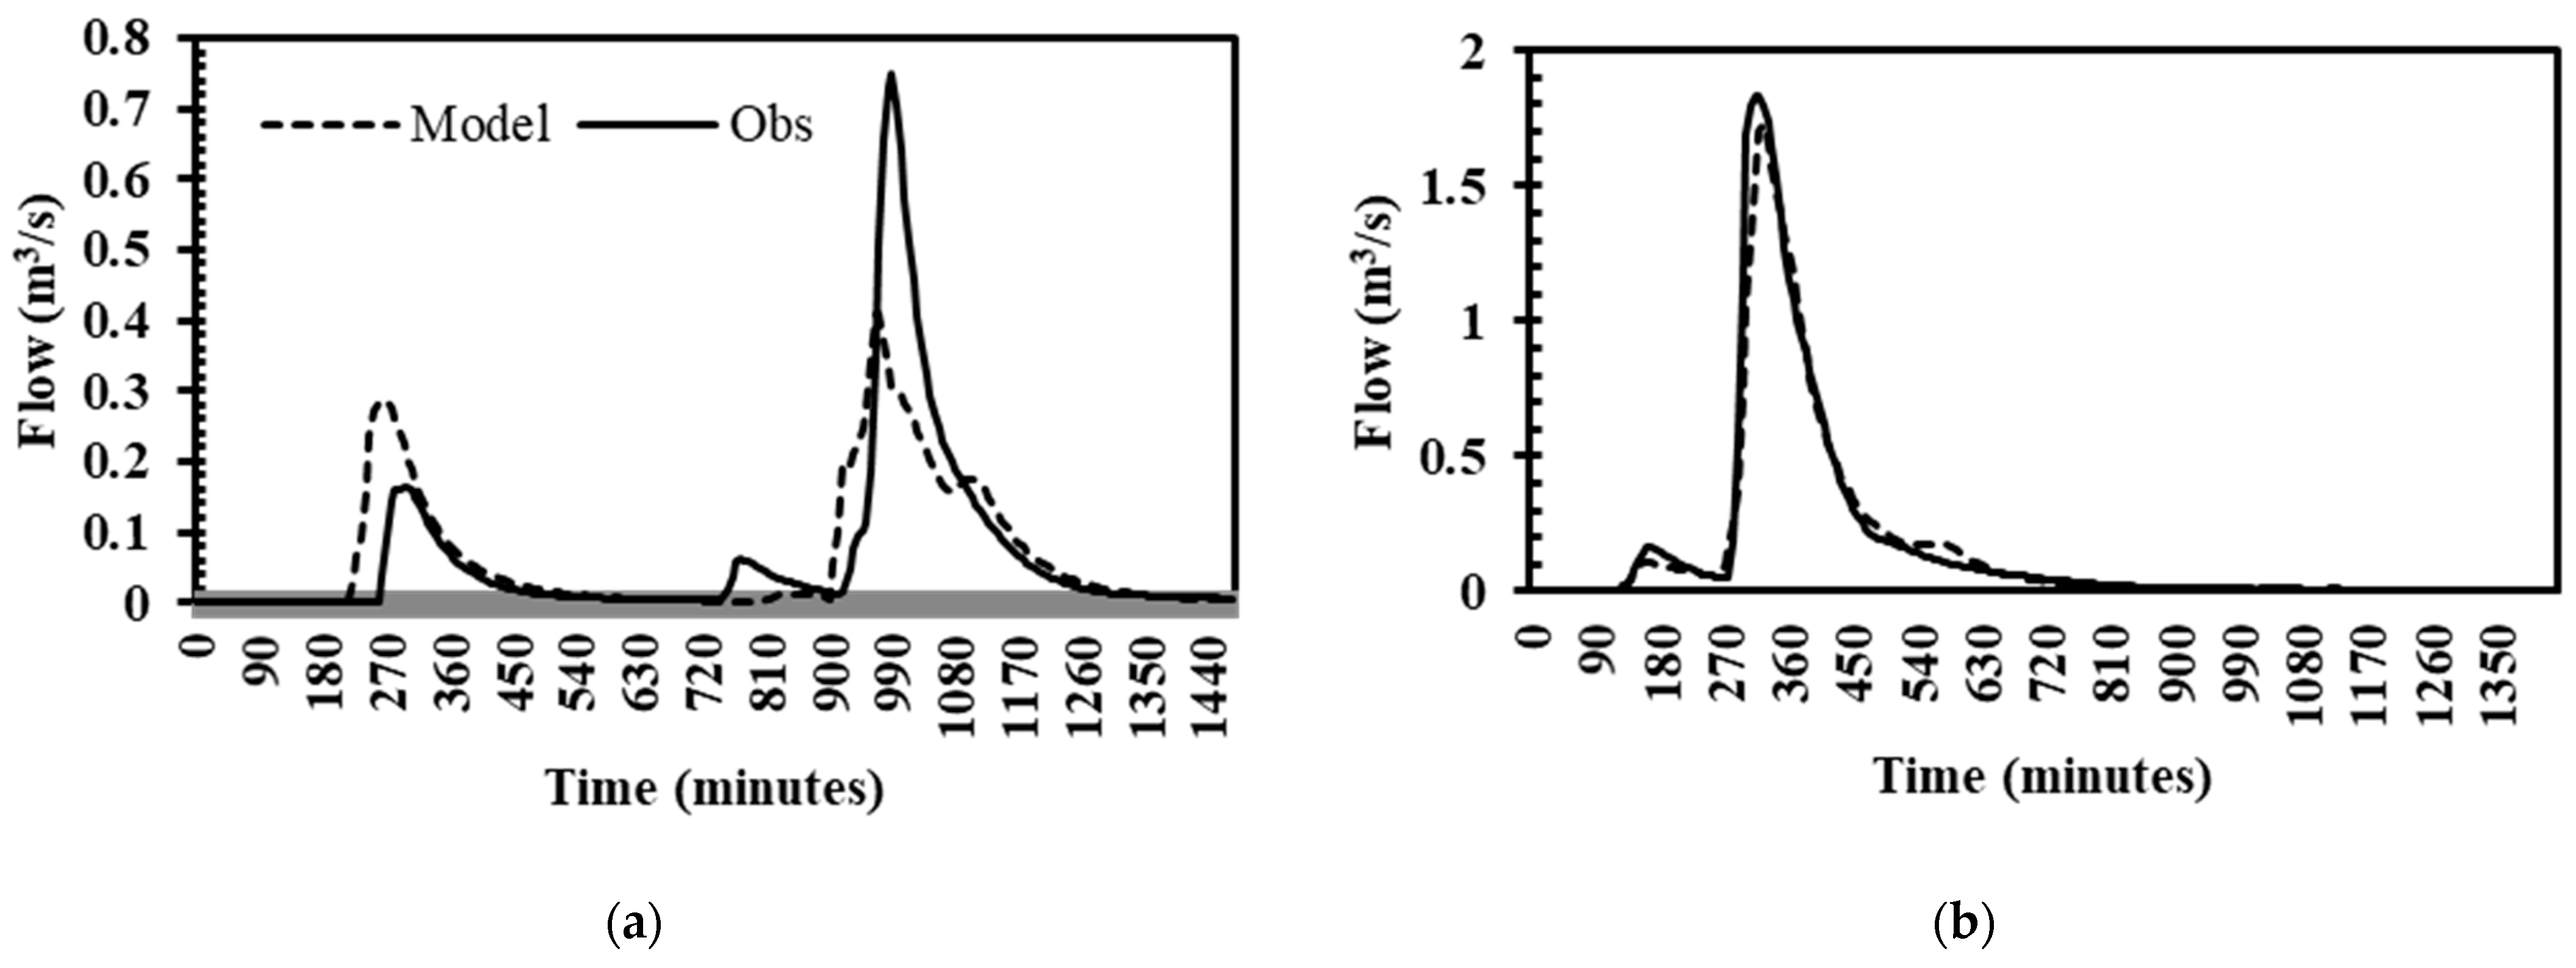
3.1. Model Calibration

Table 1 summarizes the statistical analyses for each event (21 events) used to calibrate or validate the model in this study. Nash–Sutcliffe efficiency r2 values were all greater than 0.5, with 15 of the 21 events greater than 0.7 indicating that the model was adequate. PEP values ranged from −55% to +52% while the G values ranged from 0.01 to 167.3 (L/s)2, as shown in Table 1. Hydrographs comparing calibrated and observed flow for Event #12 (event with the lowest r2 value) and Event #15 (event with the highest r2) are shown in Figure 2 while the hydrographs for all other events (20 events) are shown in Figures S1–S3 of the Supplementary data. A background discussion on sources of error is also included.

3.2. Hazardous Spills in Dry Weather

In this research, PCSWMM was run using kinematic wave routing. Kinematic wave routing solves the continuity equation (conservation of mass) and a simplified form of momentum conservation (Saint Venant) equations as outlined by Rossman [24]. Initial spill simulations (with zero baseflow) results showed high errors in the routing of flow volume (for 20 kL scenario: >81%; for 40 kL scenario: >38%) and pollutant concentrations (for 20 kL scenario: >22%; for 40 kL scenario: >21%) in the PCSWMM model due to instability in the flow routing with low flow volumes occurring over a short duration in the study catchment. These errors have been shown to occur in previous studies examining the travel time of pollutants under low flow conditions (e.g., [14]). To overcome this issue, flows were simulated with a small baseflow of 5 L/s occurring at the point of the contaminant spill, which produced a more acceptable routing error for both flow (for 20 kL scenario: <1.5%; for 40 kL scenario: <0.9%) and pollutants (for 20 kL scenario: <15%; for 40 kL scenario: <19%) as shown in Table S2, Supplementary data.
The time of travel for a spill at each risk location with 5 L/s baseflow was determined and the results shown in Table 3. The travel time can be a matter of min at some locations close to the catchment outlet, and up to approximately 84 min at the furthest reaches of the Parafield catchment (Site #18 for a 20 kL spill volume, Table 3).
The spill volume was found to have an impact on time of travel in the catchment with the travel time decreasing when the spill volume increased, as expected (Table 3). This is attributed to a greater kinetic energy for larger flows effectively forcing water through the stormwater network faster, compared to lower flows over the same conduit length. Increased depth also reduces the net effect of pipe and wall roughness on the flow of water through the pipe network, leading to increased flow velocities. A linear function (Figure S4, Supplementary data; R2 = 0.98) was fitted to describe the relationship between the travel time of 20 kL and 40 kL spill volumes during the dry weather. The travel time in the catchment was found to be reduced by 6.0% for each 10 kL increase in the spill volume.

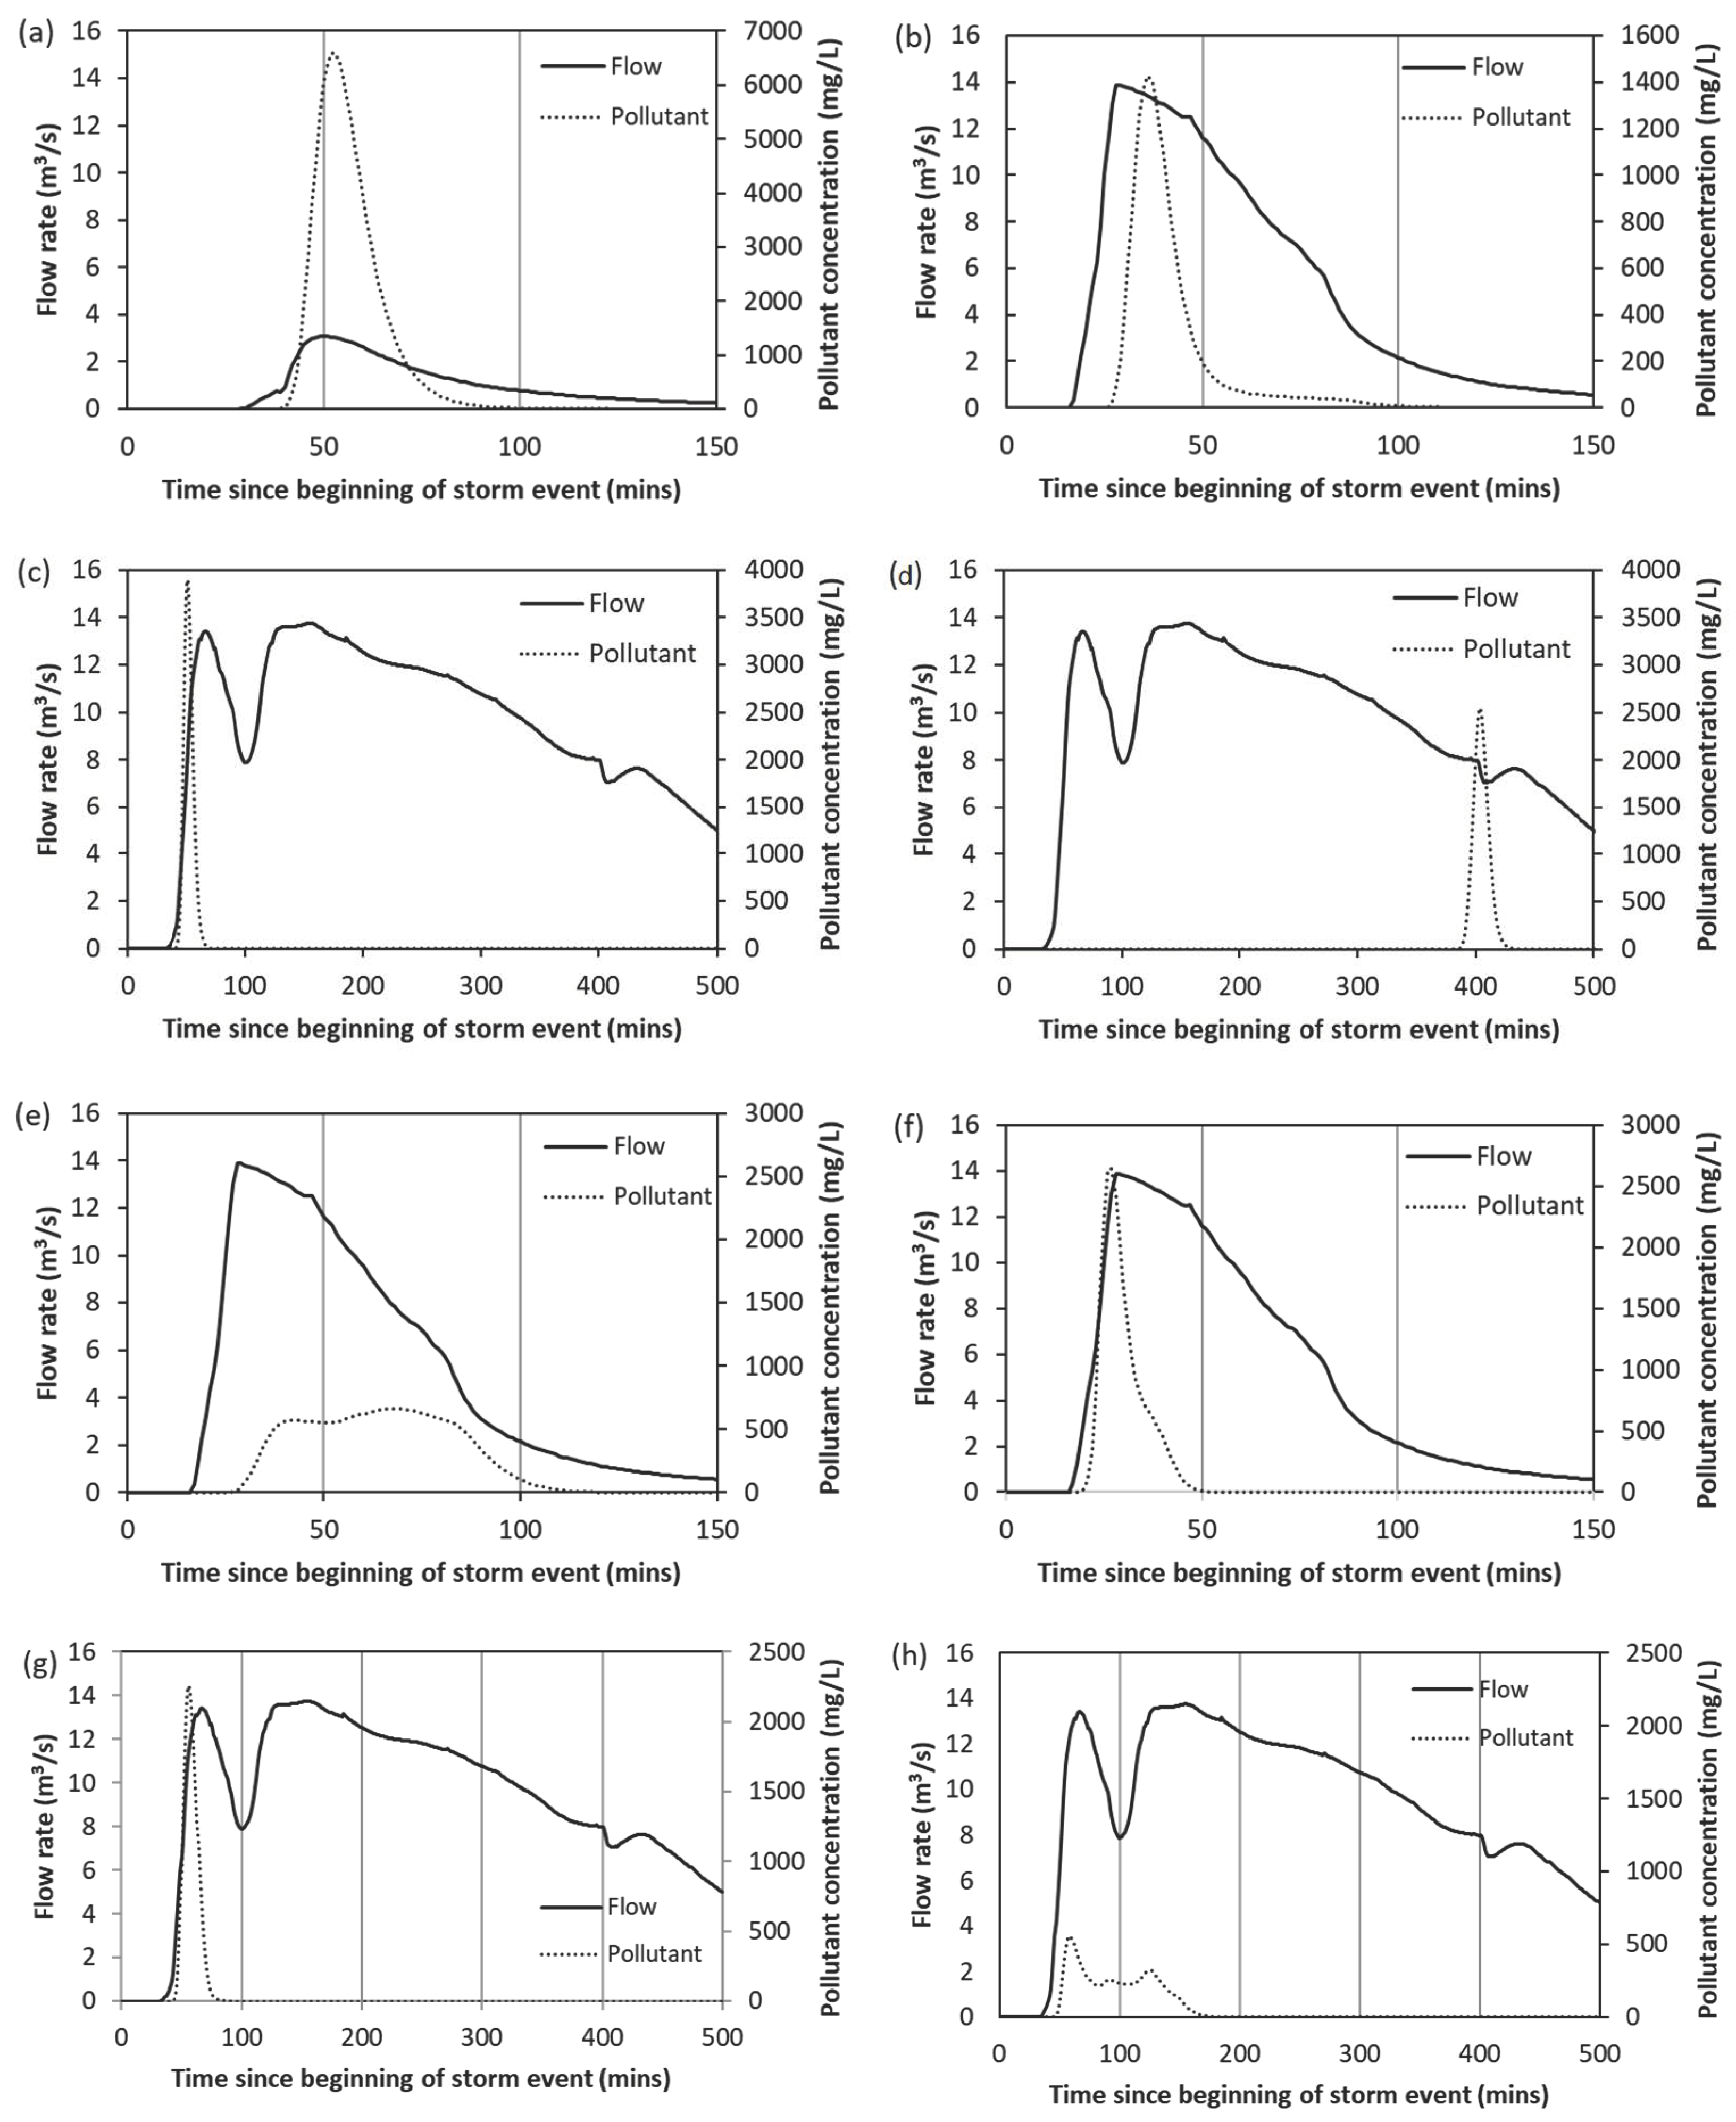
3.3. Hazardous Spills in Wet Weather

To examine the effect of storm intensity and durations, spill timings and spill durations on the travel time and pollutograph of a spill at the harvesting point during wet weather, various model scenarios were produced for two spill locations: (1) the Cobbler Creek pump station (the top of the Parafield catchment, S12) and (2) the mid-point (~half way to the harvest point) as detailed in Section 2.4. These sites correspond with the travel time validation of the model in Section 2.3. Under the various scenario conditions examined in this study, the maximum flow rates were found to be 3.2 m3/s and 13.9 m3/s for the 3-month ARI and 10-year ARI storms, respectively. Data from some scenarios (those where the duration of a highly concentrated but low flow rate spill) leads to travel time which exceeds the event duration have been neglected and not considered in the discussion, because these pose a lower risk at the harvesting point than other scenarios.

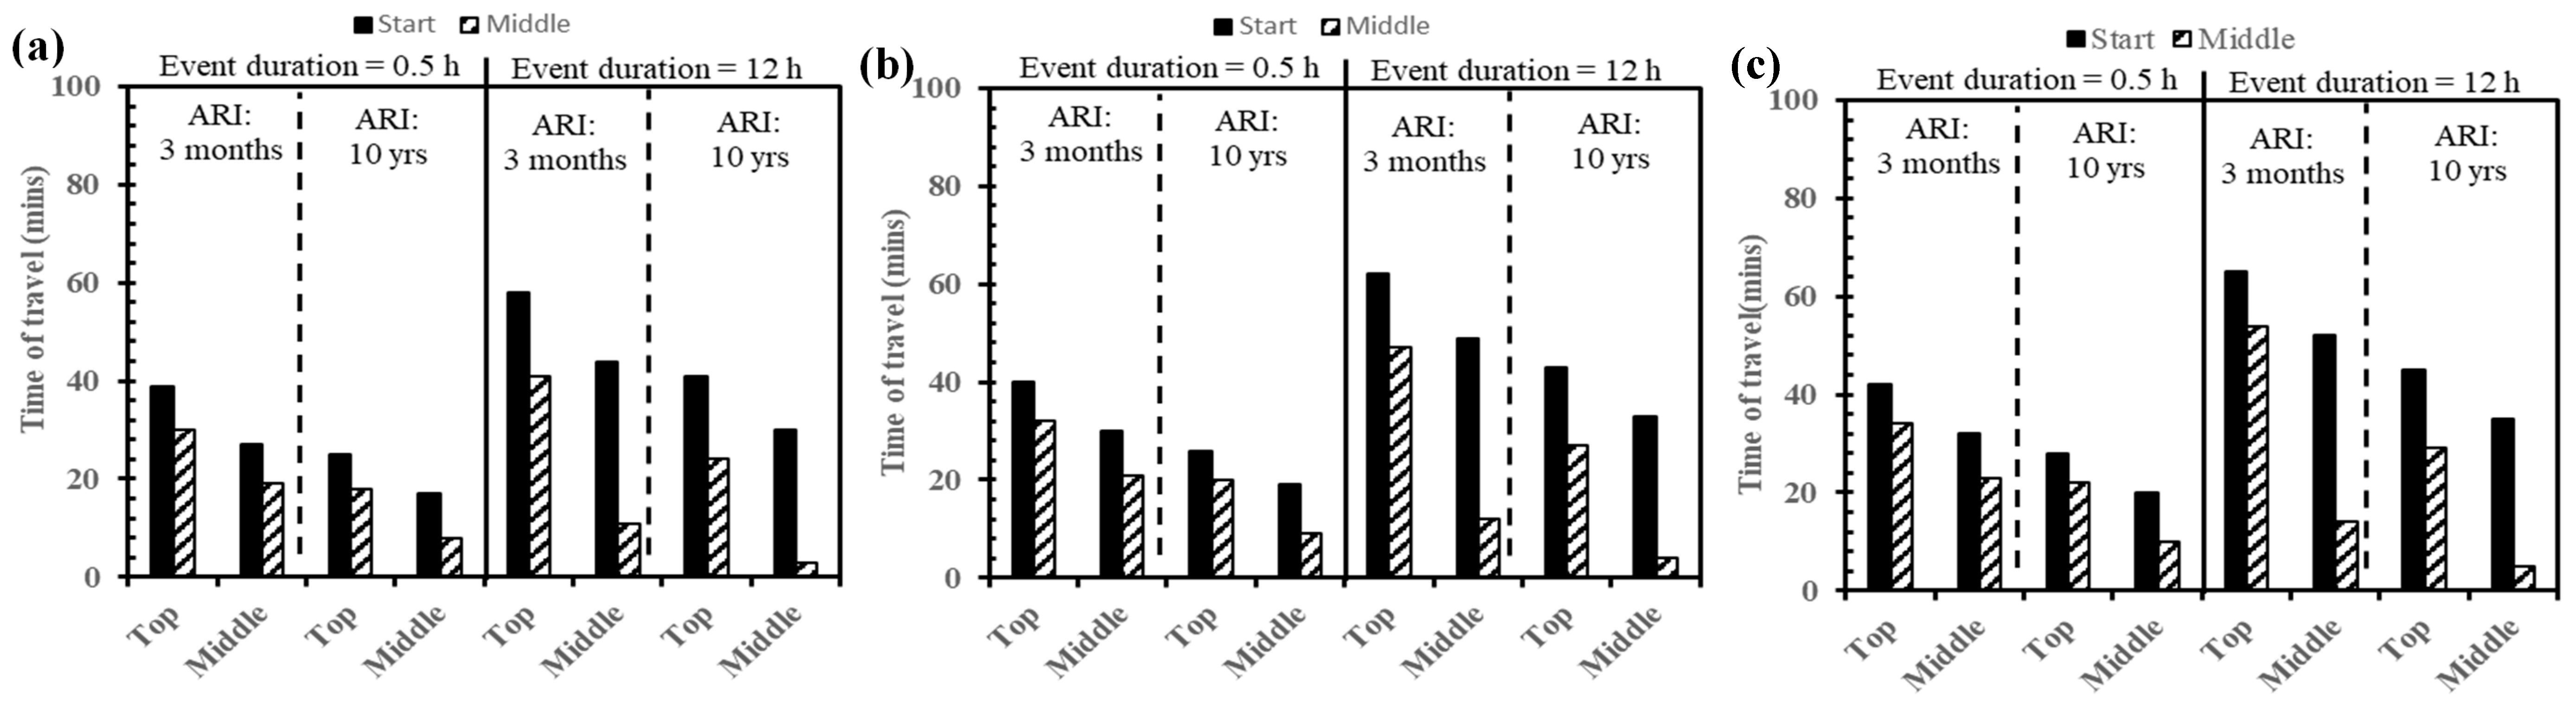
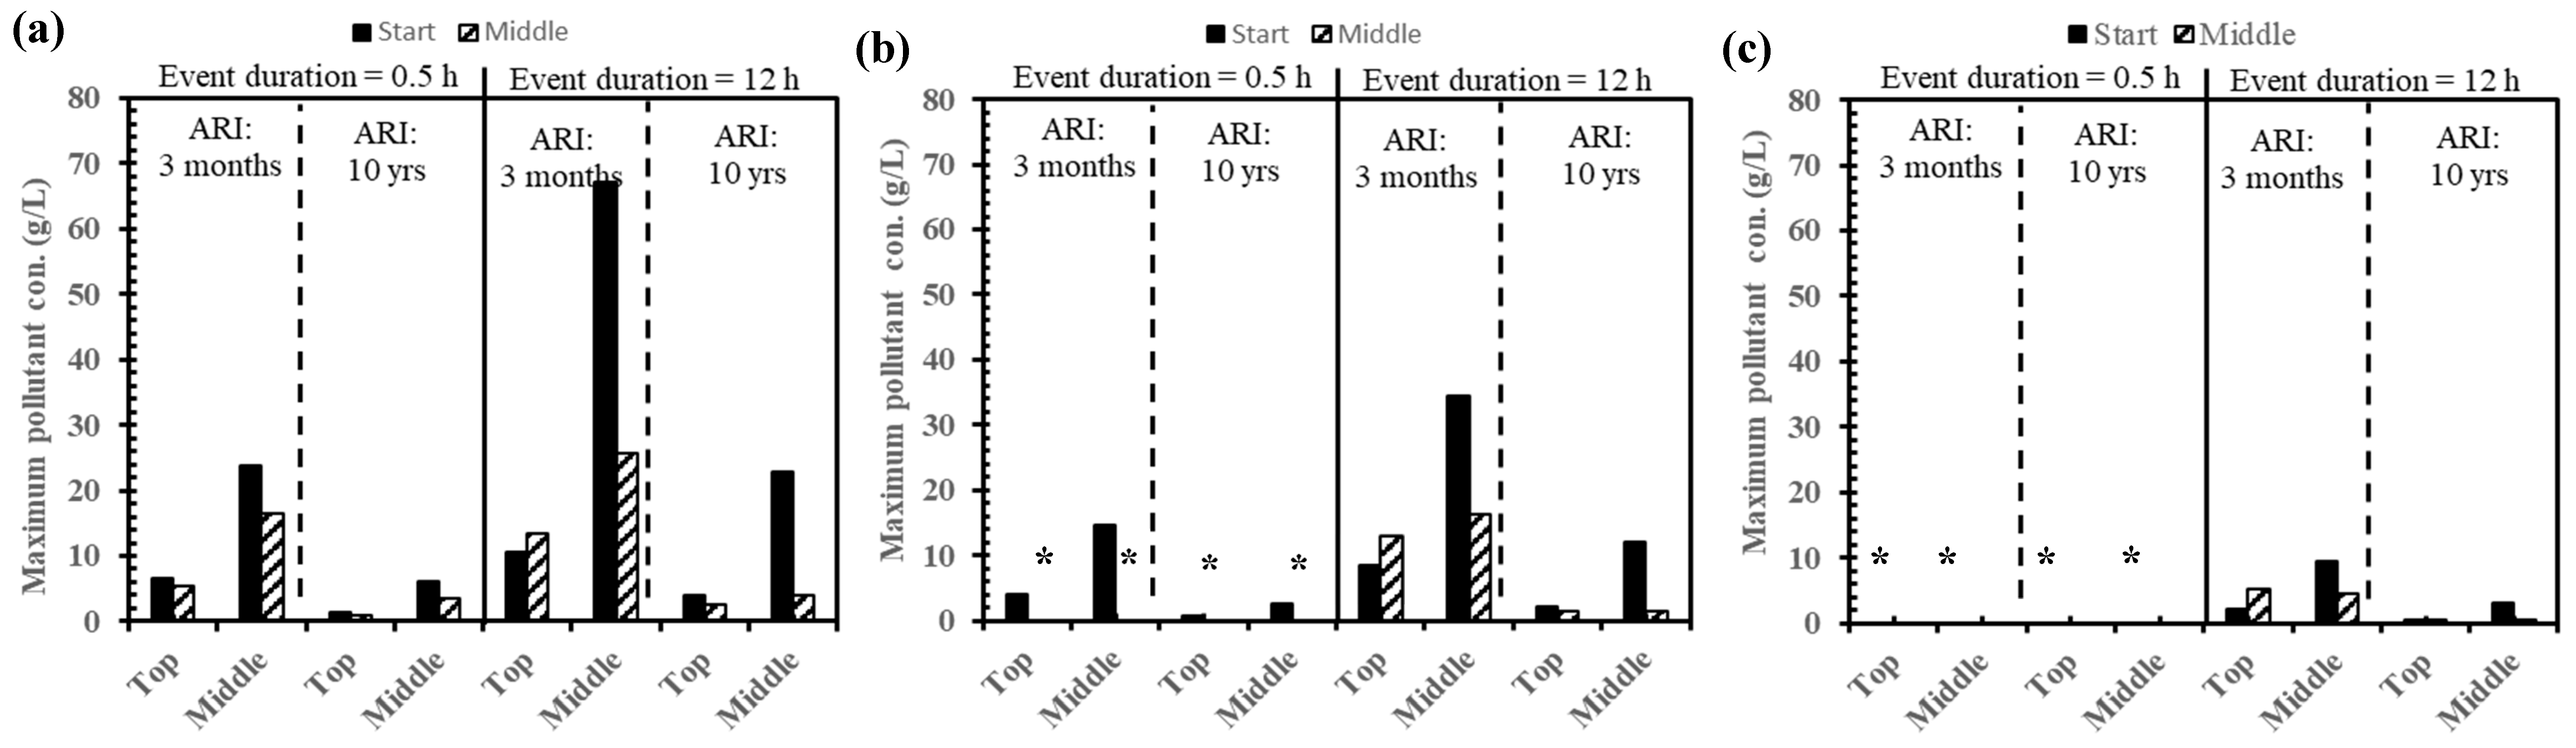
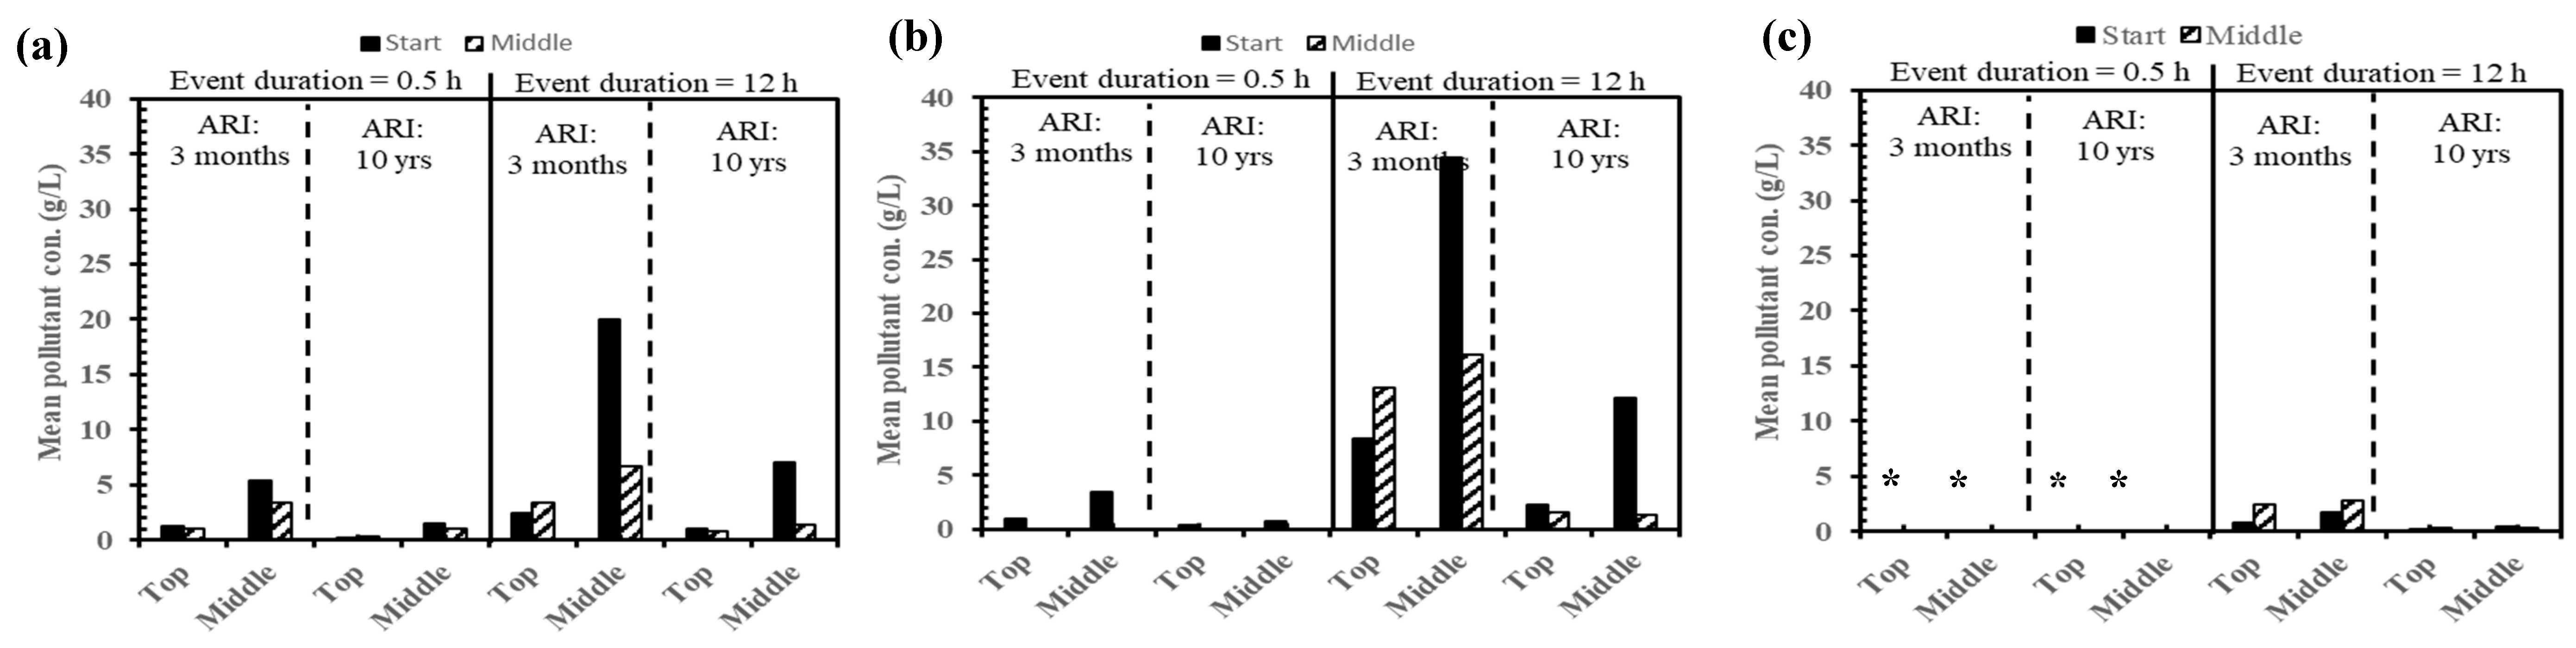
3.3.1. Effect of Storm Event Recurrence Interval

The flow and pollutant concentration characteristics at the point of harvest at various spill event conditions examined in this study are shown in Figure 3. The effect of stormwater event recurrence interval was assessed by comparing the results for spill scenarios with different storm event ARIs (3-month ARI (3M ARI) and 10-year ARI (10Y ARI)). The percentage change in the travel time (TT) parameters for the two storm intensities (e.g., (TT10Y ARI − TT3M ARI)/TT3M ARI) for spill scenarios which occurred at the same point of the catchment were calculated for spills with otherwise identical spill duration and spill start time (n = 12). The average and standard deviation (X ± S.D.) values of the percentage change in travel time for these spills were calculated. Regardless of the spill location, spill duration and spill start time, stormwater event intensity was found to have an effect on the time of travel to the harvest location (Figure 3a,b). The higher rainfall intensity consistently produced a reduction in time of travel of a pollutant to the harvest location in all scenarios (Figure 4). Travel time for the 10-year ARI event was reduced by 37% ± 5% in comparison with the 3-month ARI event when spills occurred at the top of the catchment, and by 49% ± 15% when the spill occurred in the middle of the catchment. The time taken to reach a peak pollutant concentration at the point of water harvest followed the same trend with values reduced by 26% ± 14% and 35% ± 12%, respectively (Figure 5). The higher storm intensity also reduced the maximum and mean pollutant concentration (Figure 6 and Figure 7) in all scenarios by 79% ± 8% and 76% ± 9%, respectively.
Further, the stormwater event ARI was found to have less effect on spills occurring at the start of storm compared to spills occurring in the middle of corresponding storm events. Higher storm intensity led to lower reduction in the assessed parameters when spills occurred at the start of storm events compared to spills which occurred in the middle of corresponding storm events (time of travel: 34% ± 3% vs. 52% ± 12%; travel time to peak: 28% ± 13% vs. 33% ± 14%; maximum pollutant concentration: 73% ± 7% vs. 86% ± 4%; mean pollutant concentration: 71% ± 8% vs. 82% ± 8%). Hence, high storm intensity reduced travel time of pollutants and also reduced the peak concentration, with a larger impact on pollutant concentrations than travel time.

3.3.2. Effect of Storm Event Duration

The effect of stormwater event duration was also assessed by comparing the results for spill scenarios with different storm event durations (30-min storm and 12-h storm). The percentage change in the travel time (TT) parameters for the two storm durations (e.g., (TT12-h − TT30-min)/ TT12-h) for spill scenarios which occurred at the same point of the catchment were calculated for spills with otherwise identical spill duration and spill start time (n = 12). Regardless of the spill location and spill duration and spill start time, results showed that stormwater event duration had an effect on the time of travel to the harvest location (Figure 3b,c,e,g). In contrast to the storm intensity, the longer duration storms tended to increase the travel time of a pollutant to the harvest location in all scenarios (Figure 4). Travel time was increased by 49% ± 12% (mean ± standard deviation) when spills occurred at the top of the catchment, and by 10% ± 59% when the spill occurred in the middle of the catchment.
The time taken to reach a peak pollutant concentration at the point of water harvest followed the same trend. Time to peak pollutant concentration increased (27% ± 23% and 39% ± 26%) due to longer storm events as shown in Figure 4. The longer storm events also increased the maximum and mean pollutant concentration at the stormwater harvest point in all scenarios (Figure 6 and Figure 7).

3.3.3. Effect of Spill Timing

In this study, the effect of spill timing was also assessed by comparing the results for scenarios with identical storm event ARIs, storm duration, spill duration and spill location but with spills occurred at the start or middle of storm events and the percentage change in the travel time parameters were calculated.
As shown in Figure 4, for a pollutant spill occurring at the top of the catchment, the travel time of the pollutant to the point of harvest was reduced by 27% ± 7% when the spill occurred during the middle of a storm, compared to the beginning. The travel time data where a pollutant spill occurred in the middle of catchment showed the same trend with values 61% ± 22% lower when a spill occurred during the middle of a storm compared to the beginning. Further, the reduction in the travel time was more prominent for larger storm intensity events. When a spill occurred at the top of catchment, the reduction was 31% ± 4% for a 10-year events compared to 22% ± 7% for a 3-month events. For a spill in the middle of the catchment, these reductions were 70% ± 32% and 52% ± 18%, respectively.
As shown in Figure 4, Figure 5, Figure 6 and Figure 7, in every case the travel times were shorter for spills occurring midway through a storm than at the start, because stormwater flow rates were faster. However peak and average concentrations were always lower for spills occurring midway through a storm, due to the higher rates of dilution on entry to the stormwater system, and the dilution occurred as a result of a longer initial period of untainted water reaching the harvesting point. Again, for the purposes of risk assessment, protection needs to be in place for both minimum travel time and maximum contaminant concentration, so a range of scenarios needs to be considered in order to address the range of possible values for each. Consistent with the travel time to the harvest point, the time taken for the maximum pollutant concentration at the harvest point was lower when a pollutant spill occurred during the middle of a storm, compared to the beginning.

3.3.4. Effect of Spill Duration

To examine the effect of contaminant spill duration, pollutographs were compared for scenarios where a 20 kL spill occurred during identical storm events (event intensity and duration), but where the spill occurred over a 5 min, 30 min or 2 h duration (e.g., Figure 3c,g,h). As shown in Figure 4, regardless of the spill location, the travel time of the pollutant to the point of harvest was increased where the spill duration occurred over 30 min period compared to a corresponding spill with a 5 min duration (7.9% ± 4.1% higher for a spill at the top of the catchment; 14% ± 26% for a spill at the middle of catchment). The findings for the two-hour spill were again higher than the 30-min spill. Further, the time taken to reach a peak pollutant concentration at the point of water harvest followed the same trend with values again increasing by at least 31% when the spill duration event increased as shown in Figure 4.
In contrast, increase the spill duration led to a decrease the maximum pollutant concentration estimated at the harvest point (Figure 6) in all scenarios. For example, for a 30-min spill compared to a 5 min spill the reduction was 33% ± 16% and 49% ± 10% for spill at the top and middle of the catchment, respectively.

3.3.5. Worst Case Scenario Analysis

The results (Section 3.3.1, Section 3.3.2, Section 3.3.3 and Section 3.3.4) indicated that the worst-case spill characteristics, in terms of catchment travel time, were when a short duration spill occurred at the middle of a high recurrence interval and higher intensity (shorter duration) storm event. The scenarios represent a scenario where a 10-year, 30-min duration storm event occurs with a 12 min duration spill occurring in the middle of the storm.
For the Parafield catchment, the simulated catchment travel time was found to be between 12 and 31 min at the closest high-risk location to the stormwater harvest point (S9) and furthest reach of the catchment (S12), respectively. The results show that regardless of the location, spills during wet weather travelled faster (less travel time) than the dry weather pollutant flows, as shown in Table 3. Perhaps most importantly, these travel periods leave little time for catchment managers to respond to any immediate knowledge of spills or overflows in the catchment.
Although the dry weather travel times are longer than wet weather travel times, so dry weather spills are found to be not vital for risk assessment related to travel time, they are important for the peak concentration of pollutants, which, ignoring the base flow artefact introduced for numerical stability of solutions, can be taken as the concentration of the pollutant in the spilled volume.
The highest concentrations of pollutants from spills reaching the harvesting point are in the dry weather scenario undiluted by stormwater flow. However, under wet weather scenarios, the smallest simulated storms produce the least dilution and would ensure that the contaminant reached the harvesting point. In general peak and average concentrations were highest for spills occurring at the start of a low recurrence interval, low intensity (longer duration) rainfall events. For the stormwater events with a 3-month recurrence interval, pollutant concentrations were diluted to less than 6.6% of the spill concentration and for events at a 10 year recurrence interval to less than 2.2%. Hence dilution cannot be relied on for more than about an order of magnitude reduction in pollutant concentration for large spills. Until this modelling was performed, it had been expected that a 3 to 5 log reduction would have occurred. This highlights the importance of calibrated models for improving the reliability of risk assessment for rarely occurring or measurable spill events.

3.4. Risk Management Strategies for Spill Scenarios in Urban Stormwater Catchments

Stormwater catchment modelling produced an indication of how a hazardous event such as a tanker spill or sewer overflow and its timing, duration, storm event intensity, storm event duration and spill location may affect the timing and characteristics of a pollutant arriving at the point of harvest. Overall, in terms of risk management the results indicated that the scenarios of most concern, in terms of catchment travel time and time to peak, were when short duration spill occurred at the middle of a high intensity, short duration storm event closer to the catchment outlet—although in the case of the case study catchment, a spill at the furthest location in the catchment still allowed little time for catchment managers to respond.
In the development of water safety plans [10], knowledge of the catchment travel time is a valuable reference for determining the time to respond to any hazardous event. Following the identification of potential hazards in a catchment using appropriate techniques [29], the catchment simulation procedures outlined here can be used to further determine the potential responses, or lack thereof, open to scheme managers when they become aware of an accident or spill which can affect the quality of harvested water.
Different configurations of stormwater catchment hydraulics and climatic factors would produce different results to those presented. This study demonstrated the potential sensitivity of storm intensity and duration as well as spill location, timing and duration on pollutant travel times, concentrations and persistence across the hydrograph. Despite these sensitivities, however, the overall extremely short potential response times to hazardous events are instructive. Effective water quality management may need to rely more on preventative measures and ‘end of pipe’ (point of harvest) automated detection and diversion or treatment of stormwater such as those outlined by other authors [4,20] rather than reactionary responses to hazardous spill events. For example, measures may need to be activated automatically based on thresholds in online monitoring [29] rather than dependent on human observation and intervention. Other preventive measures may include catchment surveillance at hazardous locations, communication with stakeholders especially high-risk industries, and focussing on safety within transport corridors. Communication is particularly important—if a driver or emergency first response service knew who to call in the event of an accident, they could get the harvest system shut off quickly. Additionally, detention storages in stormwater systems downstream of locations with residual high risk of contaminant spill points could be used as a buffer for both dilution and extending travel time. At the case study site, natural treatment systems such as the existing wetland and MAR scheme could be very effective in the management of some contaminants such as microbiological [6] or chemical contaminants [20,30].
There are several factors which may influence the outcome of this analysis, including catchment size, slope, impervious surface area, and drainage system connectivity and roughness, all of which are known to affect the velocity and volume of stormwater which drains through stormwater drainage systems. This study has shown that spills in the middle of storms tend to travel faster. This presents a concern for stormwater harvesting schemes because a common spill risk is the occurrence of sewer overflows [5], which are more likely to occur when flow is nearing its peak during storm events [31]. Consideration should also be given the readiness of local authorities to respond to known spill events in a catchment, such as the availability and preparedness of best practice guidelines [32].
Overall, this study has demonstrated the effectiveness of using well calibrated modelling tools to determine the time of travel of potential contaminant spills from known hazardous locations in a stormwater catchment where water is being harvested for beneficial use.

4. Conclusions

This study developed scenarios of pollutant spills (tanker spills and sewer overflows) for a fully operational stormwater harvesting MAR scheme to demonstrate a methodology which can quantify the effects of storm and spill characteristics with the aim of identifying potential risk management options. Simulation of catchment rainfall runoff was selected to compare the effect of hazardous spills in dry and wet weather.
For dry weather spills, the use of the SWMM model required an artificial baseflow be used to avoid unacceptable model errors. All dry weather spill events, in combination with artificial baseflow, travelled more slowly than wet weather spills. For wet weather spills, shortest travel times tended to occur for higher intensity storms, with shorter duration, and where a short duration spill of fixed volume occurred in the middle of the storm. Increasing the intensity of rainfall reduced the peak concentration of a pollutant at the harvest point via dilution, but it also reduced the time of travel. Overall, the longest travel times from the furthest hazard location in the catchment to the outlet (harvesting structure) were 31 to 84 min (wet and dry weather cases, respectively), and even less for closer locations. This effectively leaves no time to intervene with any reactive management actions.
Different stormwater catchment characteristics and climatic factors would produce different results, but in general, impervious urban catchments are likely to have rapid hydraulic response times. The study has demonstrated an effective means to assess the potential to manage a hazardous spill in the catchment of a stormwater harvest scheme. It found that for general urban stormwater harvesting systems like the case study catchment, risk management should focus on preventative risk management and end of pipe (or harvest point) monitoring and treatment rather than event-based response systems. Also, incident reporting protocols for spills in a stormwater harvesting catchment should be in place to alert operators of potential hazards.

Supplementary Materials

The following are available online at https://www.mdpi.com/article/10.3390/w13202865/s1, Table S1: Pollutant characteristics of MASS and CONCENTRATION based pollutant loads at downstream of the Cobbler pump with continuous baseflow, Table S2: Dry weather travel time statistics for a 20 kL and 40 kL spills without baseflow and with 5 L/s baseflow, Figure S1: Observed and model simulated data for (a) Event #1, (b) Event #2, (c) Event #3, (d) Event #4, (e) Event #5, (f) Event #6, (g) Event #7 and (h) Event #8; Figure S2: Observed and model simulated data for (a) Event #9, (b) Event #10, (c) Event #11, (d) Event #13, (e) Event #14, (f) Event #16, (g) Event #17 and (h) Event #18; Figure S3. Observed and model simulated data for (a) Event #19, (b) Event #20 and (c) Event #21; Figure S4: Travel time for 20 kL spill vs. 40 kL spill event.

Author Contributions

Conceptualization, D.P. (David Pezzaniti) and P.D.; methodology, B.M. and D.P. (David Pezzaniti); software, B.M.; validation, D.G., D.P. (David Pezzaniti) and J.A.; formal analysis, B.M. and J.A.; investigation, B.M. and D.P. (David Pezzaniti); resources, D.P. (David Pezzaniti) and D.G.; data curation, B.M. and D.P. (David Pezzaniti); writing—original draft preparation, B.M.; writing—review and editing, J.A., D.P. (David Pezzaniti) and P.D.; visualization, J.A.; supervision, P.D.; project administration, D.P. (David Pezzaniti) and D.P. (Declan Page); funding acquisition, B.M., D.P. (David Pezzaniti) and D.P. (Declan Page). All authors have read and agreed to the published version of the manuscript.

Funding

This research was funded by the Goyder Institute for Water Research Project U.2.1, a partnership between the South Australian Government through the Department of Environment, Water and Natural Resources, CSIRO, Flinders University, the University of Adelaide and the University of South Australia.

Acknowledgments

The authors acknowledge support from the partners to the Managed Aquifer Recharge and Stormwater Use Options research project. These are the National Water Commission through the Raising National Water Standards Program, the South Australian Government through the Goyder Institute for Water Research, CSIRO Water for a Healthy Country Program, City of Salisbury, the Adelaide and Mt Lofty Ranges Natural Resources Management Board, the South Australian Water Corporation and the former United Water International. The authors are also grateful for the provision of information for this study from the City of Salisbury and the City of Tea Tree Gully. The authors would also like to thank Computational Hydraulics International (CHI) for providing the PCSWMM software licence for research use.

Conflicts of Interest

The authors declare no conflict of interest. The funders had no role in the design of the study; in the collection, analyses, or interpretation of data; in the writing of the manuscript, or in the decision to publish the results.

References

  1. NRMMC-EPHC-NHMRC. Australian Guidelines for Water Recycling: Managing Health and Environmental Risks (Phase 2), Stormwater Harvesting and Reuse; Natural Resource Management Ministerial Council, Environment Protection and Heritage Council, National Health and Medical Research Council: Canberra, Australia, 2009.
  2. NRMMC-EPHC-NHMRC. Australian Guidelines for Water Recycling: Managing Health and Environmental Risks (Phase 2) Managed Aquifer Recharge; Natural Resource Management Ministerial Council, Environment Protection and Heritage Council, National Health and Medical Research Council: Canberra, Australia, 2009.
  3. Duncan, H.P. Urban stormwater pollutant characteristics. In Australian Runoff Quality; Wong, T.H.F., Ed.; Engineers Australia, ACT: Canberra, Australia, 2005. [Google Scholar]
  4. Page, D.; Gonzalez, D.; Torkzaban, S.; Toze, S.; Sidhu, J.; Miotlinski, K.; Barry, K.; Dillon, P. Microbiological risks of recycling urban stormwater via aquifers for various uses in Adelaide, Australia. Environ. Earth Sci. 2014, 73, 7733–7737. [Google Scholar] [CrossRef]
  5. Page, D.; Gonzalez, D.; Sidhu, J.; Toze, S.; Torkzaban, S.; Dillon, P. Assessment of treatment options of recycling urban stormwater recycling via aquifers to produce drinking water quality. Urban Water J. 2015, 13, 657–662. [Google Scholar] [CrossRef]
  6. Page, D.; Dillon, P.; Toze, S.; Sidhu, J.P.S. Characterising aquifer treatment for pathogens in managed aquifer recharge. Water Sci. Technol. 2010, 62, 2009–2015. [Google Scholar] [CrossRef] [PubMed] [Green Version]
  7. Allison, R.A.; Williams, R.N.; Naumann, B. Configuring biofiltration for large scale stormwater harvesting. In Proceedings of the 7th International Conference on Water Sensitive Urban Design, Sydney, NSW, Australia, 21–24 February 2012. [Google Scholar]
  8. Zhang, K.; Randelovic, A.; Aguiar, L.M.; Page, D.; McCarthy, D.T.; Deletic, A. Methodologies for Pre-Validation of Biofilters and Wetlands for Stormwater Treatment. PLoS ONE 2015, 10, e0125979. [Google Scholar] [CrossRef] [PubMed] [Green Version]
  9. Zhang, K.; Randelovic, A.; Deletic, A.; Page, D.; McCarthy, D.T. Can we use a simple modelling tool to validate stormwater biofilters for herbicides treatment? Urban Water J. 2018, 16, 412–420. [Google Scholar] [CrossRef]
  10. World Health Organization. Protecting Surface Water for Health: Identifying, Assessing and Managing Drinking-Water Quality Risks in Surface-Water Catchment; World Health Organization: Geneva, Switzerland, 2016. [Google Scholar]
  11. Hossain, I.; Imteaz, M.A. Advances in Landscape Runoff Water Quality Modelling: A Review. In Landscape Dynamics, Soils and Hydrological Processes in Varied Climates; Melesse, A.M., Abtew, W., Eds.; Springer International Publishing: Berlin/Heidelberg, Germany, 2016; pp. 225–257. [Google Scholar]
  12. Rivord, J.; Saito, L.; Miller, G.; Stoddard, S.S. Modeling Contaminant Spills in the Truckee River in the Western United States. J. Water Resour. Plan. Manag. 2014, 140, 343–354. [Google Scholar] [CrossRef]
  13. Siqueira, H.E.; Pissarra, T.C.T.; Junior, R.F.D.V.; Fernandes, L.F.S.; Pacheco, F.A.L. A multi criteria analog model for assessing the vulnerability of rural catchments to road spills of hazardous substances. Environ. Impact Assess. Rev. 2017, 64, 26–36. [Google Scholar] [CrossRef] [Green Version]
  14. City of Novi. City of Novi Rouge River GIS/Public Awareness Project; City of Novi: Novi, MI, USA, 2000. [Google Scholar]
  15. Sämann, R.; Neuweiler, I.; Graf, T. Forecasting Pollution Transport in Drainage Water. In New Trends in Urban Drainage Modelling; Mannina, G., Ed.; Springer: Cham, Switzerland, 2019; pp. 701–705. [Google Scholar]
  16. Smith, D.; Li, J.; Banting, D. A PCSWMM/GIS-based water balance model for the Reesor Creek watershed. Atmos. Res. 2005, 77, 388–406. [Google Scholar] [CrossRef]
  17. Gironás, J.; Roesner, L.A.; Rossman, L.A.; Davis, J. A new applications manual for the Storm Water Management Model (SWMM). Environ. Model. Softw. 2010, 25, 813–814. [Google Scholar] [CrossRef]
  18. Shon, T.S.; Kim, S.D.; Cho, E.Y.; Im, J.Y.; Min, K.S.; Shin, H.S. Estimation of NPS pollutant properties based on SWMM modeling according to land use change in urban area. Desalination Water Treat. 2012, 38, 267–275. [Google Scholar] [CrossRef]
  19. Petrucci, G.; Rioust, E.; Deroubaix, J.-F.; Tassin, B. Do stormwater source control policies deliver the right hydrologic outcomes? J. Hydrol. 2013, 485, 188–200. [Google Scholar] [CrossRef] [Green Version]
  20. Page, D.; Miotliński, K.; Gonzalez, D.; Barry, K.; Dillon, P.; Gallen, C. Environmental monitoring of selected pesticides and organic chemicals in urban stormwater recycling systems using passive sampling techniques. J. Contam. Hydrol. 2014, 158, 65–77. [Google Scholar] [CrossRef] [PubMed]
  21. Radcliffe, J.C.; Page, D.; Naumann, B.; Dillon, P. Fifty years of water sensitive urban design, Salisbury, South Australia. Front. Environ. Sci. Eng. 2017, 11, 7. [Google Scholar] [CrossRef]
  22. Swierc, J.; Page, D.; van Leeuwen, J.; Dillon, P. Preliminary Hazard Analysis and Critical Control Points Plan (HACCP)-Salisbury Stormwater to Drinking Water Aquifer Storage Transfer and Recovery (ASTR) Project; CSIRO Land and Water Technical Report 20/05; CSIRO Land and Water: Adelaide, SA, Australia, 2005. [Google Scholar]
  23. Clark, R.; Gonzalez, D.; Dillon, P.; Charles, S.; Cresswell, D.; Naumann, B. Reliability of water supply from stormwater harvesting and managed aquifer recharge with a brackish aquifer in an urbanising catchment and changing climate. Environ. Model. Softw. 2015, 72, 117–125. [Google Scholar] [CrossRef]
  24. Rossman, L.A. Storm Water Management Model User’s Manual Version 5.0; Environmental Protection Agency: Washington, DC, USA, 2010.
  25. Moriasi, N.D.; Arnold, G.J.; van Liew, W.M.; Bingner, L.R.; Harmel, D.R.; Veith, L.T. Model Evaluation Guidelines for Systematic Quantification of Accuracy in Watershed Simulations. Trans. ASABE 2007, 50, 885–900. [Google Scholar] [CrossRef]
  26. ASCE. Criteria for Evaluation of Watershed Models. J. Irrig. Drain. Eng. 1993, 119, 429–442. [Google Scholar] [CrossRef]
  27. Page, D.; Gonzalez, D.; Dillon, P.; Vanderzalm, J.; Vadakattu, G.; Toze, S.; Sidhu, J.; Miotlinski, K.; Torkzaban, S.; Barry, K. Managed Aquifer Recharge Stormwater Use Options: Public Health and Environmental Risk Assessment Final Report; Goyder Institute for Water Research Technical Report Series No. 13/17; Goyder Institute for Water Research: Adelaide, SA, Australia, 2013; Volume 13, p. 17. [Google Scholar]
  28. Pilgrim, D.H. (Ed.) Australian Rainfall and Runoff—A Guide to Flood Estimation; Institution of Engineers, ACT: Canberra, Australia, 1987. [Google Scholar]
  29. Gonzalez, D.; Page, D.; Vanderzalm, J.; Dillon, P. Setting Water Quality Trigger Levels for the Operation and Management of a MAR System in Parafield, South Australia. J. Hydrol. Eng. 2015, 20, 5014001. [Google Scholar] [CrossRef]
  30. Vanderzalm, J.L.; Page, D.W.; Barry, K.E.; Dillon, P.J. Application of a probabilistic modelling approach for evaluation of nitrogen, phosphorus and organic carbon removal efficiency during four successive cycles of aquifer storage and recovery (ASR) in an anoxic carbonate aquifer. Water Res. 2013, 47, 2177–2189. [Google Scholar] [CrossRef] [PubMed]
  31. Sempere-Torres, D.; Corral, C.; Raso, J.; Malgrat, P. Use of Weather Radar for Combined Sewer Overflows Monitoring and Control. J. Environ. Eng. 1999, 125, 372–380. [Google Scholar] [CrossRef]
  32. Canadian Fuels Association. Land Transportation Emergency Response Guideline for Petroleum Spills; Canadian Fuels Association: Ottawa, ON, Canada, 2013. [Google Scholar]
Figure 1. Location and layout of the Parafield stormwater harvesting scheme, including modelled pollutant spill locations used in this study.
Water 13 02865 g001
Figure 2. Observed and model simulated data for (a) Event #12 and (b) Event #15.
Water 13 02865 g002
Figure 3. The flow and pollutant concentration characteristics at the point of harvest with a 5 min duration spill occurring at the top of the catchment (S12) and at (a) the beginning of the 3-month, 0.5 h storm, (b) the beginning of the 10-year, 0.5 h storm, (c) the beginning of the 10-year, 12 h storm, and (d) the middle of the 10-year, 12 h storm. The flow and pollutant concentration characteristics at the point of harvest with a 30 min duration spill at the beginning of the 10-year, 0.5 h storm occurring at (e) the top of the catchment and (f) the middle of the catchment. The flow and pollutant concentration characteristics at the point of harvest with a (g) 30 min and (h) 120 min duration spill occurring at the top of the catchment (S12) and at the beginning of the 10-Year, 12 h storm.
Water 13 02865 g003
Figure 4. Time of travel from spill location to the point of harvest for scenarios with spill duration of (a) 5 min, (b) 30 min and (c) 120 min.
Water 13 02865 g004
Figure 5. Time taken to reach a peak pollutant at the point of harvest for scenarios with spill duration of (a) 5 min, (b) 30 min and (c) 120 min. * Data was excluded as the spill duration exceeded the event duration resulting in high model error.
Water 13 02865 g005
Figure 6. Maximum pollutant concentration at the point of harvest for scenarios with spill duration of (a) 5 min, (b) 30 min and (c) 120 min. * Data was excluded as the spill duration exceeded the event duration resulting in high model error.
Water 13 02865 g006
Figure 7. Mean pollutant concentration at the point of harvest for scenarios with spill duration of (a) 5 min, (b) 30 min and (c) 120 min. * Data was excluded as the spill duration exceeded the event duration resulting in high model error.
Water 13 02865 g007
Table 1. Characteristics of events used for calibration and validation of the PCSWMM model and the fitness results.
NoDateObserved DataSimulated DataStatistical DataDescription c
Total Rain (mm) aRain Duration (h) bFlow Duration (h)Peak Flow (m3/s)Flow Volume (m3)Peak Flow (m3/s)Flow Volume (m3)Nash–Sutcliffe, r2PEP (%)G
(L/s)2
129/01/20040.80.411.50.15690.136740.84−29.90.01C, Summer, short duration
28/07/20031.40.56.50.7329370.3721110.7149.60.77C, Winter, short duration
321/02/20045.14.714.11.7112,0901.8314,5800.86−7.33.27C, Summer, short duration
422/04/20046.1612.81.9713,3602.0814,9800.69−5.78.04C, Winter, long duration
523/07/200320.53044.42.0778,9202.2677,1900.9−910.32C, Winter, long duration
63/07/20032.3211.62.2488731.0770770.6452.18.66C, Winter, short duration
711/07/20038.617.929.1324,1303.5724,5000.73−18.814.36C, Winter, long duration
823/06/200414.547.254.54.3351,5003.847,2000.8712.318.99C, Winter, long duration
918/06/200419.524.5344.3778,3703.866,6900.691380.44C, Winter, long duration
1026/06/200346.264.669.57.2142,30011.11143,8000.75−54.5167.3C, Winter, long duration
1122/05/20042.97.818.10.6450240.4651860.6527.50.97V, Winter, long duration
1215/05/20043.112.5200.7556500.4157270.5945.11.66V, Winter, long duration
131/06/20047.422.631.90.7817,2900.7420,2700.85.62.36V, Winter, long duration
1429/04/20043.81.37.41.5465761.6975230.77−9.72.74V, Winter, short duration
158/07/20045.48171.8413,7901.7313,2000.975.81.04V, Winter, long duration
1628/05/20043.91.37.42.1892862.2799080.88−4.22.88V, Winter, short duration
179/06/20049.53.114.43.1121,8204.6227,8100.82−48.515.59V, Winter, short duration
184/11/200427.65968.73.1581,0803.8587,4400.69−22.243.58V, Summer, long duration
1911/06/200422.695106.13.3359,2504.263,0400.74−25.937.33V, Winter, long duration
203/01/20056.94104.1919,9604.1118,4300.86212.66V, Summer, short duration
218/12/200414.532.337.66.4734,0509.3639,4300.7−44.869.09V, Summer, long duration
a Event duration based on observed flow, b Rainfall at Parafield Airport gauge (023013), c ‘C’ indicates the event was used for calibration, ‘V’ indicates that the event was used for validation; long duration is used to describe storms greater than 5 h.
Table 2. Characteristics of storm events and spill scenarios in the preliminary analysis to determine spill event conditions to produce shortest travel times and highest peak contaminant concentrations for use in risk assessment.
Model InputValueComment
Intensity (Storm ARI)3-month ARILower intensity storm
10-year ARIHigher intensity storm
Storm duration30 minShorter duration storm (typical of local climate in summer)
12 hLonger duration storm (typical of the local climate in winter)
Spill locationPump Station
Midpoint
Represents spill location the Cobbler Creek catchment
Represents spill at the half way to the Harvest point
Spill volume20 kL
40 kL
100 ‘44 gallon’ drums
200 ‘44 gallon’ drums
Spill duration6 minRapid spill
30 minMedium duration spill
2 hGradual spill
Spill timingBeginning of stormSpill at time t = 0
Midpoint of stormSpill at time t = 15 min or 6 h
Total # scenarios= 2 (Intensity) × 2 (Duration) × 2 (Location) × 3 (Spill duration) × 2 (Timing) = 48
Table 3. Travel time of spills during dry and wet weather.
SitePit-IDDistance (m)Elevation Start (m)Elevation End (m)Mean Slope (%)PCSWMM Travel Time (mins)
20 kL Spill @ Dry Weather40 kL Spill @ Dry Weather20 kL Spill @ Wet Weather 10Y ARI
S1Pit-25331510051.639.810.82786724
S2Pit-25639518054.239.810.86786724
S3Pit-20061409053.869.811.08605418
S4Pit-25356339027.299.810.52555418
S5Pit-18621206018.809.810.44303018
S6Pit-18250428038.129.810.66554818
S7Pit-18251379535.349.810.67484218
S8Pit-24527248021.349.810.46303012
S9Pit-19692216019.769.810.46302712
S10Pit-20089586567.299.810.98797224
S11Pit-16017439538.899.810.66605018
S12Pit-23138681080.689.811.04847331
Publisher’s Note: MDPI stays neutral with regard to jurisdictional claims in published maps and institutional affiliations.

