1. Introduction
Groundwater is one of the most essentials of our human structure and contributes a major share in our economic development [
1,
2,
3]. It is the only life support source proving substantial for cultivable lands and uncultivable, where there is no other water source available [
4,
5]. More than two billion people need drinking water and rely on groundwater [
1]. However, in recent times, due to accelerated population increase, agriculture needs, and high manufacturing expectations, the quantity and quality of groundwater sources are failing across the globe [
4,
6,
7,
8]. For the past few years, drinking unclean water has led to major health fears due to a contamination rise in groundwater capital [
9,
10,
11,
12]. According to the statistics, contamination of drinking water is responsible for 30% of illnesses and 40% of total deaths [
13]. It becomes difficult or even impossible to restore the aquifers once they are contaminated. That is why planners and engineers need to consider the susceptibility by identifying critical land to preserve uncontaminated groundwater [
14,
15,
16].
Globally, agricultural lands cover around 260 million hectares of total land. Pakistan, China, the USA, and India are the four countries responsible for more than half of the total earth’s agriculture field [
17]. Around 60% of the world’s total grain is irrigated and harvested by two-thirds of the freshwater, which is expressively contributed by groundwater. Statistics show that the extraction of groundwater globally is anticipated to be 750–800 billion cubic meters (BCM) annually for agriculture use [
1]. Furthermore, the percentage is increasing by 1–3% yearly around the globe because of increasing population and high living demands [
18].
In Pakistan, around 90% of the population fulfills their domestic requirements from groundwater. Due to the increase in population, water demand is increasing, putting absolute stress on groundwater and damaging groundwater vulnerability. Once the underground aquifer is polluted, it is a very hard job and a costly process to purify the contaminated water [
4,
19,
20,
21,
22]. In Pakistan, community health studies revealed that 50% of illnesses and 40% of deaths were due to contamination of water [
23]. Around 7000 random samples of water taken from Pakistan show that an average of over 58% and 71% of samples were infected with fecal coliforms and total coliforms, respectively [
24]. Talking about the different areas of Pakistan such as Chichawatni, Vehari, and Rahimyar Khan, 62% of groundwater was unsuitable for drinking in 2015 [
25]. Around 66% of water is being used with the help of the piped system and mechanical pumps [
26]. There are circumstances in which the method of purification is not even economically possible. Thus, it is very much important that the polluted regions of the aquifers be identified, and appropriate precautionary measures are taken in order to save the groundwater from more contamination [
27]. This is why groundwater quantity and quality are prominent concerns [
28].
Qureshi and Ashraf [
29] described that the damage caused to people or the surrounding system due to anthropogenic activities is termed as vulnerability. It can identify a particular threat or several threats [
30]. The susceptibility assessment labels the degree of contamination or susceptibility to pollution of groundwater quality. France was first to introduce the idea in late 1960 to form awareness of groundwater vulnerability [
4]. The assessment can categorize the zones according to the degree of contamination and provide statistical outputs for the protection of groundwater in the specified region [
31]. Since then, many methods have been introduced to assess the susceptibility of the aquifer structures and how to evaluate the susceptibility. Various methods such as statistical procedures, process-based procedures, and overlay and index procedures were introduced [
6] where the most extensive method under the overlay and index procedure is the DRASTIC process technique [
28].
The DRASTIC approach is comprised of seven parameters as the main factors in the hydrogeological system, with ‘D’ as depth to the water table, ‘R’ as net recharge, ‘A’ as aquifer media, ‘S’ as soil media, ‘T’ as topography, ‘I’ as the impact of vadose zone, and ‘C’ as hydraulic conductivity [
32]. The accuracy of the susceptibility assessment process depends upon the factors of concentration of nitrate and land use patterns [
6]. The advantage of the DRASTIC approach is that it can be used as a rapid brief calculations tool before applying it to the further complicated numeric models of groundwater [
4]. Additionally, the nitrate contamination assessment and land use pattern system have drastically improved the model’s precision in vulnerability calculations [
28]. However, this model’s main disadvantage is the parameter selection of the hydrogeological system; the ratings and weight calculated differ from the actual circumstances of the examination area because the same rating value and weight value are given to each parameter, which in results gives high subjectivity [
33].
Different studies have used the DRASTIC model without taking into consideration a key factor that reflects a huge part in affecting the urbanized groundwater contamination areas. This study introduced an improved DRASTIC/DRASTICA model, in which a new parameter ‘A,’ called “impact of anthropogenic effects,” was considered. Land use patterns will be applied and combined with the anthropogenic influence to improvise the DRASTIC method for more accurate results in the research region. In the future, new industries will be installed in the study area due to China-Pakistan economic corridor (CPEC) project. So, there is a need to figure out the groundwater contaminated zones of a district which will help the planners in the future. In addition, this study is not only limited to this area, but it can be a standard for other areas of the CPEC and is also applicable on a global scale.
2. Literature Review
Groundwater infection, particularly the contamination of unconfined aquifers, is considered a major ecological problem in the modern world today. As it is contaminated, it becomes a very difficult task to revert groundwater to its previous quality [
14]. In China, the primary aspect of contamination to the underground aquifer is the nitrate contagion caused by years of land fragmentation and waste discharge, which is why the demands of water supply are not being fulfilled [
31]. Therefore, the valuation of the groundwater exposure is very much important as it supports the decision-designers to understand the condition of groundwater in a specific area [
14].
In assessing the polluted zones of groundwater, various approaches have been introduced for the valuation of the unconfined sensitivity to pollution, and the methods are categorized into three major groups [
30]: (1) overly and index procedure; (2) approaches containing procedure-based simulated simulations; (3) statistical procedures. In overly and index procedure, the reasons which are solely responsible for the movement of contaminants from the earth’s surface to the underground levels of water source (for example, topography, soil media, hydraulic conductivity, etc.) are plotted computing upon the data which is derived or present. Respective factors are then assigned by the independent numerical values (rating) based on how much it plays a role in controlling the contamination movement. The maps developed after the values assigned and calculation are then combined linearly to develop the final figure of that area’s groundwater vulnerability. Results evaluated by such a method of vulnerability assessment are relative and qualitative. DRASTIC works on dividing the area into several zones based solely on DVI (DRASTIC vulnerability index), which indicates the degree of contamination in the form of hydrological maps [
34,
35]. The advantage of this method is that the large-scale assessment because of the factors such as net recharge and depth to the water table can be assessed easily to a larger extent [
36]. With the help of GIS technology, it is much more efficient for producing ground vulnerability assessment maps [
30]. Generally, a modification for the DRASTIC technique is based upon two factors: (1) removing parameters in the DRASTIC system [
37] or (2) addition of extra parameters such as land use, etc. Considering land use and nitrate intervention technique as a parameter for increased efficiency of assessment of groundwater susceptibility is a better alternative to the DRASTIC technique [
38].
Shirazi et al. [
6] in the Melaka State of Malaysia assessed the groundwater susceptibility by means of the DRASTIC method by integrating the GIS system and established a map that shows the areas affected by land use on the susceptibility of groundwater. Alam et al. [
39] estimated the susceptibility of groundwater in the Central Ganga Plain but also explained a spatial connection between some factors such as topography, geology, pollution centers, land cover, and groundwater quality in this area. Khan et al. [
40] illustrated the quantity and quality of aquifers near the surface using the method of groundwater susceptibility in the region of the Indo-Gangetic Plains which was largely impacted by patterns of land use. Umar et al. [
41] also evaluated the vulnerability by producing a risk map in Western Uttar Pradesh, a region of the Central Ganga Plain, using the DRASTIC method. The results show that 53%, 40%, and 7% of the appointed area are categorized by very high- to high-, medium-, and low-exposed regions, individually. Rahman [
42] demonstrated the sensitive regions in near-surface aquifers of Aligarh and its neighboring fields. Ckakraborty et al. [
43] also applied the improved DRASTIC model to analyze the exposure of West Bengal [
28]. Much previous research has confirmed, after the different zone groundwater contamination assessment, that pollution has gradually increased in recent years [
39].
The studies, which have been listed above, estimated the vulnerability of the groundwater without taking a key parameter of the modified DRASTIC model called the “impact of anthropogenic activities.” Modern urbanization has influenced groundwater pollution as an outcome of large-scale anthropogenic activities. Different researchers [
44,
45,
46] altered the DRASTIC model with the added parameter of land use. Singh et al. [
28] applied the DRASTIC model successfully into the susceptibility evaluation of groundwater in the Lucknow region, India. Maqsoom et al. [
47] performed a similar study in which the DRASTICA model was used. This study reveals that, in urbanized areas, anthropogenic actions are causing a significant part in the infection of the groundwater. It has been found that shallow levels of water, penetrable vadose zone, and elevated net recharge percentage in the research region are responsible for highly susceptible zones. So, it is necessary to consider urban settlements in an area because urban sprawl is the main cause of contamination. Recent research was done in Kurdistan, Iraq, in which a standard DRASTIC model is used with an additional parameter of lineament density [
48]. It can be observed that the modified DRASTIC model shows a higher concentration of nitrates than in the simple DRASTIC model. The above examples show that adjusted parameters with the standard DRASTIC model generate more accurate and meaningful outputs than the DRASTIC model alone. Different researchers used different models based on aquifer type and the availability of data in the respective investigation region [
49]. Therefore, it is a presentation of the modified DRASTIC model or DRASTICA with the parameter “A” which illustrates the vulnerability zones of the groundwater concerning the land use pattern and anthropogenic activities to distinguish properly the susceptible zones of the Chital district. The model is integrated with a geographic information system (GIS) to generate maps of groundwater vulnerability to contamination with low cost and less time.
4. Results
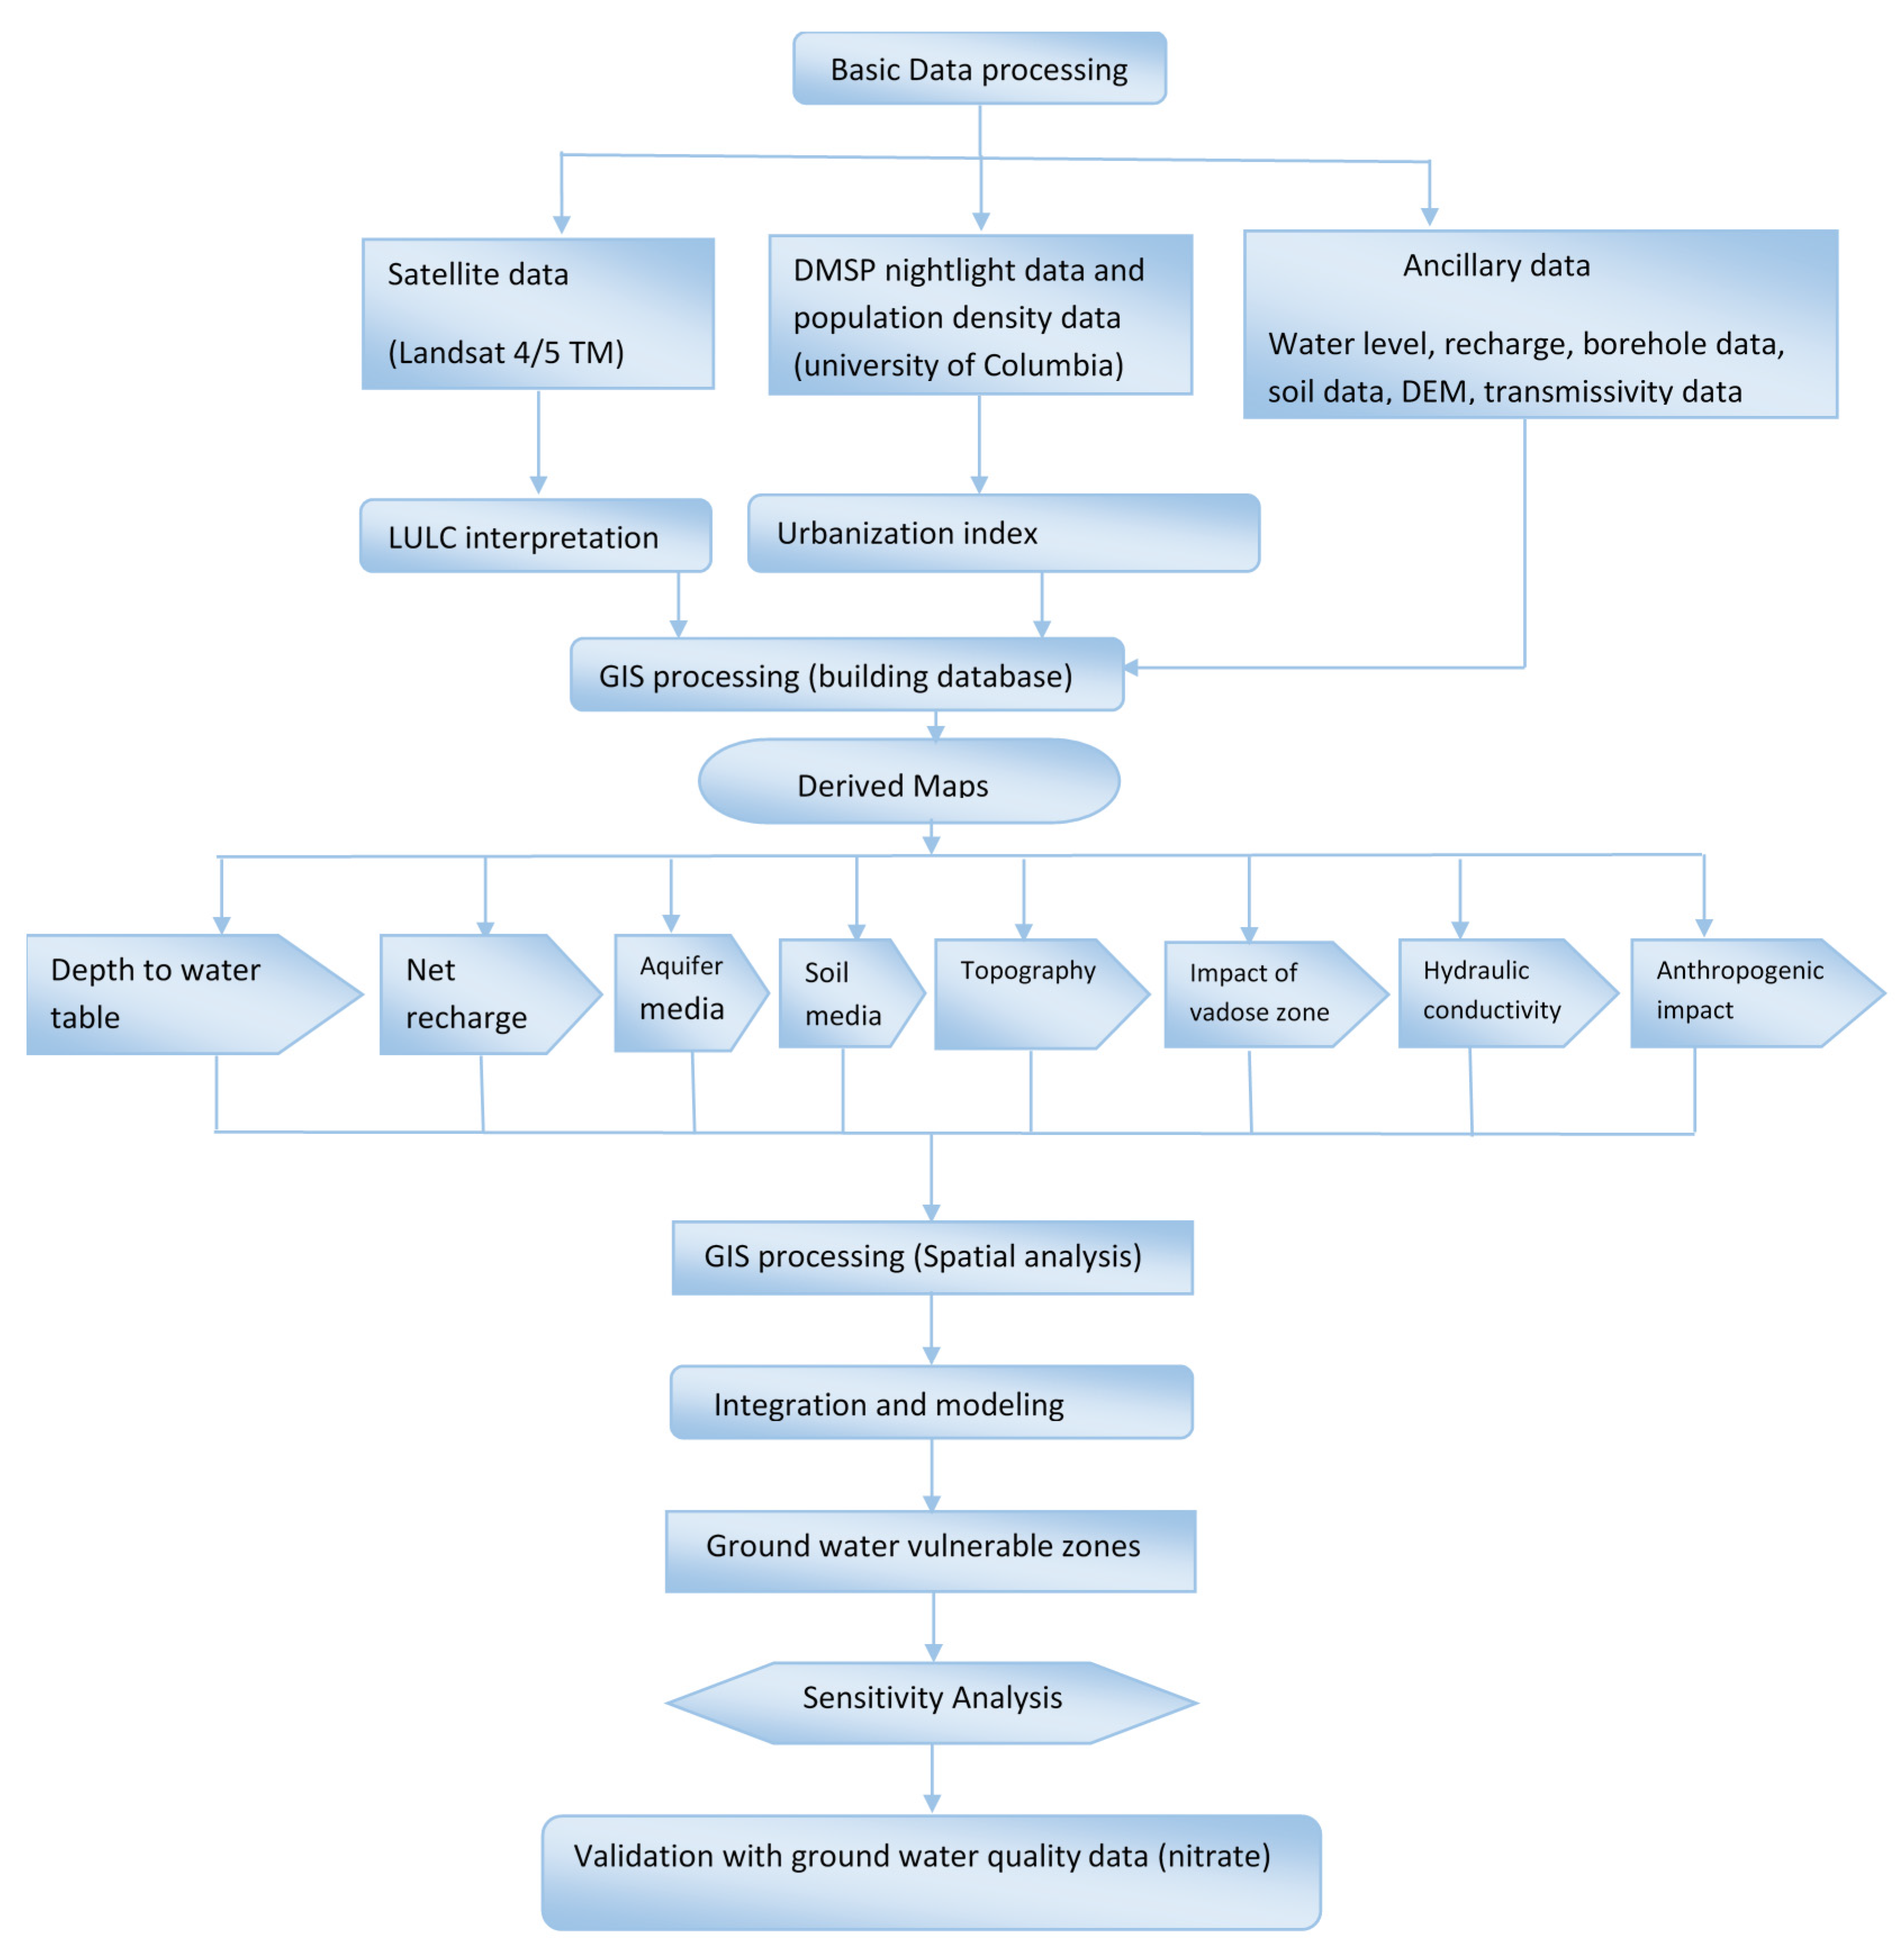
Groundwater susceptibility to contamination can be assessed by generating thematic maps of DRASTIC parameters, and after analyzing the results, a final susceptibility map was prepared to estimate the concentration of nitrates present in the research region. A sensitivity analysis was employed at the end to verify the impact of the additional parameter on groundwater susceptibility.
4.1. Thematic Maps of the Factors
Thematic maps were generated by the DRASTIC and modified DRASTIC method to find out the susceptibility of aquifers of the Chitral district. Seven thematic maps for DRASTIC and eight thematic maps were arranged for the modified DRASTIC model. The following seven steps were taken for the assessment.
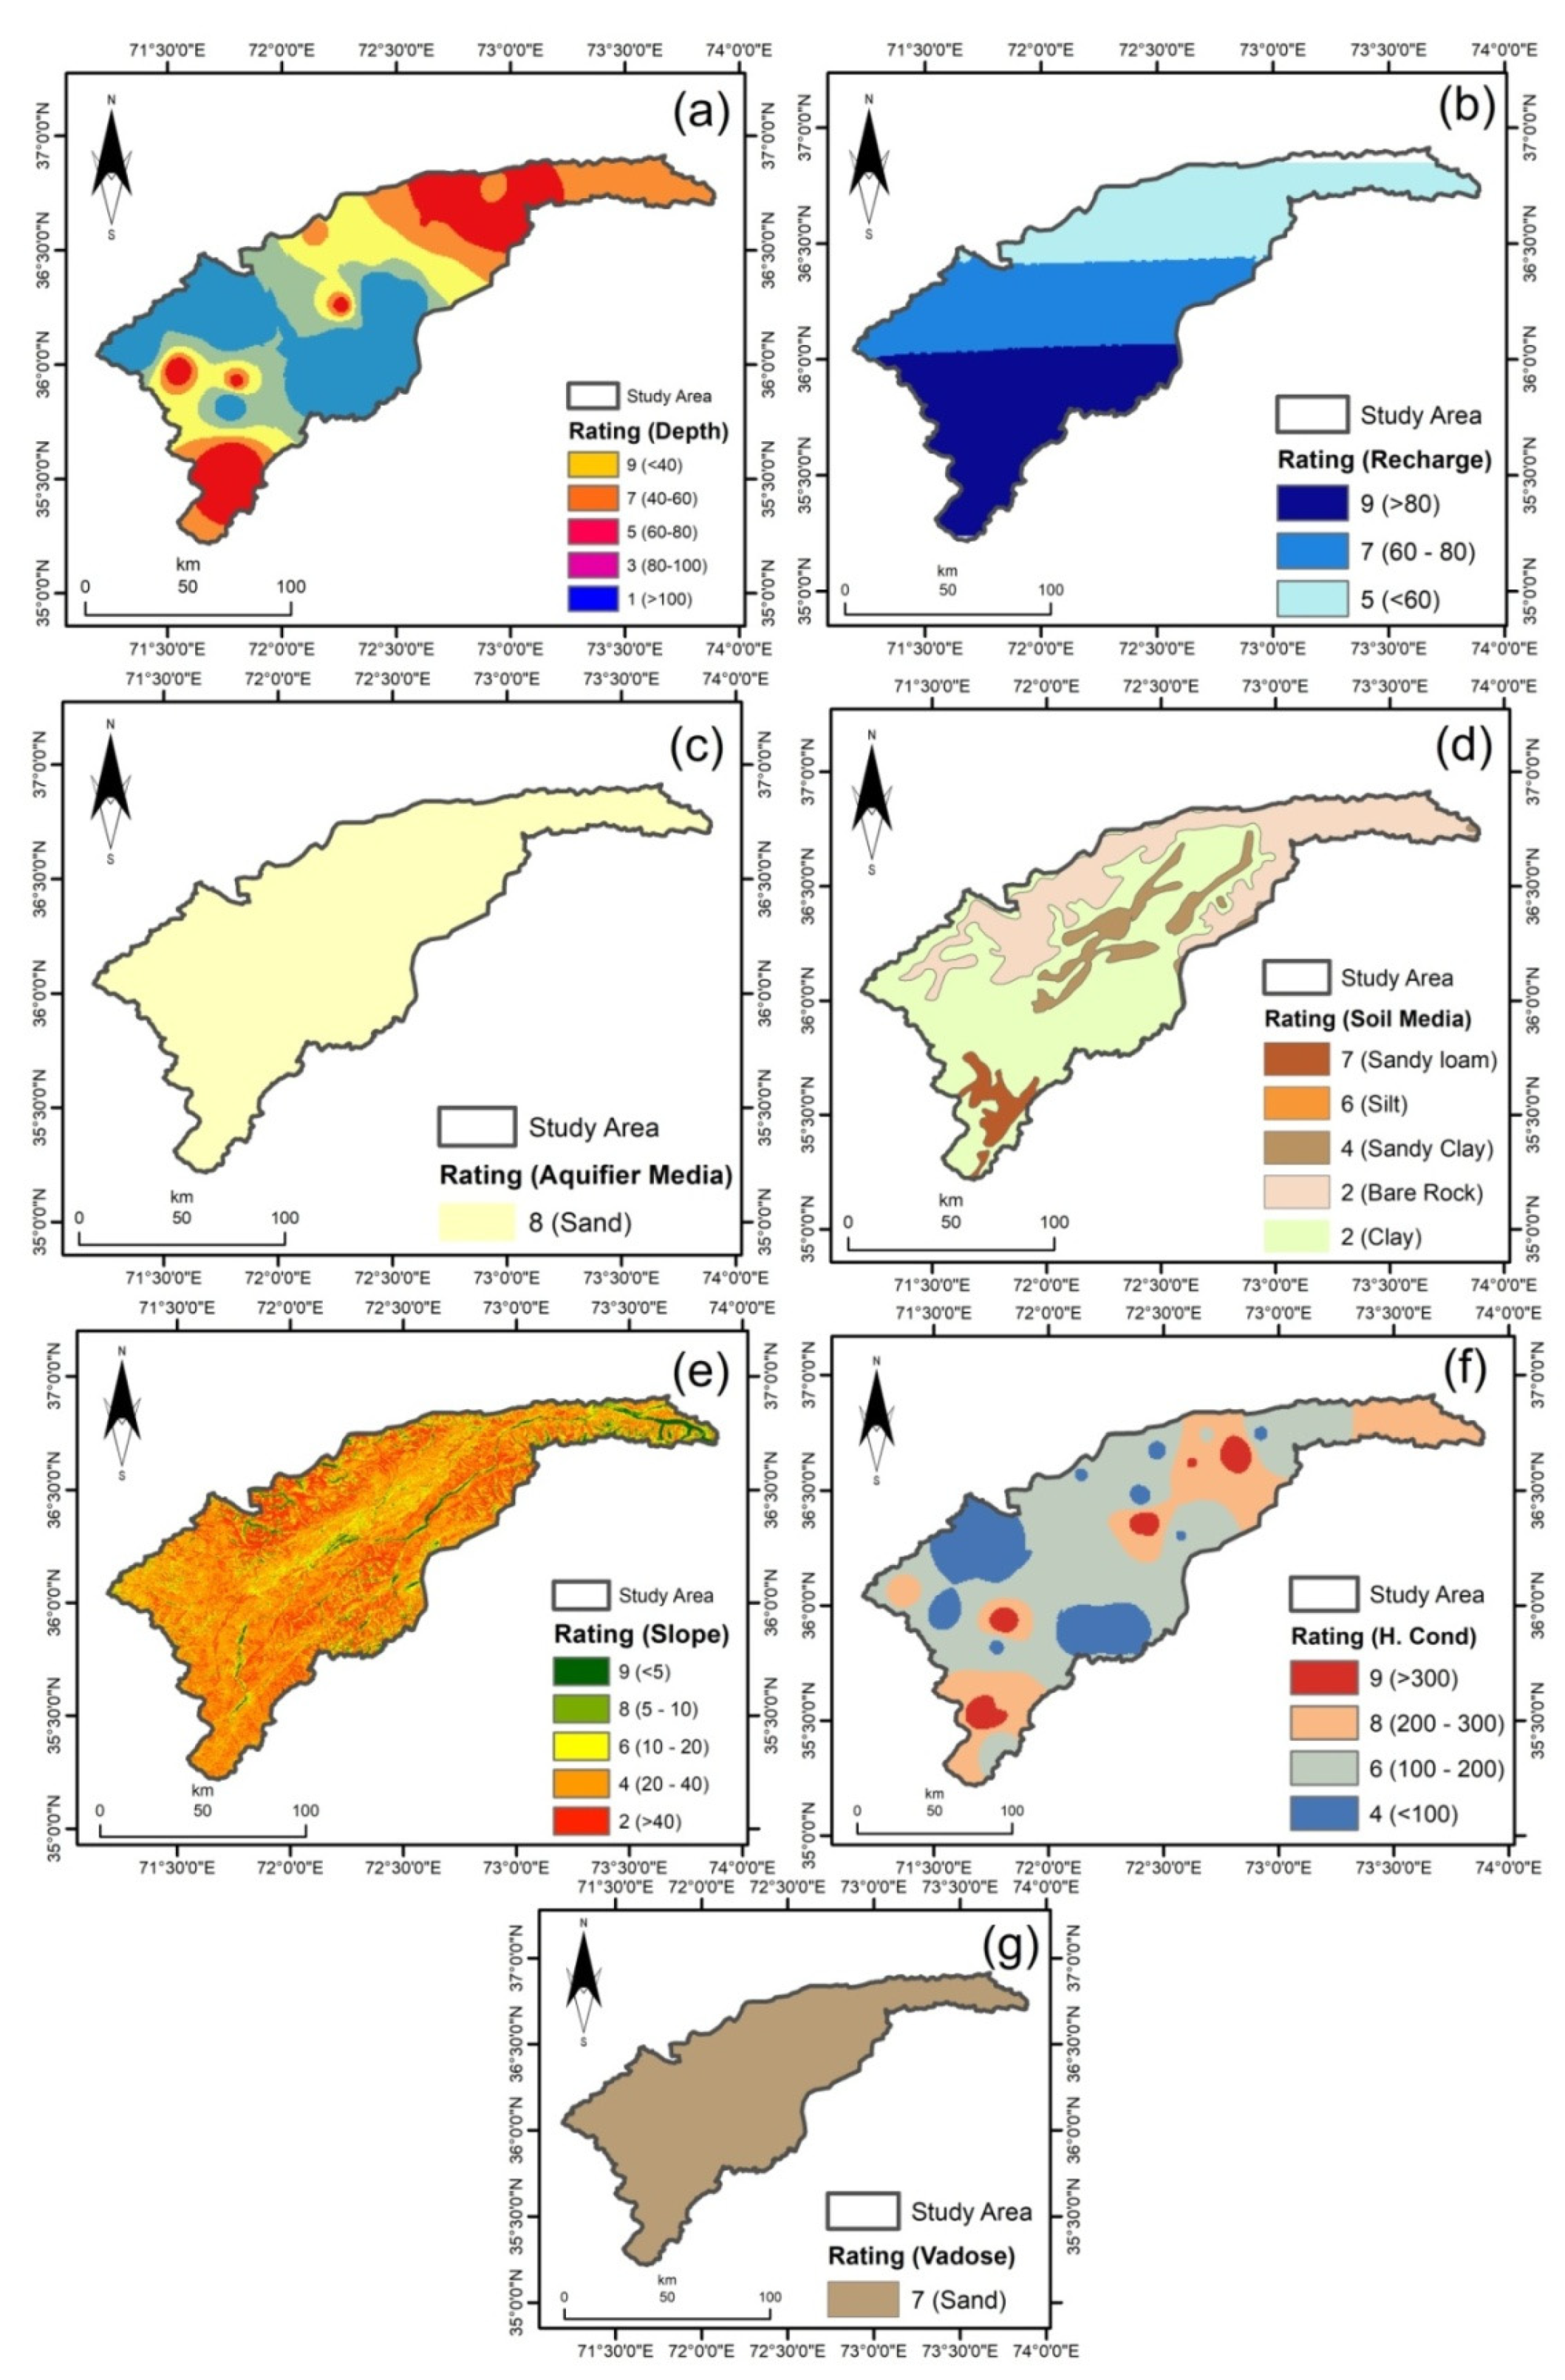
4.1.1. Depth of the Water Table
Depth of the water table has a substantial function in assessing the susceptibility of contamination in the region. They both have an opposite relationship, so shallow groundwater level increases the chances of contamination and vice versa. Maximum weight was assigned to this parameter for estimating the susceptibility of groundwater contamination (source of data and depth preparation information).
The map shown in
Figure 3a illustrates the classification of depth to table in feet and classified into six different classes (<40, 40–60, 60–80, 80–100, >100) and appropriate ratings were given: 9, 7, 5, 3, 1. It shows that the parameter ranges from (<40~>100) less than 40 ft to greater than 100 ft. After that, to make raster data, results were converted into a grid.
Table 2 illustrates the range of intervals, rating of DRASTIC, weights, and resulting index of water depth.
4.1.2. Net Recharge
Recharge significantly affects the transportation of pollutants to the groundwater. Recharge and transportation of contaminants have a direct relation. Areas with a high recharge of groundwater are more prone to groundwater contamination because a permeable pathway is available from the surface to the subsurface level.
The gravity force factor is responsible for the transmission of water perpendicularly. The unit for net recharge is millimeter per year and weight ‘4′ was assigned to this parameter. The investigation region is divided into three different divisions (mm): >80, 60–80, and <60, and their rating classes are 9, 7, and 5 respectively as shown in
Figure 3b.
4.1.3. Aquifer Media
Higher porosity and permeability have an inverse relationship with the aquifer’s attenuation capacity and as a result risk of contamination increases. Aquifer medium significantly controls the pathway and route span of pollutants.
Figure 3c illustrates the map of aquifer media is based on data of borehole aquifer media of the Chitral district.
4.1.4. Soil Media
Soil has a considerable influence on the recharge quantity having a possibility of infiltration into the groundwater and ultimately on the vertical movement capacity of pollutants through the vadose zone. Soil permeability is decreased by fine-textured soil types such as loam and clay loam. There are commonly five soil types including silt, sandy loam, bare rock, sandy clay, and clay.
Figure 3d shows the map of soil media and
Table 2 presents appropriate ratings (7, 6, 4, 2, 2) assigned to different types of soil.
4.1.5. Topography
The topography is helpful to indicate the concentration of pollutants in an area. In
Figure 3e, the Chitral district is divided into 5 classes: very steep gradient (>40 degrees), steep gradient (20–40), moderate gradient (10–20 degree), mild gradient (5–10 degrees), and very mild gradient (<5 degrees). Standard values are assigned to slope values ranging from 2 to 9, where 2 indicates the lowest slope while 9 indicates the highest value of the slope.
4.1.6. Impact of Vadose Zone
Higher thickness of the vadose zone specifies less vulnerability while lower thickness shows more vulnerability for containing contaminants [
51]. This parameter has no units and qualitative distinctiveness of vadose zone substance (clay, sand, or other divisions) is used to assign a range of values for this factor. This zone significantly attenuates the contamination processes such as dispersion, filtration, and chemical reaction, which ultimately diminish groundwater pollution [
6].
Figure 3g shows the vadose zone map and it was arranged corresponding to the rating values of factors as shown in
Table 2.
4.1.7. Hydraulic Conductivity
The flow rate of groundwater is operated by hydraulic conductivity under a specified hydraulic grade and within the aquifer, the quantity and interconnections of void spaces control it. Higher conductivities indicate higher groundwater pollution potential. The hydraulic conductivities values of the investigation land are presented in
Figure 3f according to the rating values of factors as shown in
Table 2. Four different hydraulic conductivity classes are prepared based on water transmission rates such as very high conductivity (>300 m/day), high conductivity (200–300 m/day), moderate conductivity (100–200 m/day), and low conductivity (<100 m/day). Areas with very high to medium values of conductivities have high groundwater availability than low values of conductivity. The DRASTIC rating was used in the study area to allocate the respective rates to various hydraulic conductivity zones.
4.2. Consolidation and Computation of DRASTIC Risk Map
Different processes as mentioned above were used to generate a DRASTIC model. The DRASTIC risk map is divided into five classes showing their vulnerability. Based on the DRASTIC index these classes include very high, high, medium, low, and very low as shown in
Figure 4. The map in
Figure 4 represents the collective impact of all seven considered factors. The upper part and west of Chitral district are under very high (160–180) and high (140–160) vulnerable areas, central areas are in medium zone (120–140) and very few areas in the north-west of Chitral are under low (100–120) and very low (80–100) vulnerability zones.
4.3. Modifications and Limitations of the DRASTIC Model
The DRASTIC model is extensively applied to find the susceptibility of groundwater. Although it will not be considered as the best model for urbanized locations until an additional parameter of anthropogenic impacts is not added. In this study, an improvement is made in the methodology by considering anthropogenic impact by using both satellite studies of night-lights from human communities as a substitute and land-use/land-cover (LULC) near the urban region.
4.3.1. Anthropogenic Impact Map Preparation
The map of anthropogenic impact was arranged using a land use map of the Chitral district.
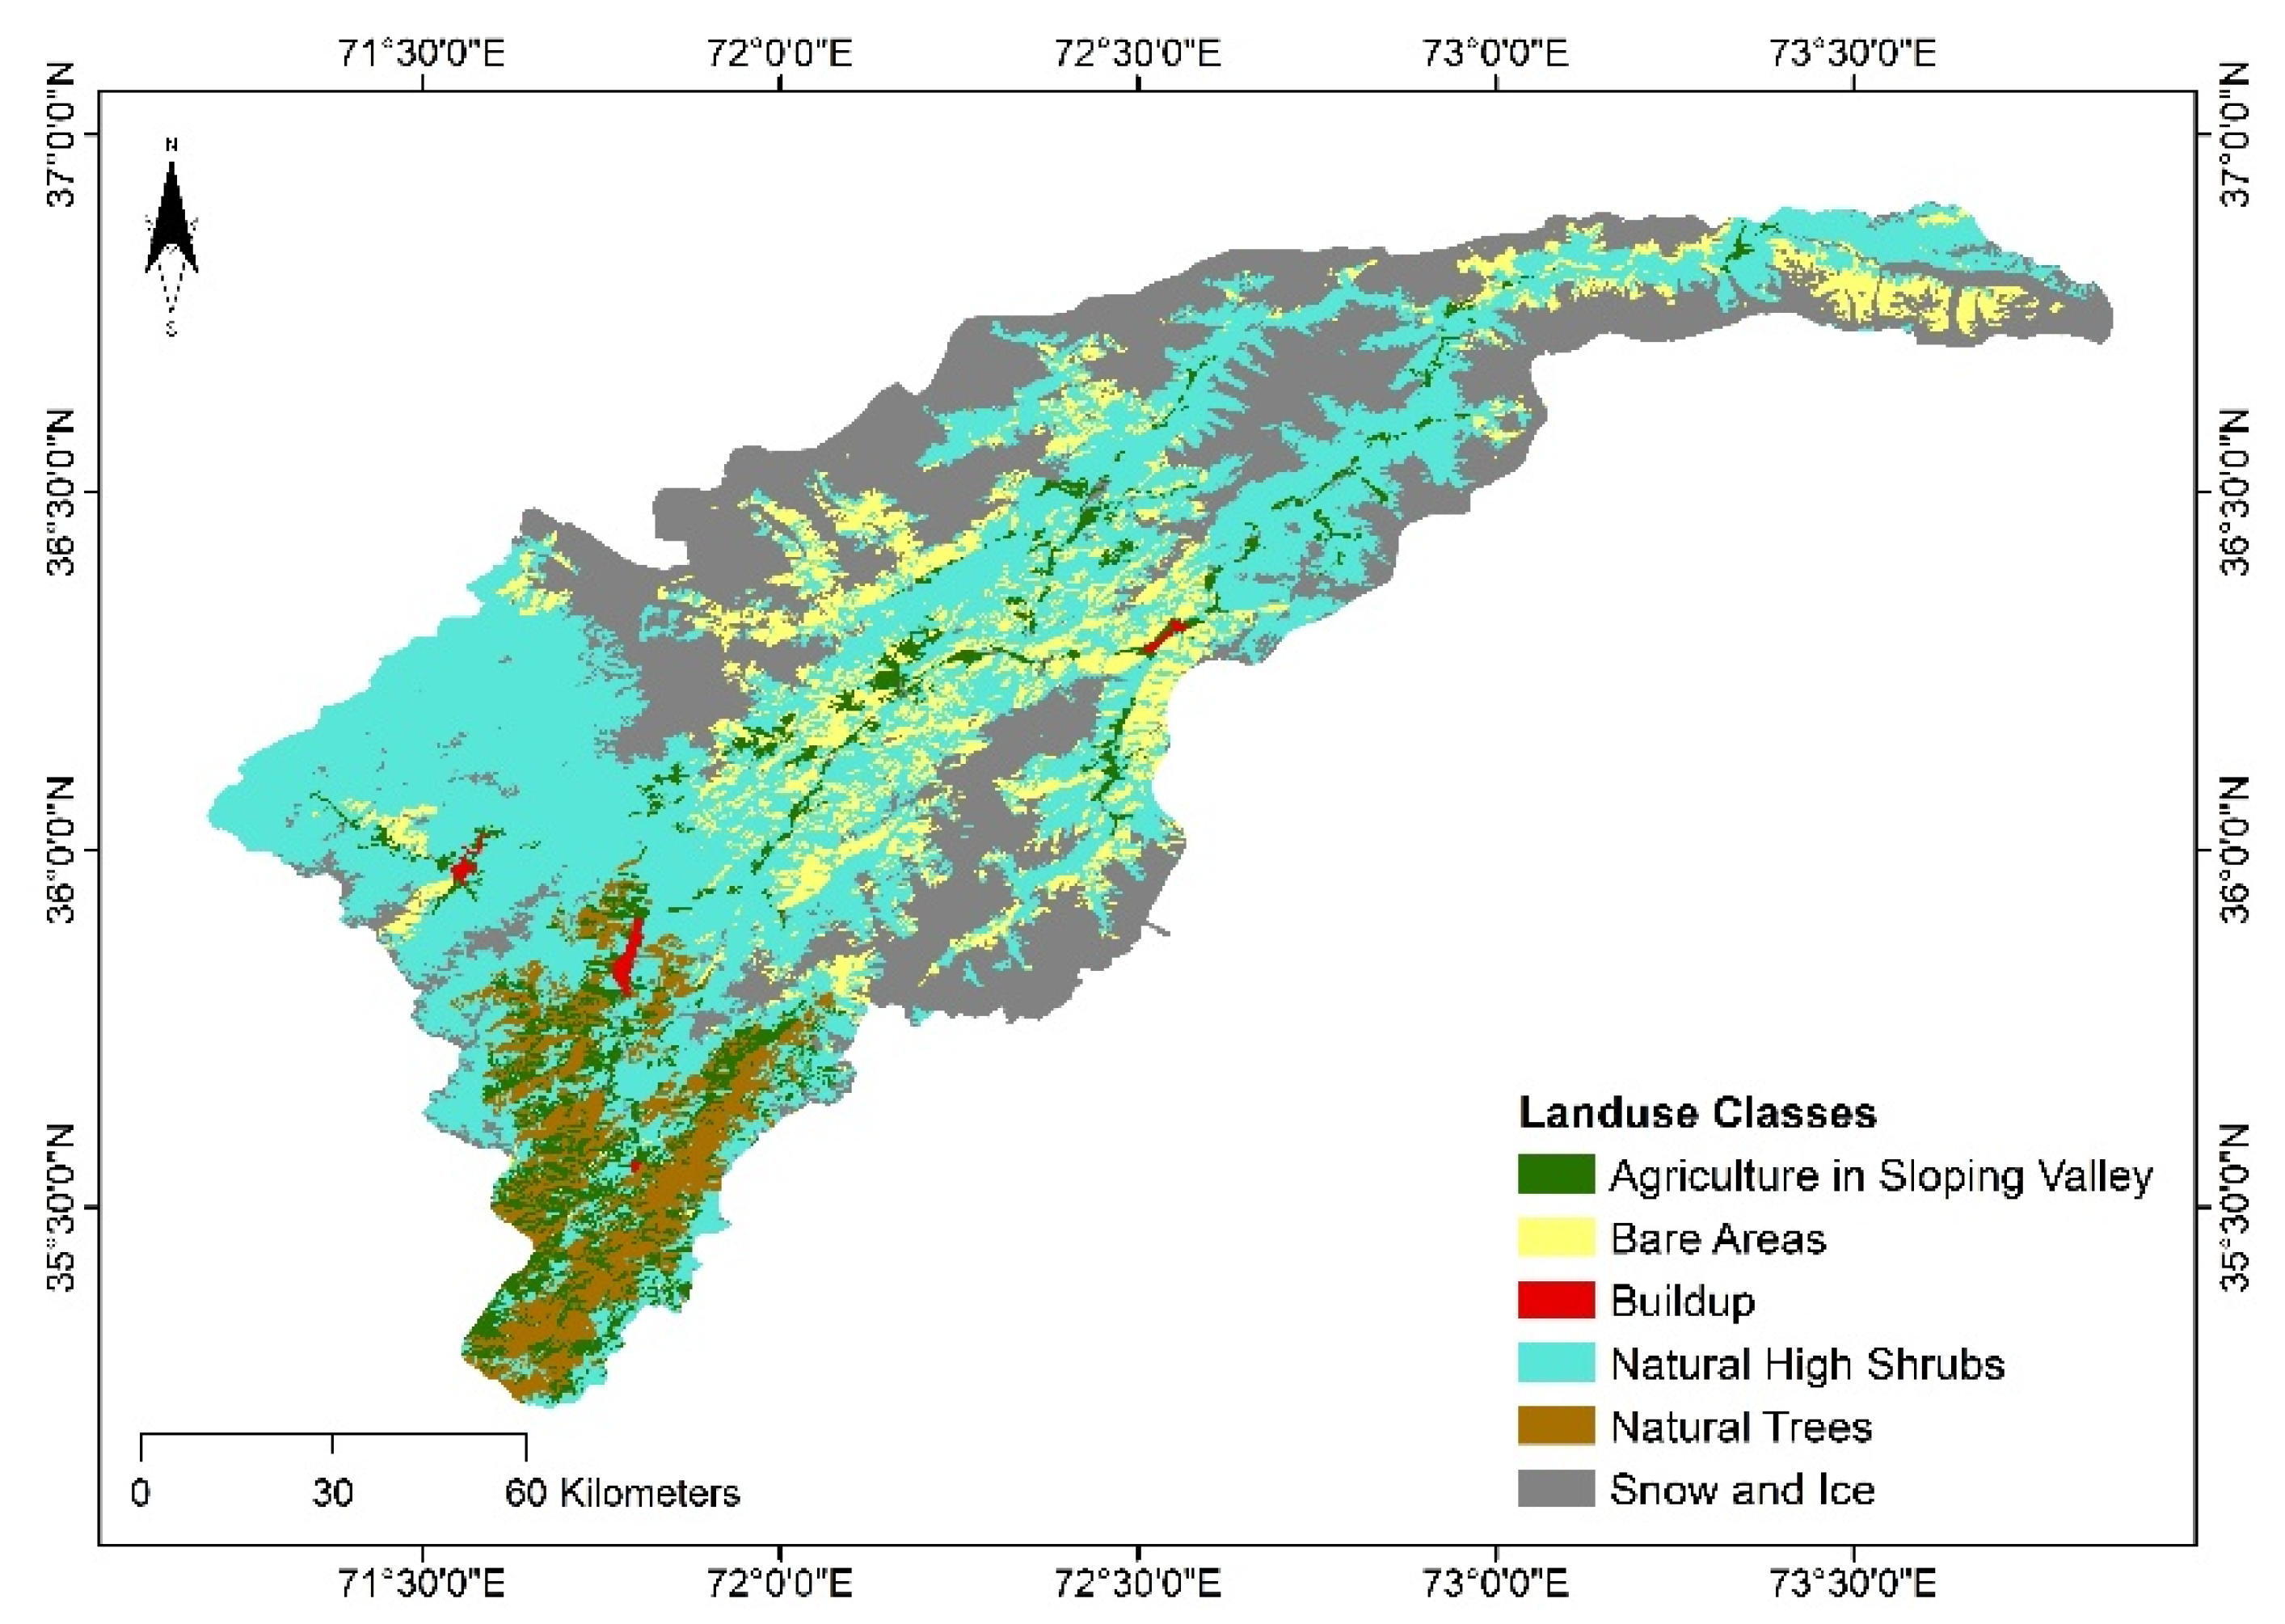
Land Use
Anthropogenic activities and land-use patterns significantly affect the groundwater quality in the investigation region. Land use patterns including industrial, urban, commercial, and agricultural patterns are leading factors for an increase in the intensity of contamination.
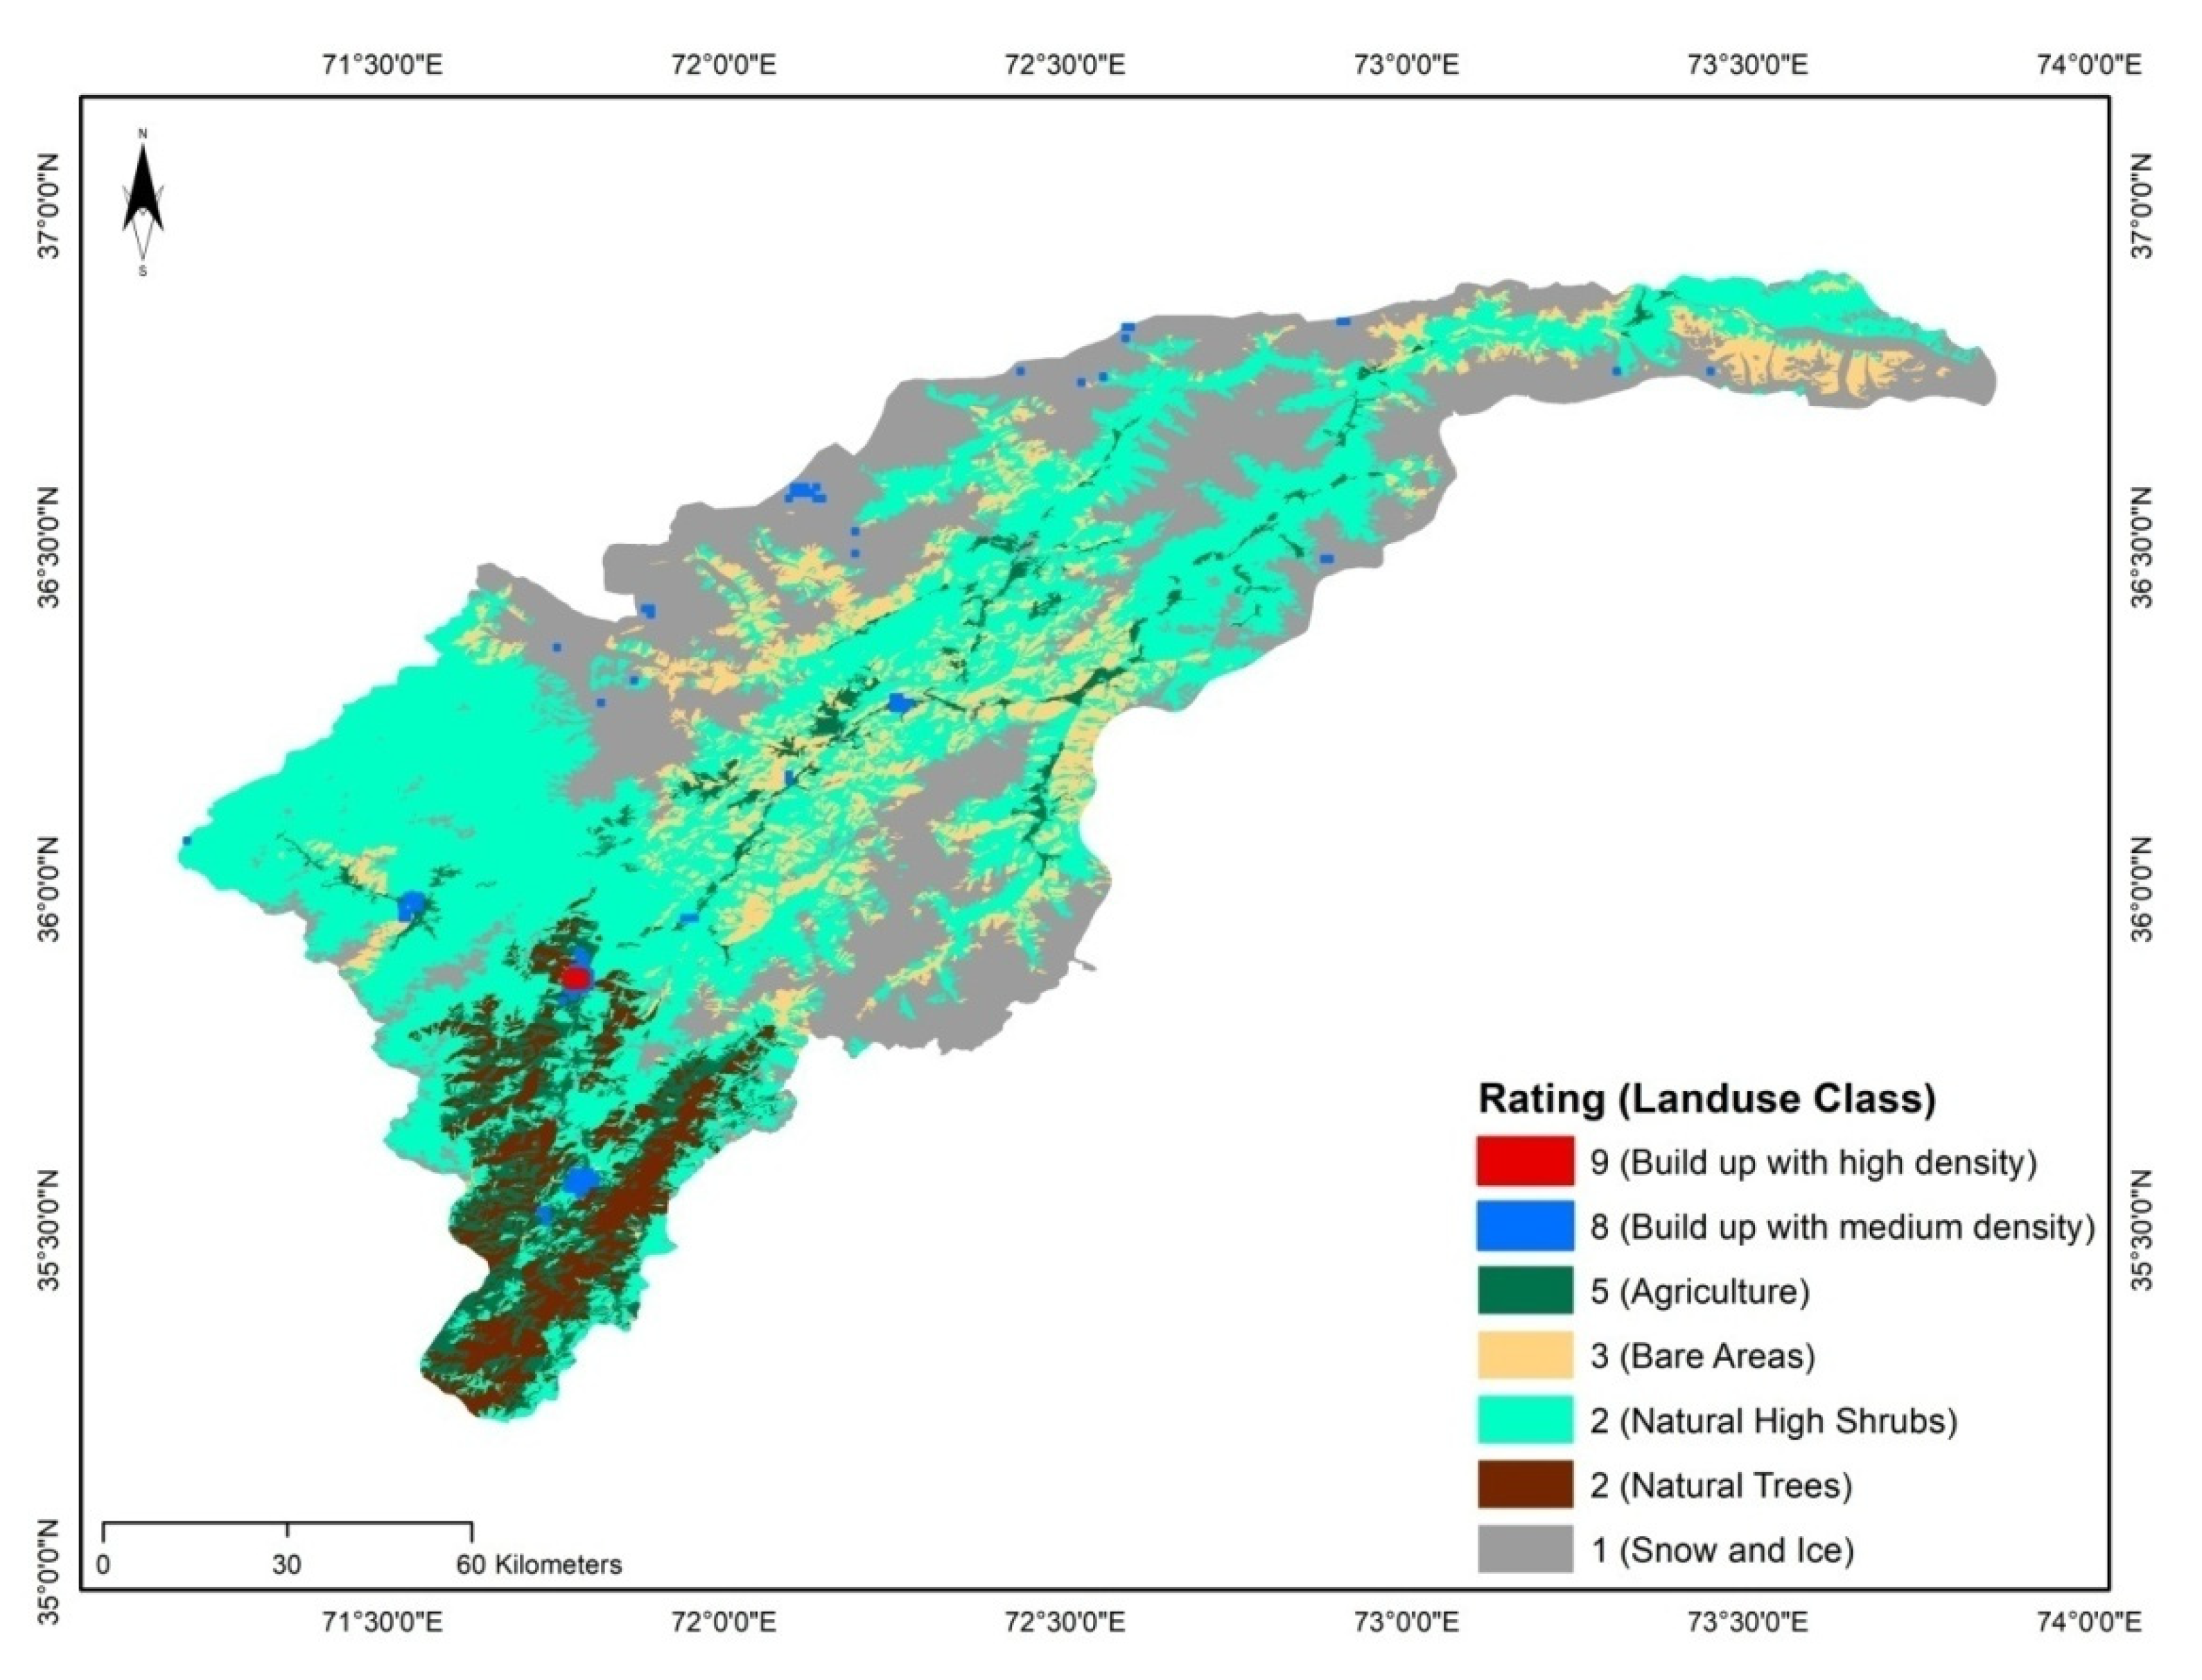
Figure 5 explains the map of land use and it illustrates that the region is divided into 5 different classes representing the agricultural areas in sloping valley, natural high shrubs, forests, bare areas, and snow and ice. The above-mentioned factors of land use have a substantial influence on hydrogeological factors. The addition of urban industrial wastes, sewerages, and the use of pesticides can also significantly distort the hydrogeological factors. In
Table 3, it is observed that most of the investigation region is covered with natural high shrubs and most of the area is covered with ice and snow. The remaining portion includes agriculture areas in sloping valleys, natural trees, and bare areas. Generally, in cultivated regions, groundwater is more susceptible to the concentration of nitrates. A study shows that the distribution of nitrate mostly depends on the dynamics of soil which includes movement of groundwater, on-ground loading of nitrogen, and rate of recharge [
6]. Classifications of land use demonstrate that natural trees and agricultural areas significantly affect the groundwater quality.
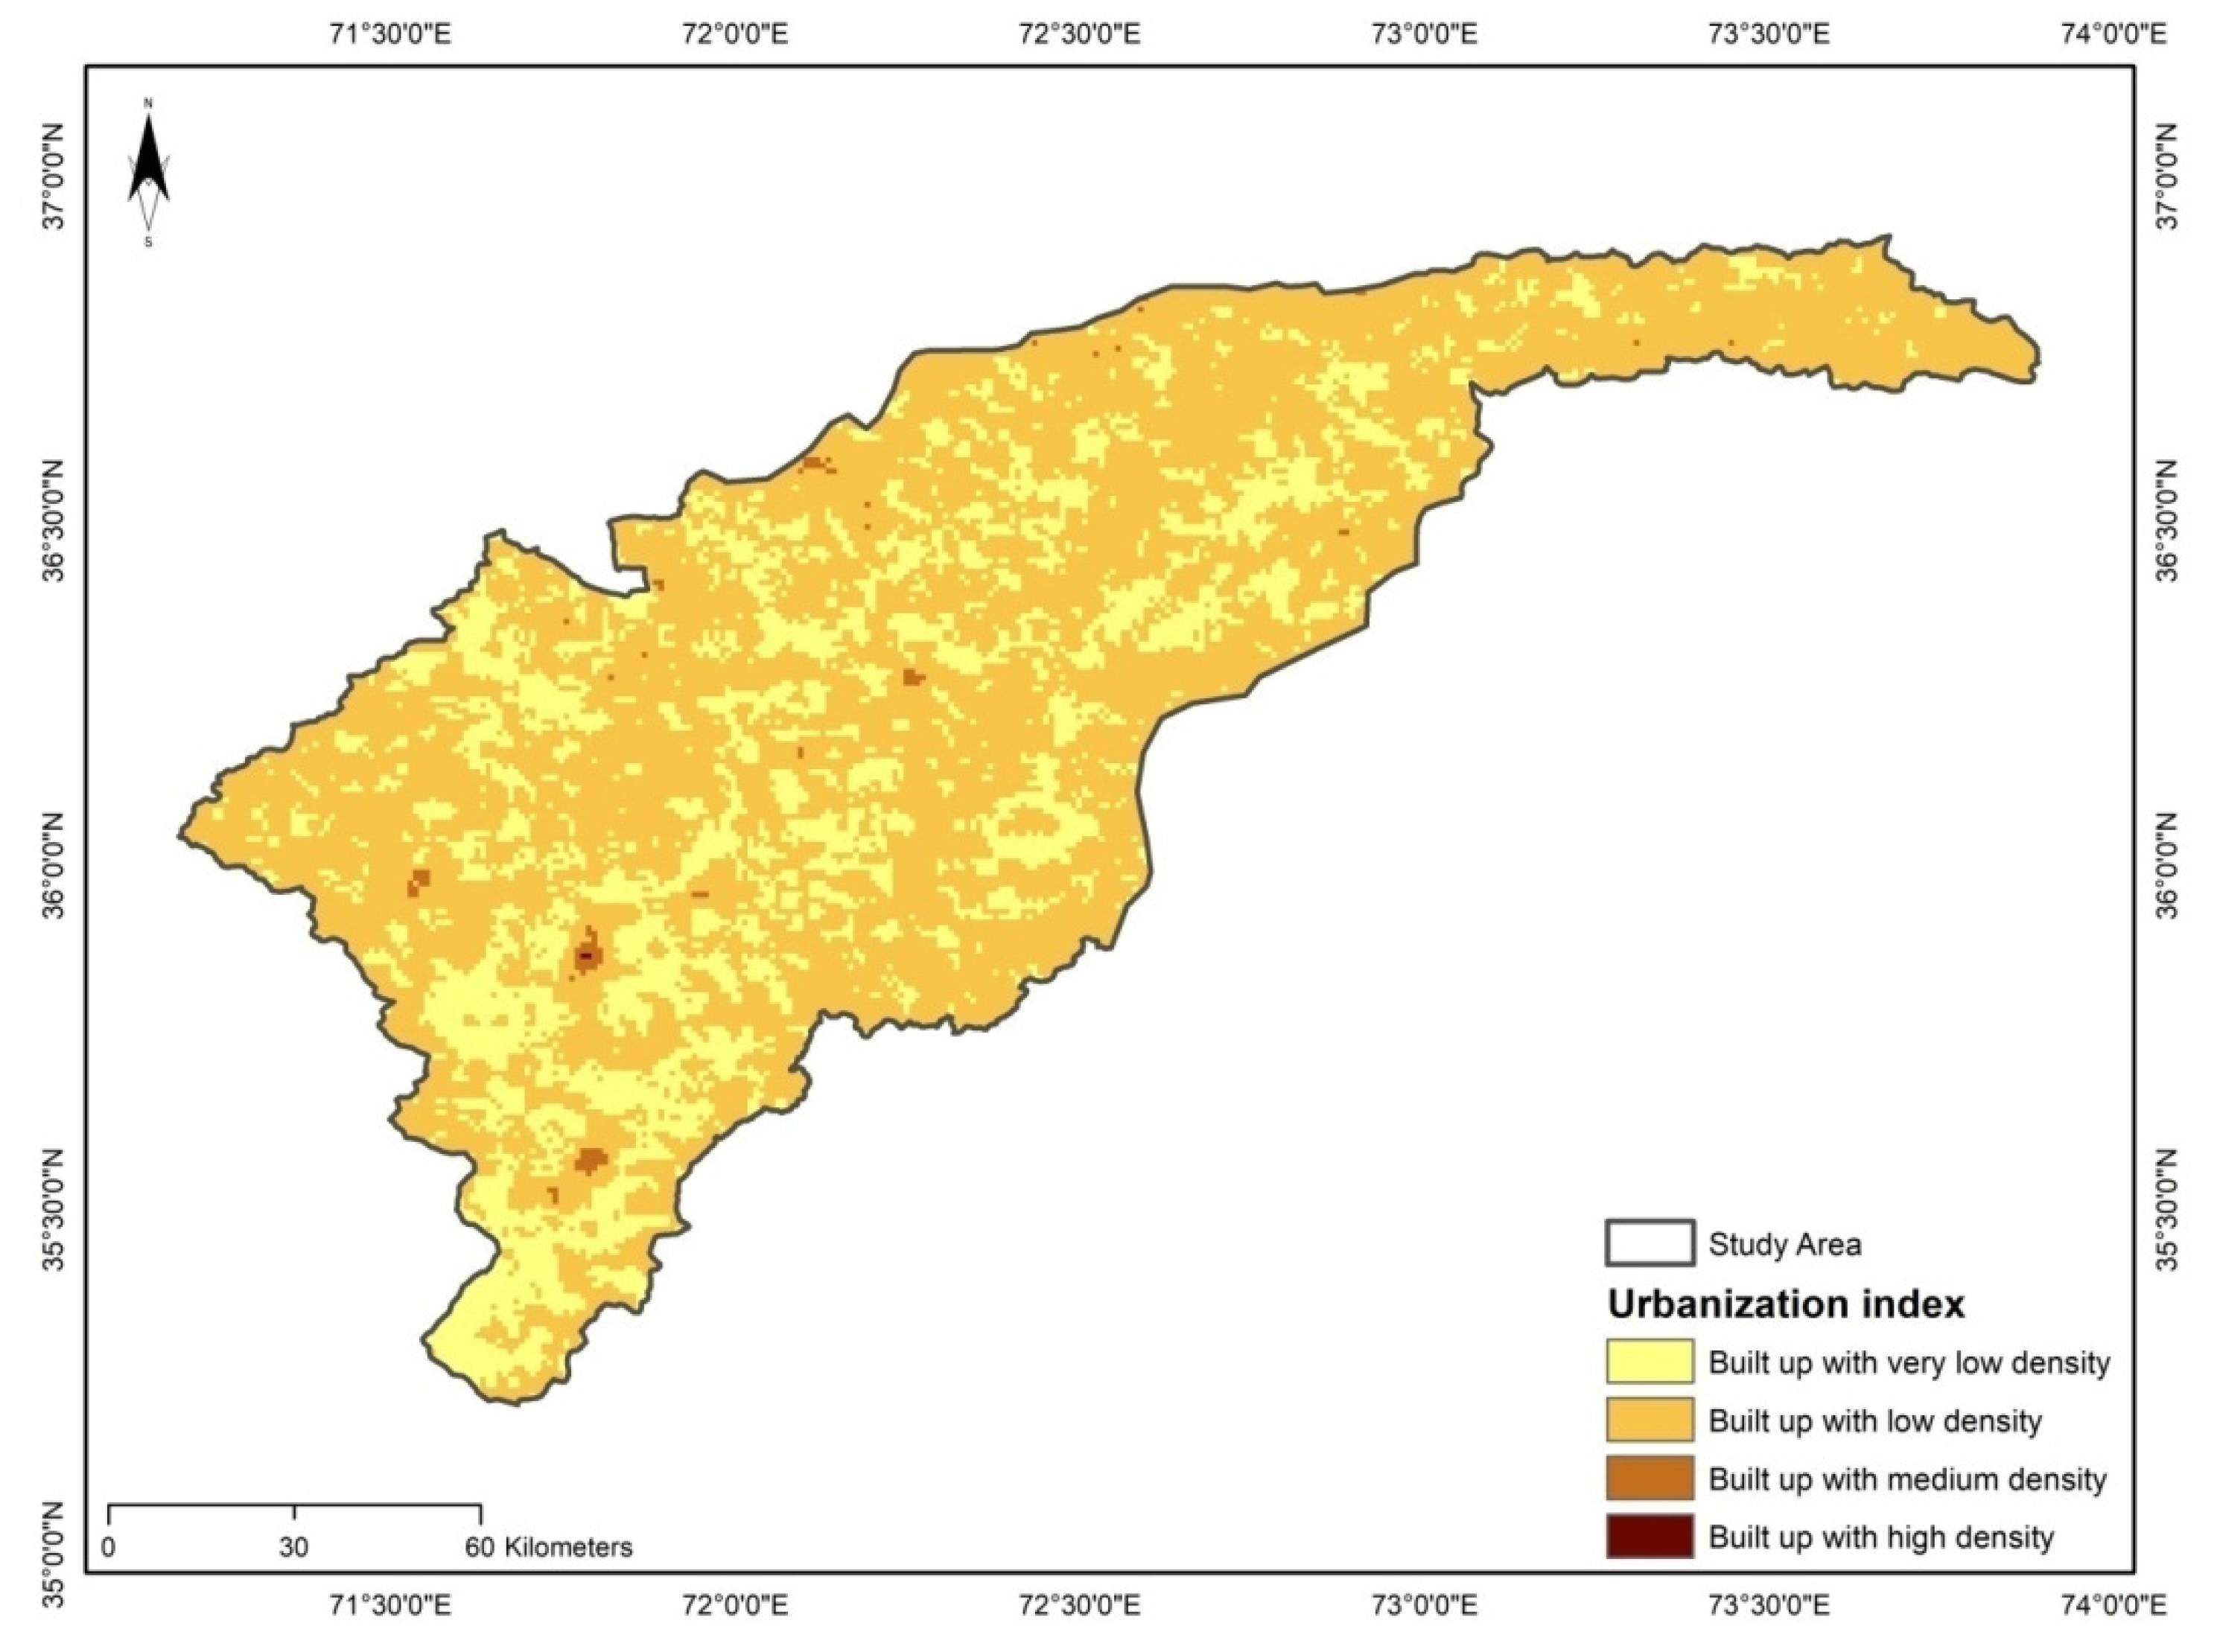
Urbanization Index Dataset
Urbanization index map of the Chitral district was generated to accomplish the modification of land use maps. In
Figure 6, a built-up map of land use map is shown in which study land was further classified into four classes: built-up with very low density, built-up with low density, built-up with medium density, and built-up with high density.
Figure 7 shows the new anthropogenic map, which was prepared based on ratings as mentioned in
Table 4. The weight of ‘5’ was multiplied with the map, according to the weights assigned to this factor. A new eighth factor was generated named ‘impact of anthropogenic activities’ in the DRASTIC model after considering all the above refinements. It is found that a very small portion is covered by built-up areas but due to CPEC, it is predicted that the population of the area will increase so ultimately anthropogenic activities will also increase. So, it is necessary to use the built-up area to modify the DRASTIC model through the urbanization index map.
4.4. DRASTICA Risk Map Development
The DRASTIC map also with anthropogenic activities facilitates the evaluation of groundwater susceptibility. The DRASTIC risk map is generated by merging the conventional DRASTIC method with a new eighth factor named ‘impact of anthropogenic activities’. The result of this innovation is termed as DRASTICA or modified DRASTIC method. The modified DRASTIC map is a result of ratings and weights allocated to anthropogenic activities on the basis of land use classes assumptions [
6,
46]. The map of anthropogenic impact was changed into a raster grid and then the weight of the factor (Aw = 5) is multiplied with it. The map of anthropogenic impact was laid over the typical map of the DRASTIC model for generating a spatial correlation between them. Conventional DRASTIC index (DI) and final resultant grid coverage were added and after that following equation [
47] was used to find out the DRASTICA index or modified DRASTIC index (MDI)
where
shows the anthropogenic impact factor rate and
is the weight of the anthropogenic impact factor. Anthropogenic activities types and study area portions which are more susceptible to groundwater susceptibility are indicated by the DRASTIC map.
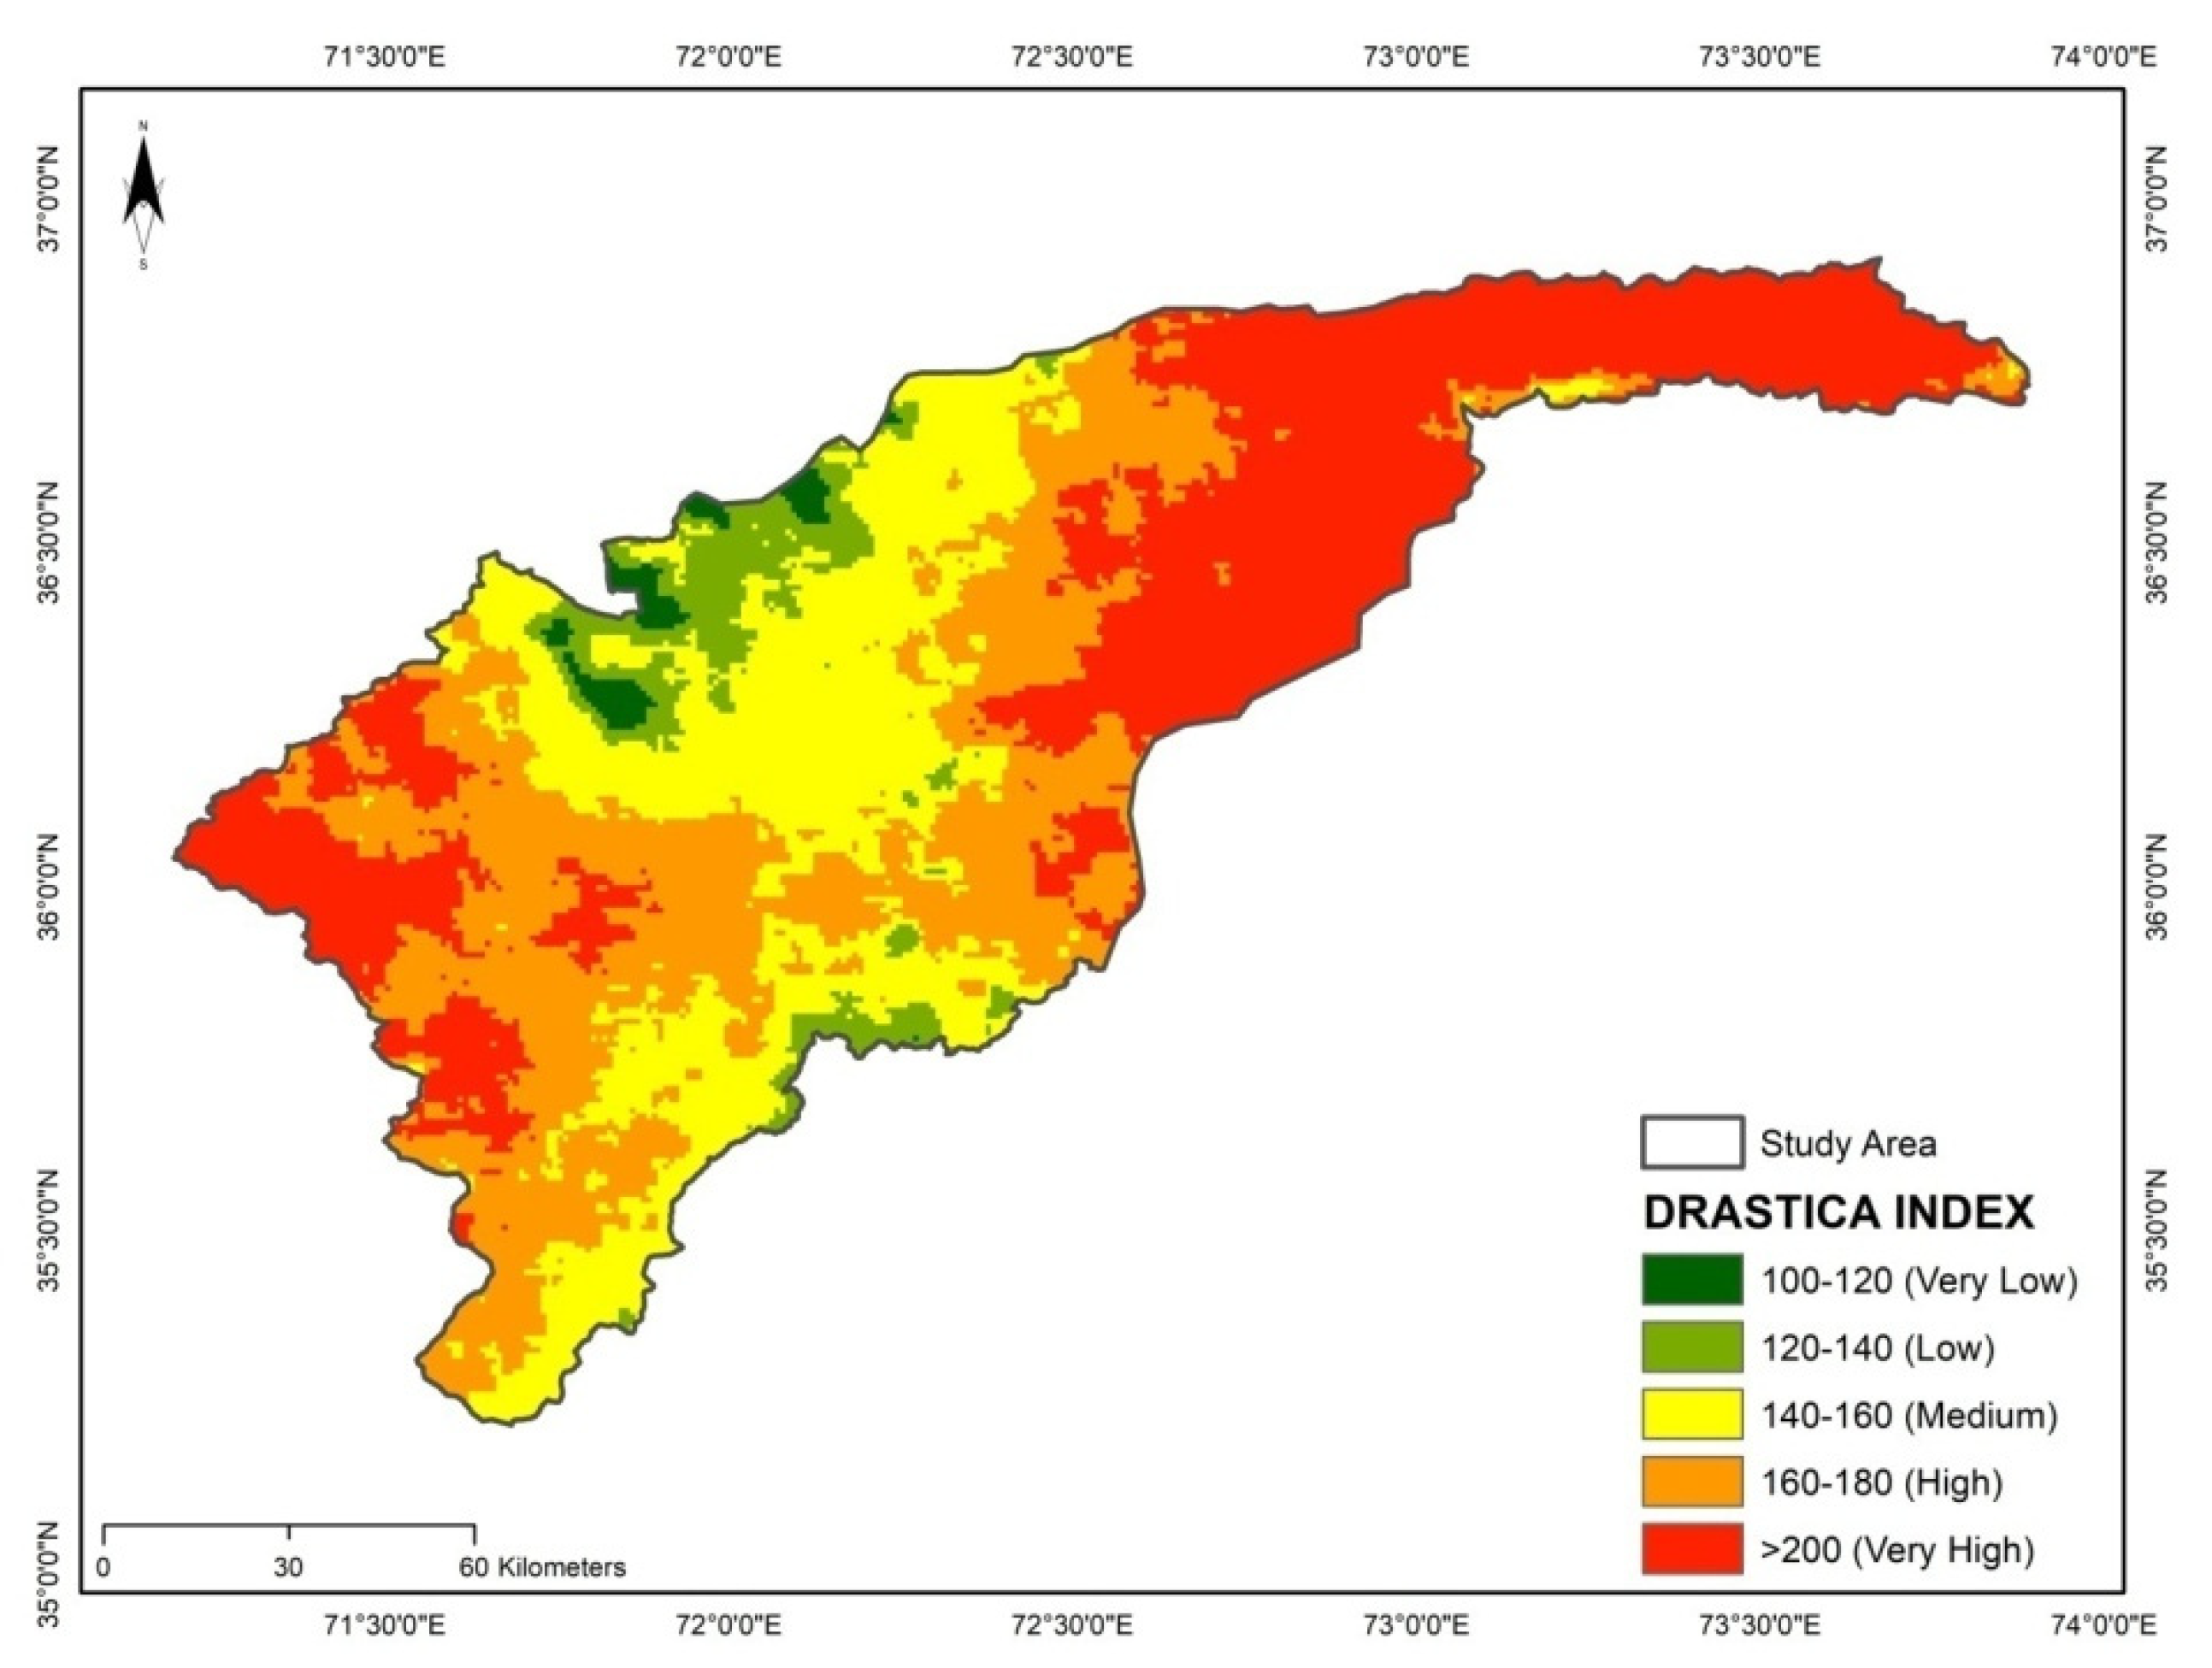
Figure 8 shows that the DRASTIC risk map is divided into 5 different divisions including very low (100–120), low (120–140), medium (140–160), high (160–180), and very high (>200). The results illustrated that 14% area lies under high and very high susceptible zone, 44% under medium susceptibility, 39% under low susceptibility, and 3% under very low susceptibility zone for groundwater contamination.
Table 5 explains a contrast between the DRASTICA risk map, and the conventional DRASTIC map showed that there is a 17% increase in a highly vulnerable area.
In the DRASTICA risk map, field observations for the quality of groundwater were considered so it has better results than conventional DRASTIC risk maps for calculating groundwater susceptibility. Anthropogenic actions are the leading factor for high nitrate contamination in urban areas of the Chitral district. It has been observed that hydraulic conductivity, depth to the water table, and anthropogenic actions prominently affect groundwater contamination while other factors such as aquifer media, soil media, topography, and net recharge prove to be less effective. Maps generated for groundwater vulnerability potential can be an effective tool used by planners and managers to deal with issues related to groundwater resource protection. An increase in the impact of anthropogenic activities and shallow water levels in urban areas resulted in high vulnerability. Due to agricultural areas, most of the areas are under a medium susceptible zone. Zones around water bodies, shrubland, forest land, and wasteland are less vulnerable, and urban areas are highly vulnerable to groundwater contamination. High nitrate concentration has been observed in urban areas samples of groundwater.
4.5. Validation of the Methods
The nitrate factor of water quality is used in
Figure 9, for the validation of DRASTIC and DRASTICA models. Generally, in the system of groundwater, a nitrate natural source is not available. So, the existence of nitrate in groundwater signifies it as a source of pollution most likely due to anthropogenic and agricultural actions [
52,
53]. The map shows the area with a high concentration of nitrates (
), which signifies the presence of polluting sources. It is classified into three classes (mg/l) having low (<30), medium (30–50), and high (>50) based on concentration of nitrates in groundwater.
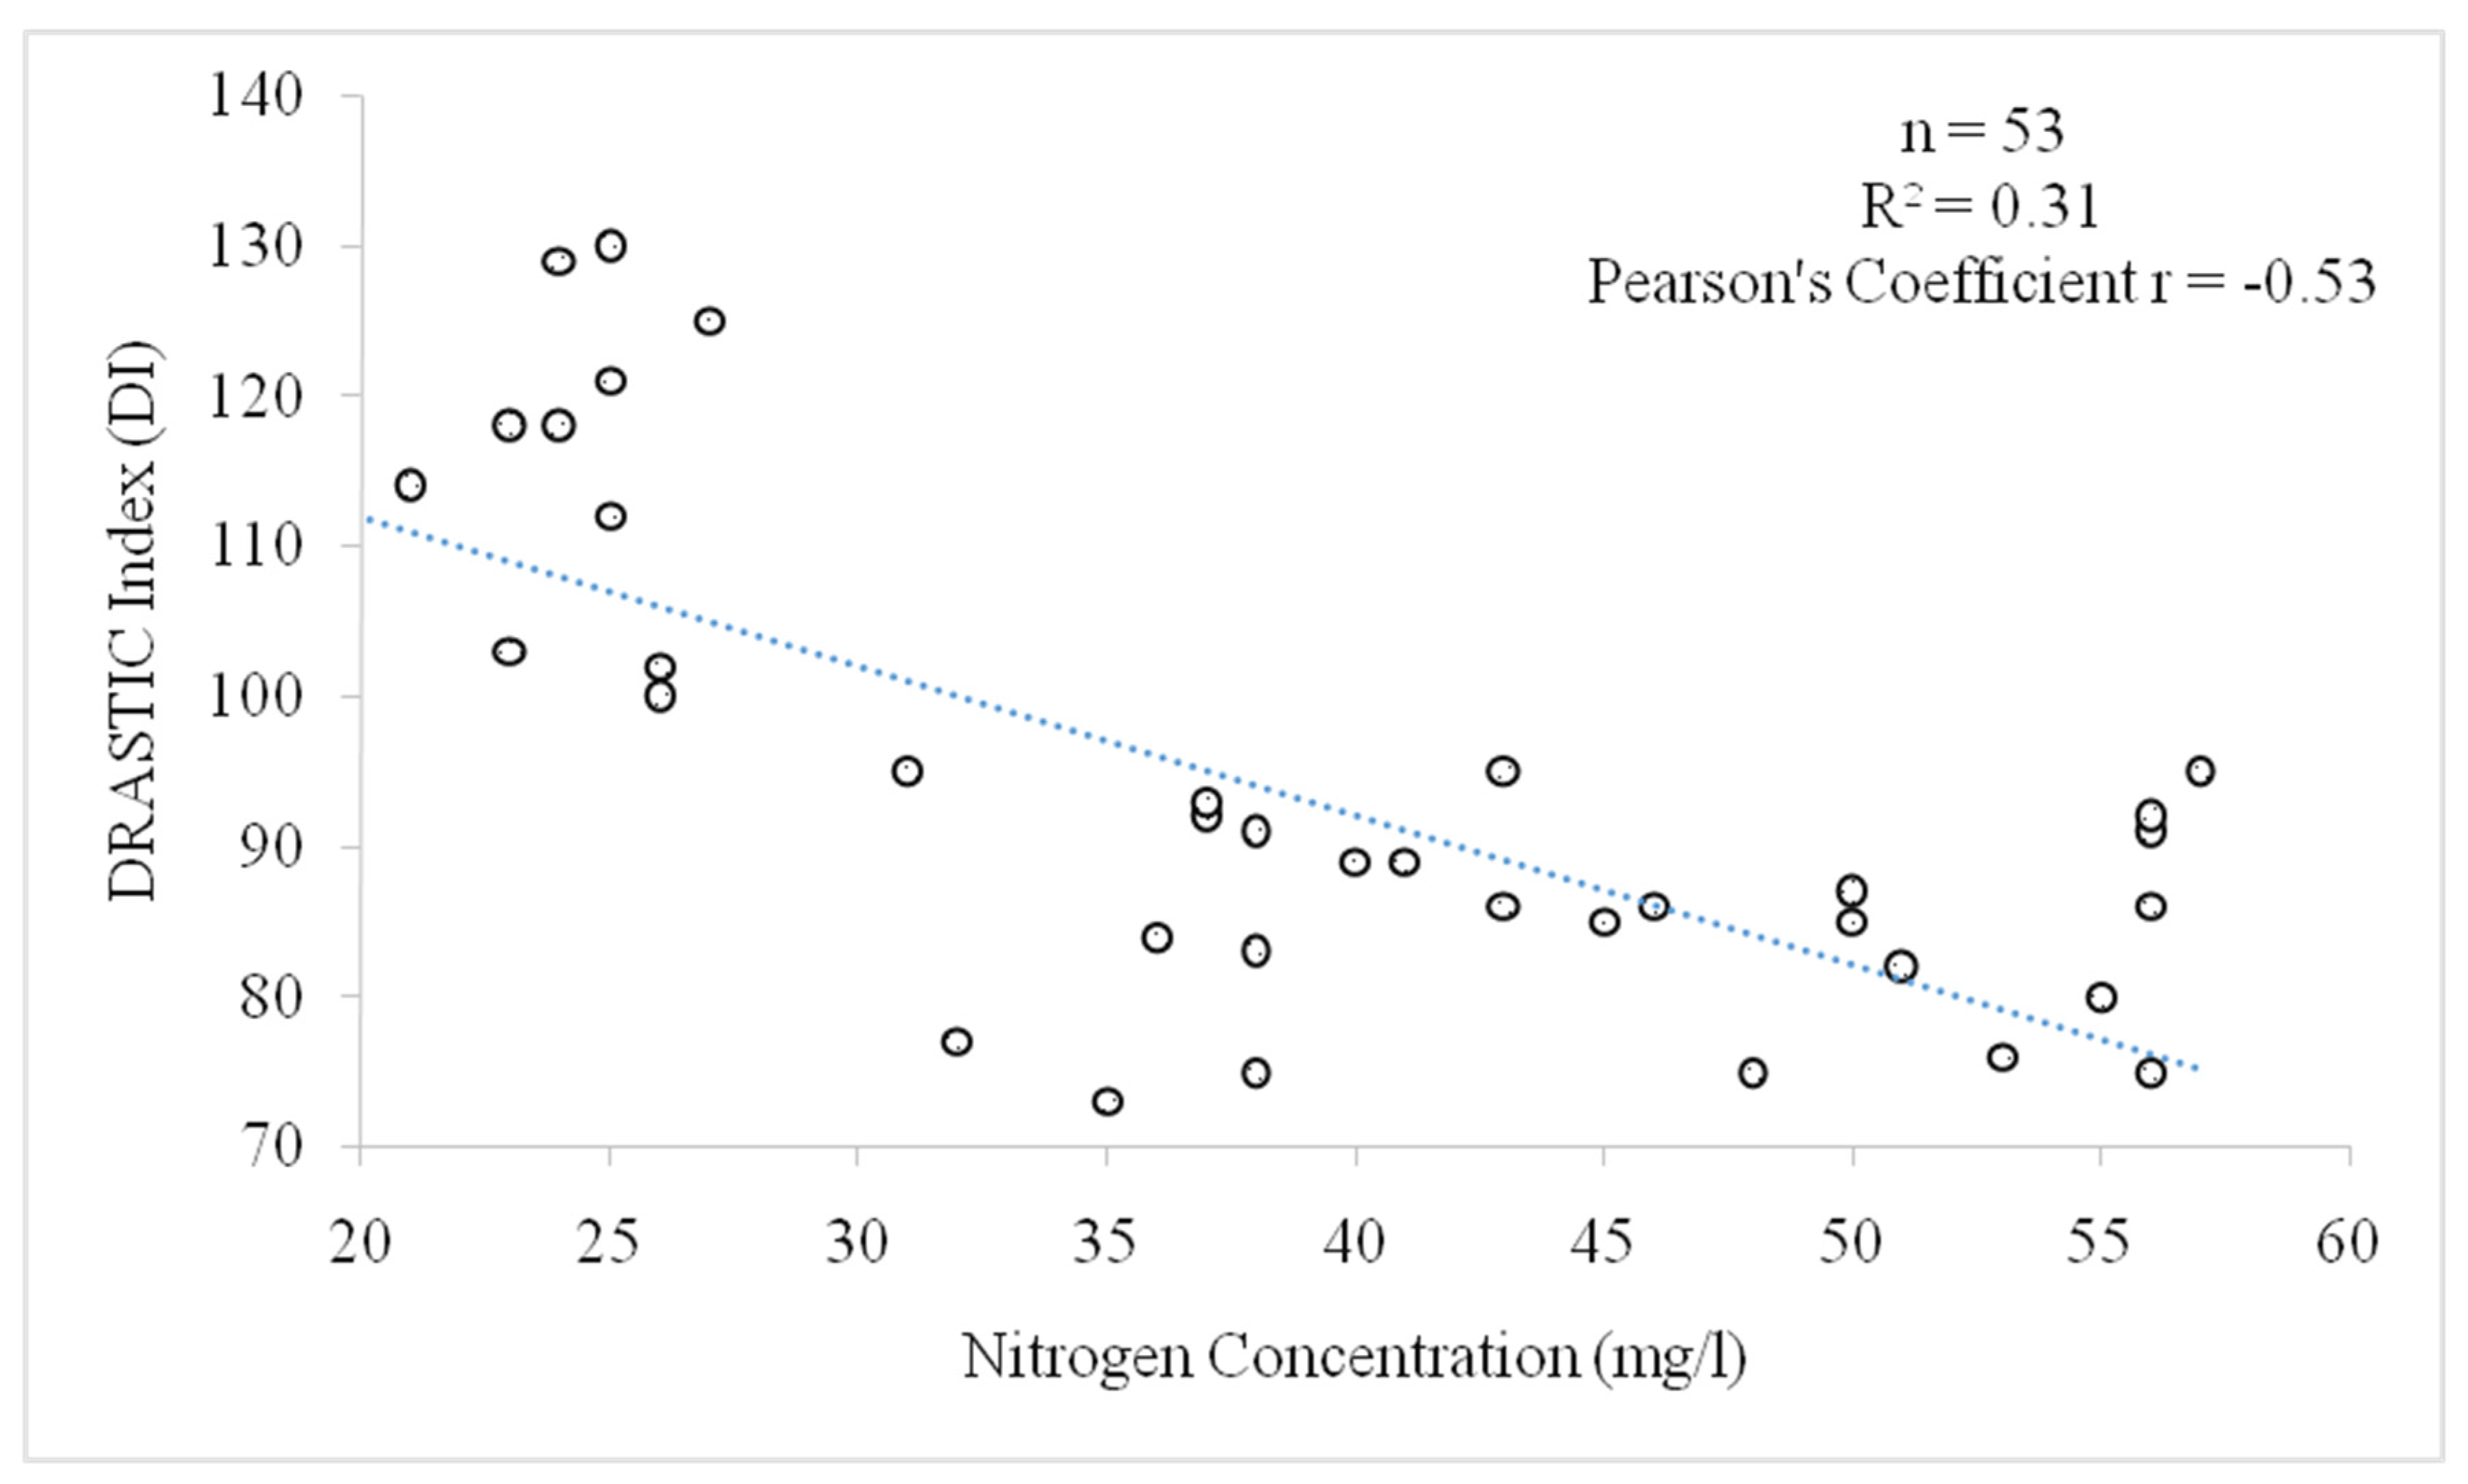
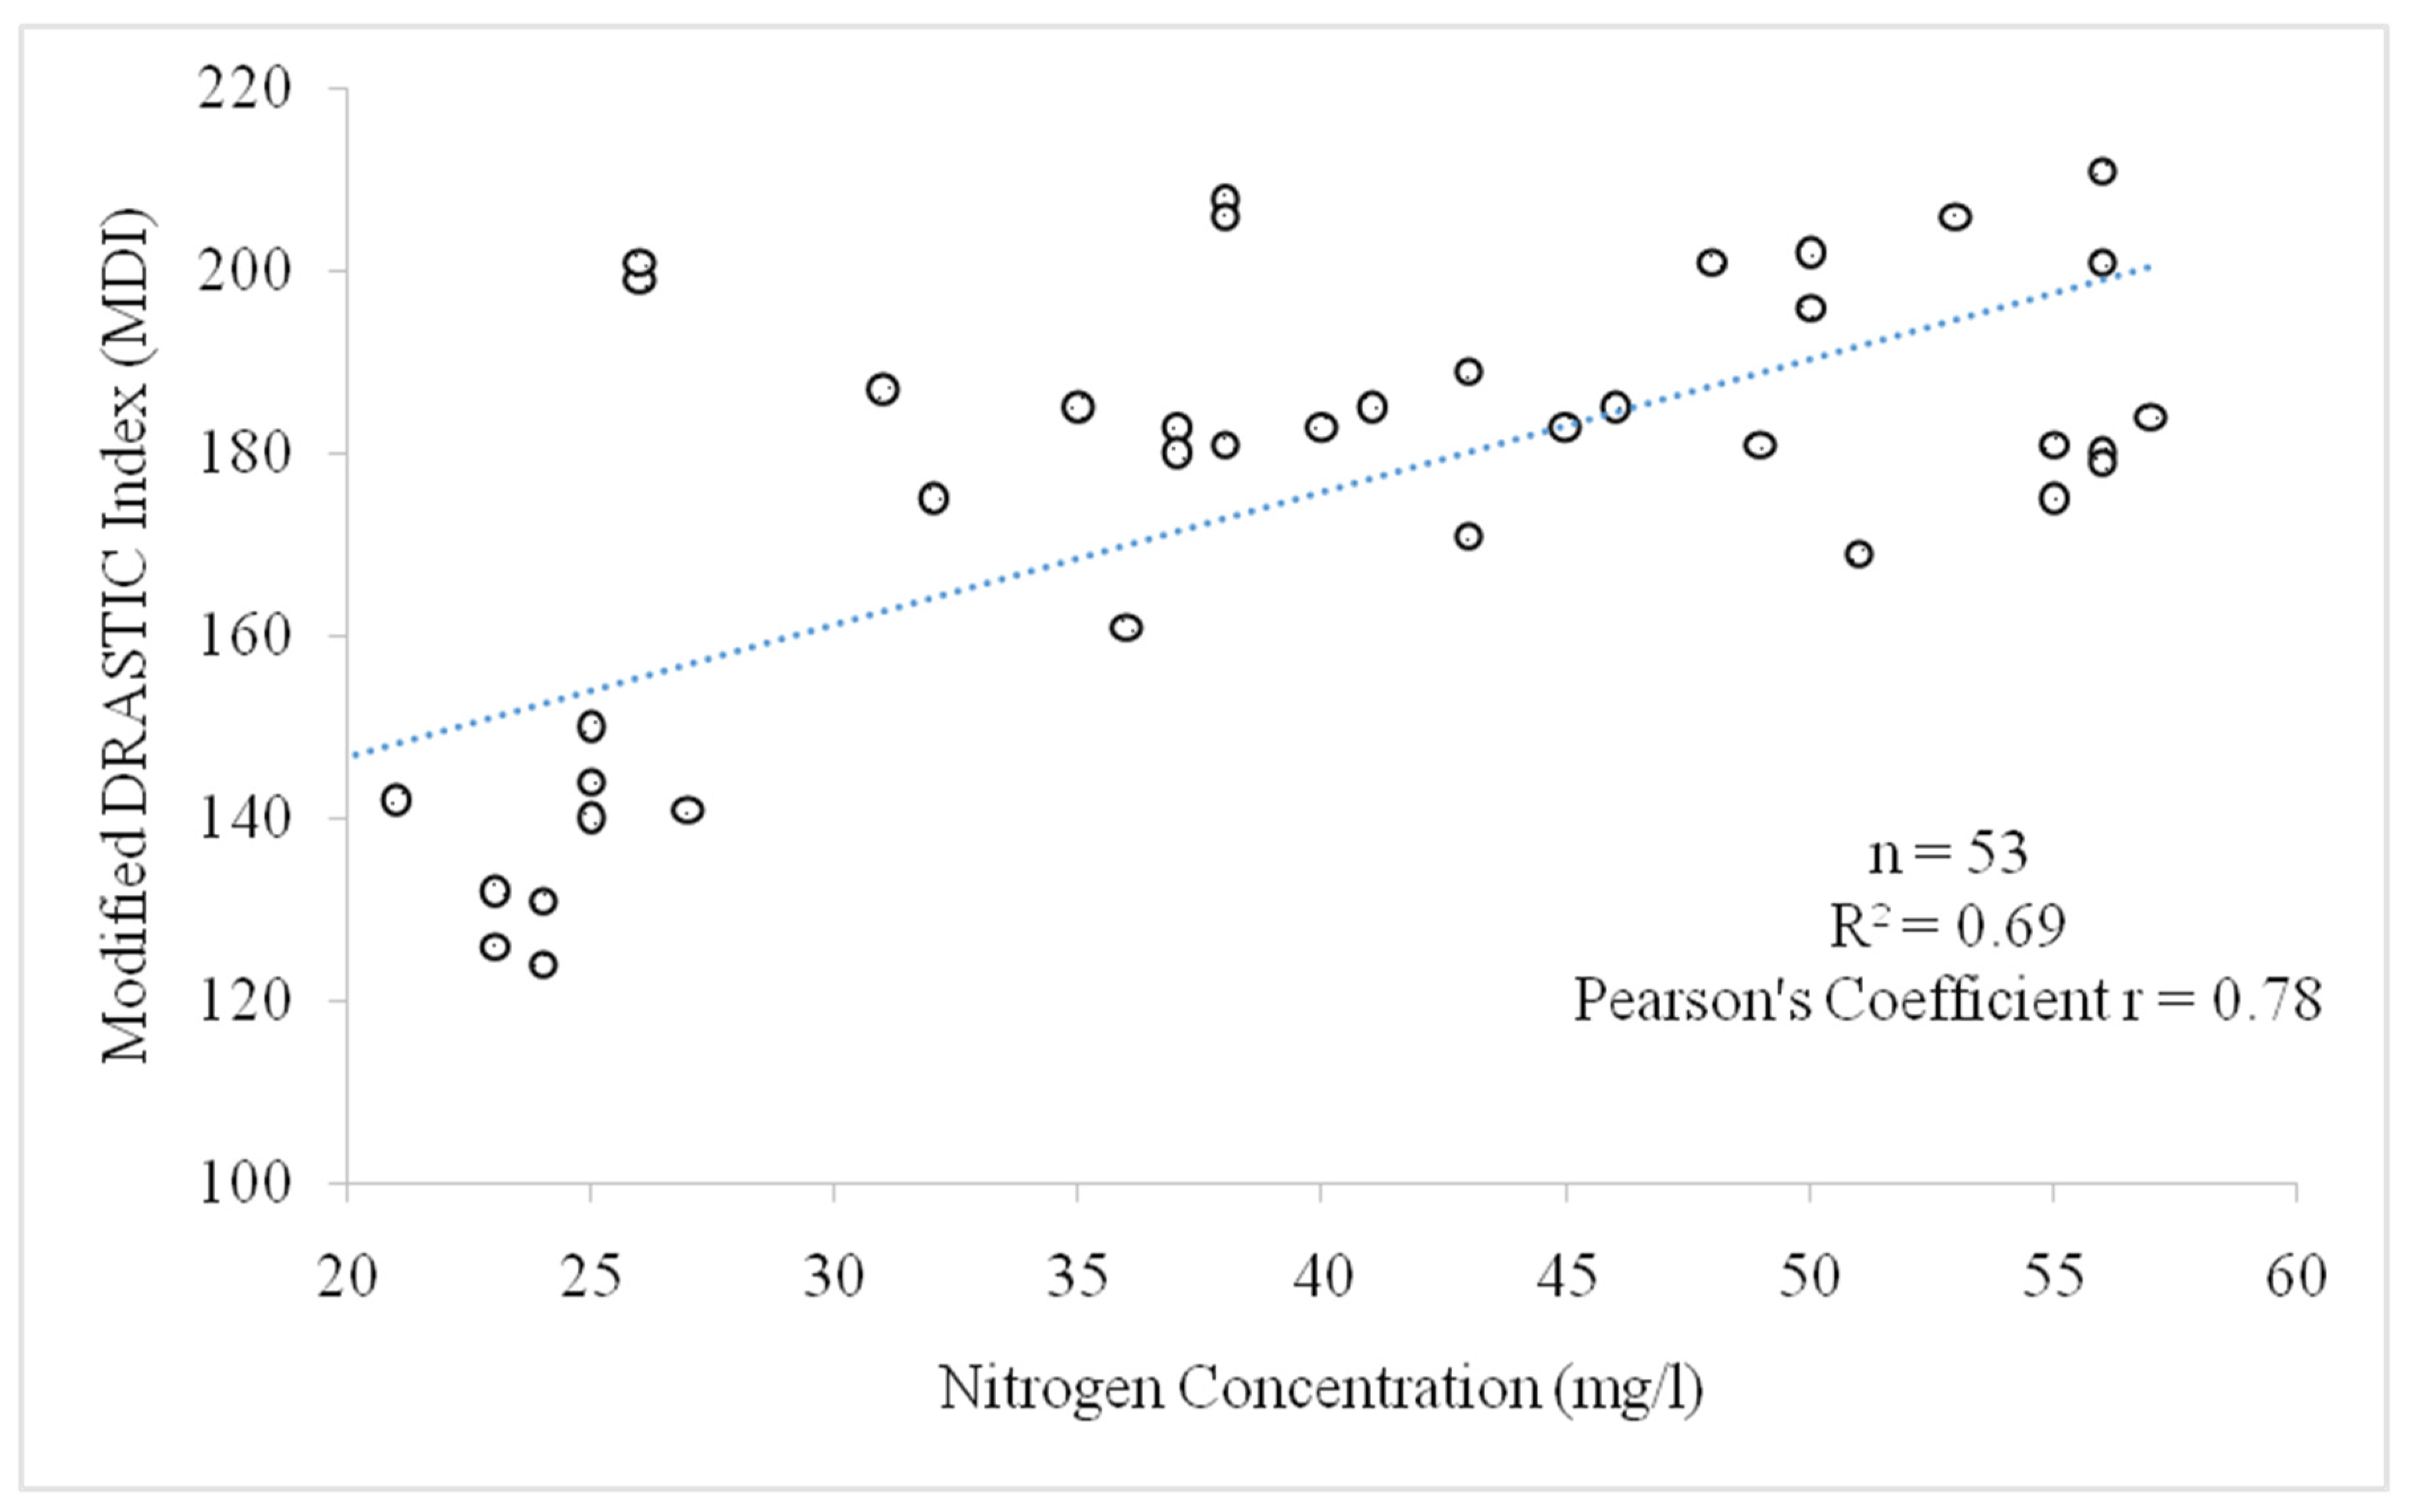
A correlation was developed between the values of nitrate concentration, DRASTIC index, and modified DRASTIC index. A relationship is used to examine the association between two computable and continuous variables. An appropriate correlation was made between maximum DRASTICA index values and the highest nitrate concentration values. A Pearson’s correlation coefficient ‘r’ for DI and MDI after correlation with a concentration of nitrate was observed to be −0.53 and 0.78 respectively. Graphs showed that 53 correlated data pairs were plotted for DI (
Figure 10) and MDI (
Figure 11) against nitrate concentration. Further authentication of the modified DRASTIC model for the urban setting is represented by a positive relationship between MDI and nitrate concentration.
4.6. Sensitivity Analysis
Sensitivity analysis proves to be an effective tool for assessment, which authenticate and assess the uniformity of methodical outputs of exposure maps [
54]. The DRASTIC model provides a major benefit of successful assessment using increased numbered layer input data and the impact of individual factors makes the final output uncertain. Although some researchers [
55] have a view that by lowering the number of input factors, DRASTIC results could be more accurate and better. This analysis was employed to assess the vulnerability maps accuracy generated with the modified DRASTIC model in the current research. This research contains two tests of sensitivity analysis: Lodwick [
56] proposed a map removal sensitivity analysis and Napolitano and Fabbri [
57] familiarized a single parameter sensitivity test. The following tests were done to obtain the model’s sensitivity test.
4.6.1. Map Removal Sensitivity Analysis
The map removal sensitivity test spotted sensitivity DRASTICA index map by eliminating one or more than one-factor layers as shown in Equation (3) [
28] below:
where S shows sensitivity measure,
is undisturbed susceptibility index (actual index is gained by using all considered aspects in the DRASTIC model
is disturbed susceptibility index (vulnerability index calculated working out a lesser number of constraints)
and
is used to find
and
the number of data layers.
Table 6 and
Table 7 are the outcomes of the map removal sensitivity analysis process after the exclusion of one parameter layer or more than one factor layer of the DRASTICA model at a time. For each cell of the grid, the measure of sensitivity was calculated using the raster math tool of ArcGIS as shown in Equation (3). After the analysis, it was identified that there was a high shift vulnerability index variation when the two parameters of depth to the water table and anthropogenic impact were removed. When the parameters of topography layers and soil media were removed, the analysis showed relatively less sensitivity concerning the vulnerability index of removed depth to the water table parameter. The reason for the parameters being less sensitive is that these two factors have lesser weights and lower ratings in the deviation. The parameter which showed the least sensitivity amid all the eight parameters of DRASTICA was the aquifer media parameter. Its result of exclusion was 0.62%. In this sensitivity analysis, values of all parameters are too close so there is no parameter that can be removed to get better results.
4.6.2. Single-Parameter Sensitivity Analysis
Single-parameter sensitivity analysis is manipulated to determine different parameters of the DRASTIC model’s effect on the susceptibility index. Each parameter’s “effective” weight percentage
(%) is calculated by relating the “effective” weight of each factor with the “theoretical” weight of each factor. Equation (4) [
28] represents the effective weight percentage
(%):
Signifies effective weight percentage, signifies the rating of a specific parameter, signify the specific parameter weight and V signifies the final susceptibility index.
In evaluating the vulnerability index of DRASTICA, map removal sensitivity analysis has a significant role in the assessment of the parameters. Whereas single parameter sensitivity analysis gives results by relating the “theoretical” weight parameter with the “effective” weight of the parameter as shown in Equation (4). Variance has been observed in the “effective” weights of parameters of DRASTICA when compared with the “theoretical” weighted parameters as described in
Table 8. The most significant factor in the susceptibility valuation is hydraulic conductivity. The percentage value of this effective parameter (17.51% respectively) surpassed the theoretical weight (16.9% respectively) allotted by DRASTICA. Other remaining parameters such as soil media, aquifer media, depth to the water table, the impact of the vadose zone, net recharge, topography, and anthropogenic impact are in low “effective” weights concerning their “theoretical” weights. Thus, factors such as hydraulic conductivity, topography and net recharge require a more thorough study and detailed analysis for improved groundwater susceptibility assessment.
5. Discussion
It is necessary to measure the susceptibility of groundwater pollution to ensure the viability of groundwater aquifers [
47]. The US Environmental Protection Agency introduces a DRASTIC model most widely used for assessing the susceptibility of groundwater pollution [
28]. Datasets were prepared by using sources described in
Table 1. It was noticed that the depth to the water table is the comparatively most significant aspect involved in groundwater susceptibility [
32]. Additionally, it was observed that this factor varies from less than 40 m to greater than 100 m and is divided into several classes (<40, 40–60, 60–80, 80–100, >100) as classified by different researchers and planners [
58,
59,
60]. Higher values of the water table show a higher rate of water pumping in the area. Net recharge (R) has also a significant impact on groundwater contamination [
51]. Weights and ratings are allocated to parameters [
31] and classified in subclasses including >80, 60–80, and >80.
Aquifer media is a responsible factor that directs the route and controls the path length of pollutants. A rating of eight is allocated to the parameter which includes sand. Singh et al. [
28] also use the same weights in their study. In fine-textured soils (i.e., loam and clay loam) the permeability of soil decreases. In soil media, the assignment of ratings and weights are on the basis of previous research [
9].
Figure 3d shows the five different soil types in the research area which include silt (7), sandy loam (6), bare rock (4), sandy clay (2), and clay (2). The highest rating value is assigned to soil with high permeability and less rating to soils with less permeability. The retaining capacity of water is controlled by the topography of an area, and it also facilitates the permeability of pollutants to groundwater. DEM was used to generate a ground slope map and the research zone is divided into 5 classes namely, <5, 5–10, 10–20, 20–40, and >40 and rating values of 9, 8, 6, 4, and 2 respectively. Assignment of these values is according to ratings and weights assigned by Maqsoom et al. [
47]. In steeper slope areas water has higher runoff so they are less suspected to pollutants [
46]. Rahman [
42] illustrated that the vadose zone is responsible for water movement on the subsurface. Results illustrated that in the vadose zone main element is sand. It is to be found that a rating of 7 is allotted to this parameter as shown in
Figure 3g. The map of the vadose zone is generated according to the methodologies applied in the mapping of depth to the water table and aquifer media. Exhaustion characteristics of pollutants are determined by the vadose zone such as biodegradation, volatilization, sorption, and dispersion [
32]. Pollutants’ rate of passage can be affected by the seventh parameter of the DRASTIC model, hydraulic conductivity [
47]. It is the water-conducting ability of an aquifer [
39].
Figure 3f demonstrated the subclasses of this factor in the study area including >300, 200–300, 100–200, and <100 and ratings of 9, 8, 6, and 4, respectively.
Figure 4 shows the final susceptibility map of the investigation region. The map is generated by combining the impact of all the seven considered factors in GIS [
1]. Chitral is divided into five classes; very high, high, medium, low, and very low and the DRASTIC index ranges for these classes are 80–100, 100–120, 120–140, 140–160, and 160–180 in that order.
Table 5 shows the area lies under each susceptibility index class, according to this model 3188.02
which is 22% of the total area lies in a low vulnerable zone (<120), 8114.96
(56%) that is maximum area lies in a moderately vulnerable zone (120–149), 2753.29
(19%) lies in a highly vulnerable zone (150–179) and 434.73
(3%) lies in a very high vulnerable zone (>180) of the study zone. These index values describe the area’s vulnerability to groundwater contamination. It was found that the maximum area lies under a moderately and highly susceptible zone of the research region.
Aller et al. [
32] first made innovation in the conventional DRASTIC model by introducing the new anthropogenic factor ‘A’ and study its impact on contamination susceptibility in groundwater aquifers. The same model of study is used in the current study by applying modified DRASTIC or DRASTICA model for assessment of susceptibility in the Chitral district of Pakistan. DRASTIC risk map was generated by allotting weights and ratings to land use classes as used by Singh et al. [
28]. DRASTICA risk map shows more meaningful results than conventional DRASTIC risk map. The anthropogenic parameter has a substantial effect on the concentration of nitrates in the groundwater aquifers. It was concluded by the results that soil media, net recharge and topography, and aquifer media have not much contribution to groundwater contamination but anthropogenic activities, depth to the water table and hydraulic conductivity significantly affects groundwater pollution. This study helps the planners and engineers to find the areas with a high risk of pollution by using a DRASTIC risk map. The DRASTICA risk map defines the five divisions on the basis of their severity of groundwater contamination namely, very low, low, medium, high, and very high. With the addition of the anthropogenic activities factor, the very high area increases from 3% to 14% as shown in
Table 5. Most of the study region lies under moderate (39%) and high (44%) vulnerability zones. In past, a study was performed by Maqsoom et al. [
47] in the northern Pakistan region of Gilgit Baltistan, in which a similar technique was used which validates the present research. It has been found that they have 19% area under very high-risk class and 2% area under low-risk class.
In spite of some ambiguities in the present model (similar ratings are assigned according to the opinions of experts only), the result generated in the study area is more meaningful and dependable than the conventional DRASTIC model. Studies show that anthropogenic activities have a substantial effect on the concentration of nitrate in urban areas. In the end, a check was applied to the results by using sensitivity analysis which validates the results by assessing the effect of each factor on susceptibility to groundwater pollution in groundwater aquifers. The results generated from the present study are only limited to the Chital district, but it should cover the whole CPEC route where new settlements can be possible. It is suggested to imply this technique on a global scale.
6. Conclusions
This study has been directed to evaluate the susceptibility of the groundwater of a civilized environment in the northern region of Pakistan, Chitral, and engaging experimental approach in the DRASTIC model with the assistance of geographic information system (GIS) software. Furthermore, to trace the land use pattern and anthropogenic settlements, a modification method has been applied to develop a revolutionary procedure labeled as a modified DRASTIC or DRASTICA model. The modified procedure involves nightlight satellite observations for human settlements termed as proxy and the area covering the civilized region of Chitral as land use or land cover (LULC). The results achieved from the conventional DRASTIC approach, extricate the vulnerability zones into three different classes, i.e., low, moderate, and high groundwater susceptibility, whereas the modified DRASTIC risk map or DRASTICA model, differentiate the vulnerable zones into four different groups of low, moderate, high and very high groundwater susceptibility. DRASTICA risk map approach when associated with the conventional DRASTIC model proved to be more definite in the evaluation of the groundwater pollution susceptibility in the advanced areas. After the groundwater susceptibility analysis, the study area results show that 14% falls into a very high-risk group, whereas the area falling into the low-risk group is 3%. Therefore, the susceptibility of the urban area of Chitral lies in very high condition, due to the high net recharge value, depth of water level (shallow), porous vadose zone. Groundwater assessment is an excellent cost-effective method in detecting possible pollution in the groundwater, also due to the disordered and disorganized development of land with different hazards affecting the condition of groundwater. Management and policymaking authorities can benefit from the output analysis of groundwater susceptibility by making policies in which human waste should not mix with groundwater. In the future, when the population increases in this area so these policies will be helpful to provide a healthy environment. It is also suggested that adding new contributing datasets will provide more meaningful outputs than present results.


 ,
, 


