
Impacts of Rainfall and Temperature Changes on Smallholder Agriculture in the Limpopo Province, South Africa

Faculty of Applied Sciences, Department of Environmental and Occupational Studies, Cape Peninsula University of Technology, Keizersgracht Street, Zonnebloem, Cape Town 7535, South Africa
*
Author to whom correspondence should be addressed.
Water 2021, 13(20), 2872; https://doi.org/10.3390/w13202872
Submission received: 13 August 2021
/
Revised: 6 October 2021
/
Accepted: 7 October 2021
/
Published: 14 October 2021
(This article belongs to the Special Issue Impacts of Climate Change on Plant Water Use, Carbon Balance, Nutrient Economy, and Their Interactions)
Abstract
:The intensity and frequency in the recurrence of extreme climate events are compounding the vulnerability of smallholder farmers, who have always lacked the resources to adapt. The increasing temperatures and decreasing rainfall are exacerbating water scarcity challenges through drought recurrence. There is an urgent need for pathways that lead towards Sustainable Development Goals, mainly Goals 1 (no poverty) and 2 (zero hunger) in poor rural communities. This study assessed rainfall and temperature trends from 1960 to 2018 and their impacts on crop production in the Mopani and Vhembe Districts of Limpopo Province, South Africa. Trend analysis was used to analyse rainfall patterns, as well as the trends in temperature recorded for the past 58 years. The climate moisture index (CMI) and runoff estimates were used to assess the degree of aridity and water availability, respectively. Geographic Information Systems (GIS) and remotely sensed data were used to assess the changes over time. The total annual rainfall has declined significantly while annual minimum and maximum temperatures have increased significantly during the period under observation. An aridity index of −0.70 calculated for the study areas classifies the districts as dry and water scarce. The results of the analysis also indicate that the districts are climate change hot spots, and are highly vulnerable to the impacts of climate change. The changes are compounding water and food insecurity. Policy and decision-makers should focus on enhancing adaptation and resilience initiatives in the study areas through systematic, transformative, and integrated approaches, such as scenario planning, circular economy, and nexus planning.
1. Introduction
Climate change and variability are some of the greatest challenges facing humankind and have dominated the agendas of major world conferences [1]. Sub-Saharan Africa (SSA) is identified as one of the climate change hotspots, as the impacts of climate variability and change are adversely affecting livelihoods and threatening to derail the economic gains in the past [1,2]. As part of SSA, South Africa has also been affected by extreme weather events that are affecting crop production, threatening national food security [1,2]. South Africa has already experienced shifts in the crop growing seasons and has been subjected to severe droughts, for example, those recorded during 1982/83, 1987/88, 1991/92, 1994/95, 2002/03, 2008/09, and 2015/16 [2,3]. The worst droughts were experienced during 1982/83, 1991/92, and 2015/16 seasons, when compared with other droughts periods or seasons [3,4]. The 2015/16 El Niño Southern Oscillation (ENSO) induced drought was the worst since the beginning of recording weather information, as the whole country became water, energy, and food-insecure [3].
In the Limpopo Province of South Africa, smallholder agriculture is intensely reliant on rainfall [5], making it highly vulnerable to the impacts of climate change. Rural communities continue relying on climate-sensitive sectors of agriculture, forestry, and fisheries, exacerbating their vulnerabilities [3]. Particularly, the smallholder agriculture sub-sector needs to be adapted to the current changes, as it plays an important role in food security [3]. Thus, adapting and improving smallholder agriculture is a climate change adaptation strategy, providing pathways towards Sustainable Development Goals (SDGs) and national goals enshrined in the National Development Plan (NDP). Although the NDP intends to increase the irrigated area by 49,000 ha by 2030, the main challenge has been that almost all the available freshwater resources are allocated, and agriculture already uses over 60% of the available water resources [4]. The challenge is compounded by the decreasing rainfall, which has seen decreases in crop productivity in the smallholder sector, compromising food security [3]. Thus, rainfall is critical in determining agricultural yields where irrigation is not very advanced.
Understanding rainfall trends is critical in projecting future crop productivity under climate change and variability [5]. Past studies have demonstrated that the changing climate has already impacted farming and food systems, as evidenced by shifts in the rainy season and modifications in the environment [6,7,8,9,10]. Climate change is causing agriculture to struggle to meet the growing food demands of an increasing population as the world is faced with water deficits and consequently low crop production [11,12]. The coping strategies being undertaken to reduce risks and vulnerabilities from the growing food and water demand are being hampered by a range of stresses that include higher temperatures, the emergence of novel infectious diseases, changing rainfall patterns, and shifts in the crop growing season [13]. These current challenges require strategies that enhance the adaptation and resilience of particularly rural people, promote sustainable food systems, and build food systems that are more resilient to current harsh climatic conditions [10,13]. Such initiatives are advance by promoting modern technologies that enhance and improve crop water productivity [10]. An understanding of the various available adaptation options and the associated benefits are closely linked to the knowledge of how temperature and rainfall are to vary over time [13].
Rainfall variability and increasing temperature are already resulting in shifts in areas that are suitable for the growth of many crops [14,15,16], a situation requiring immediate adaptation strategies. This has seen the promotion of indigenous under-utilised crops that are generally adaptable to harsh conditions [15]. Water demand has tripled since the 1950s, but the availability of freshwater has been declining [17]. According to Parry et al. [18], the impacts of climate change on global food production may look small, but they are unevenly distributed in space and time [18]. The challenge is more pronounced in arid and sub-humid tropics, particularly in poor regions where adaptation capacity is generally low [18].
This study assesses the trends in the monthly, seasonal, and annual rainfall, maximum and minimum temperatures, as well as the Climatic Moisture Index (CMI) in the Mopani and Vhembe districts of the Limpopo Province over a period of five decades. The two districts were chosen as past research indicates that they are climate hotspots [19]. We, therefore, highlighted climate change impacts in these districts at the local level to further recommend informed adaptation strategies. The premise was to guide policy and support decision-making to formulate coherent strategic interventions that lead to Sustainable Development Goals (SDGs) and the resilience of rural livelihood. The results add to the knowledge of past climatic variability and provide a platform to understand the future impact and can be used as an early warning tool. The methods can be used in other areas as climate change impacts and adaptation strategies are more effective at the local level.
2. Materials and Methods
2.1. The Study Areas
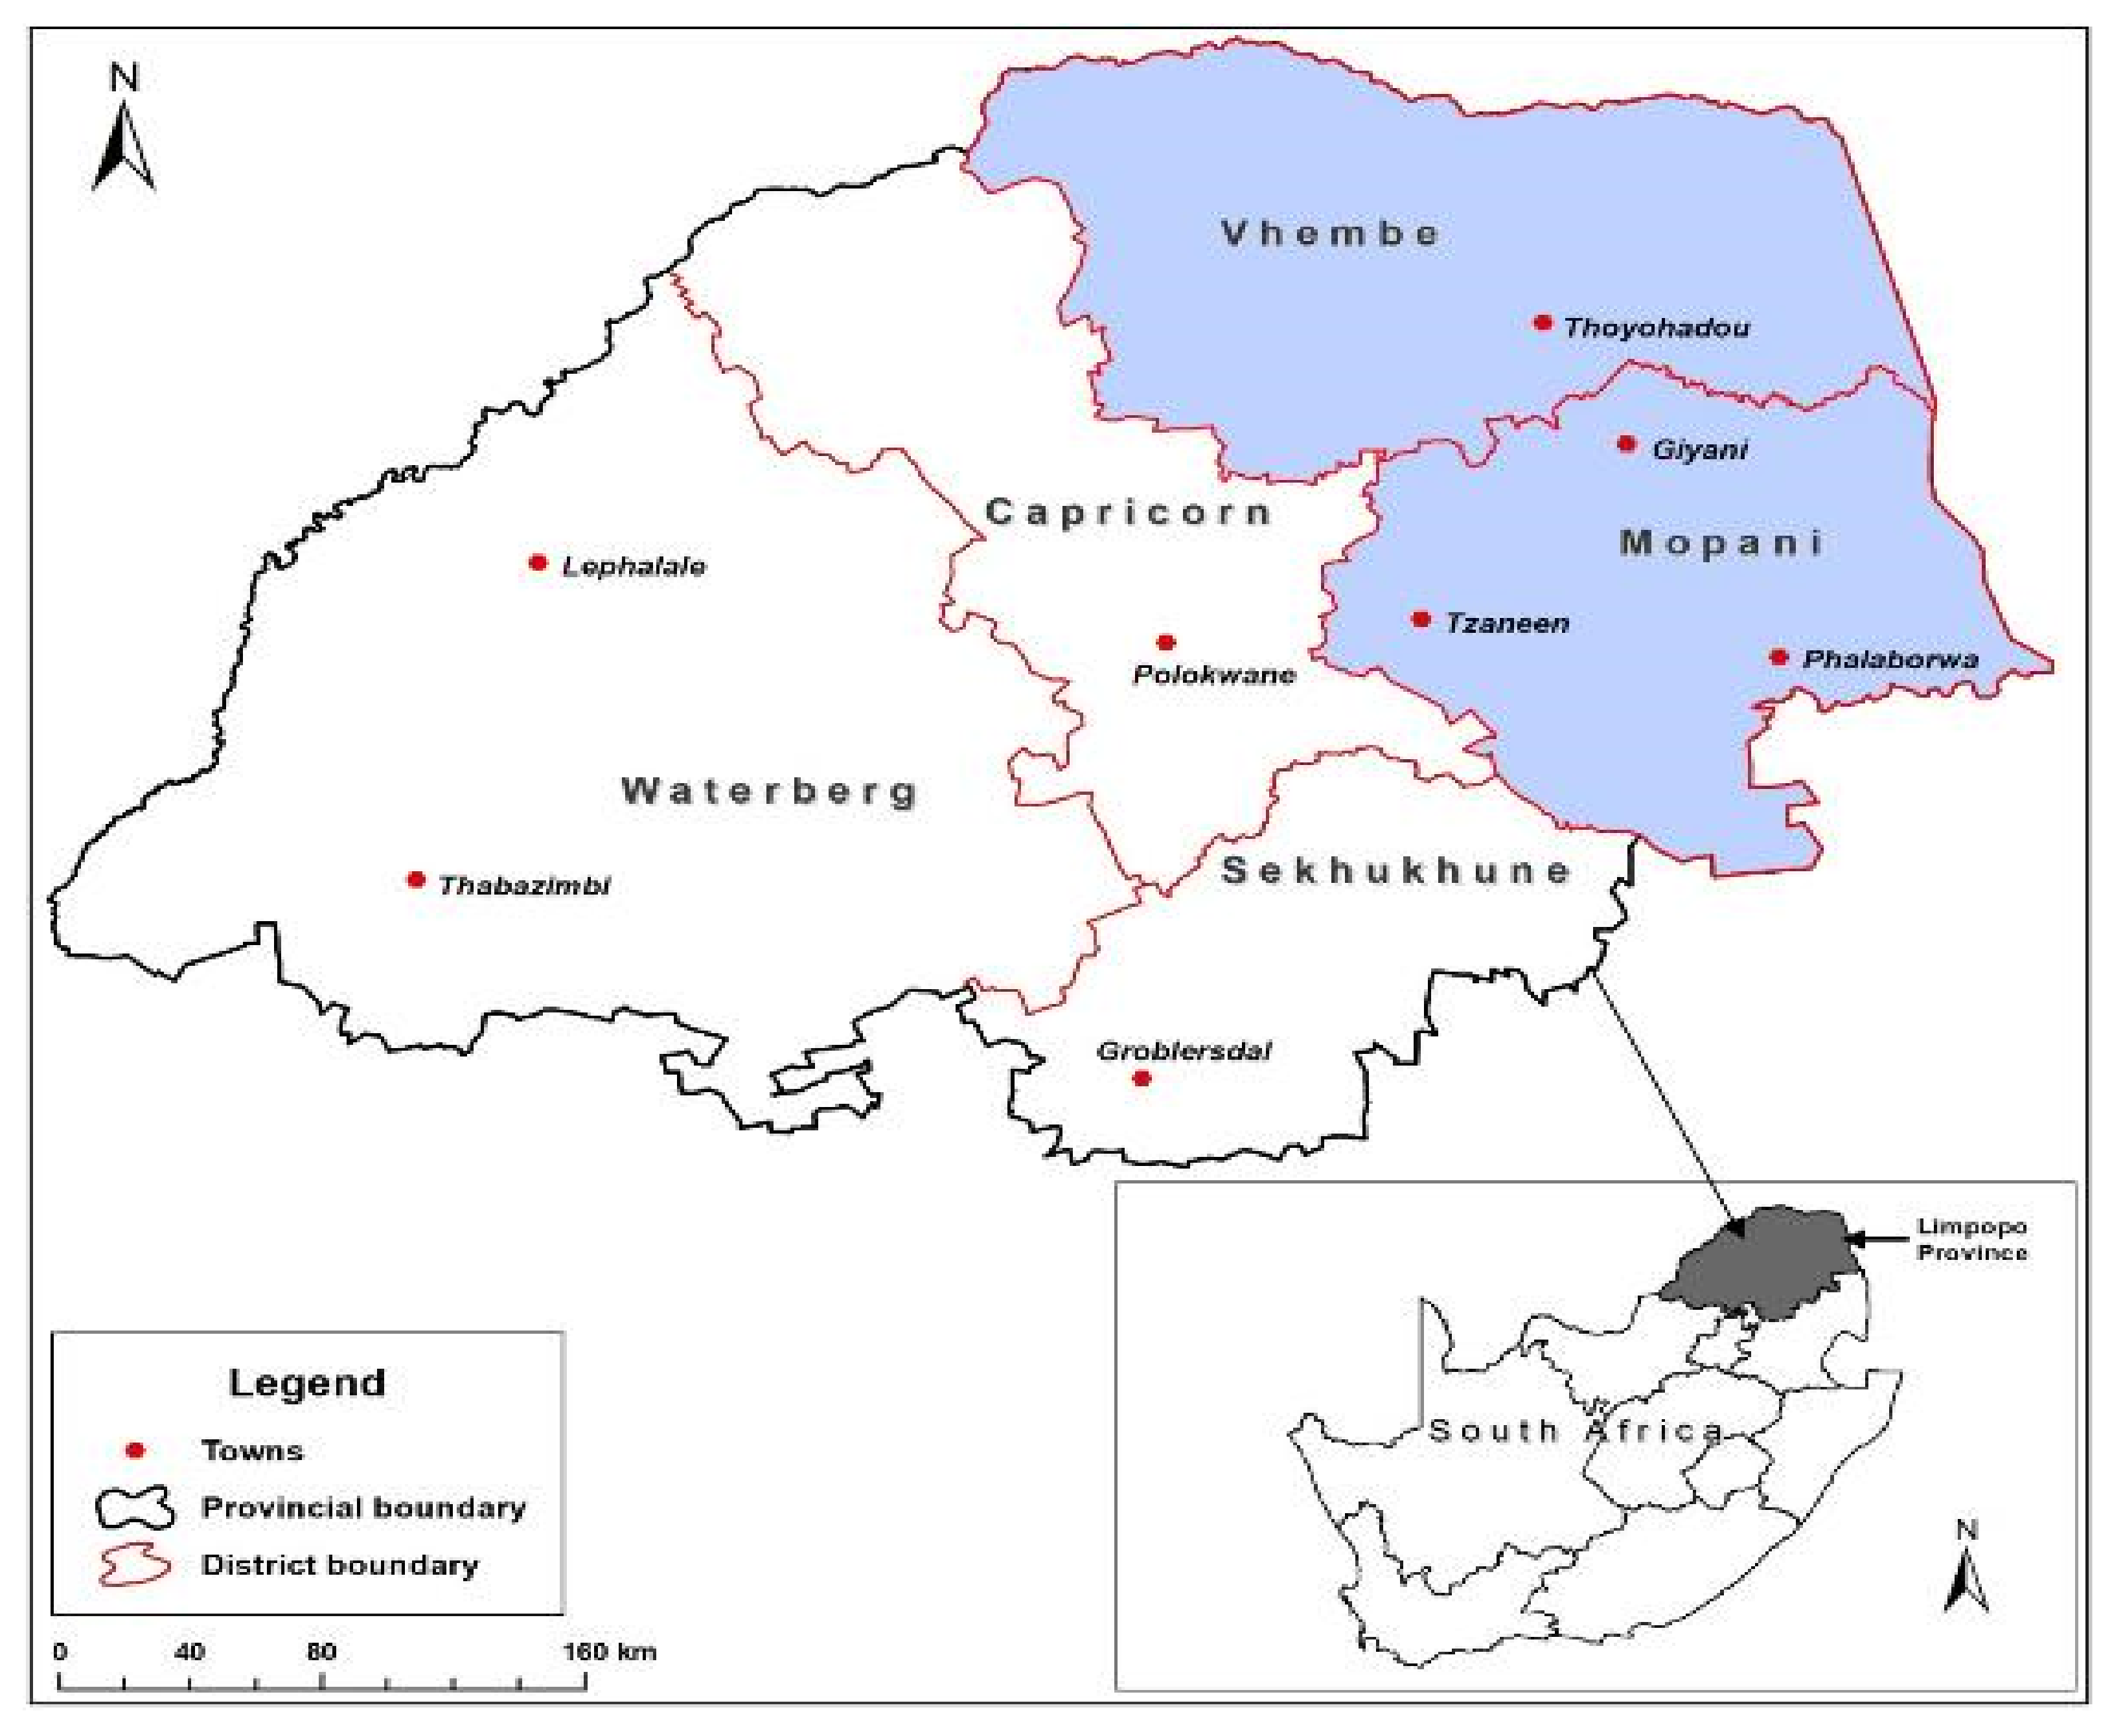
The study focused on the Mopani and Vhembe districts in the Limpopo Province, South Africa (Figure 1). The two districts are identified as climate change hotspots in Limpopo Province [20]. The Mopani district municipality is comprised of five local municipalities, namely, Greater Tzaneen, Greater Giyani, Letaba, Maruleng, and Ba-Phalaborwa. The district covers a total land area of approximately 1.4 million hectares, with a total population of 1.2 million people [21]. The district is characterised by low rainfall especially in the lower areas of Giyani and Ba-Phalaborwa municipalities. The Mopani district experiences average maximum temperatures of 21 °C to 37 °C in January, average minimum temperatures of 5 °C to 12 °C in July and has annual average temperatures of between 13 °C to 27 °C [20]. A large portion of the district, the eastward side of the Drakensberg escarpment, receives an annual average rainfall of about 400–500 mm, while the area at the foot and on the escarpment receives 600–800 mm and 800–1000 mm, respectively [20]. Agriculture is one of the key economic sectors, which are predominant in the Tzaneen, Letaba, and Maruleng.
The Vhembe district municipality is comprised of four local municipalities, Musina, Collins Chabane, Thulamela, and Makhado. It covers a total land area of about 2.6 million hectares with a total population of 1.3 million people [21]. Average annual temperatures range between 14 °C and 29 °C [21]. The district receives its rainfall in summer averaging between 300 mm and 400 mm per annum [22]. The areas suitable for tropical and subtropical fruits are mostly in the Levubu Valley. Vegetables are produced in irrigation schemes that are spread along river valleys with the Nwanedi Valley, which is well known for tomato production [20].
The target group for this study are smallholder farmers who are a generally the most vulnerable group to climate change impact, as they do not have resources to adapt like their commercial counterparts do. Smallholders, who form the majority of rural people, have small land tenure of about 2 ha (Figure S1) and grow crops on a subsistence basis; however, they play an important role in household food security. The inability of smallholder farmers to adapt and be resilient to climate change is compounded by historical displacement that placed local indigenous people into Bantustans or former homelands, which are limited in resources. Agriculture in these former homelands is generally rainfed, an agricultural system which is highly vulnerable to climate change. This study, therefore, intends to inform policy and decision-makers on informed strategies that enhance the resilience of rural livelihoods.
2.2. Data Sources
The geographical distribution description of the weather stations in the Mopani and Vhembe Districts, Limpopo Province comprising datasets of ≥50 years is given in Table 1. The dataset (daily rainfall, minimum, and maximum temperature) was obtained from the Agricultural Research Council (ARC) and the South African Weather Service (SAWS). For data quality, the climate data were inspected and the missing values filled using the ARC stand-alone patching tool, which uses the Inverse Distance Weighting and the Multiple Linear Regression methods.
2.3. Rainfall and Temperature Trends Analysis
An analysis of past rainfall trends facilitates an understanding and forecasting of possible future changes, and provides informed and reliable pathways towards adaptation and resilience. Past trends in rainfall, as well as changes in oceanic temperatures, provide important indications about the intensity and frequency of possible future extreme weather events and climate variations [22]. This study analysed observed climatic data for a period covering 58 years (from 1960 to 2018). This facilitated an understanding of the patterns and trends in the climatic variable in the study areas. The process provided the basis for projection of future rainfall changes and patterns. Recorded rainfall data from a total of 16 stations in the districts were used to calculate the average annual rainfall, maximum and minimum temperatures of both districts. The assessed climatic variables were also used to create continuous rainfall and temperature surface maps for the period under consideration through interpolation. The interpolation facilitated the comprehension of the spatio-temporal changes and variations taking place in the study areas. The process facilitated the development of contextualised adaptive measures in each of the study areas. The inverse distance weighting (IDW) interpolation method was used to create the continuous surface heat maps in Geographic Information System (GIS). The IDW interpolation is a widely used method in spatial rainfall distribution studies [23,24,25,26].
2.4. Calculation of the Area-Weighted Average Rainfall
The area-weighted average annual rainfall for both districts was obtained through the use of Thiessen’s Polygon method. Thiessen’s polygon associates each point in an area of interest with the nearest weather station. This procedure tessellates the landscape into zones that are nearer to a specific station than to any other. To calculate the average rainfall values in the created Thiessen polygons over each district, the Thiessen polygons were intersected with the Limpopo Province map through a GIS platform, then the area-weighted averages for each district were determined. The weighted average rainfall associated with each district is calculated using Equation (1) [27,28] as follows:
where Pi is the district weighted average rainfall in mm; Pk is the rainfall associated with each weather station in mm; Aik is the area of intersected polygon associated with weather station k and district in m2.
2.5. Evaluation of the Climatic Moisture Index (CMI)
As already alluded to, the degree of aridity in the Mopani and Vhembe districts was estimated using the Climatic Moisture Index (CMI). The CMI is an index or a numerical indicator of the relative dryness (aridness) or wetness of a particular region, and it represents the water stress or scarcity (aridity). It is calculated from a combination of temperature and precipitation, as well as soil moisture. Thus, there is a close correlation between the CMI and potential evapotranspiration. The CMI is based on the methodology developed by Willmott & Feddema [29], who used the ratio of annual precipitation (P) to annual potential evapotranspiration (PET), as follows:
The CMI indices range from −1 to +1, where wet climatic conditions indicate a positive CMI, and dry conditions indicate a negative CMI. Therefore, the CMI is a cumulative measure of potential water availability, which is dependent exclusively on climate variables [29]. The PET of each district was calculated using observed data from weather stations dotted about the study areas. The calculated results were interpolated to create a continuous PET dataset. Thiessen’s Polygon method was beneficial for determining the area-weighted average PET for both districts. The CMI was calculated only for seven years i.e., 1960, 1970, 1980, 1990, 2000, 2010, and 2020 (a decadal interval that shows meaningful changes in rainfall and temperature changes). The results were then used to assess the aridity of the districts. Then the weighted average for both districts was calculated from the interpolated continuous surface using Thiessen’s Polygon method. The CMI is used here as relational to climate variability and change taking place in the study area [2].
2.6. Statistical Tests
For the statistical data analysis, the 2021 TIBCO STATISTICA Version 14.0.0.15 TIBCO Software (data analysis software system) was utilized. A repeated measures Analysis of Variance (ANOVA) for rainfall, minimum and maximum temperatures as well as CMI were assess for the statistical significance. Statistical regression analysis (ordinary regression) over time was carried out to determine if there was a long term trend in the average rainfall, minimum and maximum temperatures as well as CMI rainfall over the interval of 1960 to 2018.
3. Results and Discussion
3.1. Rainfall Patterns
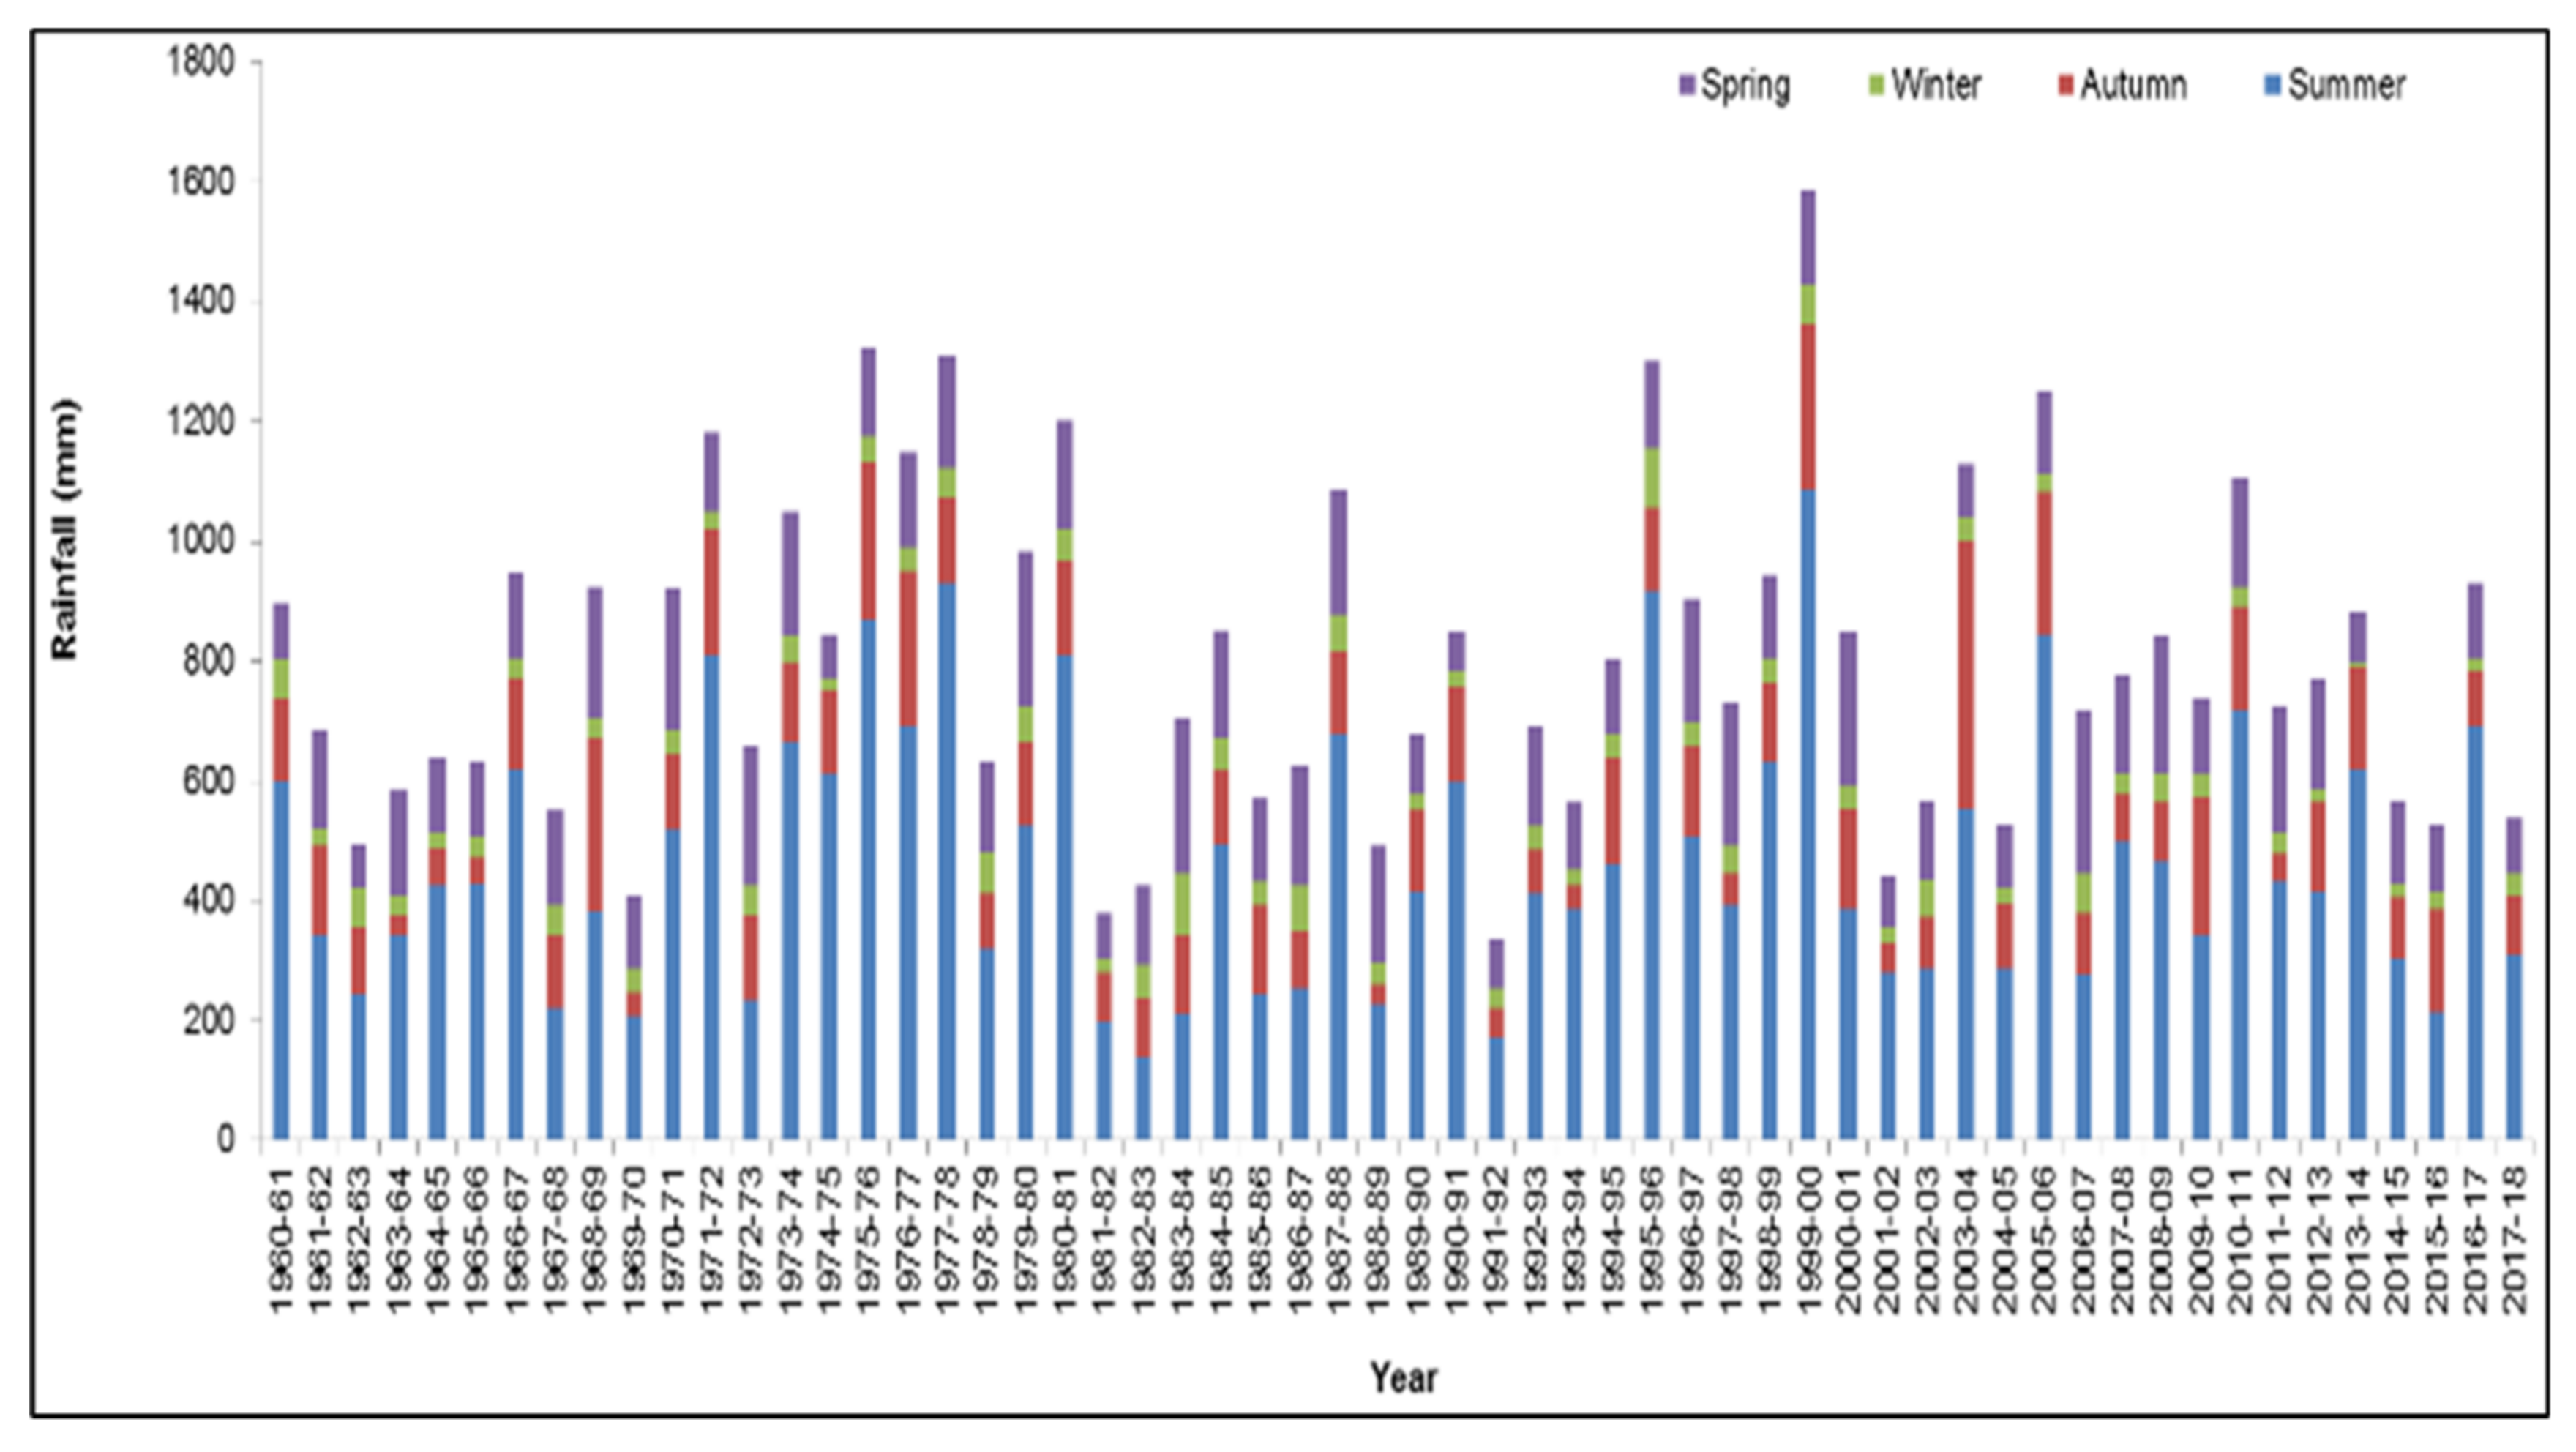
The usual indicators of climate change (increasing aridity, rising temperatures, the increasing frequency and intensity of droughts, and flooding) have been worsening in the two districts, since 1960 to date [19]. Rainfall over the two districts is strongly seasonal, with the greatest part of the rainfall experienced during the summer from December to February. Rainfall measures of up to 100 mm/month were recorded from December to February. Sometimes the downpours had an early beginning (September/October) and in fewer cases the rainy season may carry over into April. Figure 2 presents the annual average rainfall by season (summer, autumn, winter, and spring) from 1960 to 2018 for the Mopani and Vhembe Districts, Limpopo Province. The summer season (December to February) is shown to be the most humid and the winter (June to August) is the most arid and driest (Davis and Vincent, 2017). Autumn (March to May) and spring (September to November) are generally transitional seasons that usher into winter and summer, respectively. From season to season, rainfall is also highly variable and is characterised by inter-seasonal dry periods over the study area (Figure 2). Therefore, according to Figure 2 it is evident that rainfall is highly variable in the study area with inter-seasonal droughts. The peaks are indication of flooding seasons and the lows indicate drought. This high variability is unfavourable for rainfed agriculture as the rainfall is unreliable. Therefore, the main challenge in the study area is high climate variability and not necessary climate change.
Departures from mean rainfall additionally show a considerable extent between yearly fluctuations with drier years during the 1990s (Figure 2). This gives an impression of being a basic defining moment in rainfall inconsistencies from around 1995. It is demonstrated that the driest year in the time arrangement relates to the 1991/1992 season while the wettest season happened in 2000 due to flooding in that year.
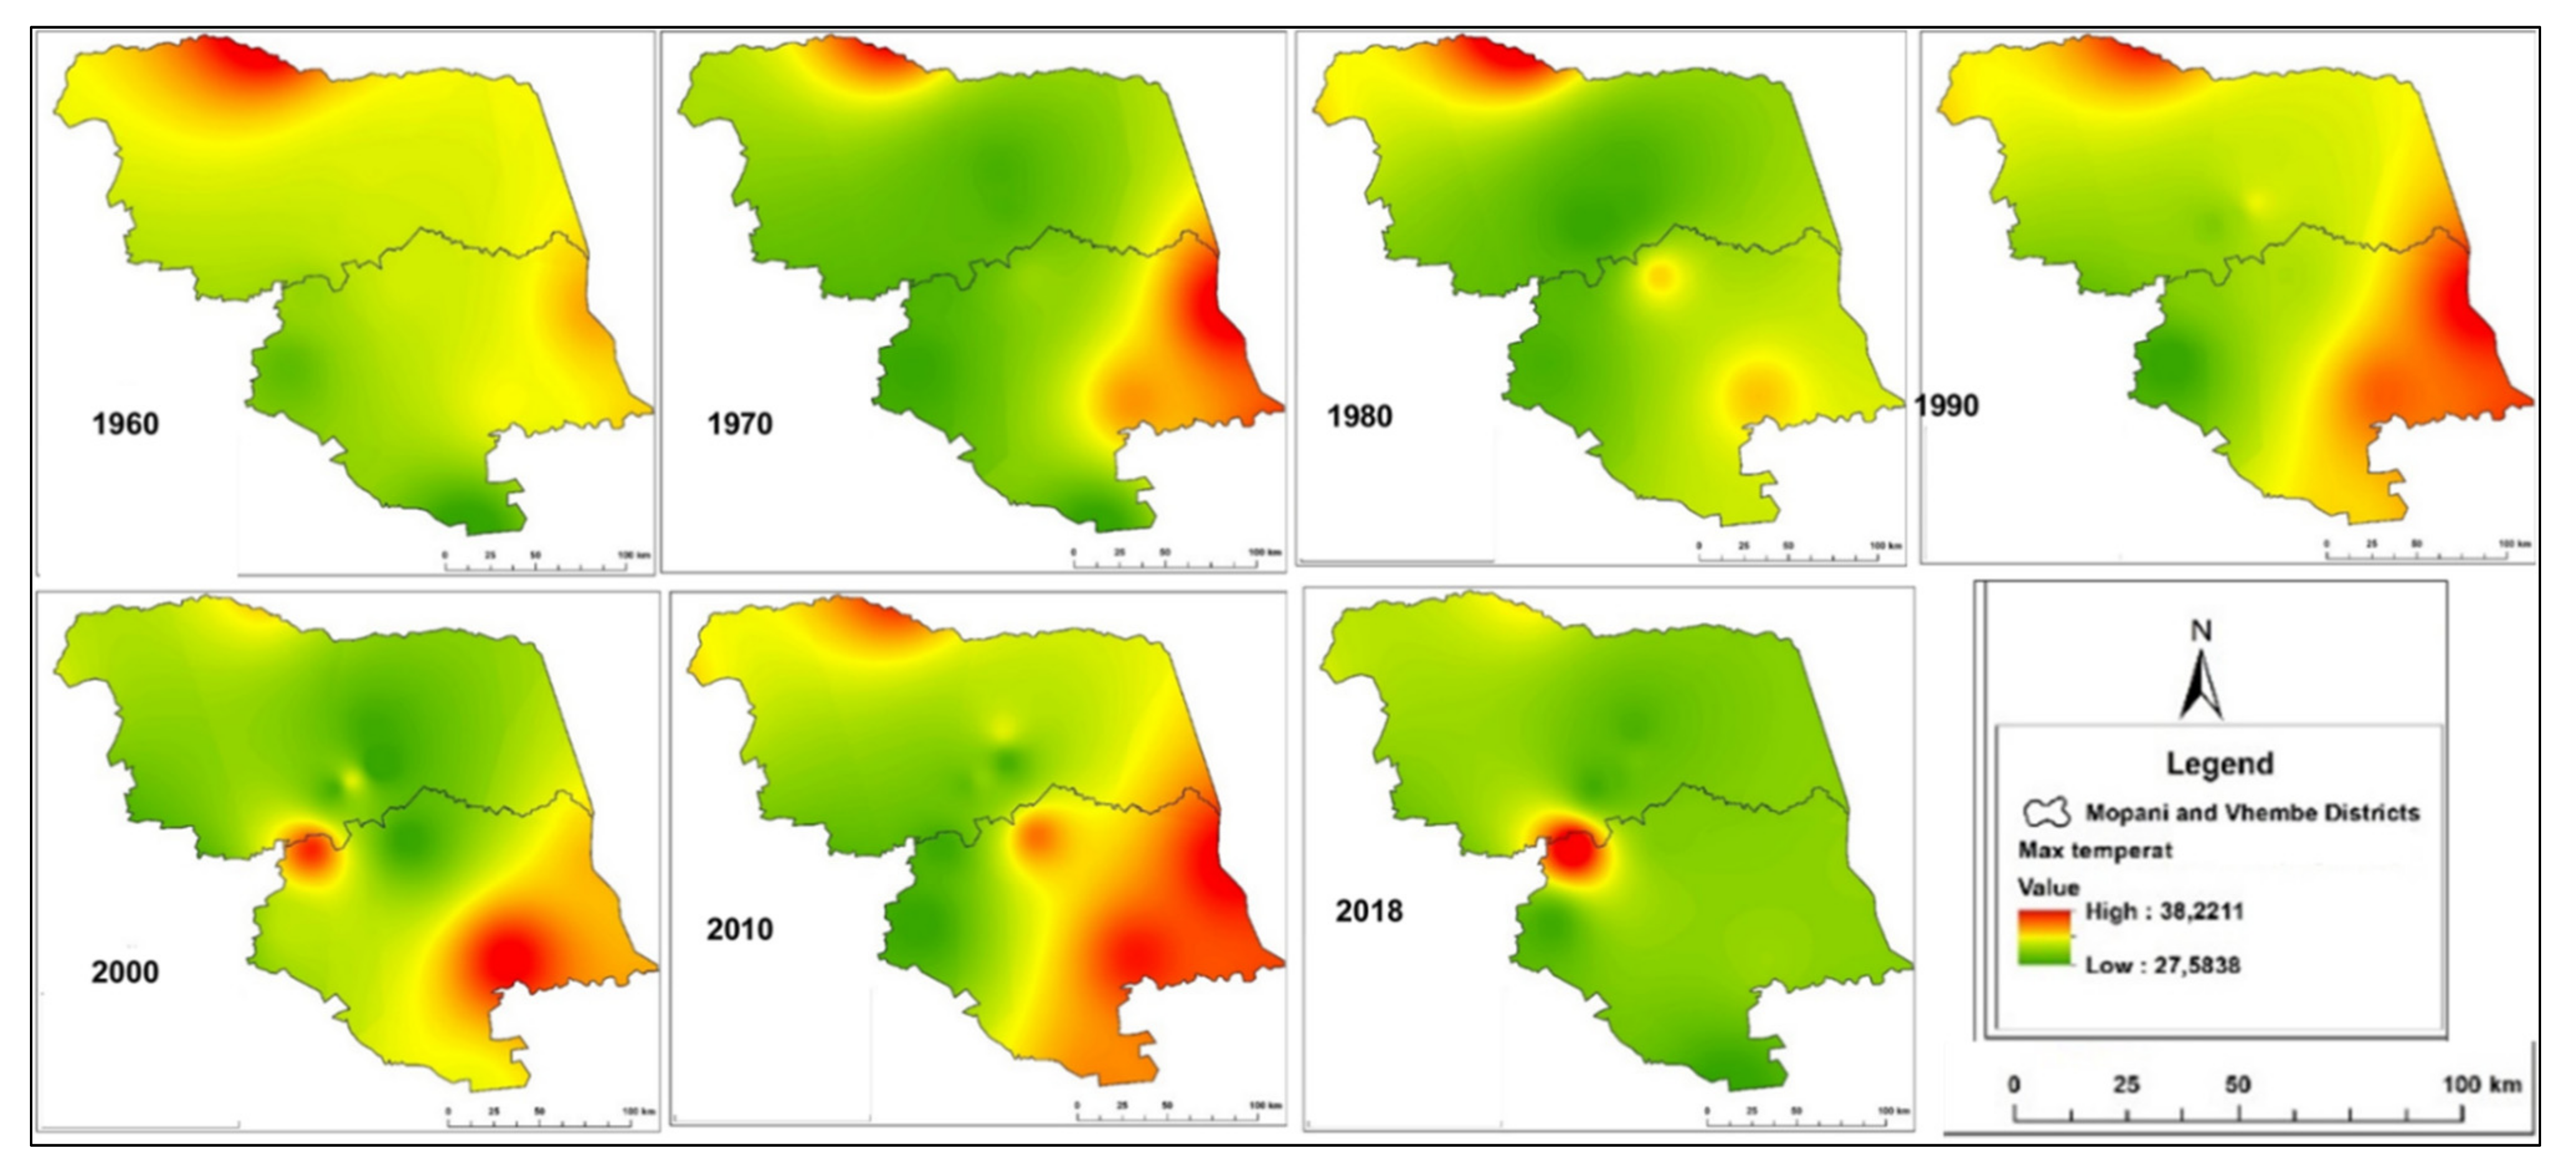
The spatial distribution of annual rainfall during 58 years from 1960 to 2018 in the Mopani and Vhembe districts is shown in Figure 3. The maps were created using Thiessen’s Polygon method. The maps show significant changes in rainfall patterns in both districts during the past 58 years. The total annual rainfall has declined significantly during the 58 years under observation. A perusal of Figure 3 (2018 map), which represents the rainfall pattern of 2018, indicates that almost the entire Mopani and Vhembe districts’ surface area has become arid, receiving less than 350 mm of rainfall, qualifies the districts to be a climate change hot spot zone. The decline in rainfall over the past 58 years has placed the farmers of the Mopani and Vhembe districts in a vulnerable position because of the impacts of climate change.
Table 1 presents the average rainfall values of different stations for the Mopani and Vhembe Districts, Limpopo Province from 1960 to 2018 at an interval of 5 years, except for the last year. Considering the annual rainfall value of 1960 as the base year, the percentage change in the rainfall values was calculated (Table 1). The general pattern of rainfall shown in Figure 3 and Table 1 indicates that rainfall is highly variable. This is confirmed by a repeated measures ANOVA over time for these districts, which indicated that the average rainfall differed statistically significantly (F (57,855) = 12.84; p < 0.001) over time, (Figure S2). The pattern shows extreme incidences of floods and droughts as shown by the considerable extent, respectively. Examples of such extreme climatic conditions are the 1962–1966 and 1970/71 moderate droughts, 1982/83, 1991/92, and 2015/16 severe drought [30,31], and the 2000 floods [32]. According to the statistics shown in Table 1, rainfall totals in both districts decreased by 38% from 1960 to 2018. The annual average rainfall in both the Mopani and Vhembe districts seemed to decrease between 1960 and 2018, as shown in the maps in Figure 3 and the graphs in Figure 2. The decrease in the annual rainfall would lead to water scarcity and the occurrence of droughts in the region, which have been more frequent of late. This would place the districts in a very high climate change vulnerable position. However, an ordinary regression analysis over time to determine if there was a long term trend in the average rainfall over the interval of 1960 to 2018 indicated no statistically significant decrease in the rainfall over time (Table 2).
3.2. Temperature
At the global level, the average surface temperature has risen by 0.6 °C over the last century. Surface temperatures are also projected to rise by between 1.4 to 5.8 °C by 2100 [1]. The analysis in this study is unique in its assessment as it uses more detailed spatial temperature trends, therefore, adding to a significant contribution to the grasping of potential impacts of temperature changes over the area under study.
Table 3 presents the average annual minimum temperature values of different stations for the Mopani and Vhembe Districts, Limpopo Province from 1960 to 2018 at an interval of 5 years, except for the last year. A repeated measures ANOVA over time for these districts indicated that the average minimum temperature differed statistically significantly (F (57,855) = 3.55; p < 0.001) over time (Figure S2). Considering the annual minimum temperature of 1960 as the base year, the percentage change in the minimum temperature values was calculated (Table 3). The general pattern of minimum temperature shown in Figure 4 and Table 3 and Table 4, indicates that the minimum temperature is increasing significantly. Table 3 and Table 4 shows that the average annual minimum temperature has significantly increased from 13.7 °C to 16.3 °C (2.6 °C) during the 58 years under observation. This is confirmed by the results of an ordinary regression analysis over time to determine if there was a long term trend in the average minimum temperature over the interval of 1960 to 2018, which indicated a statistically significant increase in minimum temperature over time in with standardised beta = 0.07, so there is a trend for minimum temperature to became significantly higher over time (Table 4). A perusal of Figure 4, which represents the minimum temperature of 2018, indicates that increases in the minimum temperature of 3.0 °C and 2.3 °C for the Mopani and Vhembe districts, respectively, over the 58 years, qualifying the districts to be a climate change hot spot zone. The highest minimum temperature increase (7.6 °C) in the Mopani district was recorded between Greater Giyani and Greater Letaba municipalities, while in the Vhembe district highest minimum temperature increase (3.8 °C) was recorded between Levubu and Tshiombo.
The spatial distribution of average minimum temperature during 58 years from 1960 to 2018 in the Mopani and Vhembe districts is shown in Figure 4. The maps in Figure 4 were created using Thiessen’s Polygon method. The maps show significant changes in minimum temperature patterns in both districts during the past 58 years. The annual minimum temperature has increased significantly during the 58 years under observation. The trends are certainly real, and the warming is large enough to have significant impacts on the hydrology and ecosystems of the districts.
Table 5 presents the average annual maximum temperature values of different stations for the Mopani and Vhembe Districts, Limpopo Province from 1960 to 2018 at an interval of 5 years, except for the last year. A repeated measures ANOVA over time for these districts which indicated that the average maximum temperature differed statistically significantly (F (57, 855) = 14.17; p < 0.001) over time (Figure S2). Considering the annual maximum temperature value of 1960 as the base year, the percentage change in the maximum temperature values was calculated (Table 5). The general pattern of maximum temperature shown in Figure 5 and Table 5, indicates that the maximum temperature is increasing. Table 5 and Table 6 shows that the average annual maximum temperature has significantly increased from 13.7 °C to 16.3 °C (2.5 °C) during the 58 years under observation (Table 5 and Table 6). This is confirmed by the results of an ordinary regression analysis over time to determine if there was a long term trend in the average maximum temperature over the interval of 1960 to 2018, which indicated a statistically significant increase in maximum temperature over time in with standardised beta = 0.26, so there is a trend for maximum temperature to became significantly higher over time (Table 6). A perusal of Figure 5 for the year 2018 indicates that increases in the maximum temperature of 3.20 °C and 1.6 °C for the Mopani and Vhembe districts, respectively over the 58 years, qualifying the districts to be a climate change hot spot zone. The highest minimum temperature increase (11.2 °C) in the Mopani district was recorded between Greater Giyani and Greater Letaba municipalities, while in the Vhembe district highest minimum temperature increase (3.2 °C) was recorded in Musina municipality.
The spatial distribution of average maximum temperature during the 58 years under review (from 1960 to 2018) in Mopani and Vhembe districts is given in Figure 5. The maps (Figure 5) were developed through the interpolation by the inverse of the square of the distances. The maps provide important information on the changes that took place in the maximum temperatures in both districts during the 58 years. The annual minimum temperatures significantly rose during the same period. These results agree with the general knowledge that recognises the increasing temperatures in Limpopo Province [33]. This information is critical when formulating policies and supporting decision-making on climate adaptation and resilience. The findings in this study are also beneficial for preparedness and risk reduction of extreme weather events [34]. The FAO has stated that rising temperatures and increasing drought frequency and intensity in Southern Africa are the factors most affecting households and crop productivity, compounding household food security in the region [34]. Climate change and variability have made households more susceptible to extreme weather events as the environments continue to degrade, impacting environmental and human health [34]. This evidence of rising temperatures over the Mopani and Vhembe districts has seen shifts in the crop growing season, due to changes in the hydrological cycle.
3.3. Degree of Aridity and Water Scarcity
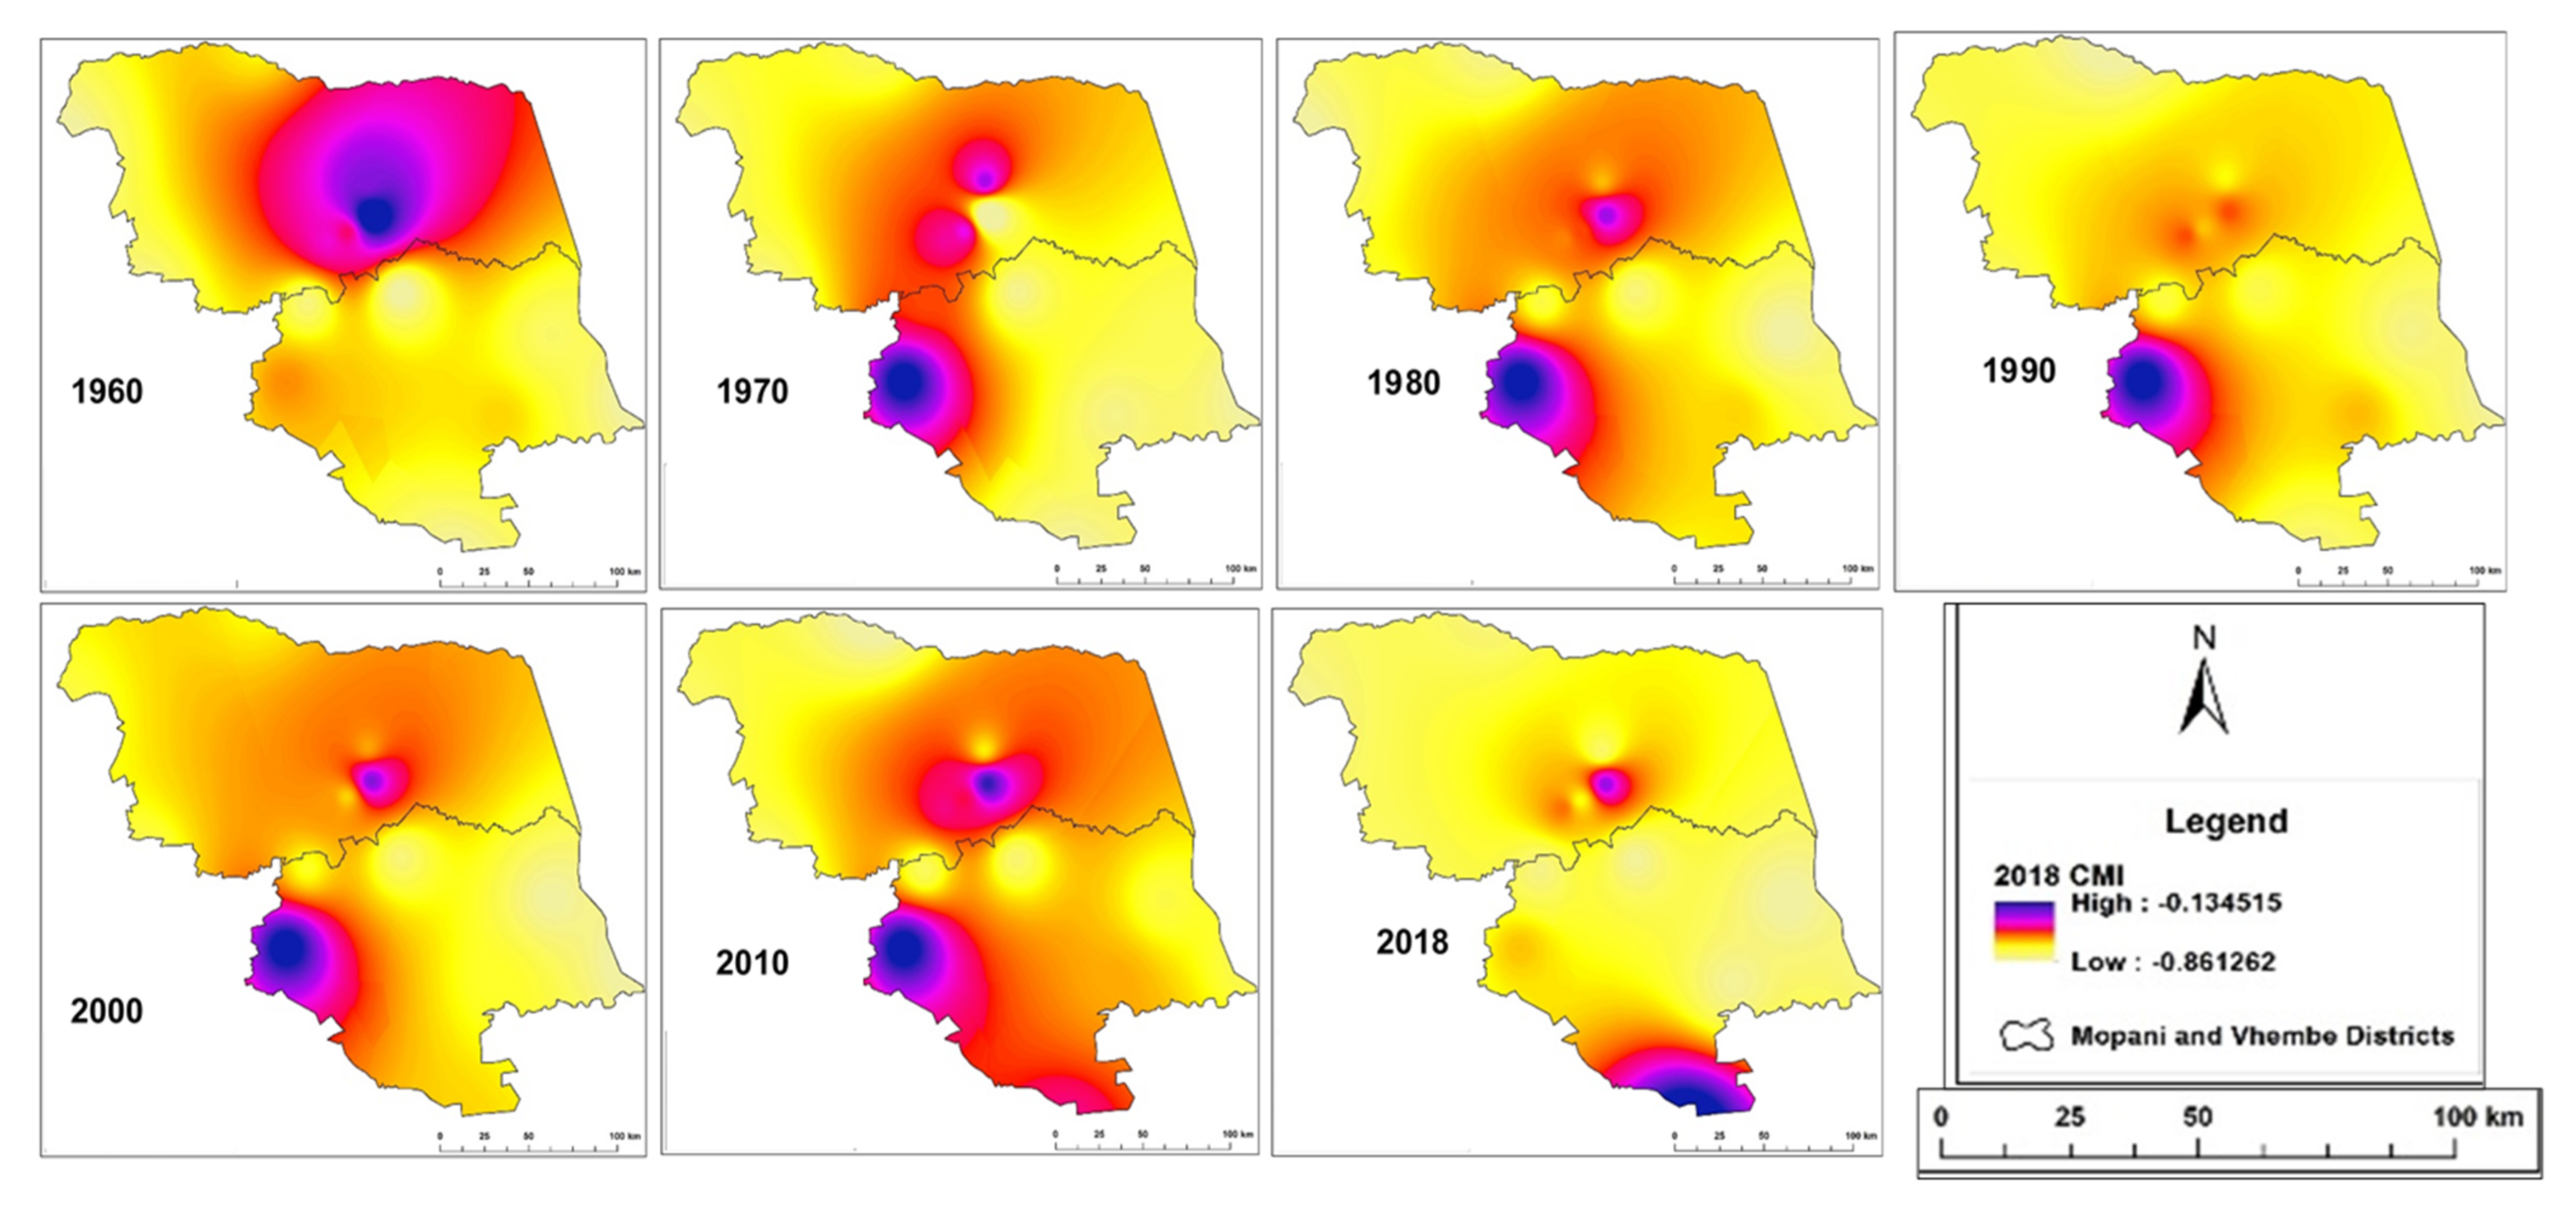
Table 7 presents the CMI of both the Mopani and Vhembe districts, which are all negative. The CMI was calculated using annual rainfall (P) and annual potential evapotranspiration (PET) applying Equations (2) and (3). The negative CMI values indicate that the PET in the region exceeds precipitation. According to Vörösmarty et al. [35], there is a classification link between CMI values and climatic conditions (CMI < −0.6 = Arid; −0.6 ≤ CMI ≤ 0 = Semi-arid; and CMI > 0 = Humid).
The average CMI for both districts over the years under observation was calculated as −0.70, qualifying the region to be a dry and water-scarce area according to the Vörösmarty classification [35]. A repeated measures ANOVA over time for these districts indicated that the average CMI differed statistically significant over time (F (57,855) = 9.37; p < 0.001), (Figure S2). The aridness of both districts seemed to increase over the years making the districts a water-scarce area (Figure 6). This is not an encouraging sign for agriculture, where water plays a crucial role as input to the production system. This will have a more negative impact on rain-fed agriculture’s production and productivity [2,36]. The large-scale implementation of various water harvesting techniques will also go a long way in alleviating water scarcity and low crop productivity. Therefore, a steady and sustainable effort should be made to bring more arable land under irrigated conditions. However, an ordinary regression analysis over time to determine if there was a long term trend in the average CMI over the interval of 1960 to 2018, indicated that there was no statistically significant decrease in the aridness over time (Table 8).
Although not statistically significant, the CMI of the study area seems to indicate a worsening aridity is indicative of the adverse climatic conditions, which are not favourable to rain fed areas that dominates smallholder agriculture in the area. There is an urgent need to adopt modern farming technologies and the use of new seed hybrids and grow under-utilised indigenous crops that are adapted to the local conditions. Another adaptation strategy is the introduction of solar irrigation to tap the groundwater resources to enhance crop water productivity and create employment, as with irrigation there is cultivation throughout the year.
3.4. Correlation between Rainfall Variability, Aridity and Cereal Production
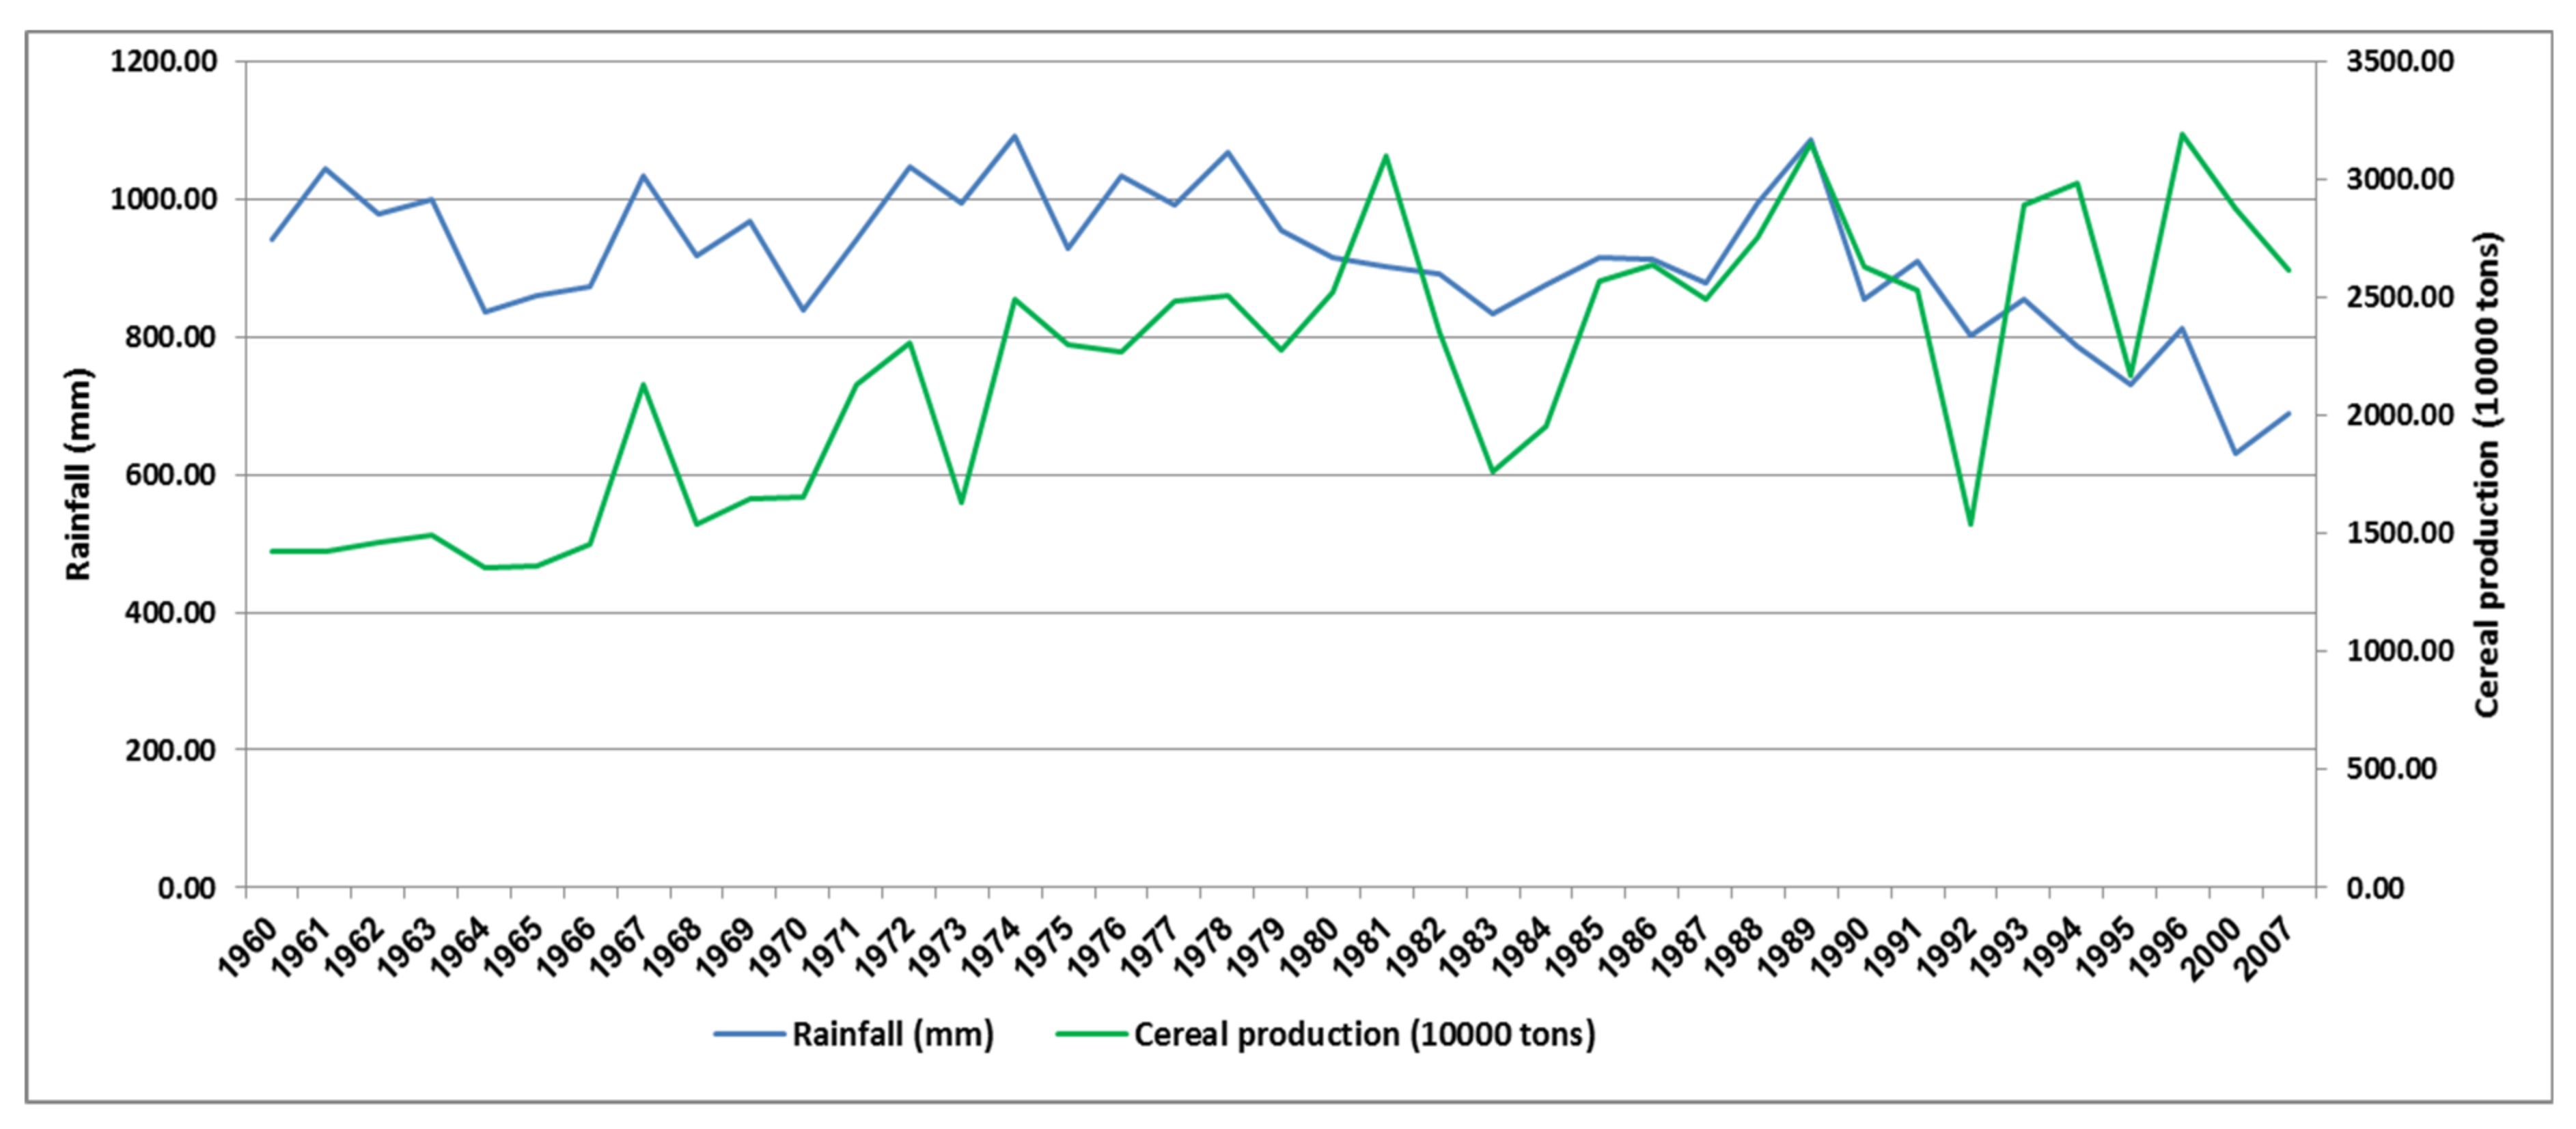
The variations in moisture in the study area adversely causing reduced crop productivity due to worsening aridity (Figure 7). Rainfed agriculture, coupled with other factors such as poor infrastructure and lack of resources to adapt to the changing environment, are only compounding the vulnerability of the two districts under study. These changes are projected to result in a reduction of between 2% and 7% in agricultural GDP by 2100 [2,14]. Although rainfall has been mainly highly variable from 1960 to 1978, it started to decline since then and to date. Although cereal production has been increasing steadily over the years, it has always failed to meet the demands of a growing population [2]. The lows in cereal production coincide with seasons of droughts.
4. Recommendations
There is a need to intensify irrigation by using the vast and untapped groundwater resource, as dependence on rainfall is highly unreliable due to occurrences of droughts and floods. The large-scale implementation of various water harvesting techniques will be a sustainable approach in alleviating water scarcity and low crop productivity. Resources should now be channeled towards adaptation and building resilient communities. One systematic, transformative, and integrated approach that is being spearheaded to guide policy and decision-making to develop informed adaptation strategies is the water–energy–food (WEF) nexus, a polycentric approach that considers all resources in equal terms and is a decision support tool to mitigate trade-offs and maximise on synergies. Unlike the integrated water resources management (IWRM) that is water-centric, the WEF nexus is multi-centric, promoting cross-sectoral resource management. Sectoral approaches in resource management only transfer challenges to other sectors as each sector pursues its strategies and policies. However, the WEF nexus stimulates stakeholder engagement before the implementation of any developmental project. Table 9 provides some of the adaptation strategies that can be adopted to increase the resilience of smallholder farmers to the impacts of climate change.
5. Conclusions
Historical annual rainfall data for the past 58 years (1960–2018) was used to analyse the patterns, variability, and trends. This helps in understanding how the rainfall may change in the future. Although not statistically significant, a decline in rainfall amount over the years with more variability in recent years was observed. A decrease in annual rainfall would result in a decrease in annual runoff volumes. Thus, to ensure food security in the districts, there is an urgent need to bring more area under irrigation to have climate-resilient agriculture. The CMI indicates the soil moisture regime is also observed to be declining, although not statistically significant. The soil water regime of both districts regarding crop production is evidenced from the CMI values, which indicate that the area is becoming soil moisture scarce. The analysis also shows that both districts are climate change hot spot areas, highly vulnerable to the impacts of climate change. The increase in temperature and the decrease in the annual rainfall is leading to water scarcity and the occurrence of droughts in the districts, which have been more frequent of late. The analysis data from 1960 to 2018 demonstrated an increased recurrence of drought, as with rainfall variability, which leads to water scarcity and food insecurity. Major climate change impacts in the districts under study are being felt through water resources, thereby affecting all sectors.
Supplementary Materials
The following are available online at https://www.mdpi.com/article/10.3390/w13202872/s1, Figure S1: Irrigated and rainfed areas of Mopani and Vhembe districts indicating the proportions of the two agriculture sub-systems, and Figure S2: Results of repeated measures ANOVA for rainfall, minimum and maximum temperatures as well as CMI of Mopani and Vhembe districts.
Author Contributions
Conceptualization, S.S., N.M. and K.S.; methodology, S.S.; formal analysis, S.S.; investigation, S.S.; resources, S.S.; data curation, S.S.; writing—original draft preparation, S.S.; writing—review and editing, N.M. and K.S.; visualization, S.S.; supervision, N.M. and K.S.; project administration, N.M.; funding acquisition, S.S. All authors have read and agreed to the published version of the manuscript.
Funding
This research was funded by the Southern African Systems Analysis Centre (SASAC) through the National Research Foundation (NRF), grant number 217301592 and The APC was funded by Cape Peninsula University of Technology (CPUT).
Institutional Review Board Statement
Not applicable.
Informed Consent Statement
Not applicable.
Data Availability Statement
Not applicable.
Acknowledgments
The authors would want to thank the Southern African Systems Analysis Centre (SASAC) through the National Research Foundation (NRF), the South African Department of Agriculture, Land Reform and Rural Development (DALRRD), and Cape Peninsula University of Technology (CPUT) for the support. The dataset was obtained from the Agricultural Research Council (ARC) and the South African Weather Service (SAWS). The opinions expressed in this study and the conclusions arrived at, are those of the authors, and are not necessarily to be attributed to the NRF.
Conflicts of Interest
The authors declare no conflict of interest. The funders had no role in the design of the study; in the collection, analyses, or interpretation of data; in the writing of the manuscript, or in the decision to publish the results.
References
- IPCC (Intergovernmental Panel on Climate Change). Climate Change 2007: Synthesis Report. Contribution of Working Groups I, II and III to the Fourth Assessment Report of the Intergovernmental Panel on Climate Change; Pachauri, R.K., Reisinger, A., Eds.; IPCC: Geneva, Switzerland, 2007. [Google Scholar]
- Nhamo, L.; Mathcaya, G.; Mabhaudhi, T.; Nhlengethwa, S.; Nhemachena, C.; Mpandeli, S. Cereal Production Trends under Climate Change: Impacts and Adaptation Strategies in Southern Africa. Agriculture 2019, 9, 30. [Google Scholar] [CrossRef] [Green Version]
- BFAP (Bureau for Food and Agricultural Policy). Policy Brief on the 2015/2016 Drought; BFAP: Pretoria, South Africa, 2016; pp. 1–44. [Google Scholar]
- Cogato, A.; Meggio, F.; Migliorati, M.D.A.; Marinello, F. Extreme Weather Events in Agriculture: A Systematic Review. Sustainability 2019, 11, 2547. [Google Scholar] [CrossRef] [Green Version]
- Van Koppen, B.; Nhamo, L.; Cai, X.; Gabriel, M.J.; Sekgala, M.; Shikwambana, S.; Tshikolomo, K.; Nevhutanda, S.; Matlala, B.; Manyama, D. Smallholder Irrigation Schemes in the Limpopo Province, South Africa; International Water Management Institute: Gujarat, India, 2017. [Google Scholar] [CrossRef]
- FAO (Food and Agriculture Organization of the United Nations). World Agriculture: Towards 2015/2030. An FAO Perspective. Food and Agriculture Organization of the United Nations: Rome, Italy; Earthscan: London, UK, 2003. [Google Scholar]
- Brown, M.E.; Funk, C.C. Food security under climate change. Science 2008, 319, 580–581. [Google Scholar] [CrossRef] [Green Version]
- Godfray, H.C.J.; Crute, I.R.; Haddad, L.; Lawrence, D.; Muir, J.F.; Nisbett, N.; Pretty, J.; Robinson, S.; Toulmin, C.; Whiteley, R. The future of the global food system. Philos. Trans. R. Soc. Biol. Sci. 2010, 365, 2769–2777. [Google Scholar] [CrossRef] [PubMed] [Green Version]
- Hanjra, M.A.; Qureshi, M.E. Global water crisis and future food security in an era of climate change. Food Policy 2010, 35, 365–377. [Google Scholar] [CrossRef]
- Clements, R.; Haggar, J.; Quezada, A.; Torres, J. Technologies for Climate Change Adaptation—Agriculture Sector; Zhu, X., Ed.; UNEP Risø Centre: Roskilde, Denmark, 2011. [Google Scholar]
- UNECA (United Nations Economic Commission for Africa). Global Environmental Outlook 2000 (GEO); UNEP: Addis Ababa, Ethiopia; Earthscan: London, UK, 2002. [Google Scholar]
- Schilling, J.; Hertig, E.; Tramblay, Y.; Scheffran, J. Climate change vulnerability, water resources and social implications in North Africa. Reg. Environ. Chang. 2020, 20, 15. [Google Scholar] [CrossRef] [Green Version]
- Camill, P. Global Change. Nat. Educ. Knowl. 2010, 3, 49. [Google Scholar]
- IPCC (Intergovernmental Panel on Climate Change). Climate Change 2001: The Scientific Basis. Contribution of Working Group I to the Third Assessment Report of the Intergovernmental Panel on Climate Change; Houghton, J.T., Ding, Y., Griggs, D.J., Noguer, M., van der Linden, P.J., Dai, X., Maskell, K., Johnson, C.A., Eds.; Cambridge University Press: Cambridge, UK; New York, NY, USA, 2001. [Google Scholar]
- Davis, C.; Archer, E.; Engelbreht, F.; Landman, W.; Stevens, N.; Sinden, L.A.; Nkambule, C.; Maserumule, R.; van der Merwe, M. A Climate Change Handbook for North-Eastern South Africa; Council for Scientific and Industrial Research (CSIR): Pretoria, South Africa, 2010; Available online: www.sarva.org.za/k2c (accessed on 20 September 2020).
- Turral, H.; Burke, J.; Faurés, J. Climate Change, Water and Food Security. FAO Water Report 36; Food and Agriculture Organization of the United Nations (FAO): Rome, Italy, 2011. [Google Scholar]
- Gleick, P.H. Global freshwater resources: Soft-path solutions for the 21st century. Science 2003, 302, 1524–1528. [Google Scholar] [CrossRef] [Green Version]
- Parry, M.; Arnell, N.; McMichael, T.; Nicholls, R.; Martens, P.; Kovats, S.; Livermore, M.; Rosenzweig, C.; Iglesias, A.; Fischer, G. Millions at risk: Defining critical climate change threats and targets. Glob. Environ. Chang. 2001, 11, 181–183. [Google Scholar] [CrossRef]
- Petrie, B.; Chapman, A.; Midgley, A.; Parker, A.; Risk, R. Vulnerability and Resilience in the Limpopo River Basin System: Climate Change, Water and Biodiversity—A Synthesis. For the USAID Southern Africa “Resilience in the Limpopo River Basin” (RESILIM) Program; One World Sustainable Investments: Cape Town, South Africa, 2015. [Google Scholar]
- LDA (Limpopo Department of Agriculture). Department of Agriculture Strategic Plan 2005–2010; Limpopo Provincial Government: Polokwane, South Africa, 2005.
- IDP (Integrated Development Plan of the Limpopo Department of Agriculture). Unpublished Data Base of Limpopo Department of Agriculture; Limpopo Provincial Government: Polokwane, South Africa, 2012.
- DFED (Department of Finance and Economic Development). Limpopo State of the Environment Report (Phase 1). Unpublished Report of the Limpopo Department of Finance and Economic Development; Limpopo Provincial Government: Polokwane, South Africa, 2004.
- Watts, L.; Calver, A. Effects of Spatially-Distributed Rainfall on Runoff for a Conceptual Catchment. Hydrol. Res. 1991, 22, 1–14. [Google Scholar] [CrossRef]
- Childs, C. Interpolation surfaces in ArcGIS spatial analyst. ArcUser 2004, 3235, 32–35. [Google Scholar]
- Lu, G.Y.; Wong, D.W. An adaptive inverse-distance weighting spatial interpolation technique. Comput. Geosci. 2008, 34, 1044–1055. [Google Scholar] [CrossRef]
- Chen, F.-W.; Liu, C.-W. Estimation of the spatial rainfall distribution using inverse distance weighting (IDW) in the middle of Taiwan. Paddy Water Environ. 2012, 10, 209–222. [Google Scholar] [CrossRef]
- Perry, M.; Hollis, D. The development of a new set of long-term climate averages for the UK. Int. J. Clim. 2005, 25, 1023–1039. [Google Scholar] [CrossRef]
- Garcia, M.; Peters-Lidard, C.D.; Goodrich, D.C. Spatial interpolation of precipitation in a dense gauge network for monsoon storm events in the South Western United States. Water Resour. Res. 2008, 44, 14. [Google Scholar] [CrossRef] [Green Version]
- Willmott, C.J.; Feddema, J.J. A More Rational Climatic Moisture Index. Prof. Geogr. 1992, 44, 84–88. [Google Scholar] [CrossRef]
- Holloway, A. Drought Emergency, Yes... Drought Disaster, No: Southern Africa 1991–1993. Camb. Rev. Int. Aff. 2000, 14, 254–276. [Google Scholar] [CrossRef]
- Rouault, M.; Richard, Y. Intensity and spatial extension of drought at different time scales since 1921 in South Africa. WaterSA 2003, 29, 489–500. [Google Scholar]
- Davis, C. Climate Risk and Vulnerability: A Handbook for Southern Africa; Council for Scientific and Industrial Research (CSIR): Pretoria, South Africa, 2011. [Google Scholar]
- Kruger, A.C.; Shongwe, S. Temperature trends in South Africa: 1960–2003. Int. J. Clim. 2004, 24, 1929–1945. [Google Scholar] [CrossRef]
- FAO (Food and Agriculture Organization of the United Nations). Irrigation in Africa in Figures: AQUASTAT Survey. FAOWater Reports 29; Food and Agriculture Organization of the United Nations (FAO): Rome, Italy, 2005. [Google Scholar]
- Vörösmarty, C.J.; Douglas, E.M.; Green, P.A.; Revenga, C. Geospatial Indicators of Emerging Water Stress: An Application to Africa. Ambio 2005, 34, 230–236. [Google Scholar] [CrossRef]
- Khalili, N.; Davari, K.; Ansari, H.; Alizadeh, A. The management of supplementary irrigation for rainfed wheat during the drought periods using crop moisture index (the case study: Bojnurd). J. Water Soil (Agric. Sci. Technol.) 2011, 24, 1254–1264. [Google Scholar]
- Mpandeli, S.; Nhamo, L.; Moeletsi, M.; Masupha, T.; Magidi, J.; Tshikolomo, K.; Liphadzi, S.; Naidoo, D.; Mabhaudhi, T. Assessing climate change and adaptive capacity at local scale using observed and remotely sensed data. Weather. Clim. Extremes 2019, 26, 100240. [Google Scholar] [CrossRef]
Figure 1.
The Mopani and Vhembe Districts in the Limpopo Province.

Figure 2.
Seasonal average rainfall in the study districts indicating high rainfall variability.

Figure 3.
Average rainfall for 1960, 1970, 1980, 1990, 2000, 2010, and 2018 in the Mopani and Vhembe Districts, Limpopo Province.
Figure 3.
Average rainfall for 1960, 1970, 1980, 1990, 2000, 2010, and 2018 in the Mopani and Vhembe Districts, Limpopo Province.

Figure 4.
Minimum temperature for 1960, 1970, 1980, 1990, 2000, 2010, and 2018 in the Mopani and Vhembe Districts.
Figure 4.
Minimum temperature for 1960, 1970, 1980, 1990, 2000, 2010, and 2018 in the Mopani and Vhembe Districts.

Figure 5.
Maximum temperature for 1960, 1970, 1980, 1990, 2000, 2010, and 2018 in the Mopani and Vhembe Districts.
Figure 5.
Maximum temperature for 1960, 1970, 1980, 1990, 2000, 2010, and 2018 in the Mopani and Vhembe Districts.

Figure 6.
Climatic Moisture Content (CMI) for 1960, 1970, 1980, 1990, 2000, 2010, and 2018 in the Mopani and Vhembe.
Figure 6.
Climatic Moisture Content (CMI) for 1960, 1970, 1980, 1990, 2000, 2010, and 2018 in the Mopani and Vhembe.

Figure 7.
Correlation between rainfall variability and cereal production in southern Arica over time as influenced by increased aridity.
Figure 7.
Correlation between rainfall variability and cereal production in southern Arica over time as influenced by increased aridity.


Table 1.
The average annual rainfall in the Mopani and Vhembe districts.
| Station | 1960 | 1965 | 1970 | 1975 | 1980 | 1985 | 1990 | 1995 | 2000 | 2005 | 2010 | 2015 | 2018 |
|---|---|---|---|---|---|---|---|---|---|---|---|---|---|
| Grenshoek (Sape) | 1294.0 | 1313.3 | 831.8 | 1479.5 | 1659.1 | 1339.6 | 989.7 | 1413.6 | 2420.0 | 722.3 | 769.4 | 489.5 | 545.0 |
| Phalaborwa—AER | 663.9 | 323.3 | 303.1 | 836.6 | 847.9 | 765.3 | 550.4 | 641.5 | 845.0 | 386.1 | 744.1 | 279.7 | 280.6 |
| Giyani-Amfarm | 645.3 | 453.0 | 305.3 | 724.3 | 981.6 | 767.4 | 488.0 | 423.3 | 1156.0 | 614.8 | 563.4 | 272.3 | 393.4 |
| Letaba | 704.8 | 242.9 | 179.3 | 429.6 | 683.6 | 426.1 | 581.3 | 354.1 | 901.4 | 364.5 | 585.1 | 293.1 | 459.7 |
| Mopani | 763.7 | 353.8 | 264.4 | 813.4 | 796.6 | 950.8 | 442.8 | 491.5 | 1504.8 | 555.5 | 801.1 | 386.7 | 350.5 |
| Bavaria Fruit Estates | 1173.3 | 749.7 | 491.2 | 873.3 | 833.4 | 1339.6 | 702.4 | 616.9 | 1007.0 | 337.9 | 635.6 | 755.4 | 868.2 |
| Mopani: Sekgosese | 688.2 | 375.2 | 430.6 | 724.5 | 961.2 | 752.8 | 600.7 | 629.7 | 2044.9 | 641.9 | 781.6 | 407.7 | 588.8 |
| Thohoyandou | 1198.2 | 812.8 | 635.2 | 939.4 | 921.0 | 975.8 | 902.4 | 1191.3 | 170.3 | 802.5 | 1327.0 | 715.6 | 1026.0 |
| Messina Proefplaas | 302.4 | 204.6 | 352.5 | 538.3 | 473.1 | 499.4 | 353.8 | 248.5 | 1010.6 | 361.5 | 669.2 | 322.0 | 386.6 |
| Levubu (S) | 1233.3 | 728.5 | 547.7 | 1436.9 | 1327.9 | 1181.3 | 790.8 | 1100.4 | 2381.2 | 843.6 | 1331.2 | 670.4 | 934.6 |
| Venda: Tshiombo | 858.2 | 552.3 | 524.4 | 1208.2 | 1014.0 | 1183.6 | 760.9 | 1135.0 | 2996.8 | 845.1 | 1501.0 | 578.8 | 517.1 |
| Venda: Lwamondo | 1160.7 | 847.4 | 488.3 | 1408.1 | 1132.7 | 1258.3 | 874.6 | 1129.1 | 2607.1 | 704.2 | 1309.5 | 552.5 | 708.5 |
| Mean | 890.5 | 579.7 | 446.2 | 951.0 | 969.3 | 953.3 | 669.8 | 781.2 | 1587.1 | 598.3 | 918.2 | 477.0 | 588.2 |
| SEM | 90.4 | 93.1 | 52.1 | 102.0 | 88.2 | 90.9 | 57.3 | 112.3 | 253.0 | 56.2 | 99.0 | 50.7 | 70.6 |
Table 2.
Statistical regression analysis for annual rainfall in the Mopani and Vhembe districts.
| N = 944 | R2 = 0.0003 | |||||
|---|---|---|---|---|---|---|
| b * | Std. Err. of b * | b | Std. Err. of b | t(942) | p-Value | |
| Intercept | 1555.82 | 1619.28 | 0.96 | 0.337 | ||
| Time | −0.017 | 0.033 | −0.42 | 0.81 | −0.52 | 0.604 |
Table 3.
The average annual minimum temperature in the Mopani and Vhembe districts.
| Scheme 1960. | 1960 | 1965 | 1970 | 1975 | 1980 | 1985 | 1990 | 1995 | 2000 | 2005 | 2010 | 2015 | 2018 |
|---|---|---|---|---|---|---|---|---|---|---|---|---|---|
| Grenshoek (Sape) | 12.5 | 15.1 | 15.0 | 15.9 | 13.8 | 16.0 | 18.6 | 17.7 | 14.9 | 17.1 | 17.1 | 17.2 | 17.6 |
| Phalaborwa—AER | 13.8 | 11.9 | 13.9 | 12.5 | 16.3 | 12.5 | 13.2 | 13.0 | 15.5 | 13.1 | 13.4 | 13.3 | 13.5 |
| Giyani—Amfarm | 13.5 | 14.7 | 15.3 | 15.2 | 15.1 | 16.0 | 15.1 | 15.0 | 14.2 | 15.9 | 14.2 | 15.0 | 14.9 |
| Letaba | 14.2 | 15.7 | 16.2 | 15.0 | 15.3 | 17.0 | 16.9 | 16.3 | 15.9 | 15.8 | 15.9 | 15.8 | 16.2 |
| Mopani | 14.1 | 15.4 | 16.2 | 15.1 | 15.1 | 16.1 | 16.5 | 16.1 | 15.7 | 16.1 | 15.6 | 15.6 | 15.8 |
| Bavaria Fruit Estates | 13.3 | 12.5 | 13.9 | 13.7 | 13.9 | 14.1 | 15.3 | 16.0 | 15.5 | 15.4 | 15.2 | 14.5 | 14.9 |
| Mopani: Sekgosese | 13.0 | 14.3 | 14.6 | 14.3 | 14.6 | 14.2 | 14.6 | 13.9 | 14.3 | 15.5 | 16.3 | 18.2 | 20.6 |
| Thohoyandou | 14.0 | 15.2 | 15.9 | 15.2 | 15.8 | 15.5 | 15.3 | 15.9 | 15.1 | 16.2 | 16.9 | 17.1 | 16.9 |
| Messina Proefplaas | 15.1 | 15.0 | 15.4 | 14.8 | 15.0 | 15.7 | 15.4 | 15.9 | 16.0 | 16.2 | 15.6 | 15.7 | 15.7 |
| Levubu (S) | 13.7 | 17.5 | 18.1 | 17.2 | 14.9 | 18.1 | 18.2 | 18.3 | 14.4 | 18.9 | 18.0 | 17.8 | 17.4 |
| Venda: Tshiombo | 14.1 | 17.9 | 18.7 | 18.0 | 16.0 | 17.8 | 17.9 | 18.1 | 14.7 | 18.6 | 17.9 | 18.3 | 17.8 |
| Venda: Lwamondo | 13.8 | 14.9 | 15.4 | 14.6 | 15.0 | 15.5 | 15.2 | 16.0 | 15.6 | 16.3 | 14.7 | 14.7 | |
| Mean | 13.7 | 15.0 | 15.7 | 15.1 | 15.1 | 15.7 | 16.0 | 16.0 | 15.2 | 16.3 | 15.9 | 16.1 | 16.3 |
| SEM | 0.2 | 0.5 | 0.4 | 0.4 | 0.2 | 0.5 | 0.5 | 0.5 | 0.2 | 0.4 | 0.4 | 0.5 | 0.6 |
Table 4.
Statistical regression analysis for minimum temperature in the Mopani and Vhembe districts.
Table 4.
Statistical regression analysis for minimum temperature in the Mopani and Vhembe districts.
| N = 944 | R2 = 0.005 | |||||
|---|---|---|---|---|---|---|
| b * | Std. Err. of b* | b | Std. Err. of b | t(942) | p-Value | |
| Intercept | 0.33 | 6.77 | 0.05 | 0.957 | ||
| Time | 0.07 | 0.033 | 0.01 | 0.003 | 2.14 | 0.032 |
Table 5.
The average annual maximum temperature in the Mopani and Vhembe districts.
| Station | 1960 | 1965 | 1970 | 1975 | 1980 | 1985 | 1990 | 1995 | 2000 | 2005 | 2010 | 2015 | 2018 |
|---|---|---|---|---|---|---|---|---|---|---|---|---|---|
| Grenshoek (Sape) | 26.7 | 27.0 | 27.6 | 26.4 | 26.1 | 26.0 | 25.3 | 25.4 | 24.5 | 27.3 | 28.5 | 27.5 | 28.1 |
| Phalaborwa—AER | 27.6 | 29.8 | 29.6 | 28.0 | 27.7 | 29.4 | 29.1 | 29.2 | 28.6 | 29.7 | 30.8 | 31.7 | 30.2 |
| Giyani—Amfarm | 27.4 | 27.2 | 28.4 | 27.6 | 27.6 | 28.4 | 26.9 | 28.5 | 27.8 | 27.9 | 27.3 | 29.8 | 29.7 |
| Letaba | 28.5 | 30.8 | 31.3 | 27.9 | 27.4 | 30.6 | 30.6 | 29.7 | 28.8 | 29.3 | 30.0 | 31.4 | 30.1 |
| Mopani | 28.1 | 30.1 | 30.8 | 27.4 | 27.1 | 29.8 | 30.3 | 29.7 | 29.0 | 29.3 | 29.4 | 31.1 | 30.1 |
| Bavaria Fruit Estates | 26.1 | 26.4 | 27.4 | 26.5 | 27.1 | 27.8 | 28.0 | 28.5 | 27.6 | 29.7 | 28.9 | 28.8 | 27.6 |
| Mopani: Sekgosese | 27.0 | 26.9 | 27.8 | 26.2 | 26.3 | 26.4 | 26.5 | 26.3 | 24.7 | 27.0 | 30.4 | 34.8 | 38.2 |
| Thohoyandou | 27.4 | 26.6 | 27.7 | 25.8 | 26.1 | 26.9 | 27.5 | 27.3 | 24.9 | 28.4 | 26.9 | 28.7 | 29.3 |
| Messina Proefplaas | 29.6 | 29.8 | 30.7 | 29.4 | 29.7 | 29.5 | 30.1 | 30.2 | 28.6 | 29.5 | 29.4 | 33.6 | 32.8 |
| Levubu (S) | 27.3 | 26.8 | 27.9 | 25.9 | 25.9 | 26.2 | 26.4 | 26.5 | 25.1 | 27.7 | 27.5 | 29.2 | 28.2 |
| Venda: Tshiombo | 27.5 | 26.6 | 27.7 | 25.8 | 26.1 | 26.7 | 27.2 | 27.3 | 26.5 | 27.8 | 27.4 | 28.3 | 28.5 |
| Venda: Lwamondo | 27.4 | 26.8 | 27.9 | 25.9 | 26.0 | 26.2 | 26.7 | 27.0 | 25.6 | 28.1 | 28.8 | 30.2 | 28.7 |
| Mean | 27.6 | 27.9 | 28.7 | 26.9 | 26.9 | 27.8 | 27.9 | 28.0 | 26.8 | 28.5 | 28.8 | 30.4 | 30.1 |
| SEM | 0.3 | 0.5 | 0.4 | 0.3 | 0.3 | 0.5 | 0.5 | 0.5 | 0.5 | 0.3 | 0.4 | 0.6 | 0.8 |
Table 6.
Statistical regression analysis for maximum temperature in the Mopani and Vhembe districts.
Table 6.
Statistical regression analysis for maximum temperature in the Mopani and Vhembe districts.
| N = 944 | R2 = 0.066 | |||||
|---|---|---|---|---|---|---|
| b * | Std. Err. of b * | b | Std. Err. of b | t(942) | p-Value | |
| Intercept | −22.97 | 6.21 | −3.70 | 0.0002 | ||
| Time | 0.268 | 0.03 | 0.03 | 0.003 | 8.18 | <0.0001 |
Table 7.
Climatic Moisture Index (CMI) for the Mopani and Vhembe districts.
| Station | 1960 | 1970 | 1980 | 1990 | 2000 | 2010 | 2018 |
|---|---|---|---|---|---|---|---|
| Grenshoek (Sape) | −0.2 | −0.5 | 0.1 | −0.3 | 0.8 | −0.5 | −0.7 |
| Phalaborwa-AER | −0.6 | −0.8 | −0.4 | −0.7 | −0.5 | −0.6 | −0.8 |
| Amfarm | −0.7 | −0.9 | −0.6 | −0.8 | −0.5 | −0.8 | −0.8 |
| Letaba | −0.7 | −0.9 | −0.7 | −0.8 | −0.6 | −0.8 | −0.8 |
| Mopani | −0.7 | −0.9 | −0.6 | −0.8 | −0.4 | −0.7 | −0.9 |
| Bavaria Fruit Estates | −0.5 | −0.8 | −0.6 | −0.7 | −0.5 | −0.7 | −0.1 |
| Sekgosese | −0.7 | −0.8 | −0.5 | −0.7 | 0.0 | −0.7 | −0.8 |
| Thohoyandou | −0.3 | −0.6 | −0.4 | −0.4 | −0.9 | −0.1 | −0.4 |
| Messina Proefplaas | −0.8 | −0.8 | −0.7 | −0.8 | −0.4 | −0.6 | −0.8 |
| L.Trichard: Levubu (S) | −0.5 | −0.8 | −0.4 | −0.6 | 0.2 | −0.4 | −0.6 |
| Venda: Tshiombo | −0.6 | −0.8 | −0.5 | −0.6 | 0.4 | −0.3 | −0.8 |
| Venda: Lwamondo | −0.5 | −0.8 | −0.4 | −0.6 | 0.3 | −0.5 | −0.7 |
| Zebediela | −0.6 | −0.8 | −0.4 | −0.6 | −0.5 | −0.6 | −0.8 |
| Makhado: All Days | −0.7 | −0.8 | −0.6 | −0.9 | −0.5 | −0.8 | −0.9 |
| Polokwane: mmondale | −0.8 | −0.8 | −0.6 | −0.7 | −0.5 | −0.7 | −0.8 |
| AL3 Boerdery | −0.8 | −0.9 | −0.6 | −0.7 | −0.6 | −0.7 | −0.8 |
| Average | −0.6 | −0.8 | −0.5 | −0.7 | −0.3 | −0.6 | −0.7 |
Table 8.
Statistical regression analysis for CMI in the Mopani and Vhembe districts.
| N = 944 | R2 = 0.001 | |||||
|---|---|---|---|---|---|---|
| b * | Std. Err. of b * | b | Std. Err. of b | t(942) | p-Value | |
| Intercept | −1.69 | 1.14 | −1.48 | 0.138 | ||
| Time | 0.031 | 0.033 | 0.001 | 0.001 | 0.95 | 0.340 |
Table 9.
Context-based adaptation strategies in Mopani and Vhembe Districts.
| Climate Change Impact | Recommended Adaptation Strategy |
|---|---|
| Shortened rain season (Starting around December and ending in March) |
|
| Intra-seasonal dry spells during the cropping season |
|
| Increasing temperatures and heatwaves |
|
| Increased frequency and intensity of droughts |
|
| Intra and inter-seasonal rainfall variability |
|
| Increased risk of flooding-(flash floods/cyclones) from January to March |
|
Adapted from Mpandeli et al. [37].
Publisher’s Note: MDPI stays neutral with regard to jurisdictional claims in published maps and institutional affiliations. |
© 2021 by the authors. Licensee MDPI, Basel, Switzerland. This article is an open access article distributed under the terms and conditions of the Creative Commons Attribution (CC BY) license (https://creativecommons.org/licenses/by/4.0/).
Share and Cite
MDPI and ACS Style
Shikwambana, S.; Malaza, N.; Shale, K. Impacts of Rainfall and Temperature Changes on Smallholder Agriculture in the Limpopo Province, South Africa. Water 2021, 13, 2872. https://doi.org/10.3390/w13202872
AMA Style
Shikwambana S, Malaza N, Shale K. Impacts of Rainfall and Temperature Changes on Smallholder Agriculture in the Limpopo Province, South Africa. Water. 2021; 13(20):2872. https://doi.org/10.3390/w13202872
Chicago/Turabian StyleShikwambana, Sydney, Ntokozo Malaza, and Karabo Shale. 2021. "Impacts of Rainfall and Temperature Changes on Smallholder Agriculture in the Limpopo Province, South Africa" Water 13, no. 20: 2872. https://doi.org/10.3390/w13202872
Note that from the first issue of 2016, this journal uses article numbers instead of page numbers. See further details here.