Article

Laboratory and Semi-Pilot Scale Study on the Electrochemical Treatment of Perfluoroalkyl Acids from Ion Exchange Still Bottoms

by
Vanessa Y. Maldonado
1,2,*,
Michael F. Becker
1,
Michael G. Nickelsen
3 and
Suzanne E. Witt
1
1
Fraunhofer USA, Inc., Center Midwest, Division for Coatings and Diamond Technologies, East Lansing, MI 48824, USA
2
Department of Chemical Engineering and Material Science, Michigan State University, East Lansing, MI 48824, USA
3
Emerging Compounds Treatment Technologies (ECT2), Portland, ME 04103, USA
*
Author to whom correspondence should be addressed.
Water 2021, 13(20), 2873; https://doi.org/10.3390/w13202873
Submission received: 27 August 2021 / Revised: 25 September 2021 / Accepted: 3 October 2021 / Published: 14 October 2021
(This article belongs to the Special Issue Removal of PFAS from Water)

Abstract

:
The ubiquitous presence of perfluoroalkyl acids (PFAAs) in the environment remains a serious environmental concern. In this study, the electrochemical oxidation (EO) of PFAAs from the waste of ion exchange (IX) still bottoms was assessed at the laboratory and semi-pilot scales, using full boron-doped diamond (BDD) electrochemical cells. Multiple current densities were evaluated at the laboratory scale and the optimum current density was used at the semi-pilot scale. The results at the laboratory scale showed >99% removal of total PFAAs with 50 mA/cm2 after 8 h of treatment. PFAAs treatment at the semi-pilot scale showed 0.8-fold slower pseudo-first-order degradation kinetics for total PFAAs removal compared to at the laboratory scale, and allowed for >94% PFAAs removal. Defluorination values, perchlorate (ClO4) generation, coulombic efficiency (CE), and energy consumption were also assessed for both scales. Overall, the results of this study highlight the benefits of a tandem concentration/destruction (IX/EO) treatment approach and implications for the scalability of EO to treat high concentrations of PFAAs.

Graphical Abstract

1. Introduction

The persistent nature, toxicity and bio-accumulation potential of per-and polyfluoroalkyl substances (PFAS) led to their classification as emerging contaminants [1,2]. Multiple treatment technologies have been developed to remove PFAS from water [3,4,5]. Separation technologies including granular activated carbon (GAC), ion exchange (IX), reverse osmosis (RO), and nanofiltration (NF) have shown high levels of PFAS removal in water [5,6,7,8]. IX was shown to be effective for removing long- and short-chain PFAS and has demonstrated higher sorption capacities and shorter contact times than GAC [3,6,9]. Although IX resins are typically intended for a single use, regenerable resins have been proposed as an alternative by: (i) enhancing the lifetime of the resins and (ii) eliminating the need for disposal or incineration of the spent resins [6]. In the regeneration process, PFAS are desorbed from the resin with a brine solution and an organic solvent (e.g., 80% methanol or ethanol) [10,11]. This solution is called the spent regenerant solution. The solvent fraction of the spent regenerant solution can be subsequently distilled, leaving a low volume of liquid waste containing high concentrations of PFAS in a brine solution, known as still bottoms, as the final product. The still bottoms can be further recycled, reduced in volume by more than 95%, and concentrated on specialized sorbents in a process called SuperloadingTM for further off-site disposal, usually performed by landfilling or incineration [6,10]. However, the previous off-site disposal options are not ideal. In the former case, PFAS migrate to landfill leachates that expand PFAS contamination to other sources [12,13,14]. For the latter, residual PFAS have been detected in the fly ash and bottom ash of the incineration process [15]. Therefore, alternative technologies are desired to target waste concentrates containing PFAS.
Destructive technologies have gained interest in recent years due to their potential for destroying PFAS. Electrochemical oxidation (EO) is one of the leading technologies that have demonstrated capability to degrade multiple contaminants in water, including PFAS [16,17,18,19,20]. In this context, electrochemical treatment could be used as a target technology for the destruction of IX still bottoms containing high concentrations of PFAS. Low volumes of highly concentrated PFAS are desirable for EO as it has been shown that the increase in concentration enhances the mass transfer of the process that leads to a higher treatment efficiency [21,22]. Moreover, the direct treatment of large volumes of water with EO, without any pre-concentration step, was shown to significantly increase treatment costs [23]. Thus, the combination of IX/EO could work as a tandem concentration/destruction approach to decrease the treatment cost of EO and eliminate PFAS from the environment.
While previous studies have assessed the electrochemical treatment of PFAS from IX still bottoms in a laboratory scale [22,24,25], the evaluation of the process at a larger scale is yet to be addressed as part of the next steps towards scaling up the EO process, which is presented in this work.
The objectives of this study were to evaluate and optimize the electrochemical treatment of perfluoroalkyl acids (PFAAs) from still bottoms at the laboratory and semi-pilot scales.

2. Materials and Methods

2.1. Materials

All chemicals used in this work were of reagent grade or higher. Perfluorooctane sulfonic acid (PFOS, >98%), perfluorooctanoic acid (PFOA, >98%), perfluorohexanesulfonic acid (PFHxS >98%), perfluorobutanoic acid (PFBA, >98%), potassium ferricyanide (K4Fe(CN)6), potassium ferrocyanide (K3Fe(CN)6), sodium carbonate (Na2CO3), and sodium chloride (NaCl) were purchased from Sigma Aldrich, St. Louis, MO, USA. A synthetic still bottoms solution and a real still bottoms solution were used in the experiments. The composition of the solutions is described in Table A1 and Table A2 in Appendix A. The real still bottoms solution was provided by Emerging Compounds Treatment Technologies (ECT2) and shipped to the Fraunhofer USA Center Midwest at Michigan State University. Samples were stored at 4 °C upon receipt.

2.2. Electrochemical Oxidation Setup

The laboratory and semi-pilot scale experiments were performed within two separate in-house build systems comprised of an electrochemical cell equipped with boron-doped diamond (BDD) rectangular-plate electrodes (Condias, Germany), power supply, peristaltic pump, reservoir tank, pH, temperature and flow rate sensors. Table A3 and Figure A1 show details of the experimental setup for both scales. The semi-pilot scale setup was built by increasing the exposed anodic surface area of the laboratory scale by a factor of 7 and maintaining a constant area-to-volume ratio (A/V) for the treated solution.
A flow rate of 6 L/min for the semi-pilot-scale setup was estimated by calculating the equivalent Reynolds number (Re) when compared to the laboratory scale setup. The Re number was determined using Equation (1) that considers the linear velocity and equivalent diameter of a parallel-plate cell [26]:
R e = 2 · Q v · ( W + S )
where Q is the flow rate (m3/s), v is the kinematic viscosity (m2/s), and W and S are the width of a rectangular plate and the inter-electrode gap.

2.3. Electrochemical Experiments

All experiments were performed in duplicate, batch mode, and under galvanostatic conditions. For the laboratory scale experiments, different current densities (10, 25, and 50 mA/cm2) were evaluated to determine the optimum current density to treat a synthetic still bottoms solution. For the semi-pilot-scale experiments, only the optimum current density found with the laboratory scale setup was used. Control experiments, without the application of current were also performed in duplicate. Experiments were typically performed for 8 h and samples were collected over time. Typically, 10 mL of sample was collected at each time point, transferred to polypropylene tubes, and stored in the refrigerator at 4 ° C until delivered for PFAS analysis. The conductivity of all solutions used was sufficiently high and the addition of electrolyte was not necessary.

2.4. Analytical Methods

During the electrochemical experiments pH, temperature, conductivity, flow rate, voltage, fluoride (F), total organic carbon (TOC), perchlorate (ClO4), and PFAS were monitored over time. TOC was determined using USEPA approved HACHTM standard methods. F was analyzed via ion chromatography using EPA Method 9056A, and ClO4 was analyzed via ion chromatography using EPA Method 314.0. The pH and conductivity were measured with an SG23-B SevenGo DuoTM Series Portable Meter (Mettler Toledo). Temperature and flow rate were monitored using in-house designed control systems.
PFAS analysis was performed following a modified EPA 537 method by Trident Labs, Inc (Holland, MI, USA). The description of the method is provided in Appendix B. The calibration standards used for PFAS quantification are shown in Table A4. The PFAS precursors 4:2 fluorotelomer sulfonate (4:2 FTS), 6:2 fluorotelomer sulfonate (6:2 FTS), 8:2 fluorotelomer sulfonate (8:2 FTS), N-ethyl perfluorooctane sulfonamido acetic acid (NEtFOSAA), and N-methyl perfluorooctane sulfonamido acetic acid (NMeFOSAA) were below detection levels (<2000 ng/L) for all the synthetic still bottoms due to the dilution factor used in this work (10,000×), which was necessary to achieve concentrations within the linear dynamic range and quantify PFAS.

3. Results and Discussion

3.1. Laboratory Scale Evaluation

3.1.1. General Observations

During the electrochemical treatment of the synthetic still bottoms solution in a laboratory scale setup, the applied voltages for the current densities evaluated ranged from 4 to 8 V. The pH of the solution was 7.70 ± 1. After 8 h of treatment, the pH decreased by 15% with 10 and 25 mA/cm2, and increased by 5% with 50 mA/cm2. The TOC removal was 19, 27, and 67% after 8 h of electrochemical treatment with 10, 25, and 50 mA/cm2. The TOC evolution over time is depicted in Figure A2.
No decrease in PFAAs concentrations was observed in the control (no-current) experiments, indicating that adsorption of PFAAs by the system components was not significant. However, a layer of foam was formed during all the electrochemical experiments due to the electrochemical generation of hydrogen and oxygen at the electrodes [27]. The layer of foam substantially decreased in thickness after 4 h and a small but persistent layer remained throughout the rest of the experimental time in all experiments. This will be addressed in following sections.

3.1.2. Influence of Current Density on PFAAs Removal

The influence of the current density on the electrochemical oxidation of PFAAs in a synthetic still bottoms solution was studied at the laboratory scale. Figure 1a shows the decrease in PFAAs concentration over time with the application of multiple current densities. The decrease in concentration was proportional to the applied current density and led to a total PFAAs removal of 46, 75, and 99% with 10, 25, and 50 mA/cm2 after 8 h of treatment, respectively. The decrease in concentration of total PFAAs followed a pseudo-first-order degradation rate and the corresponding values for the surface area normalized rate constants (kSA) are depicted in Table A5. Figure A3 shows the concentration values for individual PFAAs over time. In general, long-chain PFAAs decreased in concentration faster than short-chain PFAAs. The increase in current density allowed for a higher removal of short-chain PFAAs. PFBA presented the slowest removal rate of the PFAAs detected and although a current density of 10 mA/cm2 was not able remove it, 50 mA/cm2 allowed for >95% removal of PFBA and >99% removal for the remaining PFAAs. In addition, during the electrochemical treatment with 25 and 50 mA/cm2, the shorter-chain PFAAs—perfluoroheptanoic acid (PFHpA), perfluorohexanoic acid (PFHxA), and perfluoropentanoic acid (PFPeA)—presented transient increases in concentration. The latter results from the oxidation of the head group of longer-chain perfluorinated carboxylates and sulfonates that release CF2 moieties leading to shorter-chain PFAAs, which are consecutively oxidized under the same unzipping mechanism [22,28].
The release of CF2 moieties during the electrochemical oxidation of PFAAs leads to the generation of F, which increases over time during the PFAAs degradation process. Figure 1b depicts the F generation over time with multiple current densities. The pseudo-first-order fluoride generation rate constant and r2 values are shown in Table A6. Although the concentration of F increased with the applied current density, the generation rate constant was inversely proportional to the applied current density (Table A6) and PFAAs removal. For instance, the F generation rate was 3.5-fold slower with 50 mA/cm2 when compared to 10 mA/cm2. In addition, the F concentration values were used to quantify the defluorination percentage over time. The defluorination values are shown in Figure A4. The values were calculated using Equation (2):
D e f l u o r i n a t i o n ( % ) = C F [ t ] C F [ 0 ] n F , i × ( C 0 C t ) t
where C F [ t ] and C F [ 0 ] are the concentrations of F (mM) at time t and 0, respectively; C 0 and C t are the concentrations of PFAAs (mM) at time 0 and t, respectively; and n is the number of fluorine atoms in each PFAAs molecule present in the treated solution [24]. Similarly to the trend observed with F generation, the defluorination percentage increased with the applied current density. However, this trend was true only for the first 2 h of treatment. The defluorination percentage determined for higher treatment time points was independent of the applied current density and the average value for all the applied current densities was 10.20 ± 9% and 12.60 ± 6% for 4 and 8 h of electrochemical treatment, respectively. Nevertheless, the defluorination values with different current densities were statistically different (p < 0.05) for all treatment times. Low defluorination ratios for still bottoms electrochemical treatment were also observed by Wang et al. [24].
The decrease in the F generation rate with higher current densities and the low defluorination values attained during the electrochemical treatment can be attributed to multiple factors. One of them is the inhibition of defluorination due to the high concentration of brine that corresponded to 4% NaCl for the synthetic solutions. Schaefer et al. evaluated the impact of different brine solutions on the defluorination in the electrochemical treatment of PFAS and observed a lower F release for high concentrations of NaCl when compared to other brine solutions [22]. Both chloride Cl oxidation and PFAAs defluorination occurs through direct anodic oxidation [29,30]. In addition, the defluorination of PFAAs is rate-limited by direct oxidation at the anode surface [22]. Therefore, the low defluorination rate of PFAAs is likely attributed to the competitive reaction for chloride oxidation that ultimately leads to ClO4 generation, which was shown to be the primary Cl transformation product [22]. Incomplete oxidation of PFAAs, evidenced by the generation of shorter-chain PFAAs (Figure A3), was also ascribed to the low defluorination percentages. Other factors including recombination of F with additional constituents in the solution, generation of unknown byproducts (e.g., fluoroalkane), and possible calcium fluoride (CaF2) precipitation could be associated with the low defluorination values. However, further investigation is required. The discrepancies between the high removal percentage and low defluorination rates of PFAAs with 25 and 50 mA/cm2 could have arisen due to the fact that some PFAAs were partially removed due to their accumulation in the layer of foam that was generated during the electrochemical experiments. The high concentrations of PFAAs, together with the electrochemically generated hydrogen and oxygen, likely facilitated foam partitioning. Therefore, a percentage of the removal of the highly hydrophobic PFAAs could have been attributed to their accumulation in the foam. This hypothesis is discussed in Section 3.2.

3.1.3. Electrochemical Treatment of Real Still Bottoms

The current density that allowed for the highest PFAAs removal in the synthetic still bottoms solution (50 mA/cm2) was used to treat a real still bottoms sample at the laboratory scale. The treatment time was increased to 24 h to guarantee removal of short-chain PFAAs, given their slower degradation kinetics [31]. Figure 2 depicts the concentration of individual PFAS over time. Long-chain PFAAs, short-chain PFAAs, and PFAA-precursors were present in the sample. The PFAS characterization of the sample is depicted in Table A2. Removal efficiencies were higher for long-chain PFAAs than for short-chain PFAAs. After 24 h of treatment, the concentration of total PFAS was reduced by 93%. In particular, long-chain PFAAs were removed by 95%, short-chain PFAAs by 87%, and PFAA precursors by 99%. Transient increases were observed for perfluorobutanesulfonic acid (PFBS), perfluoropentanoic acid (PFPeA), pefluoropentanesulfonic acid (PFPeS), perflueorohexanoic acid (PFHxA), and perfluoroheptanoic acid (PFHpA), likely ascribed to the degradation of precursor compounds and longer-chain PFAAs [18,32].
Moreover, the kSA for total PFAS degradation was determined and corresponded to 4.3 × 10 6 m/s, 7-fold lower than the kSA obtained for the synthetic spent regenerant solution ( 1.4 × 10 5 m/s) treated with the same current density. A plausible explanation for the slower kinetics for PFAS removal in the real still bottoms is the interference of the additional organic matter and co-contaminants present in the matrix. The presence of organic matter and co-contaminants interferes with the electrochemical degradation process of target contaminants, usually by competitive oxidation [23,33,34]. The slower removal of PFAS was in accordance with a slower TOC removal, which was reduced by 18.5% after 8 h of treatment of the real still bottoms solution compared to 67% in the synthetic solution. Lastly, unlike the synthetic still bottoms, the real solution presented high concentration of PFAA-precursors that had to be oxidized together with PFAAs, adding more organic content to the solution.

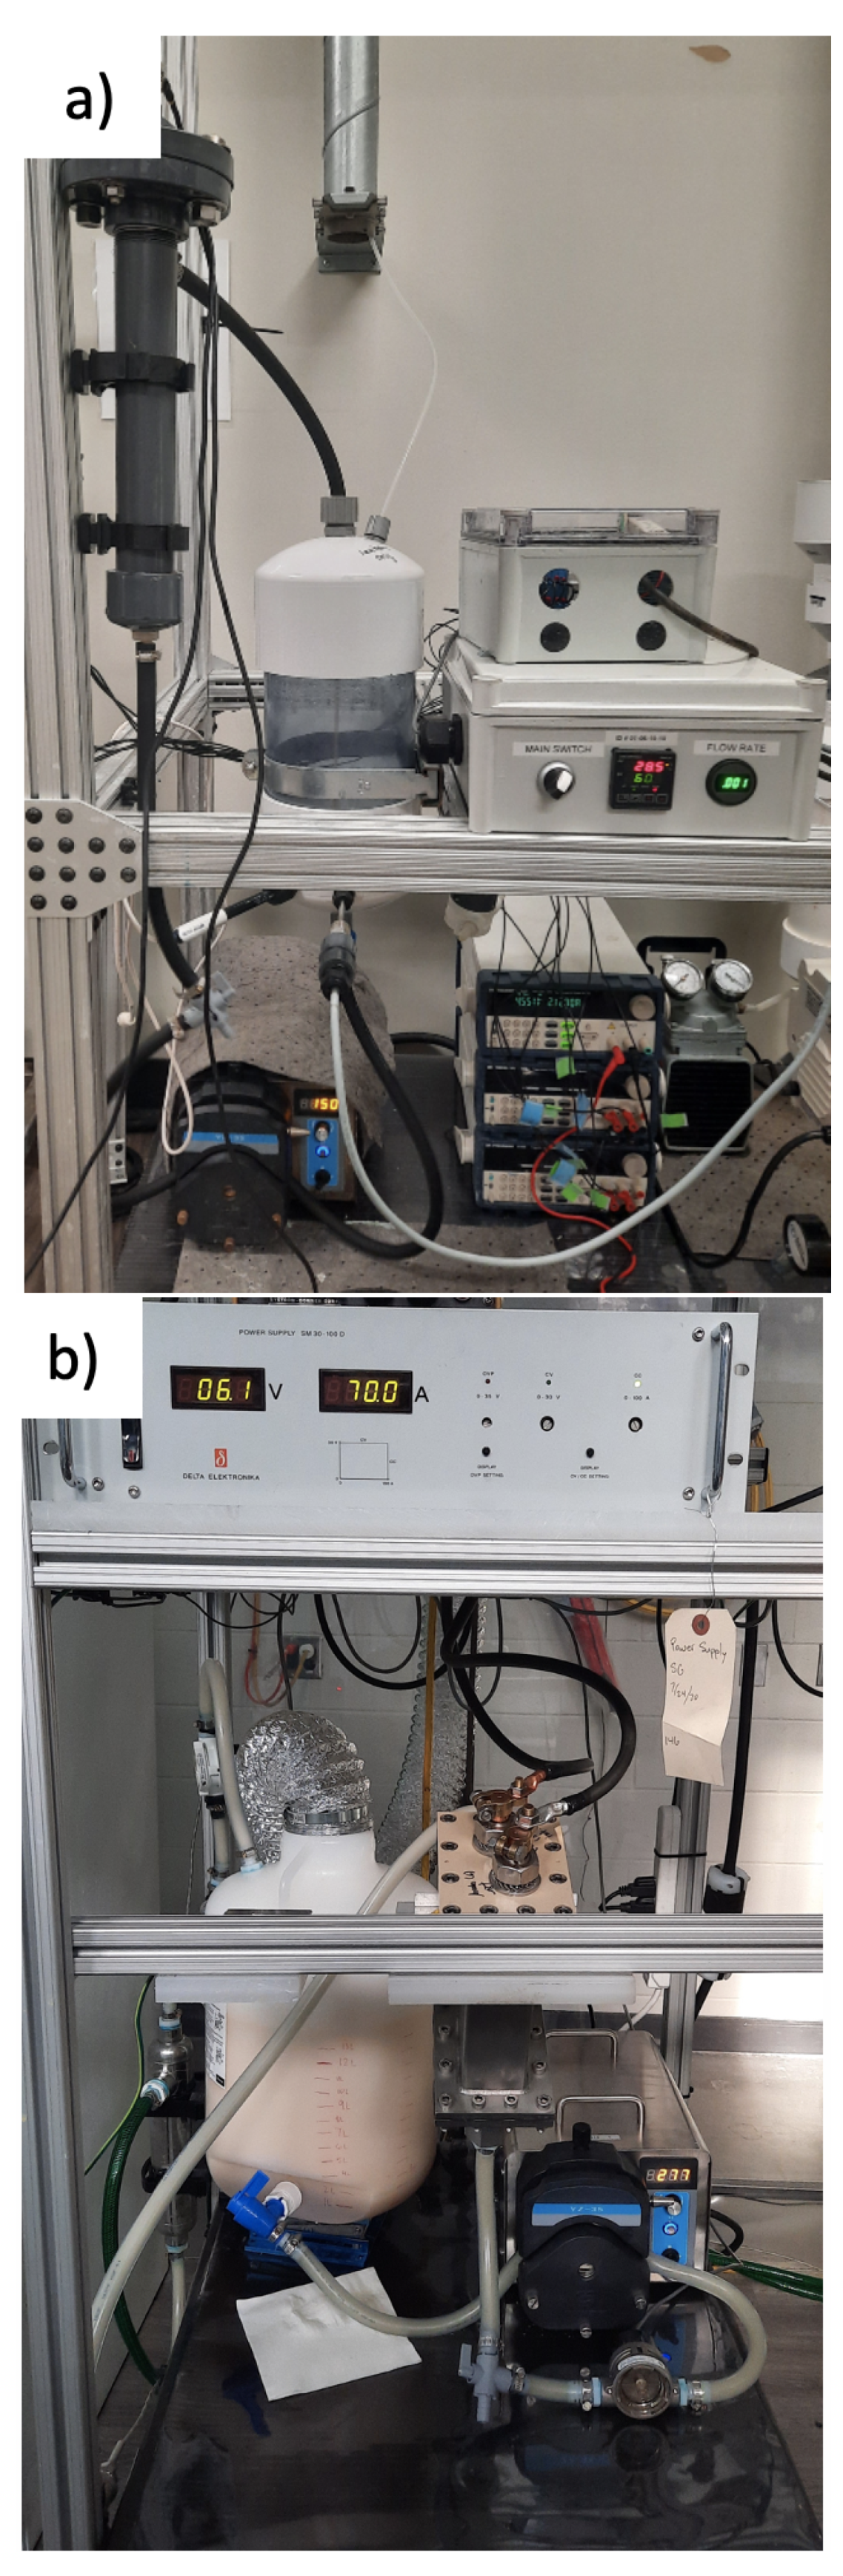
3.2. Semi-Pilot-Scale Evaluation

The laboratory-scale setup was scaled up by a factor of 7, while maintaining the A/V ratio used in the laboratory scale constant. The A/V ratio had a value of 10 m−1 (0.02 m2/0.002 m3 for the laboratory scale and 0.14 m2/0.014 m3 for the semi-pilot scale).
Prior to the evaluation of PFAAs removal, a mass transfer study was performed to determine the average mass-transfer coefficient (km) in both setups (km,lab for the laboratory scale and km,sp for the semi-pilot scale). The values of km were determined with Equation (3), using the limiting-current technique—the procedure is described elsewhere [26,35].
k m = I l i m n F A C B
where I l i m is the limiting current (A), n is the number of e exchanged, F is Faraday’s constant (96,485 C/mol), A is the anodic area (m2), and C B is the concentration in the bulk (mol/m3).
Constant concentrations of potassium of 0.05 M K4Fe(CN)6 and 0.1 M K3Fe(CN)6 were used for all the experiments. The concentration of K3Fe(CN)6 was in excess to ensure the limiting current was at the anode. For the corresponding flow rates (2 L/min at the laboratory scale and 6 L/min at the semi-pilot scale) that provided an equivalent Re number for both setups ( 2300), km,lab was 7.0 × 10 6 m/s and km,sp was 9.0 × 10 6 m/s, giving a km,lab/km,sp ratio of 0.8. The value of km depends on the cell geometry and increases with a lower inter-electrode gap [26]. Therefore, the smaller inter-electrode distance of the semi-pilot scale (2 mm, compared to 3 mm at the laboratory scale) led to an enhancement of km at the semi-pilot scale. An enhancement in kSA for PFAAs degradation was also expected at the semi-pilot scale.
Consecutively, the electrochemical treatment of PFAAs in a synthetic still bottoms solution was assessed at the semi-pilot scale and the results were compared with those obtained at the laboratory scale. The voltage that resulted from the galvanostatic process was lower at the semi-pilot scale (5.7 V at the semi-pilot scale vs. 5.9 V at the laboratory scale), attributed to the smaller inter-electrode distance, as previously stated.
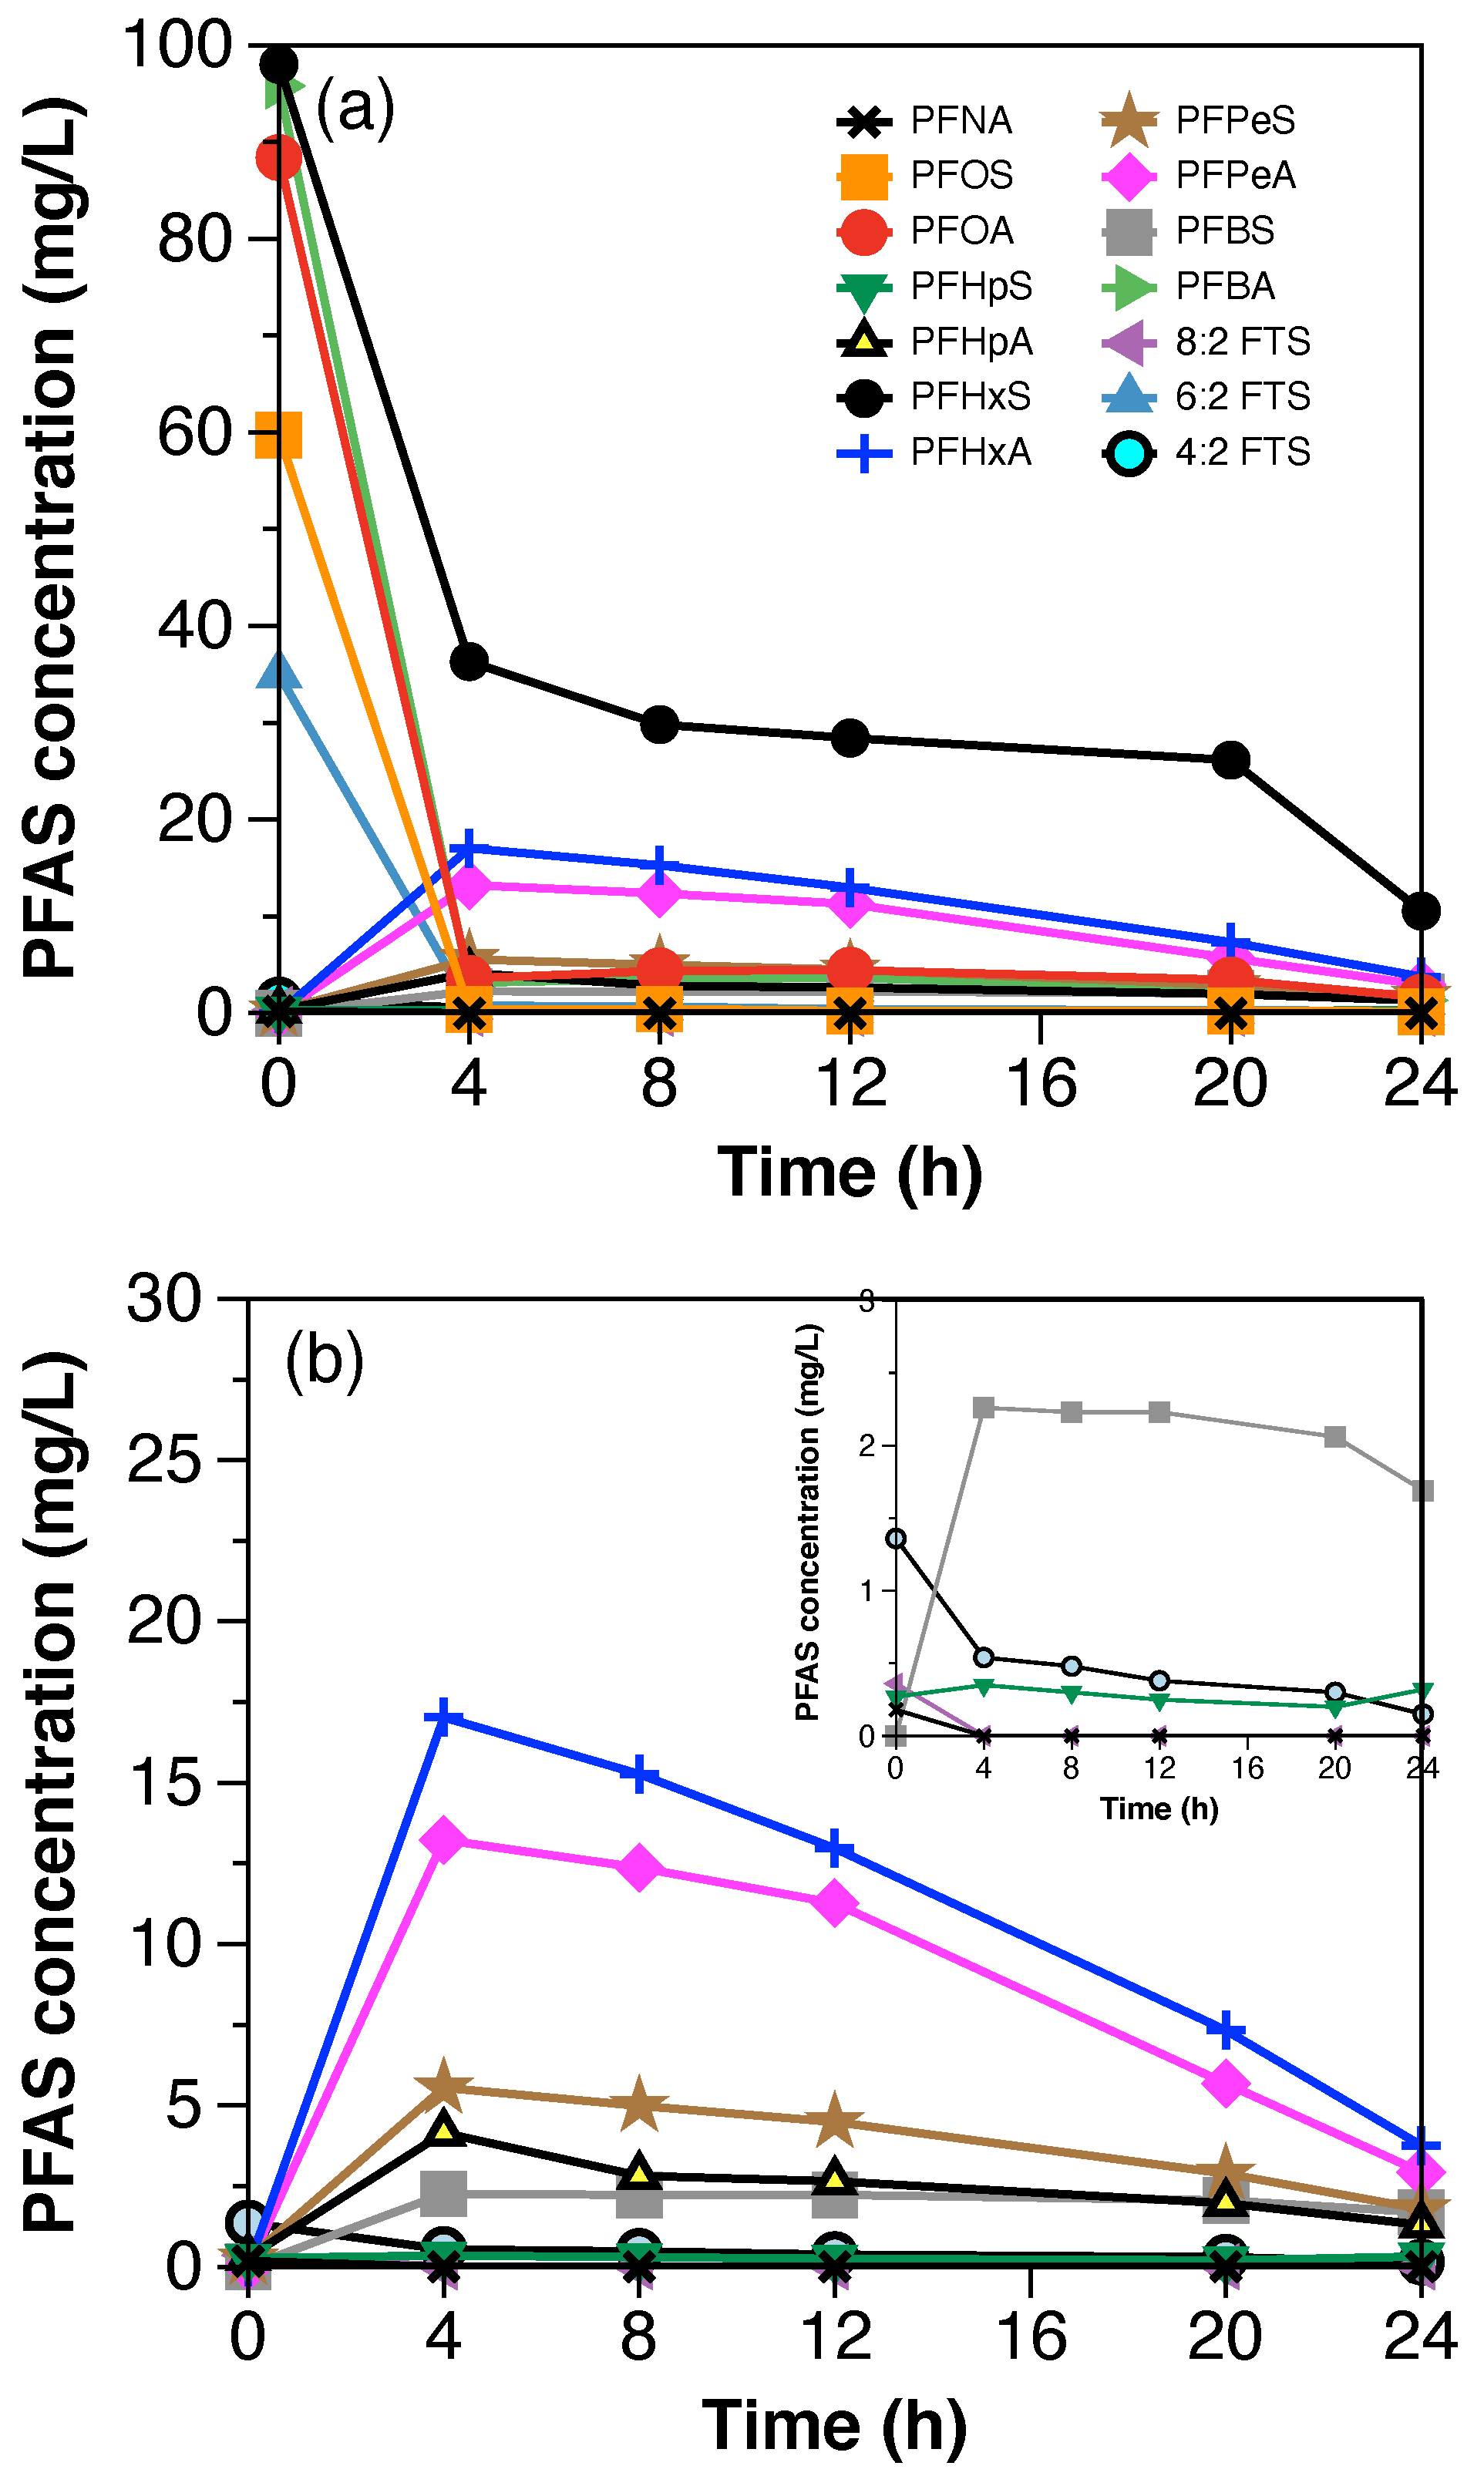
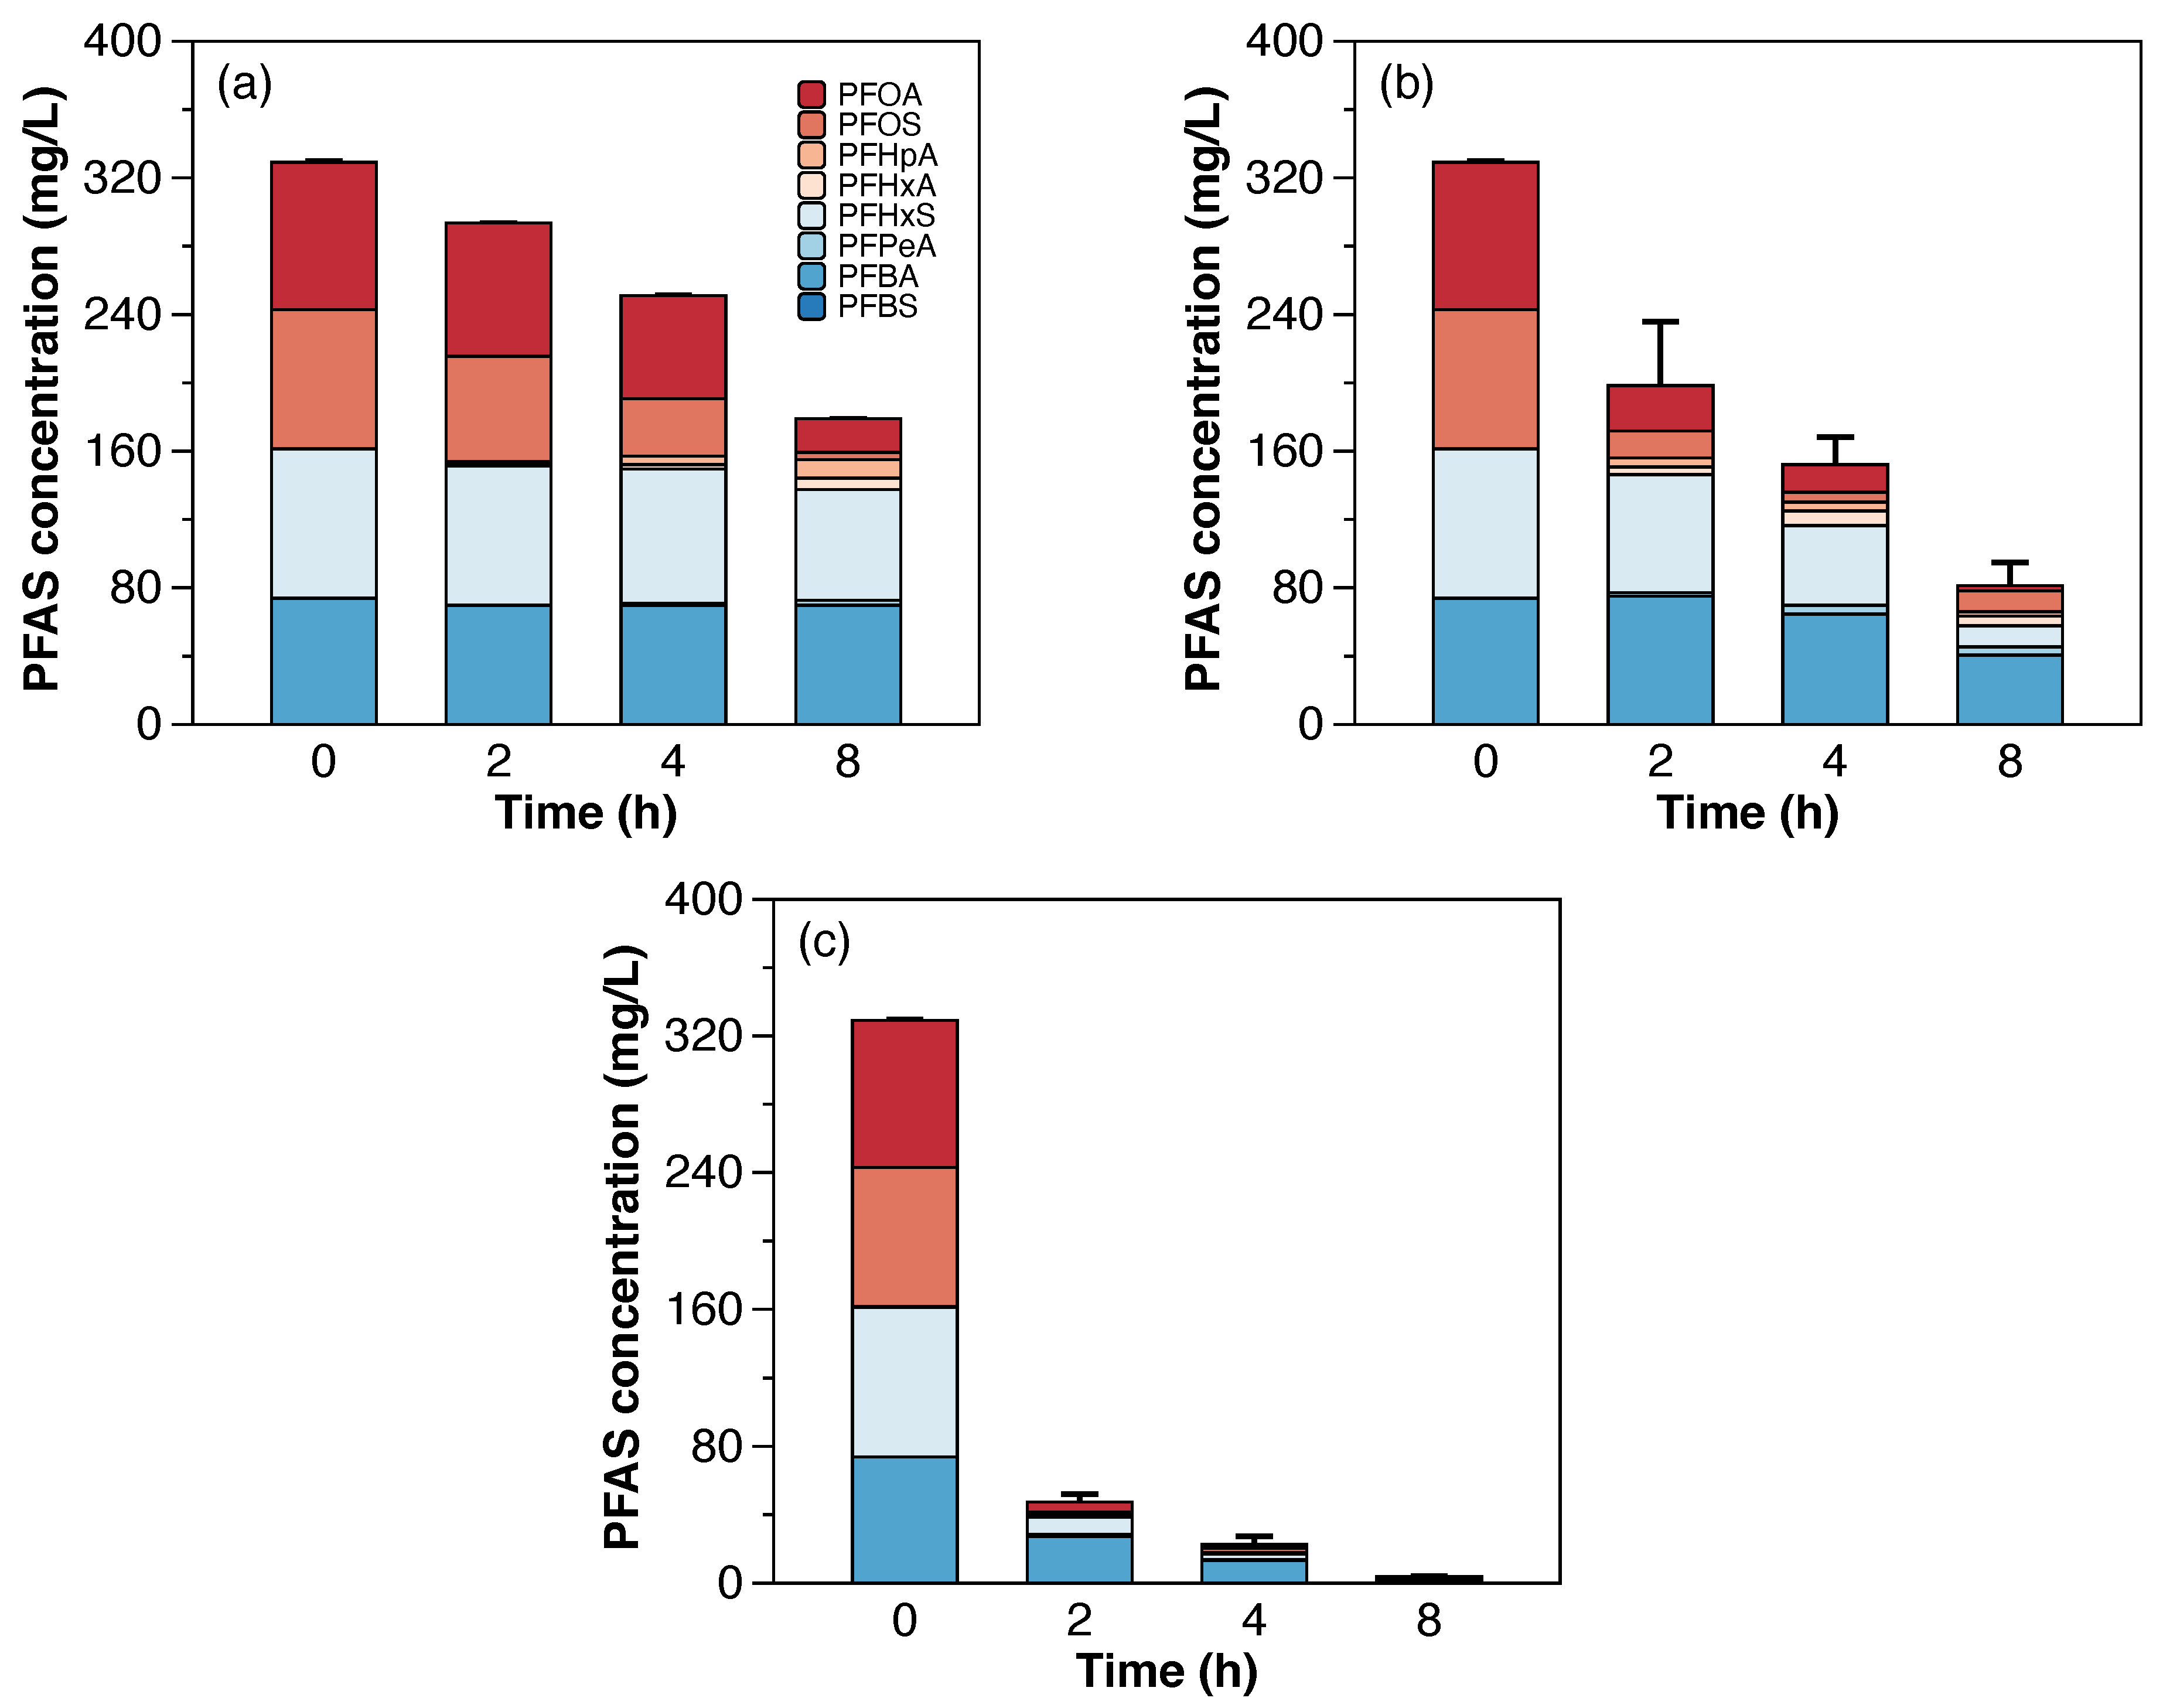
Figure 3 shows the decrease in concentration of total PFAAs from the synthetic still bottoms treated with 50 mA/cm2 in both scales. The total PFAAs removal after 8 h of treatment was 94% in the semi-pilot-scale setup. The percentages of individual PFAAs remaining in solution after treatment with respect to their initial concentrations were 19% of PFBA, 3% of PFHxS, and <2% of PFOA and PFOS. Similar to the laboratory scale experiments, a layer of foam was observed during the electrochemical treatment of PFAAs in the semi-pilot-scale setup. Therefore, a fraction of PFAAs removal, in particular the highly hydrophobic PFAAs, was likely attributed to their partitioning into the foam. To verify this, the foam generated during the experimental time (8 h) was collected separately and sent for PFAS analysis. Results showed that the mass percentage of individual PFAAs partitioned into the foam with respect to the initial concentration of PFAAs in the solution corresponded to 61% of PFOS, 17% of PFOA, 8% of PFBA, and 2% of PFHxS. Likewise, a previous study showed that at least 80% of the PFOS-associated fluorine partitioned into the foam [22].
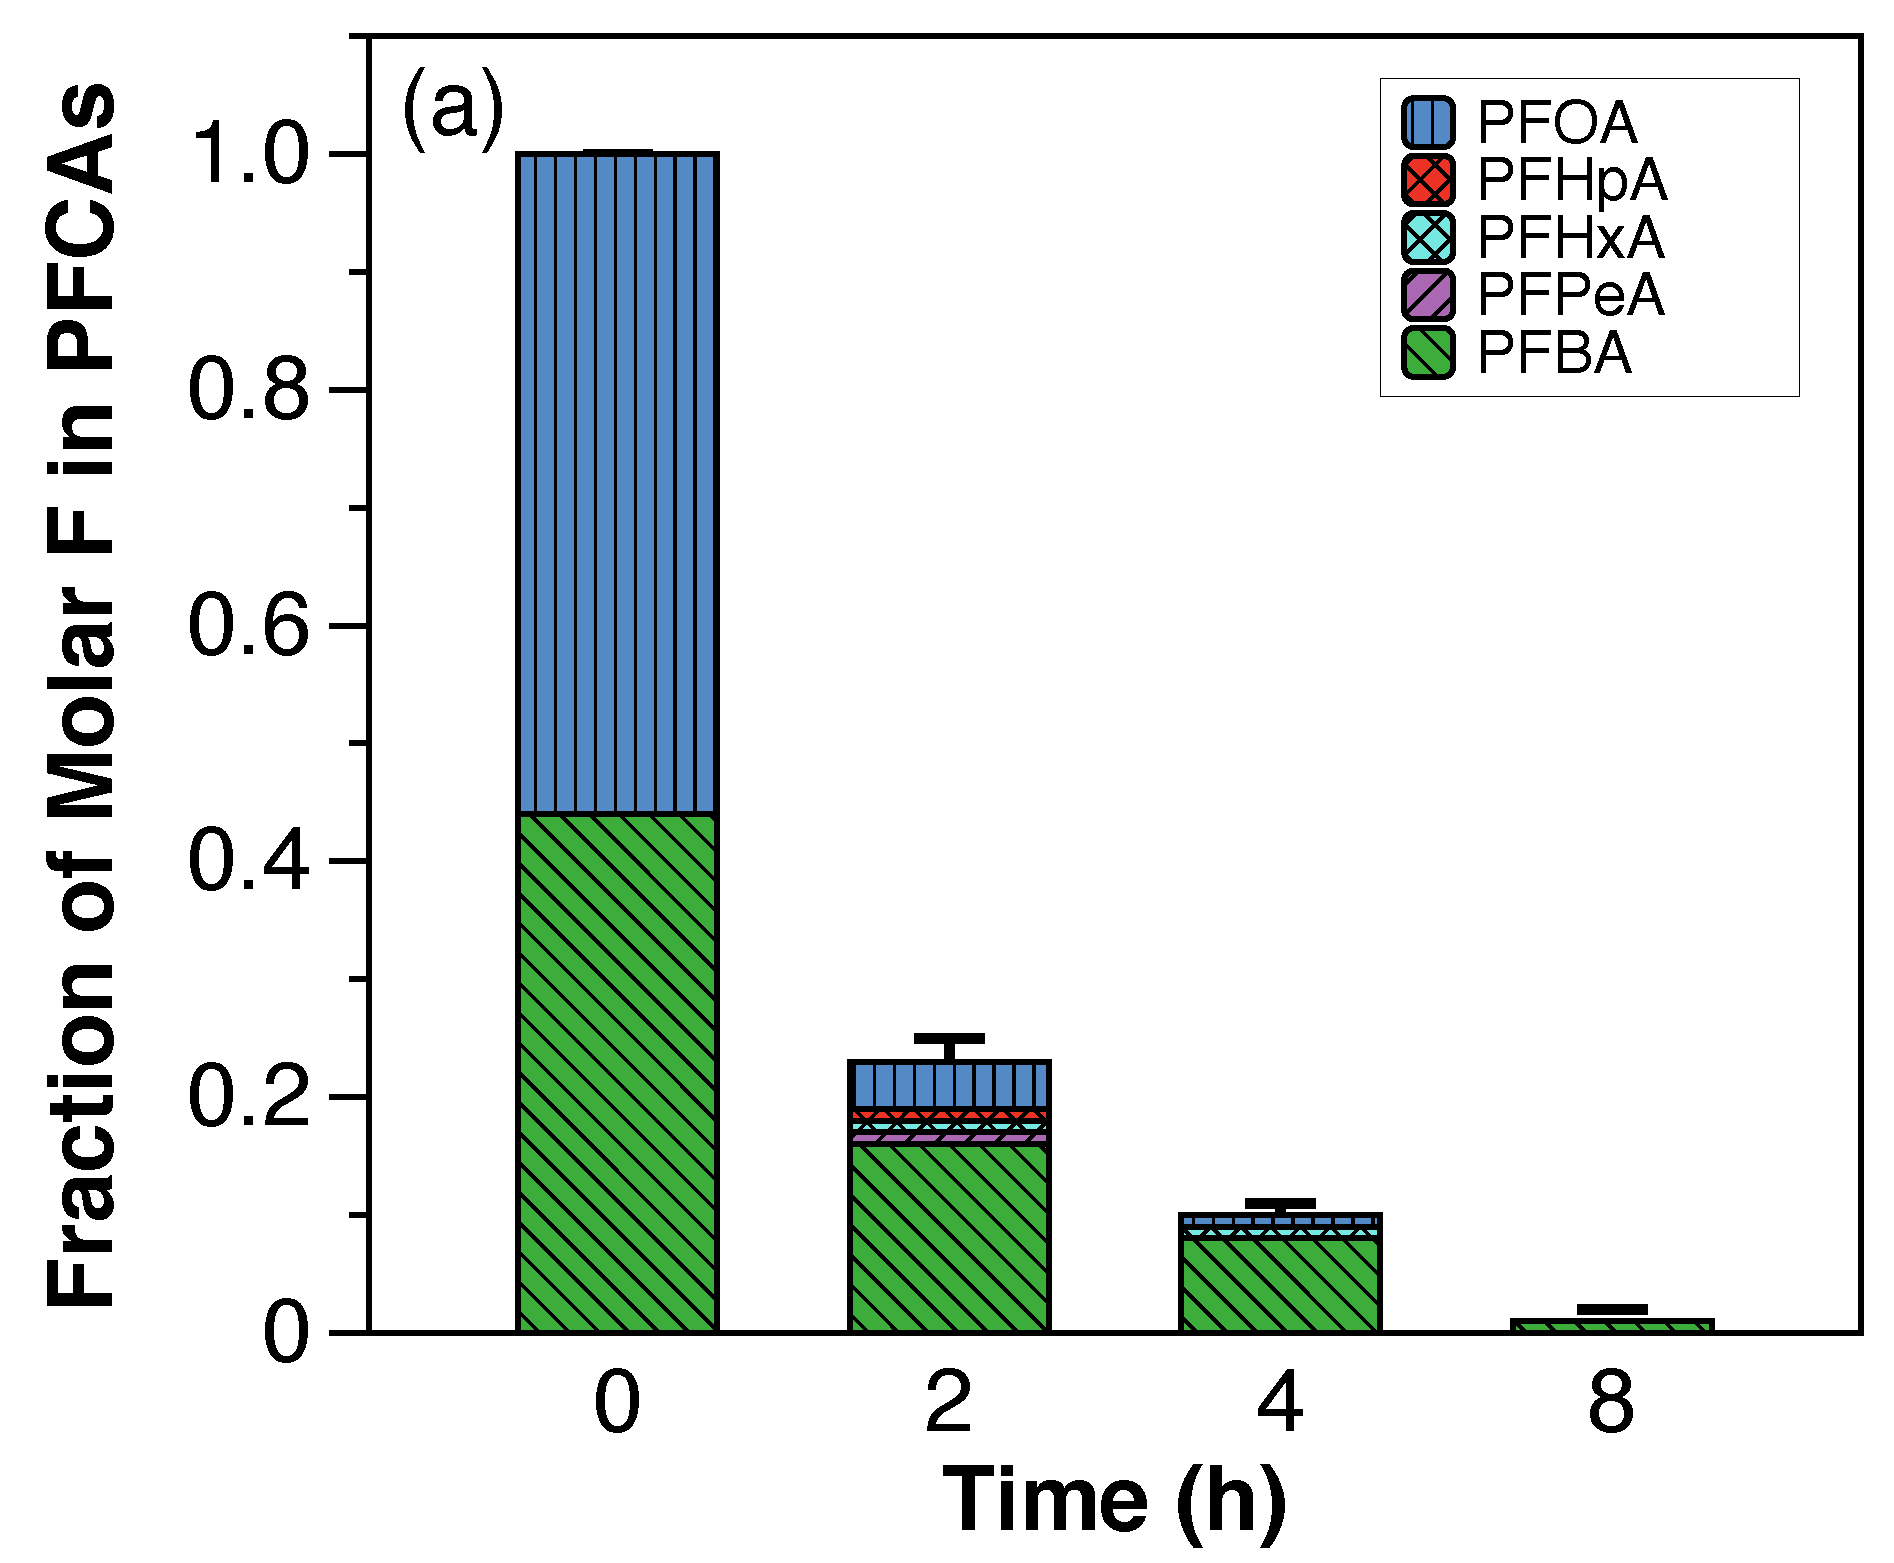
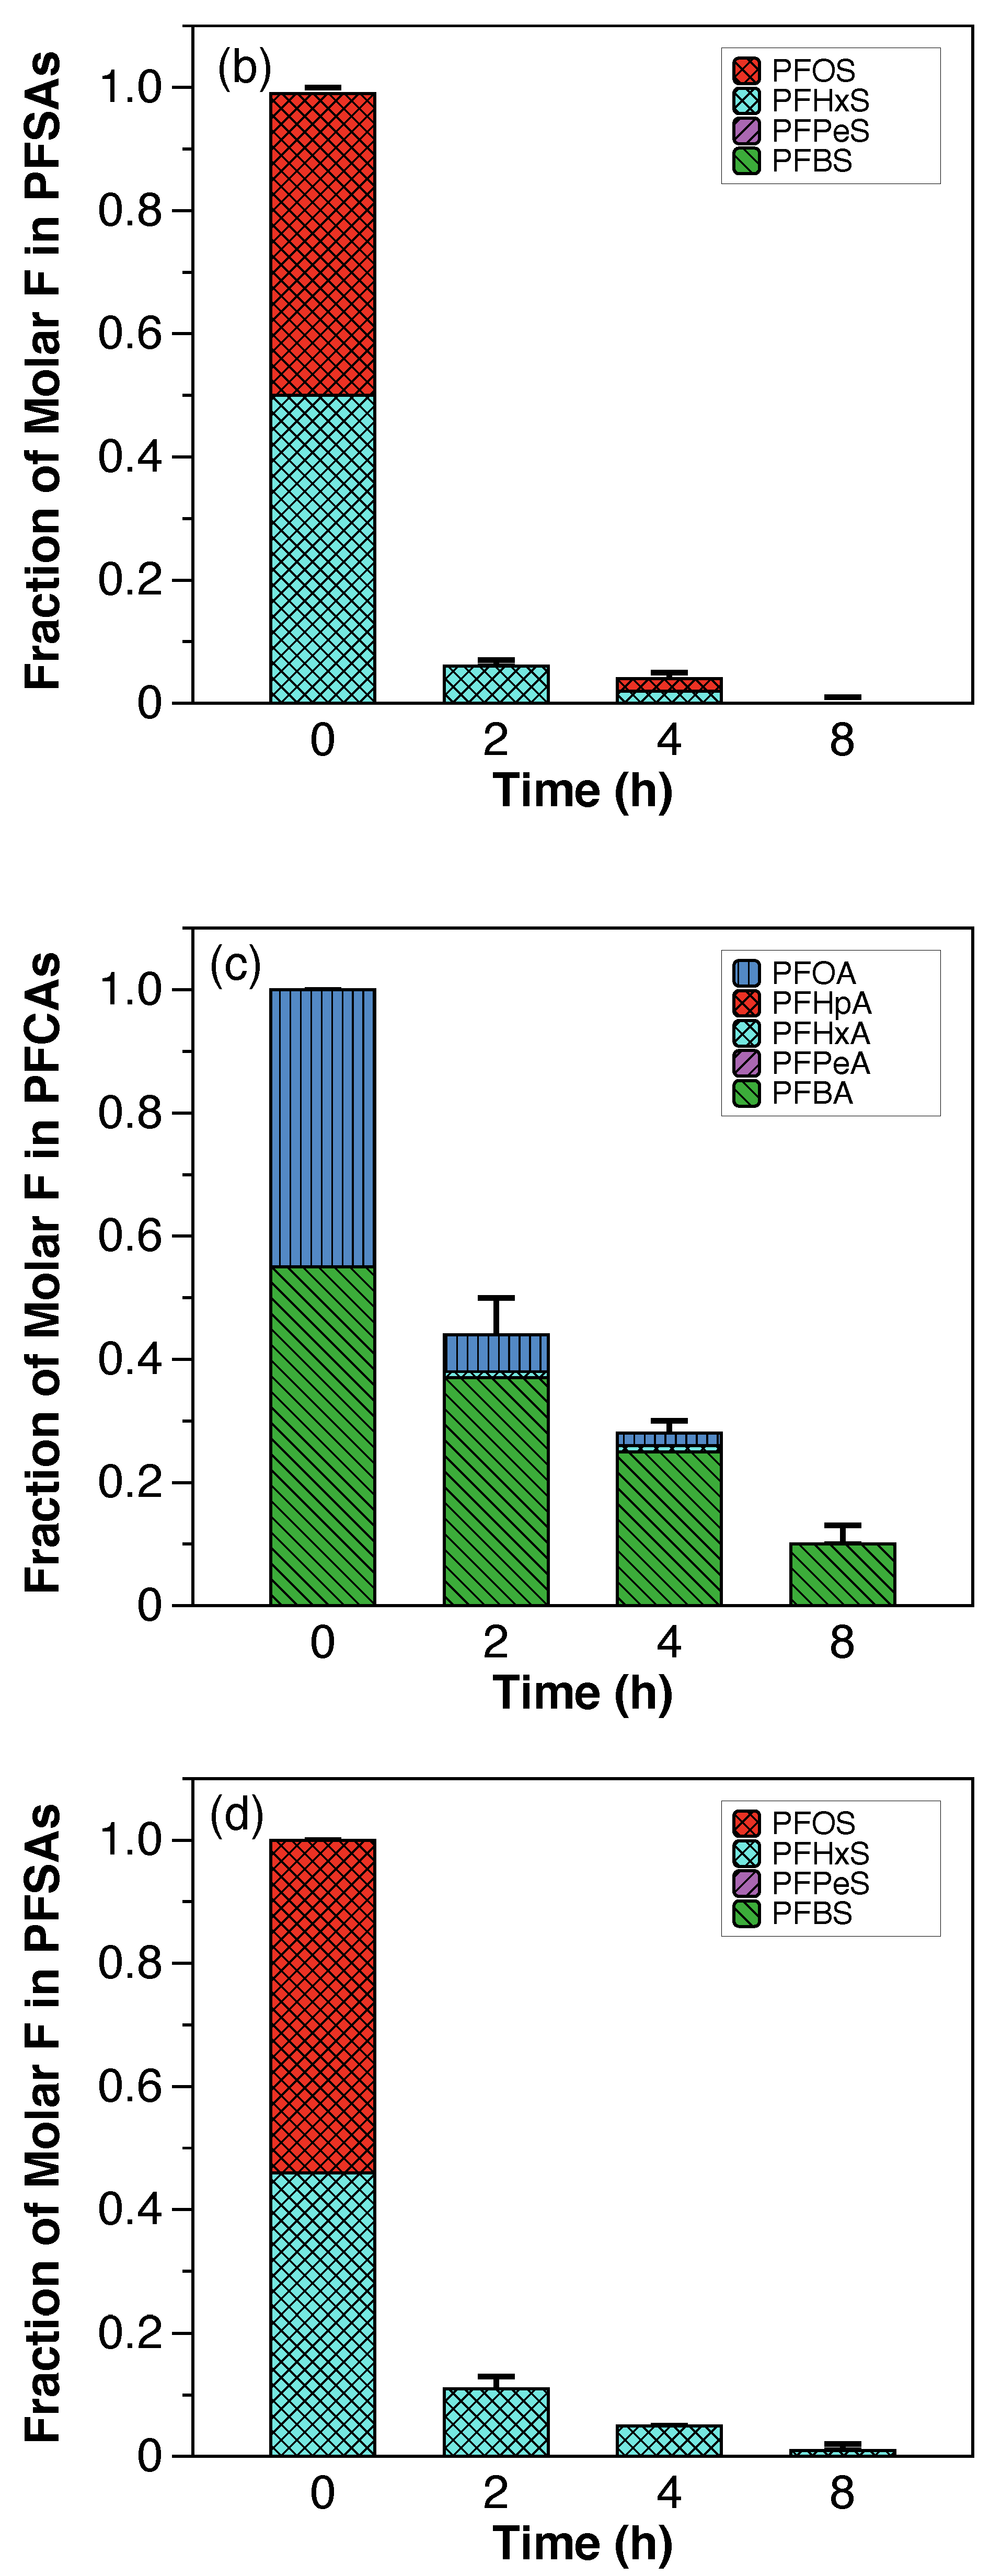
The fraction of molar F in PFCAs and PFSAs (shown in Figure A5) was used to compare the evolution of individual PFAAs over time during the electrochemical treatment in both scales. In general, higher fractions of PFCAs, in particular PFHpA, PFHxA, and PFPeA, were generated at the laboratory scale, suggesting faster degradation kinetics at the laboratory scale and more foam partitioning at the semi-pilot scale.
The values of kSA for total PFAAs removal were 1.4 × 10 5 m/s and 8.4 × 10 6 m/s for the laboratory and the semi-pilot scales, respectively, giving a kSA,lab/kSA,sp ratio of 1.6. Interestingly, opposite ratios showing kSA,lab > kSA,sp and km,lab < km,sp were obtained.
The lower value of kSA for PFAAs removal in the semi-pilot setup suggests that other factors besides fluid properties, hydrodynamics, and A/V ratio play a critical role in the treatment efficiency of PFAAs in IX still bottoms. These factors include gas evolution and current density distribution [36]. During the electrochemical oxidation of target compounds (e.g., PFAAs), only a fraction of the applied current density, equal to the limiting current, is used in the oxidation of the target compound [27]. The remaining fraction of current is used in side reactions including oxygen and hydrogen evolution [37]. The previous reactions generate substantial quantities of gas ( V g a s ) that are proportional to the applied current, according to Faraday’s first law of electrolysis (Equation (4)):
V g a s = I R T t n F P
where R is the universal gas constant (8.314 J/mol−1K−1), I is the current applied (A), T is the average working temperature (303 K), t is the treatment time (s), F is the Faraday’s constant (96,485 C/mol), P is the atmospheric pressure ( 1 × 10 5 Pa), and n is the number of e exchanged (2 for H2, and 4 for O2). A higher electrode area requires the application of a higher current to maintain a constant current density between both reactor scales, leading to the generation of a higher volume of gas in the semi-pilot-scale setup. For the corresponding currents of each setup (10.7 A at the laboratory scale and 70 A at the semi-pilot scale), the total volume of gas generated corresponds to 7.5 L/h and 49.3 L/h, approximately 7-fold more gas generation at the semi-pilot scale. Although a local increase in the mass transfer is expected if gas bubbles are generated [27], the inherent surface-active properties of PFAAs induce their movement towards the air-water interface of the bubbles [38], that travel to the interface of the solution (foam generation), where PFAAs are partitioned. In addition, local gas hold-up in the vicinity of the electrodes could have interfered with direct anodic oxidation of PFAAs in the liquid phase [37]. Therefore, the probability of PFAAs reaching the anode surface decreases, slowing down the oxidation process. Thus, a lower kSA is obtained.
Finally, possible differences in current density distributions along the electrodes in each setup could have affected the mass transfer of the process [36,39]. To maintain current similarity, it is recommended to increase the number of smaller modules, rather than increase the electrode size [36].

3.3. Perchlorate Formation during Electrochemical Treatment

ClO4 generation was quantified for all experiments and its evolution over time is shown in 
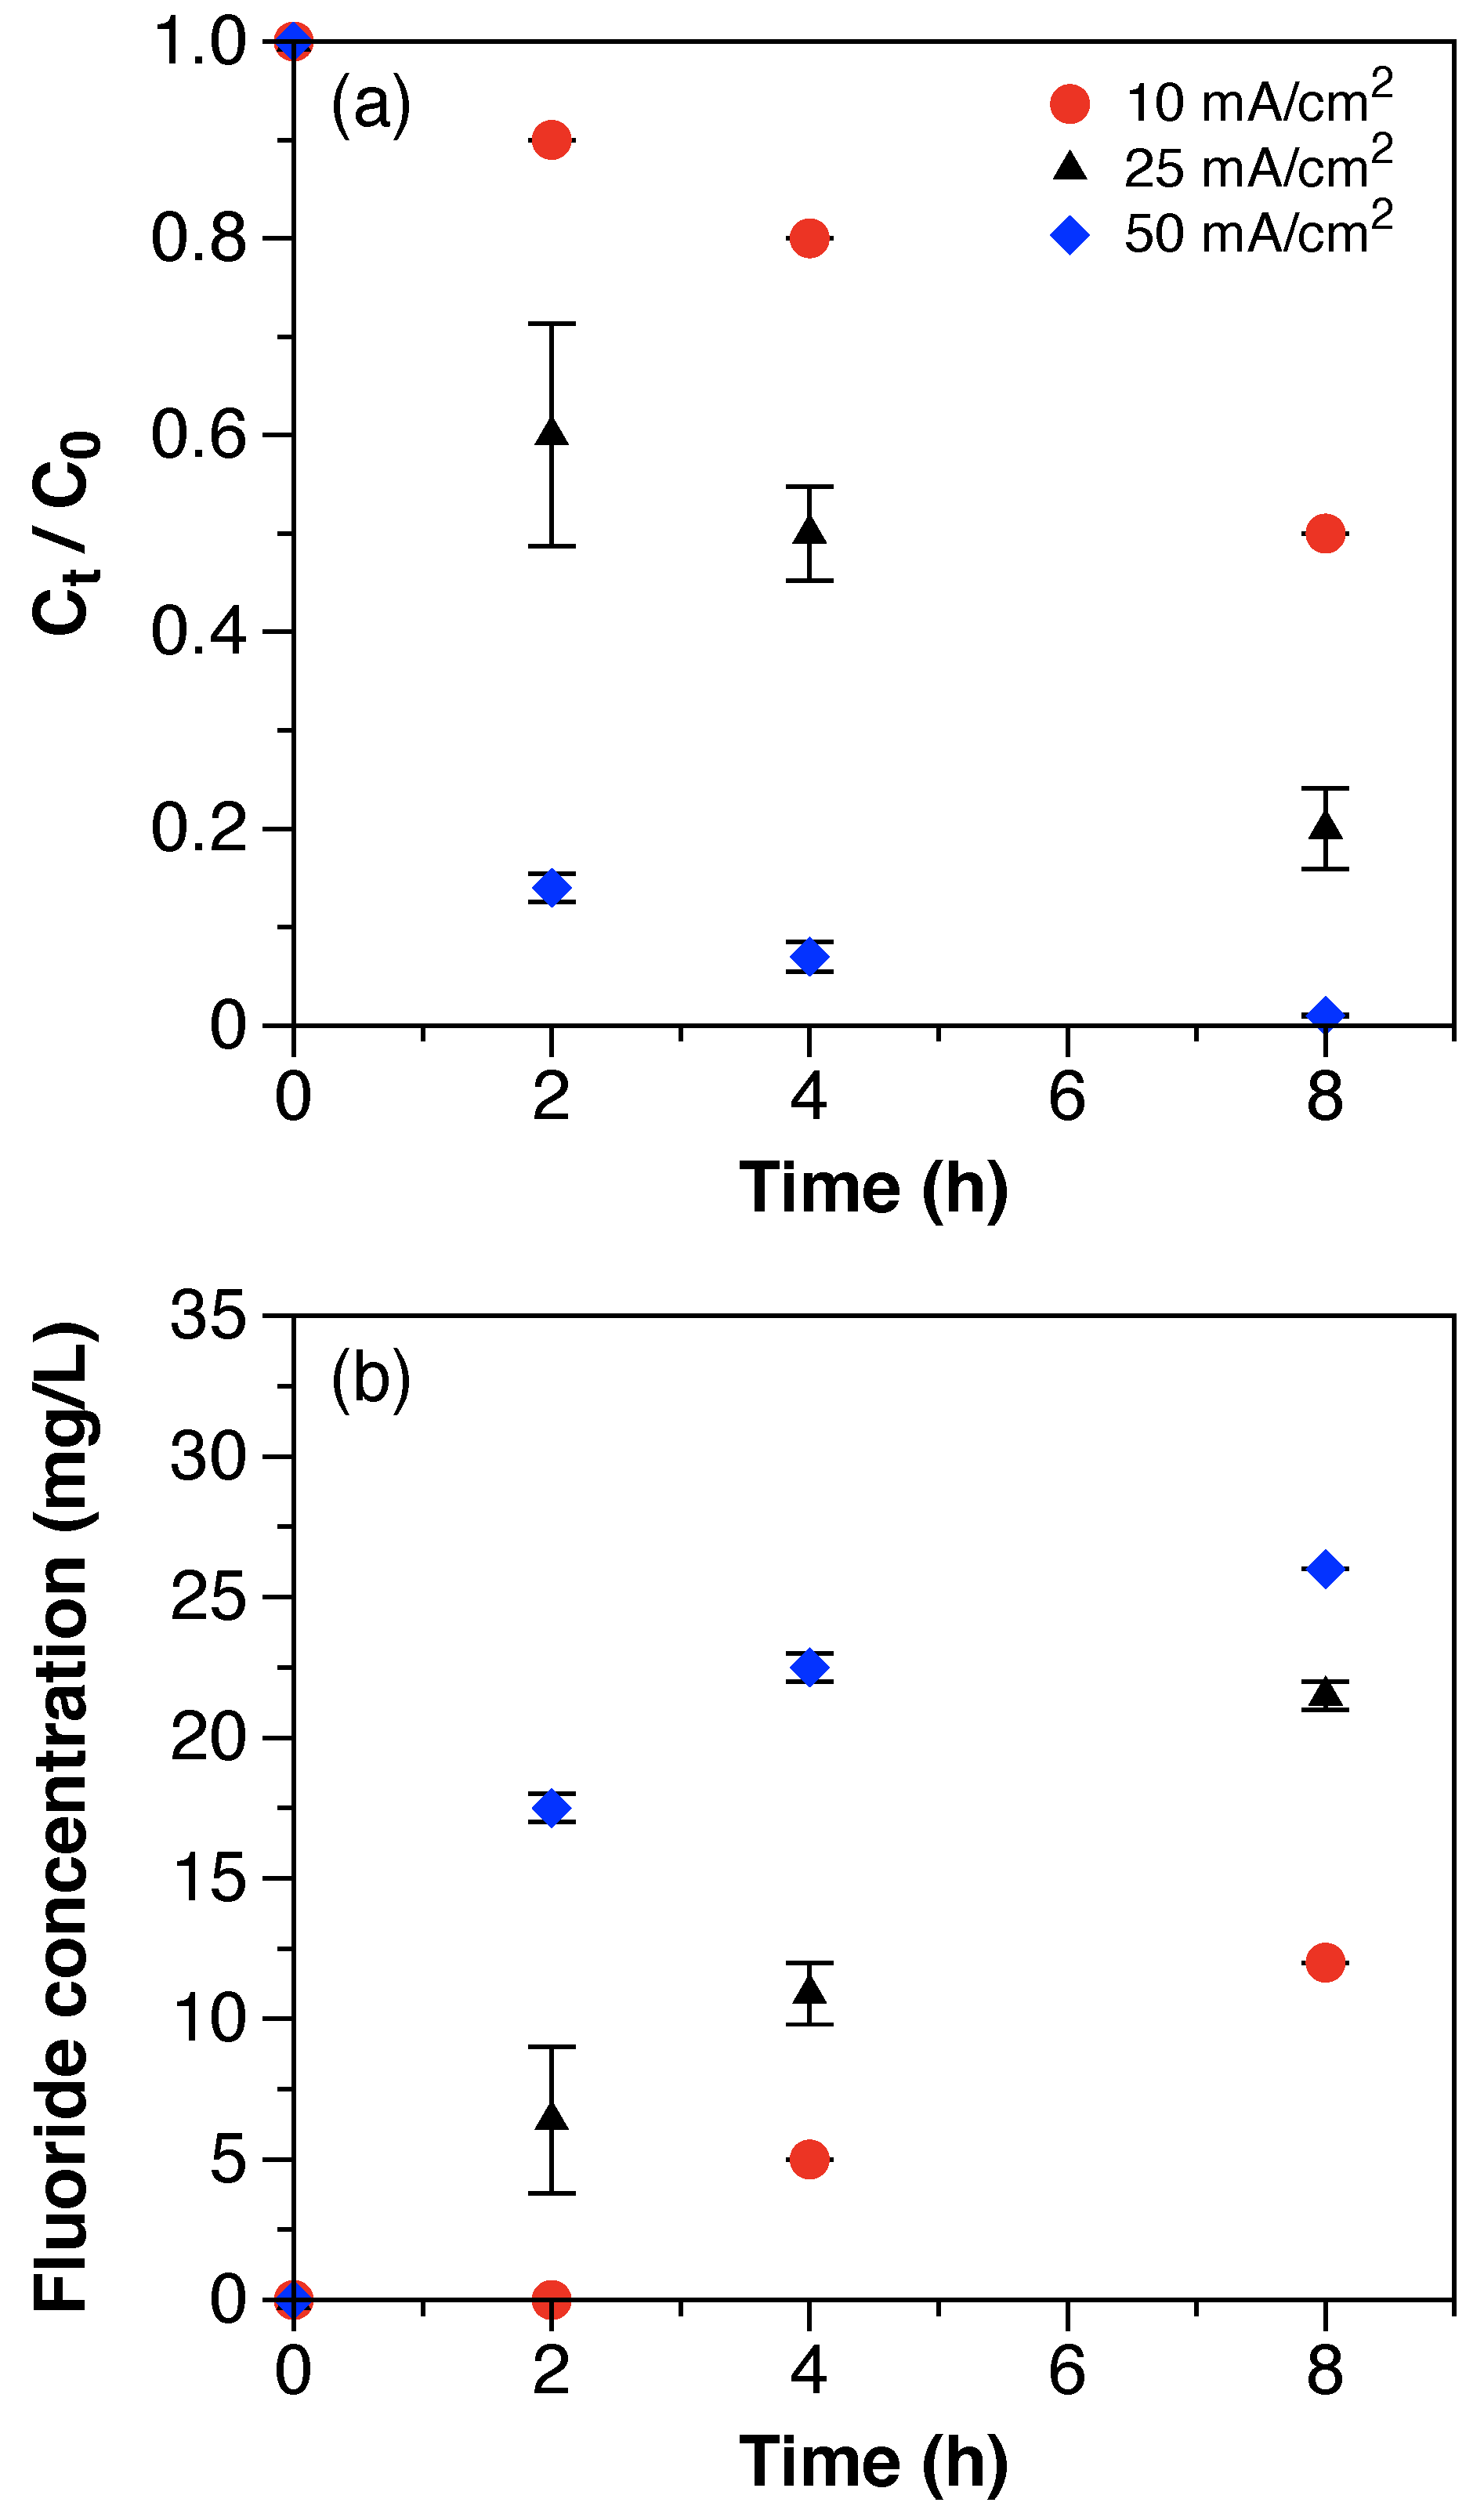
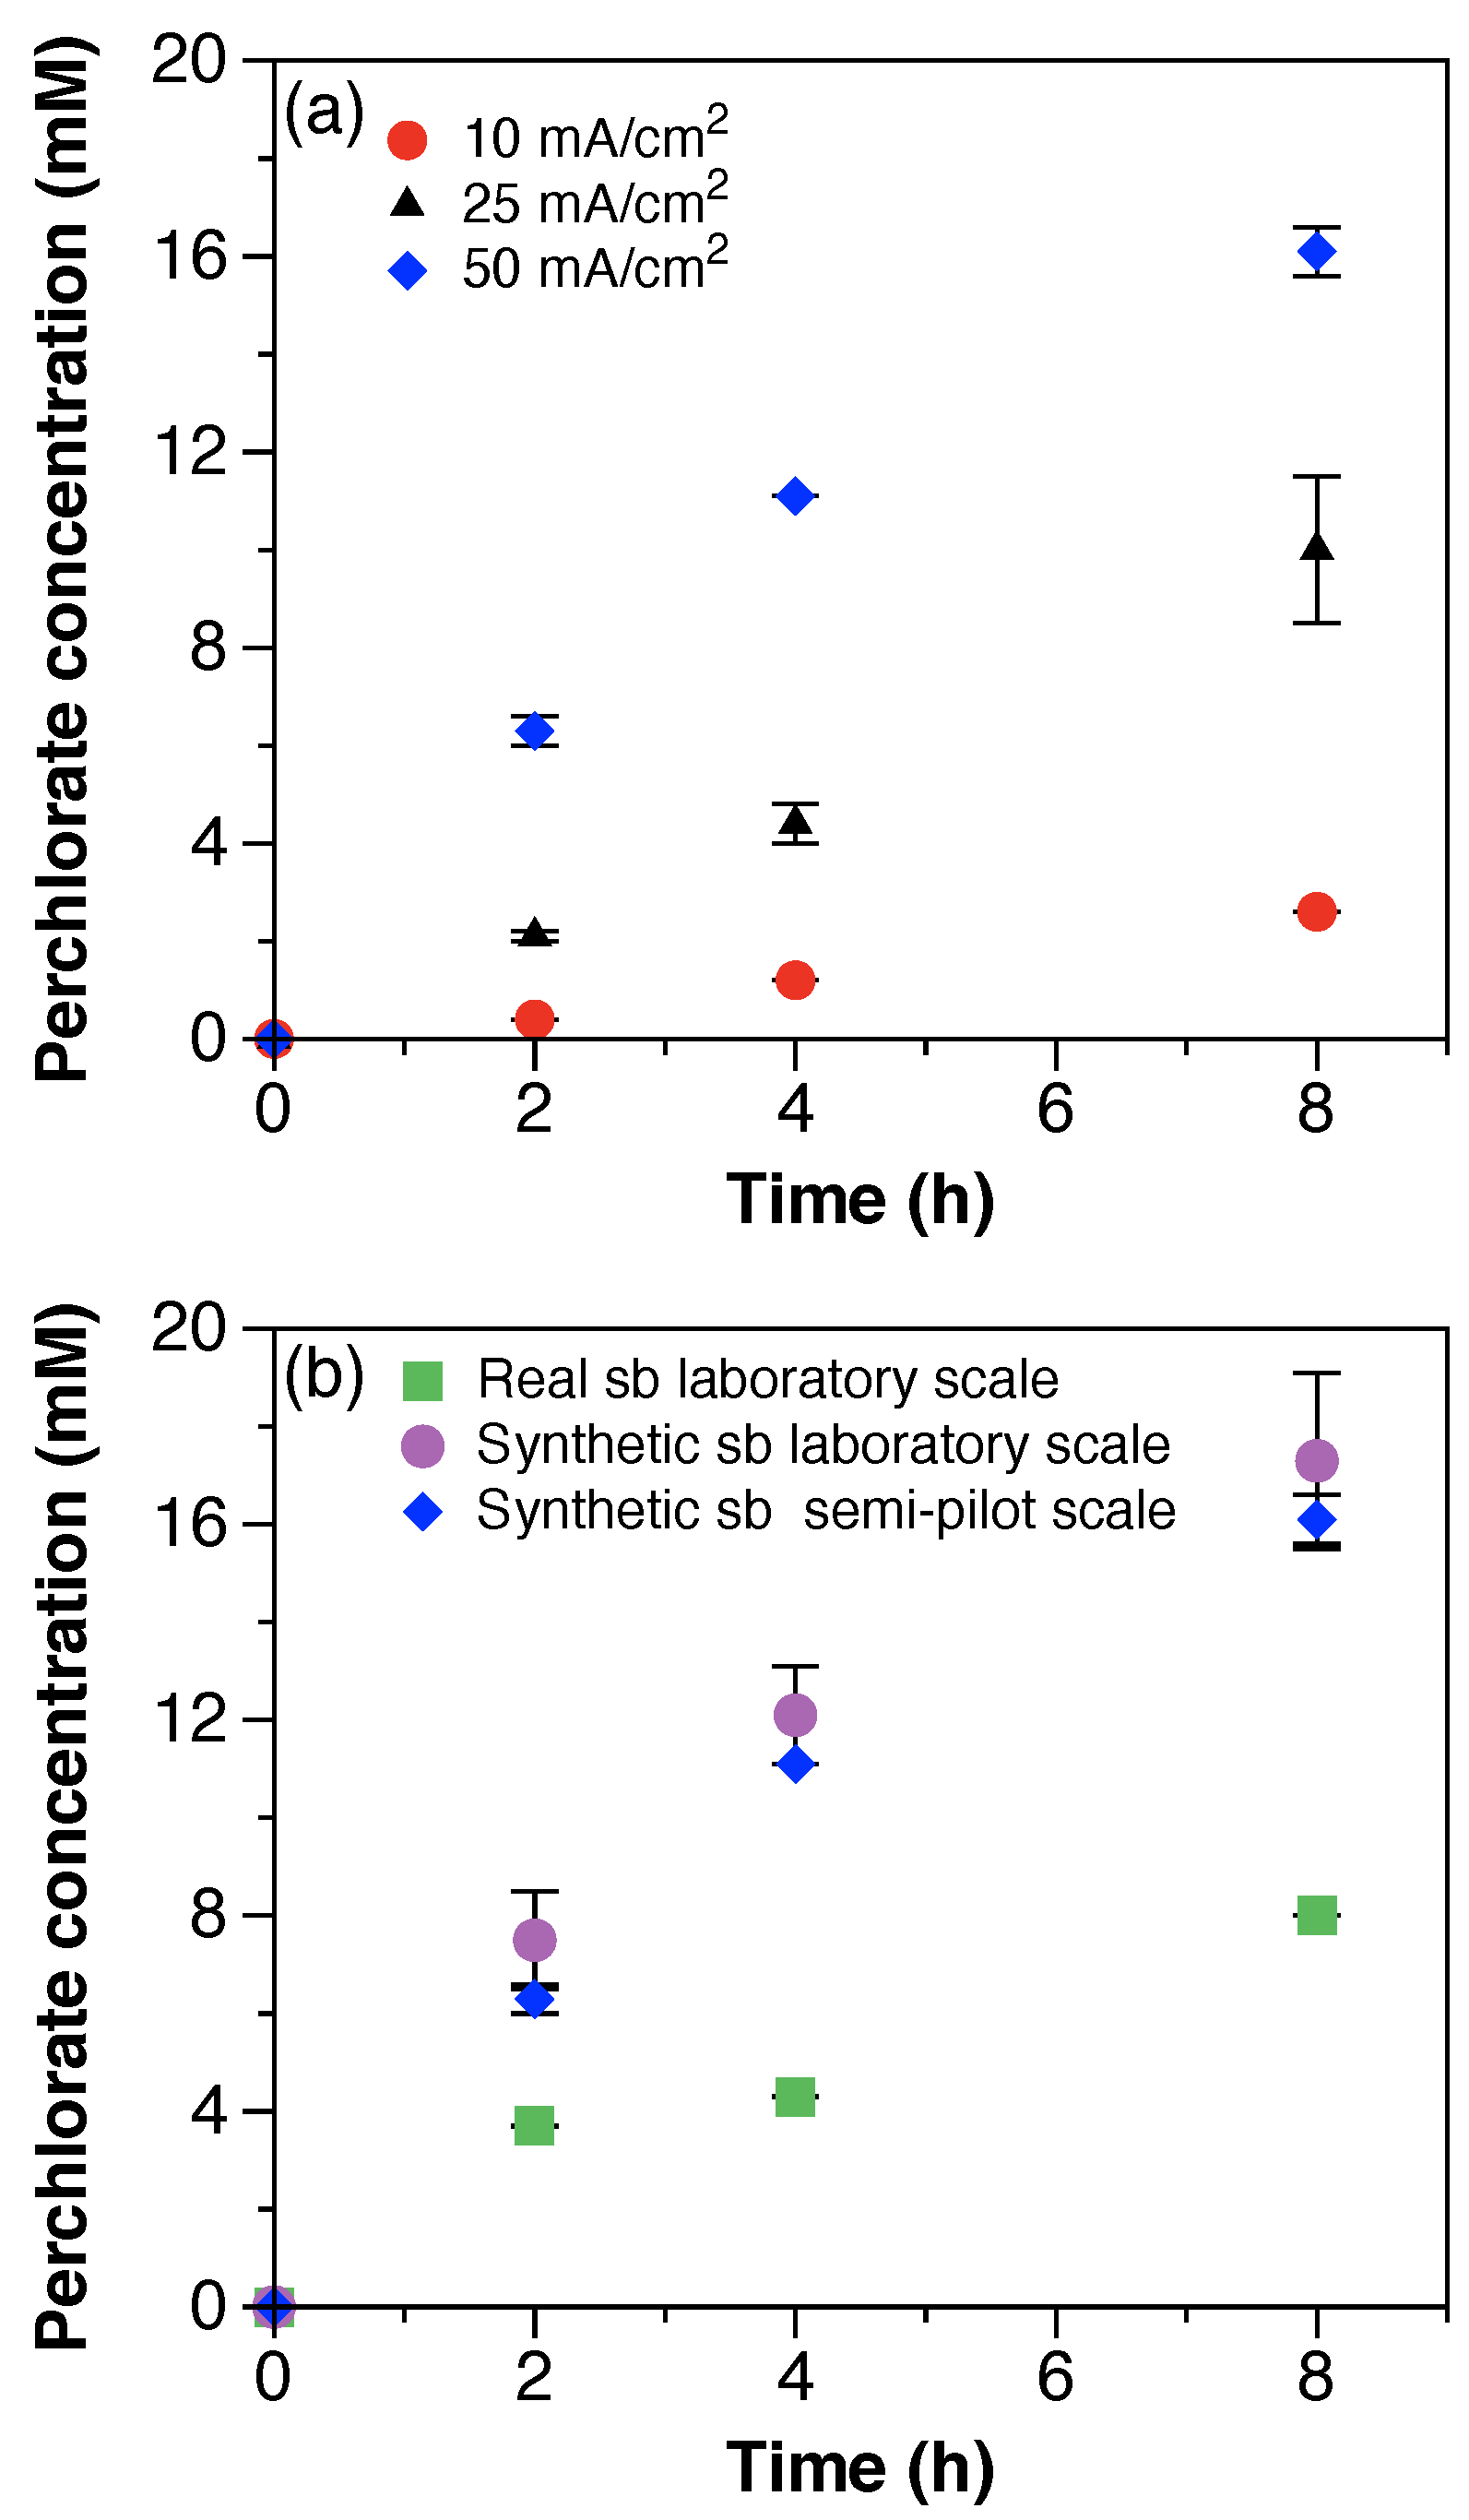
Figure 4. For the electrochemical treatment of synthetic solutions with multiple current densities, the zero-order generation rate of ClO4 increased with the current density (Figure 4a) and reached concentrations of 2.6, 10.0, and 16.1 mM after 8 h of treatment with 10, 25, and 50 mA/cm2, respectively. ClO4 concentrations at the end of the treatment time (8 h) accounted for 0.2, 0.8, and 1.4% of the initial Cl concentration (1250 mM). The generation of ClO4 was relatively low compared to the initial concentration of Cl available for oxidation. Although the concentration of chlorate (ClO3) was not quantified in this work, a recent study performed with still bottom solutions reported equimolar concentrations of ClO3 and ClO4 generated after 40 h of electrochemical treatment [24]. Even assuming equivalent concentrations of ClO3 generated, the percentage of chlorinated byproducts remains low when compared to the initial concentrations of Cl. These results suggest that additional species present in the solution may be competing for direct anodic oxidation or scavenging Cl oxidation. Wang et al. showed that the presence of methanol (100–1000 mM) in still bottom solutions scavenges chlorine radical Cl. generation and significantly reduces the formation of chlorinated byproducts [24]. The synthetic still bottoms solution of this work included a concentration of methanol of 312 mM, which likely contributed to the reduction of ClO4 generation. Moreover, although having similar initial concentrations of Cl, the generation rate of ClO4 during the electrochemical treatment of the real still bottoms was 2-fold slower than with the synthetic solution (Figure 4b). The latter suggests that Cl. scavenging may be affected by additional constituents of the solution, besides methanol. However, this assumption requires further studies.
Finally, under the same experimental conditions, the generation of ClO4 at the semi-pilot scale was comparable to the results obtained at the laboratory scale (Figure 4b). The ClO4 concentration after 8 h of electrochemical treatment was of 17.3 mM. The results suggest that ClO4 generation with BDD electrodes solely depends on the applied current density, regardless of factors associated to scale performance differences.

3.4. Treatment Efficiency and Energy Consumption

The coulombic efficiency (CE) was used to quantify the current efficiency for PFAAs defluorination during the electrochemical treatment and it is defined in Equation (5) [40,41]:
C E = F V e C F I t
where F is Faraday’s constant (96,485 C/mol), V is the volume of solution treated (L), e is the moles of e needed per mole fluoride (1 electron per C-F bond [22]), C F is the fluoride concentration (mol/L), I is the current (A), and t is the treatment time (s).
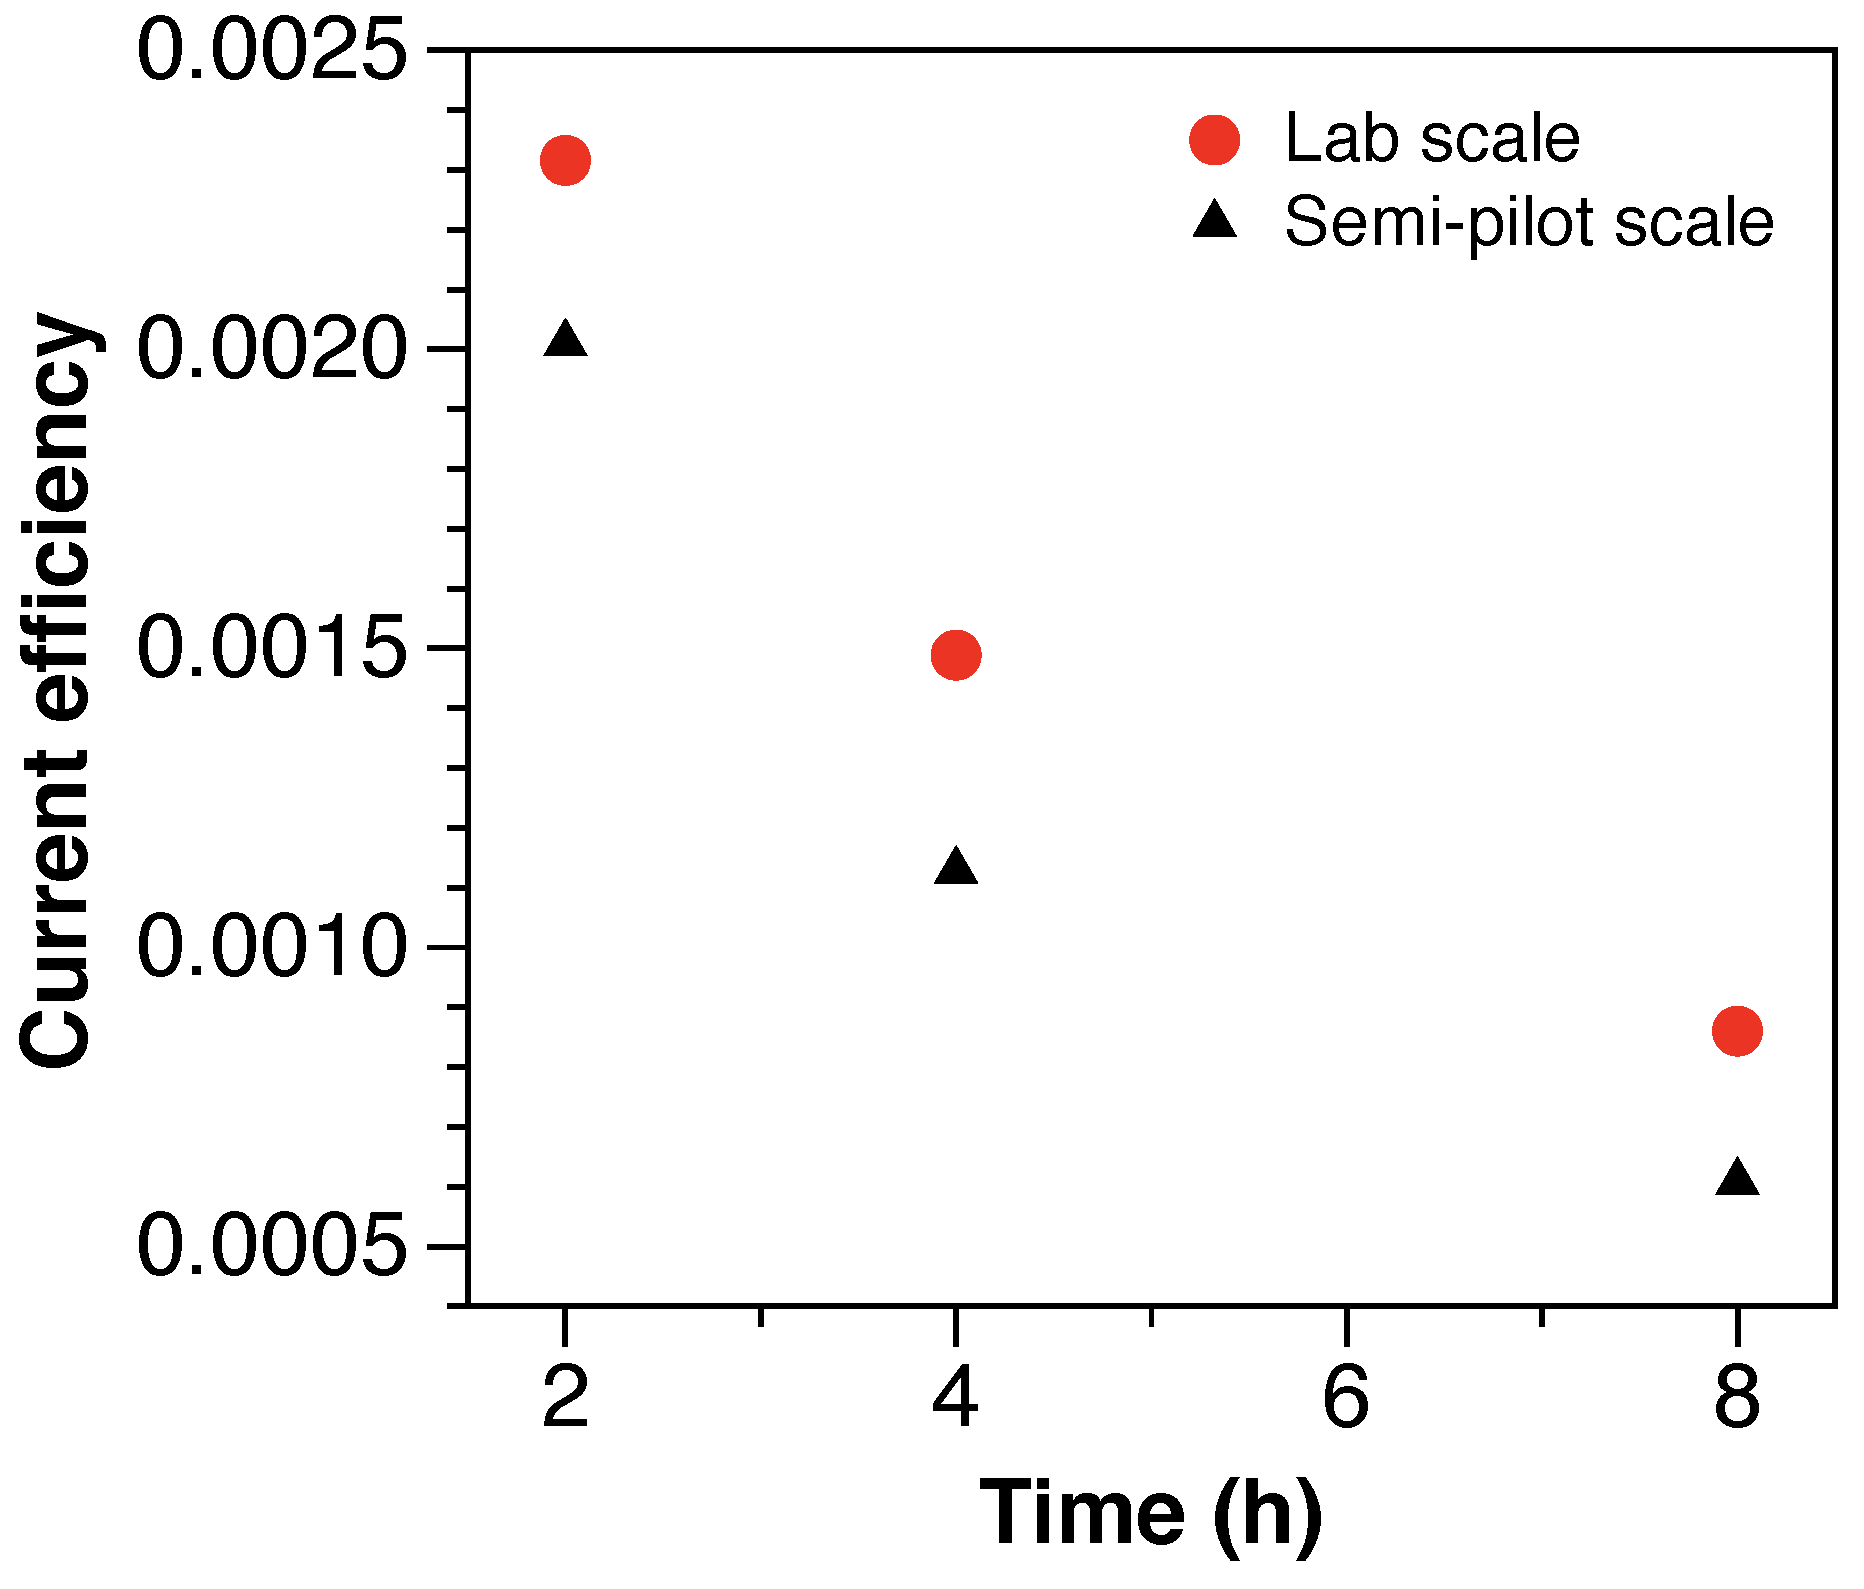
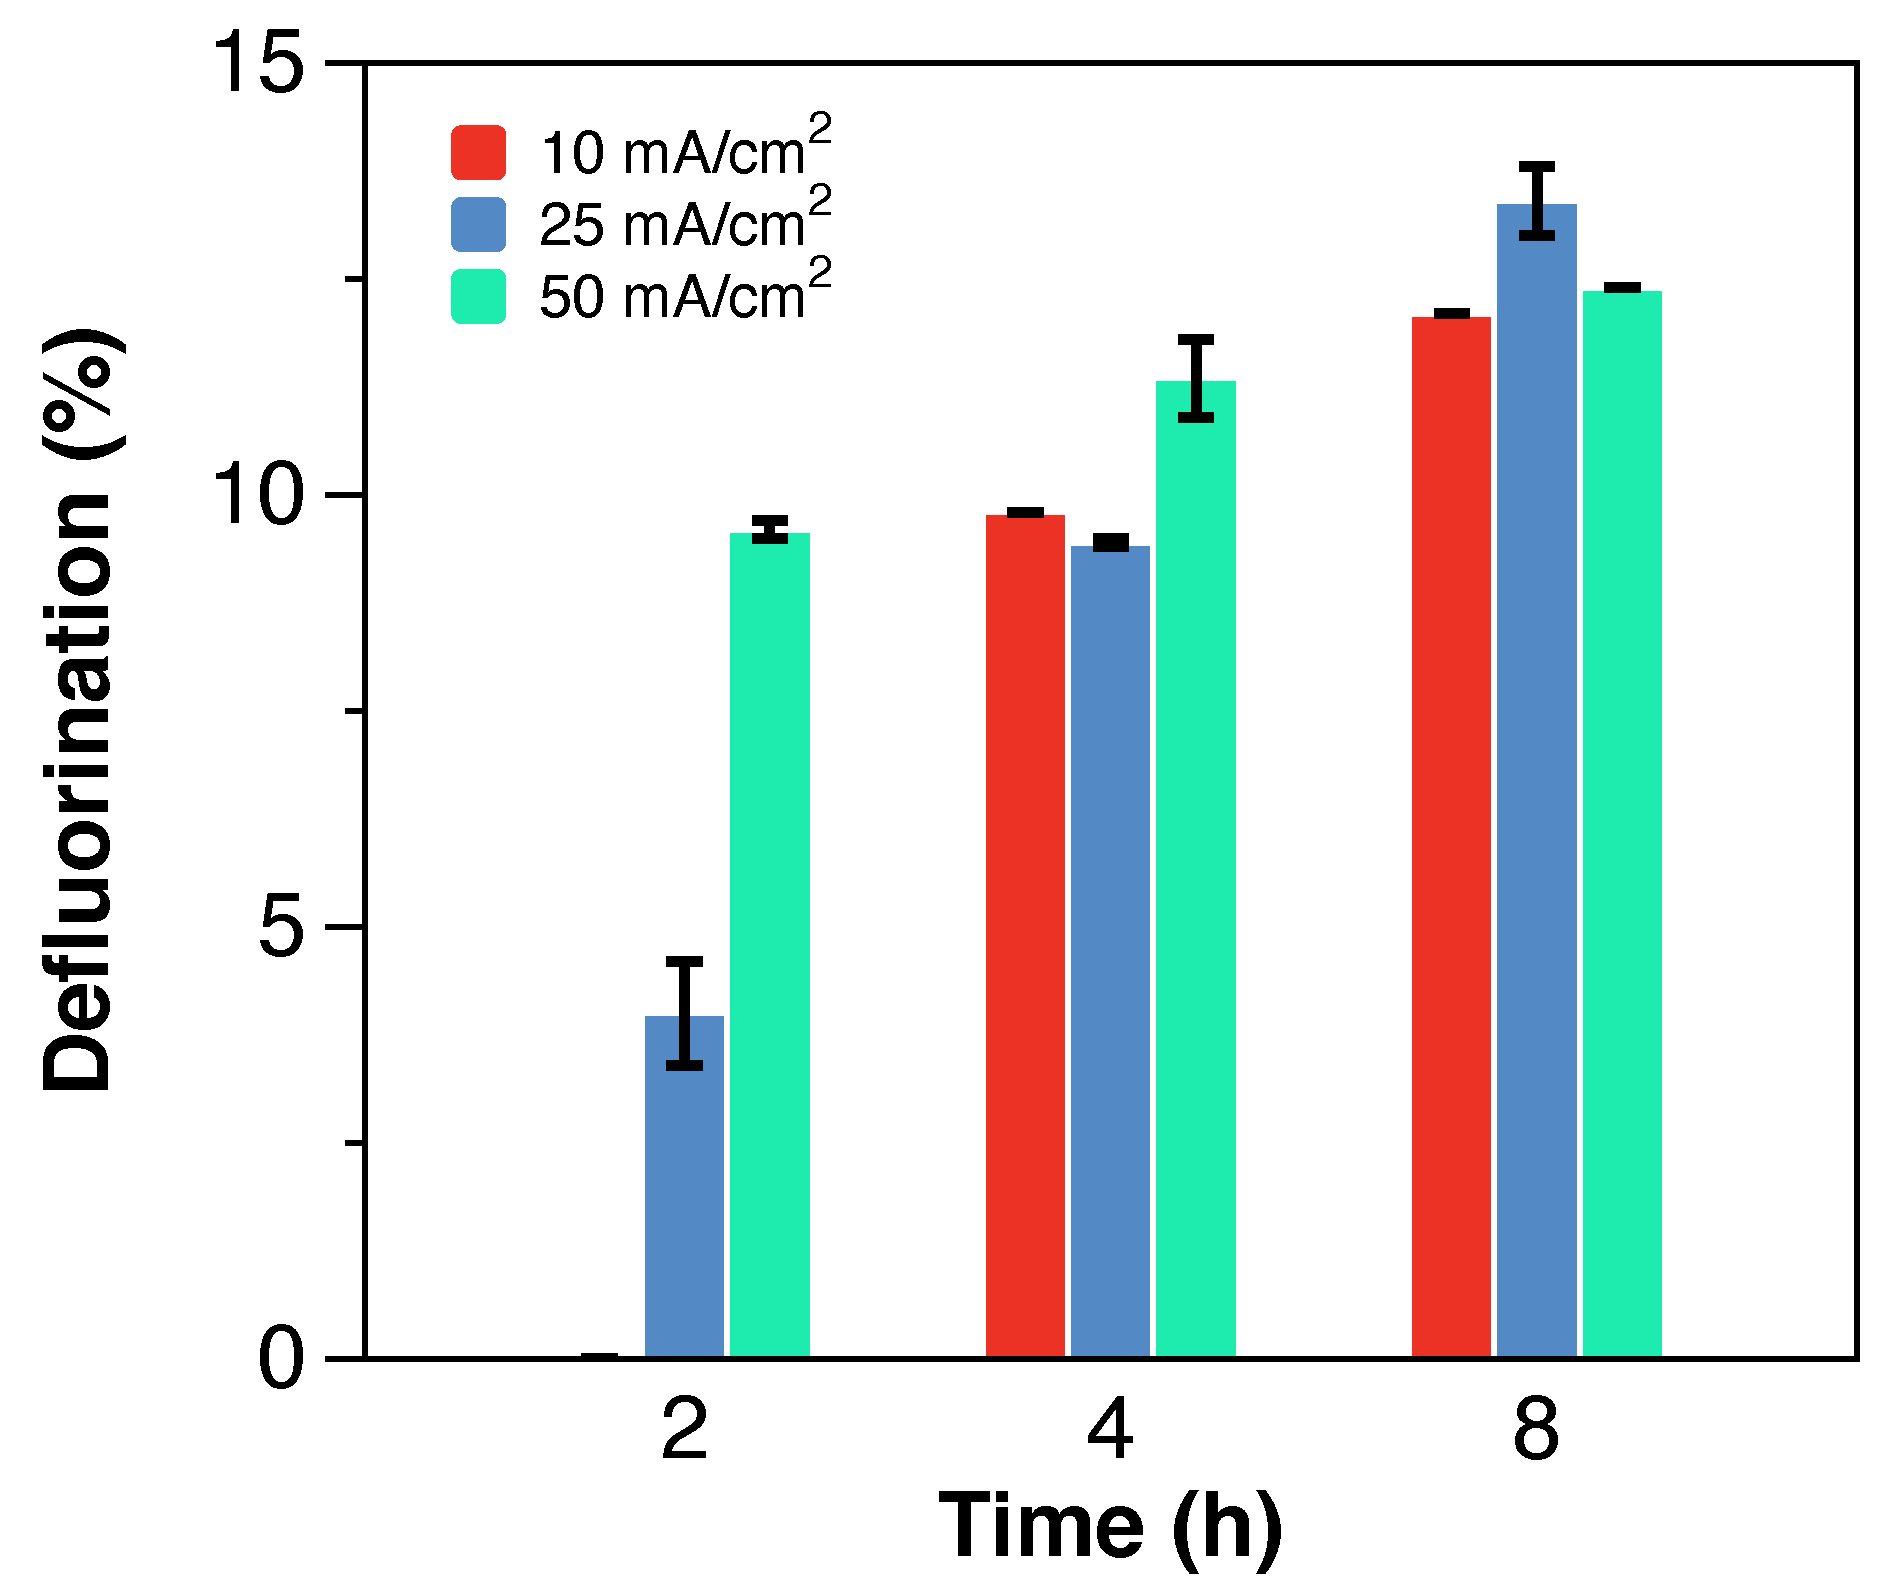
As shown in Figure 5, the CE decreases over time from 2.3 × 10 3 at 2 h of treatment to 8.6 × 10 4 at 8 h of treatment. A comparable but lower decreasing trend was observed at the semi-pilot scale, with 15 and 40% lower CE at 2 and 8 h of electrochemical treatment, respectively. The low and decreasing CE values, characteristic of mass-transfer limited electrochemical reactions with applied potentials above the water oxidation threshold, are attributed to competitive oxidation reactions from additional components of the solution (e.g., Cl, additional TOC) and water electrolysis reactions [27]. Nevertheless, the reported CE values are 5-fold greater than the values reported for the electrochemical treatment of low concentrations of PFAS in groundwater [29], showing that the efficiency of the electrochemical treatment of PFAS increases with highly concentrated solutions, such as still bottoms from IX spent regenerant solutions.
Finally, the electric energy per order (EEO) was determined using Equation (6) as follows [42]:
E E O = P t V l o g ( C / C 0 )
where P is the power of the system (W), V is the treatment volume (L), t is the treatment time (h), and C 0 and C are the initial and final PFAAs concentration. The energy required for 90% PFAAs removal with a current density of 50 mA/cm2 was 173 and 194 Wh/L for the laboratory and semi-pilot scales, respectively. Although the smaller inter-electrode distance in the semi-pilot-scale system provided a lower voltage, the faster degradation kinetics in the laboratory scale setup compensated the energy losses that result from a wider electrode gap, leading to a lower energy consumption required for the same order of removal. The latter highlights the importance of a fast degradation rate in the electrochemical process that allows for energy optimization.
Last, it is important to consider that the energy consumption for the electrochemical treatment of PFAS from still bottoms accounts for less than 0.01% of the total volume of water pre-treated with IX resins [10]. Therefore, the calculated energy required for the electrochemical treatment of the total volume of pre-treated water with IX is 0.017 Wh/L at the laboratory scale and 0.019 Wh/L at the semi-pilot scale. This outcome illustrates the benefits of a combined tandem IX- electrochemical oxidation process that allows for >99.9% energy reduction for the combined IX/EO technologies when compared to electrochemical oxidation of PFAAs alone.

4. Conclusions

This work focused on the evaluation of the electrochemical treatment of PFAAs from still bottoms at the laboratory and semi-pilot scales. Results at the laboratory scale showed >99% removal for total PFAAs, which included >95% removal for PFBA and >99% removal for PFOA, PFHxS, and PFOS, with 50 mA/cm2 after 8 h of electrochemical treatment. However, low defluorination values were reported. Competitive oxidation of Cl and PFAAs foam partitioning were attributed as the main factors for low defluorination. Additionally, the electrochemical treatment of a real still bottoms solution allowed for 93% removal of PFAAs after 24 h of treatment. However, 3-fold slower degradation kinetics for PFAAs compared to the synthetic still bottoms solution were measured, likely due to the presence of additional co-contaminants in the matrix.
The results from the semi-pilot scale presented slower degradation kinetics for total PFAAs removal with respect to the laboratory scale and allowed for 94% of total PFAAs removal after 8 h of treatment. Minimization of foaming and scaling up of smaller modules, rather than increasing the electrode size may help to improve the similarity between scales that provide an equivalent performance. The generation of ClO4 was not affected by the scale of treatment and corresponded to <2% of the initial concentration of Cl for both scales. Additionally, more than 99.9% of energy savings in electrochemical oxidation were estimated for the total volume of water treated with the IX, highlighting the benefits of combining tandem technologies.
Moreover, the addition of an anti-foaming agent (e.g., alcohol) may be necessary to avoid PFAS foam partitioning and consequently improve PFAAs degradation kinetics. Increasing the concentration of alcohol in the still bottoms could eliminate foaming while simultaneously reduce ClO4 generation. If the previous approach is effective, the increase in alcohol concentration could be achieved by reducing the distillation time of the regenerant solutions, which likely will reduce the distillation cost, providing two benefits: cost reduction of the tandem treatment and enhanced efficiency of the EO process.
Finally, although >99% and >90% of PFAAs removal was achieved in the laboratory and semi-pilot scale setups, the remaining concentration of PFAAs in solution exceeds the recommended limits established by the Environmental Protection Agency (EPA). An additional concentration post-treatment (e.g., reverse osmosis) could be incorporated at the end of the treatment to avoid low current efficiencies and high energy consumption in the EO of trace levels of PFAAs. This new solution could be recirculated for EO treatment.

Author Contributions

Conceptualization, V.Y.M.; methodology, V.Y.M.; validation, V.Y.M.; formal analysis, V.Y.M.; investigation, V.Y.M.; resources, M.F.B., M.G.N. and S.E.W.; writing—original draft preparation, V.Y.M.; writing—review and editing, V.Y.M., S.E.W., M.F.B. and M.G.N.; funding acquisition, M.F.B. All authors have read and agreed to the published version of the manuscript.

Funding

This research was funded by by the Michigan Economic Development Corporation (MEDC) through the Michigan Translational Research and Commercialization (MTRAC).

Institutional Review Board Statement

Not applicable.

Informed Consent Statement

Not applicable.

Acknowledgments

The authors thank Theresa Waeltermann and Callaghan Tyson Mayer for their exceptional technical assistance with various parts of this research. The authors also thank to the Environmental Research & Education Foundation (EREF) for their support to Maldonado.

Conflicts of Interest

The authors declare no conflict of interest.

Appendix A. Supplementary Information

Table A1. Characterization of the synthetic still bottoms solution used for the electrochemical treatment of PFAAs in both the laboratory and semi-pilot scales.
CompoundValue
pH7.7
Conductivity (mS/cm)110
PFBA (mg/L)74
PFOA (mg/L)86
PFHxS (mg/L)87
PFOS (mg/L)81
Chemguard C301 MS AFFF (% )0.1
Chloride (mg/L)41,670
Methanol (mg/L)10,000
TOC (mg/L)2400
Table A2. Characterization of the real still bottoms solution used for the electrochemical treatment of PFAAs at the laboratory scale.
CompoundValue
pH9.7
Conductivity (mS/cm)81.3
4:2 FTS (mg/L)1.4
6:2 FTS (mg/L)35.0
8:2 FTS (mg/L)0.4
PFBA (mg/L)95.8
PFPeS (mg/L)0.3
PFHxS (mg/L)98.0
PFHpA (mg/L)0.3
PFHpS (mg/L)0.3
PFOA (mg/L)88.4
PFOS (mg/L)59.3
Chloride (mg/L)41,000
Methanol (mg/L)28,000
TOC (mg/L )14,050
Table A3. Specifications of the electrochemical setup at the laboratory and semi-pilot scales.
ParameterLaboratory ScaleSemi-Pilot Scale
Number of cathodes25
Number of anodes36
Inter-electrode gap (mm)32
Electrode width (mm)2682
Anode area (cm2) 200 1400
Solution volume (L)214
Flow rate (L/min)26
Figure A1. Experimental setup for the electrochemical oxidation of PFAAs from IX still bottoms at the (a) laboratory and (b) semi-pilot scales.
Water 13 02873 g0a1

Appendix B. Analytical Procedure for PFAS Analysis Method

Water samples and quality control (QC) samples were spiked with internal standards. Solid phase extraction (SPE) was performed using Waters Oasis WAX cartridges. A mixture of ammonium hydroxide/methanol was used to elute PFAS from the sorbent into a collection vial. The extracts were concentrated to dryness using a nitrogen evaporator and then reconstituted in 1 mL of methanol. Samples were injected and ran on an Agilent LC-MS/MS system fixed with a C18 column to separate out various PFAS and a C18 delay column. The MS used an ion funnel in the negative ion mode to analyze the PFAS compounds of interest. Data analysis was performed using the Agilent QQQ Quantitative Analysis software to compare the retention time, mass spectra, ion ratio, etc., of the samples with the internal standards and calibration standards (shown in Table A3). The accepted recovery limits for quantification ranged between 50 and 150%.
Table A4. Calibration standards used for PFAS detection.
Analyte DescriptionMRL*Units
4:2 fluorotelomer sulfonate (4:2 FTS)2.0ng/L
6:2 fluorotelomer sulfonate (6:2 FTS)20.0ng/L
8:2 fluorotelomer sulfonate (8:2 FTS)2.0ng/L
N-ethylperfluorooctanesulfonamidoacetic acid (N-EtFOSAA)10.0ng/L
N-methylperfluorooctanesulfonamidoacetic acid (N-MeFOSAA)10.0ng/L
perfluorooctane sulfonamide (FOSA)10.0ng/L
Perfluorobutanesulfonic acid (PFBS)2.0ng/L
Perfluorobutanoic acid (PFBA)2.0ng/L
Perfluorodecanesulfonic acid (PFDS)2.0ng/L
Perfluorodecanoic acid (PFDA)2.0ng/L
Perfluorododecanoic acid (PFDoA)2.0ng/L
Perfluoroheptanesulfonic Acid (PFHpS)2.0ng/L
Perfluoroheptanoic acid (PFHpA)2.0ng/L
Perfluorohexanesulfonic acid (PFHxS)2.0ng/L
Perfluorohexanoic acid (PFHxA)2.0ng/L
Perfluorononanesulfonic acid (PFNS)2.0ng/L
Perfluorononanoic acid (PFNA)2.0ng/L
Perfluorooctanesulfonic acid (PFOS)2.0ng/L
Perfluorooctanoic acid (PFOA)2.0ng/L
Perfluoropentanesulfonic acid (PFPeS)2.0ng/L
Perfluoropentanoic acid (PFPeA)2.0ng/L
Perfluorotetradecanoic acid (PFTeDA)2.0ng/L
Perfluorotridecanoic acid (PFTrDA)2.0ng/L
Perfluoroundecanoic acid (PFUdA)2.0ng/L
4,8-dioxa-3H-perfluorononanoate (ADONA)2.0ng/L
Hexafluoropropylene oxide dimer acid (HFPO-DA)2.0ng/L
* MRL = minimum reporting limit.
Table A5. Values of surface area normalized pseudo-first-order degradation rate constants for the electrochemical treatment of PFAS in from a synthetic still bottoms solution.
ScaleCurrent Density (mA cm−2)ksa (m s−1)r2
lab102.02 × 10 6 0.9944
lab254.41 × 10 6 0.9846
lab501.37 × 10 5 0.9554
lab (real still bottoms)504.25 × 10 6 0.5343
semi-pilot508.44 × 10 6 0.9317
Figure A2. TOC removal over time during the electrochemical treatment of a synthetic still bottoms solution. The applied current densities were: 10 mA/cm2, 25 mA/cm2, and 50 mA/cm2.
Water 13 02873 g0a2
Figure A3. Decrease in concentration of individual PFAAs over time during the electrochemical treatment of a synthetic still bottoms solution at the laboratory scale. The applied current densities were: (a) 10 mA/cm2, (b) 25 mA/cm2, and (c) 50 mA/cm2.
Water 13 02873 g0a3
Table A6. Values of fluoride pseudo-first-order generation rate constants during the electrochemical treatment of PFAS in still bottoms.
ScaleCurrent Density (mA cm−2)k (s 1 )r2
lab106.08 × 10 5 0.9999
lab255.83 × 10 5 0.9744
lab501.72 × 10 5 0.8861
lab (real still bottom)504.89 × 10 5 0.9919
semi-pilot508.15 × 10 6 0.8994
Figure A4. Defluorination percentage during the electrochemical treatment of a synthetic still bottoms solution with 10, 25 and 50 mA/cm2.
Water 13 02873 g0a4
Figure A5. Fraction of molar F relative to t= 0 in PFCAs and PFSAs during the electrochemical oxidation of a synthetic still bottoms solution with 50 mA/cm2. (a,b) correspond to experimentation at the laboratory scale. (c,d) correspond to experimentation at the semi-pilot scale.
Water 13 02873 g0a5aWater 13 02873 g0a5b

References

  1. Suthersan, S.; Quinnan, J.; Horst, J.; Ross, I.; Kalve, E.; Bell, C.; Pancras, T. Making Strides in the Management of “Emerging Contaminants”. Groundw. Monit. Remediat. 2016, 36, 15–25. [Google Scholar] [CrossRef]
  2. Wickham, G.M.; Shriver, T.E. Emerging contaminants, coerced ignorance and environmental health concerns: The case of per- and polyfluoroalkyl substances (PFAS). Sociol. Health Illn. 2021, 43, 764–778. [Google Scholar] [CrossRef] [PubMed]
  3. Ross, I.; McDonough, J.; Miles, J.; Storch, P.; Thelakkat Kochunarayanan, P.; Kalve, E.; Hurst, J.; Dasgupta, S.; Burdick, J. A review of emerging technologies for remediation of PFASs. Remediation 2018, 28, 101–126. [Google Scholar] [CrossRef]
  4. Rahman, M.F.; Peldszus, S.; Anderson, W.B. Behaviour and fate of perfluoroalkyl and polyfluoroalkyl substances (PFASs) in drinking water treatment: A review. Water Res. 2014, 50, 318–340. [Google Scholar] [CrossRef]
  5. Kucharzyk, K.H.; Darlington, R.; Benotti, M.; Deeb, R.; Hawley, E. Novel treatment technologies for PFAS compounds: A critical review. J. Environ. Manage. 2017, 204, 757–764. [Google Scholar] [CrossRef] [PubMed]
  6. Woodard, S.; Berry, J.; Newman, B. Ion exchange resin for PFAS removal and pilot test comparison to GAC. Remediation 2017, 27, 19–27. [Google Scholar] [CrossRef]
  7. Franke, V.; McCleaf, P.; Lindegren, K.; Ahrens, L. Efficient removal of per- and polyfluoroalkyl substances (PFASs) in drinking water treatment: Nanofiltration combined with active carbon or anion exchange. Environ. Sci. Water Res. Technol. 2019, 5, 1836–1843. [Google Scholar] [CrossRef] [Green Version]
  8. Hang, X.; Chen, X.; Luo, J.; Cao, W.; Wan, Y. Removal and recovery of perfluorooctanoate from wastewater by nanofiltration. Sep. Purif. Technol. 2015, 145, 120–129. [Google Scholar] [CrossRef]
  9. Dixit, F.; Barbeau, B.; Mostafavi, S.G.; Mohseni, M. PFOA and PFOS removal by ion exchange for water reuse and drinking applications: Role of organic matter characteristics. Environ. Sci. Water Res. Technol. 2019, 5, 1782–1795. [Google Scholar] [CrossRef]
  10. Zaggia, A.; Conte, L.; Falletti, L.; Fant, M.; Chiorboli, A. Use of strong anion exchange resins for the removal of perfluoroalkylated substances from contaminated drinking water in batch and continuous pilot plants. Water Res. 2016, 91, 137–146. [Google Scholar] [CrossRef]
  11. Fang, Y.; Ellis, A.; Choi, J.; Boyer, T.H.; Higgins, C.P.; Schaefer, C.E.; Strathmann, T.J. Removal of Per-and Polyfluoroalkyl Substances (PFASs) in Aqueous Film-Forming Foam (AFFF) Using Ion-Exchange and Nonionic Resins. Cite This Environ. Sci. Technol. 2021, 55, 5011. [Google Scholar] [CrossRef]
  12. Solo-Gabriele, H.M.; Jones, A.S.; Lindstrom, A.B.; Lang, J.R. Waste type, incineration, and aeration are associated with per- and polyfluoroalkyl levels in landfill leachates. Waste Manag. 2020, 107, 191–200. [Google Scholar] [CrossRef] [PubMed]
  13. Maldonado, V.Y.; Landis, G.M.; Ensch, M.; Becker, M.F.; Witt, S.E.; Rusinek, C.A. A flow-through cell for the electrochemical oxidation of perfluoroalkyl substances in landfill leachates. J. Water Process Eng. 2021, 43, 102210. [Google Scholar] [CrossRef]
  14. Lang, J.R.; Allred, B.M.K.; Field, J.A.; Levis, J.W.; Barlaz, M.A. National Estimate of Per- and Polyfluoroalkyl Substance (PFAS) Release to U.S. Municipal Landfill Leachate. Environ. Sci. Technol. 2017, 51, 2197–2205. [Google Scholar] [CrossRef]
  15. Liu, S.; Zhao, S.; Liang, Z.; Wang, F.; Sun, F.; Chen, D. Perfluoroalkyl substances (PFASs) in leachate, fly ash, and bottom ash from waste incineration plants: Implications for the environmental release of PFAS. Sci. Total Environ. 2021, 795, 148468. [Google Scholar] [CrossRef]
  16. Schaefer, C.E.; Andaya, C.; Urtiaga, A.; McKenzie, E.R.; Higgins, C.P. Electrochemical treatment of perfluorooctanoic acid (PFOA) and perfluorooctane sulfonic acid (PFOS) in groundwater impacted by aqueous film forming foams (AFFFs). J. Hazard. Mater. 2015, 295, 170–175. [Google Scholar] [CrossRef] [PubMed]
  17. Pica, N.E.; Funkhouser, J.; Yin, Y.; Zhang, Z.; Ceres, D.M.; Tong, T.; Blotevogel, J. Electrochemical Oxidation of Hexafluoropropylene Oxide Dimer Acid (GenX): Mechanistic Insights and Efficient Treatment Train with Nanofiltration. Environ. Sci. Technol. 2019, 53, 12602–12609. [Google Scholar] [CrossRef]
  18. Gomez-Ruiz, B.; Gómez-Lavín, S.; Diban, N.; Boiteux, V.; Colin, A.; Dauchy, X.; Urtiaga, A. Efficient electrochemical degradation of poly- and perfluoroalkyl substances (PFASs) from the effluents of an industrial wastewater treatment plant. Chem. Eng. J. 2017, 322, 196–204. [Google Scholar] [CrossRef] [Green Version]
  19. Urtiaga, A.; Fernández-González, C.; Gómez-Lavín, S.; Ortiz, I. Kinetics of the electrochemical mineralization of perfluorooctanoic acid on ultrananocrystalline boron doped conductive diamond electrodes. Chemosphere 2015, 129, 20–26. [Google Scholar] [CrossRef] [Green Version]
  20. Barisci, S.; Suri, R. Electrooxidation of short and long chain perfluorocarboxylic acids using boron doped diamond electrodes. Chemosphere 2020, 243, 125349. [Google Scholar] [CrossRef]
  21. Shi, H.; Wang, Y.; Li, C.; Pierce, R.; Gao, S.; Huang, Q. Degradation of Perfluorooctanesulfonate by Reactive Electrochemical Membrane Compose of Magnéli Phase Titanium Suboxie. Environ. Sci. Technol. 2019, 53, 14528–14537. [Google Scholar] [CrossRef]
  22. Schaefer, C.E.; Tran, D.; Fang, Y.; Choi, Y.J.; Higgins, C.P.; Strathmann, T.J. Electrochemical treatment of poly- and perfluoroalkyl substances in brines. Environ. Sci. Water Res. Technol. 2020, 6, 2704–2712. [Google Scholar] [CrossRef]
  23. Soriano, A.; Schaefer, C.; Urtiaga, A. Enhanced Treatment of Perfluoroalkyl Acids in Groundwater by Membrane Separation and Electrochemical Oxidation. Chem. Eng. J. Adv. 2020, 4, 100042. [Google Scholar] [CrossRef]
  24. Wang, L.; Nickelsen, M.; Chiang, S.Y.; Woodard, S.; Wang, Y.; Liang, S.; Mora, R.; Fontanez, R.; Anderson, H.; Huang, Q. Treatment of perfluoroalkyl acids in concentrated wastes from regeneration of spent ion exchange resin by electrochemical oxidation using Magnéli phase Ti4O7 anode. Chem. Eng. J. Adv. 2021, 5, 100078. [Google Scholar] [CrossRef]
  25. Liang, S.; Pierce, R.; Lin, H.; Chiang, S.Y.D.; Huang, Q. Electrochemical oxidation of PFOA and PFOS in concentrated waste streams. Remediation 2018, 28, 127–134. [Google Scholar] [CrossRef]
  26. Anglada, Á.; Urtiaga, A.M.; Ortiz, I. Laboratory and pilot plant scale study on the electrochemical oxidation of landfill leachate. J. Hazard. Mater. 2010, 181, 729–735. [Google Scholar] [CrossRef]
  27. Kapałka, A.; Fóti, G.; Comninellis, C. Kinetic modelling of the electrochemical mineralization of organic pollutants for wastewater treatment. J. Appl. Electrochem. 2008, 38, 7–16. [Google Scholar] [CrossRef] [Green Version]
  28. Yang, S.; Fernando, S.; Holsen, T.M.; Yang, Y. Inhibition of Perchlorate Formation during the Electrochemical Oxidation of Perfluoroalkyl Acid in Groundwater. Environ. Sci. Technol. Lett. 2019, 6, 775–780. [Google Scholar] [CrossRef]
  29. Schaefer, C.E.; Choyke, S.; Ferguson, P.L.; Andaya, C.; Burant, A.; Maizel, A.; Strathmann, T.J.; Higgins, C.P. Electrochemical Transformations of Perfluoroalkyl Acid (PFAA) Precursors and PFAAs in Groundwater Impacted with Aqueous Film Forming Foams. Environ. Sci. Technol. 2018, 52, 10689–10697. [Google Scholar] [CrossRef]
  30. Panizza, M.; Cerisola, G. Direct and mediated anodic oxidation of organic pollutants. Chem. Rev. 2009, 109, 6541–6569. [Google Scholar] [CrossRef]
  31. Wang, Y.; Pierce, R.d.; Shi, H.; Li, C.; Huang, Q. Electrochemical degradation of perfluoroalkyl acids by titanium suboxide anodes. Environ. Sci. Water Res. Technol. 2020, 6, 144–152. [Google Scholar] [CrossRef]
  32. Schaefer, C.E.; Andaya, C.; Burant, A.; Condee, C.W.; Urtiaga, A.; Strathmann, T.J.; Higgins, C.P. Electrochemical treatment of perfluorooctanoic acid and perfluorooctane sulfonate: Insights into mechanisms and application to groundwater treatment. Chem. Eng. J. 2017, 317, 424. [Google Scholar] [CrossRef]
  33. Radjenovic, J.; Duinslaeger, N.; Avval, S.S.; Chaplin, B.P. Facing the Challenge of Poly- And Perfluoroalkyl Substances in Water: Is Electrochemical Oxidation the Answer? Environ. Sci. Technol. 2020, 54, 14815–14829. [Google Scholar] [CrossRef] [PubMed]
  34. Lin, H.; Niu, J.; Liang, S.; Wang, C.; Wang, Y.; Jin, F.; Luo, Q.; Huang, Q. Development of macroporous Magnéli phase Ti4O7 ceramic materials: As an efficient anode for mineralization of poly- and perfluoroalkyl substances. Chem. Eng. J. 2018, 354, 1058–1067. [Google Scholar] [CrossRef]
  35. Cañizares, P.; García-Gómez, J.; Fernández de Marcos, I.; Rodrigo, M.A.; Lobato, J. Measurement of Mass-Transfer Coefficients by an Electrochemical Technique. J. Chem. Educ. 2006, 83. [Google Scholar] [CrossRef]
  36. Goodridge, F.; Scott, K. Electrochemical Process Engineering: A Guide to the Design of Electrolytic Plant; Plenum Press: New York, NY, USA, 1995. [Google Scholar] [CrossRef]
  37. Santos, J.L.; Geraldes, V.; Velizarov, S.; Crespo, J.G. Characterization of fluid dynamics and mass-transfer in an electrochemical oxidation cell by experimental and CFD studies. Chem. Eng. J. 2010, 157, 379–392. [Google Scholar] [CrossRef]
  38. Silva, J.A.; Martin, W.A.; McCray, J.E. Air-water interfacial adsorption coefficients for PFAS when present as a multi-component mixture. J. Contam. Hydrol. 2021, 236, 103731. [Google Scholar] [CrossRef]
  39. Pletcher, D.; Walsh, F. Industrial Electrochemistry, 2nd ed.; Springer: Dordrecht, The Netherlands, 1993; p. 672. [Google Scholar] [CrossRef]
  40. Martínez-Huitle, C.A.; Rodrigo, M.A.; Sirés, I.; Scialdone, O. Single and Coupled Electrochemical Processes and Reactors for the Abatement of Organic Water Pollutants: A Critical Review. Chem. Rev. 2015, 115, 13362–13407. [Google Scholar] [CrossRef]
  41. Comninellis, C.; Chen, G. Electrochemistry for the Environment; Springer: New York, NY, USA, 2010; pp. 1–563. [Google Scholar] [CrossRef]
  42. Radjenovic, J.; Escher, B.I.; Rabaey, K. Electrochemical degradation of the b-blocker metoprolol by Ti/Ru0.7Ir0.3O2 and Ti/ SnO2-Sb electrodes. Water Res. 2011, 45, 3205. [Google Scholar] [CrossRef] [Green Version]
Figure 1. (a) Decrease in total PFAAs concentration and (b) fluoride generation over time for the electrochemical oxidation of a synthetic spent regenerant solution with 10, 25, and 50 mA/cm2. Error bars represent the standard deviation of replicates.
Water 13 02873 g001

0.45
(a) t

.45
(b) t
Figure 2. (a) Concentration of individual PFAS during the electrochemical treatment of a real still bottoms sample. The applied current density was 50 mA/cm2. (b) Concentration of individual PFAS with concentrations lower than 30 mg/L. Inset depicts the evolution of PFAS with concentrations lower than 3 mg/L.
Water 13 02873 g002

0.45
(a) t

.45
(b) t
Figure 3. Decrease in total PFAAs concentration during the electrochemical treatment of a synthetic still bottoms solution with 50 mA/cm2 in laboratory and semi-pilot scale systems. Inset shows the pseudo-first-order removal rate for PFAAs for both system scales.
Water 13 02873 g003
Figure 4. Perchlorate generation during the electrochemical treatment of (a) synthetic still bottoms solution with 10, 25 and 50 mA/cm2, (b) real still bottoms at the laboratory scale, synthetic still bottoms at the laboratory scale, and synthetic synthetic still bottoms in a semi-pilot scale with 50 mA/cm2.
Water 13 02873 g004

0.38
(a) t

0.38
(b) t
Figure 5. Coulombic efficiency (CE) for fluoride generation during the electrochemical treatment of a synthetic still bottoms solution at the laboratory and semi-pilot scales. The applied current density was 50 mA/cm2.
Water 13 02873 g005
Publisher’s Note: MDPI stays neutral with regard to jurisdictional claims in published maps and institutional affiliations.

