
Land Degradation and Soil Conservation Measures in the Moldavian Plateau, Eastern Romania: A Case Study from the Racova Catchment

 ,
,
Abstract
:1. Introduction
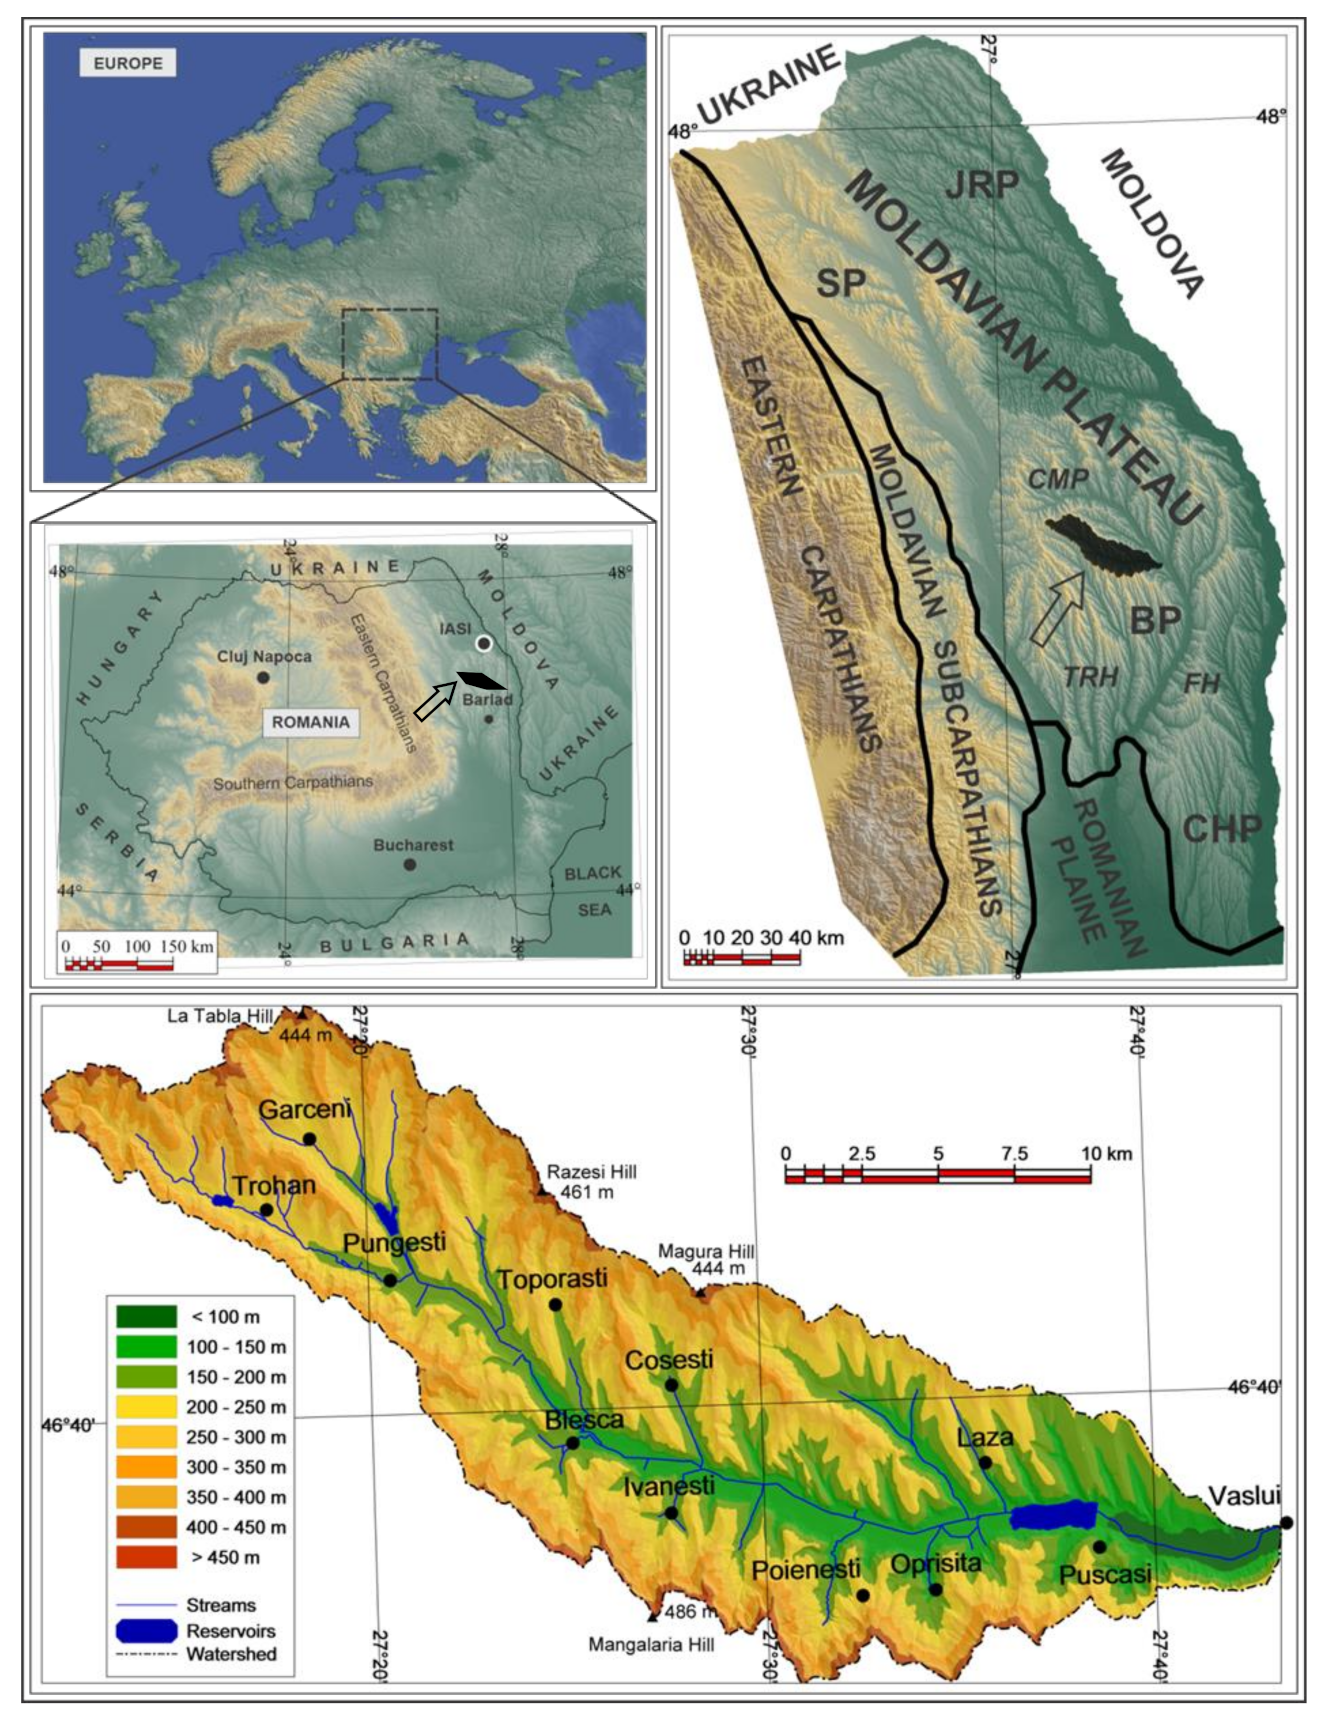
2. Study Area
3. Methods
4. Results and Discussion
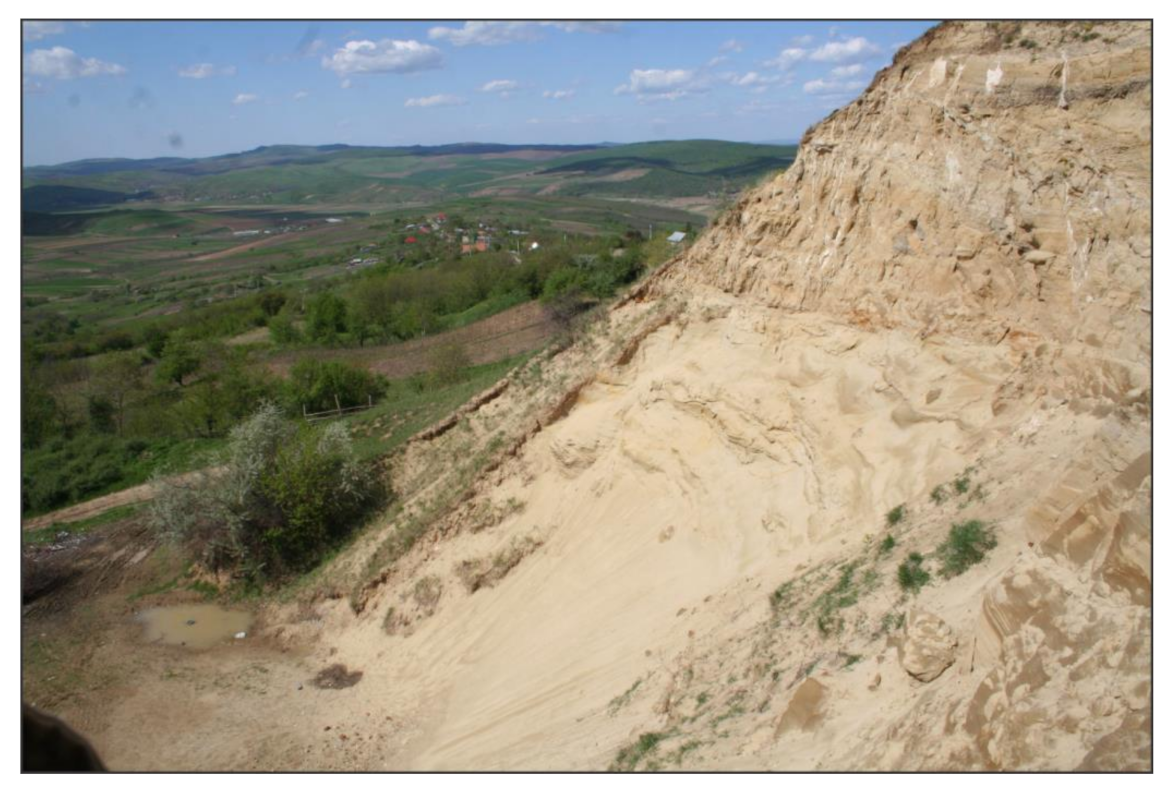
4.1. Land Degradation
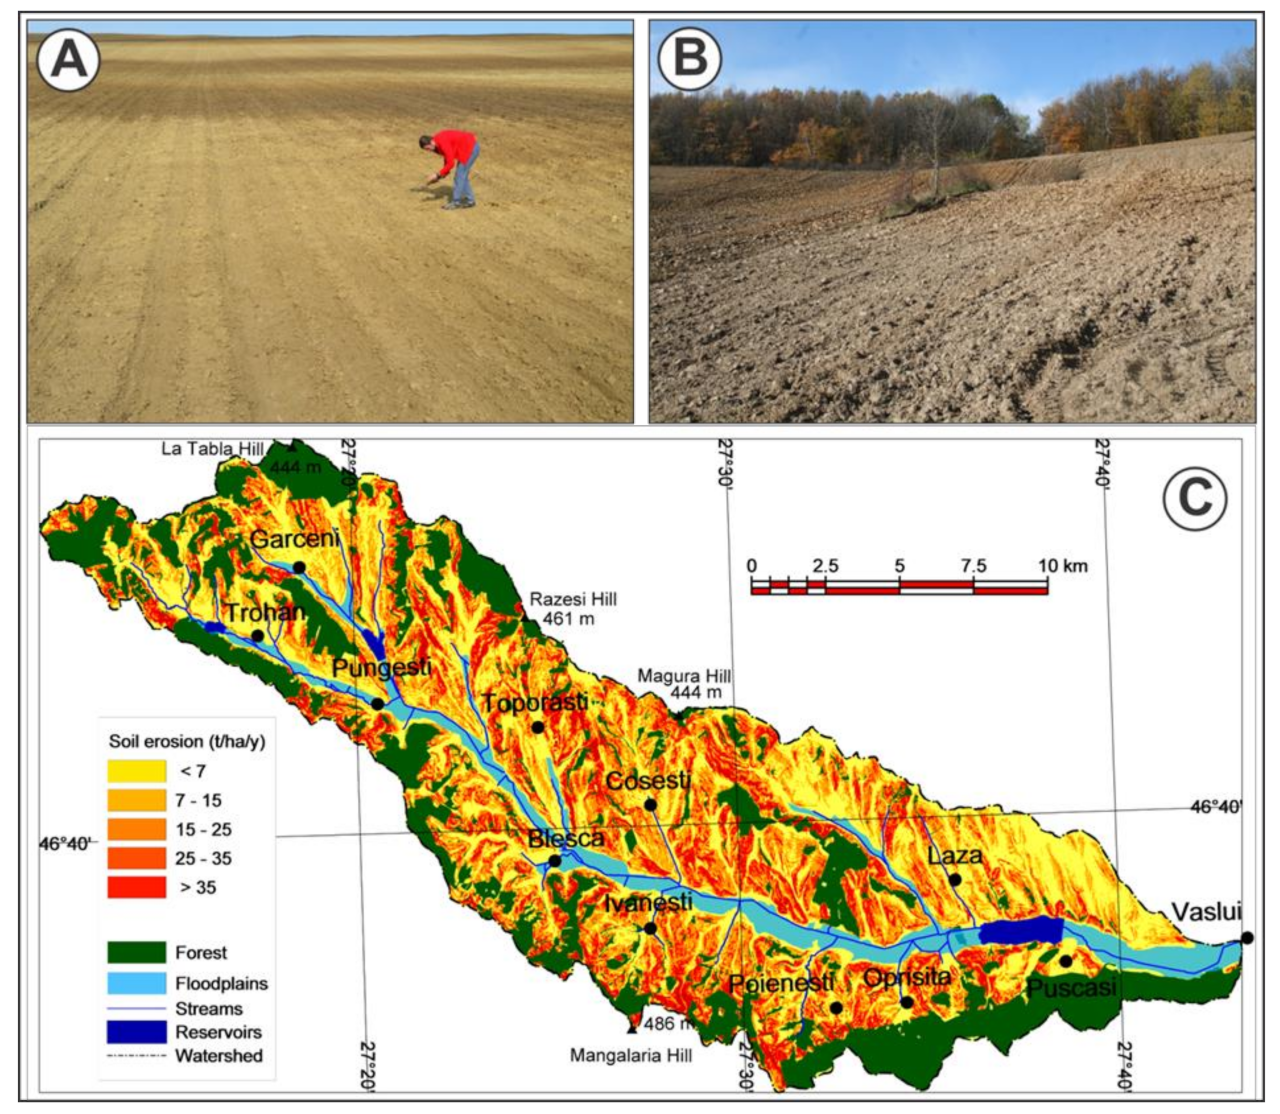
4.1.1. Erosion
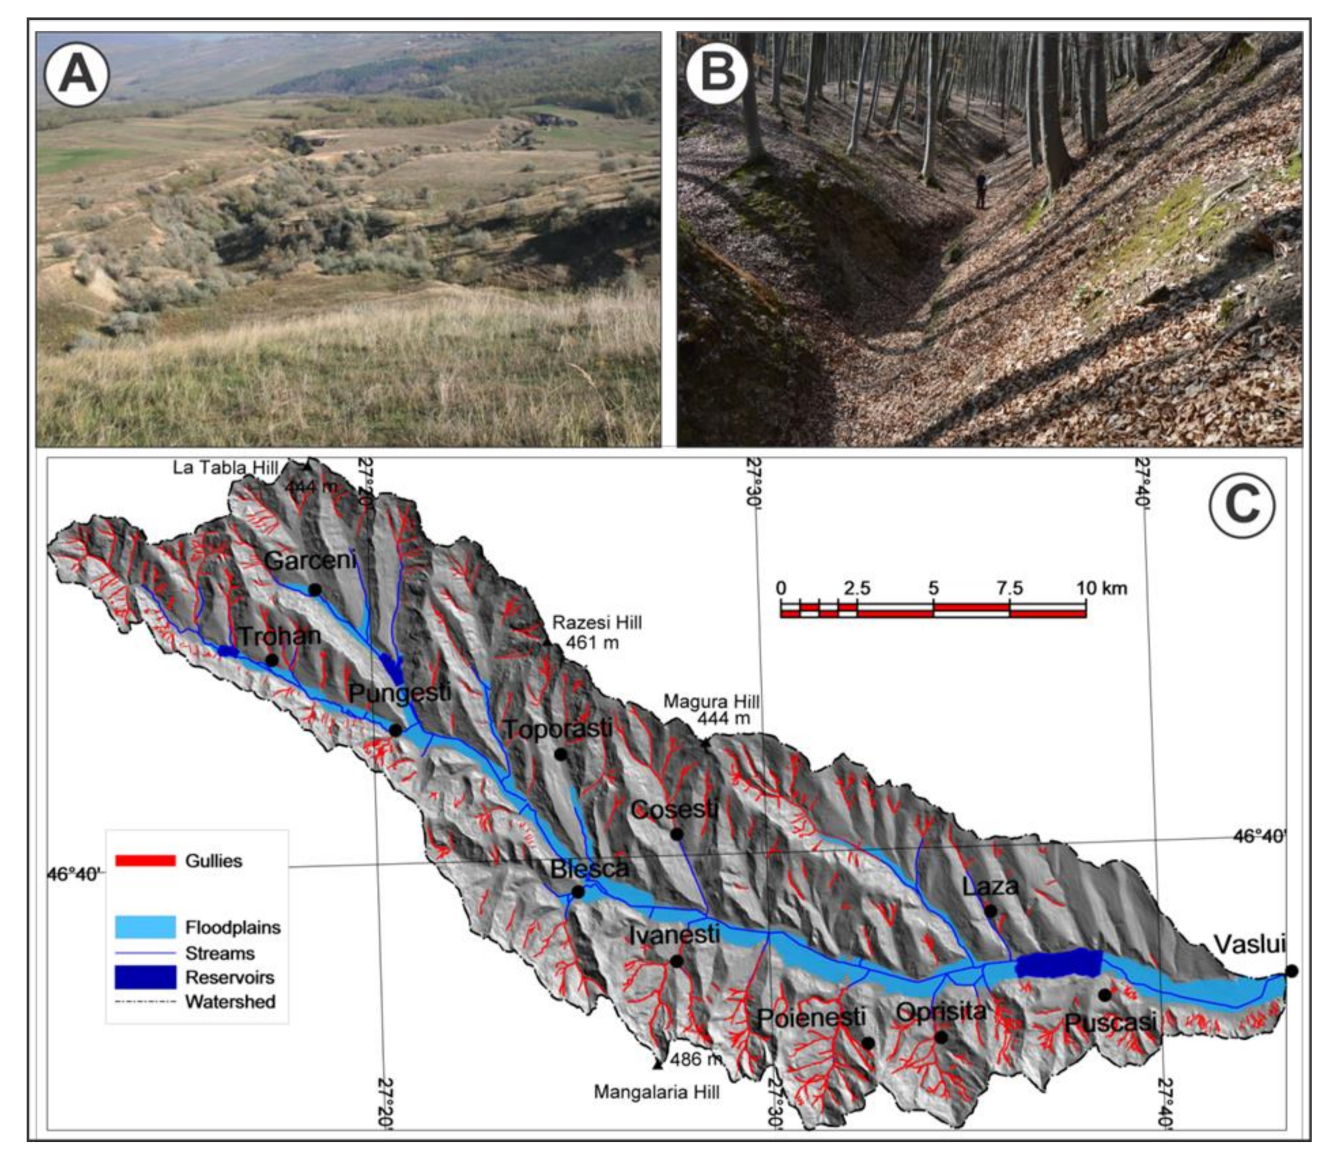
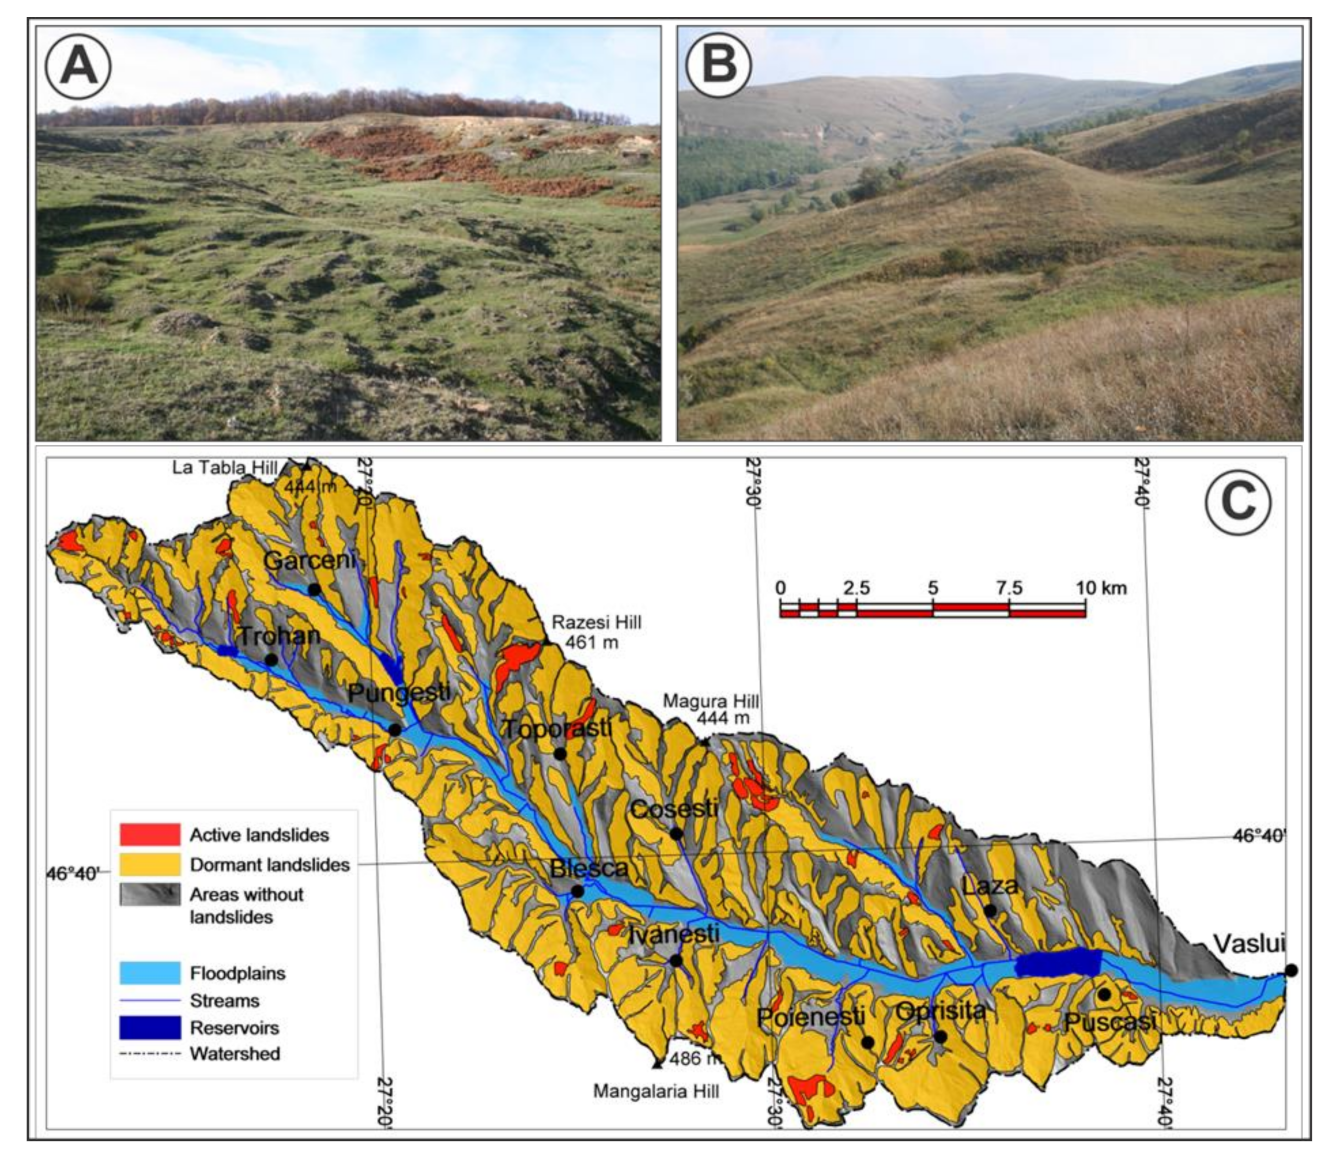
4.1.2. Landslides
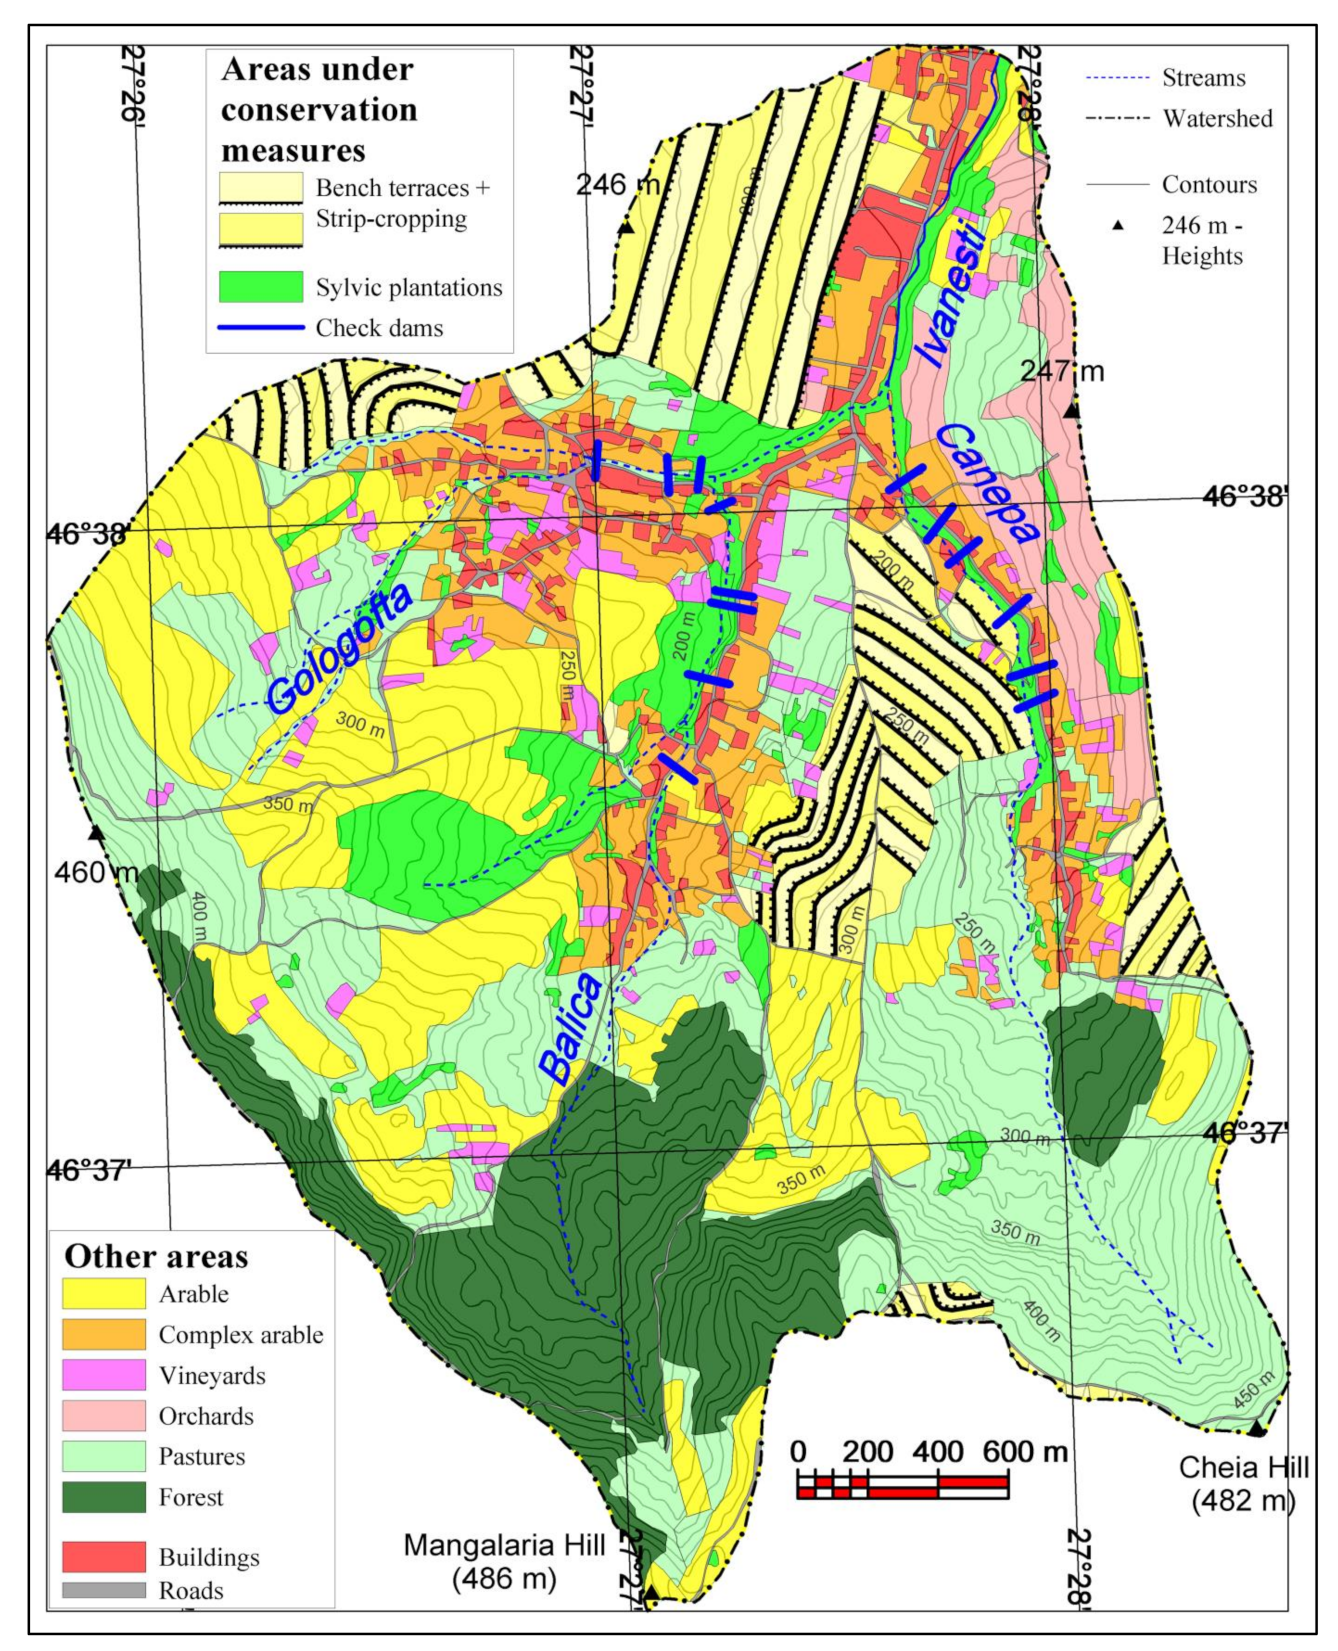
4.2. Evolution of Soil Conservation Measures
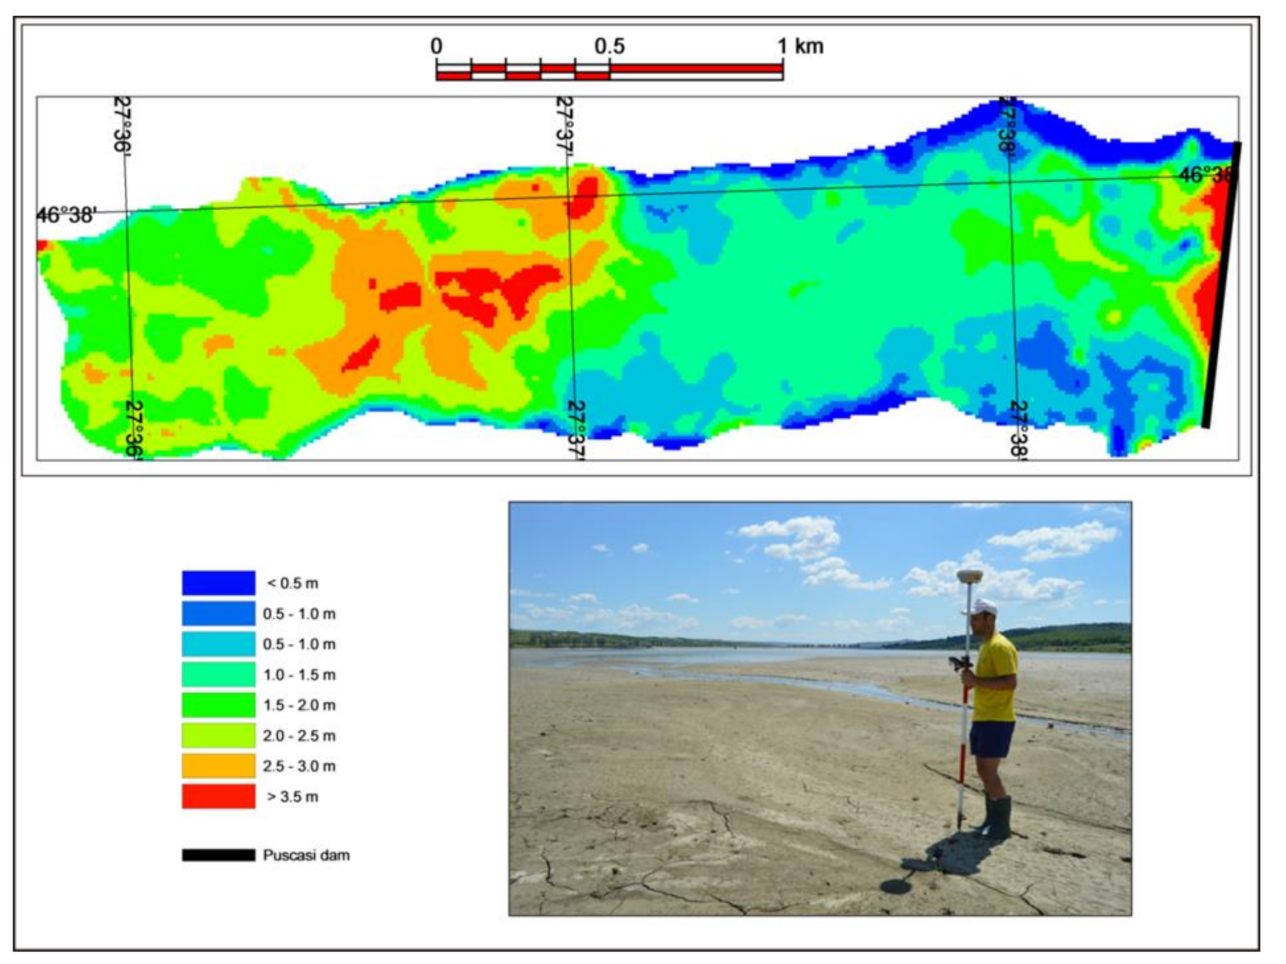
- The design and construction of dams and reservoirs, such as Puscasi in 1973 (lake area 257 ha at normal retention level/NRL) and Trohan in 1982 (21 ha at NRL) on the Racova floodplain, and Pungesti-Garceni on the Garceneanca floodplain in 1976 (61 ha at NRL).
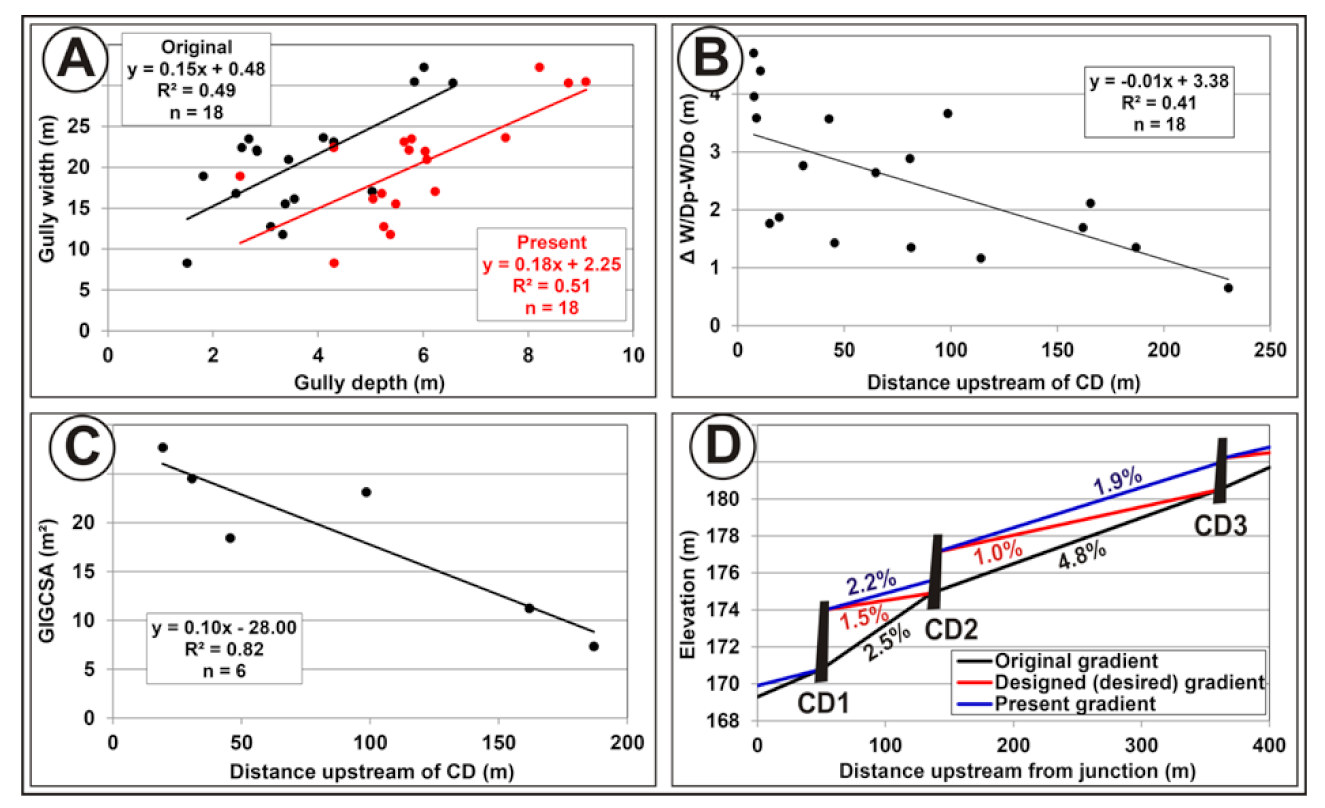
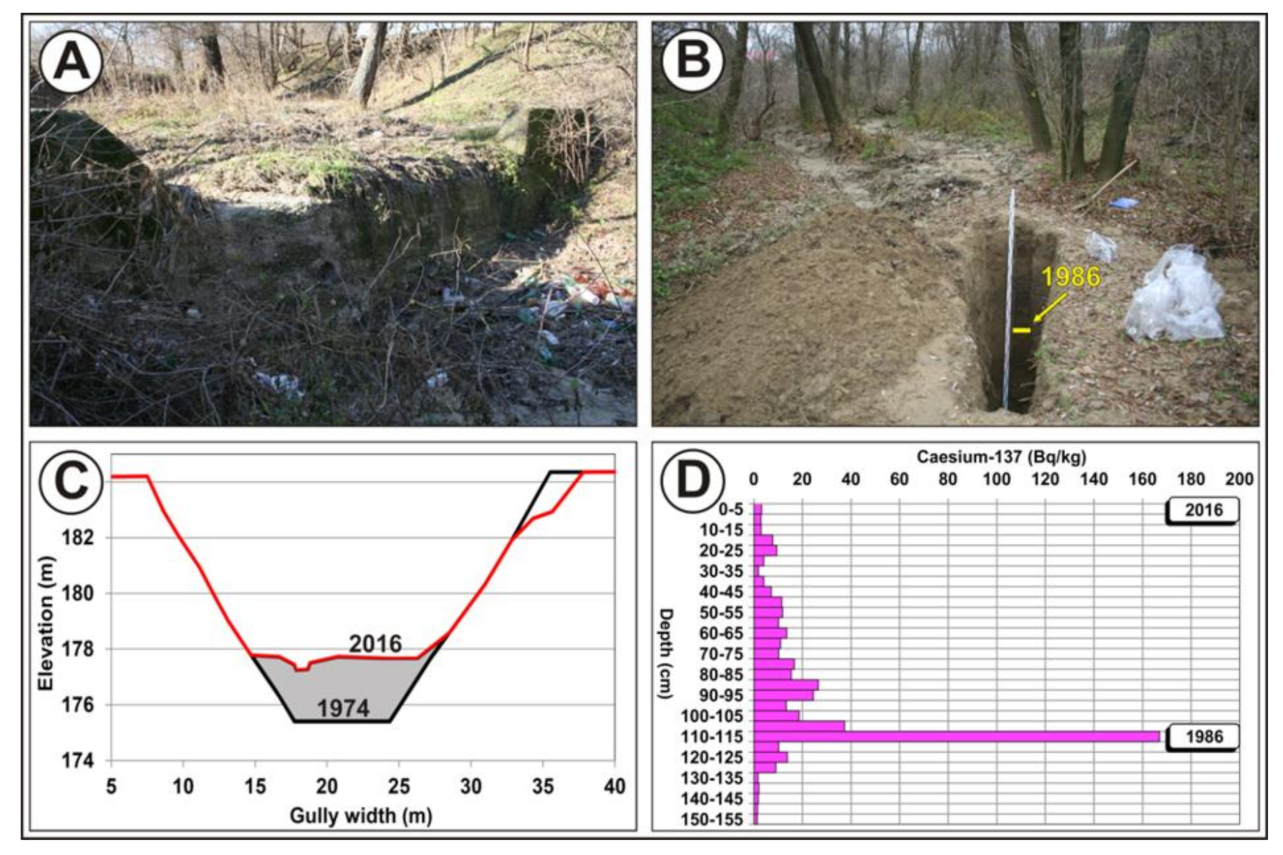
- Design and construction of check-dams to control gully erosion in the tributaries of the River Racova.
- Design and implementation of soil conservation practices on slopes in large farms, namely: strip-cropping, buffer strip cropping and especially bench terraces.
- Design and building of drainage systems.
- Filling small gullies, land reshaping using topsoil, and improving pastures.
- Large-scale afforestation on 1704 ha on landslides and gullies, especially using black locust (Robinia pseudoacacia) and populus. Some 1001 ha of the afforested area were established by the Vaslui Silvic Enterprise and 703 ha by IEELIF Vaslui.
4.3. Reservoir Sedimentation
5. Conclusions
- (1)
- The 32,098 ha Racova Catchment on the Moldavian Plateau of eastern Romania is highly susceptible to land degradation, due to both natural conditions and human impacts.
- (2)
- The mean value of soil losses by water erosion (rill and inter-rill) on agricultural land was estimated to be 21.6 t ha−1y−1. By adding the woodland contribution, this value decreased to 15.6 t ha−1y−1 and accounted for 68.7% of gross (total) erosion. The specific sediment yield by gully erosion was estimated at 7.1 t ha−1y−1 and averaged (31.2) 31.3% of the sediment mass eroded by water.
- (3)
- The estimated mean long-term (1973–2017) sedimentation rate reached 4.7 cm y−1 in the Puscasi Reservoir at the catchment outlet and the estimated associated sediment delivery ratio (SDR) was 0.28. The initial area of the Puscasi Reservoir at normal retention level (NRL) had decreased by 32% and the water storage capacity had decreased by 39% over 44 years.
- (4)
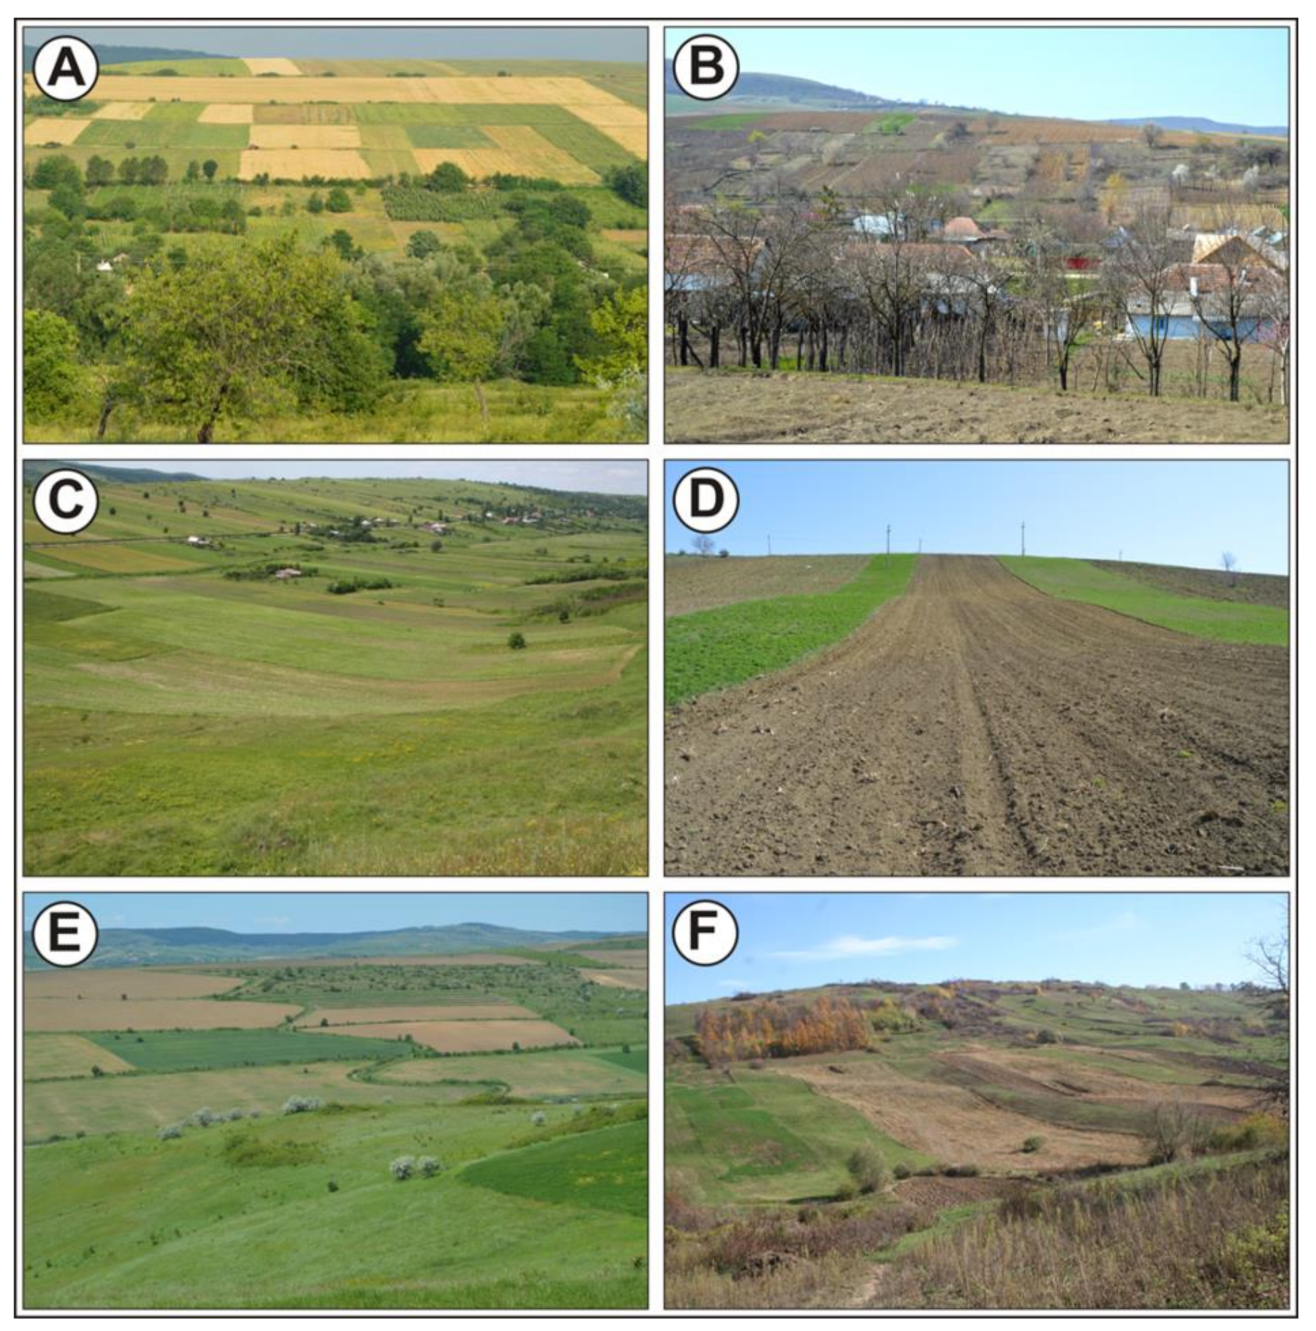
- Despite proper conservation measures that were designed and applied over a 20-year time-span from 1970–1990, after implementing the provisions of Act No. 18/1991, the contour farming system collapsed and returned to the traditional ‘up-and-down slope’ farming system on very small plots.
Author Contributions
Funding
Institutional Review Board Statement
Informed Consent Statement
Acknowledgments
Conflicts of Interest
Appendix A

| Categories | Sub-Categories | Area | |
|---|---|---|---|
| ha | % of Total | ||
| Arable | Total | 13,203.95 | 40.13 |
| Proper arable | 11,648.58 | 35.40 | |
| Complex arable | 1555.37 | 4.73 | |
| Pastures | 8588.98 | 26.10 | |
| Vineyards | 556.85 | 1.69 | |
| Orchards | 47.33 | 0.14 | |
| Total agricultural land | 22,397.11 | 68.06 | |
| Woodland | Total | 7431.56 | 22.58 |
| Forest | 5727.98 | 17.40 | |
| Silvic plantations | 1703.58 | 5.18 | |
| Bushes & thorn bushes | 1181.91 | 3.59 | |
| Water land | Lakes | 270.91 | 0.82 |
| Roads | 319.68 | 0.97 | |
| Land with buildings | Total | 821.03 | 2.49 |
| Yards. buildings | 713.65 | 2.17 | |
| Buildings & industrial yards | 105.80 | 0.32 | |
| Dams | 1.58 | 0.003 | |
| Wasteland | 485.80 | 1.48 | |
| Total non-agricultural land | 105,10.89 | 31.94 | |
| General total | 32,908.00 | 100.00 | |
| Gully | Check Dam (CD) | Location Upstream of Junction with (UJW) or Upstream of Check Dam (UCD) | Trapezoidal Spillway | Obs. | |||
|---|---|---|---|---|---|---|---|
| B (m) | b (m) | H (m) | Useful Height (Hu) as the Difference between Spillway Crest and Stilling Basin (m) | Sediment Thickness on Stilling Basin (SB) (m) | |||
| Canepa | CD1 | 295.4 m UJW Ivanesti | 5.7 | 3.2 | 1.1 | 4.2 | 1.8 |
| CD2 | 182.5 m UCD1 | 6.6 | 3.8 | 1.2 | 2.2 | 1.3 | |
| CD3 | 100.1 m UCD2 | 6.8 | 4.1 | 1.0 | 2.0 | 1 | |
| CD4 | 241.6 m UCD3 | 7.8 | 4.8 | 1.55 | 2.95 | 1 | |
| CD5 | 193.0 m UCD4 | 5.95 | 4.8 | 0.5 | 1.2 | 0.95 | |
| CD6 | 88.1 m UCD5 | 6.5 | 4.0 | 1.2 | 3.2 | 1.1 | |
| Balica | CD1 | 89.0 m UJW Gologofta | 8 | 5.5 | 1.2 | 3.5 | 0.5 |
| CD2 | 277.3 m UCD1 | 4.0 | 3.2 | 0.75 | 2.1 | 0.7 | |
| CD3 | 21.2 m UCD2 | 6.1 | 4.2 | 1.2 | 1.5 | Destroyed SB | |
| CD4 | 228.9 m UCD3 | 5.45 | 2.8 | 1.0 | 2.8 | SB without baffle piers | |
| CD5 | 283.8 m UCD4 | 5.4 | 3.0 | 1.1 | 2.7 | 1.30 | |
| Gologofta | CD1 | 50.4 m UJW Balica | 5.90 | 2.95 | 1.3 | 3.2 | Clean SB |
| CD2 | 85.5 m UCD1 | 8.65 | 6.62 | 1.0 | 2.2 | 0.7 | |
| CD3 | 225 m UCD2 | 6.72 | 4.25 | 1.0 | 1.7 | 1.5 | |
| Gully | Cross-Section No. | Location Upstream of Check Dam (UCD) | Ratio between the Present and Original Depth (Dp/Do) | Difference between the Present and Original W/D Ratios (Wp/Dp—Wo/Do) | Ratio between the Present and Original Area of Cross-Section (CSp/CSo) |
|---|---|---|---|---|---|
| Gologofta | 1 | 187 m UCD 2 | 0.62 | 1.35 | 0.80 |
| 2 | 162 m UCD 2 | 0.59 | 1.69 | 0.71 | |
| 3 | 98.6 m UCD 2 | 0.47 | 3.66 | 0.59 | |
| 4 | 30.8 m UCD 2 | 0.57 | 2.76 | 0.70 | |
| 5 | 45.6 m UCD 3 | 0.73 | 1.43 | 0.88 | |
| 6 | 19.4 m UCD 3 | 0.64 | 1.87 | 0.80 | |
| Balica | 1 | 80.7 m UCD 1 | 0.72 | 2.88 | 0.77 |
| 2 | 7.6 m UCD 1 | 0.49 | 3.96 | 0.63 | |
| 3 | 7.5 m UCD 2 | 0.46 | 4.71 | 0.63 | |
| 4 | 114.0 m UCD 5 | 0.75 | 1.16 | 0.86 | |
| Canepa | 1 | 8.8 m UCD 1 | 0.35 | 3.58 | 0.58 |
| 2 | 42.9 m UCD 2 | 0.59 | 3.57 | 0.75 | |
| 3 | 10.6 m UCD 3 | 0.47 | 4.40 | 0.58 | |
| 4 | 230.4 m UCD 4 | 0.81 | 0.65 | 0.92 | |
| 5 | 15.0 m UCD 4 | 0.62 | 1.76 | 0.81 | |
| 6 | 81.3 m UCD 5 | 0.70 | 1.35 | 0.86 | |
| 7 | 165.6 m UCD 6 | 0.76 | 2.11 | 0.98 | |
| 8 | 64.8 m UCD 6 | 0.54 | 2.64 | 0.68 |
References
- Dotterweich, M. The history of soil erosion and fluvial deposits in small catchments of central Europe: Deciphering the long-term interaction between humans and the environment—A review. Geomorphology 2008, 101, 192–208. [Google Scholar] [CrossRef]
- Poesen, J. Soil erosion in the Anthropocene: Research needs. Earth Surf. Process. Landf. 2018, 43, 64–84. [Google Scholar] [CrossRef]
- Panagos, P.; Ballabio, C.; Himics, M.; Scarpa, S.; Matthews, F.; Bogonos, M.; Poesen, J.; Borrelli, P. Projections of soil loss by water erosion in Europe by 2050. Environ. Sci. Policy 2021, 124, 380–392. [Google Scholar] [CrossRef]
- Garcia-Ruiz, J.M.; Begueria, S.; Nadal-Romero, E.; Gonzalez-Hidalgo, J.C.; Lana-Renault, N.; Sanjuan, Y. A meta-analysis of soil erosion rates across the world. Geomorphology 2015, 239, 160–173. [Google Scholar] [CrossRef] [Green Version]
- Panagos, P.; Katsoyiannis, A. Soil erosion modelling: The new challenges as the result of policy developments in Europe. Environ. Res. 2019, 172, 470–474. [Google Scholar] [CrossRef]
- Golosov, V.; Gusarov, A.; Litvin, L.; Yermolaev, O.; Chizhikova, N.; Safina, G.; Kiryukhina, Z. Evaluation of soil erosion rates in the southern half of the Russian Plain: Methodology and initial results. Proc. Int. Assoc. Hydrol. Sci. 2017, 375, 23. [Google Scholar] [CrossRef]
- Patriche, C.V. Quantitative assessment of rill and interrill soil erosion in Romania. Soil Use Manag. 2019, 35, 257–272. [Google Scholar] [CrossRef]
- Navas, A.; Machín, J.; Soto, J. Assessing soil erosion in a Pyrenean mountain catchment using GIS and fallout 137Cs. Agric. Ecosyst. Environ. 2005, 105, 493–506. [Google Scholar] [CrossRef] [Green Version]
- Niacșu, L.; Sfîcă, L.; Ursu, A.; Ichim, P.; Bobric, D.E.; Breabăn, I.G. Wind erosion on arable lands, associated with extreme blizzard conditions within the hilly area of Eastern Romania. Environ. Res. 2019, 169, 86–101. [Google Scholar] [CrossRef] [PubMed]
- Maetens, W.; Vanmaercke, M.; Poesen, J.; Jankauskas, B.; Jankauskiene, G.; Ionita, I. Effects of land use on annual runoff and soil loss in Europe and the Mediterranean: A meta-analysis of plot data. Prog. Phys. Geogr. Earth Environ. 2012, 36, 599–653. [Google Scholar] [CrossRef]
- Panagos, P.; Borrelli, P.; Poesen, J.; Ballabio, C.; Lugato, E.; Meusburger, K.; Montanarella, L.; Alewell, C. The new assessment of soil loss by water erosion in Europe. Environ. Sci. Policy 2015, 54, 438–447. [Google Scholar] [CrossRef]
- Borrelli, P.; Robinson, D.A.; Panagos, P.; Lugato, E.; Yang, J.E.; Alewell, C.; Ballabio, C. Land use and climate change impacts on global soil erosion by water (2015–2070). Proc. Natl. Acad. Sci. USA 2020, 117, 21994–22001. [Google Scholar] [CrossRef]
- Stefanidis, S.; Alexandridis, V.; Chatzichristaki, C.; Stefanidis, P. Assessing soil loss by water erosion in a typical mediterranean ecosystem of northern Greece under current and future rainfall erosivity. Water 2021, 13, 2002. [Google Scholar] [CrossRef]
- Kostadinov, S.; Braunović, S.; Dragićević, S.; Zlatić, M.; Dragović, N.; Rakonjac, N. Effects of erosion control works: Case study—Grdelica Gorge, the South Morava River (Serbia). Water 2018, 10, 1094. [Google Scholar] [CrossRef] [Green Version]
- Maetens, W.; Poesen, J.; Vanmaercke, M. How effective are soil conservation techniques in reducing plot runoff and soil loss in Europe and the Mediterranean? Earth Sci. Rev. 2012, 115, 21–36. [Google Scholar] [CrossRef] [Green Version]
- Xiong, M.; Sun, R.; Chen, L. Effects of soil conservation techniques on water erosion control: A global analysis. Sci. Total Environ. 2018, 645, 753–760. [Google Scholar] [CrossRef]
- Gusarov, A.V. The impact of contemporary changes in climate and land use/cover on tendencies in water flow, suspended sediment yield and erosion intensity in the northeastern part of the Don River basin, SW European Russia. Environ. Res. 2019, 175, 468–488. [Google Scholar] [CrossRef]
- Tošić, R.; Dragićević, S.; Zlatić, M.; Todosijević, M.; Kostadinov, S. The impact of socio-demographic changes on land use and soil erosion (case study: Ukrina river catchment). Geogr. Rev. 2012, 46, 69–78. [Google Scholar]
- Kijowska-Strugata, M.; Bucata-Hrabia, A.; Demczuk, P. Long-term impact of land use changes on soil erosion in an agricultural catchment (in the Western Polish Carpathians). Land Degrad. Dev. 2018, 29, 1871–1884. [Google Scholar] [CrossRef]
- Spalević, V.; Barović, G.; Vujacić, D.; Curović, M.; Behzadfar, M.; Ðurović, N.; Dudić, B.; Billi, P. The impact of land use changes on soil erosion in the river basin of Miocki Potok, Montenegro. Water 2020, 12, 2973. [Google Scholar] [CrossRef]
- Bacauanu, V.; Barbu, N.; Pantazica, M.; Ungureanu, A.L.; Chiriac, D. The Moldavian Plateau-Nature, Man, Society; Scientific and Encyclopedic Publishing House: Bucharest, Romania, 1980. [Google Scholar]
- Ungureanu, A. Geography of the Romanian Plateaus and Plains; “Al. I. Cuza” University Publishing House: Iasi, Romania, 1993. [Google Scholar]
- Motoc, M. Average Rate of Soil Erosional Degradation in R.S. Romania; Buletin Informativ ASAS, 2: Bucharest, Romania, 1983; pp. 67–73. [Google Scholar]
- Brooks, A.P.; Shellberg, J.G.; Knight, J.; Spencer, J. Alluvial gully erosion: An example from the Mitchell fluvial megafan, Queensland, Australia. Earth Surf. Process. Landf. 2009, 34, 1951–1969. [Google Scholar] [CrossRef] [Green Version]
- Guerra, A.J.T.; Bezerra, J.F.R.; Fullen, M.A.; Mendoça, J.K.S.; Sathler, R.; Lima, F.S.; Mendes, S.P.; Guerra, T.T. Urban Gullies in Sao Luis City, Maranhao State, Brazil, Progress in Gully Erosion Research. In Proceedings of the IVth International Symposium on Gully Erosion, Pamplona, Spain, 17–19 September 2007; Casali, J., Giménez, R., Eds.; Universidad Publica de Navarra: Pamplona, Spain, 2007; pp. 58–59. [Google Scholar]
- Rădoane, M.; Rădoane, N. Gully erosion. In Landform Dynamics and Evolution in Romania; Rădoane, M., Vespremeanu-Stroe, A., Eds.; Springer: Cham, Switzerland, 2016; pp. 371–396. [Google Scholar]
- Yermolaev, O.P. Erosion processes of the forest and forest-steppe zones in the eastern part of the Russian Plain. World Appl. Sci. J. 2014, 29, 453–459. [Google Scholar]
- Valentin, C.; Poesen, J.; Li, Y. Gully Erosion: Impacts, factors and control. Catena 2005, 63, 132–153. [Google Scholar] [CrossRef]
- Imwangana, F.M.; Vandecasteele, I.; Trefois, P.; Ozer, P.; Moeyersons, J. The origin and control of mega-gullies in Kinshasa (DR Congo). Catena 2015, 125, 38–49. [Google Scholar] [CrossRef]
- Wilkinson, S.N.; Kinsey-Henderson, A.E.; Hawdon, A.A.; Hairsine, P.B.; Bartley, R.; Baker, B. Grazing impacts on gully dynamics indicate approaches for gully erosion control in northeast Australia. Earth Surf. Process. Landf. 2018, 43, 1711–1725. [Google Scholar] [CrossRef]
- Xu, J.; Li, H.; Liu, X.; Hu, W.; Yang, Q.; Hao, Y.; Zhen, H.; Zhang, X. Gully erosion induced by snowmelt in Northeast China: A case study. Sustainability 2019, 11, 2088. [Google Scholar] [CrossRef] [Green Version]
- Vanmaercke, M.; Poesen, J.; Van Mele, B.; Demuzer, M.; Bruynseels, A.; Golosov, V.; Bezerra, J.F.R.; Bolysov, S.; Dvinskih, A.; Frankl, A.; et al. How fast do gully headcuts retreat? Earth Sci. Rev. 2016, 154, 336–355. [Google Scholar] [CrossRef]
- Nyssen, J.; Poesen, J.; Veyret-Picot, M.; Moeyersons, J.; Haile, M.; Deckers, J.; Dewit, J.; Naudts, K.; Govers, G. Assessment of gully erosion rates through interviews and measurements: A case study from northern Ethiopia. Earth Surf. Process. Landf. 2006, 31, 167–185. [Google Scholar] [CrossRef]
- Nachtergaele, J.; Poesen, J.; Oostwoud, D.W.; Vandekerckhove, L. Medium-term evolution of a gully developed in a loess-derived soil. Geomorphology 2002, 46, 223–239. [Google Scholar] [CrossRef]
- Gomez-Gutierrez, A.; Schnabel, S.; Berenguer-Sempere, F.; Lavado-Contador, F.; Rubio-Delgado, J. Using 3D photo-reconstruction methods to estimate gully headcut erosion. Catena 2014, 120, 91–101. [Google Scholar] [CrossRef]
- Niculiță, M.; Mărgărint, M.C.; Tarolli, P. Chapter 10-Using UAV and LiDAR data for gully geomorphic changes monitoring. In Developments in Earth Surface Processes; Tarolli, P., Mudd, S.M., Eds.; Elsevier: Amsterdam, The Netherlands, 2020; Volume 23, pp. 271–315. [Google Scholar]
- Poesen, J.; Torri, D.; Vanwalleghem, T. Gully erosion: Procedures to adopt when modelling soil erosion in landscapes affected by gullying. In Handbook of Erosion Modelling; Morgan, R., Nearing, M., Eds.; Blackwell Publishing Ltd.: Hoboken, NJ, USA, 2011; pp. 360–386. [Google Scholar]
- Liu, X.B.; Li, H.; Zhang, S.M.; Cruse, R.M.; Zhang, X.Y. Gully erosion control practices in Northeast China: A review. Sustainability 2019, 18, 5065. [Google Scholar] [CrossRef] [Green Version]
- Guyassa, E.; Frankl, A.; Zenebe, A.; Poesen, J.; Nyssen, J. Effects of check dams on runoff characteristics along gully reaches, the case of Northern Ethiopia. J. Hydrol. 2017, 545, 299–309. [Google Scholar] [CrossRef] [Green Version]
- Otlacan-Nedelcu, L. The uselfulness of a new model for the gully control structures effect prediction. In Sustaining the Global Farm; Stott, D.E., Mohtar, R.H., Steinhart, G.C., Eds.; Purdue University: West Lafayette, IN, USA, 2001; pp. 1000–1007. [Google Scholar]
- Ichim, I.; Mihaiu, G.; Surdeanu, V.; Radoane, M.; Radoane, N. Gully erosion in agricultural lands in Romania. In Soil Erosion on Agricultural Land; Boardman, J., Foster, I.D.L., Dearing, J.A., Eds.; Wiley: Hoboken, NJ, USA, 1990; pp. 55–68. [Google Scholar]
- Radoane, M.; Ichim, I.; Radoane, N. Gully distribution and development in Moldavia, Romania. Catena 1995, 24, 127–146. [Google Scholar] [CrossRef]
- Ionita, I. Geomorphological Study of Land Degradations in the Middle Barlad Catchment. Ph.D. Thesis, “Al. I. Cuza” University of Iasi, Iasi, Romania, 1998. [Google Scholar]
- Ionita, I. Gully Formation and Evolution in the Barlad Plateau; Corson Publishing House: Iasi, Romania, 2000. [Google Scholar]
- Ioniţă, I. Gully development in the Moldavian Plateau of Romania. Catena 2006, 68, 133–140. [Google Scholar] [CrossRef]
- Pujină, D. Research Concerning Landsliding Processes on Agricultural Lands in the Barlad Plateau and Contributions to Land Conservation Techniques. Ph.D. Thesis, “Gh. Asachi” Technical University of Iasi, Iasi, Romania, 1997. [Google Scholar]
- Pujină, D. Landslides in the Moldavian Plateau; Performantica Publishing House: Iasi, Romania, 2008. [Google Scholar]
- Ionita, I.; Chelaru, P.; Niacsu, L.; Butelca, D.; Andrei, A. Landslide distribution and their recent development within the Central Moldavian Plateau of Romania. Carpathian J. Earth Environ. Sci. 2014, 9, 241–252. [Google Scholar]
- Honek, D.; Michalková, M.Š.; Smetanová, A.; Sočuvka, V.; Velísková, Y.; Karásek, P.; Konecna, J.; Nemetova, Z.; Danáčová, M. Estimating sedimentation rates in small reservoirs-Suitable approaches for local municipalities in central Europe. J. Environ. Manag. 2020, 261, 109958. [Google Scholar] [CrossRef]
- Verstraeten, G.; Bazzoffi, P.; Lajczak, A.; Rãdoane, M.; Rey, F.; Poesen, J.; de Vente, J. Reservoir and pond sedimentation in Europe. In Soil Erosion in Europe; Boardman, J., Poesen, J., Eds.; Wiley: Hoboken, NJ, USA, 2006; pp. 759–774. [Google Scholar]
- Manojlović, S.; Sibinović, M.; Srejić, T.; Hadud, A.; Sabri, I. Agriculture land use change and demographic change in response to decline suspended sediment in Južna Morava River basin (Serbia). Sustainability 2021, 13, 3130. [Google Scholar] [CrossRef]
- Stefanidis, P.; Stefanidis, S. Reservoir sedimentation and mitigation measures. Lakes Reserv. Res. Manag. 2012, 17, 113–117. [Google Scholar] [CrossRef]
- Ionita, I.; Margineanu, R.M.; Hurjui, C. Assessment of the reservoir sedimentation rates from 137-Cs measurements in the Moldavian Plateau. Acta Geol. Hisp. 2000, 35, 357–367. [Google Scholar]
- Ionita, I.; Margineanu, R.M. Application of the 137-Cs for measuring soil erosion/deposition rates in Romania. Acta Geol. Hisp. 2000, 35, 311–319. [Google Scholar]
- Ionita, I.; Niacsu, L.; Petrovici, G.; Blebea-Apostu, A.M. Gully development in eastern Romania: A case study from Falciu Hills. Nat. Hazards 2015, 79 (Suppl. 1), 113–138. [Google Scholar] [CrossRef]
- Jeanrenand, P. Geology of Central Moldova between Siret and Prut. Ph.D. Thesis, “Al. I. Cuza” University of Iasi, Iasi, Romania, 1971. [Google Scholar]
- Ionesi, L. Geology of the Platform Units and the North-Dobrogea Orogen; Technical Publishing House: Bucharest, Romania, 1994. [Google Scholar]
- Samoila, C.; Ionita, I. Racova catchment, Geomorphological peculiarities. Lucr. Semin. Geogr. Dimitrie Cantemir 2017, 45, 109–124. [Google Scholar] [CrossRef] [Green Version]
- Poghirc, P. Village from Tutova Hills. Geographical Study; Scientific and Encyclopedic Publishing House: Bucharest, Romania, 1972. [Google Scholar]
- Stanga, I.C.; Niacsu, L. Using old maps and soil properties to reconstruct the forest spatial pattern in the late 18th century. Environ. Eng. Manag. J. 2016, 15, 1369–1378. [Google Scholar]
- Renard, K.G.; Foster, G.R.; Yoder, D.C.; McCool, D.K. RUSLE revisited: Status, questions, answers, and the future. J. Soil Water Conserv. 1994, 49, 213–220. [Google Scholar]
- Renard, K.G.; Foster, G.R.; Weesies, G.A.; McCool, D.K.; Yoder, D.C. Predicting Soil Erosion by Water: A Guide Toconservation Planning with the Revised Universal Soil Loss Equation (RUSLE). Agriculture Handbook, vol. 703; US Department of Agriculture: Washington, DC, USA, 1997; p. 384. [Google Scholar]
- Wischmeier, W.H.; Smith, D.D. A Universal Soil-Loss Equation to guide conservation farm planning. Trans. Int. Congr. Soil Sci. 1960, 1, 418–425. [Google Scholar]
- Wischmeier, W.H.; Smith, D.D. Predicting Rainfall Erosion Losses: A Guide to Conservation Planning. USDA Agriculture Handbook No. 537; Department of Agriculture, Science and Education Administration: Washington DC, USA, 1978. [Google Scholar]
- Motoc, M. Estimation de l’influence des facteurs d’érosion. In Proceedings of the International Water Erosion Symposium-Proceedings II, Prague, Czech Republic, 1970. [Google Scholar]
- Motoc, M.; Munteanu, S.; Baloiu, V.; Stanescu, P.; Mihaiu, G. Soil Erosion and Control Methods; Ceres Publishing House: Bucharest, Romania, 1975. [Google Scholar]
- Ionescu, A. Topographic Map of the Floor of Puscasi Reservoir; ISPIF (Institute for Land Treatments Studies and Designs): Bucharest, Romania, 1969. [Google Scholar]
- Pedological Study of Laza Territory. Includes Soils Map of Laza Territory-Scale 1:10,000; Office for Pedological and Agrochemical Surveys: Vaslui, Romania, 1997; p. 88. [Google Scholar]
- Eswaran, H.; Lal, R.; Reich, P.F. Land degradation: An overview. Response to Land Degradation. In Proceedings of the 2nd International Conference on Land Degradation (ICLD), Khon Kaen, Thailand, date of conference; Bridges, E.M., Hannam, I.D., Oldeman, L.R., DeVries, W.T.P., Scherr, S.J., Sombatpanit, S., Eds.; CRC Press: Boca Raton, FL, USA, 2001; pp. 20–35. [Google Scholar]
- Pravalie, R.; Patriche, C.; Borrelli, P.; Panagos, P.; Rosca, B.; Dumitrascu, M.; Nita, I.A.; Savulescu, I.; Birsan, M.V.; Bandoc, G. Arable lands under the pressure of multiple land degradation processes. A global perspective. Environ. Res. 2021, 194, 110697. [Google Scholar] [CrossRef]
- Ioniţă, I.; Rădoane, M.; Mircea, S. 1.13 Romania. In Soil Erosion in Europe; Boardman, J., Poesen, J., Eds.; Wiley: Hoboken, NJ, USA, 2006; pp. 155–166. [Google Scholar]
- Ioniță, I.; Niacșu, L.; Poesen, J.; Fullen, M.A. Controls on the development of continuous gullies: A 60 year monitoring study in the Moldavian Plateau of Romania. Earth Surf. Process. Landf. 2021, 46, 2746–2763. [Google Scholar] [CrossRef]
- Margarint, M.C.; Niculita, M. Landslide type and pattern in Moldavian Plateau, NE Romania. In Landform Dynamics and Evolution in Romania; Radoane, M., Vespremeanu-Stroe, A., Eds.; Springer: Cham, Switzerland, 2017; pp. 271–304. [Google Scholar]
- Poesen, J.; Nachtergaele, J.; Verstraeten, G.; Valentin, C. Gully erosion and environmental change: Importance and research needs. Catena 2003, 50, 91–133. [Google Scholar] [CrossRef]
- Poesen, J. Challenges in gully erosion research. Landf. Anal. 2011, 17, 5–9. [Google Scholar]
- Motoc, M.; Ionita, I.; Nistor, D.; Vatau, A. Soil erosion control in Romania. State of the Art. In U.S. Central and Eastern European Agro-Environmental Program, Soil Erosion Prevention and Remediation Workshop; Academy of Agricultural and Forestry Sciences: Bucharest, Romania, 1992; pp. 111–133. [Google Scholar]
- Gaspar, R.; Traci, C.; Apostol, A.; Necula, F.; Mesina, P. Normative for Design of the Correction Works of Torrents and Forest Improvement of Eroded Lands; Institute for Land Improvement Studies and Projects: Bucharest, Romania, 1967. [Google Scholar]
- Enterprise for Performing and Exploiting the Land Improvement Works Vaslui. In Soil Conservation Work Plans; IEELIF: Vaslui, Romania, 1970–1989.
- Rusu, A.; Ursu, A.; Stoleriu, C.C.; Groza, O.; Niacșu, L.; Sfîcă, L.; Minea, I.; Stoleriu, O.M. Structural changes in the Romanian economy reflected through Corine Land Cover datasets. Remote Sens. 2020, 12, 1323. [Google Scholar] [CrossRef] [Green Version]
- Verstraeten, G.; Poesen, J. Estimating trap efficiency of small reservoirs and ponds: Methods and implications for the assessment of sediment yield. Prog. Phys. Geogr. 2000, 24, 219–251. [Google Scholar] [CrossRef]


Publisher’s Note: MDPI stays neutral with regard to jurisdictional claims in published maps and institutional affiliations. |
© 2021 by the authors. Licensee MDPI, Basel, Switzerland. This article is an open access article distributed under the terms and conditions of the Creative Commons Attribution (CC BY) license (https://creativecommons.org/licenses/by/4.0/).
Share and Cite
Niacsu, L.; Ionita, I.; Samoila, C.; Grigoras, G.; Blebea-Apostu, A.M. Land Degradation and Soil Conservation Measures in the Moldavian Plateau, Eastern Romania: A Case Study from the Racova Catchment. Water 2021, 13, 2877. https://doi.org/10.3390/w13202877
Niacsu L, Ionita I, Samoila C, Grigoras G, Blebea-Apostu AM. Land Degradation and Soil Conservation Measures in the Moldavian Plateau, Eastern Romania: A Case Study from the Racova Catchment. Water. 2021; 13(20):2877. https://doi.org/10.3390/w13202877
Chicago/Turabian StyleNiacsu, Lilian, Ion Ionita, Claudia Samoila, Georgel Grigoras, and Ana Maria Blebea-Apostu. 2021. "Land Degradation and Soil Conservation Measures in the Moldavian Plateau, Eastern Romania: A Case Study from the Racova Catchment" Water 13, no. 20: 2877. https://doi.org/10.3390/w13202877