
Transboundary Aquifers between Baja California, Sonora and Chihuahua, Mexico, and California, Arizona and New Mexico, United States: Identification and Categorization

Abstract
:1. Introduction
2. Materials and Methods
2.1. Geological Correlation
2.2. Delimitation of HGUs
2.3. Classification of Geological Formations
3. Results and Discussion
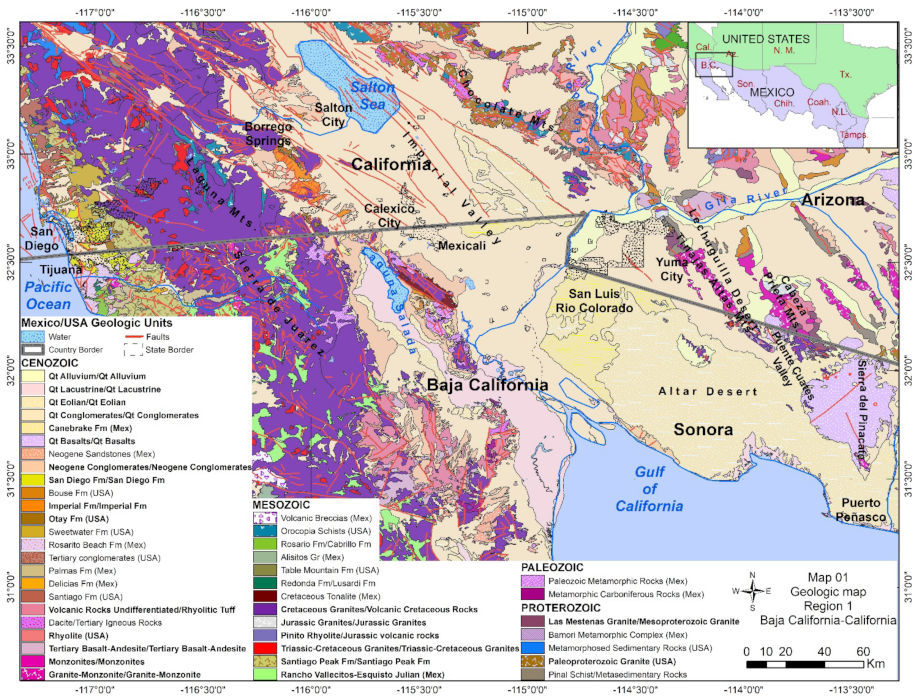
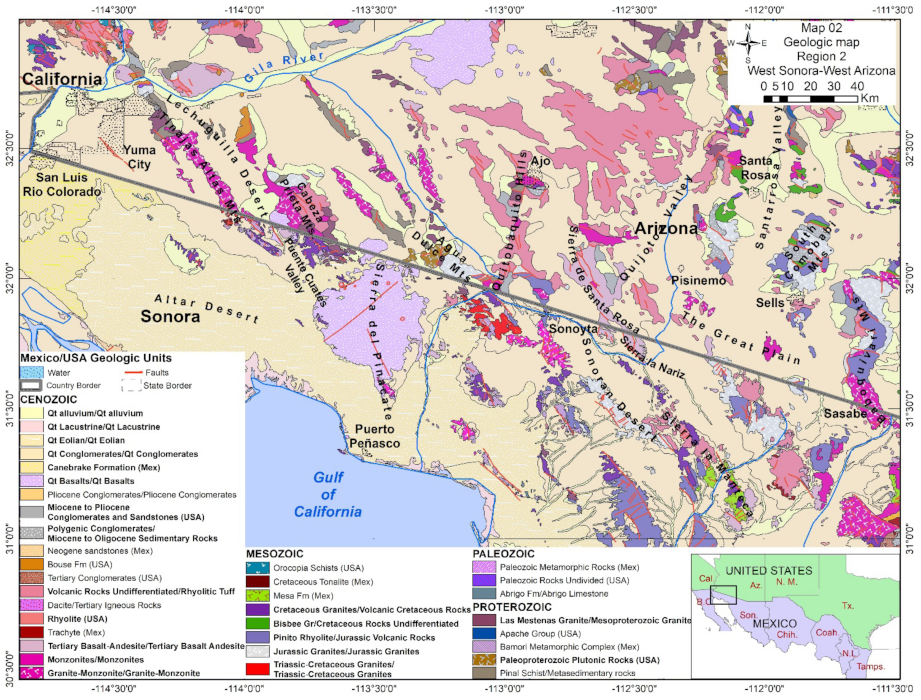
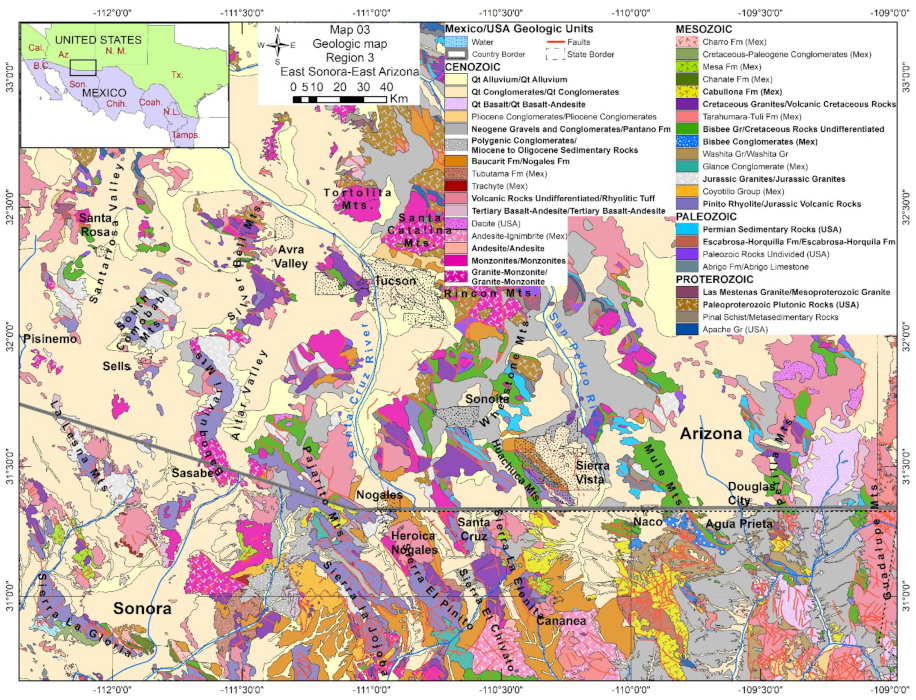
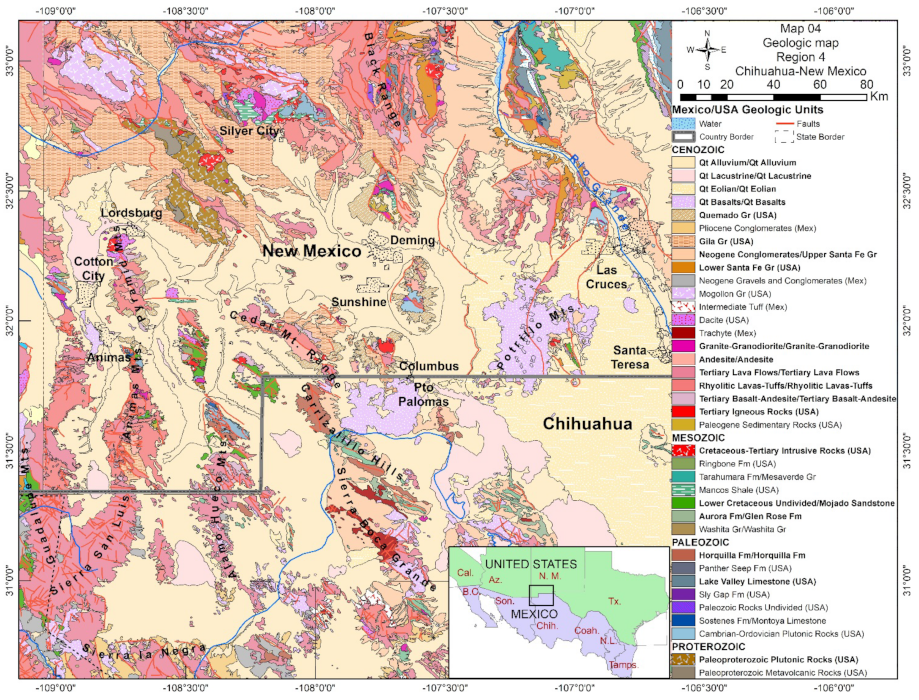
3.1. Geological Correlation between Mexico (Baja California, Sonora, and Chihuahua) and the U.S. (California, Arizona, and New Mexico)
3.2. Geologic Transboundary and Boundary Formation Limits
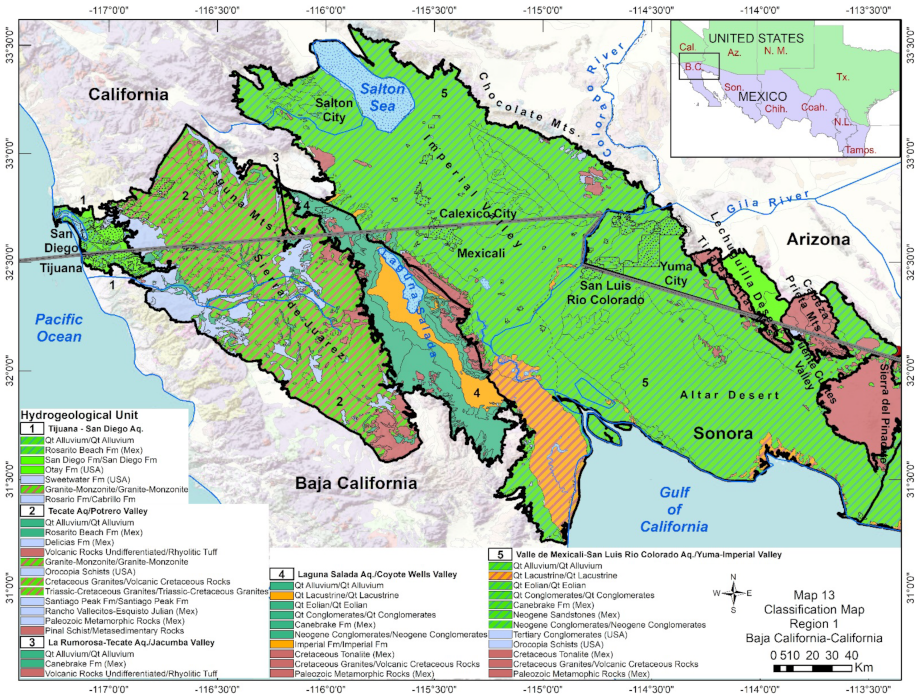
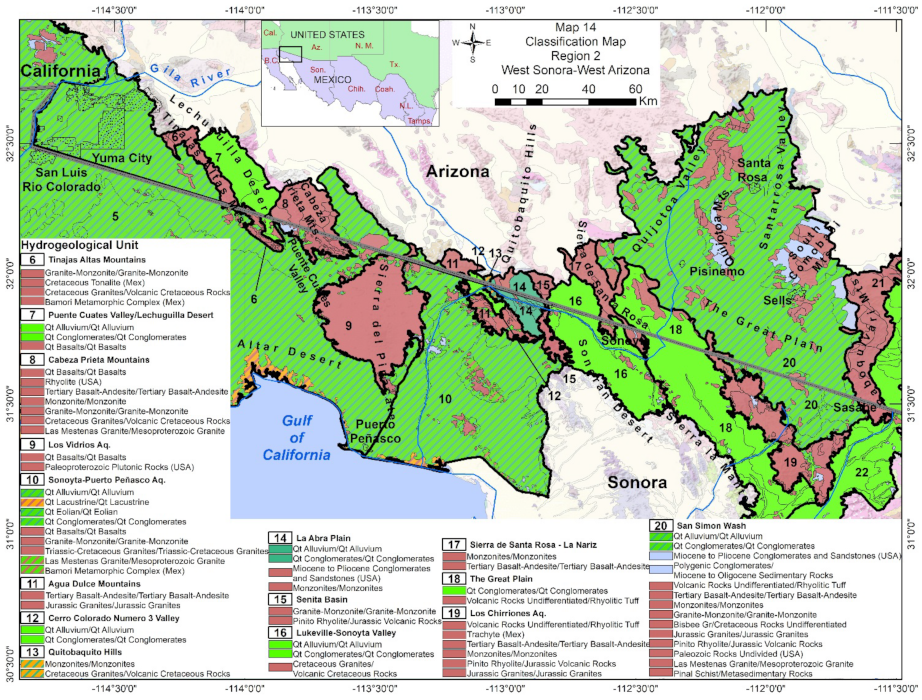
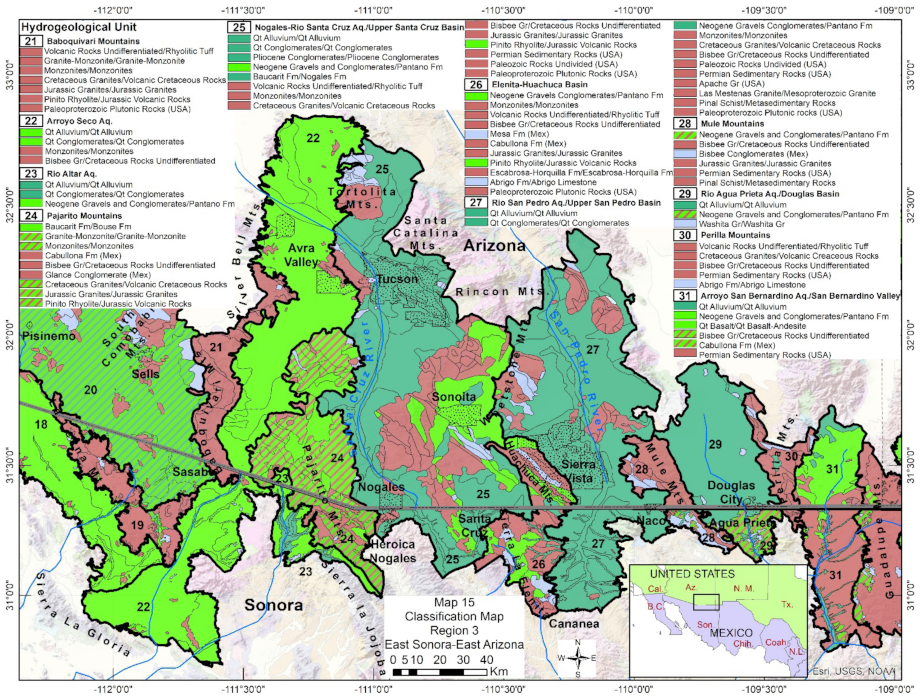
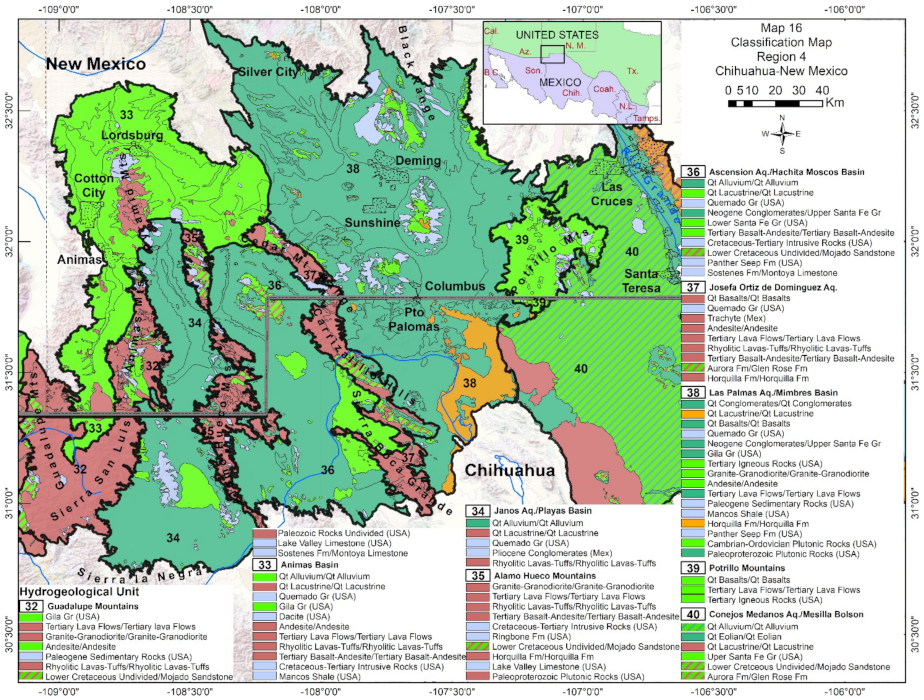
3.3. Delineation of Transboundary Hydrogeological Units (HGUs)
3.4. Classification of Geological Formations/Aquifers
4. Conclusions
Author Contributions
Funding
Data Availability Statement
Acknowledgments
Conflicts of Interest
References
- Sanchez, R.; Victoria, L.; Eckstein, G. Identifying and Characterizing Transboundary Aquifers Along the Mexico–Us Border: An Initial Assessment. J. Hydrol. 2016, 535, 101–119. [Google Scholar] [CrossRef] [Green Version]
- Sanchez, R.; Rodriguez, L.; Tortajada, C. Transboundary Aquifers between Chihuahua, Coahuila, Nuevo Leon and Tamaulipas, Mexico, and Texas, USA: Identification and Categorization. J. Hydrol. Reg. Stud. 2018, 20, 74–102. [Google Scholar] [CrossRef]
- Tapia-Villaseñor, E.M.; Megdal, S.B. The Us-Mexico Transboundary Aquifer Assessment Program as a Model for Transborder Groundwater Collaboration. Water 2021, 13, 530. [Google Scholar] [CrossRef]
- Hanson, A.T.; Schmid, W.; Knight, J.; Maddock, T., III. Integrated Hydrologic Modeling of a Transboundary Aquifer System—Lower Rio Grande. In Proceedings of the MODFLOW and More 2013—Translating Science into Practice, Golden, CO, USA, 2–5 June 2013. [Google Scholar]
- Erwin, G. Groundwater Flow Model of the Santa Cruz Active Management Area Microbasins International Boundary to Nogales International Wastewater Treatment Plant Santa Cruz County, Arizona; Arizona Department of Water Resources: Phoenix, AZ, USA, 2007. [Google Scholar]
- Callegary, J.B.; Megdal, S.B.; Tapia Villaseñor, E.M.; Petersen-Perlman, J.D.; Minjárez Sosa, I.; Monreal, R.; Gray, F.; Grijalva Noriega, F. Findings and Lessons Learned from the Assessment of the Mexico-United States Transboundary San Pedro and Santa Cruz Aquifers: The Utility of Social Science in Applied Hydrologic Research. J. Hydrol. Reg. Stud. 2018, 20, 60–73. [Google Scholar] [CrossRef]
- Callegary, J.B.; Minjárez Sosa, I.; Tapia Villaseñor, E.M.; Dos Santos, P.; Monreal Saavedra, R.; Grijalva Noriega, F.J.; Huth, A.K.; Gray, F.; Scott, C.A.; Megdal, S.B. Binational Study of the Transboundary San Pedro Aquifer. In El Paso TX; 2016; 1, pp. 1–164. Available online: http://www.ibwc.gov/Files/Binational_Study_Transboundary_San_Pedro_Aquifer.pdf (accessed on 10 September 2020).
- Sanchez, R.; Brena, A.; Rivera, A.; Hanson, R.T.; Hernandez-Espriu, A.; Hogeboom, R.; Benavides, J.; Milman, A.; Pedrozo-Acuna, A.; Soriano-Monzalvo, J.C.; et al. Perspectives on Building Water Security and a Resilient Capacity for Transboundary Groundwater Systems in the Borderlands of Mexico and the United States. Water Int. 2021, in press. [Google Scholar]
- Hollet, K.J. Maps Showing Ground-Water Conditions in the San Simon Wash Area, Papago Indian Reservation, Arizona-1979; Geological Survey (US): Reston, VS, USA, 1981. [CrossRef]
- Servicio Geologico Mexicano. Geoinfomex. El Banco De Datos Del Sgm. Available online: https://mapasims.sgm.gob.mx/GeoInfoMex_gobmx/ (accessed on 11 January 2021).
- Servicio Geologico Mexicano. Carta Geologico Minera Ciudad Juarez, H13-1, El Porvenir H13-2, Chihuahua, Escala 1:250,000; Servicio Geológico Mexicano, 2003. Available online: http://mapserver.sgm.gob.mx/Cartas_Online/geologia/33_H13-1_GM.pdf (accessed on 15 October 2020).
- Servicio Geologico Mexicano. Carta Geologico Minera Agua Prieta, H12-3 Sonora, Chihuahua Escala 1:250,000; Servicio Geológico Mexicano, 2003. Available online: http://mapserver.sgm.gob.mx/Cartas_Online/geologia/25_H12-3_GM.pdf (accessed on 15 October 2020).
- Servicio Geologico Mexicano. Carta Geologico Minera Ensenada, H11-2, Baja California, Escala 1:250,000; Servicio Geológico Mexicano, 2003. Available online: http://mapserver.sgm.gob.mx/Cartas_Online/geologia/2_H11-2_GM.pdf (accessed on 15 October 2020).
- Servicio Geologico Mexicano. Carta Geologico Minera Tijuana, I11-11, Baja California, Escala 1:250,000; Servicio Geológico Mexicano, 2003. Available online: http://mapserver.sgm.gob.mx/Cartas_Online/geologia/1_I11-11_GM.pdf (accessed on 15 October 2020).
- Servicio Geologico Mexicano. Carta Geologico Minera Mexicali I11-12, Baja California Y Sonora, Escala 1:250,000; Servicio Geológico Mexicano, 2003. Available online: http://mapserver.sgm.gob.mx/Cartas_Online/geologia/3_I11-12_GM.pdf (accessed on 15 October 2020).
- Servicio Geologico Mexicano. Carta Geologico Minera Nueva Casas Grandes, H13-4 Chihuahua, Escala 1:250,000; Servicio Geológico Mexicano, 2002. Available online: http://mapserver.sgm.gob.mx/Cartas_Online/geologia/34_H13-4_GM.pdf (accessed on 15 October 2020).
- Servicio Geologico Mexicano. Carta Geologico Minera Puerto Peñasco H12-1, Sonora, Escala 1:250,000; Servicio Geológico Mexicano, 2002. Available online: http://mapserver.sgm.gob.mx/Cartas_Online/geologia/10_H12-1_GM.pdf (accessed on 15 October 2020).
- Servicio Geologico Mexicano. Carta Geologico Minera Los Vidrios, I12-10, Sonora, Escala 1:250,000; Servicio Geológico Mexicano, 2002. Available online: http://mapserver.sgm.gob.mx/Cartas_Online/geologia/9_I12-10_GM.pdf (accessed on 15 October 2020).
- Servicio Geologico Mexicano. Carta Geologico Minera Nogales, H12-2 Sonora, Escala 1:250,000; Servicio Geológico Mexicano, 2000. Available online: http://mapserver.sgm.gob.mx/Cartas_Online/geologia/16_H12-2_GM.pdf (accessed on 15 October 2020).
- Servicio Geologico Mexicano. Carta Geologico Minera Cananea H12-5, Sonora, Escala 1:250,000; Servicio Geológico Mexicano, 1999. Available online: http://mapserver.sgm.gob.mx/Cartas_Online/geologia/17_H12-5_GM.pdf (accessed on 15 October 2020).
- Servicio Geologico Mexicano. Carta Geologico Minera San Felipe, H11-3 Baja California Y Sonora, Escala 1:250,000; Servicio Geológico Mexicano, 1999. Available online: http://mapserver.sgm.gob.mx/Cartas_Online/geologia/4_H11-3_GM.pdf (accessed on 15 October 2020).
- Servicio Geologico Mexicano. Carta Geológico-Minera Nacozari H12-6 Sonora Y Chihuahua, 1:250000: Pachuca; Servicio Geológico Mexicano, 1998. Available online: http://mapserver.sgm.gob.mx/Cartas_Online/geologia/26_H12-6_GM.pdf (accessed on 15 October 2020).
- Stoeser, D.B.; Green, G.N.; Morath, L.C.; Heran, W.D.; Wilson, A.B.; Moore, D.W.; Van Gosen, B.S. Preliminary Integrated Geologic Map Databases for the United States Central States: Montana, Wyoming, Colorado, New Mexico, Kansas, Oklahoma, Texas, Missouri, Arkansas, and Louisiana,-the State of Texas; Geological Survey (US): Reston, VS, USA, 2005. [CrossRef]
- Ludington, S.; Moring, B.; Miller, R.; Flynn, K.; Hopkins, M.; Stone, P.; Bedford, D.; Haxel, G. Preliminary Integrated Databases for the United States-Western States: California, Nevada, Arizona, Washington, Oregon, Idaho, and Utah; Geological Survey (US): Reston, VS, USA, 2005. [CrossRef]
- Poland, J.F.; Lofgren, B.E.; Riley, F.S. Glossary of Selected Terms Useful in Studies of the Mechanics of Aquifer Systems and Land Subsidence Due to Fluid Withdrawal; Geological Survey (US): Reston, VS, USA, 1972.
- Ries, K.G., III; Newson, J.K.; Smith, M.J.; Guthrie, J.D.; Steeves, P.A.; Haluska, T.; Kolb, K.R.; Thompson, R.F.; Santoro, R.D.; Vraga, H.W. Streamstats, Version 4; US Geological Survey: Reston, VS, USA, 2017.
- INEGI. Siatl (Simulador De Flujos De Agua De Cuencas Hidrográficas). Available online: https://antares.inegi.org.mx/analisis/red_hidro/siatl/ (accessed on 30 August 2021).
- U.S. Geological Survey. Water Science Glossary of Terms. Water Encycl. 2005, 2, 541–548. [Google Scholar] [CrossRef]
- Hiscock, K.M. Hydrogeology: Principles and Practice; John Wiley & Sons: Hoboken, NJ, USA, 2009. [Google Scholar]
- Hutchison, W.R. Conceptual Model Report: Lower Rio Grande Valley Groundwater Transport Model. 2016. Available online: https://www.twdb.texas.gov/publications/reports/contracted_reports/doc/1548301854_GSI_ConceptualReport.pdf (accessed on 20 April 2017).
- Ransome, F.L. The Geology and Ore Deposits of the Bisbee Quadrangle, Arizona; US Government Printing Office: Washington, DC, USA, 1904; Volume 21. [Google Scholar]
- CONAGUA. Actualizacion De La Disponibilidad Media Anual De Agua En El Acuifero Cumpas (2661), Estado De Sonora. Mexico, DF: Subdireccion General Tecnica, CONAGUA. 2018. Available online: https://sigagis.conagua.gob.mx/gas1/Edos_Acuiferos_18/sonora/DR_2661.pdf (accessed on 20 April 2017).
- Condie, K.C. Geochemistry of Proterozoic Granitic Plutons from New Mexico, USA. Chem. Geol. 1978, 21, 131–149. [Google Scholar] [CrossRef]
- Damon, P.E.; Livingston, D.E.; Mauger, R.L.; Gilletti, B.J.; Alor, P. Edad Del Precámbrico Anterior Y De Otras Rocas Del Zócalo De La Región De Caborca-Altar De La Parte Noroccidental Del Estado De Sonora: Boletín Instituto De Geología. Univ. Nac. Autónoma México 1962, 64, 11–64. [Google Scholar]
- Ransome, F.L. Geology of the Globe Copper District, Arizona; US Government Printing Office: Washington, DC, USA, 1903.
- Viveros-Martínez, A. Estudio Geológico De La Sierra De Cabullona, Municipio De Agua Prieta, Estado De Sonora. Bachelor’s Thesis, Universidad Nacional Autónoma de México, Ciudad de México, Mexico, 1965. [Google Scholar]
- CONAGUA. Actualizacion De La Disponibilidad Media Anual De Agua En El Acuifero Los Vidrios (2602), Estado De Sonora. Mexico, DF: Subdireccion General Tecnica, CONAGUA. 2018. Available online: https://sigagis.conagua.gob.mx/gas1/Edos_Acuiferos_18/sonora/DR_2602.pdf (accessed on 20 May 2020).
- Clemons, R.E. Geology of the Florida Mountains, Southwestern New Mexico; New Mexico Bureau of Mines and Mineral Resources: Socorro, NM, USA, 1998. [Google Scholar]
- Trauger, F.D.; Herrick, E.H. Ground Water in Central Hachita Valley Northeast of the Big Hatchet Mountains, Hidalgo County, New Mexico; New Mexico State Engineer Office: Albuquerque, NM, USA, 1962. [Google Scholar]
- Richardson, G.B. Report of a Reconnaissance in Trans-Pecos Texas: North of the Texas and Pacific Railway; Von Boeckmann-Jones Company, State Printers, 1904. Available online: https://repositories.lib.utexas.edu/handle/2152/24408 (accessed on 20 April 2017).
- Hanson, R.T.; McLean, J.S.; Miller, R.S. Hydrogeologic Framework and Preliminary Simulation of Ground-Water Flow in the Mimbres Basin, Southwestern New Mexico; US Geological Survey, US Department of the Interior: Washington, DC, USA, 1994; Volume 94. [CrossRef]
- Díaz-Cabrera, P. Simulación Numérica Del Acuífero Superior Del Valle De Mexicali, Baja California, México. Master’s Thesis, CICECE. División de Ciencias de la Tierra, Ensenada BC, Ciudad de México, Mexico, 2001. [Google Scholar]
- Gordon, C.H. Art. Vi.—Mississippian (Lower Carboniferous) Formations in the Rio Grande Valley, New Mexico. Am. J. Sci. (1880–1910) 1907, 24, 58. Available online: https://ngmdb.usgs.gov/Prodesc/proddesc_88702.htm (accessed on 20 April 2017). [CrossRef]
- Kottlowski, F.E.; Kottlowski, F.E. Stratigraphic Studies of the San Andres Mountains, New Mexico; New Mexico Institute of Mining, State Bureau of Mines and Mineral Resources: Socorro, NM, USA, 1956. [Google Scholar]
- Gilluly, J.; Cooper, J.R.; Williams, J.S. Late Paleozoic Stratigraphy of Central Cochise County, Arizona; U.S. Geological Survey: Reston, VS, USA, 1954. [CrossRef]
- CONAGUA. Actualizacion De La Disponibilidad Media Anual De Agua En El Acuifero Josefa Ortiz De Dominguez (0829), Estado De Chihuahua. Mexico, DF: Subdireccion General Tecnica, CONAGUA. 2018. Available online: https://www.gob.mx/cms/uploads/attachment/file/103590/DR_0829.pdf (accessed on 20 June 2020).
- Nations, D.; Stump, E. Geology of Arizona; Kendall Hunt Publishing Company: Dubuque, IA, USA, 1996. [Google Scholar]
- CONAGUA. Actualizacion De La Disponibilidad Media Anual De Agua En El Acuifero Tecate (0202), Estado De Baja California. Mexico, DF: Subdireccion General Tecnica, CONAGUA. 2018. Available online: https://sigagis.conagua.gob.mx/gas1/Edos_Acuiferos_18/BajaCalifornia/DR_0202.pdf (accessed on 20 June 2020).
- Gilmont, N.L. Geology of the Puerto La Bandera Area. Master’s Thesis, University of Northern Arizona, Flagstaff, AZ, USA, 1978. [Google Scholar]
- Minjárez Sosa, I.; Saavedra, R.M.; Grijalva Noriega, F.J.; Ochoa Granillo, J.A.; Tapia Villaseñor, E.M.; Rangel Medina, M.; Montijo González, A. Actividades Hidrogeológicas En El Acuífero Río Santa Cruz, Estado De Sonora, Primera Etapa; CILA: Hermosillo, Mexico, 2011. [Google Scholar]
- CONAGUA. Actualizacion De La Disponibilidad Media Anual De Agua En El Acuifero Rio Alisos (2613), Estado De Sonora. Mexico, DF: Subdireccion General Tecnica, CONAGUA. 2018. Available online: https://sigagis.conagua.gob.mx/gas1/Edos_Acuiferos_18/sonora/DR_2613.pdf (accessed on 25 September 2020).
- Force, E.R. The Bisbee Group of the Tombstone Hills, Southeastern Arizona: Stratigraphy, Structure, Metamorphism, and Mineralization; US Government Printing Office: Washington, DC, USA, 1996. [CrossRef]
- Bilodeau, W.L.; Kluth, C.F.; Vedder, L.K. Regional Stratigraphic, Sedimentologic, and Tectonic Relationships of the Glance Conglomerate in Southeastern Arizona. Mesoz. Rocks South. Ariz. Adjac. Areas Ariz. Geol. Soc. Dig. 1987, 18, 229–256. [Google Scholar]
- Brown, T.E. Stratigraphy of the Washita Group in Central Texas; Department of Geology, Baylor University: Waco, TX, USA, 1971. [Google Scholar]
- Hill, R.T. Preliminary Notes on the Topography and Geology of Northern Mexico and Southwest Texas, and New Mexico; American Geologist: Austin, Texas, USA, 1891; Volume 8, pp. 133–141. [Google Scholar]
- CONAGUA. Actualizacion De La Disponibilidad Media Anual De Agua En El Acuifero Palomas-Guadalupe Victoria (0812), Estado De Chihuahua. Mexico, DF: Subdireccion General Tecnica, CONAGUA. 2018. Available online: https://sigagis.conagua.gob.mx/gas1/Edos_Acuiferos_18/chihuahua/DR_0812.pdf (accessed on 25 September 2020).
- Zeller, R.A.; Molina, R. Reconnaissance Geologic Map of Southern Animas Mountains; New Mexico Bureau of Mines and Mineral Resources: Socorro, NM, USA, 1962. [Google Scholar]
- CONAGUA. Actualizacion De La Disponibilidad Media Anual De Agua En El Acuifero Arroyo San Bernardino (2630), Estado De Sonora. Mexico, DF: Subdireccion General Tecnica, CONAGUA. 2018. Available online: https://sigagis.conagua.gob.mx/gas1/Edos_Acuiferos_18/sonora/DR_2630.pdf (accessed on 25 September 2020).
- McDonald, C.C.; Loeltz, O.J. Water Resources of Lower Colorado River-Salton Sea Area as of 1971: Summary Report; US Government Printing Office: Washington, DC, USA, 1976; Volume 486.
- Landis, E.R.; Dane, C.H.; Cobban, W.A. Stratigraphic Terminology of the Dakota Sandstone and Mancos Shale, West-Central New Mexico. US Government Printing Office: Washington, DC, USA, 1973. [Google Scholar]
- Taliaferro, N.L. An Occurrence of Upper Cretaceous Sediments in Northern Sonora, Mexico. J. Geol. 1933, 41, 12–37. [Google Scholar] [CrossRef]
- Lasky, S.G. Newly Discovered Section of Trinity Age in Southwestern New Mexico. AAPG Bull. 1938, 22, 524–540. [Google Scholar] [CrossRef]
- Kennedy, M.P.; Moore, G.W. Stratigraphic Relations of Upper Cretaceous and Eocene Formations, San Diego Coastal Area, California. AAPG Bull. 1971, 55, 709–722. [Google Scholar] [CrossRef]
- Haxel, G.B.; Jacobson, C.E.; Wittke, J.H. Mantle Peridotite in Newly Discovered Far-Inland Subduction Complex, Southwest Arizona: Initial Report. Int. Geol. Rev. 2015, 57, 871–892. [Google Scholar] [CrossRef]
- Scholle, P.A. Geologic Map of New Mexico; New Mexico Bureau of Geology and Mineral Resources: Socorro, NM, USA, 2003. [Google Scholar]
- Richard, S.M.; Reynolds, S.J.; Spencer, J.E.; Pearthree, P.A. Geologic Map of Arizona: Arizona Geological Survey Map 35, 1 Sheet, Scale 1:1,000,000. 2000. Available online: http://hdl.handle.net/10150/630741 (accessed on 15 October 2020).
- Department of Planning County of San Diego. General Plan Update. Appendix D, Groundwater Study. In Department of Planning and Land Use; San diego County, Planning and Development Services; 2010. Available online: https://www.sandiegocounty.gov/content/dam/sdc/pds/gpupdate/docs/BOS_Aug2011/EIR/Appn_D_GW.pdf (accessed on 15 October 2020).
- Darton, N.H. Geology and Underground Water of Luna County, New Mexico; Government Printing Office: Washington, DC, USA, 1916.
- Flynn, C.J. Geology of the La Gloria-Presa Rodriguez Area, Baja California, Mexico. Master’s Thesis, San Diego State University, San Diego, CA, USA, 1968. [Google Scholar]
- Olmsted, F.H.; Loeltz, O.J.; Irelan, B. Geohydrology of the Yuma Area, Arizona and California; US Government Printing Office: Washington, DC, USA, 1973; Volume 486. [Google Scholar]
- Trauger, F.D.; Lavery, N.G. Geohydrology of the Upper Pipe Line Draw Area, Grant County, New Mexico. In Consultant report to Exxon Minerals; Exxon Company: Houston, TX, USA, 1976. [Google Scholar]
- O’Brien, K.M.; Stone, W.J. A Two-Dimensional Hydrologic Model of the Animas Valley, Hidalgo County, New Mexico; New Mexico Bureau of Mines and Mineral Resources: Socorro, NM, USA, 1983. [Google Scholar]
- CONAGUA. Actualizacion De La Disponibilidad Media Anual De Agua En El Acuifero Rio Santa Cruz (2615), Estado De Sonora. Mexico, DF: Subdireccion General Tecnica, CONAGUA. 2018. Available online: https://sigagis.conagua.gob.mx/gas1/Edos_Acuiferos_18/sonora/DR_2615.pdf (accessed on 25 September 2020).
- Morton, P.K. Geology and Mineral Resources of Imperial County, California. California Division of Mines and Geology. 1977. Available online: https://ngmdb.usgs.gov/Prodesc/proddesc_408.htm (accessed on 11 November 2020).
- Mason, D.; Hipke, W. Regional Groundwater Flow Model of the Tucson Active Management Area, Arizona. Model Update and Calibration; Arizona Department of Water Resources: Phoenix, AZ, USA, 2013. [Google Scholar]
- Connell, S.D. Stratigraphy of the Albuquerque Basin, Rio Grande Rift, Central New Mexico: A Progress Report. In Stratigraphy and Tectonic Development of the Albuquerque Basin, Central Rio Grande Rift. Field-Trip Guidebook for the Geological Society of America, Mini-Papers; New Mexico Bureau of Mines and Mineral Resources: Socorro, NM, USA, 2001; pp. A1–A27. [Google Scholar]
- Myers, R.G.; Orr, B.R. Geohydrology of the Aquifer in the Santa Fe Group, Northern West Mesa of the Mesilla Basin near Las Cruces, New Mexico; US Geological Survey: Reston, VS, USA, 1985; Volume 84. [CrossRef]
- Artim, E.R.; Pinckney, C.J. La Nacion Fault System, San Diego, California. Geol. Soc. Am. Bull. 1973, 84, 1075–1080. [Google Scholar] [CrossRef]
- Walsh, S.L.; Demere, T.A. Age and Stratigraphy of the Sweetwater and Otay Formations, San Diego County, California. 1991. Available online: http://sntbberry.cityofsanteeca.gov/sites/FanitaRanch/Public/Remainder%20of%20the%20Record/(2)%20Reference%20Documents%20from%20EIR%20&%20Technical%20Reports/Tab%20083%20-%201991%20Walsh%20&%20Demere%20-%20Age%20and%20Stratigraphy.pdf (accessed on 14 May 2021).
- Flint, L.E.; Flint, A.L.; Stolp, B.J.; Danskin, W.R. Water-Balance and Groundwater-Flow Estimation for an Arid Environment: San Diego Region, California. Hydrol. Earth Syst. Sci. Discuss. 2012, 9, 2717–2762. [Google Scholar]
- Woodring, W.P. Distribution and Age of the Marine Tertiary Deposits of the Colorado Desert. Carnegie Inst. Wash. Publ. 1932, 418, 1–28. Available online: https://ngmdb.usgs.gov/Prodesc/proddesc_88957.htm (accessed on 24 May 2021).
- Cohen, A.; Cassidy, C.; Crow, R.; Bright, J.; Crossey, L.; Dorsey, R.; Gootee, B.; House, K.; Howard, K.; Karlstrom, K. The Bouse Formation, a Controversial Neogene Archive of the Evolving Colorado River: A Scientific Drilling Workshop Report (28 February–3 March 2019–Bluewater Resort & Casino, Parker, Az, USA). Sci. Drill. 2019, 26, 59–67. [Google Scholar] [CrossRef] [Green Version]
- Simons, F.S. Geologic Map and Sections of the Nogales and Lochiel Quadrangles, Santa Cruz County, Arizona. US Geological Survey: Reston, VS, USA, 1974. [Google Scholar] [CrossRef]
- Page, W.R.; Gray, F.; Bultman, M.W.; Menges, C.M. Hydrogeologic Investigations of the Miocene Nogales Formation in the Nogales Area, Upper Santa Cruz Basin, Arizona; US Geological Survey: Reston, VS, USA, 2016. [CrossRef] [Green Version]
- Thiros, S.A.; Bexfield, L.M.; Anning, D.W.; Huntington, J.M. Conceptual Understanding and Groundwater Quality of Selected Basin-Fill Aquifers in the Southwestern United States; US Geological Survey: Reston, VS, USA, 2010.
- CONAGUA. Actualizacion De La Disponibilidad Media Anual De Agua En El Acuifero San Pedro (2616), Estado De Sonora. Mexico, DF: Subdireccion General Tecnica, CONAGUA. 2018. Available online: https://www.gob.mx/cms/uploads/attachment/file/104308/DR_2616.pdf (accessed on 20 April 2017).
- Gilbert, G.K. Report on the Geology of Portions of California, Nevada, Utah, Colorado, New Mexico, and Arizona, Examined in the Years 1871, 1872, and 1873. US Geol. Geog. Surv. West 100th Meridian (U. S.) 1875, 3, 288. [Google Scholar]
- Garcia, J. New Mexico’s Border with Mexico: Creating a Viable Agenda for Growth; The Center for Latin American and Border Studies, New Mexico State University: Las Cruces, NM, USA, 2001. [Google Scholar]
- Wilkins, D.W. Summary of the Southwest Alluvial Basins Regional Aquifer-System Analysis in Parts of Colorado, New Mexico, and Texas; US Geological Survey: Reston, VS, USA, 1998. [CrossRef]
- Chamberlin, R.M.; Cather, S.M.; Anderson, O.J.; Jones, G.E. Reconnaissance Geologic Map of the Quemado 30× 60-Minute Quadrangle, Catron County, New Mexico; Open-File Report 406; New Mexico Bureau of Mines and Mineral Resources: Socorro, NM, USA, 1994. [Google Scholar]
- Cleveland, G.B. Geology of the Otay Bentonite Deposit, San Diego County, California; Division of Mines, Department of Natural Resources, State of California: San Francisco, CA, USA, 1960; Volume 64. [Google Scholar]
- Anderson, E.K. Hydraulic Conductivity of Pliocene & Pleistocene Sediments in the San Diego Bay Subsurface. 2009. Available online: https://www.carleton.edu/departments/geol/resources/comps/compspdffiles/2009/andersok_2009.pdf (accessed on 10 June 2021).
- Dibblee, T.W., Jr. Geology of the Imperial Valley Region, California. Geol. South. Calif. Calif. Div. Mines Bull. 1954, 170, 21–28. Available online: https://ngmdb.usgs.gov/Prodesc/proddesc_73371.htm (accessed on 20 April 2017).
- CONAGUA. Actualizacion De La Disponibilidad Media Anual De Agua En El Acuifero Arroyo Sahuaro (2604), Estado De Sonora. Mexico, DF: Subdireccion General Tecnica, CONAGUA. 2018. Available online: https://sigagis.conagua.gob.mx/gas1/Edos_Acuiferos_18/sonora/DR_2604.pdf (accessed on 17 February 2021).
- CONAGUA. Actualizacion De La Disponibilidad Media Anual De Agua En El Acuifero Arroyo Seco (2607), Estado De Sonora. Mexico, DF: Subdireccion General Tecnica, CONAGUA. 2018. Available online: https://sigagis.conagua.gob.mx/gas1/Edos_Acuiferos_18/sonora/DR_2607.pdf (accessed on 17 February 2021).
- CONAGUA. Actualizacion De La Disponibilidad Media Anual De Agua En El Acuifero Laguna Salada (0209), Estado De Baja California. Mexico, DF: Subdireccion General Tecnica, CONAGUA. 2018. Available online: https://www.gob.mx/cms/uploads/attachment/file/103406/DR_0209.pdf (accessed on 23 February 2021).
- CONAGUA. Actualizacion De La Disponibilidad Media Anual De Agua En El Acuifero Sonoyta-Puerto Penasco (2603), Estado De Sonora. Mexico, DF: Subdireccion General Tecnica, CONAGUA. 2018. Available online: https://sigagis.conagua.gob.mx/gas1/Edos_Acuiferos_18/sonora/DR_2603.pdf (accessed on 19 February 2021). Estado De Sonora.
- White, N.D.; Matlock, W.G.; Schwalen, H.C. An Appraisal of the Groundwater Resources of Avra and Altar Valleys, Pima County, Arizona. In Arizona State Land Department Water-Resources Report; Arizona State Land Department: Phoenix, AZ, USA, 1966. [Google Scholar]
- Anderson, T.H.; Nourse, J.A.; McKee, J.W.; Steiner, M.B. Pull-Apart Basins at Releasing Bends of the Sinistral Late Jurassic Mojave-Sonora Fault System. Spec. Pap.-Geol. Soc. Am. 2005, 393, 97. [Google Scholar]
- Longoria, J.F.; Jimenez, O.H. Sir-a Imagery in Geologic Studies of the Sierra Madre Oriental, Northeastern Mexico. Part 1 (Regional Stratigraphy): The Use of Morphostratigraphic Units in Remote Sensing Mapping. 1985. Available online: https://ntrs.nasa.gov/api/citations/19850011187/downloads/19850011187.pdf (accessed on 11 March 2021).
- IGRAC. Transboundary Aquifers of the World. Scale 1:50.000.000. Available online: https://ggis.un-igrac.org/view/tba (accessed on 2 April 2021).
- Magistrale, H.; Rockwell, T. The Central and Southern Elsinore Fault Zone, Southern California. Bull. Seismol. Soc. Am. 1996, 86, 1793–1803. [Google Scholar]
- CONAGUA. Actualizacion De La Disponibilidad Media Anual De Agua En El Acuifero La Rumorosa—Tecate (0236), Estado De Baja California. Mexico, DF: Subdireccion General Tecnica, CONAGUA. 2018. Available online: https://sigagis.conagua.gob.mx/gas1/Edos_Acuiferos_18/BajaCalifornia/DR_0236.pdf (accessed on 11 March 2021).
- Moyle, W.R., Jr. Geohydrologic Maps of Southern California; US Geological Survey: Reston, VS, USA, 1973. [CrossRef]
- UNESCO/OEA/ISARM AMERICAS. Sistemas Acuíferos Transfronterizos En Las Américas. Evaluación Preliminar; UNESCO: Montevideo, Uruguay; Washington, DC, USA, 2015. [Google Scholar]
- CONAGUA. Actualizacion De La Disponibilidad Media Anual De Agua En El Acuifero Valle De San Luis Rio Colorado (2601), Estado De Sonora. Mexico, DF: Subdireccion General Tecnica, CONAGUA. 2018. Available online: https://sigagis.conagua.gob.mx/gas1/Edos_Acuiferos_18/sonora/DR_2601.pdf (accessed on 9 March 2021).
- Haxel, G.B.; Tosdal, R.M.; May, D.J.; Wright, J.E. Latest Cretaceous and Early Tertiary Orogenesis in South-Central Arizona: Thrust Faulting, Regional Metamorphism, and Granitic Plutonism. Geol. Soc. Am. Bull. 1984, 95, 631–653. [Google Scholar] [CrossRef]
- Mason, D.; Bota, L. A Regional Groundwater Flow Model of the Tucson Active Management Area. 2006; Volume 159. Available online: https://new.azwater.gov/hydrology/model-data/regional-groundwater-flow-model-tucson-active-management-area-arizona-model (accessed on 29 March 2021).
- Callegary, J.; Megdal, S.B.; Scott, C.A.; Vandervoet, P.L. Five-Year Interim Report of the United States-Mexico Transboundary Aquifer Assessment Program: 2007–2012; United States Geological Survey (USGS): Reston, VA, USA, 2013. [CrossRef]
- Nassereddin, M.T. Hydrogeological Analysis of Groundwater Flow in Sonoita Creek Basin, Santa Cruz County, Arizona. 1967. Available online: https://citeseerx.ist.psu.edu/viewdoc/download?doi=10.1.1.882.9537&rep=rep1&type=pdf (accessed on 19 March 2021).
- Bradbeer, G.E. Hydrogeologic Evaluation of the Sonoita Creek Aquifer. 1978. Available online: https://repository.arizona.edu/handle/10150/191669?show=full (accessed on 30 August 2021).
- ADWR. Upper San Pedro Basin; Arizona Department of Water Resources: Phoenix, AZ, USA, 2009. [Google Scholar]
- ADWR. Santa Cruz Ama; Arizona Department of Water Resources: Phoenix, AZ, USA, 2009. [Google Scholar]
- Hawley, J.W.; Hibbs, B.J.; Kennedy, J.F.; Creel, B.J.; Remmenga, M.D.; Johnson, M.; Lee, M.M.; Dinterman, P. Trans-International Boundary Aquifers in Southwestern New Mexico; Rep. X-996350-01; New Mexico Water Resources Research Institute: Las Cruces, NM, USA, 2000; Volume 3. [Google Scholar]
- Baldridge, W.S.; Olsen, K.H. The Rio Grande Rift: What Happens When the Earth’s Lithosphere Is Pulled Apart? Am. Sci. 1989, 77, 240–247. Available online: http://www.jstor.org/stable/27855725 (accessed on 14 May 2021).
- International Boundary Water Commission (Ed.) Minute 242, Permanent and Definitive Solution to the International Problem of the Salinity of the Colorado River; 1973. Available online: https://www.ibwc.gov/Files/Minutes/Min242.pdf (accessed on 25 April 2021).


| Geological Formation | Water Quality | |||||
|---|---|---|---|---|---|---|
| Good | Regular | Poor | No Info | |||
| <1000 ppm | 1000–3000 ppm | >3000 ppm | ||||
| 1 | 2 | 3 | 4 | |||
| Aquifer Potential | Good | A | A1 | A2 | A3 | A4 |
| Moderate | B | B1 | B2 | B3 | B4 | |
| Poor | C | C1 | C2 | C3 | C4 | |
| Aquitard | D | D1 | D2 | D3 | D4 | |
| No Info | E | E1 | E2 | E3 | E4 | |
| Unit Name (Mex/USA) | Age | Location (Mex/USA) | Lithological Description | Hydrological Features | Aquifer |
|---|---|---|---|---|---|
|
Pinal Schist/
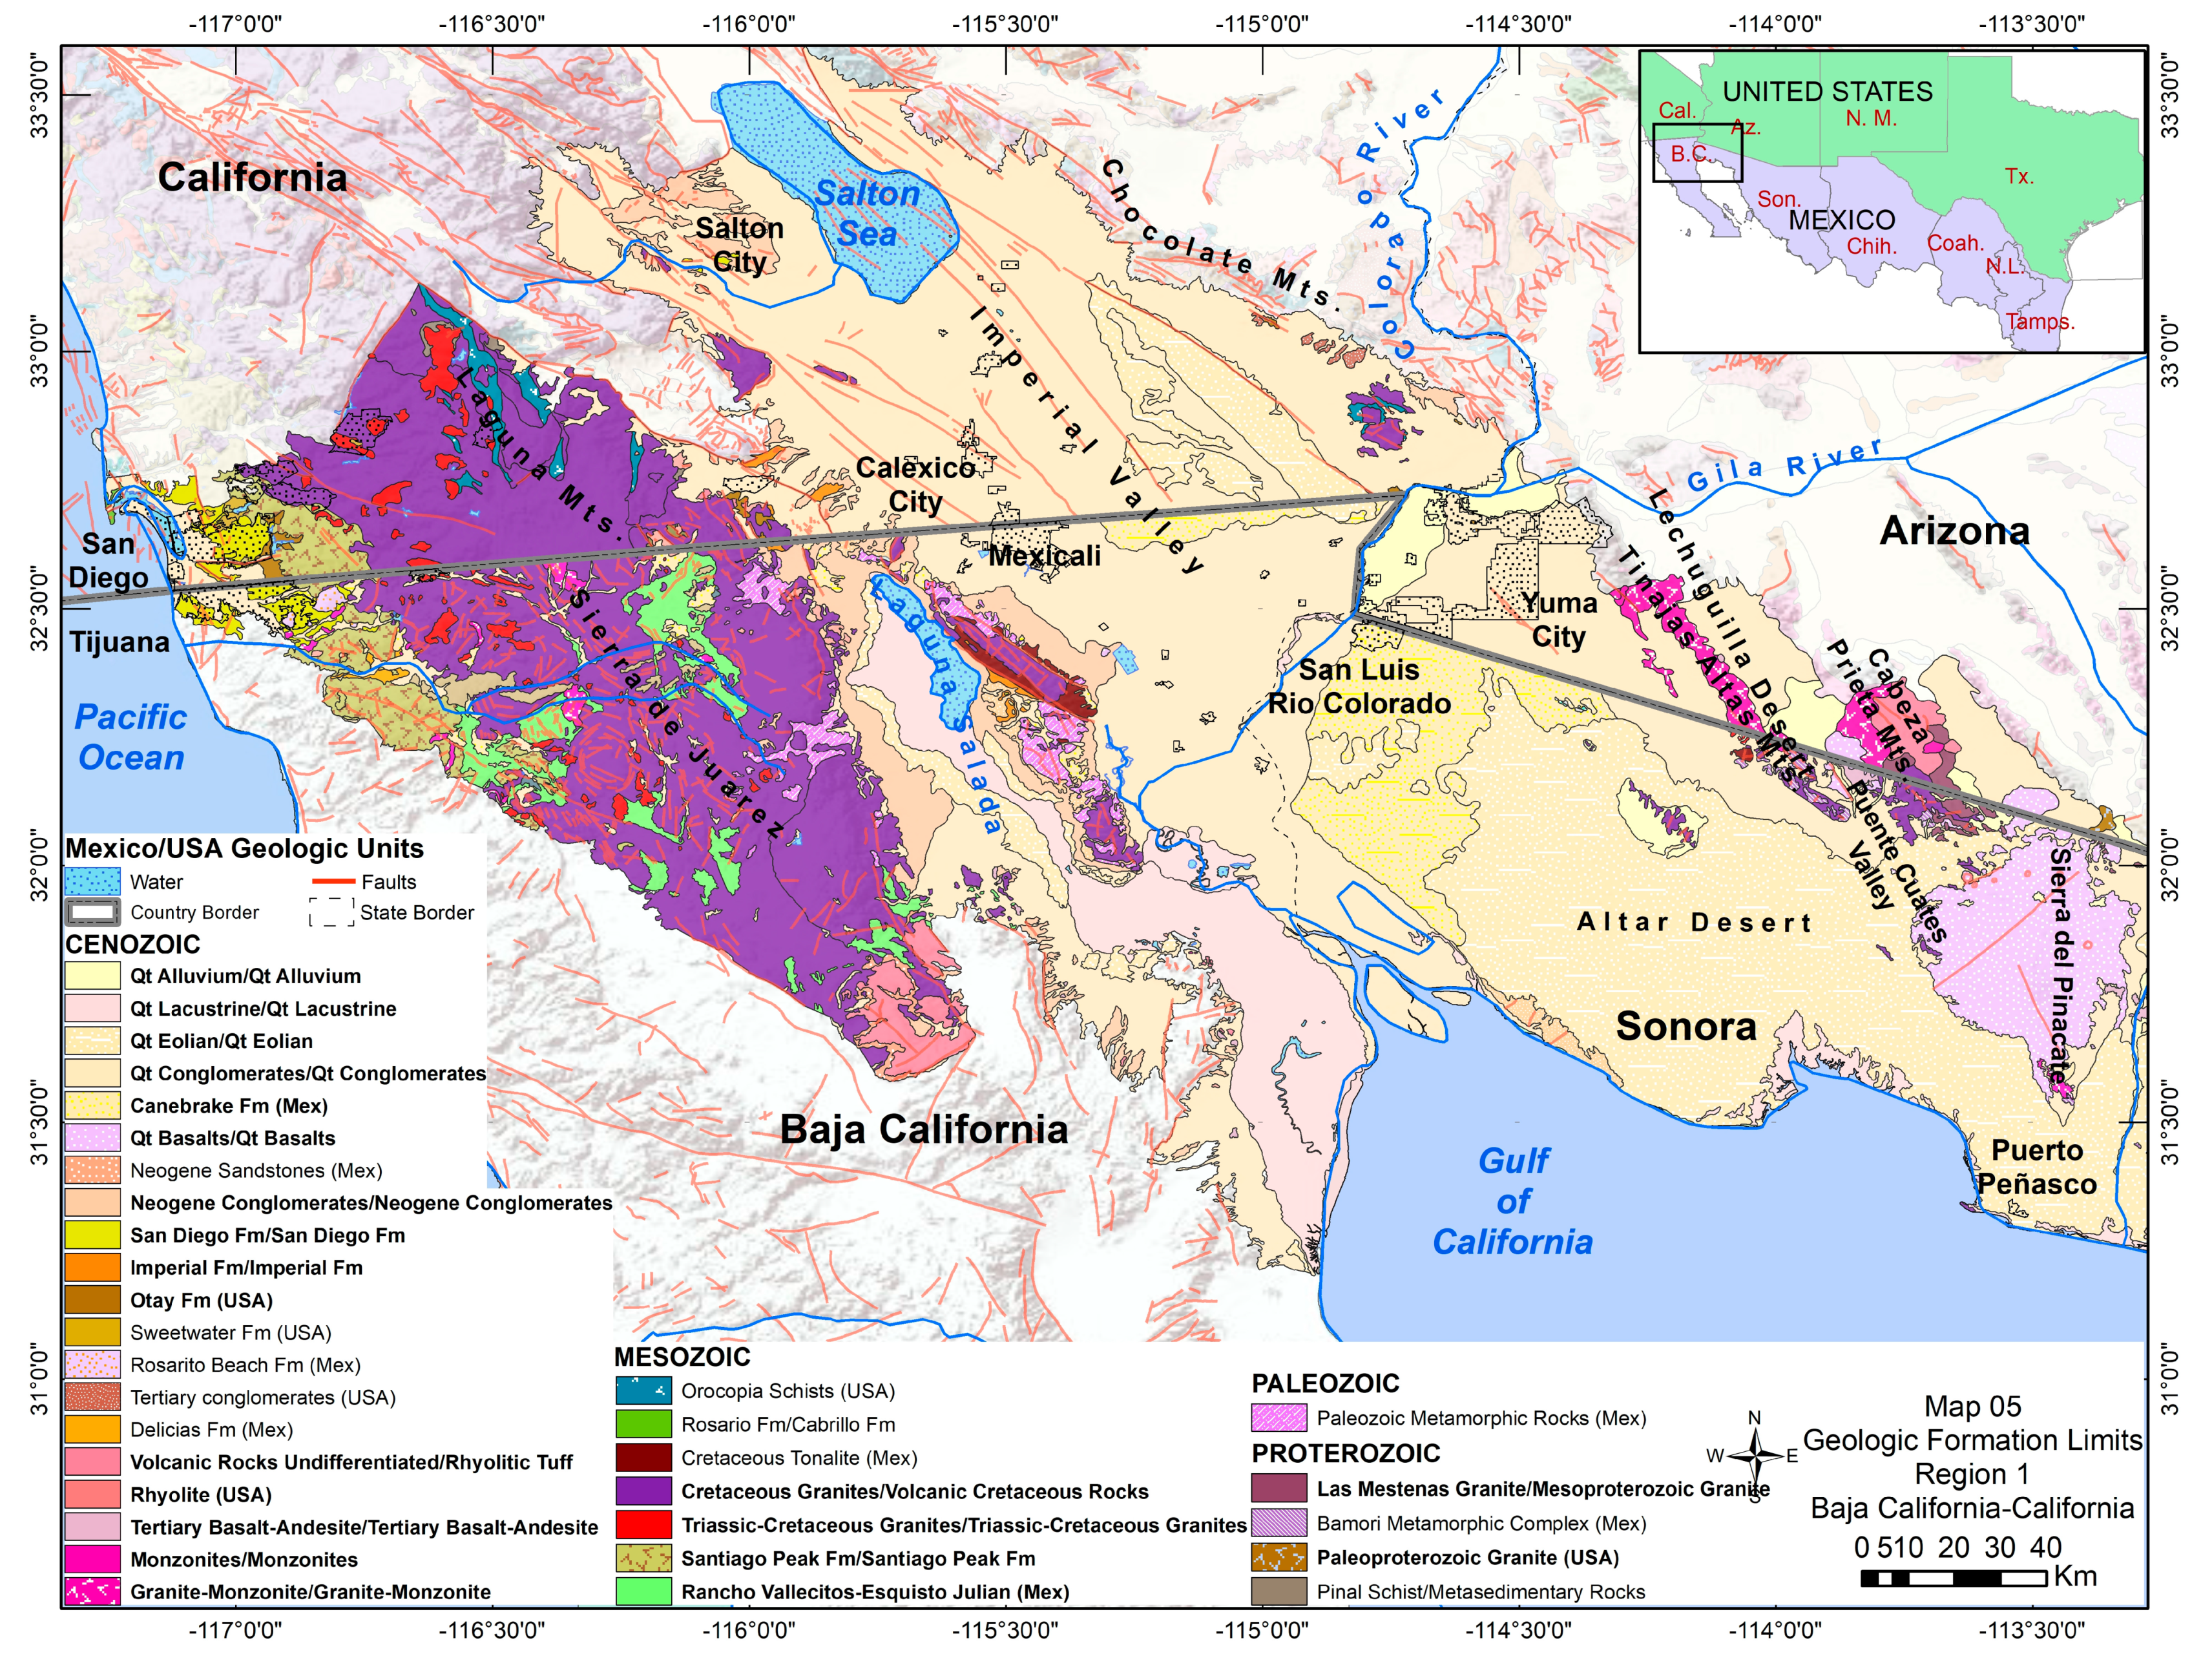
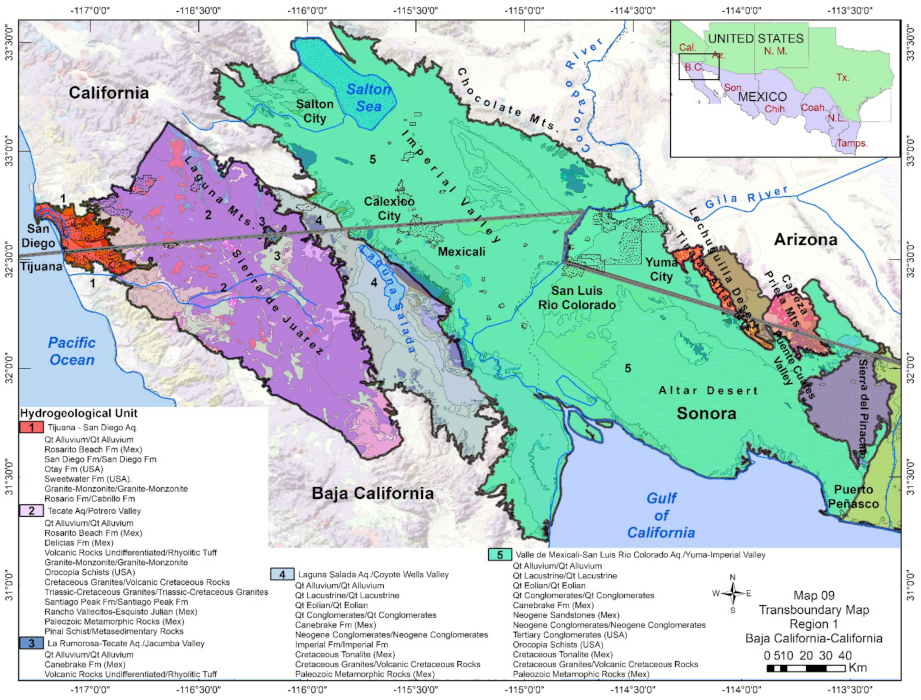
Metasedimentary Rocks (Figure 1, Figure 2 , Figure 3). | Paleoproterozoic. | Western Chihuahua and Northern Sonora/ Central New Mexico, Southern Arizona, Southern California. | Gray quartzite-sericite schists and quartzites [31]. | Low to nonexistent permeability [32]. Local secondary porosity due to fracturing [7]. | San Pedro Aq. [7]. |
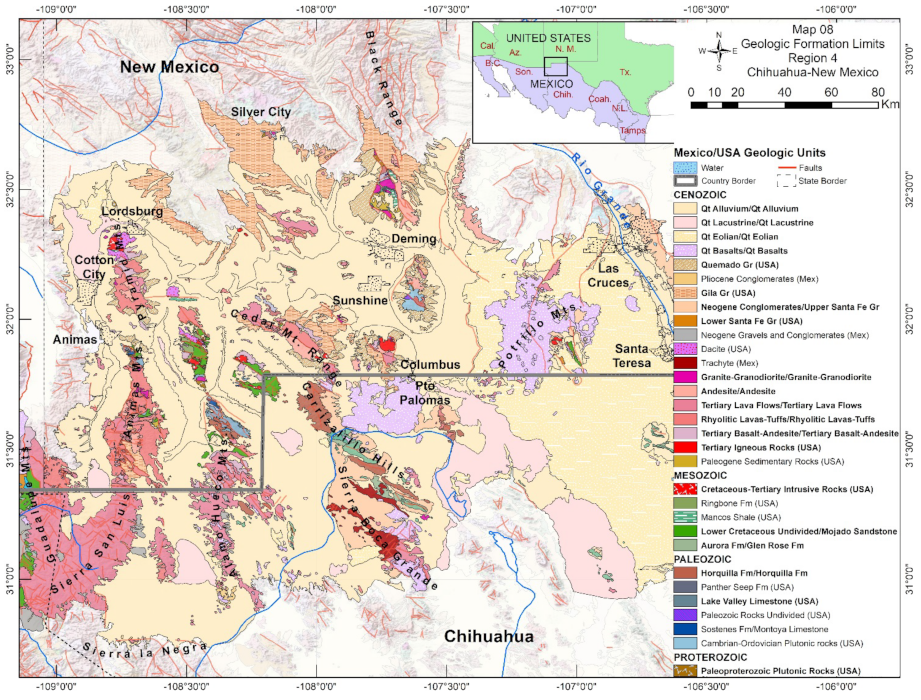
| Paleoproterozoic Plutonic Rocks (USA) (Figure 1 , Figure 2 , Figure 3 , Figure 4). | Paleoproterozoic. | Central New Mexico/ Southern Arizona. | Granitic Gneisses and foliated granites [33]. | - | - |
| Bamori Metamorphic Complex (Mex) (Figure 1 and Figure 2). | Paleoproterozoic. | Northeast Sonora. | Muscovite, biotite and quartz schists [34]. | - | - |
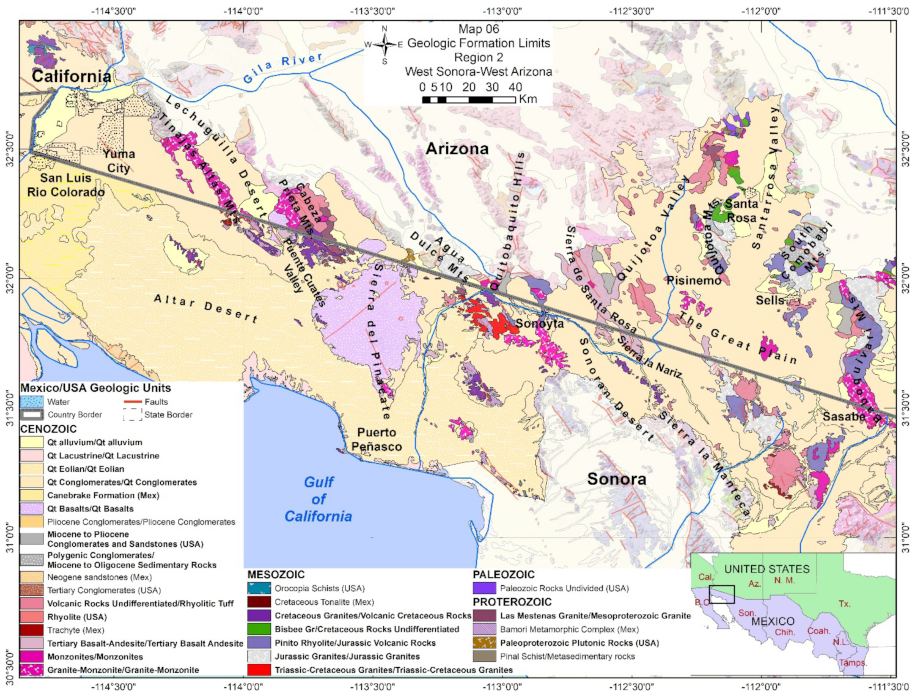
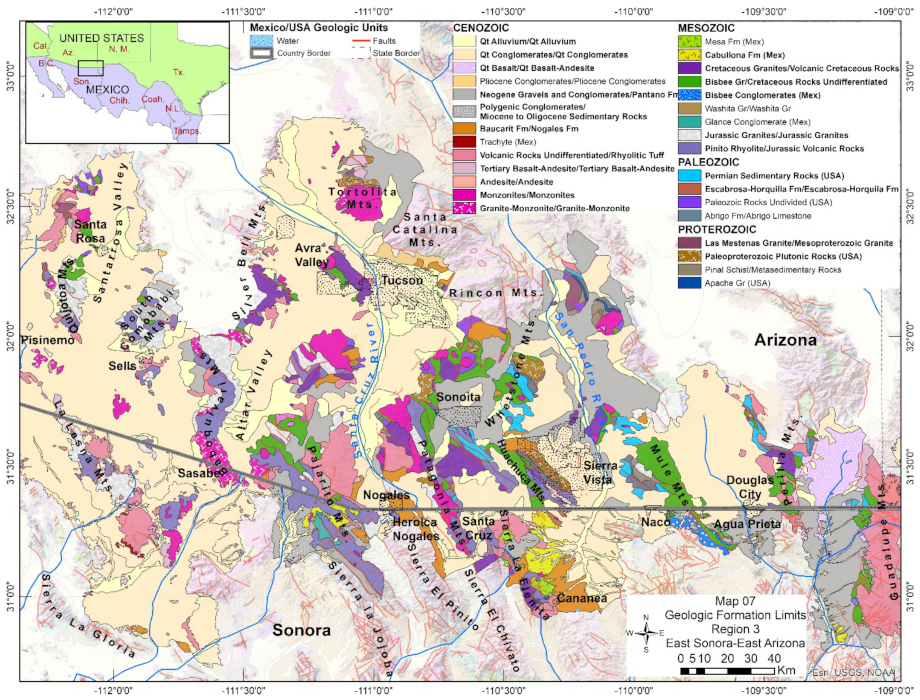
| Apache Gr (USA) (Figure 2 and Figure 3). | Mesoproterozoic. | Central and Southern Arizona. | Quartzites, with few shales and conglomerates [35]. | Local secondary porosity due to fracturing [7]. | San Pedro Aq. [7]. |
|
Las Mestenas Granite/ Mesoproterozoic Granite (Figure 1 , Figure 2 , Figure 3). | Mesoproterozoic. | Northern Sonora/ Southern Arizona. | Granites with coarse- grained holocrystalline texture. Some areas show gneiss texture [36]. | Local secondary porosity due to fracturing [7,37] | San Pedro Aq. [7]. Los Vidrios Aq. [37]. |
|
Abrigo Fm/
Abrigo Limestone (Figure 2 and Figure 3). | Cambrian. | Northeast Sonora/ Southern Arizona. | Gray-blue limestones, stratified in thin layers [31]. | - | - |
| Cambrian-Ordovician Plutonic Rocks (USA) (Figure 4). | Cambrian-Ordovician. | Southwest New Mexico. | Granites and syenites [38]. | Dense, impermeable rocks [39]. | - |
| Sostenes Fm/ Montoya Limestone (Figure 4). | Ordovician. | Central and Northern Chihuahua/ West Texas, Southern New Mexico. | Gray dolomites, some layers are recrystallized limestones. Few mudstones to the top [40]. | Montoya Dolomites have not been developed, but some evidence indicates that they may be capable of yielding water to wells [41]. | Mimbres Basin [41]. |
| Paleozoic Rocks Undivided (USA) (Figure 2 and Figure 3). | Devonian-Carboniferous. | Southeastern New Mexico, Arizona. | Nodular, silty limestones that locally contain limy shales and siltstones [41]. | Few wells yielded water from fractures [7,41]. | Mimbres Basin [41]. San Pedro Aq. [7]. |
| Paleozoic Metamorphic Rocks (Mex) (Figure 1 and Figure 2). | Devonian-Carboniferous. | Northern Baja California/ Northern Sonora. | Biotite schists and slates [42]. | Local secondary porosity due to fracturing [37]. | Los Vidrios Aq. [37]. |
| Lake Valley Limestone (USA) (Figure 4). | Carboniferous. | Western Texas, southern New Mexico. | Gray limestones filled with nodular cherts [43]. | - | - |
| Panther Seep Fm (USA) (Figure 4). | Carboniferous. | Western Texas, Central New Mexico. | Interbedded dark gray shales and calcareous siltstones [44]. | - | - |
|
Horquilla Fm/ Horquilla Fm (Figure 3 and Figure 4). | Carboniferous. | Northern Chihuahua, Northern Sonora/ Southern Mexico, Arizona. | Thin pink limestone layers to the top. Gray massive limestone layers to the top [45]. | Massive rocks which constitute limits of adjacent younger deposits [46]. | Josefa Ortiz de Dominguez Aq. [46]. |
| Escabrosa Fm/ Escabrosa Fm (Figure 3). | Carboniferous. | Northeast Sonora/ Southeast Arizona. | White to dark gray limestones, coarse stratification [31]. | - | - |
| Permian Sedimentary Rocks (USA) (Figure 3). | Permian. | Southeastern Arizona. | Thick bedded limestones with layers of shales and sandstones [47]. | Local secondary porosity due to fracturing [7]. | San Pedro Aq. [7]. |
| Triassic-Cretaceous Granites/ Triassic-Cretaceous Granites (Figure 1 and Figure 2). | Triassic-Cretaceous. | Northern Baja California, Northwestern Sonora/ Southern California. | Granodiorites, Tonalites [15]. | Poor porosity, secondary porosity on the surface due to alteration [48]. | Tecate Aq. [48]. |
|
Jurassic Granites/ Jurassic Granites (Figure 1 , Figure 2 , Figure 3). | Triassic-Jurassic. | Northern Sonora/ Southern Arizona. | Plutonic and volcanic rocks, with local occurrences of redbeds [47]. | - | - |
|
Pinito Rhyolite/ Jurassic Volcanic Rocks (Figure 1 , Figure 2 , Figure 3). | Jurassic. | Northern Sonora/ Southern Arizona. | White to light gray rhyolites and rhyodacites [49]. | Low primary permeability but moderate secondary permeability [50,51]. | Santa Cruz Aq. [50]. Rio Alisos Aq. [51]. |
|
Bisbee Gr/ Bisbee Gr (Figure 2 and Figure 3). | Late Jurassic-Early Cretaceous. | Northern Sonora/ Southeast Arizona. | Conglomerates, sandstones, and argilites [52,53]. | - | - |
| Washita Gr/ Washita Gr | Early Cretaceous. | Northern Chihuahua. | Limestones interbedded with clays [54]. | - | - |
| Cretaceous Tonalite (Mex) (Figure 1 and Figure 2). | Aptian. | Northwest Sonora, Northern Baja California. | Tonalites and Granites | - | - |
| Aurora Fm/ Glen Rose Fm (Figure 4). | Albian. | Northeast Chihuahua/ Western Texas. | Limestone layers, sandy limestones with interbedded sandy clays, sandstone and marl [55]. | Secondary porosity due to fracturing [56]. | Palomas-Guadalupe Victoria Aq. [56]. |
| Lower Cretaceous Undivided/Mojado Sandstone (Figure 4). | Albian-Cenomanian. | Northern Chihuahua/ Central New Mexico. | Quartz sandstone interbedded with gray shales [57] | Local secondary porosity due to fracturing [7,58]. | San Pedro Aq. [7]. Arroyo San Bernardino Aq. [58] |
|
Cretaceous Granites/ Volcanic Cretaceous Rocks (Figure 1 , Figure 2 , Figure 3) | Late Cretaceous. | Northern Sonora, Northern Baja California/ Southern Arizona, Southern California. | Rhyolitic to andesitic volcanic rocks, locally associated sedimentary and subvolcanic intrusive rocks [47]. | These crystalline rocks are dense and contain only small amounts of water in fractures and weathered zones [59]. | Mexicali-Rio Colorado Valley [59]. Santa Cruz Aq. [50]. |
| Mancos Shale (USA) (Figure 4). | Turonian-Coniacian. | Central New Mexico. | Shales with local siltstones, sandstones, and bentonite [60]. | - | - |
| Cabullona Fm (Mex) (Figure 3) | Santonian-Maastrichtian. | Northern Sonora. | Conglomerates, sandstones, shales, and tuffs [61]. | - | - |
| Ringbone Fm (USA) (Figure 4). | Campanian. | Southwestern New Mexico. | Dark shales with conglomerates at the bottom, tuffaceous sandstone at the top [62]. | - | - |
| Rosario Fm/Cabrillo Fm (USA) (Figure 1). | Maastrichtian. | Southwestern California. | Massive medium-grained sandstone with thin siltstone beds and conglomerate lenses [63]. | - | - |
| Orocopia Schists (USA) (Figure 1 and Figure 2). | Late Cretaceous-Paleogene. | Western Arizona, Southeastern California. | Gray quartz-feldspar schists, peridotites, schistose amphibolite, metachert, siliceous marble [64]. | - | - |
| Cretaceous-Tertiary Intrusive Rocks (USA) (Figure 4). | Late Cretaceous-Paleogene. | Southern New Mexico. | Granodiorite, quartz monzonite, monzonite porphyry dikes [65]. | - | - |
|
Granite-Monzonite/ Granite-Monzonite (Figure 1 , Figure 2 , Figure 3). | Campanian-Eocene. | Northern Sonora, Northern Baja California/ Southern Arizona. | Muscovite granites with garnets, monzonites [66]. | Poor porosity [50]. Secondary porosity [67]. | Santa Cruz [50]. San Diego Aq. [67]. |
|
Monzonites/ Monzonites (Figure 1 , Figure 2 , Figure 3). | Paleocene-Eocene. | Northern Sonora/ Southern Arizona. | Monzonites and quartz monzonites [19]. | Local secondary porosity due to fracturing [7]. | San Pedro Aq. [7]. |
| Paleogene Sedimentary Rocks (USA) (Figure 4). | Paleocene-Oligocene. | Southern New Mexico. | Calcareous sandstones, gray limestones [68]. | - | - |
| Delicias Fm (Mex) (Figure 1). | Eocene. | Northwestern Baja California. | Green shales and dark yellow sandstones [69]. | - | - |
| Tertiary Igneous Rocks (USA) (Figure 4). | Eocene-Pliocene. | Southwestern New Mexico. | Monzonites to granites, andesites, dacites [65]. | - | - |
| Rhyolitic Lavas-Tuffs/ Rhyolitic Lavas-Tuffs (Figure 4). | Oligocene. | Northern Chihuahua/ Western New Mexico. | Rhyolitic tuffs. Tuffaceous and silty sandstones [41]. | Rocks rarely developed for groundwater production [41]. | Mimbres Basin [41]. |
|
Tertiary Basalt-Andesite/ Tertiary Basalt-Andesite (Figure 1 , Figure 2 , Figure 3 , Figure 4). | Oligocene. | Northern Baja California, Northern Sonora/ Southern California, Southern Arizona, Southern New Mexico. | Basaltic-andesitic sequence, pyroclastic rocks of silicic to intermediate composition ranging from soft pumiceous ashfall tuff to densely welded ash-flow tuff [70]. | Locally fractured rocks allow secondary permeability between 18 and 25% [71]. | Mimbres Basin [41]. |
| Tertiary Lava Flows/ Tertiary Lava Flows (Figure 4). | Oligocene. | Northern Chihuahua and Sonora/ Southern New Mexico. | Locally erupted lavas, rhyolitic pyroclastic flows and tuffs [65]. | - | - |
| Andesite/Andesite (Figure 3 and Figure 4). | Oligocene. | Northern Chihuahua/ Southern New Mexico. | Andesitic and rhyolitic rocks [72]. | Moderate to good secondary porosity [58]. | Arroyo San Bernardino Aq. [58]. |
| Granite-Granodiorite/ Granite-Granodiorite (Figure 4). | Oligocene. | Northern Chihuahua/ Southern New Mexico. | Quartz-Monzonite porphyry and granodiorites [72]. | Locally fractured rocks allow secondary permeability between 18 and 25% [71,73]. | Mimbres Basin [41]. Santa Cruz Aq. [73]. |
| Trachyte (Mex) (Figure 2 , Figure 3 , Figure 4). | Oligocene. | Northern Chihuahua, Northern Sonora. | Trachyte and volcanic felsic flows [11]. | - | - |
| Rhyolite (USA) (Figure 1 and Figure 2). | Oligocene-Miocene | Southern California. | Volcanic rhyolitic flows and tuffs [74]. | - | - |
| Neogene gravels and conglomerates/Pantano Fm (Figure 3 and Figure 4) | Oligocene-Miocene | Northern Sonora and Chihuahua/Eastern Arizona. | Well consolidated fine to coarse-grained alluvial fan and playa deposits, volcanic flows, and rock-avalanche beds [75]. | Provides water to wells and alluvial deposits [75]. | Tucson AMA [75]. |
| Polygenic conglomerates/Miocene to Oligocene sedimentary rocks (Figure 2 and Figure 3) | Oligocene-Miocene | Northern Sonora/Central and western Arizona. | Conglomerates, sandstones and mudstones undifferentiated [19,66]. | - | - |
| Lower Santa Fe Gr (USA) (Figure 4) | Oligocene-Miocene | South-central New Mexico. | Coarse sandstones and alluvial fan deposits [76]. | Source of fresh water in the bolsons area [77]. | Mesilla Bolson [77]. |
| Palmas Fm (Mex) (Figure 1). | Oligocene-Pleistocene. | Northwestern Baja California. | Polymictic conglomerates with few sandstones and claystones [14]. | - | - |
| Dacite (USA) (Figure 1 , Figure 2 , Figure 3 , Figure 4). | Miocene. | Southern New Mexico, Southern Arizona. | Rhyolite and Dacite flows [65]. | - | - |
|
Volcanic Rocks Undifferentiated/ Rhyolitic Tuff (Figure 1 , Figure 2 , Figure 3). | Miocene. | Northern Sonora, Northern Baja California/ Southern Arizona. | Flows of rhyolites and rhyolitic tuffs [21]. | Poorly water bearing rocks, may form the boundaries of the groundwater reservoir [59]. | Mexicali-Rio Colorado Valley [59]. |
| Tertiary Conglomerates (USA) (Figure 1 and Figure 2). | Miocene. | Southern California. | Coarse grained non-marine deposits [59]. | These deposits are capable of yielding moderate amounts of fresh groundwater [59]. | Mexicali-Rio Colorado Valley [59]. |
| Sweetwater Fm (USA) (Figure 1). | Miocene. | Southwestern California. | Gritty sandstones and red claystones [78]. | - | - |
| Dacite (USA) (Figure 1 , Figure 2 , Figure 3 , Figure 4). | Miocene. | Southern New Mexico, Southern Arizona. | Rhyolite and Dacite flows [65]. | - | - |
| Otay Fm (USA) (Figure 1) | Miocene | Southwestern California. | Conglomerates and sandstones with few mudstones and bentonites [79]. | Water bearing unit [80]. | San Diego Aq. [80]. |
| Imperial Fm/ Imperial Fm (Figure 1). | Miocene-Pliocene. | Southern California. | Siltstones and conglomerates [81]. | Generally low permeability [59]. | Yuma Aq. [59]. |
| Bouse Fm (USA) (Figure 2) | Miocene-Pliocene. | Southern Arizona and California. | Basal limestones and a distinctive tuff, interbedded clay, silt, and sandstones [82]. | The lower part of the formation is generally poorly permeable, but the upper part is fairly permeable where sand is more abundant [59]. | Lower Colorado River and Salton Sea basins [59]. |
| Baucarit Fm/Nogales Fm (Figure 3) | Miocene-Pliocene | Northern Sonora/Southeastern Arizona | Volcanic conglomerates, sandstones and clays with local thin basalt flows [83]. | Effective porosity ranges from 16 to 42% and hydraulic conductivity from 4 to 57 cm per day [84]. Some layers from Baucarit Fm. work as confining units [58]. | Santa Cruz Aq. [85]. Rio San Pedro Aq. [86] |
| Gila Gr (USA) (Figure 4). | Miocene-Pliocene. | Central New Mexico/ Central Arizona. | Conglomerates with calcareous cement. Interbeddings of sandstones [87]. | Very low hydraulic conductivities and storage coefficients, indicative of semiconfined to confined hydraulic conditions [88]. | Mimbres, Hachita, Playas, Animas basins [89]. Mimbres Basin [41]. |
| Pliocene Conglomerates/Pliocene Conglomerates (Figure 2 and Figure 3) | Pliocene | Northern Baja California, Northern Sonora/ Southern New Mexico, Southern Arizona, Southern California. | Conglomerates and sandstones [22]. | - | - |
| Neogene Conglomerates/ Upper Santa Fe Gr (Figure 4). | Pliocene-Holocene. | Northern Chihuahua, Northern Sonora/Southwestern New Mexico. | Semiconsolidated polymictic conglomerates [11]. Fluvial cemented deposits [76]. | Major source of fresh water [77]. | Mesilla Bolson [77]. |
| Quemado Gr (USA) (Figure 4). | Pliocene- Pleistocene. | Southern New Mexico. | Light brown friable sandstones and gravels [90]. | - | - |
| San Diego Fm/San Diego Fm (Figure 1). | Pliocene- Pleistocene. | Northern Baja California/Southern California. | Sandstones and conglomerates with thin beds of bentonite [91]. | Moderate hydraulic conductivity [92]. | San Diego aq. [92]. |
| Canebrake Fm (Mex) (Figure 1 and Figure 2). | Pliocene-Pleistocene. | Northern Baja California. | Gray and conglomerates with few layers of unconsolidated sandstones [93]. | - | - |
| Neogene Sandstones (Mex) (Figure 1). | Pliocene-Holocene. | Northwestern Sonora. | Unconsolidated sands and gravels [17]. | - | - |
|
Qt Conglomerates/ Qt Conglomerates (Figure 1 , Figure 2 , Figure 3). | Pleistocene-Holocene. | Northern Sonora/ Southern Arizona. | Terrace deposits of coarse sand and gravel [41]. | Deposits saturated with saline water [94]. Moderate porosity [95]. | Mimbres Basin [41]. Arroyo Seco Aq. [95]. Puerto Peñasco Aq. [94]. |
|
Qt Eolian/ Qt Eolian (Figure 1 , Figure 2 , Figure 3 , Figure 4). | Pleistocene-Holocene. | Northern Chihuahua, northwestern Sonora/ Southern California. | Unconsolidated sands [59]. | - | Animas Aq. [72]. Yuma Aq. [59]. Laguna Salada Aq. [96]. |
|
Qt Lacustrine/ Qt Lacustrine (Figure 1 , Figure 2 , Figure 3 , Figure 4). | Pleistocene-Holocene. | Northern Chihuahua, Northwestern Sonora, Northeastern Baja California/ Southern New Mexico. | Unconsolidated gray clay, red shales and bentonite [41]. | Deposits with low permeability [37]. The deposits are part of swamps near the coast [97]. | Sonoyta-Puerto Peñasco Aq. [97]. |
|
Qt Alluvium/ Qt Alluvium (Figure 1 , Figure 2 , Figure 3 , Figure 4). | Pleistocene-Holocene. | Chihuahua, Sonora, Baja California/ New Mexico, Arizona, California. | Conglomerates cemented with calcium carbonate in southern New Mexico [39]. The alluvium consists of permeable lenses of sand and gravel interbedded with clay and silt in southeastern Arizona [98]. Clean medium to coarse sand in California [59]. | The valley floor is underlain by permeable alluvium, capable of producing large amounts of ground water at Avra Valley [98]. High K, n, and S at San Diego Aq. [67]. High K in unconsolidated deposits at San Pedro Aq. [7]. | Avra and Altar Valleys [98], Yuma and Mexicali-Rio Colorado Valley [59]. Mimbres Basin [41]. San Diego Aq. [67]. San Pedro Aq. [7]. |
| HGU/Aquifer | Boundary (*) and Transboundary Formations | Aquifer Potential | Hydrogeologic Features | Water Quality | TDS (ppm) | ID |
|---|---|---|---|---|---|---|
| (1) Tijuana–San Diego Aq. | Qt Alluvium/Qt Alluvium. | Good. | T = 3024 m2/d K = 190 m/d | Fresh to Saline. | 600–4900 |  |
| *Rosarito Beach Fm (Mex). | Good. | T = 346 m2/d K = 0.17 m/d | Fresh to Saline. | 600–4900 | | |
| San Diego Fm/San Diego Fm | Moderate. | K = 0.02 m/d | Poor. | - | B3 | |
| *Otay Fm (USA). | Good | - | Poor | B4 | ||
| *Sweetwater Fm (USA). | Unknown. | Unknown. | E4 | |||
| Granite–Monzonite/Granite–Monzonite. | Moderate–Poor. | Unknown. |  | |||
| Rosario Fm/Cabrillo Fm (USA). | Unknown. | Unknown. | E4 | |||
| (2) Tecate Aq./ Potrero Valley. | Qt Alluvium/Qt Alluvium. | Moderate. | T = 2074 m2/d K = 81.6 m/d | Good. | 300–900 | B1 |
| *Rosarito Beach Fm (Mex). | Moderate. | T = 55 m2/d K = 0.82 m/d | Good. | 300–900 | B1 | |
| *Delicias Fm (Mex). | Unknown. | Unknown. | E4 | |||
| Volcanic Rocks Undifferentiated/Rhyolitic Tuff. | Poor. | Unknown. | C4 | |||
| Granite–Monzonite/Granite–Monzonite. | Moderate–Poor. | Unknown. | | |||
| *Orocopia Schists (USA). | Unknown. | Unknown. | E4 | |||
| *Cretaceous Granites/Volcanic Cretaceous Rocks. | Moderate–Poor. | Unknown. | | |||
| Triassic–Cretaceous Granites/Triassic–Cretaceous Granites. | Moderate–Poor. | Unknown. | | |||
| *Santiago Peak Fm/Santiago Peak Fm. | Unknown. | Unknown. | E4 | |||
| *Rancho Vallecitos–Esquisto Julian (Mex). | Unknown. | Unknown. | E4 | |||
| *Paleozoic Metamorphic Rocks (Mex). | Unknown. | Unknown. | E4 | |||
| *Pinal Schist/Metasedimentary Rocks. | Poor. | Poor. | C3 | |||
| (3) La Rumorosa–Tecate Aq./ Jacumba Valley. | Qt Alluvium/Qt Alluvium. | Good. | T = 52–95 m2/d | Moderate to good. | 1184–1236 | A2 |
| *Canebrake Fm (Mex). | Good. | Moderate to good. | 1184–1236 | A2 | ||
| Volcanic Rocks Undifferentiated/Rhyolitic Tuff. | Poor. | Unknown. | C4 | |||
| (4) Laguna Salada Aq./ Coyote Wells Valley. | Qt Alluvium/Qt Alluvium. | Good. | T = 43–173 m2/d K = 0.05–22 m/d | Brackish. | 1180 | A2 |
| Qt Lacustrine/Qt Lacustrine. | Poor. | Brackish. | 1180 | C2 | ||
| Qt Eolian/Qt Eolian. | Good. | T = 43–173 m2/d K = 0.05–22 m/d | Brackish. | 1180 | A2 | |
| Qt Conglomerates/Qt Conglomerates. | Good. | T = 43–173 m2/d. K = 0.05–22 m/d | Brackish. | 1180 | A2 | |
| *Canebrake Fm (Mex). | Moderate. | Brackish. | 1180 | B2 | ||
| Neogene Conglomerates/Neogene Conglomerates. | Moderate. | Brackish. | 1180 | B2 | ||
| Imperial Fm/Imperial Fm. | Low. | Brackish. | 1180 | C2 | ||
| *Cretaceous Tonalite (Mex). | Poor. | Unknown. | C4 | |||
| *Cretaceous Granites/Volcanic Cretaceous Rocks. | Poor. | Unknown. | C4 | |||
| *Paleozoic Metamorphic Rocks (Mex). | Poor. | Unknown. | C4 | |||
| (5) Valle de Mexicali–San Luis Rio Colorado Aq./ Yuma–Imperial Valley. | Qt Alluvium/Qt Alluvium. | Good. | N = 28% T = 4300–30,200 m2/d | Fresh to Saline. | 498–7280 | |
| Qt Lacustrine/Qt Lacustrine. | Poor. | Brackish. | 498–7280 |  | ||
| Qt Eolian/Qt Eolian. | Good. | N = 28% T = 4300–30,200 m2/d | Fresh to Saline. | 498–7280 | | |
| Qt Conglomerates/Qt Conglomerates. | Good. | N = 28% T = 4300–30,200 m2/d | Fresh to Saline. | 498–7280 | | |
| *Canebrake Fm (Mex). | Moderate. | Brackish. | 498–7280 |  | ||
| *Neogene Sandstones (Mex). | Moderate. | Brackish. | 498–7280 | | ||
| Neogene Conglomerates/Neogene Conglomerates. | Moderate. | Brackish. | 498–7280 | | ||
| *Tertiary Conglomerates (USA). | Unknown. | Unknown. | E4 | |||
| *Orocopia Schists (USA). | Unknown. | Unknown. | E4 | |||
| *Cretaceous Tonalite (Mex). | Poor. | Unknown. | C4 | |||
| *Cretaceous Granites/Volcanic Cretaceous Rocks. | Poor. | Unknown. | C4 | |||
| *Paleozoic Metamorphic Rocks (Mex). | Poor. | Unknown. | C4 | |||
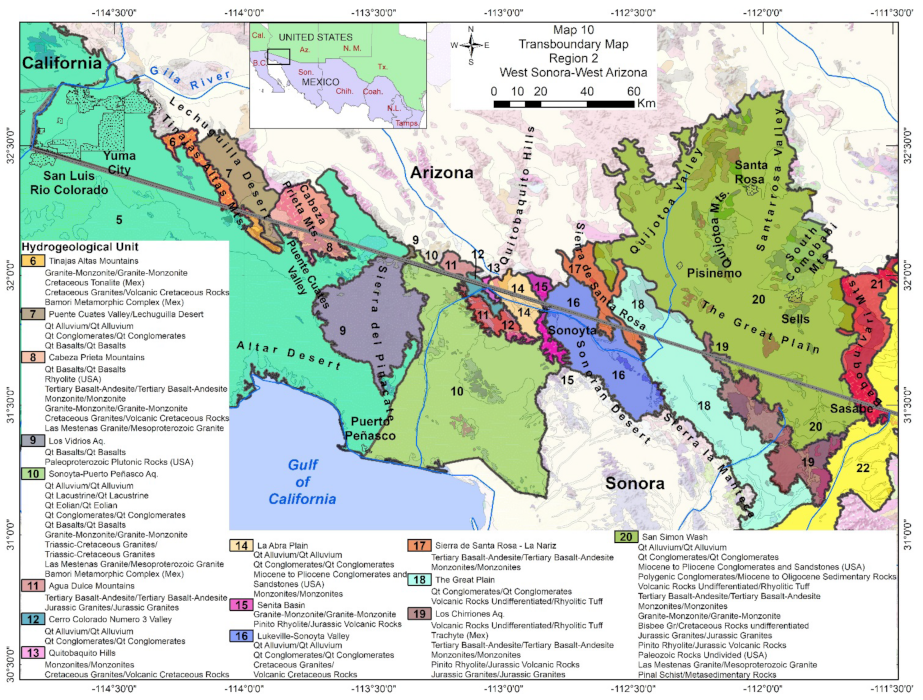
| (6) Tinajas Altas Mountains. | Granite–Monzonite/Granite–Monzonite. | Poor. | Unknown. | C4 | ||
| *Cretaceous Tonalite (Mex). | Poor. | Unknown. | C4 | |||
| *Cretaceous Granites/Volcanic Cretaceous Rocks. | Poor. | Unknown. | C4 | |||
| *Bamori Metamorphic Complex (Mex). | Poor. | Unknown. | C4 | |||
| (7) Puente Cuates Valley/Lechuguilla Desert. | Qt Alluvium/Qt Alluvium. | Good. | Unknown. | A4 | ||
| Qt Conglomerates/Qt Conglomerates. | Good. | Unknown. | A4 | |||
| Qt Basalts/Qt Basalts. | Poor. | Unknown. | C4 | |||
| (8) Cabeza Prieta Mountains. | Qt Basalts/Qt Basalts. | Poor. | Unknown. | C4 | ||
| *Rhyolite (USA). | Poor. | Unknown. | C4 | |||
| Tertiary Basalt–Andesite/Tertiary Basalt–Andesite. | Poor. | Unknown. | C4 | |||
| Monzonites/Monzonites. | Poor. | Unknown. | C4 | |||
| Granite–Monzonite/Granite–Monzonite. | Poor. | Unknown. | C4 | |||
| *Cretaceous Granites/Volcanic Cretaceous Rocks. | Poor. | Unknown. | C4 | |||
| Las Mestenas Granite/Mesoproterozoic Granite. | Poor. | Unknown. | C4 | |||
| (9) Los Vidrios Aq. | Qt Basalts/Qt Basalts | Poor. | Unknown. | C4 | ||
| *Paleoproterozoic Plutonic Rocks (USA). | Poor. | Unknown. | C4 | |||
| (10) Sonoyta–Puerto Peñasco Aq. | Qt Alluvium/Qt Alluvium. | Good. | T = 4400 m2/d | Fresh to Saline. | 353–25,076 | |
| Qt Lacustrine/Qt Lacustrine. | Poor. | T = 1550 m2/d | Fresh to Saline. | 353–25,076 |  | |
| Qt Eolian/Qt Eolian. | Good. | T = 4400 m2/d | Fresh to Saline. | 353–25,076 | | |
| Qt Conglomerates/Qt Conglomerates. | Good. | K = 302 m/d | Fresh to Saline. | 353–25,076 | | |
| Qt Basalts/Qt Basalts. | Poor. | Unknown. | C4 | |||
| Granite–Monzonite/Granite–Monzonite. | Poor. | Unknown. | C4 | |||
| Triassic–Cretaceous Granites/Triassic–Cretaceous Granites. | Poor. | Unknown. | C4 | |||
| Las Mestenas Granite/Mesoproterozoic Granite. | Moderate–Poor. | Unknown. | | |||
| *Bamori Metamorphic Complex (Mex). | Moderate–Poor. | Unknown. | | |||
| (11) Agua Dulce Mountains. | Tertiary Basalt–Andesite/Tertiary Basalt–Andesite. | Poor. | Unknown. | C4 | ||
| Jurassic Granites/Jurassic Granites. | Poor | Unknown | C4 | |||
| (12) Cerro Colorado Numero 3 Valley. | Qt Alluvium/Qt Alluvium | Good. | Unknown. | A4 | ||
| Qt Conglomerates/Qt Conglomerates. | Good. | Unknown. | A4 | |||
| (13) Quitobaquito Hills. | Monzonites/Monzonites. | Moderate–Poor. | Good. | 662–783 |  | |
| *Cretaceous Granites/Volcanic Cretaceous Rocks. | Moderate–Poor. | Good. | 662–783 | | ||
| (14) La Abra Plain. | Qt Alluvium/Qt Alluvium. | Good. | K = 15–30 m/d | Slightly saline. | 1500 | A2 |
| Qt Conglomerates/Qt Conglomerates. | Good. | Slightly saline. | 1500 | A2 | ||
| *Miocene to Pliocene Conglomerates and Sandstones (USA) | Poor. | Unknown. | C4 | |||
| Monzonites/Monzonites. | Poor. | Unknown. | C4 | |||
| (15) Senita Basin. | Granite–Monzonite/Granite–Monzonite. | Poor. | Unknown. | C4 | ||
| Pinito Rhyolite/Jurassic Volcanic Rocks. | Poor. | Unknown. | C4 | |||
| (16) Lukeville–Sonoyta Valley. | Qt Alluvium/Qt Alluvium. | Good. | Unknown. | A4 | ||
| Qt Conglomerates/Qt Conglomerates. | Good. | Unknown. | A4 | |||
| *Cretaceous Granites/Volcanic Cretaceous Rocks. | Poor. | Unknown. | C4 | |||
| (17) Sierra de Santa Rosa–La Nariz. | Tertiary Basalt–Andesite/Tertiary Basalt–Andesite. | Poor. | Unknown. | C4 | ||
| Monzonites/Monzonites. | Poor. | Unknown. | C4 | |||
| (18) The Great Plain. | Qt Conglomerates/Qt Conglomerates. | Good. | Poor. | 4880 | A3 | |
| Volcanic Rocks Undifferentiated/Rhyolitic Tuff. | Poor. | Unknown. | C4 | |||
| (19) Los Chirriones Aq. | Volcanic Rocks Undifferentiated/Rhyolitic Tuff. | Poor. | Unknown. | C4 | ||
| *Trachyte (Mex). | Poor. | Unknown. | C4 | |||
| Tertiary Basalt–Andesite/Tertiary Basalt–Andesite. | Poor. | Unknown. | C4 | |||
| Monzonites/Monzonites. | Poor. | Unknown. | C4 | |||
| Pinito Rhyolite/Jurassic Volcanic Rocks. | Poor. | Unknown. | C4 | |||
| Jurassic Granites/Jurassic Granites. | Poor. | Unknown. | C4 | |||
| (20) San Simon Wash. | Qt Alluvium/Qt Alluvium. | Good. | Fresh to Saline. | 180–4900 | | |
| Qt Conglomerates/Qt Conglomerates. | Good. | Fresh to Saline. | 180–4900 | | ||
| *Miocene to Pliocene Conglomerates and Sandstones (USA) | Unknown. | Unknown. | E4 | |||
| Polygenic Conglomerates/Miocene to Oligocene Sedimentary Rocks | Unknown | Unknown | E4 | |||
| Volcanic Rocks Undifferentiated/Rhyolitic Tuff. | Poor. | Unknown. | C4 | |||
| Tertiary Basalt–Andesite/Tertiary Basalt–Andesite. | Poor. | Unknown. | C4 | |||
| Monzonites/Monzonites. | Poor. | Unknown. | C4 | |||
| Granite–Monzonite/Granite–Monzonite. | Poor. | Unknown. | C4 | |||
| Bisbee Gr/Cretaceous Rocks Undifferentiated | Poor. | Unknown. | C4 | |||
| Jurassic Granites/Jurassic Granites. | Poor. | Unknown. | C4 | |||
| Pinito Rhyolite/Jurassic Volcanic Rocks. | Poor. | Unknown. | C4 | |||
| *Paleozoic Rocks Undivided (USA). | Poor. | Unknown. | C4 | |||
| Las Mestenas Granite/Mesoproterozoic Granite. | Poor. | Unknown. | C4 | |||
| *Pinal Schist/Metasedimentary Rocks. | Poor. | Poor. | C3 | |||
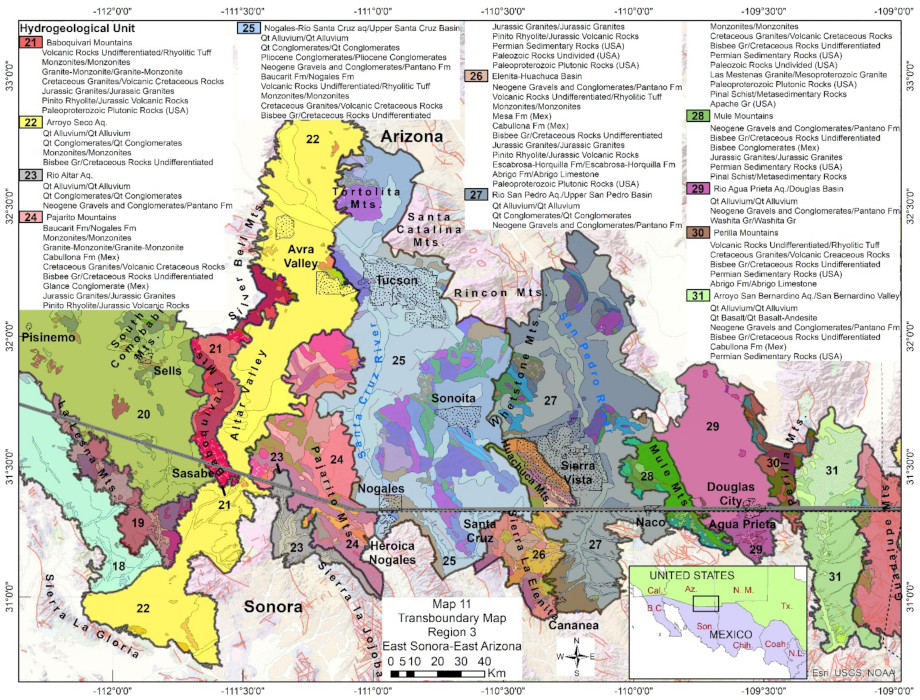
| (21) Baboquivari Mountains. | Volcanic Rocks Undifferentiated/Rhyolitic Tuff | Poor. | Unknown. | C4 | ||
| Granite–Monzonite/Granite–Monzonite. | Poor. | Unknown. | C4 | |||
| Monzonites/Monzonites. | Poor. | Unknown. | C4 | |||
| *Cretaceous Granites/Volcanic Cretaceous Rocks | Poor. | Unknown. | C4 | |||
| Jurassic Granites/Jurassic Granites. | Poor. | Unknown. | C4 | |||
| Pinito Rhyolite/Jurassic Volcanic Rocks. | Poor. | Unknown. | C4 | |||
| *Paleoproterozoic Plutonic Rocks (USA). | Poor. | Unknown. | C4 | |||
| (22) Arroyo Seco Aq. | Qt Alluvium/Qt Alluvium. | Good. | Unknown. | A4 | ||
| Qt Conglomerates/Qt Conglomerates. | Moderate. | T = 86 m2/d | Unknown. | B4 | ||
| Monzonites/Monzonites. | Poor. | Unknown. | C4 | |||
| Bisbee Gr/Cretaceous Rocks Undifferentiated. | Poor. | Unknown. | C4 | |||
| (23) Rio Altar Aq. | Qt Alluvium/Qt Alluvium. | Good. | Good. | 243–640 | A1 | |
| Qt Conglomerates/Qt Conglomerates. | Good. | Good. | 243–640 | A1 | ||
| Pantano | Moderate. | Unknown. | B4 | |||
| (24) Pajarito Mountains. | Baucarit Fm/Nogales Fm.. | Moderate. | Unknown. | B4 | ||
| Granite–Monzonite/Granite–Monzonite. | Moderate–Poor. | Unknown. | | |||
| Monzonites/Monzonites. | Moderate–Poor. | Unknown. | | |||
| *Cabullona Fm (Mex). | Poor. | Unknown. | C4 | |||
| Bisbee Gr/Cretaceous Rocks Undifferentiated. | Poor. | Unknown. | C4 | |||
| *Glance Conglomerate (Mex). | Poor. | Unknown. | C4 | |||
| *Cretaceous Granites/Volcanic Cretaceous Rocks. | Moderate–Poor. | Unknown. | | |||
| Jurassic Granites/Jurassic Granites. | Moderate–Poor. | Unknown. | | |||
| Pinito Rhyolite/Jurassic Volcanic Rocks. | Moderate–Poor. | Unknown. | | |||
| (25) Nogales–Rio Santa Cruz aq./Upper Santa Cruz Basin. | Qt Alluvium/Qt Alluvium. | Good. | K = 1–90 m/d | Good. | 500 | A1 |
| Qt Conglomerates/Qt Conglomerates. | Good. | Good. | 500 | A1 | ||
| Pliocene Conglomerates/Pliocene Conglomerates | Moderate | Good | 500 | A1 | ||
| Neogene Gravels and Conglomerates/Pantano Fm | Moderate. | Unknown. | B4 | |||
| Baucarit Fm/Nogales Fm. | Moderate. | K = 0.1–1 m/d | Good. | 500 | A1 | |
| Volcanic Rocks Undifferentiated/Rhyolitic Tuff. | Poor. | Unknown. | C4 | |||
| Monzonites/Monzonites. | Poor. | Unknown. | C4 | |||
| *Cretaceous Granites/Volcanic Cretaceous Rocks. | Poor. | Unknown. | C4 | |||
| Bisbee Gr/Cretaceous Rocks Undifferentiated. | Poor. | Unknown. | C4 | |||
| Jurassic Granites/Jurassic Granites. | Poor. | Unknown. | C4 | |||
| Pinito Rhyolite/Jurassic Volcanic Rocks. | Moderate. | Unknown. | B4 | |||
| *Permian Sedimentary Rocks (USA). | Poor. | Unknown. | C4 | |||
| *Paleozoic Rocks Undivided (USA). | Poor. | Unknown. | C4 | |||
| *Paleoproterozoic Plutonic Rocks (USA). | Poor. | Unknown. | C4 | |||
| (26) Elenita-Huachuca Basin. | Neogene Gravels and Conglomerates/Pantano Fm | Moderate. | Unknown. | B4 | ||
| Monzonites/Monzonites. | Poor. | Unknown. | C4 | |||
| Volcanic Rocks Undifferentiated/Rhyolitic Tuff. | Poor. | Unknown. | C4 | |||
| Bisbee Gr/Cretaceous Rocks Undifferentiated. | Poor. | Unknown. | C4 | |||
| *Mesa Fm (Mex). | Unknown. | Unknown. | E4 | |||
| *Cabullona Fm (Mex). | Poor. | Unknown. | C4 | |||
| Jurassic Granites/Jurassic Granites. | Poor. | Unknown. | C4 | |||
| Pinito Rhyolite/Jurassic Volcanic Rocks. | Moderate. | Unknown. | B4 | |||
| Escabrosa–Horquilla Fm/Escabrosa–Horquilla Fm. | Poor. | Unknown. | C4 | |||
| *Abrigo Fm/Abrigo Limestone. | Unknown. | Unknown. | E4 | |||
| *Paleoproterozoic Plutonic Rocks (USA). | Poor. | Unknown. | C4 | |||
| (27) Rio San Pedro Aq./Upper San Pedro Basin. | Qt Alluvium/Qt Alluvium. | Good. | K = 12.5–7.5 m/d | Good. | 229–751 | A1 |
| Qt Conglomerates/Qt Conglomerates. | Good. | K = 12.5–7.5 m/d | Good. | 229–751 | A1 | |
| Neogene Gravels and Conglomerates/Pantano Fm. | Moderate. | K = 3.5 m/d | Good. | 229–751 | B1 | |
| Monzonites/Monzonites. | Poor. | K = 0.006 m/d | Unknown. | C4 | ||
| *Cretaceous Granites/Volcanic Cretaceous Rocks. | Poor. | K = 0.018 m/d | Unknown. | C4 | ||
| Bisbee Gr/Cretaceous Rocks Undifferentiated. | Poor. | K = 0.039 m/d | Unknown. | C4 | ||
| *Paleozoic Rocks Undivided (USA). | Poor. | K = 0.039 m/d | Unknown. | C4 | ||
| *Permian Sedimentary Rocks (USA). | Poor. | K = 0.039 m/d | Unknown. | C4 | ||
| *Apache Gr (USA). | Poor. | K = 0.072 m/d | Unknown. | C4 | ||
| Las Mestenas Granite/Mesoproterozoic Granite. | Poor. | K = 0.006 m/d | Unknown. | C4 | ||
| *Pinal Schist/Metasedimentary Rocks. | Poor. | K = 0.006 m/d | Poor. | C3 | ||
| *Paleoproterozoic Plutonic Rocks (USA). | Poor. | Unknown. | C4 | |||
| (28) Mule Mountains. | Neogene Gravels and Conglomerates/Pantano Fm. | Moderate–Poor. | Unknown. | | ||
| Bisbee Gr/Cretaceous Rocks Undifferentiated. | Poor. | Unknown. | C4 | |||
| *Bisbee Conglomerates (Mex) | Unknown. | Unknown. | E4 | |||
| Jurassic Granites/Jurassic Granites. | Poor. | Unknown. | C4 | |||
| *Permian Sedimentary Rocks (USA). | Poor. | Unknown. | C4 | |||
| *Pinal Schist/Metasedimentary Rocks. | Poor. | Poor. | C3 | |||
| (29) Rio Agua Prieta Aq./Douglas Basin. | Qt Alluvium/Qt Alluvium. | Good. | T = 147 m2/d K = 10 m/d | Good. | 344–552 | A1 |
| Neogene Gravels and Conglomerates/Pantano Fm. | Moderate–Poor. | Unknown. | | |||
| Washita Gr/Washita Gr. | Unknown. | Unknown. | E4 | |||
| (30) Perilla Mountains. | Volcanic Rocks Undifferentiated/Rhyolitic Tuff. | Poor. | Unknown. | C4 | ||
| *Cretaceous Granites/Volcanic Cretaceous Rocks. | Poor. | Unknown. | C4 | |||
| Bisbee Gr/Cretaceous Rocks Undifferentiated. | Poor. | Unknown. | C4 | |||
| *Permian Sedimentary Rocks (USA). | Poor. | Unknown. | C4 | |||
| *Abrigo Fm/Abrigo Limestone. | Unknown. | Unknown. | E4 | |||
| (31) Arroyo San Bernardino Aq./San Bernardino Valley. | Qt Alluvium/Qt Alluvium. | Good. | T = 100 m2/d K = 43 m/d | Good. | <1000 | A1 |
| Neogene Conglomerates/Neogene Conglomerates. | Moderate–Good. | Unknown. | A4-B4 | |||
| Qt Basalts/Qt Basalts. | Good. | Unknown. | A4 | |||
| Bisbee Gr/Cretaceous Rocks Undifferentiated. | Moderate–Poor. | Unknown. | | |||
| *Cabullona Fm (Mex). | Moderate–Poor. | Unknown. | | |||
| *Permian Sedimentary Rocks (USA). | Poor. | Unknown. | C4 | |||
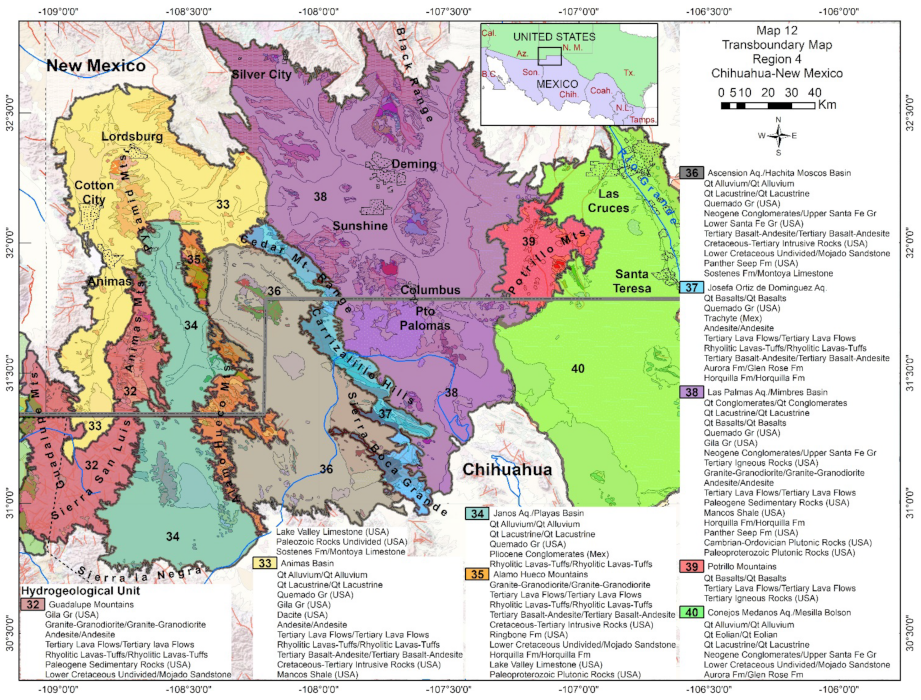
| (32) Guadalupe Mountains. | *Gila Gr (USA). | Good. | Unknown. | A4 | ||
| Tertiary Lava Flows/Tertiary Lava Flows. | Poor. | Unknown. | C4 | |||
| Granite–Granodiorite/Granite–Granodiorite. | Poor. | Unknown. | C4 | |||
| *Andesite/Andesite. | Good. | Unknown. | A4 | |||
| *Paleogene Sedimentary Rocks (USA). | Unknown. | Unknown. | E4 | |||
| Rhyolitic Lavas–Tuffs/Rhyolitic Lavas–Tuffs. | Poor. | Unknown. | C4 | |||
| Bisbee Gr/Cretaceous Rocks Undifferentiated. | Moderate–Poor. | Unknown. | | |||
| *Paleozoic Rocks Undivided (USA). | Poor. | Unknown. | C4 | |||
| *Lake Valley Limestione (USA). | Unknown. | Unknown. | E4 | |||
| *Sostenes Fm/Montoya Limestone. | Unknown. | Unknown. | E4 | |||
| (33) Animas Basin. | Qt Alluvium/Qt Alluvium. | Good. | T = 273–3055 m2/d | Unknown. | A4 | |
| Qt Lacustrine/Qt Lacustrine. | Poor. | Unknown. | C4 | |||
| *Quemado Gr (USA). | Unknown. | Unknown. | E4 | |||
| *Gila Gr (USA). | Good. | Unknown. | A4 | |||
| *Dacite (USA). | Unknown. | Unknown. | E4 | |||
| *Andesite/Andesite. | Poor. | Unknown. | C4 | |||
| Tertiary Lava Flows/Tertiary Lava Flows. | Poor. | Unknown. | C4 | |||
| Rhyolitic Lavas–Tuffs/Rhyolitic Lavas–Tuffs. | Poor. | Unknown. | C4 | |||
| Tertiary Basalt–Andesite/Tertiary Basalt–Andesite. | Poor. | Unknown. | C4 | |||
| *Cretaceous–Tertiary Intrusive Rocks (USA). | Unknown. | Unknown. | E4 | |||
| *Mancos Shale (USA). | Unknown. | Unknown. | E4 | |||
| (34) Janos Aq./Playas Basin. | Qt Alluvium/Qt Alluvium. | Good. | T = 345 m2/d | Good. | 250–500 | A1 |
| Qt Lacustrine/Qt Lacustrine. | Poor. | Unknown. | C4 | |||
| *Quemado Gr (USA). | Unknown. | Unknown. | E4 | |||
| Pliocene Conglomerates (Mex) | Unknown. | Unknown. | E4 | |||
| Rhyolitic Lavas–Tuffs/Rhyolitic Lavas–Tuffs. | Poor. | Unknown. | C4 | |||
| (35) Alamo Hueco Mountains. | Granite–Granodiorite/Granite–Granodiorite. | Poor. | Unknown. | C4 | ||
| Tertiary Lava Flows/Tertiary Lava Flows. | Poor. | Unknown. | C4 | |||
| Rhyolitic Lavas–Tuffs/Rhyolitic Lavas–Tuffs. | Poor. | Unknown. | C4 | |||
| Tertiary Basalt–Andesite/Tertiary Basalt–Andesite. | Poor. | Unknown. | C4 | |||
| *Cretaceous–Tertiary Intrusive Rocks (USA). | Unknown. | Unknown. | E4 | |||
| *Ringbone Fm (USA). | Unknown. | Unknown. | E4 | |||
| Lower Cretaceous Undivided/Mojado Sandstone. | Moderate–Poor. | Unknown. | | |||
| Horquilla Fm/Horquilla Fm | Poor. | Unknown. | C4 | |||
| *Lake Valley Limestione (USA). | Unknown. | Unknown. | E4 | |||
| *Paleoproterozoic Plutonic Rocks (USA). | Poor. | Unknown. | C4 | |||
| (36) Ascension Aq./Hachita Moscos Basin. | Qt Alluvium/Qt Alluvium. | Good. | T = 346 m2/d K = 0.17 m/d | Good. | 500 | A1 |
| Qt Lacustrine/Qt Lacustrine. | Moderate. | Unknown. | B4 | |||
| *Quemado Gr (USA). | Unknown. | Unknown. | E4 | |||
| Neogene Conglomerates/Upper Santa Fe Gr | Good. | Good. | 250–1000 | A1 | ||
| Lower Santa Fe Gr. | Moderate. | Unknown. | B4 | |||
| Tertiary Basalt–Andesite/Tertiary Basalt–Andesite. | Moderate. | Unknown. | B4 | |||
| *Cretaceous–Tertiary Intrusive Rocks (USA). | Unknown. | Unknown. | E4 | |||
| Lower Cretaceous Undivided/Mojado Sandstone. | Moderate–Poor. | Unknown. | | |||
| *Panther Seep Fm (USA). | Unknown. | Unknown. | E4 | |||
| *Sostenes Fm/Montoya Limestone. | Unknown. | Unknown. | E4 | |||
| (37) Josefa Ortiz de Dominguez Aq. | Qt Basalts/Qt Basalts. | Poor. | Unknown. | C4 | ||
| *Quemado Gr (USA). | Unknown. | Unknown. | E4 | |||
| *Trachyte (Mex). | Poor. | Unknown. | C4 | |||
| *Andesite/Andesite. | Poor. | Unknown. | C4 | |||
| Tertiary Lava Flows/Tertiary Lava Flows. | Poor. | Unknown. | C4 | |||
| Rhyolitic Lavas–Tuffs/Rhyolitic Lavas–Tuffs | Poor. | Unknown. | C4 | |||
| Tertiary Basalt–Andesite/Tertiary Basalt–Andesite. | Poor. | Unknown. | C4 | |||
| Aurora Fm/Glen Rose Fm. | Moderate–Poor. | Unknown. | | |||
| Horquilla Fm/Horquilla Fm. | Poor. | Unknown. | C4 | |||
| (38) Las Palmas Aq./Mimbres Basin. | Qt Conglomerates/Qt Conglomerates. | Good. | T = 35–330 m2/d K = 0.7 m/d | Fresh. | 340 | A1 |
| Qt Lacustrine/Qt Lacustrine. | Poor. | K = 0.4 m/d | Fresh. | 340 | C1 | |
| Qt Basalts/Qt Basalts. | Good. | K = 0.24–0.36 m/d | Fresh. | 340 | A1 | |
| *Quemado Gr (USA). | Unknown. | Unknown. | E4 | |||
| Neogene Conglomerates/Upper Santa Fe Gr | Moderate. | Fresh to slightly saline. | 120–1400 | B1-B2 | ||
| *Gila Gr (USA). | Good. | Fresh. | 200–380 | A1 | ||
| *Tertiary Igneous Rocks (USA). | Good. | Unknown. | A4 | |||
| Granite–Granodiorite/Granite–Granodiorite. | Good. | Unknown. | A4 | |||
| *Andesite/Andesite. | Good. | n = 18%–25% | Unknown. | A4 | ||
| Tertiary Lava Flows/Tertiary Lava Flows. | Good. | Fresh. | 260–560 | A1 | ||
| *Paleogene Sedimentary Rocks (USA). | Unknown. | Unknown. | E4 | |||
| *Mancos Shale (USA). | Unknown. | Unknown. | E4 | |||
| Horquilla Fm/Horquilla Fm. | Poor. | Slightly saline. | C2 | |||
| *Panther Seep Fm (USA). | Unknown. | Unknown. | E4 | |||
| *Cambrian–Ordovician Plutonic Rocks (USA). | Good. | Unknown. | A4 | |||
| *Paleoproterozoic Plutonic Rocks (USA). | Good. | Fresh. | 500 | A1 | ||
| (39) Potrillo Mountains. | Qt Basalts/Qt Basalts. | Good. | n = 18%–25% | Unknown. | A4 | |
| Tertiary Lava Flows/Tertiary Lava Flows. | Good. | n = 18%–25% | Unknown. | A4 | ||
| *Tertiary Igneous Rocks (USA). | Good. | n = 18%–25% | Unknown. | A4 |
Publisher’s Note: MDPI stays neutral with regard to jurisdictional claims in published maps and institutional affiliations. |
© 2021 by the authors. Licensee MDPI, Basel, Switzerland. This article is an open access article distributed under the terms and conditions of the Creative Commons Attribution (CC BY) license (https://creativecommons.org/licenses/by/4.0/).
Share and Cite
Sanchez, R.; Rodriguez, L. Transboundary Aquifers between Baja California, Sonora and Chihuahua, Mexico, and California, Arizona and New Mexico, United States: Identification and Categorization. Water 2021, 13, 2878. https://doi.org/10.3390/w13202878
Sanchez R, Rodriguez L. Transboundary Aquifers between Baja California, Sonora and Chihuahua, Mexico, and California, Arizona and New Mexico, United States: Identification and Categorization. Water. 2021; 13(20):2878. https://doi.org/10.3390/w13202878
Chicago/Turabian StyleSanchez, Rosario, and Laura Rodriguez. 2021. "Transboundary Aquifers between Baja California, Sonora and Chihuahua, Mexico, and California, Arizona and New Mexico, United States: Identification and Categorization" Water 13, no. 20: 2878. https://doi.org/10.3390/w13202878