
Evaluating the Cost of Failure Risk: A Case Study of the Kang-Wei-Kou Stream Diversion Project


1
Department of Civil Engineering, National Taiwan University, Taipei 10617, Taiwan
2
Department of Hydrology and Atmospheric Sciences, University of Arizona, Tucson, AZ 85721, USA
3
High School, Kaohsiung American School, Kaohsiung 813, Taiwan
*
Author to whom correspondence should be addressed.
†
These authors share the responsibility for the first authorship in the respective fields.
Water 2021, 13(20), 2881; https://doi.org/10.3390/w13202881
Submission received: 11 August 2021
/
Revised: 9 October 2021
/
Accepted: 11 October 2021
/
Published: 14 October 2021
(This article belongs to the Section Hydrology)
Abstract
:For water resource engineering projects, some potential risks that are unclear and difficult to investigate are the most crucial problem for engineers. This study presents a unique case of unknown risks, the Kang-Wei-Kou (KWK) Diversion project, which collapsed due to an unexpected hydraulic jump resulting from uneven regional rainfall. We used HEC-RAS incorporating Monte Carlo simulations for analyzing the potential risks to the original design of the KWK Diversion, concerning boundary conditions. An extreme value type I distribution was selected as the form of probability density function (PDF) to upstream discharge, whereas a normal distribution was selected as the form of PDF to downstream water depth, as boundary conditions. Applying the Monte Carlo method, the analysis revealed that the probability of failure was 7.5%, which was non-negligible and should have been considered in the design plan. This case study indicates that overlooking downstream conditions can lead a major facility to fail, and a stochastic analysis could be a way to find out potential risks. We also applied the cost–benefit analysis to review whether the design plans were appropriately estimated with careful risk based consideration.
1. Introduction
In water resource engineering projects, uncertainties are unavoidable [1,2]. The fact that uncertainty in the design of hydraulic structures can lead to system failure has led to the development of numerous risk based approaches to the management of water resources [3,4]. Most uncertainties in water resource engineering projects can be attributed to human ignorance and the complexity and randomness inherent in natural systems [5,6]. Mays and Tung [7] categorized uncertainties as hydrologic, hydraulic, structural, and economic. Hydrologic conditions, especially flood characteristics [8], are the main culprits in the failure of hydraulic facilities [9,10]. Risk based planning and the management of water resource systems require knowledge of the variability in hydroclimatic processes [11,12].
The estimation of streamflow variability is generally based on frequency analysis, and the risk associated with random hydrologic events is considered in terms of its return period [13], despite the simplicity of the underlying assumptions [14]. Hydrologists have developed many methods for the analysis of flood frequency; however, these methods often depend on the availability of observation data and specific hydrometeorological characteristics [15]. The field of stochastic hydrology has traditionally been concerned with the problem of the natural uncertainty of quantity [16,17]. Many of the important developments in applied statistics, such as extreme value theory and stochastic simulation, were originally developed by researchers in stochastic hydrology [18]. A host of stochastic models have been developed to model natural time series, which has made it possible to use synthetic streamflow models to reproduce hydrologic behaviors with a sufficient degree of variability to meet the needs of water resource engineers [19].
Recent flooding events have prompted a reformulation of flood risk management practices; however, integrated risk based approaches to flood management are already well established [3,20,21,22], and probabilistic risk analysis has been used for some years in the narrower context of flood defense engineering [23,24,25].
The literature includes numerous approaches to the design of hydraulic facilities [23,26,27,28,29]. Tung and Mays [30,31] proposed a risk based approach to flood levee design in which hydrologic as well as hydraulic uncertainties are considered. Note that they defined risk as the probability of a natural flood exceeding the capacity of the levee. Lee and Mays [32,33] extended their risk evaluation procedure to analyze the risk resulting from the hydraulic uncertainty of Manning’s equation. Anselmo et al. [34] proposed a risk assessment framework in which hydrological and hydraulic modeling are integrated, to estimate the effects of flood events in flood prone areas. Salas et al. [14] proposed a risk assessment procedure using a variety of statistical methods to quantify the probability of hydraulic structure failure due to hydrological uncertainties. Apel et al. [35] proposed a simple probabilistic method to assess the probability of dike failure. Risk analysis is also useful in quantifying the risks associated with dams, and estimating the impact of dam failure [9,36,37,38,39]. Bellos et al. [40] examined the uncertainties of a dam breach, and found that the uncertainty of the flow peaks is greater than the uncertainty of the maximum water depths, and detected a decreasing trend of uncertainty along the river to downstream. Risk based analysis is employed in a wide range of applications associated with hydraulic engineering [10,27,30,31]. The concepts and methodologies of risk based design provide a logical and systematic approach to the analysis of design related uncertainties. Risk based design can also be implemented within an optimization framework, to estimate the minimum annual expected cost [40].
Studies in risk analysis and decision making have underlined the importance of accounting for uncertainty in formulating reliable decisions [41]. Risk analysis provides a framework to facilitate the analysis of potential risks [25,42,43]; however, the insufficiency of quantitative uncertainty often yields different answers, which can lead to erroneous decisions [43,44]. Risk and uncertainty are commonly analyzed using mathematical and statistical methods, the point estimate method, direct integration, Latin hypercube sampling, and Monte Carlo simulation [6]. Event uncertainty can be quantified using the coefficient of variation and probability distributions, but it is difficult to obtain all the necessary information and many variables cannot be estimated due to data availability, repeatability or computational complexity [45,46,47]. Furthermore, it is very easy to disregard essential criteria [6].
Potential risks sometimes are unclear and difficult to investigate. Failure mode and effects analysis (FMEA) was developed in the late 1950s and became a standard military protocol in the 1980s [48]. Failure mode refers to the manner in which a system or system component fails to meet design requirements [49]. Failure mode analysis depends, primarily, on defining a system failure [50]. Several studies have summarized potential failure modes associated with flood control measures, such as levees, diversions and pump stations [51,52,53]. Safety margin and safety factor are two reliability measures frequently used in engineering. Yen [54] summarized several types of safety factor and discussed their applications. Probabilistic and stochastic methods are well suited to evaluating the reliability of hydraulic engineering systems. The most direct approach involves the statistical analysis of records related to previous failures in similar systems. Another (less direct) approach involves reliability analysis, which considers the contribution of every factor that could potentially have contributed to the failure.
This study presents a very special case, the Kang-Wei-Kou Diversion (KWK Diversion) engineering project in Tainan, Taiwan, which was built to protect the downstream area from flooding. Since the KWK Diversion was finished on 27 July 2014, it has been used to divert flood water from the Kang-Wei-Kou stream (KWK Stream) into the Er-Jen river. On 10 August 2014, the KWK Diversion collapsed due to unexpected failure resulting from uneven regional rainfall, which caused flooding upstream of the diversion, with a relatively low water stage at its downstream end. The unexpected low water stage led to the formation of a hydraulic jump within the KWK Diversion channel, which damaged the channel bed in a section close to the outlet, resulting in severe scouring and in the eventual collapse of the bank walls. This study reports an ex post analysis of the risk associated to this unpredicted failure mechanism, with a particular focus on the relationship between the upstream and downstream water stages. Our approach combines one dimensional, deterministic hydraulic modeling with hydrological uncertainty by performing a Monte Carlo simulation for analyzing the potential risks. Cost–benefit analysis was also applied to re-examine the reasonability of the original design within the context of risk.
2. Materials and Methods
Most regulations pertaining to hydraulic engineering focus on the prevention of failures resulting from high flow conditions in upstream areas. However, undue emphasis on upstream conditions often leads to downstream conditions being overlooked. Without due attention to downstream conditions, many facilities are susceptible to failure. The failure of the KWK Diversion is a good example of unexpected downstream conditions causing a major facility to fail. In this study, stochastic analysis was used to elucidate the risks to the KWK Diversion, which the designers and managers had failed to notice. It should be noted that erosion processes are inherently uncertain and a number of studies have attempted to quantify these uncertainties [55,56]. However, due to their complexity, these go beyond the scope of this paper.
2.1. Study Area
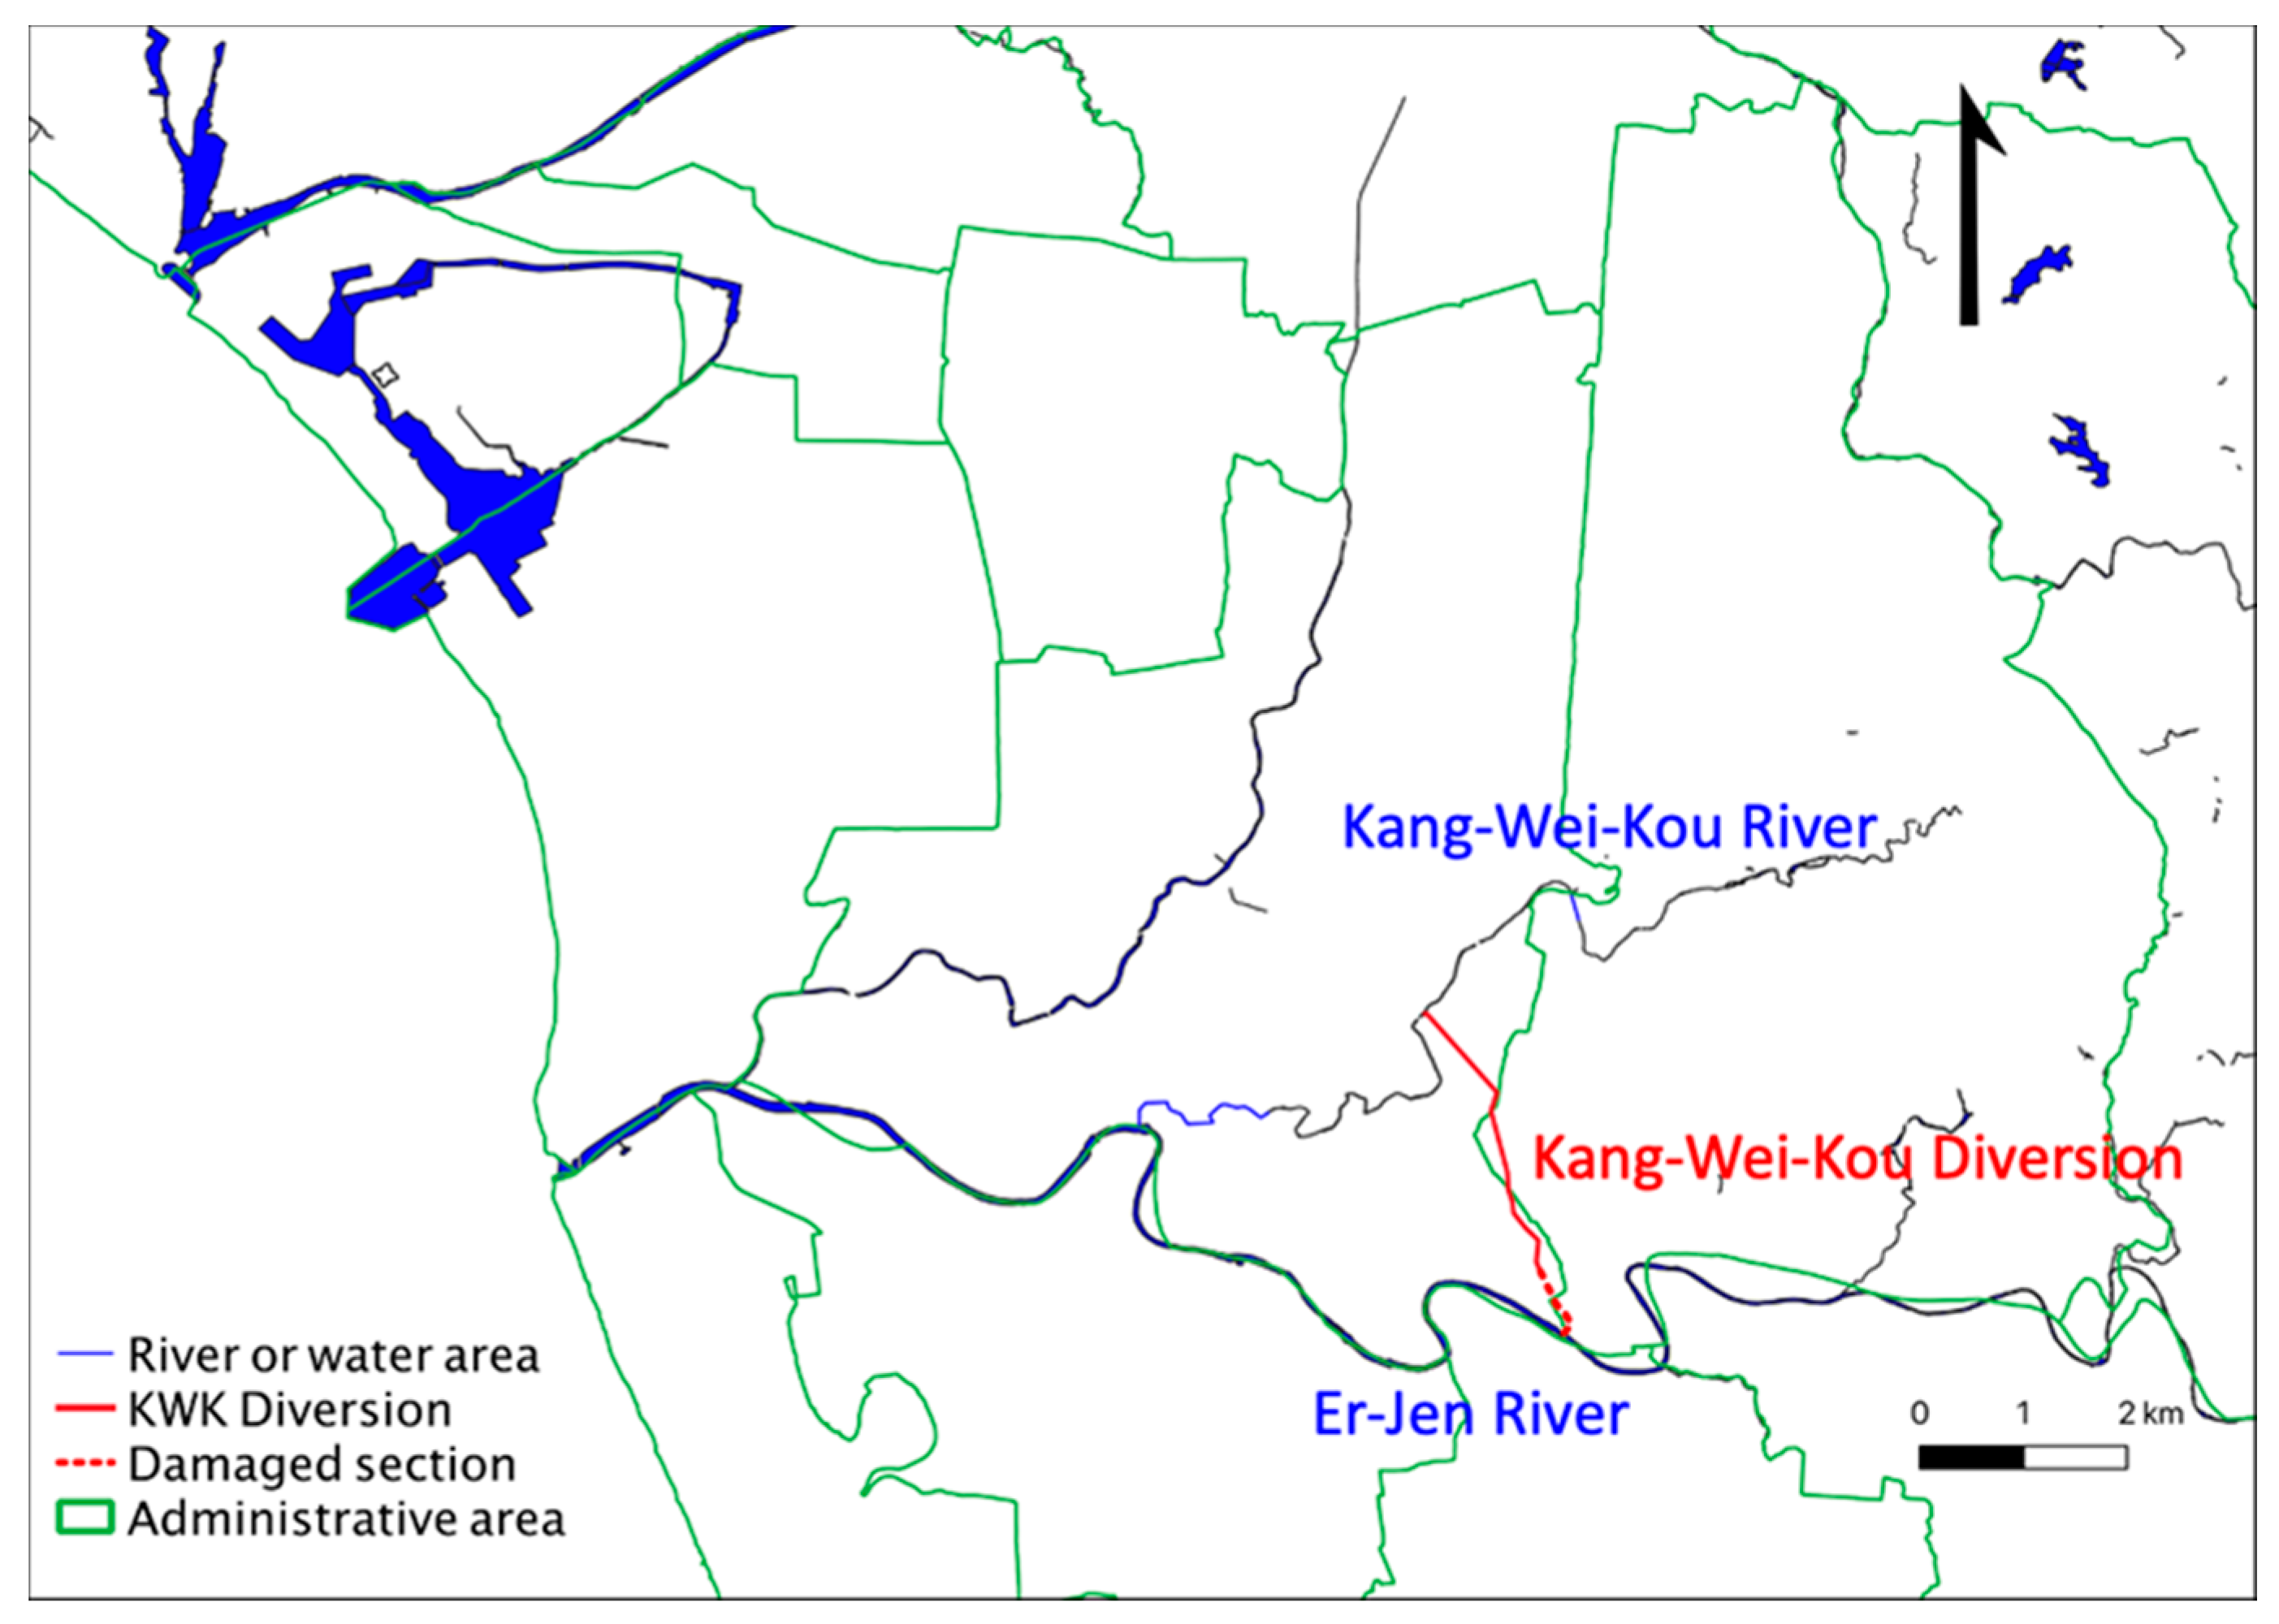
The KWK Diversion is a flood control engineering project located between the KWK stream and Er-Jen river along the Zhongshan Freeway bridge in Tainan City, Taiwan (red line in Figure 1). The length of the main drainage system is approximately 16,840 m, running through a catchment area covering 36,730,000 m2. According to government sources, the downstream flood area includes residential and industrial areas in the vicinity of the freeway bridge, and average flood damage causes New Taiwan Dollars (TWD) 516 million loss per year (Water Resources Agency, Taichung, Taiwan, 2009). In an effort to mitigate damage from flooding, the government constructed a new floodway to guide the flow from the upstream catchment into the river, to release flood pressure in the downstream area.
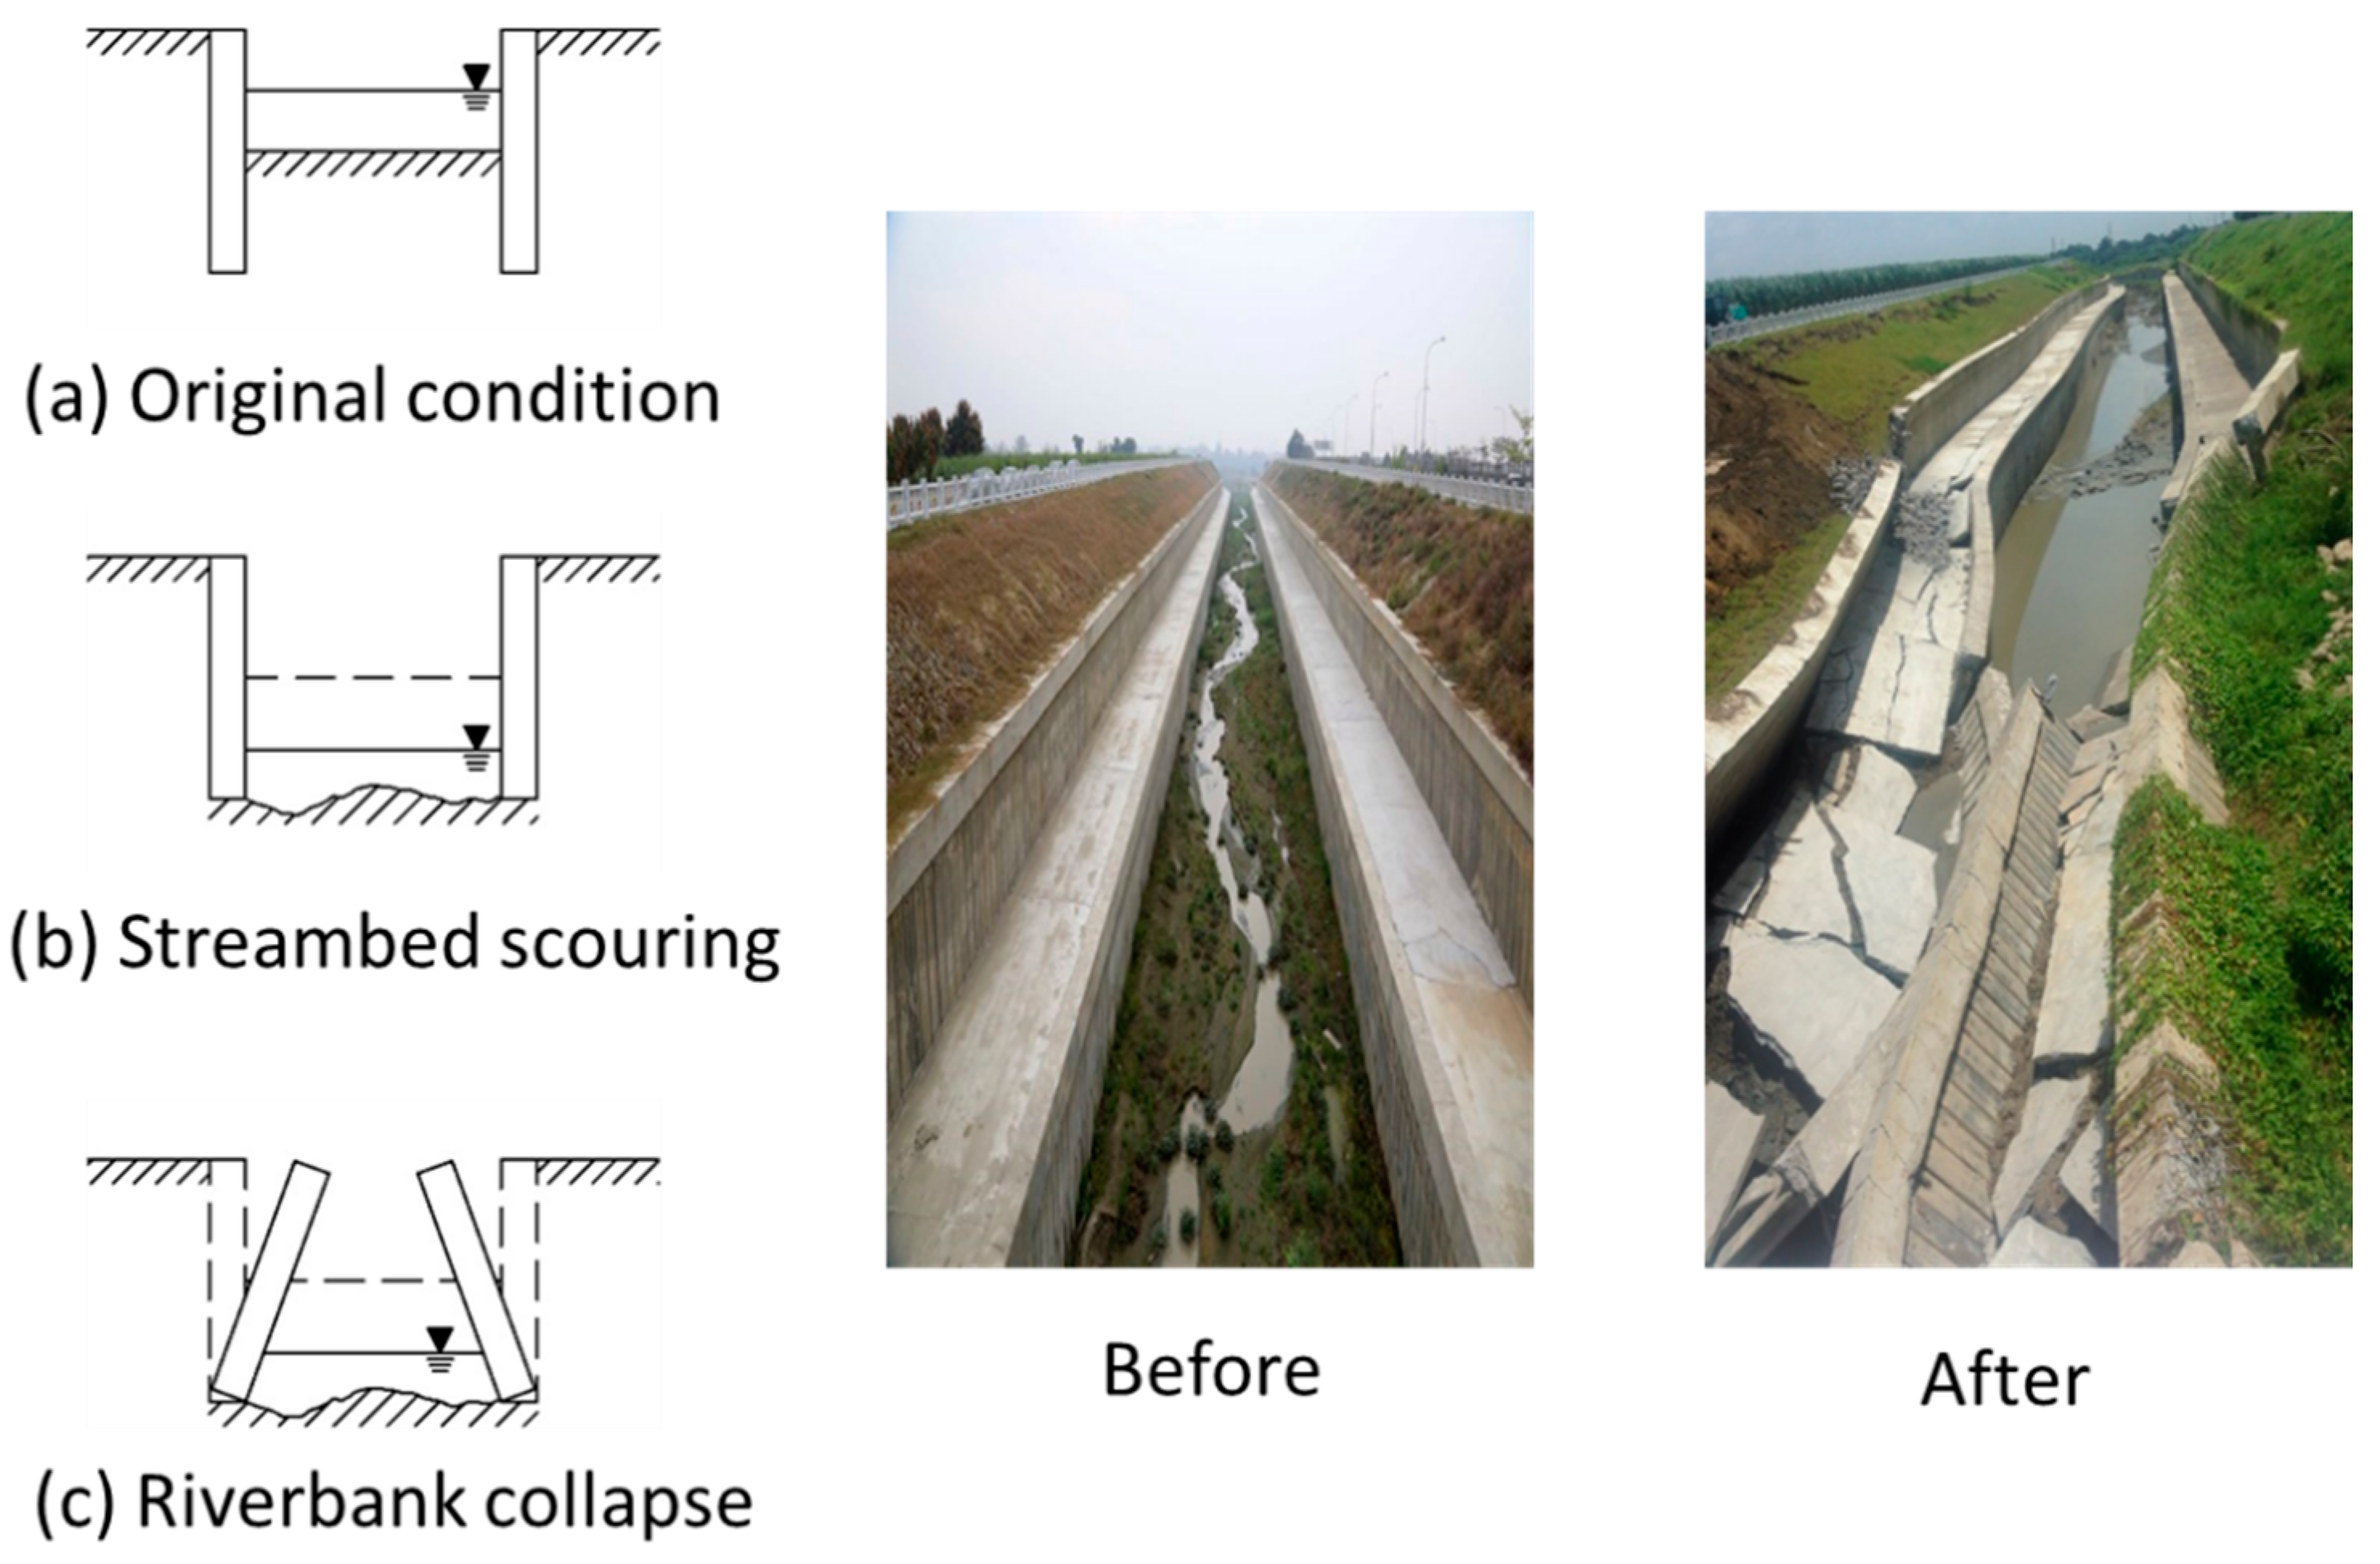
The KWK Diversion diverts additional runoff from the KWK stream into the Er-Jen river before it enters the downtown reach of the KWK stream. The drainage stream project was finished in early August 2014; however, by 10 August, the left bank revetment had collapsed close to its outlet in the Er-Jen river (see Figure 2). The fact that the flowrate did not exceed the designed safety criteria meant that this structural failure would not have been anticipated. During the initial design phase, engineers considered putting in a channel that was completely lined with concrete; however, that plan was down rated due to ecological and budgetary concerns. Thus, the diversion channel was eventually constructed with retaining walls to support the river bank, but preserving the original river bed. In hindsight, it would not be fair to make any claims pertaining to the wisdom of this decision. Nevertheless, it is worth re-examining those decisions within the context of risk based on estimated potential loss.
2.2. HEC-RAS Simulation
The modelling analysis makes use of HEC-RAS (Hydrologic Engineering Center’s River Analysis System) version 5.0.3. An HEC-RAS model is a common hydrodynamic simulation software package used for the modeling of hydraulic flow. Geometric data representation and hydraulic computation routines are used to replicate networks of river channels (natural and artificial). HEC-RAS is able to generate simulations of 1D steady flow and 2D unsteady flow for river flow analysis, as well as sediment transport and water temperature/quality. Our objective, in this study, was to elucidate the interdependencies between hydrodynamical conditions, hydrological factors, and facilities of the KWK Diversion; therefore, we focused on 1D open channel flow in HEC-RAS simulation model. This model computes water surface profiles by solving shallow water equations and deals with the occurrence of hydraulic jumps using Manning’s equation and the momentum equation [57].
An HEC-RAS model of KWK Diversion was developed and certified for planning purposes by the Water Resources Agency (WRA), Taiwan. The WRA, Taiwan [58] compared six scenarios involving detention pond volume and the capacity of the diversion. The final plan was based on a scenario that addressed the maximum capacity of the diversion. The resulting 1D open channel model of the diversion covered a length of 3634 m comprising 102 sections. The Manning’s n value for the two culverts was 0.016, and 0.025 in the remainder of the channel. The difference in elevation between the upstream and downstream river beds was measured at roughly 2 m, which is equivalent to an average slope of 0.55%.
The diversion was intended to deliver flood discharge at 181 m3/s under events with a 25-year return period. At the point where the KWK Diversion connects to the Er-Jen river, the water stages corresponded to the following event return periods: 10 years (9.46 m), 25 years (9.73 m), and 100 years (10.41 m). The boundary conditions used for the original design plan included the upstream flowrate and downstream water depth (the larger value of the normal depth and the 25-year return period water stage of the Er-Jen river) [58]. Note that the boundary conditions, which are crucial to the risk of failure, were varied throughout the stochastic simulations rather than assigning a fixed number, as in previous planning reports. HEC-RAS simulations were used to derive hydrodynamic features, including water level, velocity, and energy gradient in various section of the KWK Diversion.
2.3. Hydrologic Conditions
Hydrologic conditions were the inputs required for HEC-RAS simulation. In our stochastic analysis of the KWK Diversion, the upstream boundary condition was flowrate, whereas the downstream boundary condition was water depth. Historical data obtained from related planning reports were subjected to frequency analysis to derive probability distributions pertaining to water depth and flowrate. The Monte Carlo method was then used to assess the operation of the diversion channel and, in particular, the possible formation of a hydraulic jump.
The hydrologic conditions were based on a planning report [58] and an investigation into the current status of the Er-Jen river system. Table 1 lists the results of frequency analysis on the hydrologic conditions related to the KWK Diversion corresponding to seven return periods (2, 5, 10, 20, 25, 50, and 100 years). Discharge values were used to indicate the flowrates from the KWK stream (used as the upstream boundary conditions), whereas the surface elevation values were used to indicate the water level of Er-Jen river (used as the downstream boundary condition). Note that the upstream and downstream boundary conditions were mutually independent, to facilitate the detection of anomalies (e.g., hydraulic jumps and channel scours) that might otherwise be overlooked.
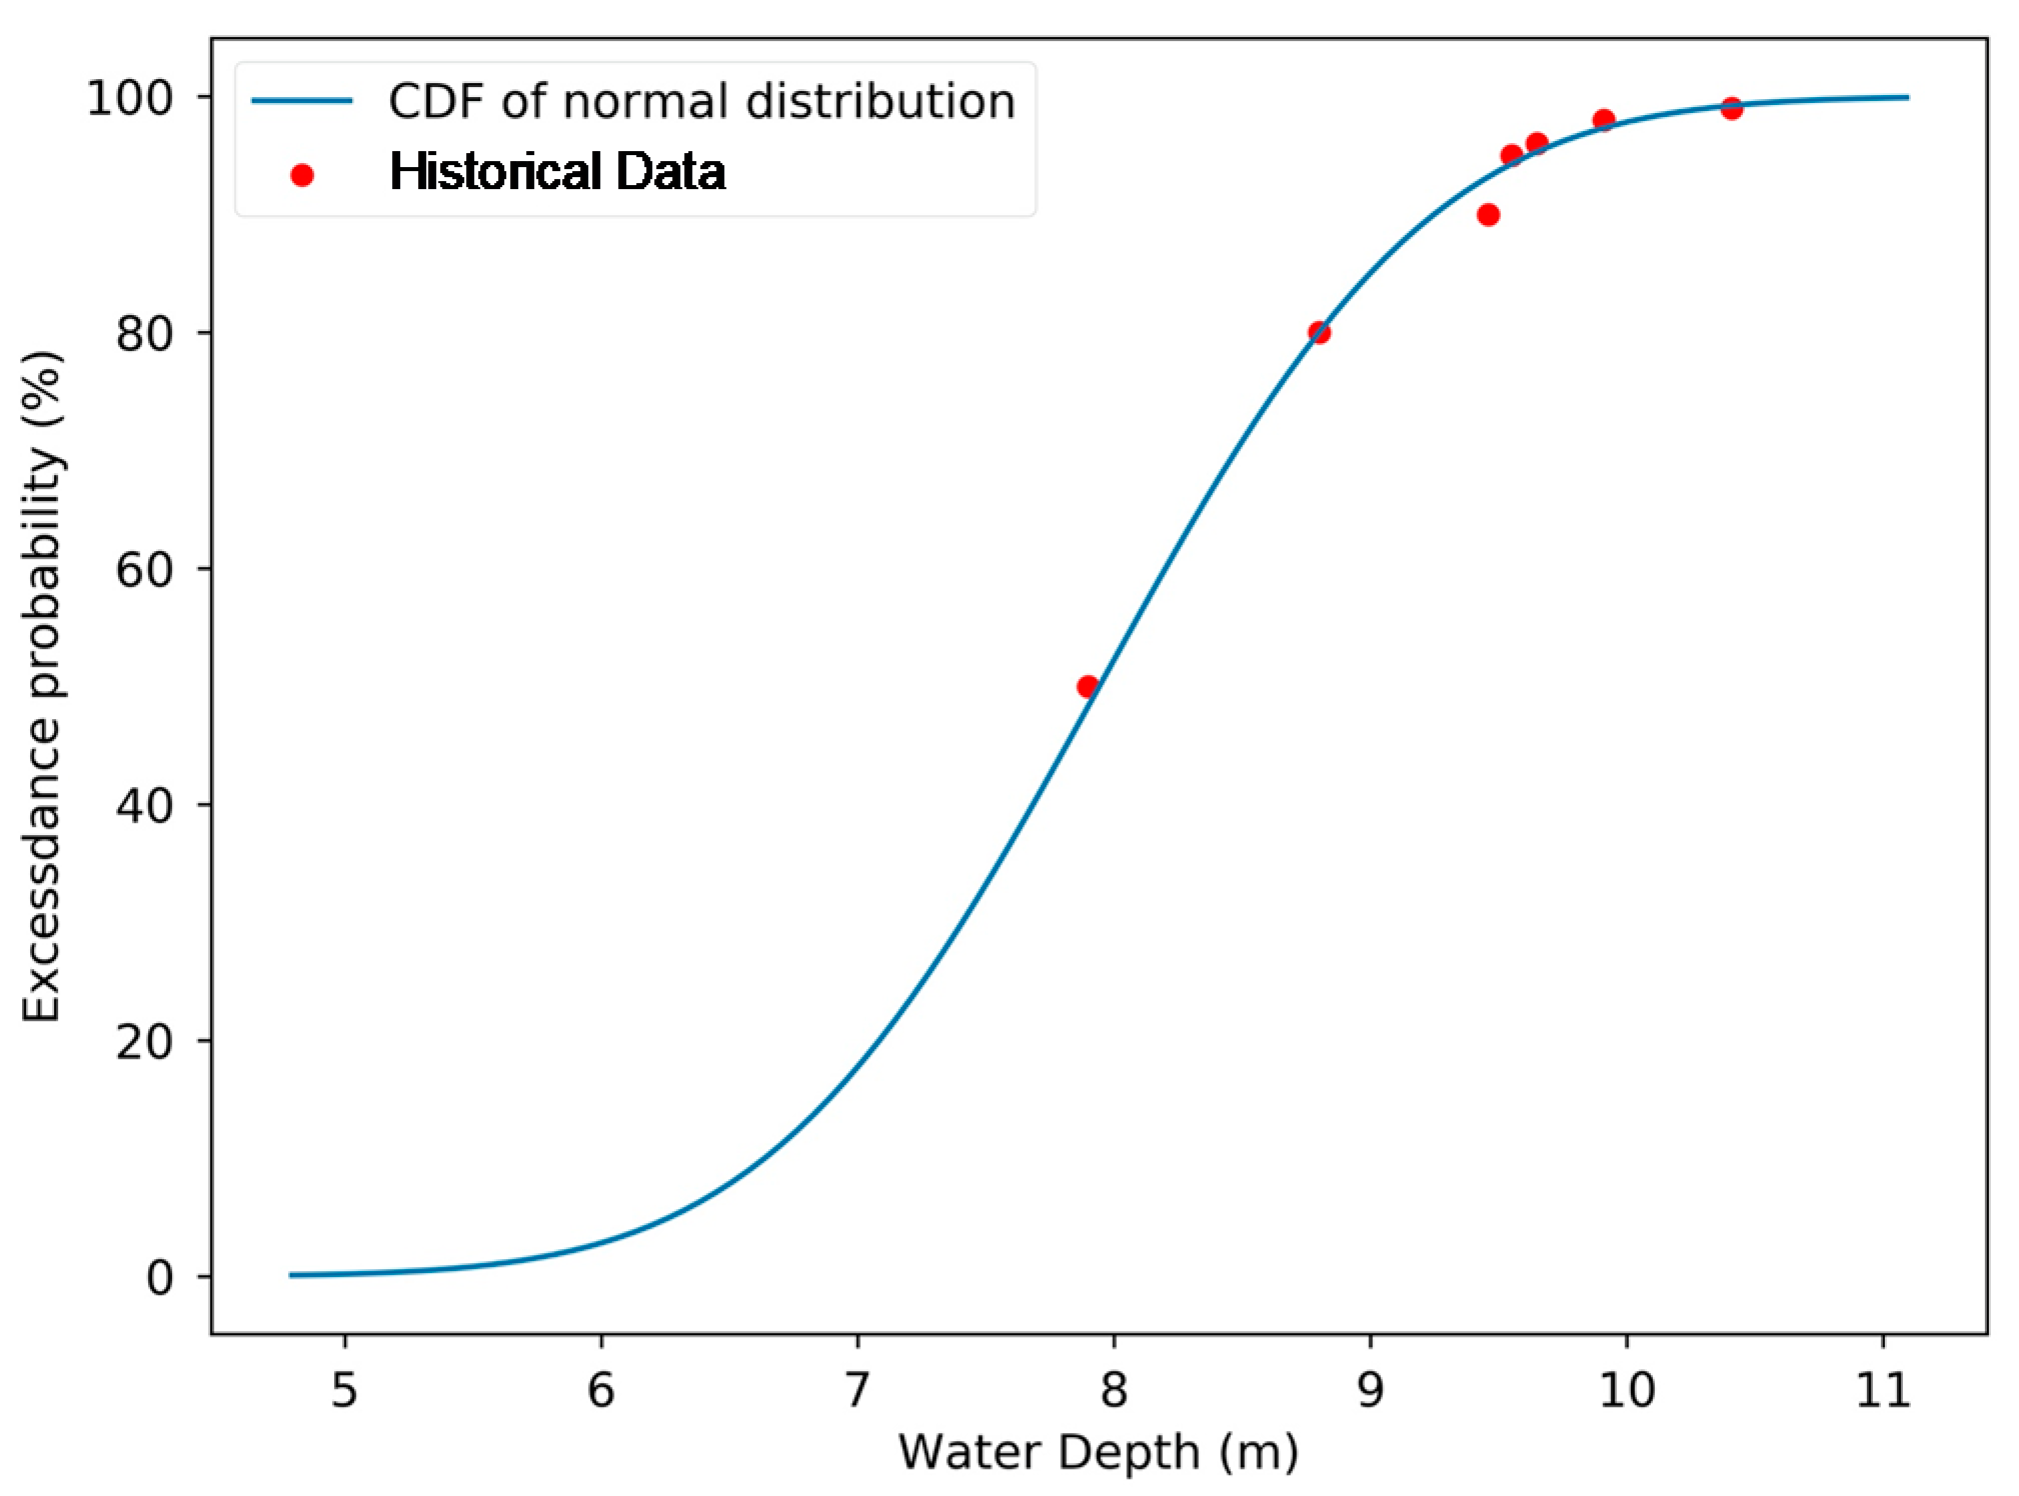
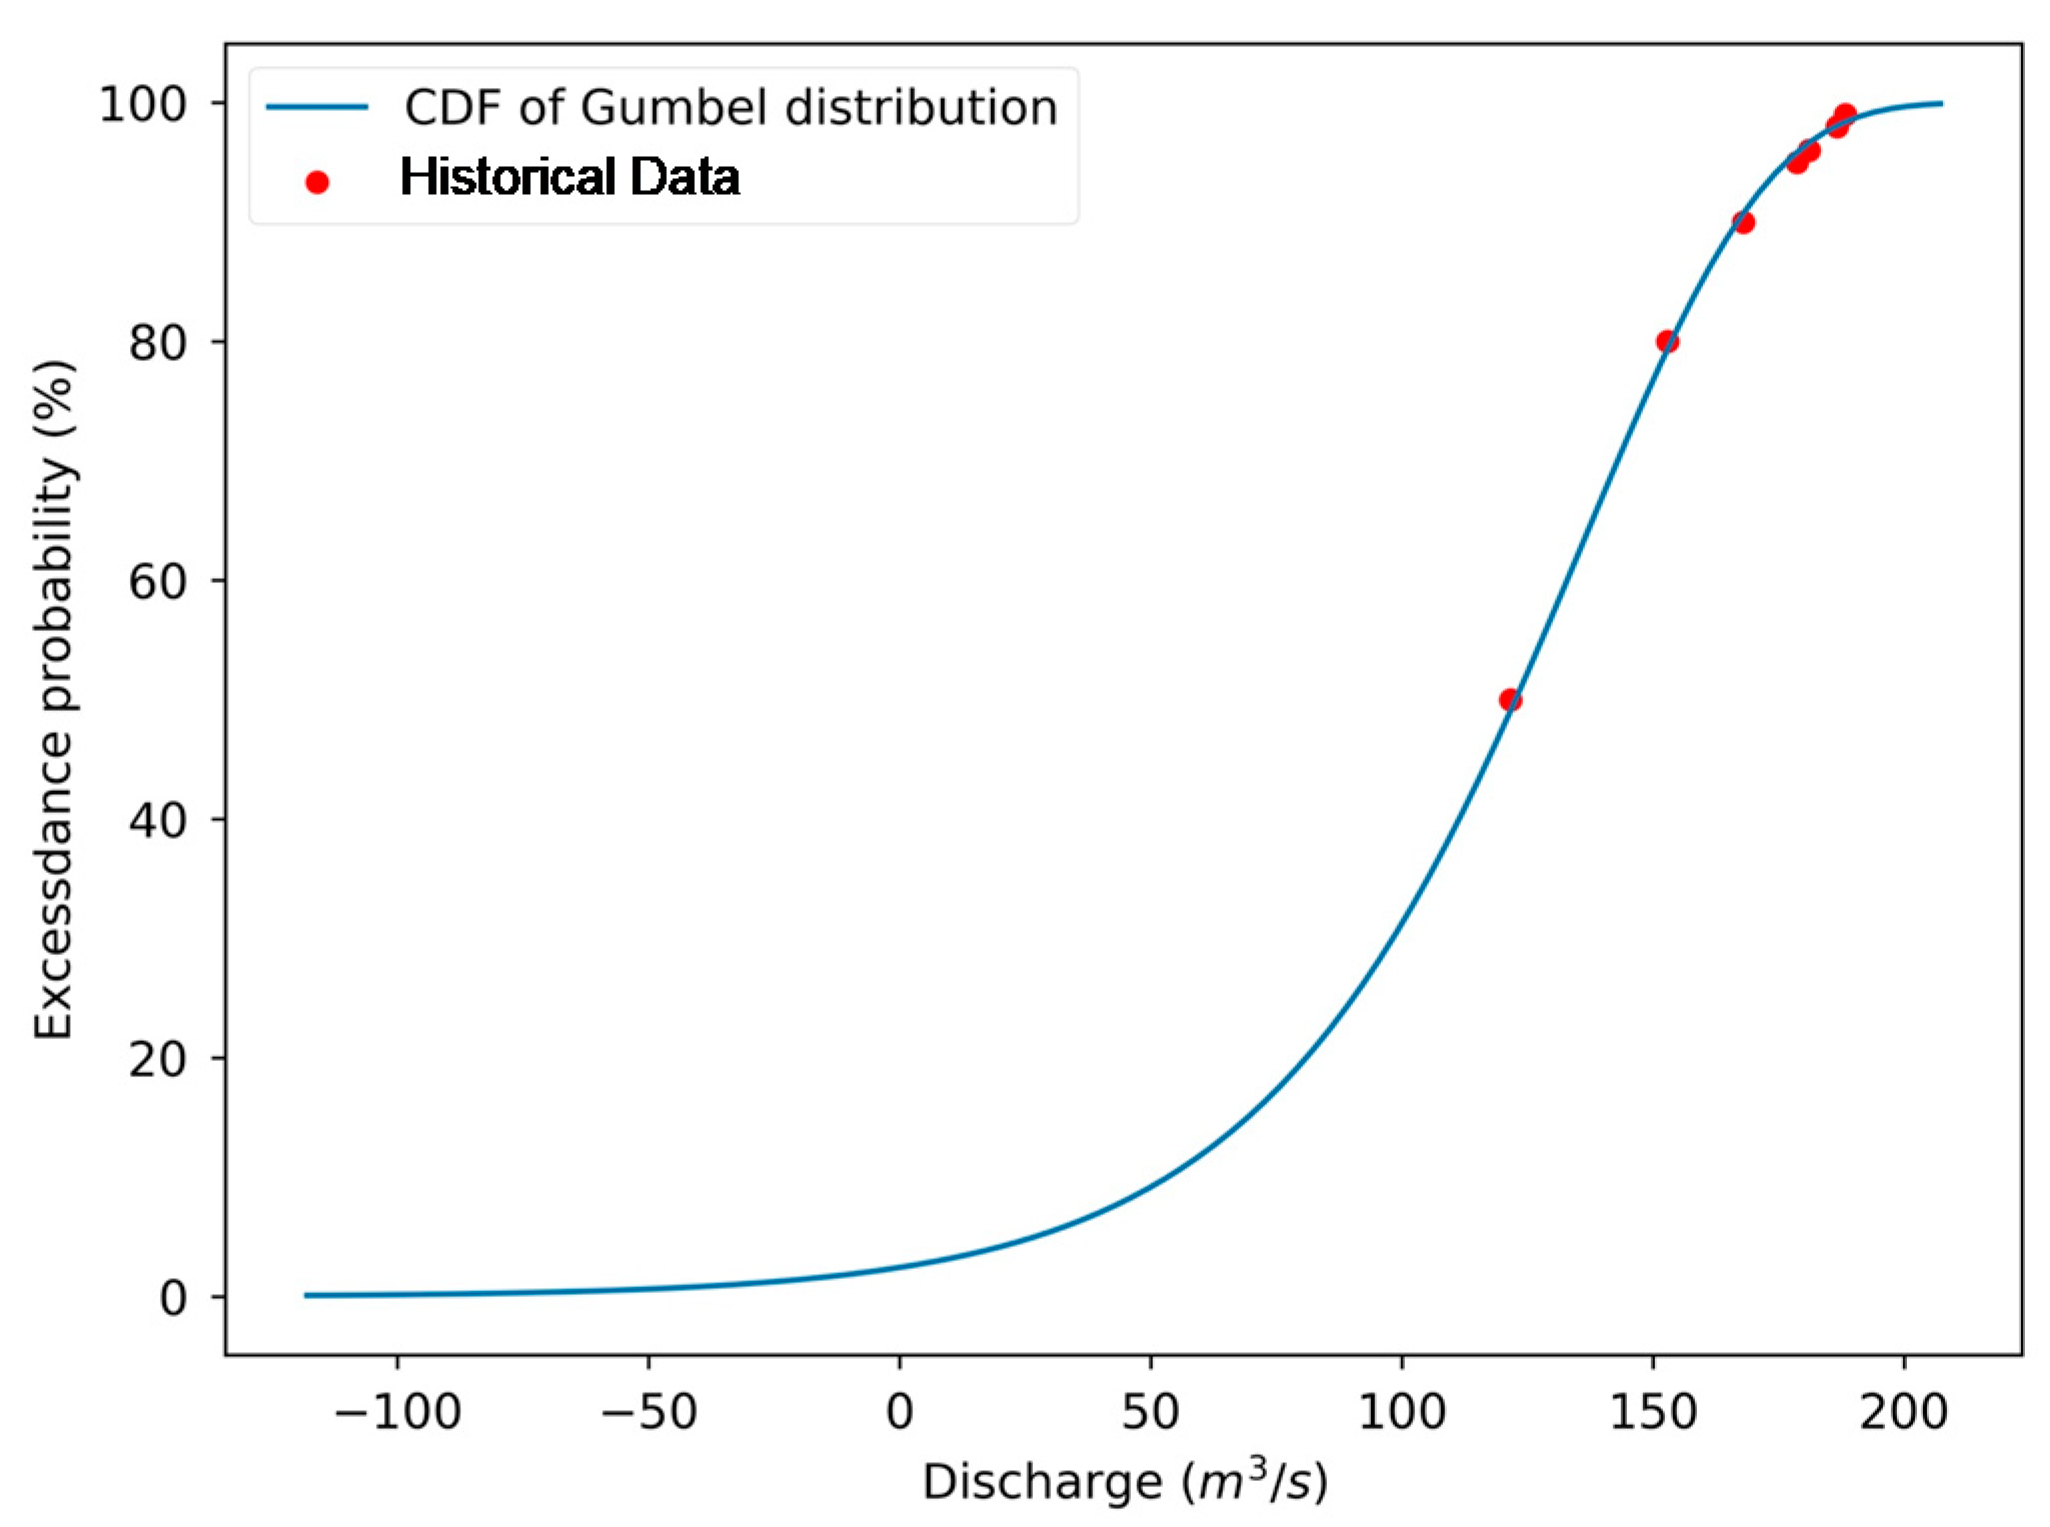
We derived probability distribution functions (PDF) capable of describing the historical data for stochastic analysis. The study applied the maximum likelihood method for the probability fitting, and measured the goodness of fit by AIC (Akaike information criterion) to select among different distributions. The hydrological data is from 1986 to 2014 and annual maximum series were used for analysis. An extreme value type I distribution was selected as the form of PDF to flow discharge (upstream), whereas a normal distribution was selected as the form of PDF to water depth (downstream). Figure 3 and Figure 4 present the fitting results of the cumulative distribution function (CDF) to upstream and downstream conditions. Using the PDF, we applied the Monte Carlo method to generate 1000 sets of scenarios, combining upstream and downstream boundary conditions simultaneously. Note, however, that the two PDFs were treated as independent rather that paired, due to a lack of temporal information in the original dataset that made it impossible to identify instances of correlation. Thus, we had no choice but to treat the upstream inflow and downstream water levels as independent. The simulations provided a sufficient number of results to evaluate the degree of risk under a variety of upstream and downstream conditions.
3. Results
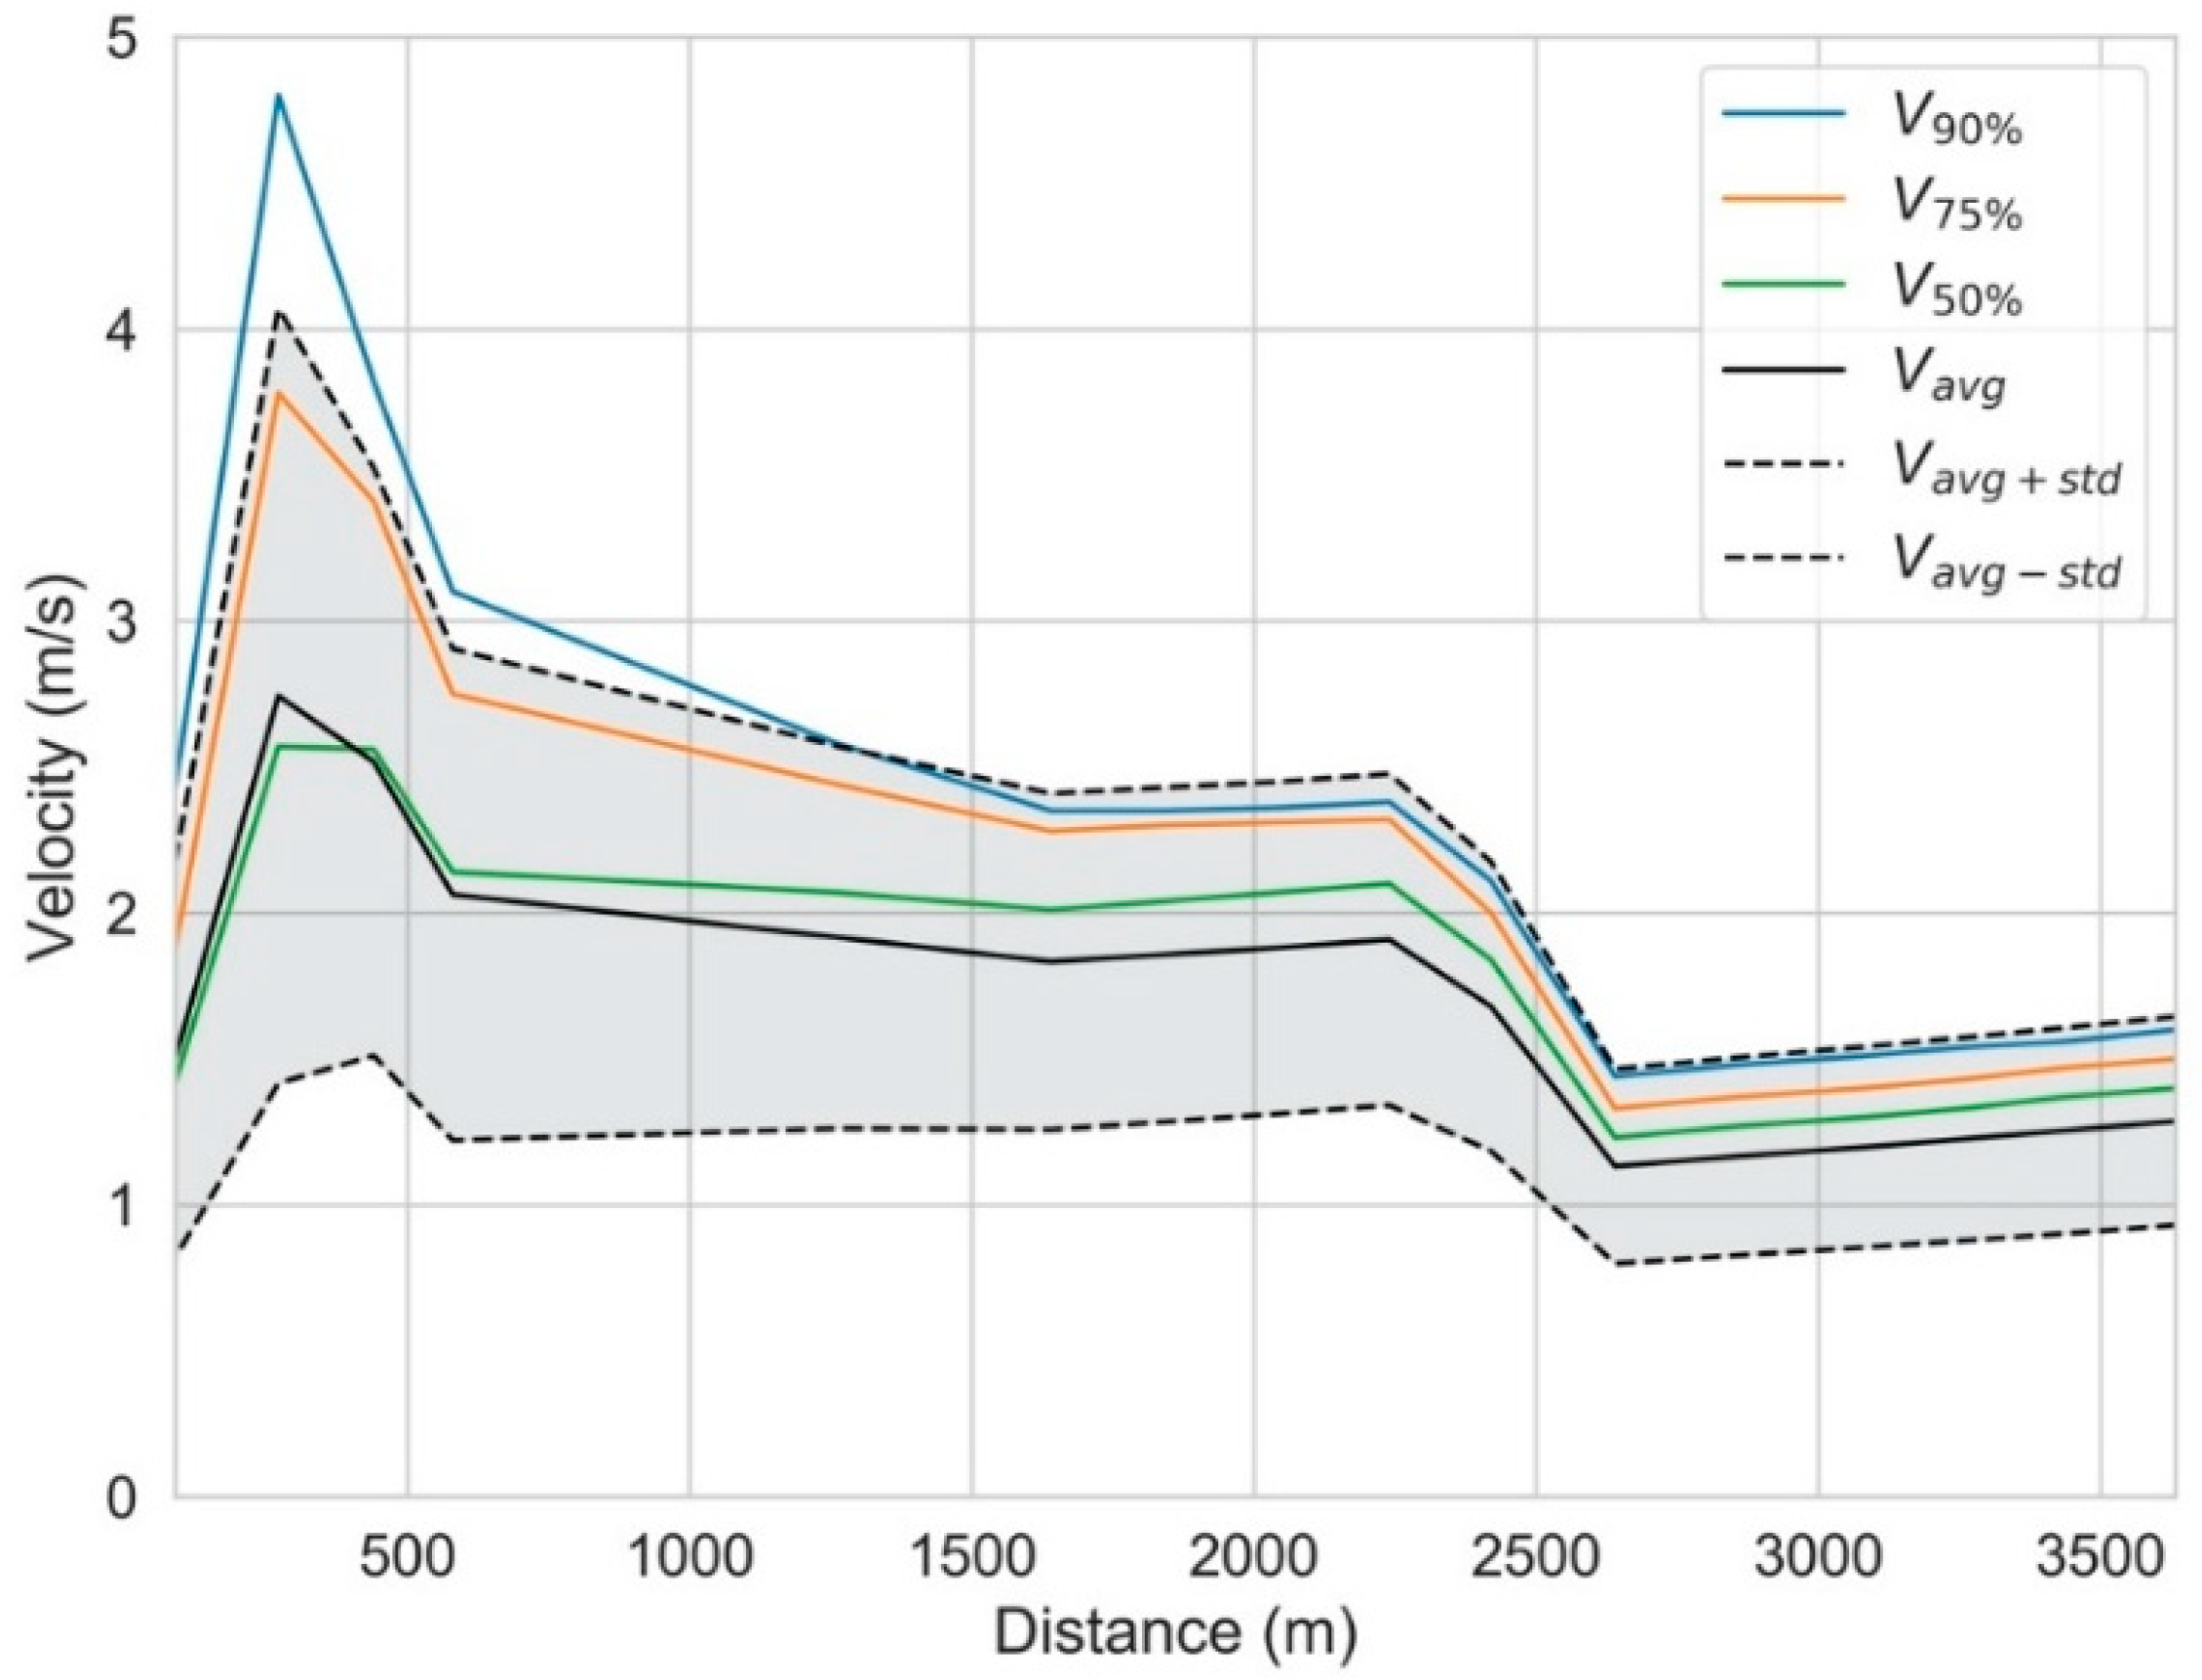
As described in the previous section, this study performed a risk analysis to evaluate the probability of the failure of the KWK Diversion channel. The models adopted boundary conditions generated from 1000 Monte Carlo simulations based on various discharge values and water levels. We adopted the concept of exceedance probability to express the level of risk. The data was visualized in the form of flow depth and velocity profiles along the diversion channel, as shown in Figure 5 and Figure 6. In these figures, the distance refers to the channel station measured from the downstream to the upstream section of the diversion channel.
Figure 5 presents velocity profiles along the diversion channel. Note that the average velocities (black line) in most of the sections were between 1 and 2 m/s, and greater than 2 m/s, at the river station between 200 to 500 m. As can be seen, most of the areas with high velocity flow were located in the downstream section. We classified the reach into three sections, segmented by two major culverts (at 581 m and 1262 m), which were built to bypass a station for the high speed railway Sharon branch and Evergreen road, respectively.
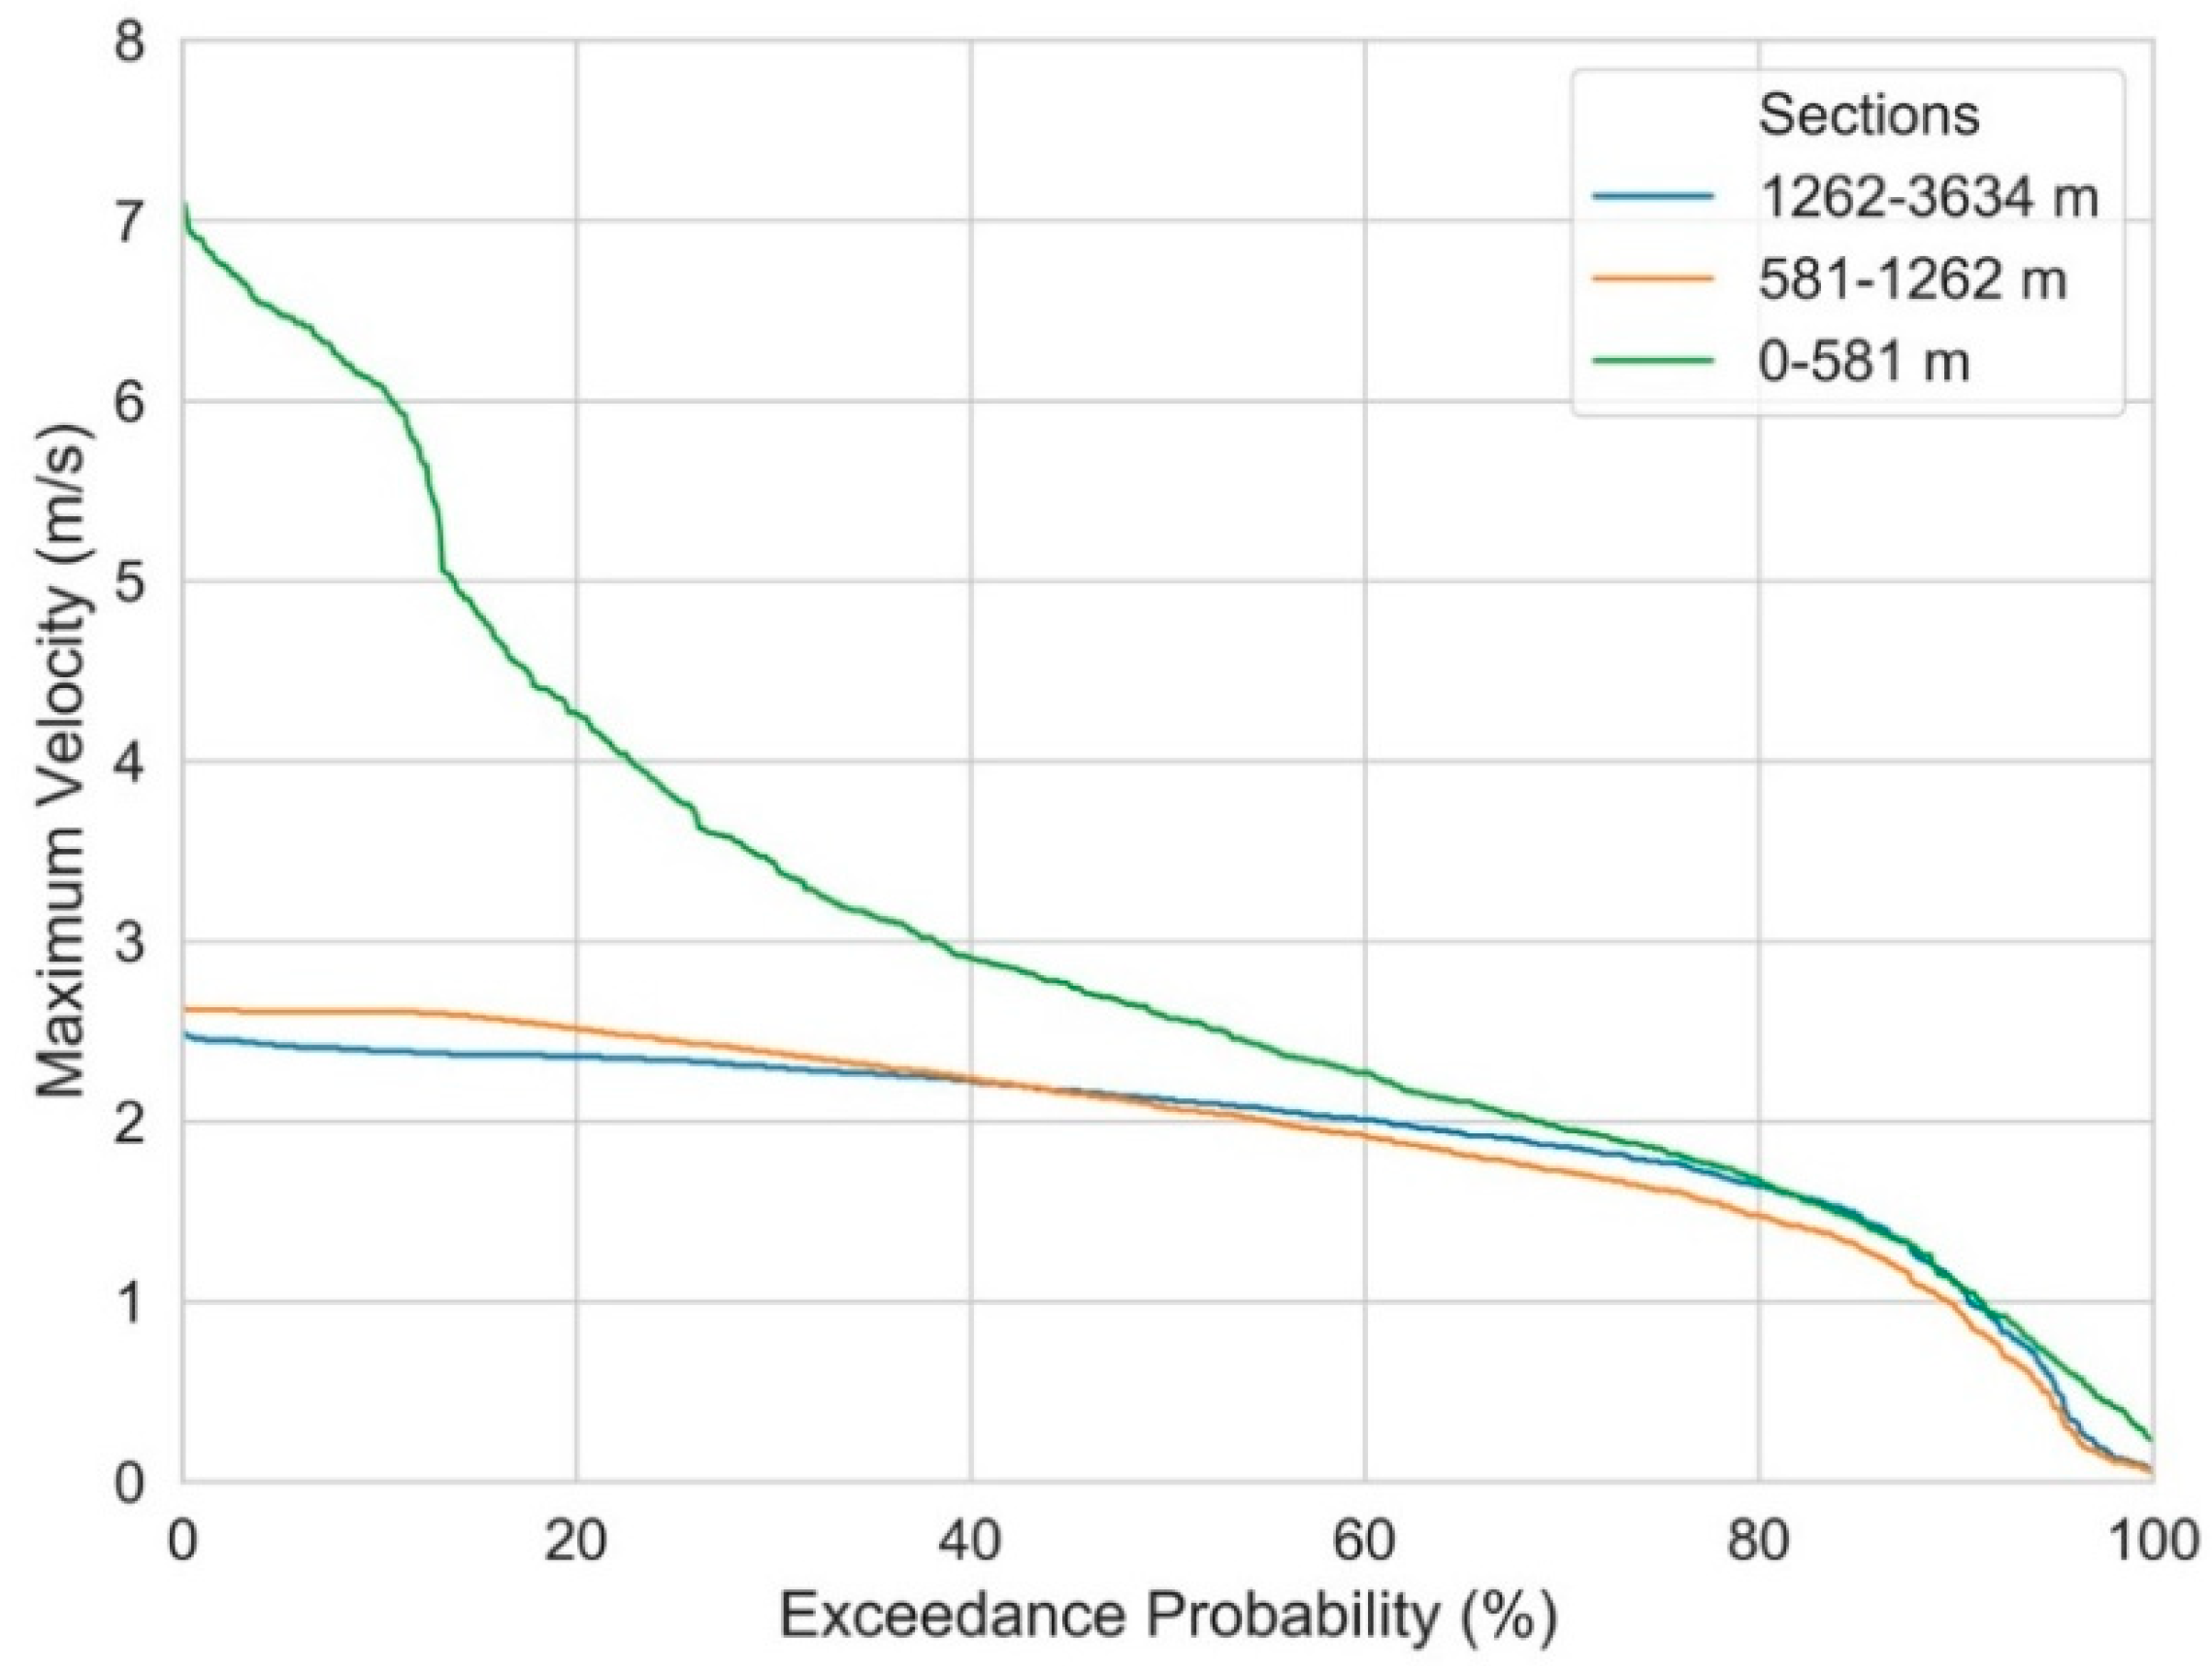
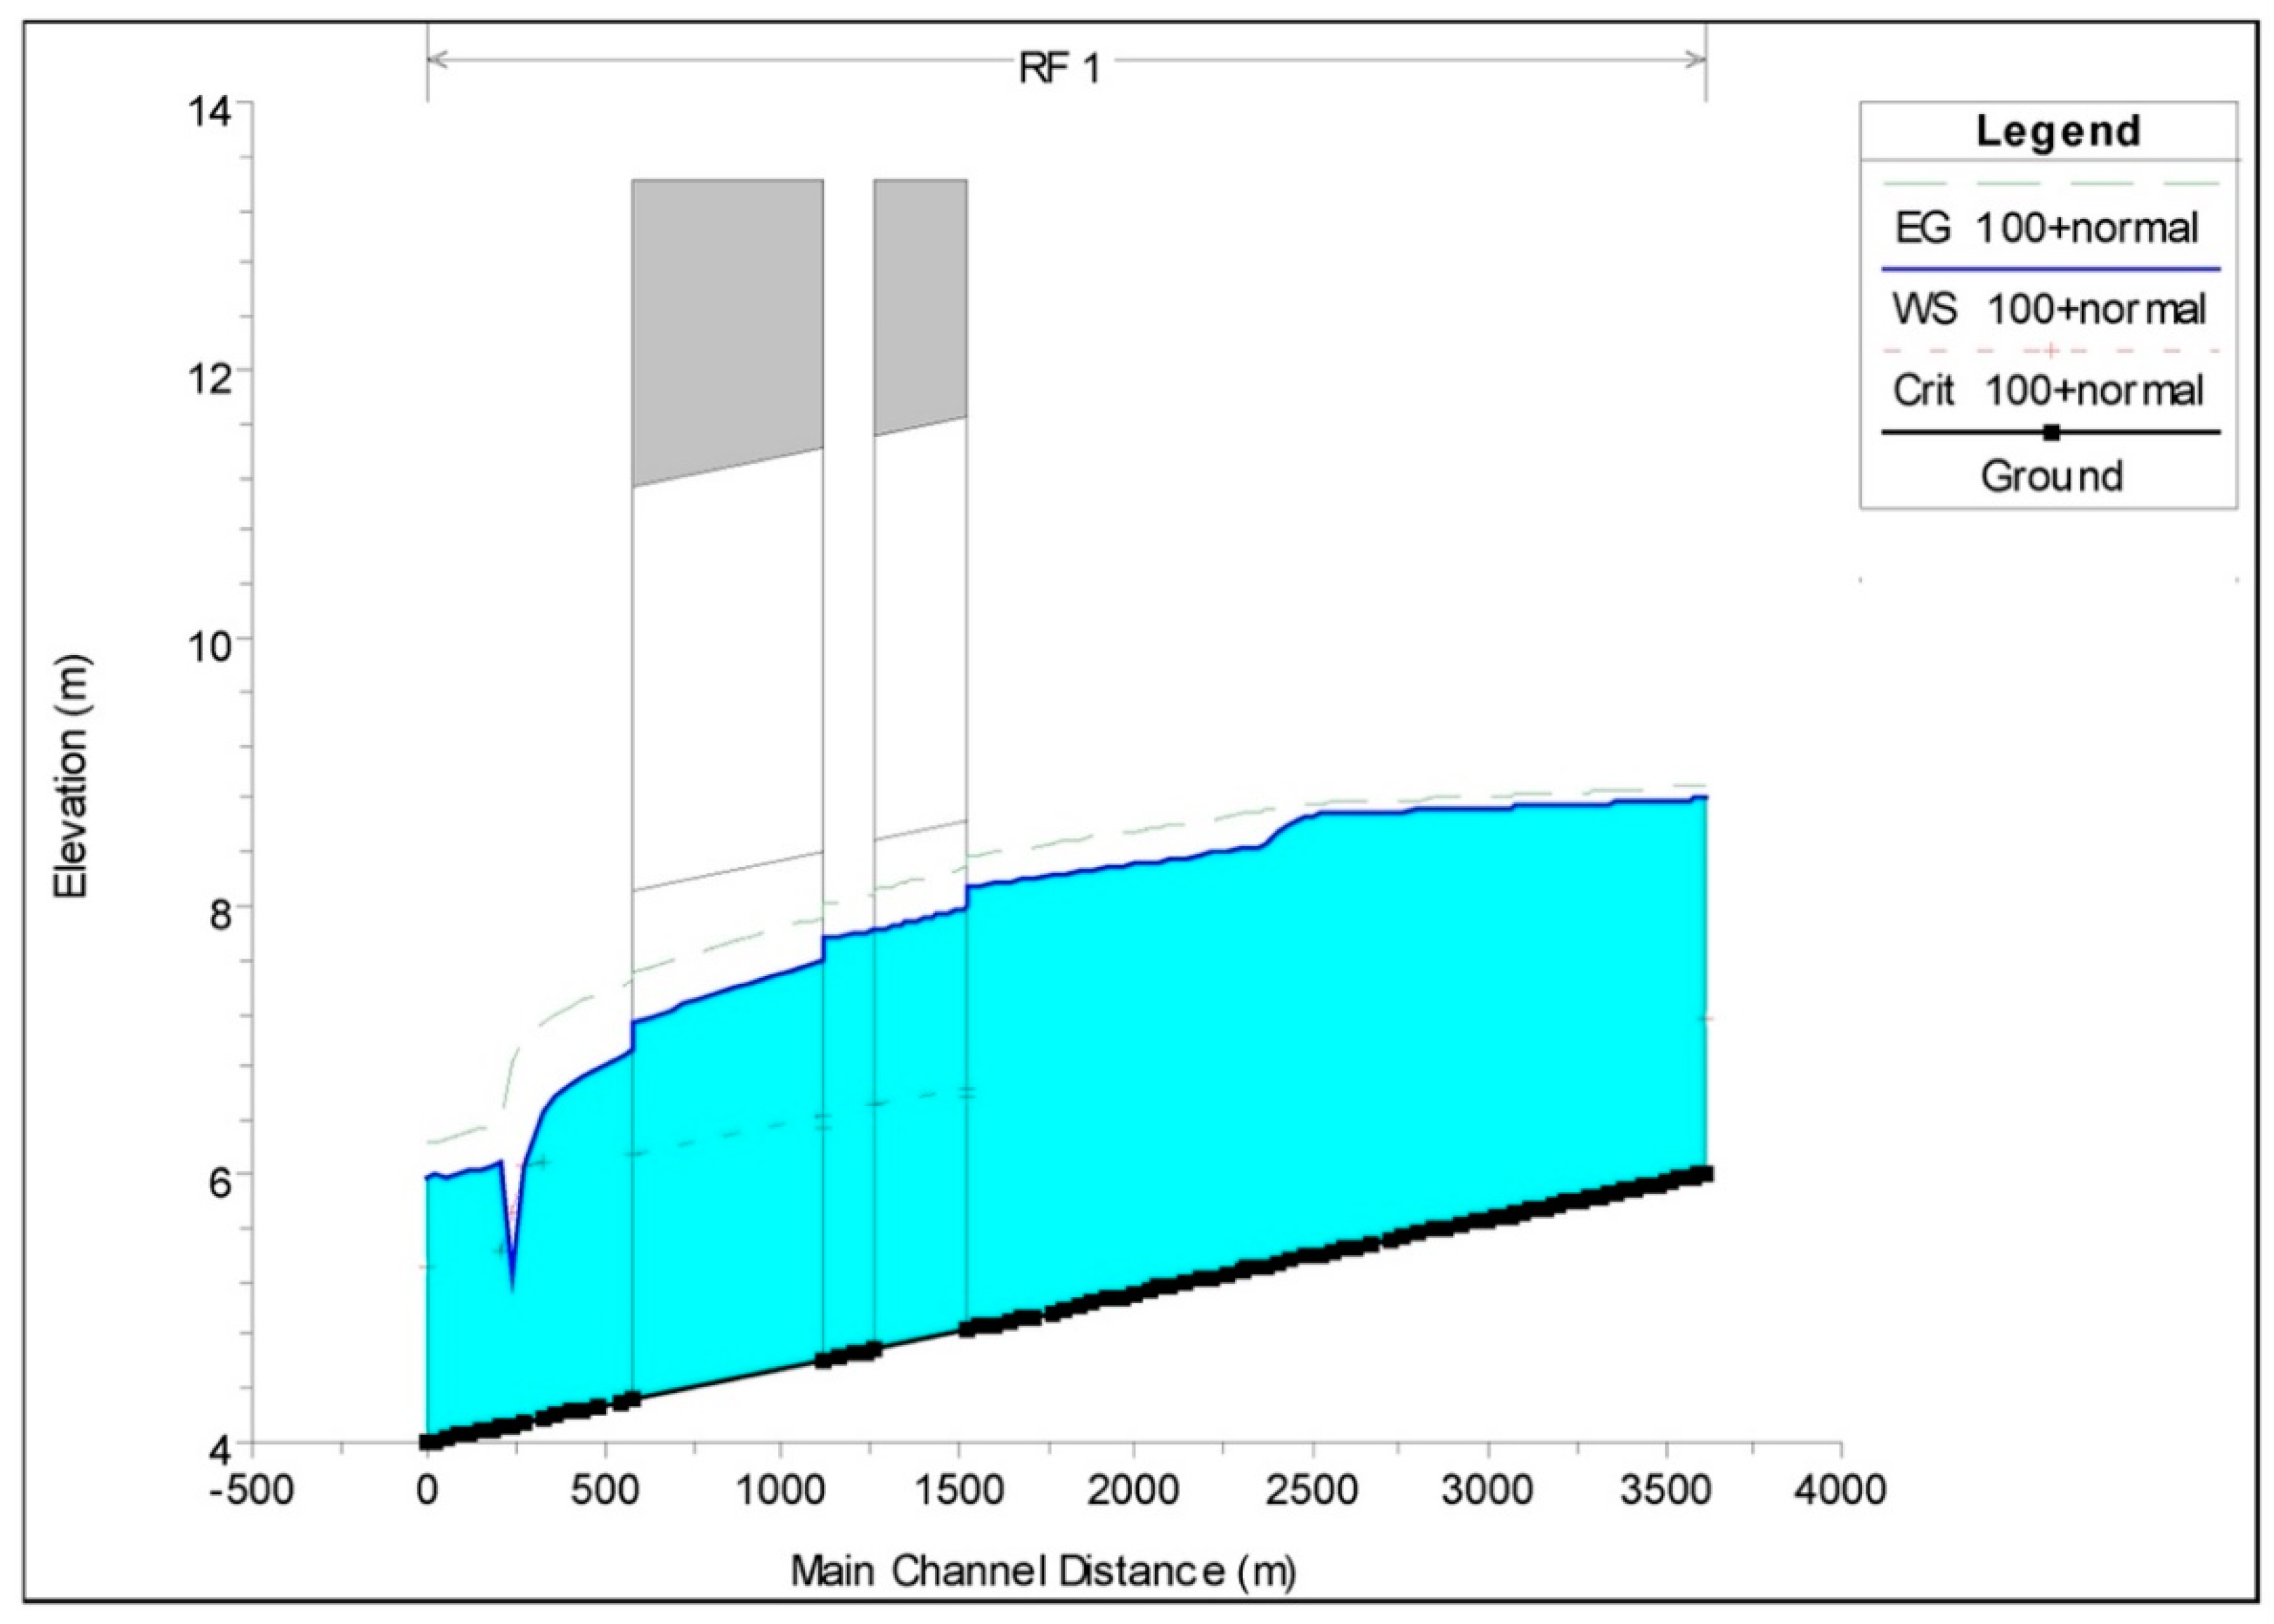
Figure 6 indicates the exceedance probabilities of the largest velocities in three sections. The lines represent three sections divided by two culverts, and the numbers refer to the reaches of the sections. In Figure 6, the flow velocity of the section at 0~581 m has 20% chance of being larger than 5 m/s. The channel width is changed from 12 m at river station 271 to 25 m at river station 180 m. This changed the streamflow in the channel from a subcritical flow to a supercritical flow, and then went back to a subcritical flow by a hydraulic jump, as shown in Figure 7. Figure 7 is one of the results by HEC-RAS, for example. This case is set at 100-year return period discharge as an upstream boundary condition, whereas normal depth as a downstream boundary condition. The green line is the energy grade line; the blue line is the water surface; the red cross indicates the critical depths. Two culverts are also shown in Figure 7: round river station 580 m to 1120 m and 1260 m to 1530 m. With rapid velocities, the water surface level was below the critical depth under supercritical flow conditions, causing a hydraulic jump slightly downstream to dispense excess energy and bring the water level back to the normal depth. The hydraulic jump depleted much of the energy, and caused riverbed erosion, leading to the collapse of the KWK Diversion in 2014.
In the past, engineers focused on whether there was sufficient capacity above the flood level to maintain the integrity of levees, but largely disregarded the risk of failure caused by flow conditions, such as a hydraulic jump. Standards established by the WRA, Taiwan [59] stipulated that levees provide 30~50 cm freeboard above the flood level for major and secondary rivers. In the U.S., CFR 65.10(b)(1)(i) requires a minimum of 150 cm freeboard along levee systems, with an exception for situations in which uncertainty analysis demonstrates that the system provides adequate protection.
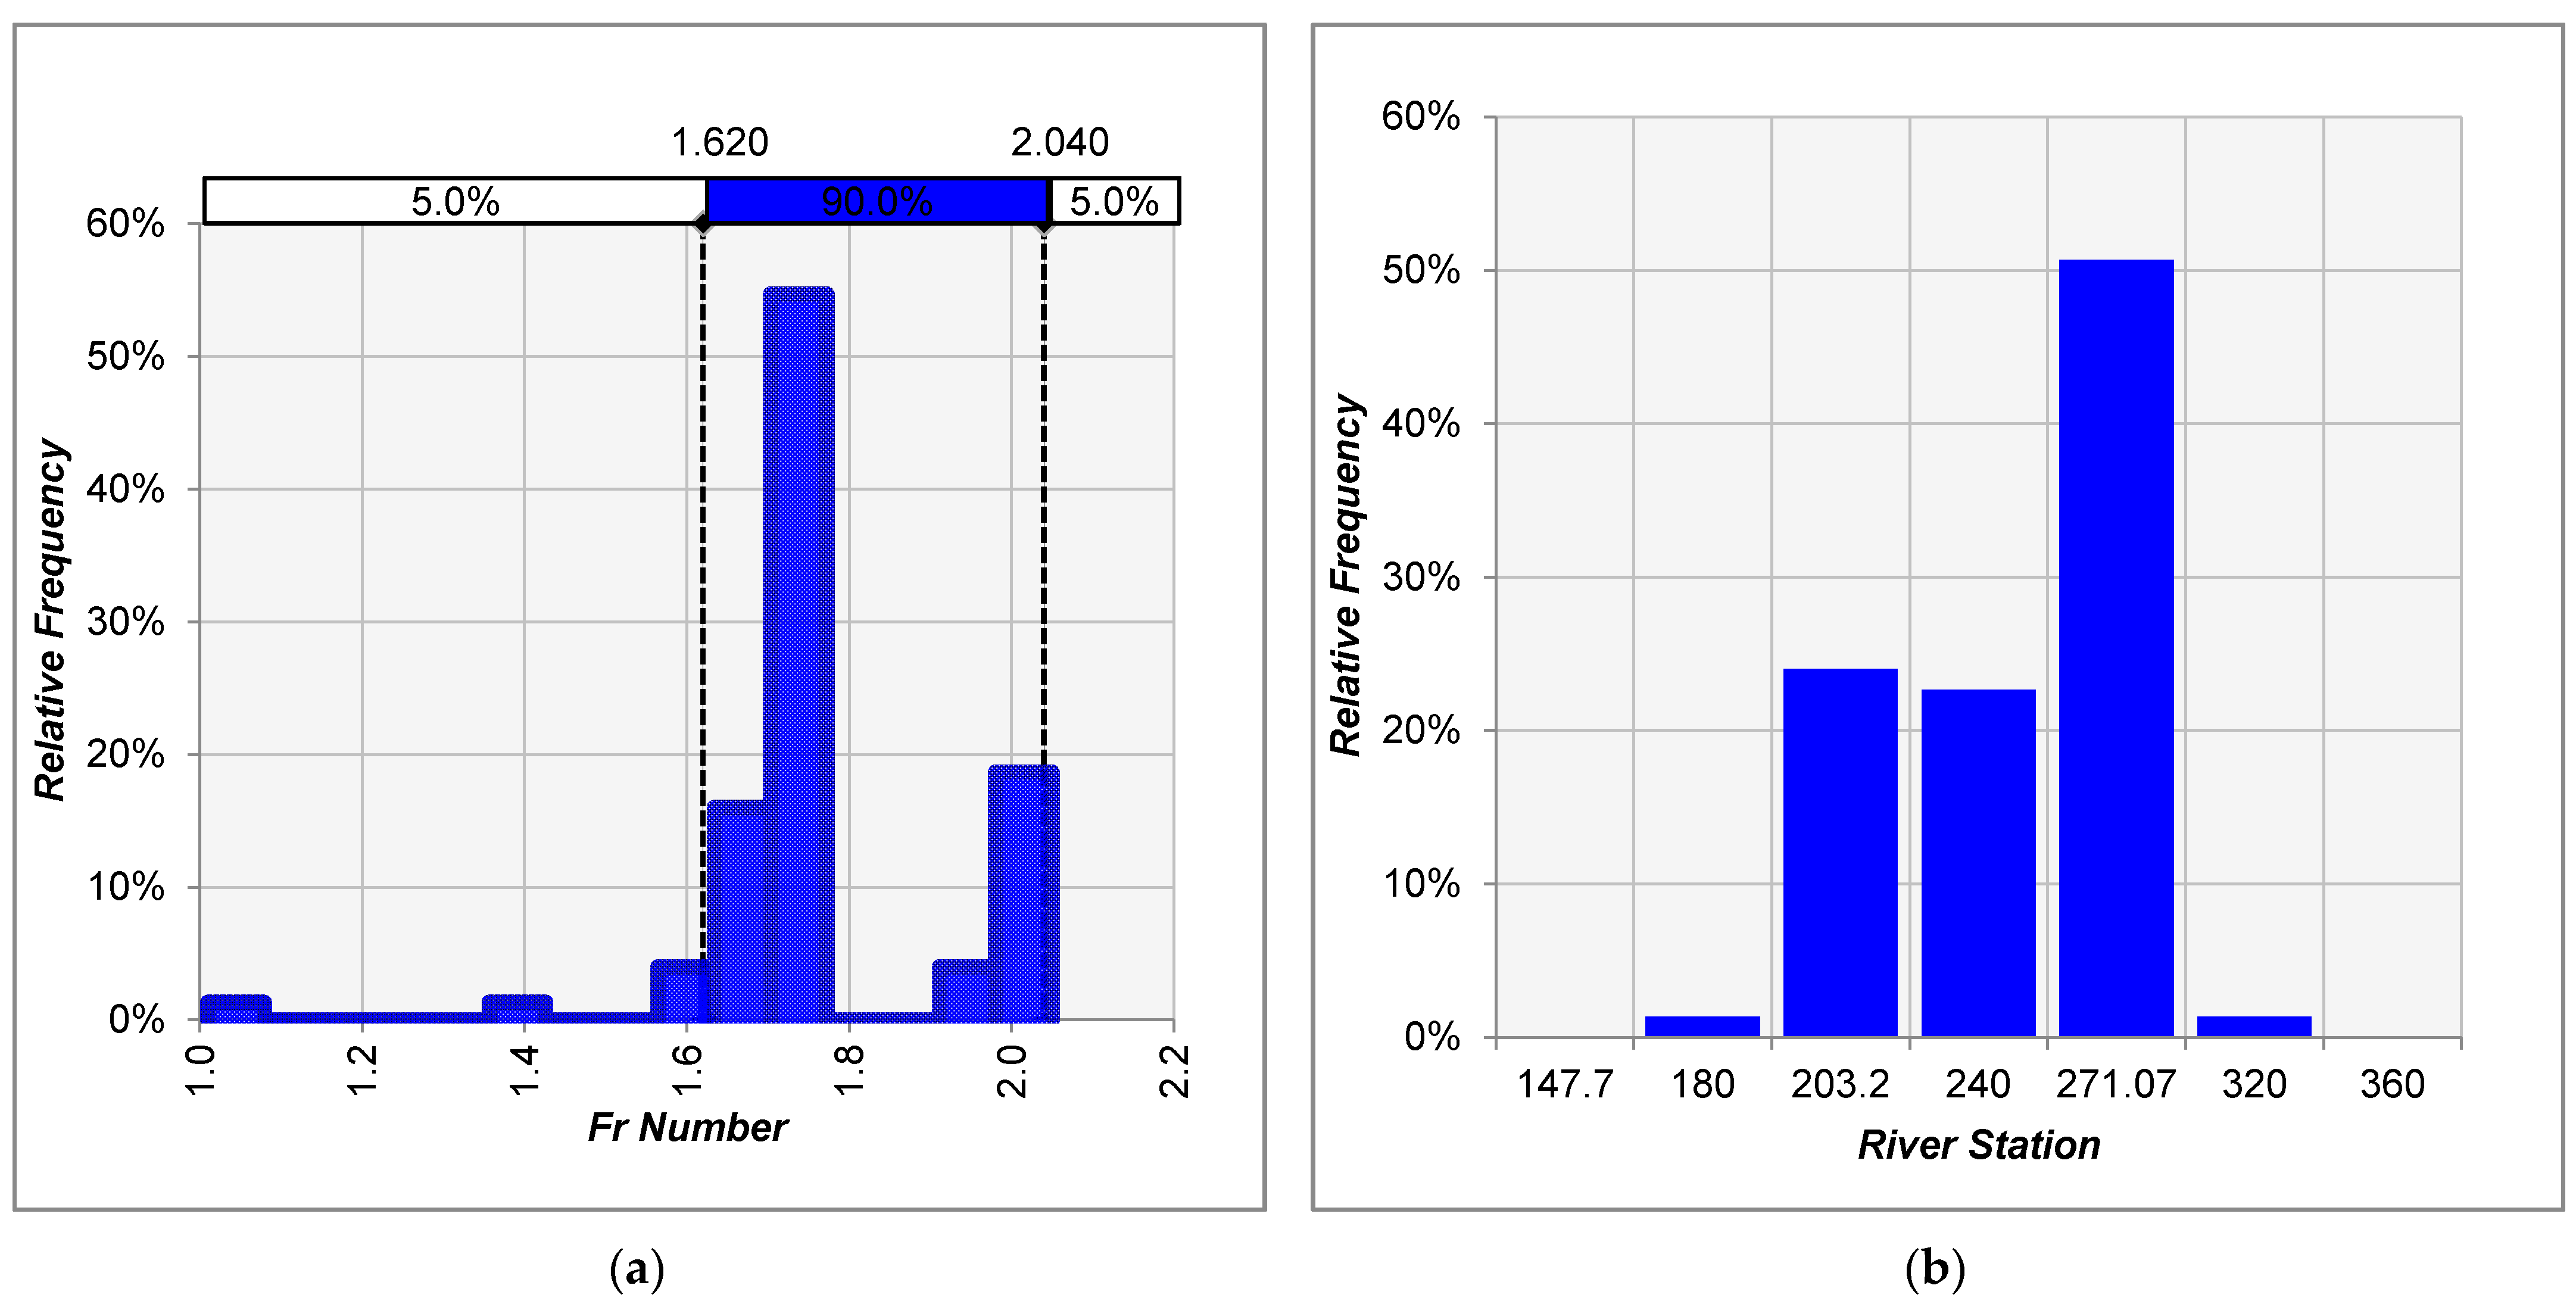
Our HEC-RAS results revealed that, in this case study, the probability of structural failure due to hydrodynamic conditions exceeded the probability of overbank events. Among the 1000 simulation sets, 75 produced hydraulic jumps in the downstream areas, which means the probability of hydraulic jump was 7.5%. The histogram of the magnitudes and locations of these 75 hydraulic jumps produced is demonstrated as Figure 8. In this figure, the magnitudes of the hydraulic jumps are given in term of the Froude number before the hydraulic jump, and the locations are presented as the river stations at the cross section upstream before the hydraulic jump. Note that these estimates are conservative, as we assumed that upstream and downstream conditions were perfectly independent. Additional data would be required to explore the dependence between upstream and downstream hydraulic conditions.
4. Discussion
Engineers generally use flood hazard analysis to guide the design of hydraulic facilities, such as floodways. According to FEMA [60], the four inputs required for 1D steady flow simulations are cross section geometry, loss coefficients, water surface elevation, and peak flow discharge. Basic flooding is delineated by 100-year return period events, and floodplains and floodways should be able to withstand events of 500-year return period intensity. FEMA provides several suggestions to determine the sufficiency of the data used to assess downstream boundary conditions. Downstream boundary conditions are usually determined by the elevation of water surfaces; however, when reference values are unavailable, designers can use depths related to structures, such as drop structures or culverts. When neither type of data is available, the normal depth can be used for the downstream boundary condition.
According to FEMA guidelines, the rule of thumb is to consider system failures within the context of overall extreme events, under which all components are at their maximum loading. Note that rainfall distributions are highly spatially variable, particularly during thunderstorms and typhoons. Under those conditions, hydraulic conditions often deviate considerably from the design parameters, resulting in failure. The failure of the KWK Diversion is a case in point. The KWK Diversion was designed to reduce the risk of flooding under high return period events. In these scenarios, it is usual to use high water surface levels as upstream and downstream conditions. On the day of the failure, precipitation was concentrated in the upstream area rather than over the entire area. As a result, the low water level in the downstream section created the hydraulic conditions capable of inducing a hydraulic jump. The readers are also referred to [61,62,63] for the influence of downstream boundary conditions on the operation and performance of hydraulic structure. Definitely, dealing with uncertainty should consider more aspects besides hydrological variability [64], for example erosion [55,56] or others, such as roughness, longitudinal gradient and grid resolution [65]. Further works were restricted due to the increase in the complexity of analysis, but could be investigated to some degrees by sensitivity analysis.
After exposing the risks, we should determine whether the risk was worth the benefits of cost saving. As mentioned previously, the original design included a concrete lined channel over the entire length of the KWK Diversion, whereas the final (riskier) design used only retaining walls as a cost saving measure. We, thus, used cost–benefit analysis to re-examine the decisions that led to the final engineering plan within the context of risk. According to the WRA, the total cost of the project was TWD 2460 million and the total benefit was estimated at TWD 3444 million, with a discount rate of 6% and 20 years of economic life. Note, however, that the benefits were estimated without considering the risk of structural failure resulting from a hydraulic jump. More comprehensive cost–benefit analysis would also account for the risk of the hydraulic jump leading to collapses of the channel, which was estimated at 7.5%. However, it should be noted that this estimate of the risk is based on the assumption that the hydraulic jump will definitely cause riverbed scouring and the collapse of channel. This assumption could be very likely correct, but in some cases the construction might be able to resist against hydraulic jumps without physical damage. A more physically based adjustment of the failure threshold founded on the mechanics of sediment transport or river hydraulics is worth further discussion, but still out of the scope of this study.
In the following, we compare two scenarios that represent the original plan and an alternative:
- Scenario A: concrete lined channel (alternative plan)
- Scenario B: concrete retaining wall for riverbanks only (original plan)
The total net benefit of Scenarios A and B can, respectively, be derived using Equations (1) and (2):
where p indicates the risk of collapse each year, X is the annual benefit, and r is the discount rate, n is the number of years after the completion of the project. Equation (1) describes the flood control benefits of the original design which is estimated around TWD 3444 million, the flood control benefit within the context of failure probability due to hydraulic jump is only TWD 1922 million. The benefit of Scenario B is TWD 1522 million lower than that of Scenario A, approximately half. Clearly, the risk of failure due to hydraulic jump cannot be disregarded, unless there are other benefits or cost savings of Scenario B (over Scenario A) exceeding TWD 1522 million.
5. Conclusions
Excessively high water levels are a key issue in the design of flood control facilities; however, there are numerous risk factors that must be identified by carefully examining the specifics of the project. The failure of the KWK Diversion should be a reminder to engineers of the potential risks that are so easily disregarded during the design process. The most important problem for engineers is not to prevent known system failures, but, rather, to deal with failures that have not previously been encountered. Monte Carlo simulations provide one approach to resolving this problem.
In this special case, it would be preferable to install low weirs or guided racks to maintain the water at an appropriate level. Efforts should also be made to ensure a smooth transition between sections with different slopes or widths, in order to prevent excessive energy loss or an abrupt change in flow conditions. Cost–benefit analysis could be used to estimate the amount of money available to reduce these risks before drawing up a final plan. It is reasonable to pick the plan with the greatest net benefit; however, it is also necessary to adequately consider the possibility of facility failure. Finding a suitable balance between economic considerations and engineering objectives is a critical question requiring further consideration
Author Contributions
Conceptualization, G.J.-Y.Y., C.-Y.L. and Y.-H.W.; methodology, analysis and writing, C.-Y.L. and Y.-H.W.; original draft preparation, P.-C.C.; data curation, E.L.; supervision, project administration, funding acquisition, G.J.-Y.Y.; C.-Y.L. and Y.-H.W. contributed equally to this work. All authors have read and agreed to the published version of the manuscript.
Funding
This research was funded by Ministry of Science and Technology, Taiwan (MOST 108-2625-M-008-007-) and the Water Resources Agency, Taiwan (MOEAWRA1050438).
Institutional Review Board Statement
Not applicable.
Informed Consent Statement
Not applicable.
Data Availability Statement
All data, models, or code that support the findings of this study are available from the corresponding author upon reasonable request.
Conflicts of Interest
The authors declare no conflict of interest.
References
- Yiping, W.; Cong, C.; Gaofeng, H.; Qiuxia, Z. Landslide stability analysis based on random-fuzzy reliability: Taking Liangshuijing landslide as a case. Stoch. Environ. Res. Risk Assess. 2014, 28, 1723–1732. [Google Scholar] [CrossRef]
- Goda, K. Time-dependent probabilistic tsunami hazard analysis using stochastic rupture sources. Stoch. Environ. Res. Risk Assess. 2019, 33, 341–358. [Google Scholar] [CrossRef]
- Hall, J.; Solomatine, D. A framework for uncertainty analysis in flood risk management decisions. Int. J. River Basin Manag. 2008, 6, 85–98. [Google Scholar] [CrossRef] [Green Version]
- Mays, L.W. The role of risk analysis in water resources engineering. J. Contemp. Water Res. Educ. 2011, 103, 3. [Google Scholar]
- Yen, B.C.; Cheng, S.T.; Melching, C.S. First order reliability analysis. In Stochastic and Risk Analysis in Hydraulic Engineering; Water Resource Publications: Littleton, CO, USA, 1986; pp. 1–36. [Google Scholar]
- Lian, Y.; Yen, B.C. Comparison of risk calculation methods for a culvert. J. Hydraul. Eng. 2003, 129, 140–152. [Google Scholar] [CrossRef] [Green Version]
- Mays, L.W.; Tung, Y.K. Hydrosystems Engineering and Management; Water Resource Publications: Littleton, CO, USA, 2002. [Google Scholar]
- Singh, V.P. (Ed.) Application of Frequency and Risk in Water Resources: Proceedings of the International Symposium on Flood Frequency and Risk Analyses, 14–17 May 1986, Louisiana State University, Baton Rouge, USA; Springer Science & Business Media: Berlin/Heidelberg, Germany, 2012. [Google Scholar]
- Bowles, D.S.; Anderson, L.R.; Glover, T.F.; Chauhan, S.S. Portfolio risk assessment: A tool for dam safety risk management. In Proceedings of the USCOLD 1998 Annual Lecture, Buffalo, NY, USA, 8–14 August 1998. [Google Scholar]
- Stedinger, J.R. Frequency analysis of extreme events. In Handbook of Hydrology; McGraw-Hill: New York, NY, USA, 1993. [Google Scholar]
- Rajagopalan, B.; Salas, J.D.; Lall, U. Stochastic methods for modeling precipitation and streamflow. In Advances in Data-Based Approaches for Hydrologic Modeling and Forecasting; World Scientific: Singapore, 2010; pp. 17–52. [Google Scholar]
- Salas, J.D.; Obeysekera, J. Return period and risk for nonstationary hydrologic extreme events. In Proceedings of the World Environmental and Water Resources Congress 2013: Showcasing the Future, Cincinnati, OH, USA, 19–23 May 2013; pp. 1213–1223. [Google Scholar]
- Rasmussen, P.F.; Rosbjerg, D. Evaluation of risk concepts in partial duration series. Stoch. Hydrol. Hydraul. 1991, 5, 1–16. [Google Scholar] [CrossRef]
- Salas, J.D.; Burlando, P.; Heo, J.H.; Lee, D.J. The axis of risk and uncertainty in hydrologic design. Hydrol. Days 2003, 153–164. [Google Scholar]
- Arnaud, P.; Cantet, P.; Aubert, Y. Relevance of an at-site flood frequency analysis method for extreme events based on stochastic simulation of hourly rainfall. Hydrol. Sci. J. 2016, 61, 36–49. [Google Scholar] [CrossRef]
- Hipel, K.W.; McLeod, A.I. Time Series Modelling of Water Resources and Environmental Systems; Elsevier: Amsterdam, The Netherlands, 1994; Volume 45. [Google Scholar]
- Marco, J.B.; Harboe, R.; Salas, J.D. (Eds.) Stochastic Hydrology and Its Use in Water Resources Systems Simulation and Optimization; Springer Science & Business Media: Berlin/Heidelberg, Germany, 2012; Volume 237. [Google Scholar]
- MacNeill, I.B.; Umphrey, G. (Eds.) Advances in the Statistical Sciences: Stochastic Hydrology: Volume IV Festschrift in Honor of Professor VM Joshi’s 70th Birthday; Springer Science & Business Media: Berlin/Heidelberg, Germany, 2012; Volume 37. [Google Scholar]
- You, G.J.Y.; Thum, B.H.; Lin, F.H. The examination of reproducibility in hydro-ecological characteristics by daily synthetic flow models. J. Hydrol. 2014, 511, 904–919. [Google Scholar] [CrossRef]
- Hall, J.W. Handling uncertainty in the hydroinformatic process. J. Hydroinformatics 2003, 5, 215–232. [Google Scholar] [CrossRef] [Green Version]
- National Research Council. Risk Analysis and Uncertainty in Flood Damage Reduction Studies; National Academies Press: Washington, DC, USA, 2000. [Google Scholar]
- Sayers, P.B.; Hall, J.W.; Meadowcroft, I.C. Towards risk-based flood hazard management in the UK. In Proceedings of the Institution of Civil Engineers-Civil Engineering; Thomas Telford Ltd.: London, UK, May, 2002; Volume 150, Issue 5, pp. 36–42. [Google Scholar]
- Vrijling, J.K. Development in probabilistic design of flood defenses in the Netherlands. In Reliability and Uncertainty Analyses in Hydraulic Design; Yen, B.C., Tung, Y.-K., Eds.; ASCE: New York, NY, USA, 1993; pp. 133–178. [Google Scholar]
- U.S. Army Corps of Engineers. Risk-based analysis for flood damage reduction studies. In Manual, EM 1110-2-1619; U.S. Army Corps of Engineers: Washington, DC, USA, 1996. [Google Scholar]
- Goldman, D. Estimating expected annual damage for levee retrofits. J. Water Resour. Plan. Manag. 1997, 123, 89–94. [Google Scholar] [CrossRef]
- Tang, W.H.; Yen, B.C. Hydrologic and hydraulic design under uncertainties. Proc. Int. Symp. Uncertainties Hydrol. Water Resour. Syst. 1973, 2, 868–882. [Google Scholar]
- Yen, B.C.; Tung, Y.K. (Eds.) Reliability and Uncertainty Analyses in Hydraulic Design; ASCE: New York, NY, USA, 1993. [Google Scholar]
- Melching, C.S. Reliability Estimation. In Computer Models of Watershed Hydrology; Water Resources Publications: Highlands Ranch, CO, USA, 1995. [Google Scholar]
- Ayyub, B.M.; McCuen, R.H. Probability, Statistics, and Reliability for Engineers and Scientists; CRC Press: Boca Raton, FL, USA, 2016. [Google Scholar]
- Tung, Y.K.; Mays, L.W. Optimal risk-based design of water resource engineering projects. NASA STI/Recon Tech. Rep. N 1980, 81, 20316. [Google Scholar]
- Tung, Y.K.; Mays, L.W. Risk models for flood levee design. Water Resour. Res. 1981, 17, 833–841. [Google Scholar] [CrossRef]
- Lee, H.L.; Mays, L.W. Improved risk and reliability model for hydraulic structures. Water Resour. Res. 1983, 19, 1415–1422. [Google Scholar] [CrossRef]
- Lee, H.L.; Mays, L.W. Hydraulic uncertainties in flood levee capacity. J. Hydraul. Eng. 1986, 112, 928–934. [Google Scholar] [CrossRef]
- Anselmo, V.; Galeati, G.; Palmieri, S.; Rossi, U.; Todini, E. Flood risk assessment using an integrated hydrological and hydraulic modelling approach: A case study. J. Hydrol. 1996, 175, 533–554. [Google Scholar] [CrossRef]
- Apel, H.; Thieken, A.H.; Merz, B.; Blöschl, G. A probabilistic modelling system for assessing flood risks. Nat. Hazards 2006, 38, 79–100. [Google Scholar] [CrossRef]
- Thompson, K.D.; Stedinger, J.R.; Heath, D.C. Evaluation and presentation of dam failure and flood risks. J. Water Resour. Plan. Manag. 1997, 123, 216–227. [Google Scholar] [CrossRef]
- Kuo, J.T.; Yen, B.C.; Hsu, Y.C.; Lin, H.F. Risk analysis for dam overtopping—Feitsui reservoir as a case study. J. Hydraul. Eng. 2007, 133, 955–963. [Google Scholar] [CrossRef]
- Lee, B.S.; You, G.J.Y. An assessment of long-term overtopping risk and optimal termination time of dam under climate change. J. Environ. Manag. 2013, 121, 57–71. [Google Scholar] [CrossRef]
- Bellos, V.; Tsakiris, V.K.; Kopsiaftis, G.; Tsakiris, G. Propagating Dam Breach Parametric Uncertainty in a River Reach Using the HEC-RAS Software. Hydrology 2020, 7, 72. [Google Scholar] [CrossRef]
- Merz, B.; Kreibich, H.; Thieken, A.; Schmidtke, R. Estimation uncertainty of direct monetary flood damage to buildings. Nat. Hazards Earth Syst. Sci. 2004, 4, 153–163. [Google Scholar] [CrossRef] [Green Version]
- Tsai, C.W.; Yeh, J.J.; Huang, C.H. Development of probabilistic inundation mapping for dam failure induced floods. Stoch. Environ. Res. Risk Assess. 2019, 33, 91–110. [Google Scholar] [CrossRef]
- Aven, T.; Pörn, K. Expressing and interpreting the results of quantitative risk analyses. Review and discussion. Reliab. Eng. Syst. Saf. 1998, 61, 3–10. [Google Scholar] [CrossRef]
- Apel, H.; Merz, B.; Thieken, A.H. Quantification of uncertainties in flood risk assessments. Int. J. River Basin Manag. 2008, 6, 149–162. [Google Scholar] [CrossRef] [Green Version]
- Morgan, M.G.; Henrion, M.; Small, M. Uncertainty: A Guide to Dealing with Uncertainty in Quantitative Risk and Policy Analysis; Cambridge University Press: Cambridge, UK, 1990. [Google Scholar]
- Johnson, P.A. Uncertainty of hydraulic parameters. J. Hydraul. Eng. 1996, 122, 112–114. [Google Scholar] [CrossRef]
- Gates, T.K.; Al-Zahrani, M.A. Spatiotemporal stochastic open-channel flow. I: Model and its parameter data. J. Hydraul. Eng. 1996, 122, 641–651. [Google Scholar] [CrossRef]
- Johnson, P.A.; Dock, D.A. Probabilistic bridge scour estimates. J. Hydraul. Eng. 1998, 124, 750–754. [Google Scholar] [CrossRef]
- U.S. Department of Defense. Military Standard: Procedures for Performing a Failure Mode Effects and Criticality Analysis; Department of Defense: Washington, DC, USA, 1980. [Google Scholar]
- Bluvband, Z.; Zilberberg, E. Knowledge base approach to integrated FMEA. In Proceedings of the Annual Quality Congress Proceedings-American Society for Quality Control, Philadelpha, PA, USA, 4–6 May 1998; pp. 535–545. [Google Scholar]
- Krasich, M. Use of fault tree analysis for evaluation of system-reliability improvements in design phase. In Proceedings of the Annual Reliability and Maintainability Symposium. 2000 Proceedings. International Symposium on Product Quality and Integrity (Cat. No. 00CH37055), Los Angeles, CA, USA, 24–27 January 2000; pp. 1–7. [Google Scholar]
- U.S. Army Corps of Engineers. USACE Process for the National Flood Insurance Program (NFIP) Levee System Evaluation; EC 1110-2-6067; U.S. Army Corps of Engineers: Washington, DC, USA, 2010.
- Wahalathantri, B.L.; Lokuge, W.; Karunasena, W.; Setunge, S. Vulnerability of floodways under extreme flood events. Nat. Hazards Rev. 2015, 17, 04015012. [Google Scholar] [CrossRef]
- Wang, Y.H.; Hsu, Y.C.; You, G.J.Y.; Yen, C.L.; Wang, C.M. Flood Inundation Assessment Considering Hydrologic Conditions and Functionalities of Hydraulic Facilities. Water 2018, 10, 1879. [Google Scholar] [CrossRef] [Green Version]
- Yen, B.C. Safety factor in hydrologic and hydraulic engineering design. Proceedings 1978, 1. [Google Scholar]
- Johnson, P.A.; Clopper, P.E.; Zevenbergen, L.W.; Lagasse, P.F. Quantifying uncertainty and reliability in bridge scour estimations. J. Hydraul. Eng. 2015, 141, 04015013. [Google Scholar] [CrossRef]
- Pizarro, A.; Manfreda, S.; Tubaldi, E. The science behind scour at bridge foundations: A review. Water 2020, 12, 374. [Google Scholar] [CrossRef] [Green Version]
- U.S. Army Corps of Engineers. HEC-RAS River Analysis System Hydraulic Reference Manual. Version 5.0; U.S. Army Corps of Engineers: Washington, DC, USA, 2016.
- Water Resources Agency, Taiwan. Regulation Project of Flood-prone Areas (Formulation Report of Tainan County Governmental Gang-Wei-Gou Drainage System); Water Resources Agency: Taichung, Taiwan, 2009. [Google Scholar]
- Water Resources Planning Institute, Taiwan. Regional Drainage and Environmental Planning Reference Manual; Water Resources Planning Institute: Taichung, Taiwan, 2006. [Google Scholar]
- FEMA. Hydraulics: One-dimensional analysis. In Guidance for Flood Risk Analysis and Mapping; FEMA: Washington, DC, USA, 2016. [Google Scholar]
- Viero, D.P.; Defina, A. Extended theory of hydraulic hysteresis in open-channel flow. J. Hydraul. Eng. 2017, 143, 06017014. [Google Scholar] [CrossRef] [Green Version]
- Mel, R.A.; Viero, D.P.; Carniello, L.; D’Alpaos, L. Multipurpose use of artificial channel networks for flood risk reduction: The case of the waterway Padova–Venice (Italy). Water 2020, 12, 1609. [Google Scholar] [CrossRef]
- Mel, R.A.; Viero, D.P.; Carniello, L.; D’Alpaos, L. Optimal floodgate operation for river flood management: The case study of Padova (Italy). J. Hydrol. Reg. Stud. 2020, 30, 100702. [Google Scholar] [CrossRef]
- Wang, Y.H.; Chu, C.C.; You, G.J.Y.; Gupta, H.V.; Chiu, P.H. Evaluating Uncertainty in Fluvial Geomorphic Response to Dam Removal. J. Hydrol. Eng. 2020, 25, 04020022. [Google Scholar] [CrossRef]
- Dimitriadis, P.; Tegos, A.; Oikonomou, A.; Pagana, V.; Koukouvinos, A.; Mamassis, N.; Koutsoyiannis, D.; Efstratiadis, A. Comparative evaluation of 1D and quasi-2D hydraulic models based on benchmark and real-world applications for uncertainty assessment in flood mapping. J. Hydrol. 2016, 534, 478–492. [Google Scholar] [CrossRef]
Figure 1.
Location of the case site. Kang-Wei-Kou Diversion, Tainan, Taiwan.

Figure 2.
The process of the failure of KWK diversion.

Figure 3.
The fitting of the normal CDF to downstream water depth.

Figure 4.
The fitting of the Gumbel CDF to upstream discharge.

Figure 5.
The velocity profiles extracted from the stochastic analysis.

Figure 6.
The maximum velocity in three sections of the stream.

Figure 7.
One of the output sets from 1000 experiments by HEC-RAS, EG: energy gradient line, WS: water surface, Crit: critical depth.
Figure 7.
One of the output sets from 1000 experiments by HEC-RAS, EG: energy gradient line, WS: water surface, Crit: critical depth.

Figure 8.
The histogram of the magnitudes and locations of 75 hydraulic jumps produced by simulation. (a) Magnitude; (b) Location.
Figure 8.
The histogram of the magnitudes and locations of 75 hydraulic jumps produced by simulation. (a) Magnitude; (b) Location.


Table 1.
The frequency analysis of the hydrologic conditions.
| Return period (year) | 2 | 5 | 10 | 20 | 25 | 50 | 100 |
| Discharge (m3/s) | 121.65 | 152.89 | 168.00 | 178.65 | 181.00 | 186.58 | 188.24 |
| Water surface elevation (m) | 7.90 | 8.80 | 9.46 | 9.55 | 9.65 | 9.91 | 10.41 |
Publisher’s Note: MDPI stays neutral with regard to jurisdictional claims in published maps and institutional affiliations. |
© 2021 by the authors. Licensee MDPI, Basel, Switzerland. This article is an open access article distributed under the terms and conditions of the Creative Commons Attribution (CC BY) license (https://creativecommons.org/licenses/by/4.0/).
Share and Cite
MDPI and ACS Style
Liang, C.-Y.; Wang, Y.-H.; You, G.J.-Y.; Chen, P.-C.; Lo, E. Evaluating the Cost of Failure Risk: A Case Study of the Kang-Wei-Kou Stream Diversion Project. Water 2021, 13, 2881. https://doi.org/10.3390/w13202881
AMA Style
Liang C-Y, Wang Y-H, You GJ-Y, Chen P-C, Lo E. Evaluating the Cost of Failure Risk: A Case Study of the Kang-Wei-Kou Stream Diversion Project. Water. 2021; 13(20):2881. https://doi.org/10.3390/w13202881
Chicago/Turabian StyleLiang, Chung-Yuan, Yuan-Heng Wang, Gene Jiing-Yun You, Po-Chun Chen, and Emilie Lo. 2021. "Evaluating the Cost of Failure Risk: A Case Study of the Kang-Wei-Kou Stream Diversion Project" Water 13, no. 20: 2881. https://doi.org/10.3390/w13202881
Note that from the first issue of 2016, this journal uses article numbers instead of page numbers. See further details here.