
Effect of Biochar Amendment in Woodchip Denitrifying Bioreactors for Nitrate and Phosphate Removal in Tile Drainage Flow


Department of Water Engineering, Vytautas Magnus University, K. Donelaičio Str. 58, 44248 Kaunas, Lithuania
*
Author to whom correspondence should be addressed.
Water 2021, 13(20), 2883; https://doi.org/10.3390/w13202883
Submission received: 14 September 2021
/
Revised: 9 October 2021
/
Accepted: 11 October 2021
/
Published: 14 October 2021
(This article belongs to the Special Issue Nitrogen and Phosphorus in Surface- and Ground-Water: Sources, Mechanisms, Processes, and Pathways)
Abstract
:Biochar has received increased attention in environmental applications in recent years. Therefore, three pilot-scale denitrifying bioreactors, one filled with woodchips only and the other two enriched with 10% and 20% by volume of biochar from deciduous wood, were tested under field conditions for the removal of nitrate (NO3-N) and phosphate (PO4-P) from tile drainage water in Lithuania over a 3-year period. The experiment showed the possibility to improve NO3-N removal by incorporating 20% biochar into woodchips. Compared to the woodchips only and woodchips amended with 10% biochar, the NO3-N removal effect was particularly higher at temperatures below 10.0 °C. The results also revealed that woodchips alone can be a suitable medium for PO4-P removal, while the amendment of biochar to woodchips (regardless of 10% or 20%) can lead to large releases of PO4-P and other elements. Due to the potential adverse effects, the use of biochar in woodchip bioreactors has proven to be very limited and complicated. The experiment highlighted the need to determine the retention capacity of biochar for relevant substances depending on the feedstock and its physical and chemical properties before using it in denitrifying bioreactors.
1. Introduction
To maintain high crop production, modern agriculture uses large amounts of mineral fertilizers to create more favorable conditions for plant growth. However, this practice can result in increased levels of nutrients (i.e., inorganic forms of N and P) leaching from the soil and rapidly entering surface waters through tile drainage systems [1,2]. As in other countries in temperate regions, this phenomenon detrimentally affects waters in Lithuania, where the tile-drained area covers 74% of the total agricultural land [3].
The environmental impact from the introduction of tile drainage is a major concern [4]. Excessive nutrient input to water bodies can accelerate eutrophication with the subsequent promotion of toxicity to aquatic life and endanger human health [5,6]. With the rapidly increasing human population, agriculture is expected to become even more intense with likely larger negative impacts on water environments [7]. To mitigate the impacts, nutrient inflows have to be intercepted before reaching surface waters. Therefore, a new emerging edge-of-field technology, woodchip-denitrifying bioreactors, has been employed for NO3-N removal in tile drainage flow [8,9,10,11]. The core of the bioreactor is a drainage trench filled with woodchips through which the tile flow is directed. Consequently, under anaerobic conditions, chemically bound oxygen is used by heterotrophic bacteria to oxidize carbon, while NO3-N is reduced to N gases [12,13].
Previous research [14,15,16] has shown that bioreactors can reduce the annual NO3-N load in drainage water from 32% to 55%. However, little has been done to evaluate phosphate-phosphorus (PO4-P) removal in bioreactors. Phosphorus is the most important limiting nutrient for primary production in surface waters. Nevertheless, a significant increase in P has been observed in many freshwaters in recent decades [17,18]. Various adsorption technologies are commonly used to reduce PO4-P content in water [19]. However, they are not very effective at the low PO4-P concentrations (e.g., less than 0.100 mg/L, but enough to cause eutrophication) typically found in tile drainage water [20].
Denitrification is a temperature-dependent process. Consequently, the performance of bioreactors at lower temperatures (below 10 °C) demonstrates lower NO3-N removal efficiency [21,22,23]. The possibilities of increasing the efficiency of bioreactors at lower temperatures have not been widely explored. Therefore, more knowledge is needed to promote the process at lower temperatures when the addition of relevant additives to woodchips can help to improve denitrification [6,24,25,26].
Biochar is a carbon-rich material produced during the pyrolysis process [27]. Due to its specific properties (e.g., high surface charge, high specific surface area, high micro-porosity and more), biochar has become a widely used material for environmental purposes [28]. Biochar is known to act as a reducing agent in chemical reactions [29], and therefore it could be an effective additive to enhance nutrient removal in woodchip bioreactors. Consequently, the main goal of this study was to determine whether woodchips amended with biochar can increase NO3-N and PO4-P removal in bioreactors treating tile drainage flow.
2. Materials and Methods
To assess the efficiency of NO3-N and PO4-P removal in tile drainage flow, three pilot-scale denitrifying bioreactors were built at the field laboratory of Agriculture Academy at VMU in Kaunas, Lithuania. One bioreactor (WW) was filled entirely with woodchips, while the other two (WAB-10 and WAB-20) were supplemented with a mixture of woodchips and 10% and 20% biochar by volume (v/v), respectively. The experiment was part of ongoing research [26,30] aimed at examining the suitability of denitrification bioreactors for tile water treatment.
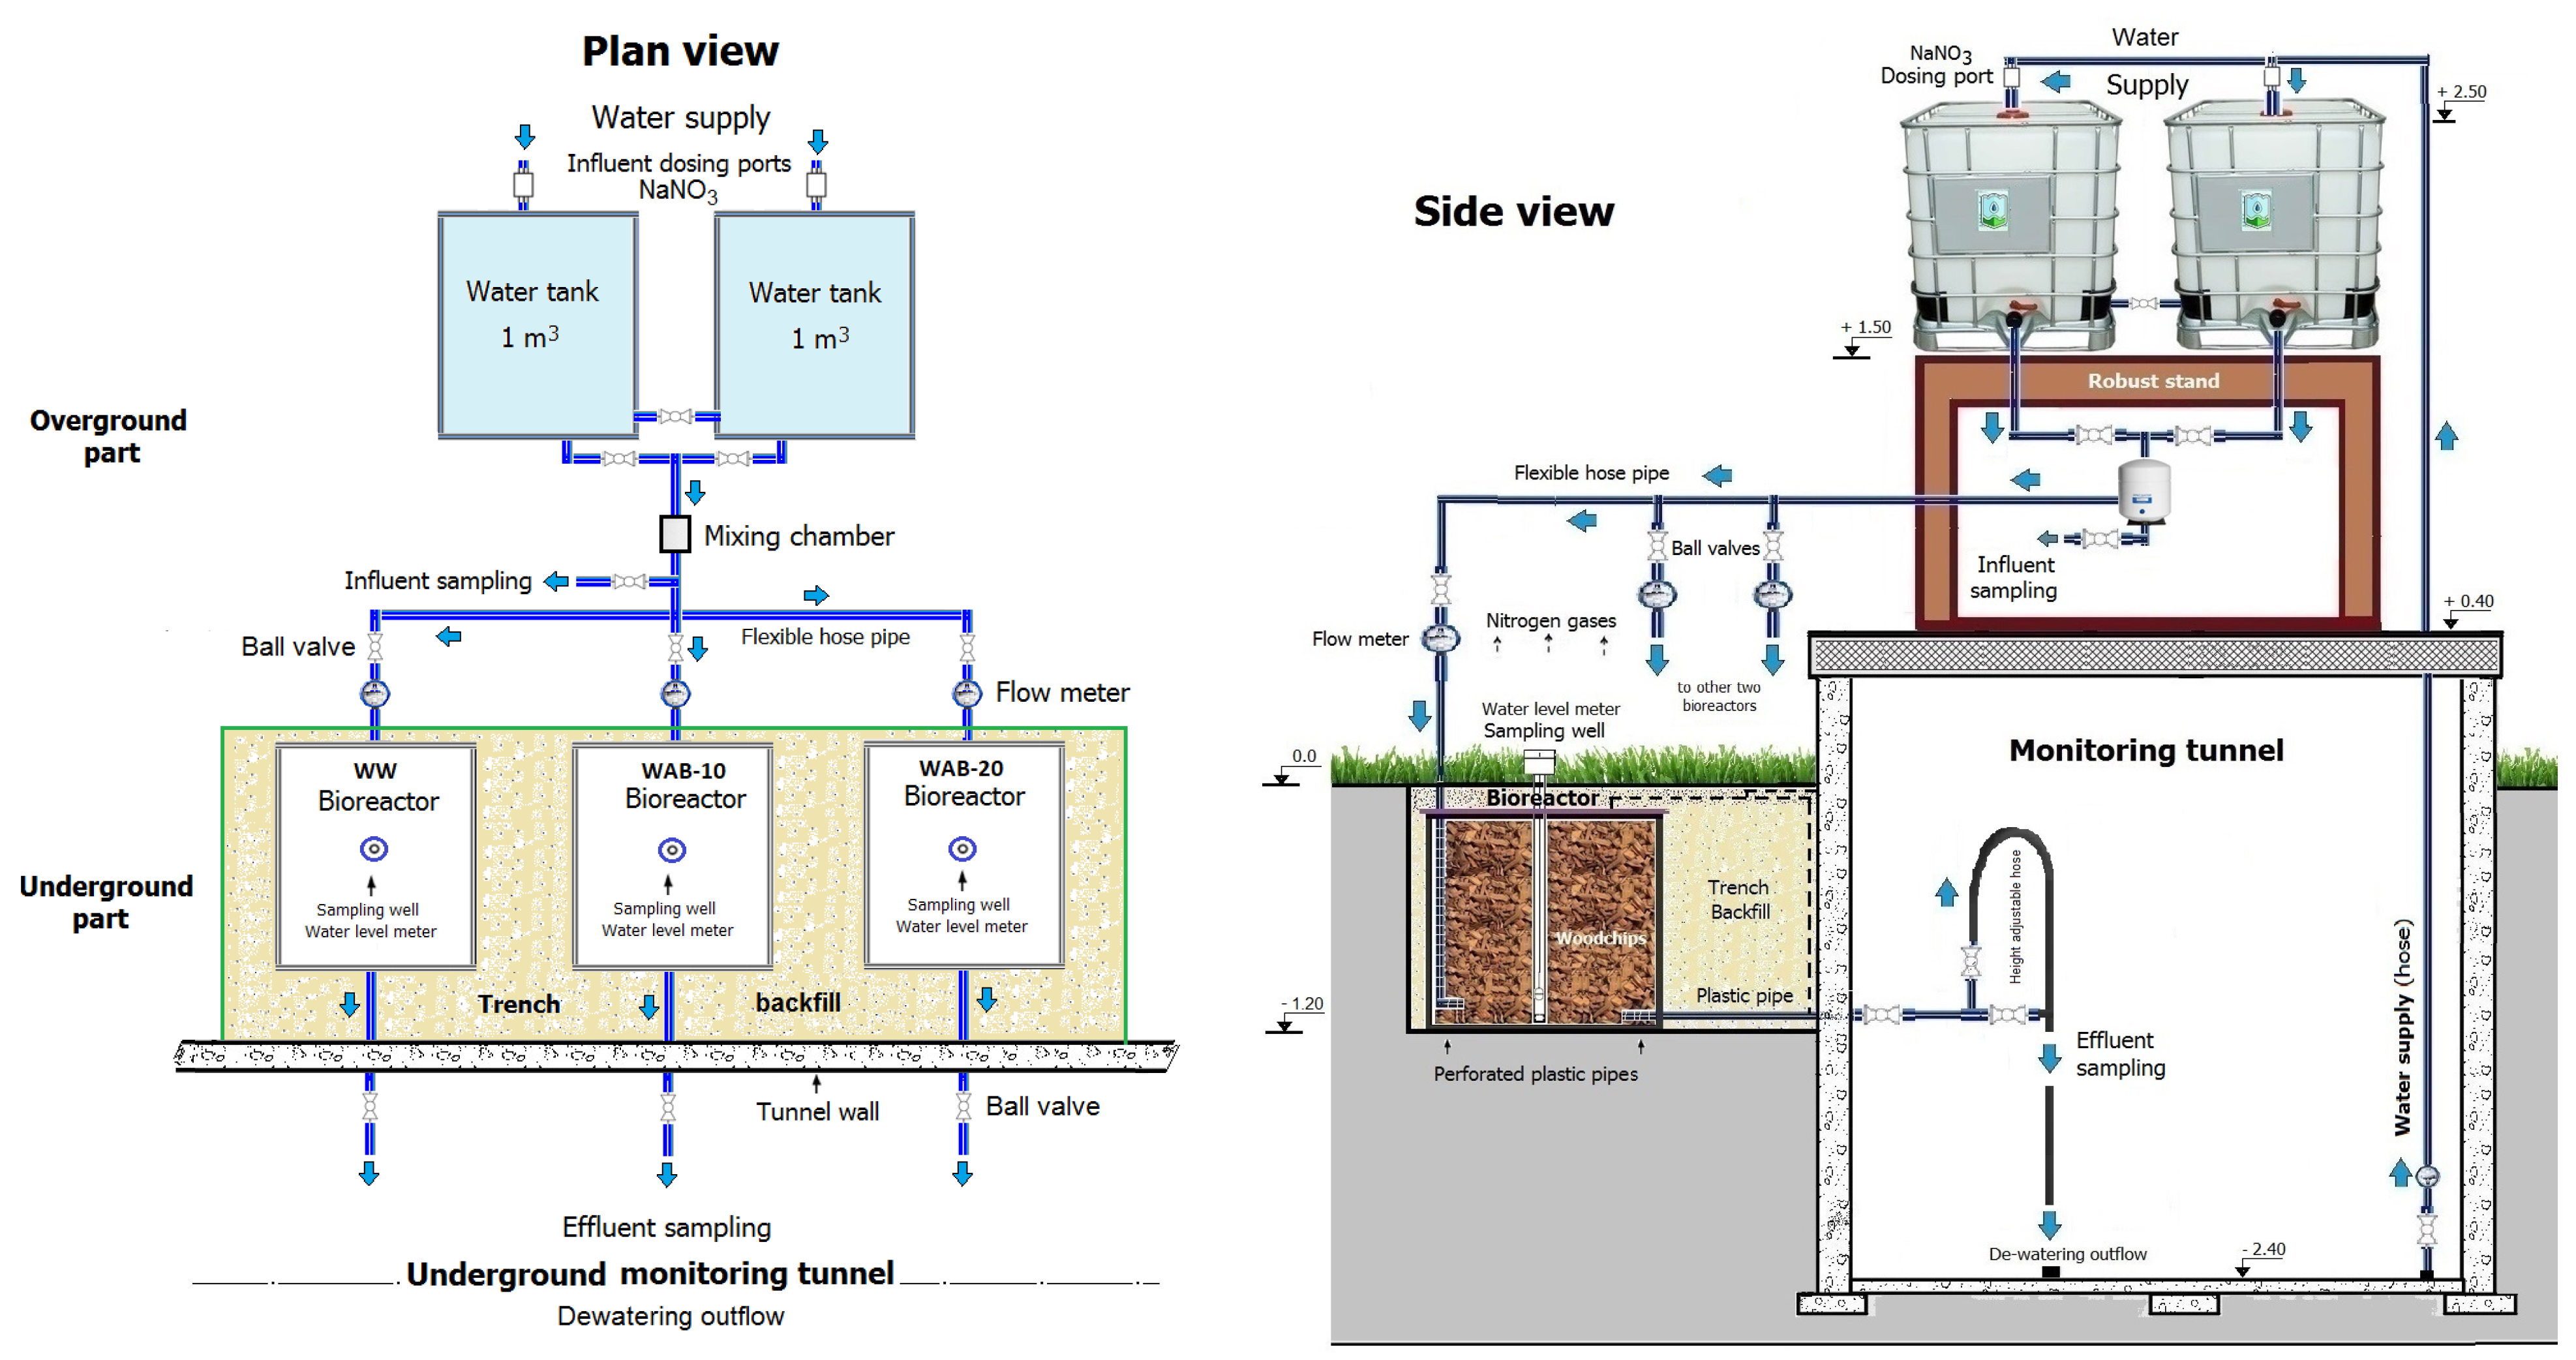
Each bioreactor was a 1.0 m3 plastic container (Figure 1) installed in a drainage trench and connected to two (1.0 m3 each) water supply tanks. Woodchips from alder (Alnus glutinosa) and pine trees (Pinus sylvestris) dominated the wood mixtures, with diameters ranging from 1.1 cm to 3.0 cm and with a bulk density of 260 kg/m3, whereas biochar made from deciduous wood at temperature 850 °C was a commercial product of FLUID® (Warzsawa, Poland). The particle size fraction of 0.825–2.0 mm had the highest (73.8%) mass fraction in biochar with a 3.1% ash content, 80.6% C content (dry weight), pH 8.3, porosity 0.70, bulk density 300 kg/m3, iodine number 250 mg/g, BET surface area 445 m2/g, 0.96% N, 0.10% total P, 664.8 mg/kg labile P2O5, 957.6 mg/kg total Fe, 0.52% total Ca, 0.13% total Mg and 0.03% S. According to Hassanpour et al. [29], the biochar was fresh because it was stored in sealed plastic bags and used after 2 weeks of production.
Each bioreactor was filled to 1.0 m depth, and a water level of 0.9 m was constantly maintained. The porosity (i.e., pore volume) in each bioreactor was determined by the method proposed by Christianson et al. [31]. Thus, in the WW bioreactor, the pore volume was 50%, while in the WAB-10 and WAB-20 it was 49% and 46%, respectively.
The NO3-N and PO4-P removal efficiency tests began on 5 May 2018. All bioreactors displayed strong erratic behavior (i.e., inconsistent NO3-N and PO4-P removal or release and soluble organic carbon flushing) within the first month following startup. Therefore, the findings in this article refer to the period from 21 June 2018, to 25 June 2021 (including winter months), with measurements taken at irregular intervals (from daily to weekly and even less frequently).
The experiment was designed to reproduce influent NO3-N and PO4-P concentrations measured in tile water under field conditions [32]. The bioreactors were fed NO3-N at concentrations ranging from 7.9 to 29.8 mg/L through the addition of NaNO3 to the water tanks. The PO4-P content in the influent was consistent with the typical tile drainage concentrations of 0.023–0.120 mg/L. The concentrations were changed each time according to the filling and emptying cycles of the water supply tanks. The changes were inconsistent, i.e., with each new filling, higher concentrations were followed by lower ones and vice versa. The inflow water temperature ranged from +1.8 to +21.7 °C, whereas the water temperature in the outflow ranged from +4.0 to +21.2 °C. Flow meters were used to record the water inflow to each bioreactor. Using valves, the inflow rates and different water retention times (i.e., flow rate and bioreactor pore volume estimations) were manually adjusted. The water (hydraulic) retention times were simultaneously kept the same for all bioreactors under the created steady-state flow conditions for different time intervals (1–3 h). Because drainage flow is highly variable, different retention times (2–12 h) were maintained to represent a wider range of runoff conditions [15].
Measurements (total n = 140) of pH, NO3-N, water temperature (T), dissolved oxygen (DO), total dissolved solids (TDS), and PO4-P (n = 58) were taken at the inlet, outlet, and inside the sampling wells. Concentrations of K, Na, HCO3, total Fe, Ca, Mg, and Cl in the effluents were also measured intermittently. NO3-N and PO4-P concentrations were determined using a MaxiDirect Photometer MD600 (Lovibond®, Amesbury, UK) with powder reagents. The DO and T were measured using a portable HI-9142 multimeter (Hanna® Instruments Ltd., Leighton Buzzard, UK). TDS values were determined using an HI-98136 m. The amounts of Ca, Na, K, and Mg were determined by the Dionex® ICS-1000 Ion Chromatography System (Sunnyvale, CA, USA), while HCO3 was determined using the potentiometric titration method. Total Fe was detected by the spectrophotometric method using ortho-phenanthroline. Bacterial communities and gaseous emissions were not analyzed.
NO3-N and PO4-P removal efficiencies (expressed as percentages) were calculated as the difference between inlet and outlet concentrations divided by inlet concentration. NO3-N removal rate (RR, expressed in g N/(m3·h)) was calculated as the difference between inlet and outlet concentrations during an event (i.e., the period when water flow is greater than zero) divided by the hydraulic retention time (i.e., the pore volume of the bioreactor divided by the flow rate).
The statistical significance of the differences between the analyzed variables in bioreactors with different fillers was evaluated using a non-parametric Kruskal-Wallis test (the normality assumption based on the Shapiro-Wilk test was not met) with post hoc analysis. A non-parametric Mann-Whitney test was used to examine the significance of the means in each pairwise comparison. Data that were 2.2⸱IQR (i.e., interquartile range) above the third quartile (75%) and below the first quartile (25%) were removed from the analysis. All statistical comparisons were performed using the software package PAST (version 3.14).
3. Results
3.1. Inflow Parameters Change
The Kruskal-Wallis test revealed no significant differences (p < 0.050) between the bioreactors in the change of concentrations of input T, DO, pH, TDS, NO3-N and PO4-P, and hydraulic retention time (HRT). Since the changes in these parameters were similar, it was assumed that the influent conditions in all bioreactors had the same effect on NO3-N and PO4-P removal.
3.2. The pH and Total Dissolved Solids
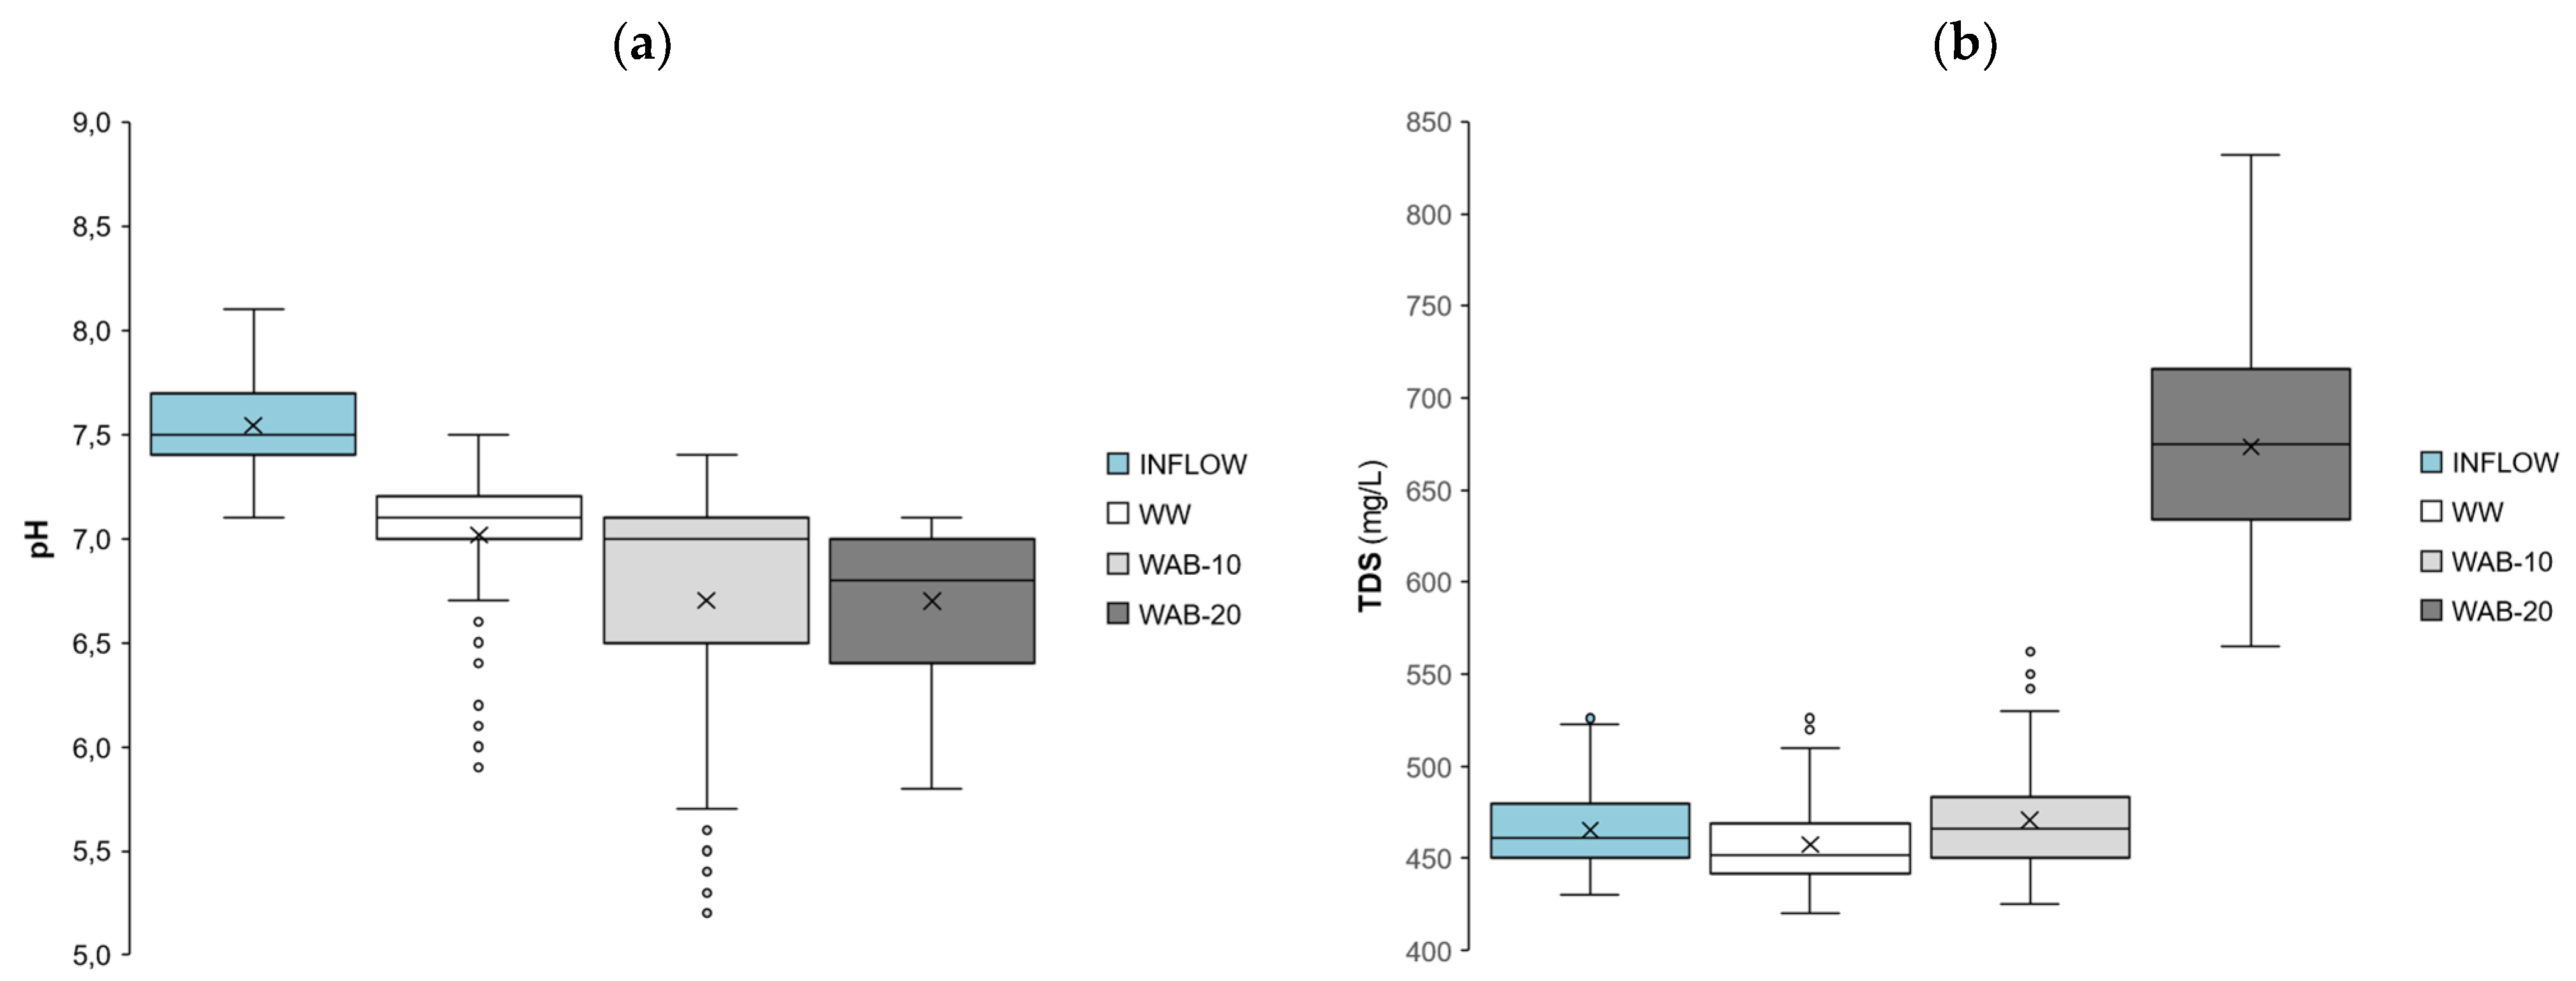
The pH of the influent ranged from 7.1 to 8.1 (average 7.6), while the pH of the water in the bioreactors ranged from 5.2 to 7.5. This showed that the medium was changing from neutral to slightly acidic (Figure 2a). In the WW, WAB-10, and WAB-20 bioreactors, the average pH was 7.0, 6.7, and 6.6, respectively.
In the WW bioreactor, pH values between 7.0 and 7.5 accounted for 78% of all readings, while pH values below 7.0 in the WAB-10 and WAB-20 bioreactors accounted for 41% and 74%, respectively. In the bioreactors containing biochar, pH values below 6.5 were measured in up to 26% of the cases, while in WW such an acid-prone environment was observed in only 9%. The results showed that pH was statistically different (p < 0.010) between bioreactors, indicating that neutral media was more prevalent in WW, while an acidic environment was predominant in the WAB-10 and WAB-20 bioreactors.
The pattern of total dissolved solids (TDS) between bioreactors (Figure 2b) was also statistically different (p < 0.001). At influent concentrations between 430 and 526 mg/L (average 466 mg/L), the highest TDS releases (between 565 and 832 mg/L with an average value of 674 mg/L) were observed in the WAB -20 bioreactor. TDS in WW and WAB-10 effluents changed from 420 to 530 mg/L (average 458 mg/L) and 425 to 563 mg/L (average 471 mg/L), respectively.
3.3. The NO3-N Removal
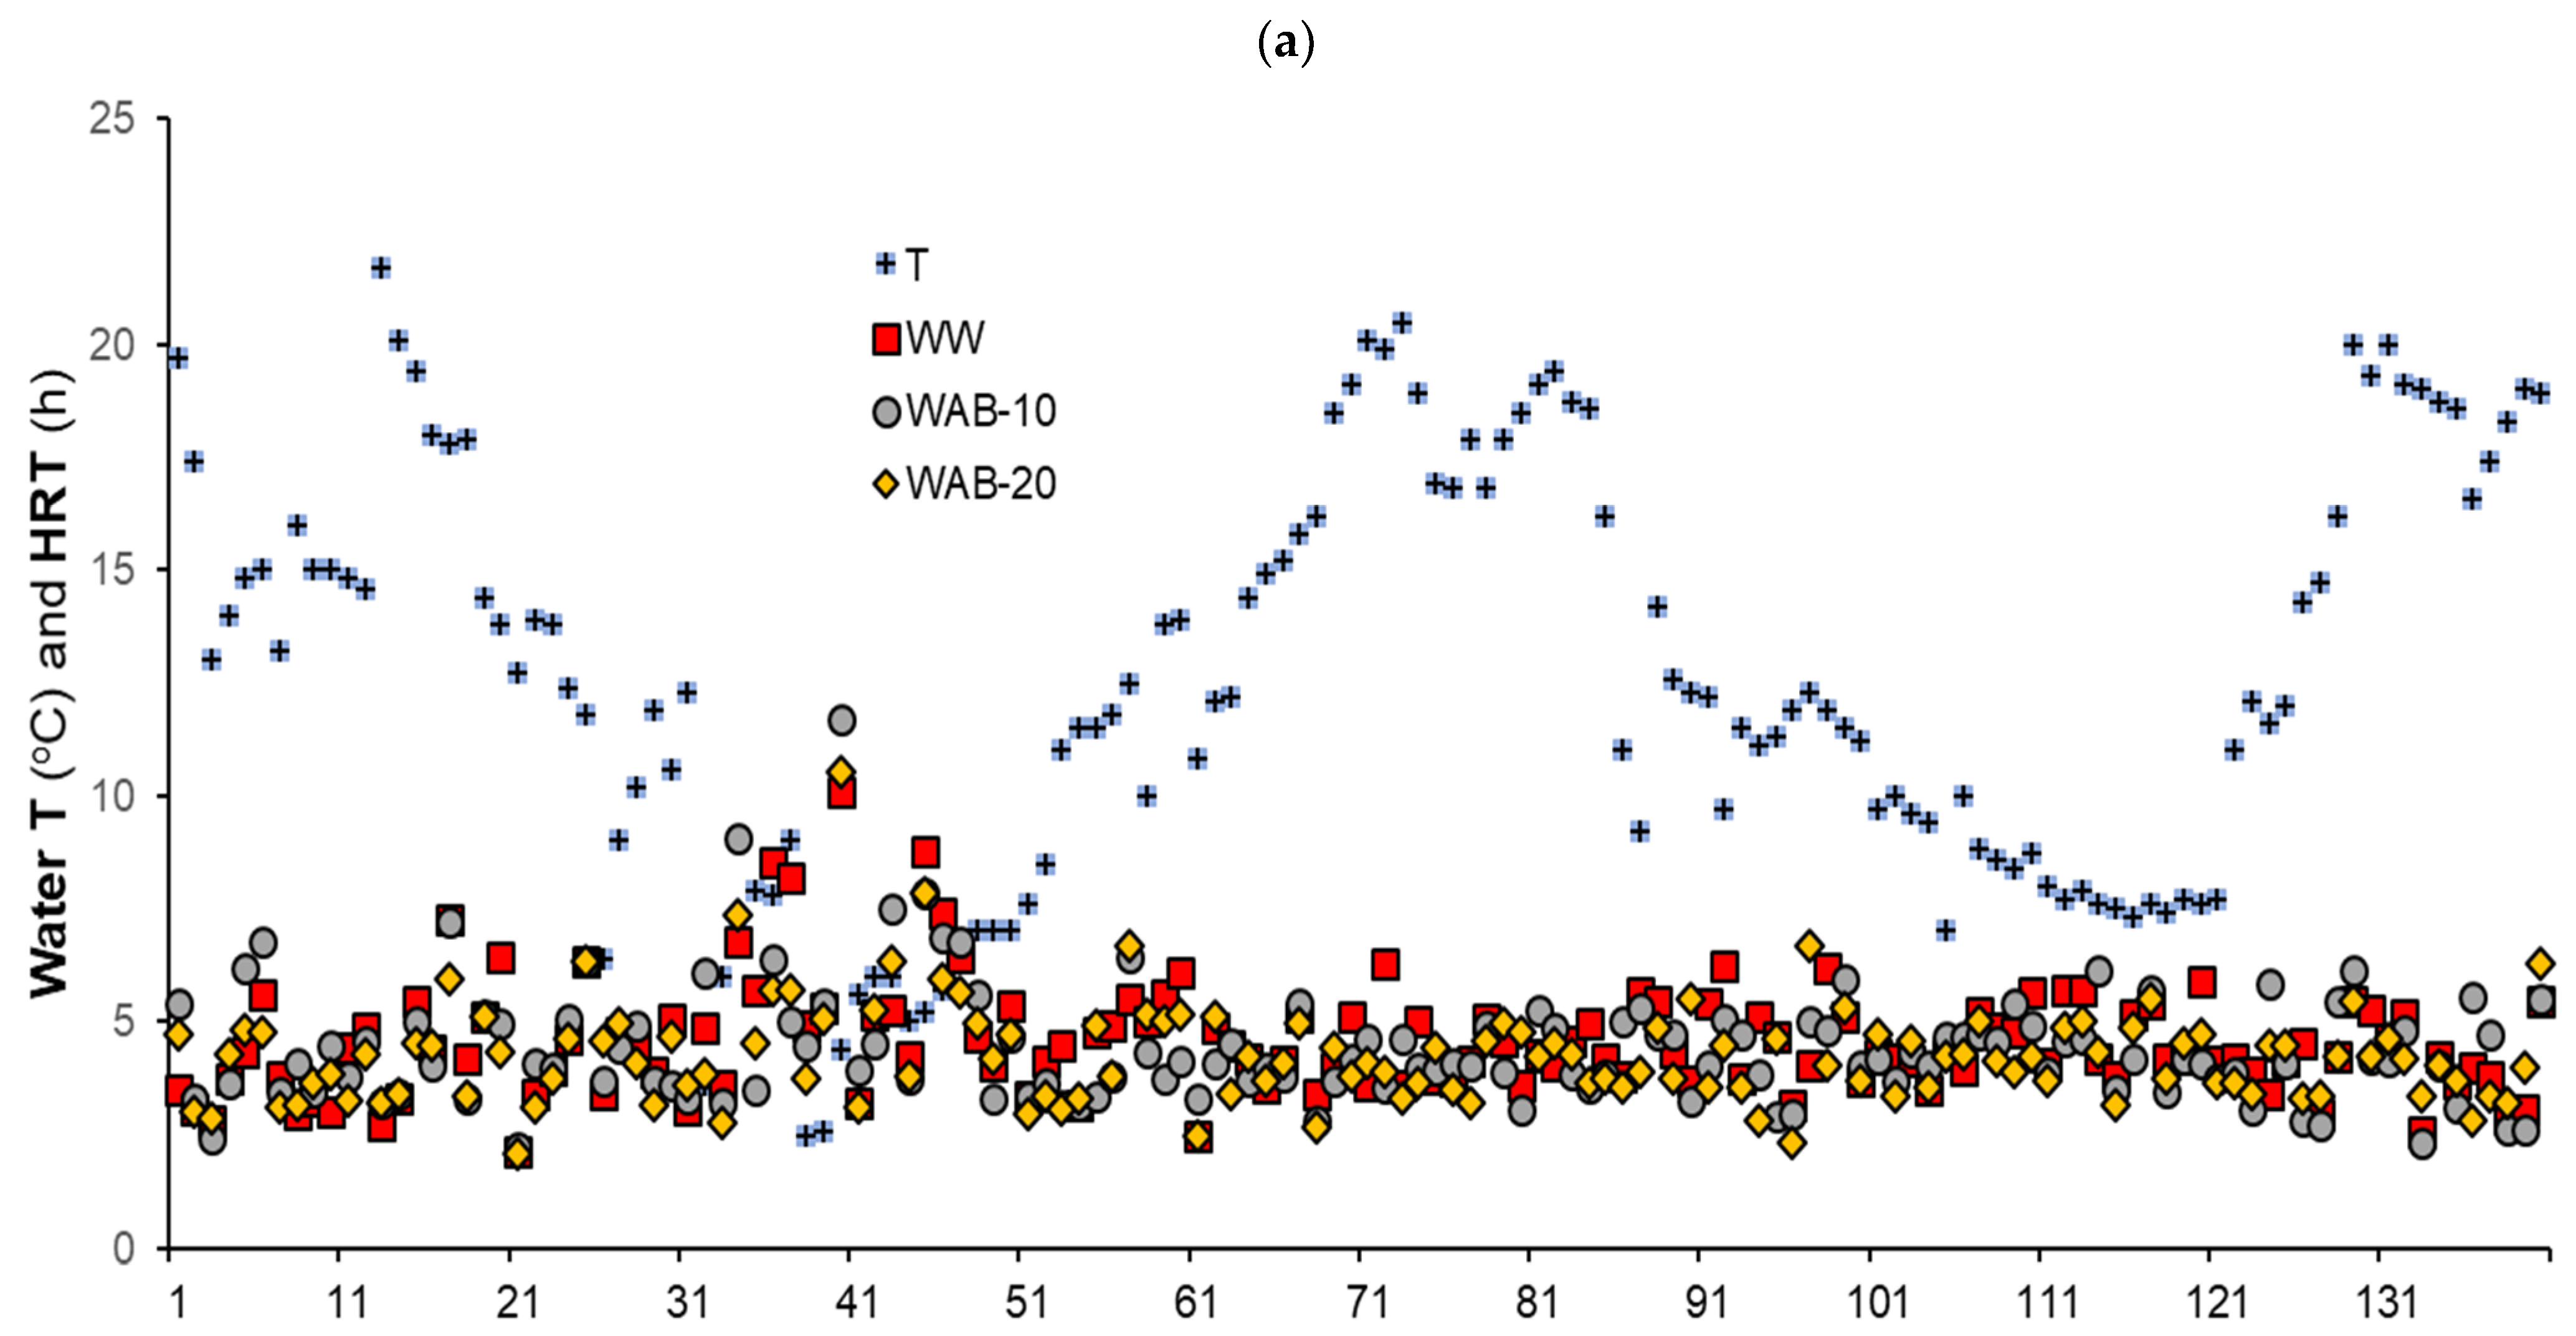
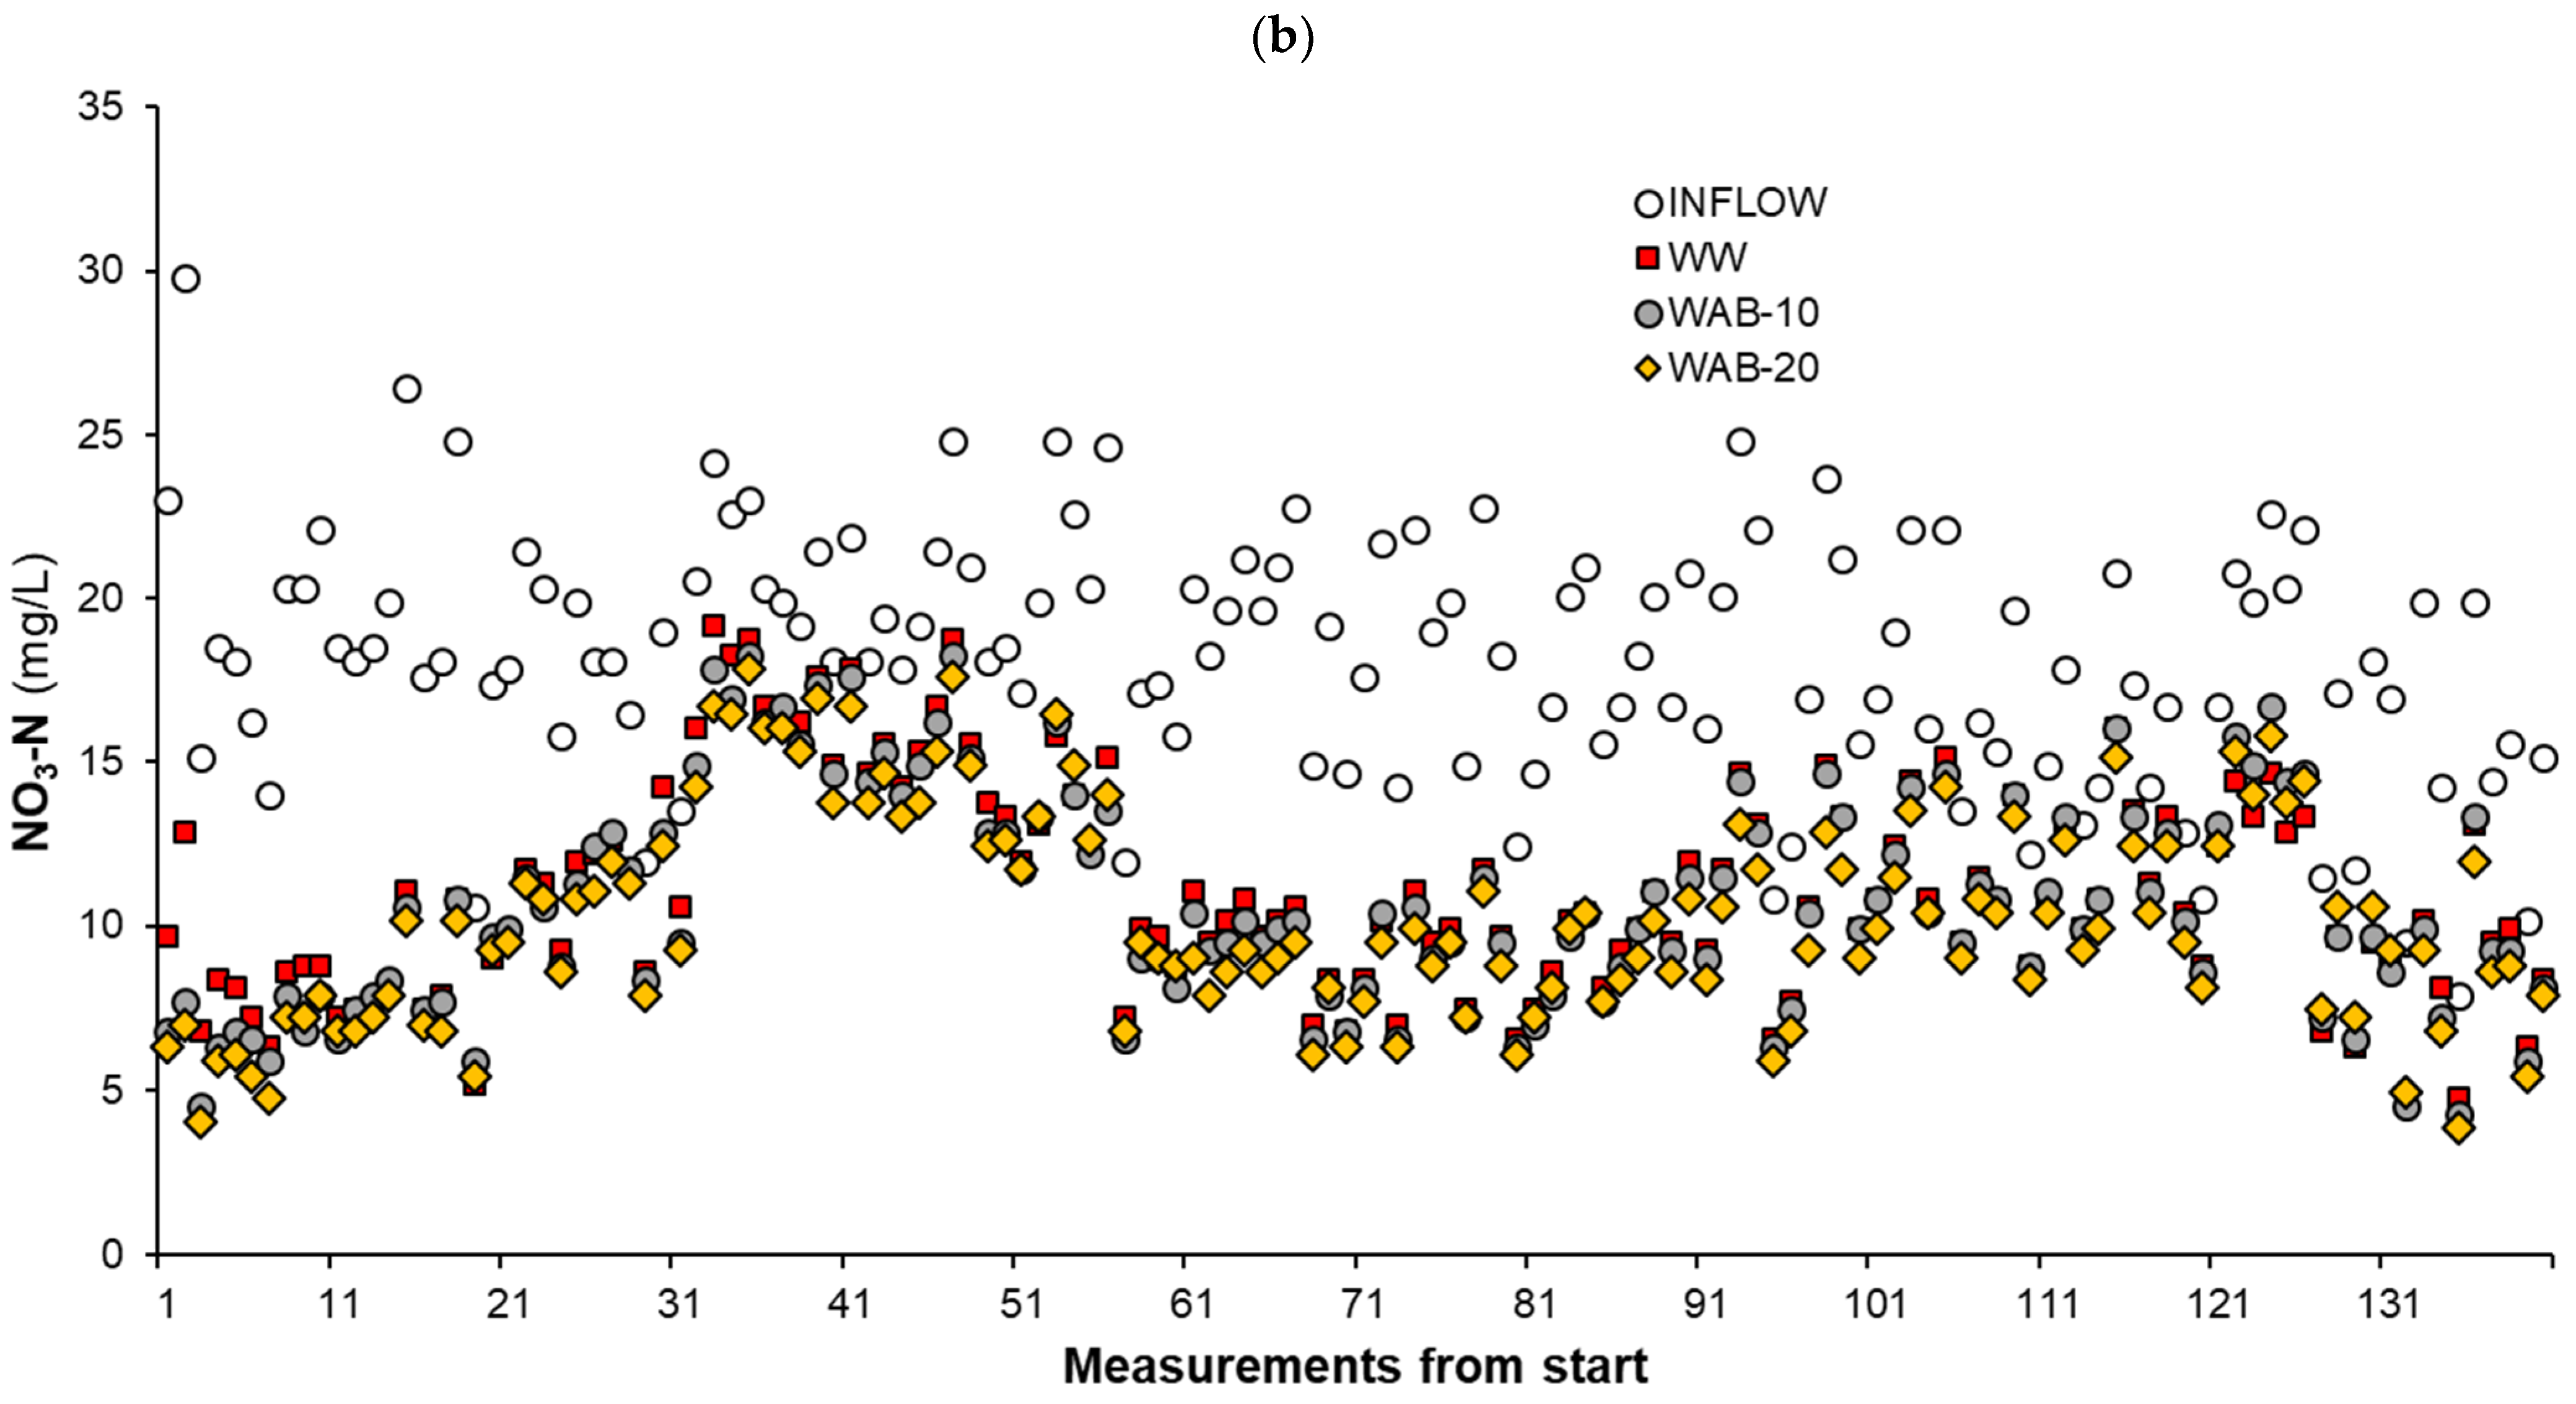
NO3-N was removed to varying degrees in all bioreactors. During the experiment, the HRT changed from 2.11 to 11.7 h, with concentrations of DO ranging from 3.1 to 4.9 mg/L at the inlet and 0.0 to 1.5 mg/L at the outlets, respectively. Low DOs indicate that an anaerobic environment was consistently maintained. NO3-N concentrations in the influent during an event ranged from 7.9 to 29.8 mg/L (Figure 3), with NO3-N removal efficiencies ranging from 15.3 to 76.6% and removal rates from 0.35 to 4.58 g N/(m3·h) (Table 1). The average RR changed from 1.70 to 2.0 g N/(m3·h), with the average NO3-N removal efficiency changing from 39.2 to 44.0%. In the bioreactor with 20% v/v biochar (WAB-20), NO3-N removal was higher (p < 0.030) for both characteristics than in the other two.
3.4. NO3-N Removal vs. Water Temperature
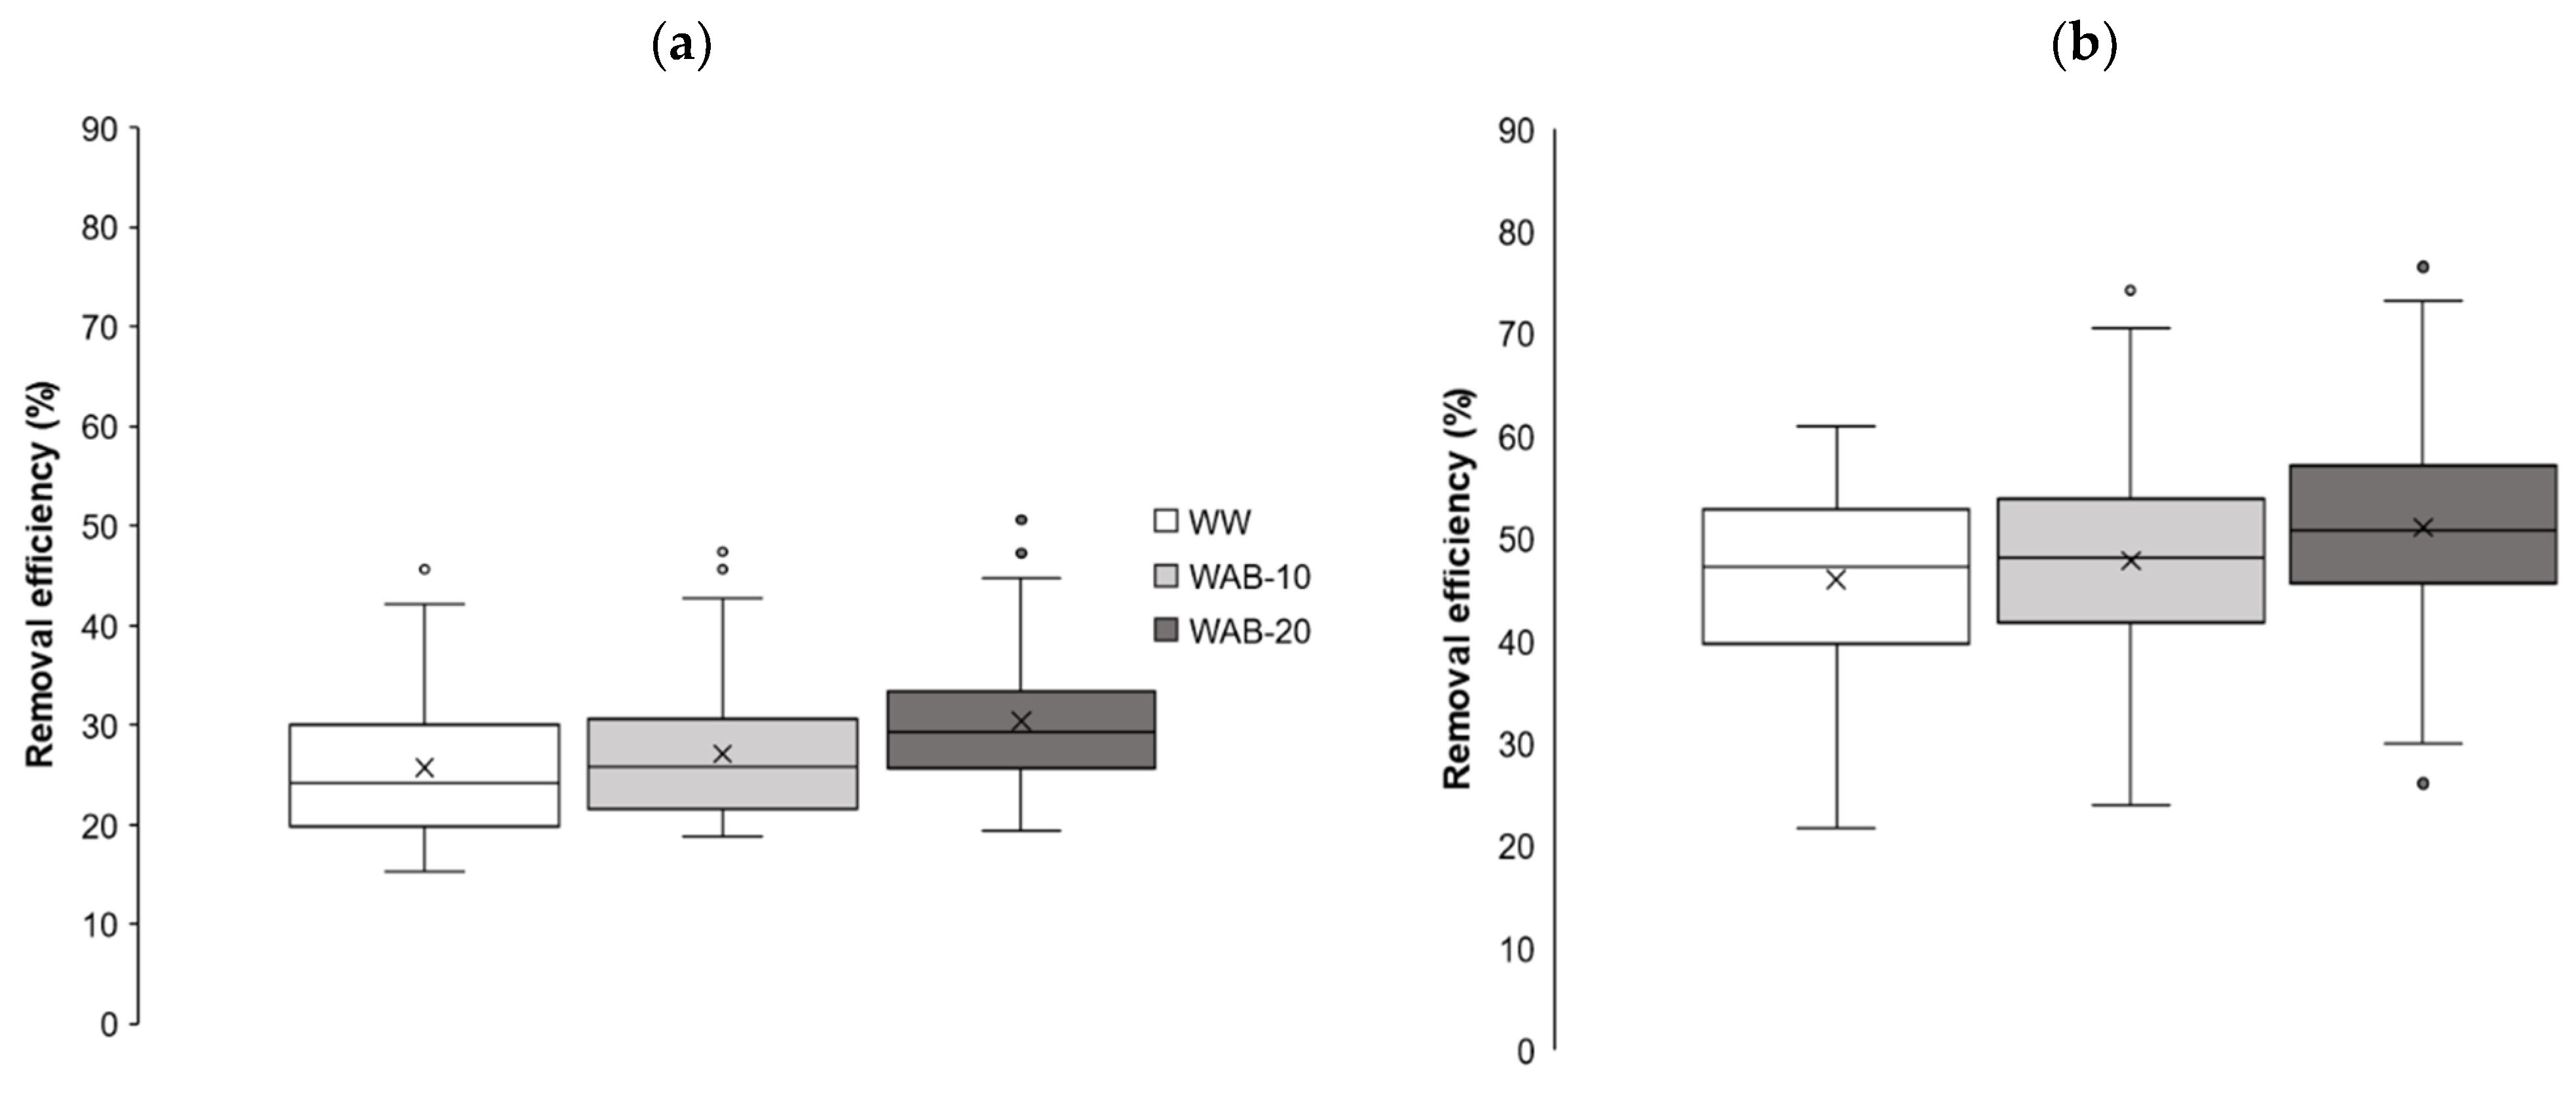
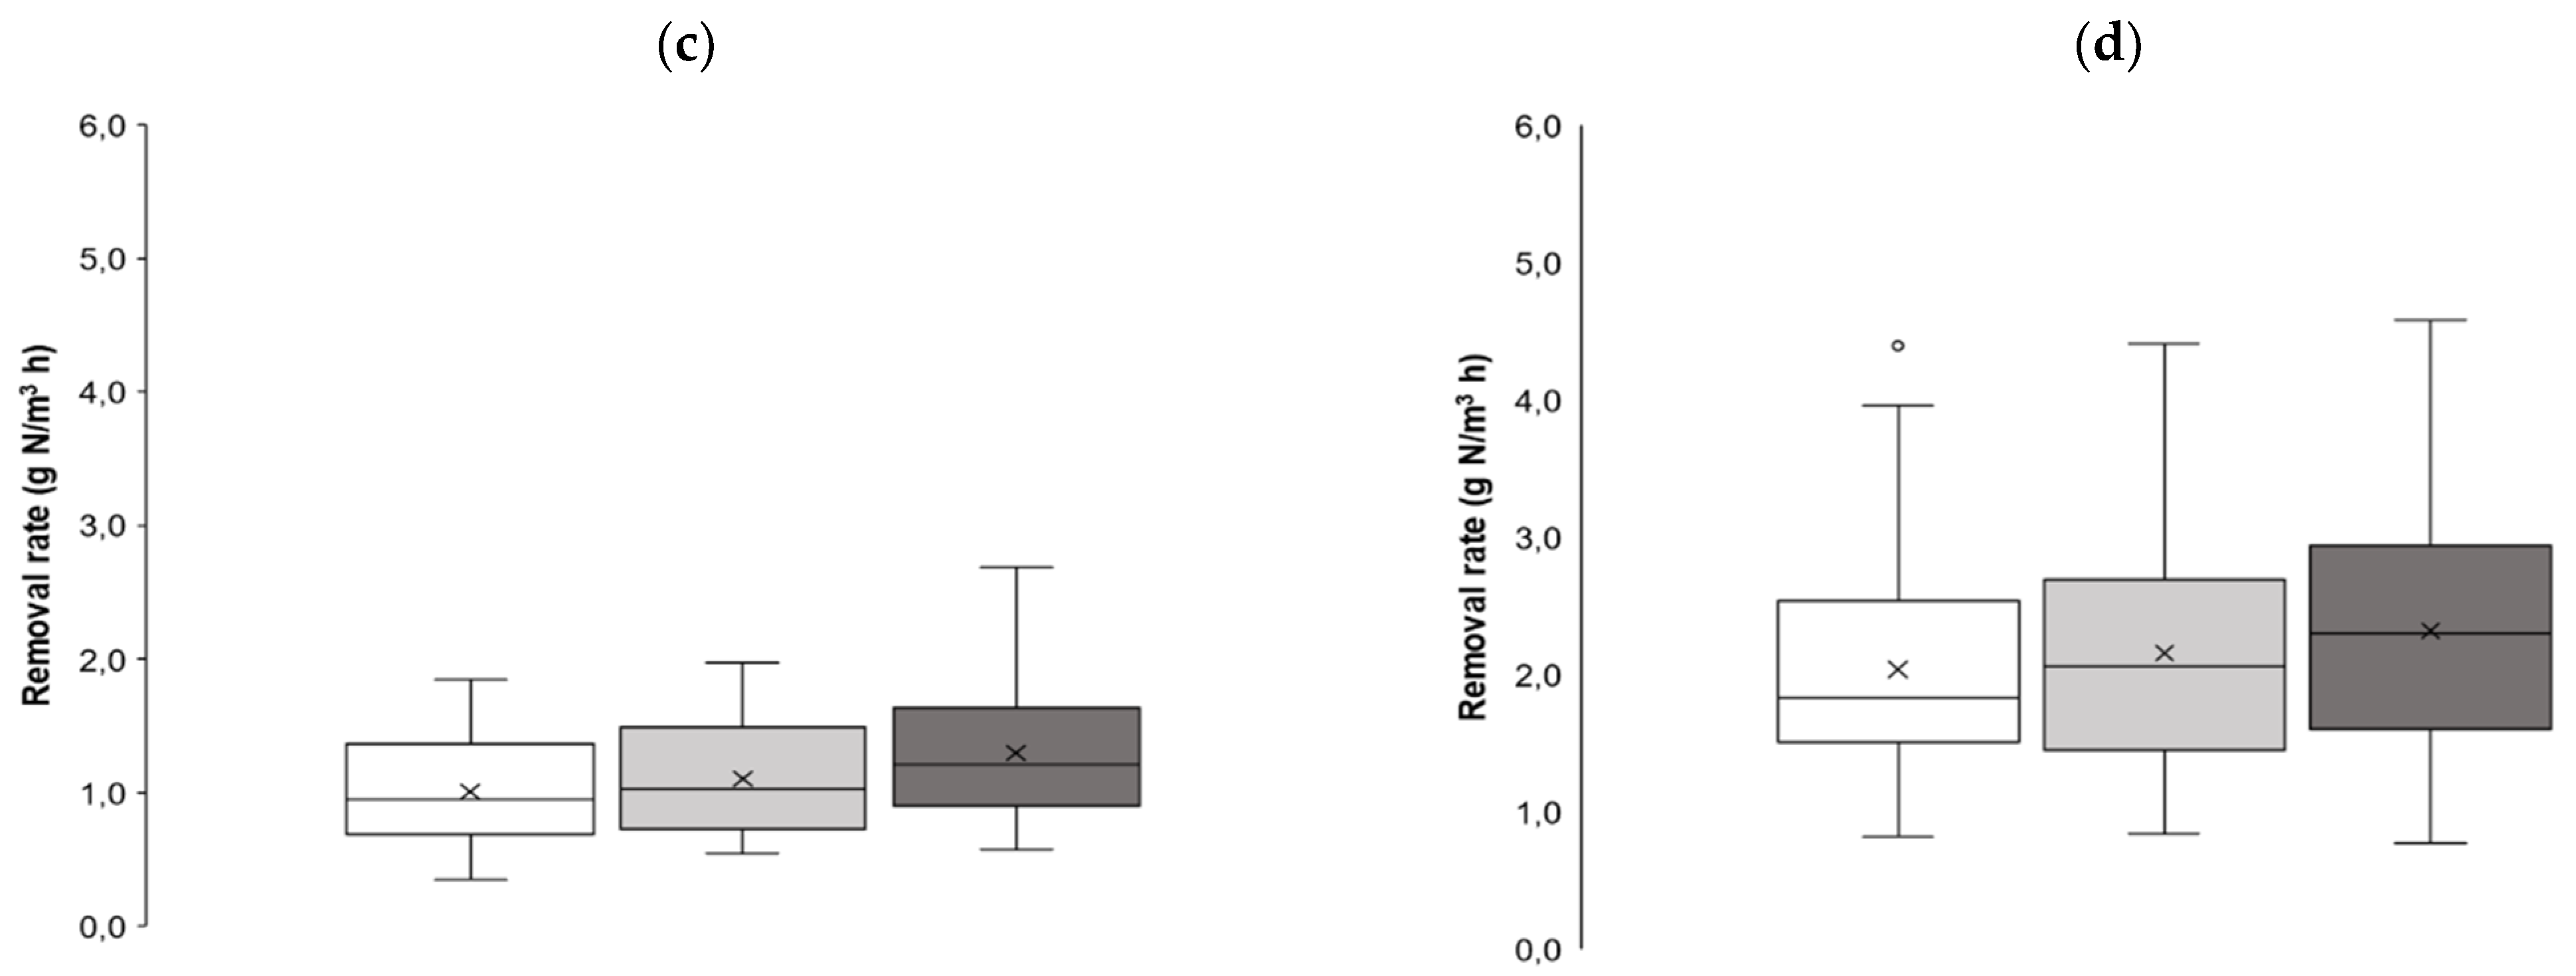
The temperature of the inflow water affected NO3-N removal (Figure 3). At low temperatures (i.e., below 10.0 °C which are the predominant tile water temperatures from late autumn to early spring), significant differences (p < 0.010) were found between bioreactor WAB-20 and the other two bioreactors. No significant differences were observed between the WW and WAB-10 bioreactors. At temperatures above 10 °C, significantly higher (p < 0.030) NO3-N removal was found only in the WAB-20 compared to the WW. Figure 4 shows NO3-N removal efficiencies and rates at different water temperature intervals.
The average removal efficiencies in the WAB-20, WAB-10, and WW bioreactors were 30.4%, 27.1%, and 25.7%, respectively, at a temperature range of 0.0–10.0 °C. At temperatures above 10.0 °C, the WAB-20, WAB-10, and WW bioreactors had average removal efficiencies of 51.1%, 47.9%, and 46.0%, respectively.
At both temperature intervals, the NO3-N removal rate was significantly higher (p < 0.030) in bioreactor WAB-20 than in bioreactor WW (Figure 4c,d). There were no significant differences in RRs between WAB-20 and WAB-10 and between WW and WAB-10. Removal rates in bioreactors WW, WAB-10, and WAB-20 changed from 0.35 to 2.70 g N/(m3·h) when the inflow temperature was between 0.0–10.0 °C, with average values of 1.01, 1.11, and 1.30 g N/(m3·h), respectively. However, at temperatures above 10.0 °C, much higher RRs were observed, ranging from 0.82 to 4.58 g N/(m3·h), with average values of 2.04, 2.16, and 2.36 g N/(m3·h), respectively. Based on a large meta-analysis using data from field-scale studies performed across the world, Christianson et al. [9] reported NO3-N removal rates in the order of 5.1 g N/(m3·d) (median; mean ± SD: 7.2 ± 9.6 g N/(m3·d)) for a variety of hydraulic, water temperature, and inflow concentration conditions. The higher removal efficiency and RR in the WAB-20 bioreactor under both inflow water temperature conditions could be the result of adding 20% biochar.
3.5. The Behavior of PO4-P
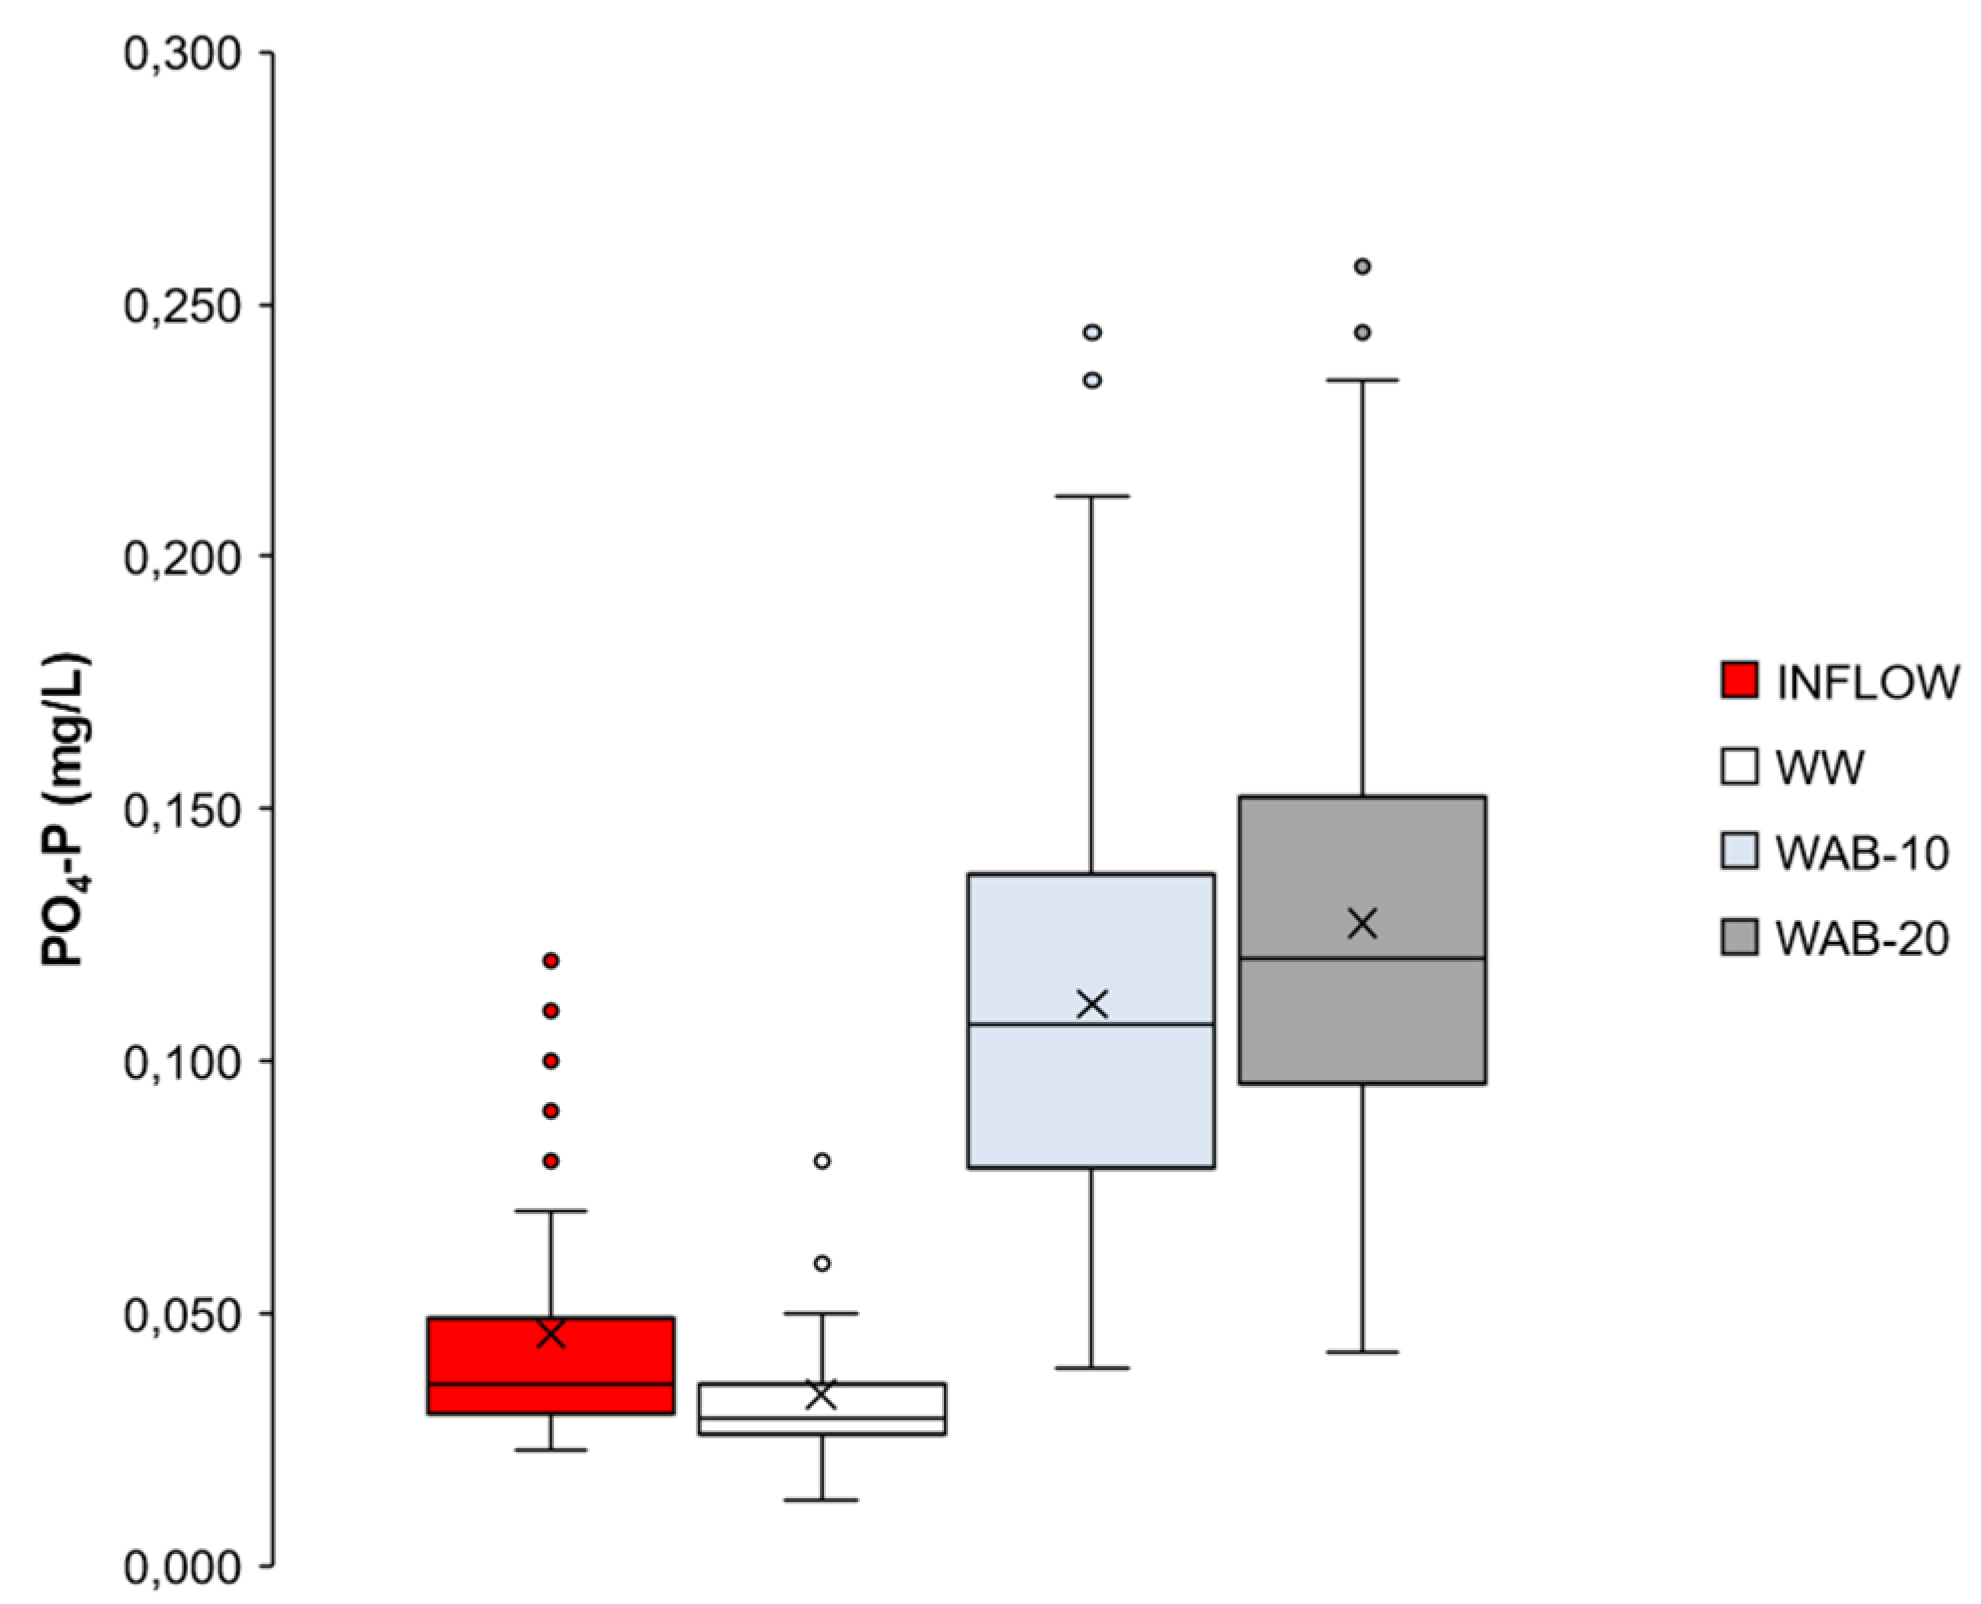
Both removal and release of PO4-P were observed in bioreactors containing different fillers. However, only bioreactor WW demonstrated PO4-P removal with concentrations at the inlet varying from 0.023 to 0.120 mg/L (average 0.046 mg/L) and being higher (p < 0.001) than those at the outlet, which ranged from 0.013 to 0.080 mg/L with an average value of 0.034 mg/L (Figure 5). Consequently, between 9.1% and 50.1% of PO4-P was removed (average 25.3%) in the effluent of WW. In contrast to NO3-N removal, the inflow water temperature did not significantly affect the removal of PO4-P at both temperature intervals. The removal of PO4-P ranged from 9.1 to 50.1% when the temperature was between 0.0–10.0 °C while above 10 °C it ranged from 9.0 to 45.5% with average values of 25.0% and 25.6%, respectively. It was likely that PO4-P removal in bioreactor WW occurred through the formation of calcium phosphate precipitates [33,34]. The PAOs (i.e., PO4-P accumulating organisms) may also contribute to the removal [35]. Moreover, complex chemical reactions could also form strong precipitates of Fe-phosphates [36].
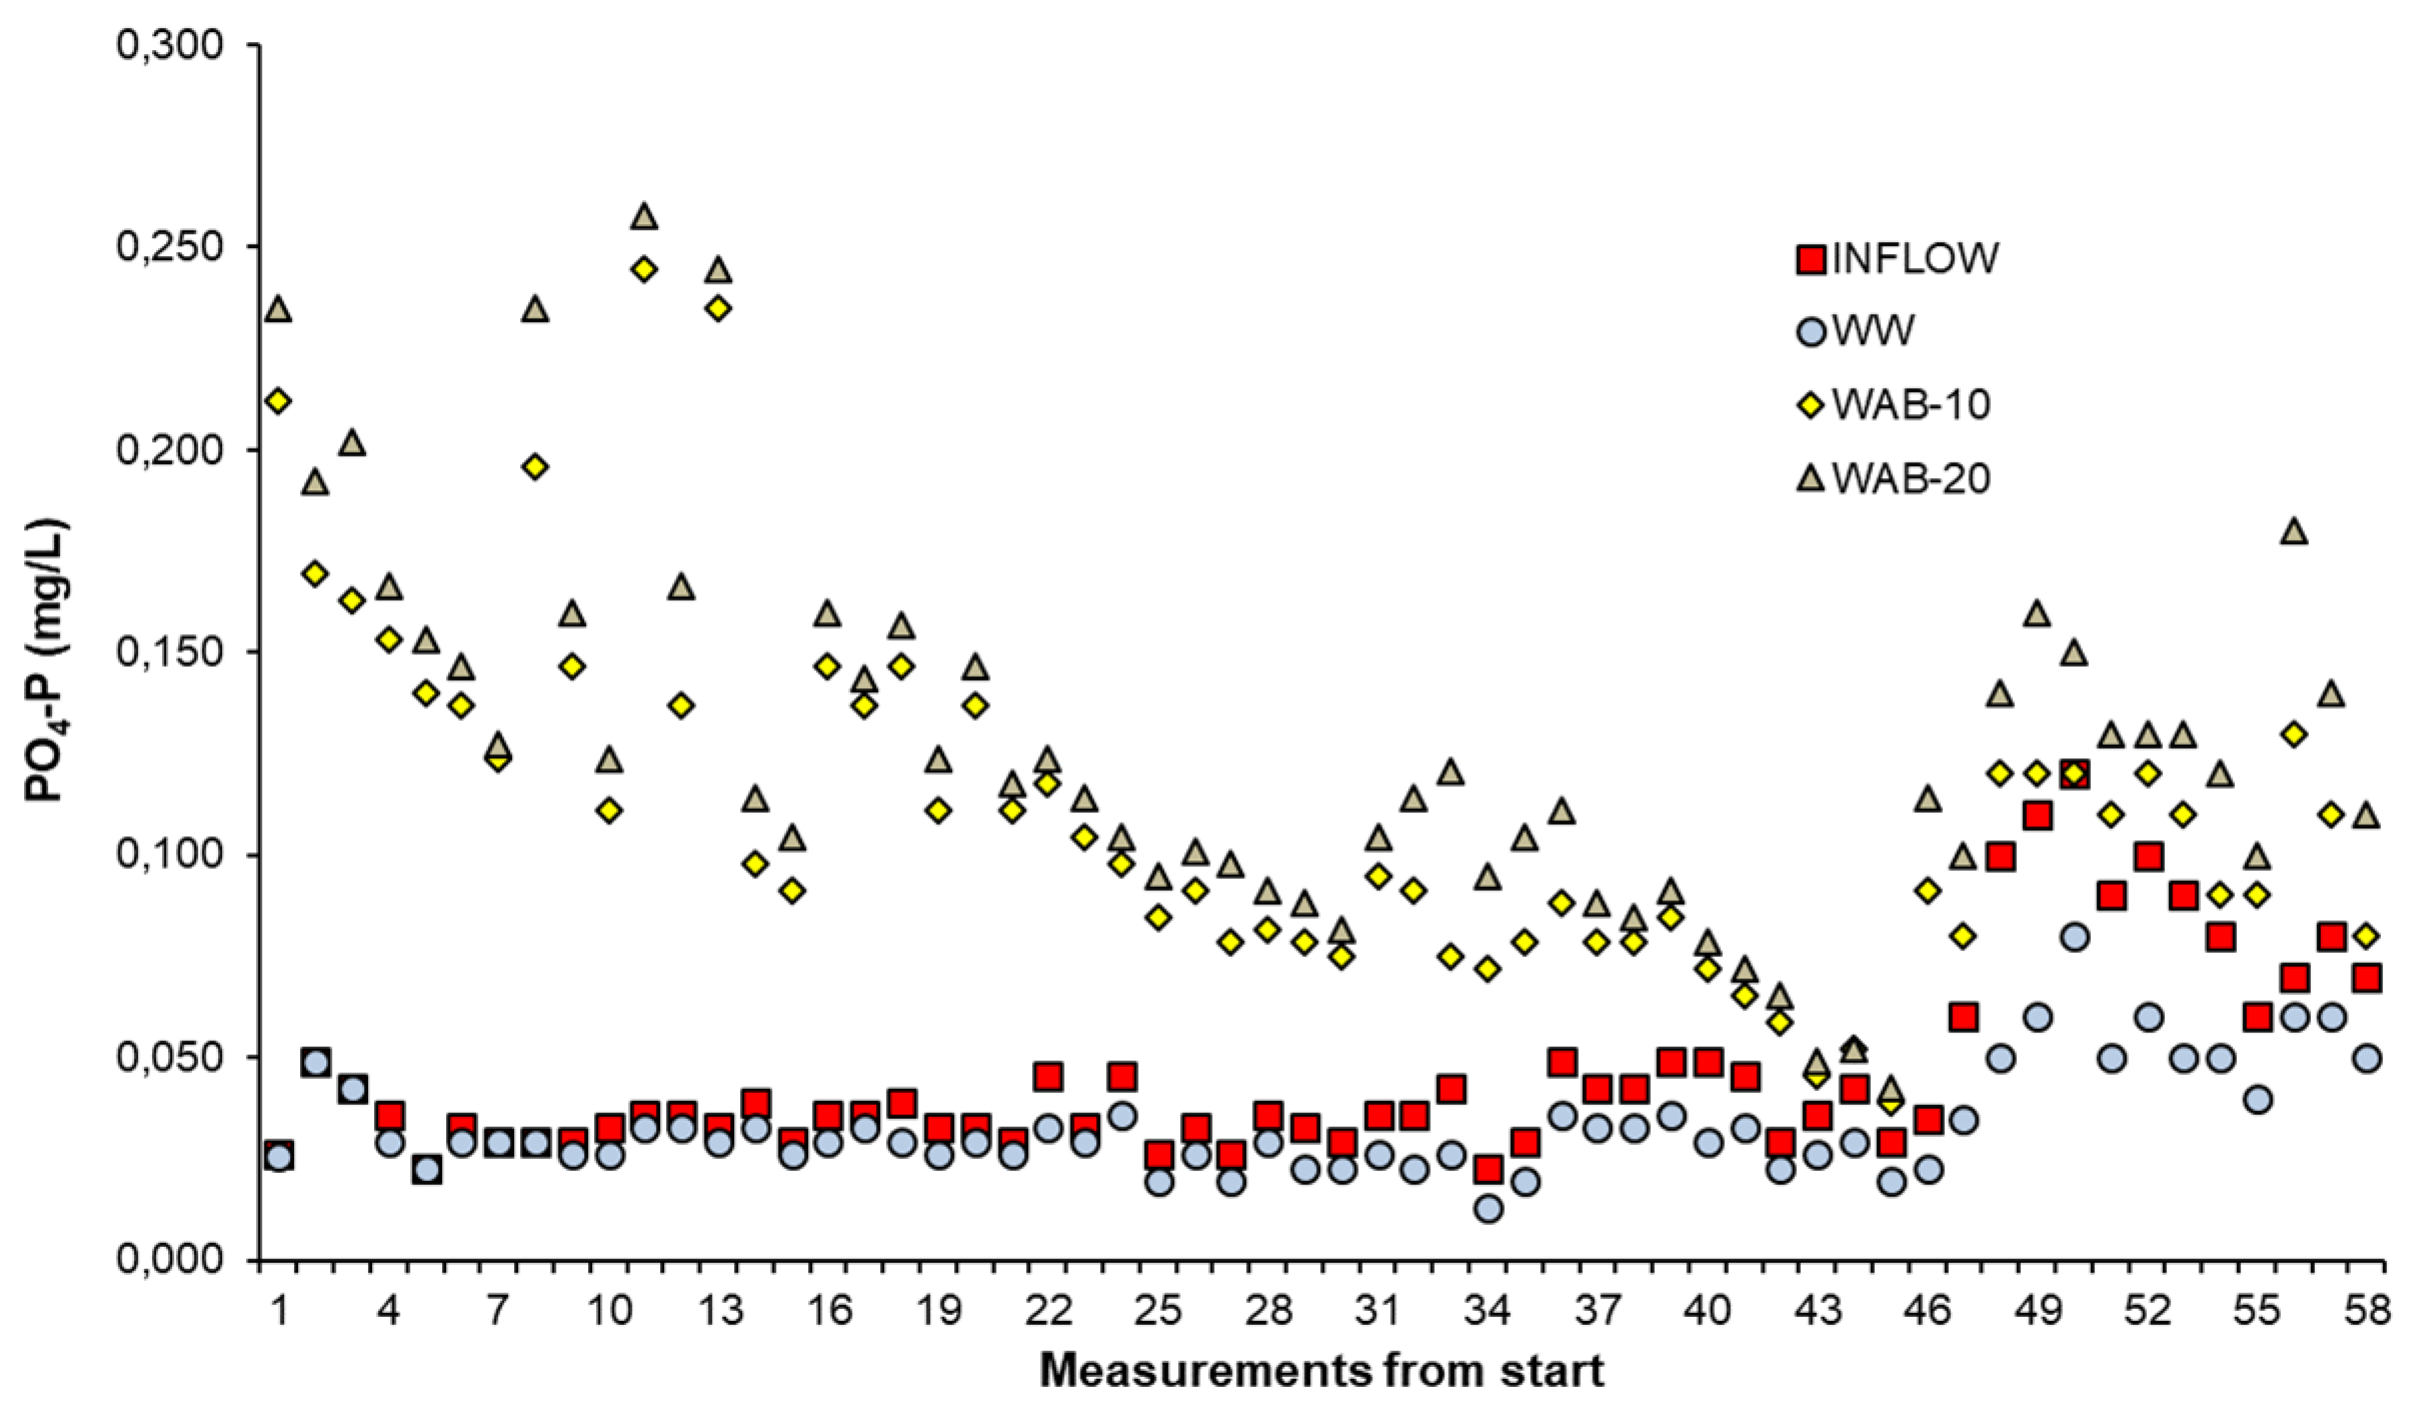
In contrast to the WW bioreactor, the PO4-P effluents from the bioreactors containing biochar were up to three times higher than the influents (Figure 5). The PO4-P in the effluents of the WAB-10 and WAB-20 bioreactors ranged from 0.039 to 0.258 mg/L and was higher (p < 0.001) than in the WW effluents. A particularly high PO4-P concentration in the effluents was observed after startup when it reached the peak values of 0.720–2.50 mg/L (data not shown). Later, they began to decrease, but never fell below influent levels. However, whenever the PO4-P inflows increased significantly, high PO4-P outflows were again observed (Figure 6).
Compared to the PO4-P effluents from the WAB-10 bioreactor, the effluents from the WAB-20 were on average 9% higher and their pattern of change was significantly different (p < 0.020). Most likely, the release of P-bound composites present in the biochar caused the increase in PO4-P in the effluents [37]. The abundance of PO4-P in the WAB-10 and WAB-20 bioreactors was in continuous equilibrium between the PO4-P removal capacity and the extraction of PO4-P from the biochar. Obviously, the PO4-P removal capacity was always lower than the total release from the biochar and the PO4-P in the influent. Therefore, the behavior of PO4-P in biochar-amended bioreactors suggests that its release is a complex and variable process that can take a long time and, unlike expectations, may lead to long-lasting adverse effects.
4. Discussion
The results showed that water temperature in the inflow significantly affected NO3-N removal in bioreactors. Nevertheless, the bioreactor amended with 20% v/v biochar (WAB-20) demonstrated higher NO3-N removal at lower (below 10 °C) and higher temperatures (above 10 °C) compared to the woodchip-only bioreactor. No significant differences were observed in the bioreactor (WAB-10) to which 10% v/v biochar was added. Oliveira et al. [38] and Coleman et al. [39] also found that the addition of biochar to woodchips can increase NO3-N removal. Their findings generally agree with our results.
It was likely that enhanced microbial activity due to the addition of biochar contributed to higher NO3-N removal. According to Gao and DeLuca [40], Cayuela et al. [41] and Weldon et al. [42], biochar can modify and promote microbial activity. In addition, biochar produced at higher temperatures (560–800 °C) can support higher denitrification than that produced at low temperatures (372–416 °C). Biochar has shown to be a suitable environment for various microorganisms to colonize its surface [43,44,45]. Therefore, it is likely that biochar, due to its specific properties, is a relevant medium for the growth of heterotrophs with subsequent enhancement of denitrification. According to Heaney et al. [46] and Mehrabinia and Ghanbari-Adivi [47], greater NO3-N adsorption on biochar was also possible due to the acidic (pH < 7.0) environment (i.e., released organic acids and CO2 from enhanced bacterial respiration), which was consistently observed in the WAB-20 bioreactor.
The higher WAB-20 efficiency obtained at low temperatures (below 10 °C) was probably the result of the greater potential of biochar to attach and retain more labile organic compounds as an energy source necessary for bacterial activity at lower temperatures. This assumption is supported by the work of Schreiber et al. [48], Lehmann and Joseph [49], and Choi et al. [50], who reported about much higher adsorption of organic carbon at lower temperatures, while Porter et al. [51] demonstrated gene abundance along with denitrifying bacterial community composition at lower temperatures. Jang et al. [52] identified the microorganisms that support denitrification at low temperatures. This suggests that biochar-amended woodchips make NO3-N removal more efficient at low temperatures. However, recent studies show that chemisorption of oxygen by biochar can also affect NO3-N removal. According to Hassanpour et al. [29], due to oxygen chemisorption, oxidized biochar (e.g., exposed to atmospheric oxygen for 2.5 years) can reduce NO3-N removal by 9–13%. They found that fresh biochar can increase denitrification by chemisorbing oxygen, while oxidized biochar can reduce denitrification by functioning as an electron acceptor. Therefore, in the current experiment, it was likely that biochar chemisorbed oxygen was present in the influent water, resulting in NO3-N reduction. Although the experiment did not show a downward trend (based on the Mann-Kendall test) in NO3-N removal in any of the bioreactors, Hassanpour et al. [22,29] reported that biochar may lose efficacy due to aging (e.g., after the 1st year or in the 6th year). It is, therefore, to be expected that the continuation of the experiment will provide more knowledge and show a more reliable effect of the biochar.
The results also showed that the bioreactor with woodchips only (WW) can reduce PO4-P in the outflow by 25.3% on average. Rivas et al. [10], Gottschall et al. [53], Dougherty [54], and Husk et al. [55] reported PO4-P reduction of 23–89%, while Zoski et al. [56] achieved only 11% PO4-P removal using wood shavings. PO4-P removal might be related to the formation of Ca-phosphate precipitates [33]. This presumption is based on the results of van Rijn et al. [34], who determined the overall process of how heterotrophic activity leads to an increase in net alkalinity and CaCO3 formation. Therefore, it was very likely that the WW bioreactor acted as a sink for PO4-P due to the higher availability of Ca with subsequent formation of Ca-bound precipitates. This is supported by the fact that the amount of Ca observed at the outlet was always higher (up to 34%) than at the inlet. Furthermore, the absence of a significant difference in PO4-P removal at both temperature intervals suggests that PAOs (e.g., Accumulibacter phosphatis spp.) could also take over PO4-P uptake [35,57,58]. It is known [59] that PO4-P uptake by PAOs is faster under aerobic conditions, but some of the PAOs can also accumulate phosphorus under anoxic conditions. The PAOs might even be the dominant bacteria in the microbial community at low temperatures [60]. Erdal et al. [61] reported that P removal in EBPR systems (i.e., enhanced biological phosphorus removal) was higher at lower temperatures because PAOs are psychrophilic microorganisms. Moreover, the systems performed better due to the proliferation of PAOs in anoxic zones. All this presumes that woodchips alone have the potential to remove PO4-P in addition to NO3-N removal, but the removal mechanisms should be further investigated.
However, the addition of biochar to woodchips resulted in large releases of PO4-P along with increased amounts of total Fe, Cl, Na, Ca, Mg, and K. Effluent concentrations of K, Mg, Ca, Na, and Cl in the WAB-10 and WAB-20 bioreactors were 4 to 200% higher than in the WW bioreactor. The largest differences (up to 6-fold higher concentrations) were observed in the total Fe release pattern. This implies that the mentioned inorganic elements were extracted from the biochar. These extractions, together with the negatively charged colloids and the higher (up to 41%) release of HCO3, also resulted in significantly higher TDS concentrations (Figure 2b) in the WAB-20 bioreactor. Potentially, biochar, due to its elemental composition, could be a source of P, which is released in various forms from the dissolution of P-bound Fe, Ca, Mg, and K compounds [39,62,63,64]. Despite the reported large reduction of PO4-P (up to 65%) in some biochar applications [65,66], the results obtained suggest that PO4-P was likely released by the decomposition of Fe- or Ca-based biochar compounds.
The labile P and total Fe content were relatively high in the biochar used in this investigation, while the total Ca content was low. According to Buss et al. [67], the biochar with a Ca content of less than 1% can lead to maximum PO4-P release. Therefore, Ca and total Fe content in biochar can be considered as relevant predictors of PO4-P release. In addition, the feedstock, pH, and pyrolysis temperature can significantly affect P sorption [68,69]. In the current study, the high PO4-P release was likely caused by the reduction of Fe phosphates at low pH from low Ca-containing biochar. This highlights the significance of determining the ability of biochar to retain relevant substances prior to its application. For example, a laboratory scale isothermal study could be useful to determine the P sorption capacity of biochar. On the other hand, biochar should be produced with clearly defined properties so that it can be used for specific purposes and cases. Therefore, further investigations are needed to enhance understanding about the application of biochar in denitrifying bioreactors depending on the sources from which it is derived, its physical and chemical properties, and the formation processes.
5. Conclusions
The experiment revealed the potential to improve NO3-N removal in tile drainage flow by incorporating 20% v/v deciduous wood biochar into denitrifying woodchip bioreactors. Compared to the pure woodchips and the woodchips mixed with 10% biochar, the NO3-N removal effect was more pronounced at low (below 10.0 °C) temperatures.
Woodchips alone proved to be a suitable medium for PO4-P removal, whereas the biochar showed to be a PO4-P source. The addition of biochar to woodchips (regardless of 10% or 20%) resulted in a large release of phosphates and other inorganic elements. This implies that the use of biochar for the treatment of tile drainage flow could be very limited or even inappropriate.
The results highlight the need to determine the retention capacity of biochar for relevant substances depending on the sources and temperature from which it is derived, as well as its physical and chemical properties before it is used in denitrifying bioreactors.
Author Contributions
R.V., Investigation, analysis, writing. A.P., conceptualization, analysis, supervision, methodology, writing. All authors have read and agreed to the published version of the manuscript.
Funding
This research received no external funding.
Institutional Review Board Statement
Not applicable.
Informed Consent Statement
Not applicable.
Data Availability Statement
Not applicable.
Acknowledgments
The research was supported by the Agriculture Academy of Vytautas Magnus University, Lithuania.
Conflicts of Interest
The authors declare that they have no known competing interests.
References
- Qi, H.; Qi, Z. Simulating phosphorus loss to subsurface tile drainage flow: A review. Environ. Rev. 2017, 25, 150–162. [Google Scholar] [CrossRef] [Green Version]
- Randall, G.W.; Goss, M.J. Nitrate losses to surface water through subsurface, tile drainage. In Nitrogen in the Environment; Academic Press: Cambridge, MA, USA, 2008; pp. 145–175. [Google Scholar]
- Povilaitis, A. Hydrological effect of artificial drainage in lowland river catchments in Lithuania. Environ. Eng. Manag. J. 2015, 14, 2243–2253. [Google Scholar] [CrossRef]
- Deelstra, J.; Iital, A.; Povilaitis, A.; Kyllmar, K.; Greipsland, I.; Blicher-Mathiesen, G.; Jansons, V.; Koskiaho, J.; Lagzdins, A. Hydrological pathways and nitrogen runoff in agricultural dominated catchments. Agric. Ecosyst. Environ. 2014, 198, 65–73. [Google Scholar] [CrossRef]
- Conley, D.J.; Paerl, H.W.; Howarth, R.W.; Boesch, D.F.; Seitzinger, S.P.; Havens, K.E.; Lancelot, C.; Likens, G.E. Controlling eutrophication: Nitrogen and phosphorus. Science 2009, 323, 1014–1015. [Google Scholar] [CrossRef] [PubMed]
- Sun, H.; Wua, Q.; Yu, P.; Zhang, L.; Ye, L.; Zhang, X.-X.; Ren, H. Denitrification using excess activated sludge as carbon source: Performance and the microbial community dynamics. Bioresour. Technol. 2017, 238, 624–632. [Google Scholar] [CrossRef]
- Food and Agriculture Organization of the United Nations. More People, More Food, Worse Water? A Global Review of Water Pollution from Agriculture; FAO; IWMI: Rome, Italy, 2018. [Google Scholar]
- Addy, K.; Gold, A.J.; Christianson, L.E.; David, M.B.; Schipper, L.; Ratigan, N.A. Denitrifying Bioreactors for Nitrate Removal: A Meta-Analysis. J. Environ. Qual. 2016, 45, 873–881. [Google Scholar] [CrossRef]
- Christianson, L.E.; Cooke, R.A.; Hay, C.H.; Helmers, M.J.; Feyereisen, G.W.; Ranaivoson, A.Z.; McMaine, J.T.; McDaniel, R.; Rosen, T.R.; Pluer, W.T.; et al. Effectiveness of denitrifying bioreactors on water pollutant reduction from agricultural areas. Trans. ASABE 2021, 64, 641–658. [Google Scholar] [CrossRef]
- Rivas, A.; Barkle, G.; Stenger, R.; Moorhead, B.; Clague, J. Nitrate removal and secondary effects of a woodchip bioreactor for the treatment of subsurface drainage with dynamic flows under pastoral agriculture. Ecol. Eng. 2020, 148, 105786. [Google Scholar] [CrossRef]
- Schipper, L.A.; Robertson, W.D.; Gold, A.J.; Jaynes, D.B.; Cameron, S.C. Denitrifying bioreactors: An approach for reducing nitrate loads to receiving waters. Ecol. Eng. 2010, 36, 1532–1543. [Google Scholar] [CrossRef]
- Shah, F.A.; Mahmood, Q.; Shah, M.M.; Pervez, A.; Asad, S.A. Microbial ecology of anaerobic digesters: The key players of anaerobiosis. Sci. World J. Hindawi 2014, 2014, 183752. [Google Scholar]
- Zhang, Y.; Wanga, L.; Han, W.; Wang, X.; Guo, Z.; Peng, F.; Yang, F.; Kong, M.; Gao, Y.; Chao, J.; et al. Nitrate removal, spatiotemporal communities of denitrifiers and the importance of their genetic potential for denitrification in novel denitrifying bioreactors. Bioresour. Technol. 2017, 241, 552–562. [Google Scholar] [CrossRef]
- Jaynes, D.B.; Kaspar, T.C.; Moorman, T.B.; Parkin, T.B. In Situ Bioreactors and Deep Drain-Pipe Installation to Reduce Nitrate Losses in Artificially Drained Fields. J. Environ. Qual. 2008, 37, 429–436. [Google Scholar] [CrossRef] [PubMed] [Green Version]
- Lepine, C.; Christianson, L.; Sharrer, K.; Summerfelt, S. Optimizing hydraulic retention times in denitrifying woodchip bioreactors treating recirculating aquaculture system wastewater. J. Environ. Qual. 2016, 45, 813–821. [Google Scholar] [CrossRef] [PubMed]
- Warneke, S.; Schipper, L.A.; Matiasek, M.G.; Scow, K.M.; Cameron, S.; Bruesewitz, D.A.; McDonald, I.R. Nitrate removal, communities of denitrifiers, and adverse effects in different carbon substrates for use in denitrification beds. Water Res. 2011, 45, 5463–5475. [Google Scholar] [CrossRef] [PubMed] [Green Version]
- Dodds, W.K.; Smith, V.H. Nitrogen, phosphorus, and eutrophication in streams. Inland Waters 2016, 6, 155–164. [Google Scholar] [CrossRef]
- Gentry, L.E.; David, M.B.; Royer, T.V.; Mitchell, C.A.; Starks, K.M. Phosphorus Transport Pathways to Streams in Tile-Drained Agricultural Watersheds. J. Environ. Qual. 2007, 36, 408–415. [Google Scholar] [CrossRef] [Green Version]
- Almanassra, I.W.; Kochkodan, V.; Mckay, G.; Atieh, M.A.; Al-Ansari, T. Review of phosphate removal from water by carbonaceous sorbents. J. Environ. Manag. 2021, 287, 112245. [Google Scholar] [CrossRef]
- Kumar, P.S.; Korving, L.; van Loosdrecht, M.C.; Witkamp, G.J. Adsorption as a technology to achieve ultra-low concentrations of phosphate: Research gaps and economic analysis. Water Res. 2019, 4, 100029. [Google Scholar] [CrossRef]
- Halaburka, B.J.; Lefevre, G.H.; Luthy, R.G. Quantifying the temperature dependence of nitrate reduction in woodchip bioreactors: Experimental and modeled results with applied case-study. Environ. Sci. Water Res. Technol. 2019, 5, 782–797. [Google Scholar] [CrossRef]
- Hassanpour, B.; Giri, S.; Pluer, W.T.; Steenhuis, T.S.; Geohring, L.D. Seasonal performance of denitrifying bioreactors in the Northeastern United States: Field trials. J. Environ. Manag. 2017, 202, 242–253. [Google Scholar] [CrossRef]
- Hoover, N.L.; Bhandari, A.; Soupir, M.L.; Moorman, T.B. Woodchip Denitrification Bioreactors: Impact of Temperature and Hydraulic Retention Time on Nitrate Removal. J. Environ. Qual. 2016, 45, 803–812. [Google Scholar] [CrossRef] [Green Version]
- Feyereisen, G.W.; Moorman, T.B.; Christianson, L.E.; Venterea, R.T.; Coulter, J.A.; Tschirner, U.W. Performance of agricultural residue media in laboratory denitrifying bioreactors at low temperatures. J. Environ. Qual. 2016, 45, 779–787. [Google Scholar] [CrossRef]
- Mazarji, M.; Aminzadeh, B.; Baghdadi, M.; Bhatnagar, A. Removal of nitrate from aqueous solution using modified granular activated carbon. J. Mol. Liq. 2017, 233, 139–148. [Google Scholar] [CrossRef] [Green Version]
- Povilaitis, A.; Matikienė, J. Nitrate removal from tile drainage water: The performance of denitrifying woodchip bioreactors amended with activated carbon and flaxseed cake. Agric. Water Manag. 2020, 229, 105937. [Google Scholar] [CrossRef]
- Weber, K.; Quicker, P. Properties of biochar. Fuel 2018, 217, 240–261. [Google Scholar] [CrossRef]
- Godlewska, P.; Schmidt, H.P.; Ok, Y.S.; Oleszczuk, P. Biochar for composting improvement and contaminants reduction. A review. Bioresour. Technol. 2017, 246, 193–202. [Google Scholar] [CrossRef] [PubMed]
- Hassanpour, B.; Riazi, S.F.; Pluer, E.M.; Geohring, L.D.; Guzman, C.D.; Steenhuis, T.S. Biochar acting as an electron acceptor reduces nitrate removal in woodchip denitrifying bioreactors. Ecol. Eng. 2020, 149, 105724. [Google Scholar] [CrossRef]
- Povilaitis, A.; Matikienė, J.; Vismontienė, R. Effects of three types of amendments in woodchip-denitrifying bioreactors for tile drainage water treatment. Ecol. Eng. 2020, 158, 106054. [Google Scholar] [CrossRef]
- Christianson, L.; Castelló, A.L.; Christianson, L.; Helmers, M.; Bhandari, A. Hydraulic property determination of denitrifying bioreactor fill media. Appl. Eng. Agric. 2010, 26, 849–854. [Google Scholar] [CrossRef]
- Povilaitis, A.; Rudzianskaitė, A.; Misevičienė, S.; Gasiūnas, V.; Miseckaitė, O.; Živatkauskienė, I. Efficiency of drainage practices for improving water quality in Lithuania. Trans. ASABE 2018, 61, 179–196. [Google Scholar] [CrossRef] [Green Version]
- Christianson, L.E.; Lepine, C.; Sibrell, P.L.; Penn, C.; Summerfelt, S.T. Denitrifying woodchip bioreactor and phosphorus filter pairing to minimize pollution swapping. Water Res. 2017, 121, 129–139. [Google Scholar] [CrossRef] [PubMed]
- Van Rijn, J.; Tal, Y.; Schreier, H.J. Denitrification in recirculating systems: Theory and applications. Aquac. Eng. 2006, 34, 364–376. [Google Scholar] [CrossRef]
- Oehmen, A.; Lopez-Vazquez, C.M.; Carvalho, G.; Reis, M.A.M.; Van Loosdrecht, M.C.M. Modelling the population dynamics and metabolic diversity of organisms relevant in anaerobic/anoxic/aerobic enhanced biological phosphorus removal processes. Water Res. 2010, 44, 4473–4486. [Google Scholar] [CrossRef] [PubMed]
- Azam, H.M.; Finneran, K.T. Fe (III) reduction-mediated phosphate removal as vivianite (Fe3 (PO4)2⋅ 8H2O) in septic system wastewater. Chemosphere 2014, 97, 1–9. [Google Scholar] [CrossRef]
- Wu, H.; Che, X.; Ding, Z.; Hu, X.; Creamer, A.E.; Chen, H.; Gao, B. Release of soluble elements from biochars derived from various biomass feedstocks. Environ. Sci. Pollut. Res. 2016, 23, 1905–1915. [Google Scholar] [CrossRef]
- Oliveira, F.R.; Patel, A.K.; Jaisi, D.P.; Adhikari, S.; Lu, H.; Khanal, S.K. Environmental application of biochar: Current status and perspectives. Bioresour. Technol. 2017, 246, 110–122. [Google Scholar] [CrossRef]
- Coleman, B.S.L.; Easton, Z.M.; Bock, E.M. Biochar fails to enhance nutrient removal in woodchip bioreactor columns following saturation. J. Environ. Manag. 2019, 232, 490–498. [Google Scholar] [CrossRef] [PubMed]
- Gao, S.; DeLuca, T.H. Wood biochar impacts soil phosphorus dynamics and microbial communities in organically-managed croplands. Soil Biol. Biochem. 2018, 126, 144–150. [Google Scholar] [CrossRef]
- Cayuela, M.L.; Sanchez-Monedero, M.; Roig, A.; Hanley, K.; Enders, A.; Lehmann, J. Biochar and denitrification in soils: When, how much and why does biochar reduce N2O emissions? Sci. Rep. 2013, 3, 1732. [Google Scholar] [CrossRef] [PubMed] [Green Version]
- Weldon, S.; Rasse, D.P.; Budai, A.; Tomic, O.; Dörsch, P. The effect of a biochar temperature series on denitrification: Which biochar properties matter? Soil Biol. Biochem. 2019, 135, 173–183. [Google Scholar] [CrossRef]
- Ashoori, N.; Teixido, M.; Spahr, S.; LeFevre, G.H.; Sedlak, D.L.; Luthy, R.G. Evaluation of pilot-scale biochar-amended woodchip bioreactors to remove nitrate, metals, and trace organic contaminants from urban stormwater runoff. Water Res. 2019, 154, 1–11. [Google Scholar] [CrossRef]
- Domingues, R.R.; Trugilho, P.F.; Silva, C.A.; Melo, I.C.N.D.; Melo, L.C.; Magriotis, Z.M.; Sanchez-Monedero, M.A. Properties of biochar derived from wood and high-nutrient biomasses with the aim of agronomic and environmental benefits. PLoS ONE 2017, 12, e0176884. [Google Scholar] [CrossRef] [PubMed] [Green Version]
- Rosales, E.; Meijide, J.; Pazos, M.; Sanromán, M.A. Challenges and recent advances in biochar as low-cost biosorbent: From batch assays to continuous-flow systems. Bioresour. Technol. 2017, 246, 176–192. [Google Scholar] [CrossRef]
- Heaney, N.; Ukpong, E.; Lin, C. Low-molecular-weight organic acids enable biochar to immobilize nitrate. Chemosphere 2020, 240, 124872. [Google Scholar] [CrossRef] [PubMed]
- Mehrabinia, P.; Ghanbari-Adivi, E. Examining nitrate surface absorption method from polluted water using activated carbon of agricultural wastes. Modeling Earth Syst. Environ. 2021, 2121, 1–9. [Google Scholar]
- Schreiber, B.; Schmalz, V.; Brinkmann, T.; Worch, E. The effect of water temperature on the adsorption equilibrium of dissolved organic matter and atrazine on granular activated carbon. Environ. Sci. Technol. 2007, 41, 6448–6453. [Google Scholar] [CrossRef] [PubMed]
- Lehmann, J.; Joseph, S. (Eds.) Biochar for Environmental Management: Science, Technology and Implementation; Routledge: London, UK, 2015; 448p. [Google Scholar] [CrossRef]
- Choi, Y.; Park, H.; Lee, M.; Lee, G.-S.; Choi, Y.-J. Seasonal variation of assimilable organic carbon and its impact to the biostability of drinking water. Environ. Eng. Res. 2018, 24, 501–512. [Google Scholar] [CrossRef]
- Porter, M.; Andrus, J.; Bartolerio, N.; Rodriguez, L.; Zhang, Y.; Zilles, J.; Kent, A. Seasonal Patterns in Microbial Community Composition in Denitrifying Bioreactors Treating Subsurface Agricultural Drainage. Microb. Ecol. 2015, 70, 710–723. [Google Scholar] [CrossRef]
- Jang, J.; Anderson, E.L.; Venterea, R.T.; Sadowsky, M.; Rosen, C.J.; Feyereisen, G.W.; Ishii, S. Denitrifying Bacteria Active in Woodchip Bioreactors at Low-Temperature Conditions. Front. Microbiol. 2019, 10, 635. [Google Scholar] [CrossRef]
- Gottschall, N.; Edwards, M.; Craiovan, E.; Frey, S.; Sunohara, M.; Ball, B.; Zoski, E.; Topp, E.; Khan, I.; Clark, I.; et al. Amending woodchip bioreactors with water treatment plant residuals to treat nitrogen, phosphorus, and veterinary antibiotic compounds in tile drainage. Ecol. Eng. 2016, 95, 852–864. [Google Scholar] [CrossRef]
- Dougherty, H. Hydraulic Evaluation of a Denitrifying Bioreactor with Baffles. Master’s Thesis, University of Illinois, Urbana, IL, USA, 2018. [Google Scholar]
- Husk, B.; Sanchez, J.; Anderson, B.; Whalen, J.; Wootton, B. Removal of phosphorus from agricultural subsurface drainage water with woodchip and mixed-media bioreactors. J. Soil Water Conserv. 2018, 73, 265–275. [Google Scholar] [CrossRef]
- Zoski, E.D.; Lapen, D.R.; Gottschall, N.; Murrell, R.S.; Schuba, B.R. Nitrogen, phosphorus, and bacteria removal in laboratory-scale woodchip bioreactors amended with drinking water treatment residuals. Trans. ASABE 2013, 56, 1339–1347. [Google Scholar]
- Mino, T.; van Loosdrecht, M.C.M.; Heijnen, J.J. Microbiology and biochemistry of the enhanced biological phosphate removal processes. Water. Res. 1998, 32, 3193–3207. [Google Scholar] [CrossRef]
- Oehmen, A.; Carvalho, G.; Freitas, F.; Reis, M.A. Assessing the abundance and activity of denitrifying polyphosphate accumulating organisms through molecular and chemical techniques. Water Sci. Technol. 2010, 61, 2061–2068. [Google Scholar] [CrossRef] [PubMed] [Green Version]
- Kerrn-Jespersen, J.P.; Henze, M. Biological phosphorus uptake under anoxic and aerobic conditions. Water Res. 1993, 27, 617–624. [Google Scholar] [CrossRef]
- Lopez-Vazquez, C.M.; Oehmen, A.; Hooijmans, C.M.; Brdjanovic, D.; Gijzen, H.J.; Yuan, Z.; van Loosdrecht, M.C. Modeling the PAO–GAO competition: Effects of carbon source, pH and temperature. Water Res. 2009, 43, 450–462. [Google Scholar] [CrossRef] [PubMed]
- Erdal, U.G.; Erdal, Z.K.; Randall, C.W. The competition between PAOs (phosphorus accumulating organisms) and GAOs (glycogen accumulating organisms) in EBPR (enhanced biological phosphorus removal) systems at different temperatures and the effects on system performance. Water Sci. Technol. 2003, 47, 1–8. [Google Scholar] [CrossRef] [PubMed]
- Cao, X.; Harris, W. Properties of dairy-manure-derived biochar pertinent to its potential use in remediation. Bioresour. Technol. 2010, 101, 5222–5228. [Google Scholar] [CrossRef]
- Qian, T.; Zhang, X.; Hu, J.; Jiang, H. Effects of environmental conditions on the release of phosphorus from biochar. Chemosphere 2013, 93, 2069–2075. [Google Scholar] [CrossRef] [PubMed]
- Silber, A.; Levkovitch, I.; Graber, E.R. pH-dependent mineral release and surface properties of cornstraw biochar: Agronomic implications. Environ. Sci. Technol. 2010, 44, 9318–9323. [Google Scholar] [CrossRef] [PubMed]
- Bock, E.; Smith, N.; Rogers, M.; Coleman, B.; Reiter, M.; Benham, B.; Easton, Z.M. Enhanced nitrate and phosphate removal in a denitrifying bioreactor with biochar. J. Environ. Qual. 2014, 44, 605–613. [Google Scholar] [CrossRef] [PubMed]
- Laird, D.; Fleming, P.; Wang, B.; Horton, R.; Karlen, D. Biochar impact on nutrient leaching from a Midwestern agricultural soil. Geoderma 2010, 158, 436–442. [Google Scholar] [CrossRef] [Green Version]
- Buss, W.; Assavavittayanon, K.; Shepherd, J.G.; Heal, K.V.; Sohi, S. Biochar phosphorus release is limited by high pH and excess calcium. J. Environ. Qual. 2018, 47, 1298–1303. [Google Scholar] [CrossRef] [PubMed] [Green Version]
- Glaser, B.; Lehr, V.-I. Biochar effects on phosphorus availability in agricultural soils: A meta-analysis. Sci. Rep. 2019, 9, 9338. [Google Scholar] [CrossRef] [Green Version]
- Kameyama, K.; Miyamoto, T.; Shiono, T.; Shinogi, Y. Influence of Sugarcane Bagasse-derived Biochar Application on Nitrate Leaching in Calcaric Dark Red Soil. J. Environ. Qual. 2012, 41, 1131–1137. [Google Scholar] [CrossRef]
Figure 1.
Scheme of the experimental setup with denitrifying bioreactors (WW: woodchips alone; WAB-10 and WAB-20: mixtures of woodchips with 10% and 20% biochar, respectively).
Figure 1.
Scheme of the experimental setup with denitrifying bioreactors (WW: woodchips alone; WAB-10 and WAB-20: mixtures of woodchips with 10% and 20% biochar, respectively).

Figure 2.
The pH (a) and TDS (b) in the inflow and outflows of bioreactors WW, WAB-10, and WAB-20. Whiskers represent 1.5 IQRs, boxplots indicate the 25% and 75% quartiles, crosses show the means, dashes in boxes mark the medians, and circles denote values up to 2.2 IQRs.
Figure 2.
The pH (a) and TDS (b) in the inflow and outflows of bioreactors WW, WAB-10, and WAB-20. Whiskers represent 1.5 IQRs, boxplots indicate the 25% and 75% quartiles, crosses show the means, dashes in boxes mark the medians, and circles denote values up to 2.2 IQRs.

Figure 3.
Inflow water T (°C) and HRT (a), and NO3-N concentrations at the inlet and outlet (b) of WW, WAB-10, and WAB-20 bioreactors. The inceptive cases are neglected in the graphs.
Figure 3.
Inflow water T (°C) and HRT (a), and NO3-N concentrations at the inlet and outlet (b) of WW, WAB-10, and WAB-20 bioreactors. The inceptive cases are neglected in the graphs.


Figure 4.
NO3-N removal efficiencies and rates between the WW, WAB-10, and WAB-20 bioreactors (the water temperature at the inlet was below 10 °C in graphs (a,c), while it was above 10 °C in graphs (b,d). The specific components in the graphs are the same as in Figure 2.
Figure 4.
NO3-N removal efficiencies and rates between the WW, WAB-10, and WAB-20 bioreactors (the water temperature at the inlet was below 10 °C in graphs (a,c), while it was above 10 °C in graphs (b,d). The specific components in the graphs are the same as in Figure 2.


Figure 5.
Comparison of PO4-P concentrations at the outlets of the bioreactors. The specific components in the graphs are the same as in Figure 2.
Figure 5.
Comparison of PO4-P concentrations at the outlets of the bioreactors. The specific components in the graphs are the same as in Figure 2.

Figure 6.
Dynamics of PO4-P concentrations at the outlets of bioreactors with different fillers. The inceptive cases are neglected in the graph.
Figure 6.
Dynamics of PO4-P concentrations at the outlets of bioreactors with different fillers. The inceptive cases are neglected in the graph.


Table 1.
Efficiencies and rates of NO3-N removal in bioreactors *.
| Abbreviated Name of Bioreactor | Removal Efficiency, ** % | Removal Rates, g N/(m3·h) | Hydraulic Retention Time, h |
|---|---|---|---|
| WW | 15.3/61.0 (39.2 ± 13.2) | 0.35/4.40 (1.70 ± 0.89) | 2.13/10.1 (4.58 ± 1.27) |
| WAB-10 | 18.8/74.3 (41.0 ± 14.1) | 0.54/4.41 (1.81 ± 0.88) | 2.24/11.7 (4.45 ± 1.31) |
| WAB-20 | 19.3/76.6 (44.0 ± 13.7) | 0.58/4.58 (2.00 ± 0.95) | 2.11/10.6 (4.30 ± 1.26) |
* Minimum/maximum and average values with standard deviation (in brackets) throughout the experiment. ** Significantly higher values (p < 0.050) are shown in italic bold.
Publisher’s Note: MDPI stays neutral with regard to jurisdictional claims in published maps and institutional affiliations. |
© 2021 by the authors. Licensee MDPI, Basel, Switzerland. This article is an open access article distributed under the terms and conditions of the Creative Commons Attribution (CC BY) license (https://creativecommons.org/licenses/by/4.0/).
Share and Cite
MDPI and ACS Style
Vismontienė, R.; Povilaitis, A. Effect of Biochar Amendment in Woodchip Denitrifying Bioreactors for Nitrate and Phosphate Removal in Tile Drainage Flow. Water 2021, 13, 2883. https://doi.org/10.3390/w13202883
AMA Style
Vismontienė R, Povilaitis A. Effect of Biochar Amendment in Woodchip Denitrifying Bioreactors for Nitrate and Phosphate Removal in Tile Drainage Flow. Water. 2021; 13(20):2883. https://doi.org/10.3390/w13202883
Chicago/Turabian StyleVismontienė, Rasa, and Arvydas Povilaitis. 2021. "Effect of Biochar Amendment in Woodchip Denitrifying Bioreactors for Nitrate and Phosphate Removal in Tile Drainage Flow" Water 13, no. 20: 2883. https://doi.org/10.3390/w13202883
Note that from the first issue of 2016, this journal uses article numbers instead of page numbers. See further details here.