
Optimal Water-Fertilizer Combinations for Efficient Nitrogen Fixation by Sugarcane at Different Stages of Growth


1
College of Tea (Pu’er), West Yunnan University of Applied Sciences, Pu’er 665000, China
2
Center for Integrative Conservation, Xishuangbanna Tropical Botanical Garden, Chinese Academy of Sciences, Xishuangbanna 666303, China
3
School of Water Conservancy and Hydropower, Hebei University of Engineering, Handan 056038, China
4
Guangxi Key Laboratory of Water Engineering Materials and Structures, Nanning 530023, China
5
Environmental Science Center, Qatar University, Doha 2713, Qatar
6
College of Agronomy and Biotechnology, Yunnan Agricultural University, Kunming 650201, China
7
Center of Conservation Biology, Core Botanical Gardens, Chinese Academy of Sciences, Mengla 666303, China
*
Authors to whom correspondence should be addressed.
Water 2021, 13(20), 2895; https://doi.org/10.3390/w13202895
Submission received: 12 September 2021
/
Revised: 11 October 2021
/
Accepted: 11 October 2021
/
Published: 15 October 2021
(This article belongs to the Section Water, Agriculture and Aquaculture)
Abstract
:High fertilizer application and over-irrigation in sugarcane systems can cause considerable N2O emissions. Optimized water-fertilization management which reduces N2O emissions, while maintaining sugarcane biomass, is crucial, but may affect nitrogen fixation by sugarcane. This study evaluated the combined effect of water-fertilization on sugarcane biomass and nitrogen fixation in field trials in southern China. Treatments included drip and spray irrigation, with three levels (0% (low), 50% (medium), 100% (high)) of irrigation and of fertilizer. A rain-fed crop (no irrigation or fertilizer) was included as the control. The results showed that (1) spray irrigation with medium water and high fertilization increased biomass. The optimum combination in sugarcane elongation stage was drip irrigation with medium water and high fertilization, while drip irrigation with high water and high fertilization was the best choice for maturity stage. (2) For sugarcane nitrogen (δ15N) content, spray irrigation with medium water and high fertilization was the best combination in seedling and tillering stages. The optimum combination in the elongation stage was drip irrigation with medium water and high fertilization, and in maturity stage was drip irrigation with high water and high fertilization. (3) For soil (δ15N content), drip irrigation with high water and high fertilization proved optimal for seedling, tillering, and maturity stages. (4) In seedling stage, sugarcane (δ15N content) was found to be strongly correlated with leaf area index, soil water, soil temperature, and soil electrical conductivity. Soil (δ15N content) was correlated with photosynthesis and soil temperature. In conclusion, drip irrigation appears most suitable for field planting, while the best treatment in seedling and tillering stages is medium water-high fertilization, and that the best in elongation stage is high water-medium fertilization. The optimum water-fertilizer combinations identified here can provide a scientific basis for optimization and management of irrigation and fertilization in China and other regions with similar environments.
1. Introduction
Methane (CH4), carbon dioxide (CO2), and nitrous oxide (N2O) are important greenhouse gases (GHG) emitted in agriculture [1,2,3]. Well-drained soils in agricultural regions are usually sinks of CH4 [4,5,6]. Since CO2 is both emitted and taken up by plants in photosynthesis, it has little influence on the GHG emissions balance, making N2O the most important GHG emitted from agricultural soils [7]. Furthermore, N2O emissions from agrarian soils have actually increased due to its partial denitrification [3]. According to the United Nations Intergovernmental Panel on Climate Change, emissions from agriculture account for 13.5% of total global GHG emissions. These emissions are an important source of N2O, the global warming potential of which is 298-fold higher than that of CO2 [8,9]. Agricultural soils are the most significant anthropogenic N2O source, with the highest N2O emissions found in terrestrial landscapes at subtropical latitudes [10]. The N2O flux from soil generally increases with increased nitrogen fertilization rates and intensive cropping [11,12]. Feng et al. (2021) expect N2O emission to increase by 20–51% by 2030 and 27–74% by 2050 compared with estimated emissions in the year 2000, which underline the urgency of improvements in catchment-scale nitrogen management strategies [13,14,15]. The scientific community is working with the UN to coordinate and accelerate the necessary actions to achieve the new goal of “halv[ing] nitrogen waste” by 2030, contributing to post-coronavirus disease 2019 (COVID-19) economic recovery and multiple SDGs [16]. In general, GHGs differ in anthropogenic structures, which are determined by technical or functional choices [17]. Research has therefore focused on a range of mitigation options, including optimized irrigation, fertilizer types, and fertilizer doses to meet actual plant demands [18,19]. Sugarcane is the main feedstock for global sugar production and has also emerged as a second major source of biofuel [20]. It is a crop of significant social and economic value in many countries, given that nearly 75% of global production is concentrated in Brazil, India, China, Thailand, and Pakistan [21]. China is the world’s third largest sugar producer, after Brazil and India, and approximately 90% of Chinese sugar production comes from sugarcane [22]. In some regions, such as Guangxi province in southern China, sugarcane planting is part of a broad industrial chain, with integration of local primary, secondary, and tertiary industries [23,24,25]. Water and fertilization are the most important factors which determine crop growth, and can significantly affect crop yield, crop quality, and water and fertilization use efficiency, especially in sugarcane [26,27].
In combination, water and fertilizer levels have a significant impact on crop growth and water productivity [28]. Water is essential for sugarcane growth, and the important of suitable irrigation systems for sugarcane cultivation has been widely reported [29,30]. However, excessive irrigation wastes resources and can also seriously affect the soil environment [31]. One study on sugarcane growth and sugar production under water stress and various irrigation regimens found that as water stress increased, biomass and sugar accumulation declined, primarily in leaves and stems [32]. Water deficit stress can also result in oxidative damage, due to overproduction of reactive oxygen species [33]. In central-southern regions of China, sugarcane fertilization begins soon after the previous ratoon crop and continues from April to November, spanning three seasons (autumn to spring). Fertilization mainly affects soil respiration by influencing crop growth (increasing crop root biomass), which in turn increases the soil litter [34]. Delabiglia has pointed out that sugarcane, in addition to increments in agro-industrial yield which require adequate water, also requires nutritional supply, and the mineral element nitrogen (N) in particular. This nutritional supply has a direct effect on sprouting and tillering, influencing the production capacity of the crop in terms of stalk and sugar [35]. Substantial amounts of nitrogenous fertilizer are necessary for high sugarcane production, due to the crop’s high biomass production [36]. However, studies on the effects of fertilization on sugarcane biomass and sugar accumulation have revealed that high nitrogen fertilization is a strong source of CH4 and NO2 emissions [37]. More specifically, high nitrogen fertilization and periodic waterlogging create considerable potential for N2O emissions [38]. In general, inadequate N management leads to increased N losses, which has both economic and environmental consequences.
Given the significance of Chinese sugarcane planting and production, determining its optimum water and fertilization regimen is of vital importance if we are to safeguard the global sugar supply and rise to the responsibility of reducing GHG emissions. Previous studies have mainly focused on the effects of single factors, such as irrigation, fertilization, or combined water-fertilizer application on sugarcane growth, and few studies have considered the nitrogen-fixing ability of sugarcane while optimizing water and fertilizer use. Consequently, water-fertilizer optimization experiments which consider nitrogen fixation are required in order to ensure appropriate management of water and fertilizer in sugarcane cropping.
The hypothesis for this study was that water and fertilization application can be optimized to increase sugarcane biomass while maximizing the nitrogen-fixing effect of sugarcane on plants and soil. To test this hypothesis, we monitored three indicators (sugarcane biomass, sugarcane δ15N content, soil δ15N content) at different growth stages under different water-fertilization management systems, in a typical sugarcane cropping system in Guangxi. Specific objectives were to determine: (1) the pattern of variation in sugarcane biomass; (2) sugarcane δ15N and soil δ15N content at different growth stages; (3) the pattern of variation in photosynthesis, soil respiration, transpiration, soil electrical conductivity, and leaf area index; and (4) the optimum water-fertilizer regimen for the sugarcane cropping system.
2. Materials and Methods
2.1. Study Area
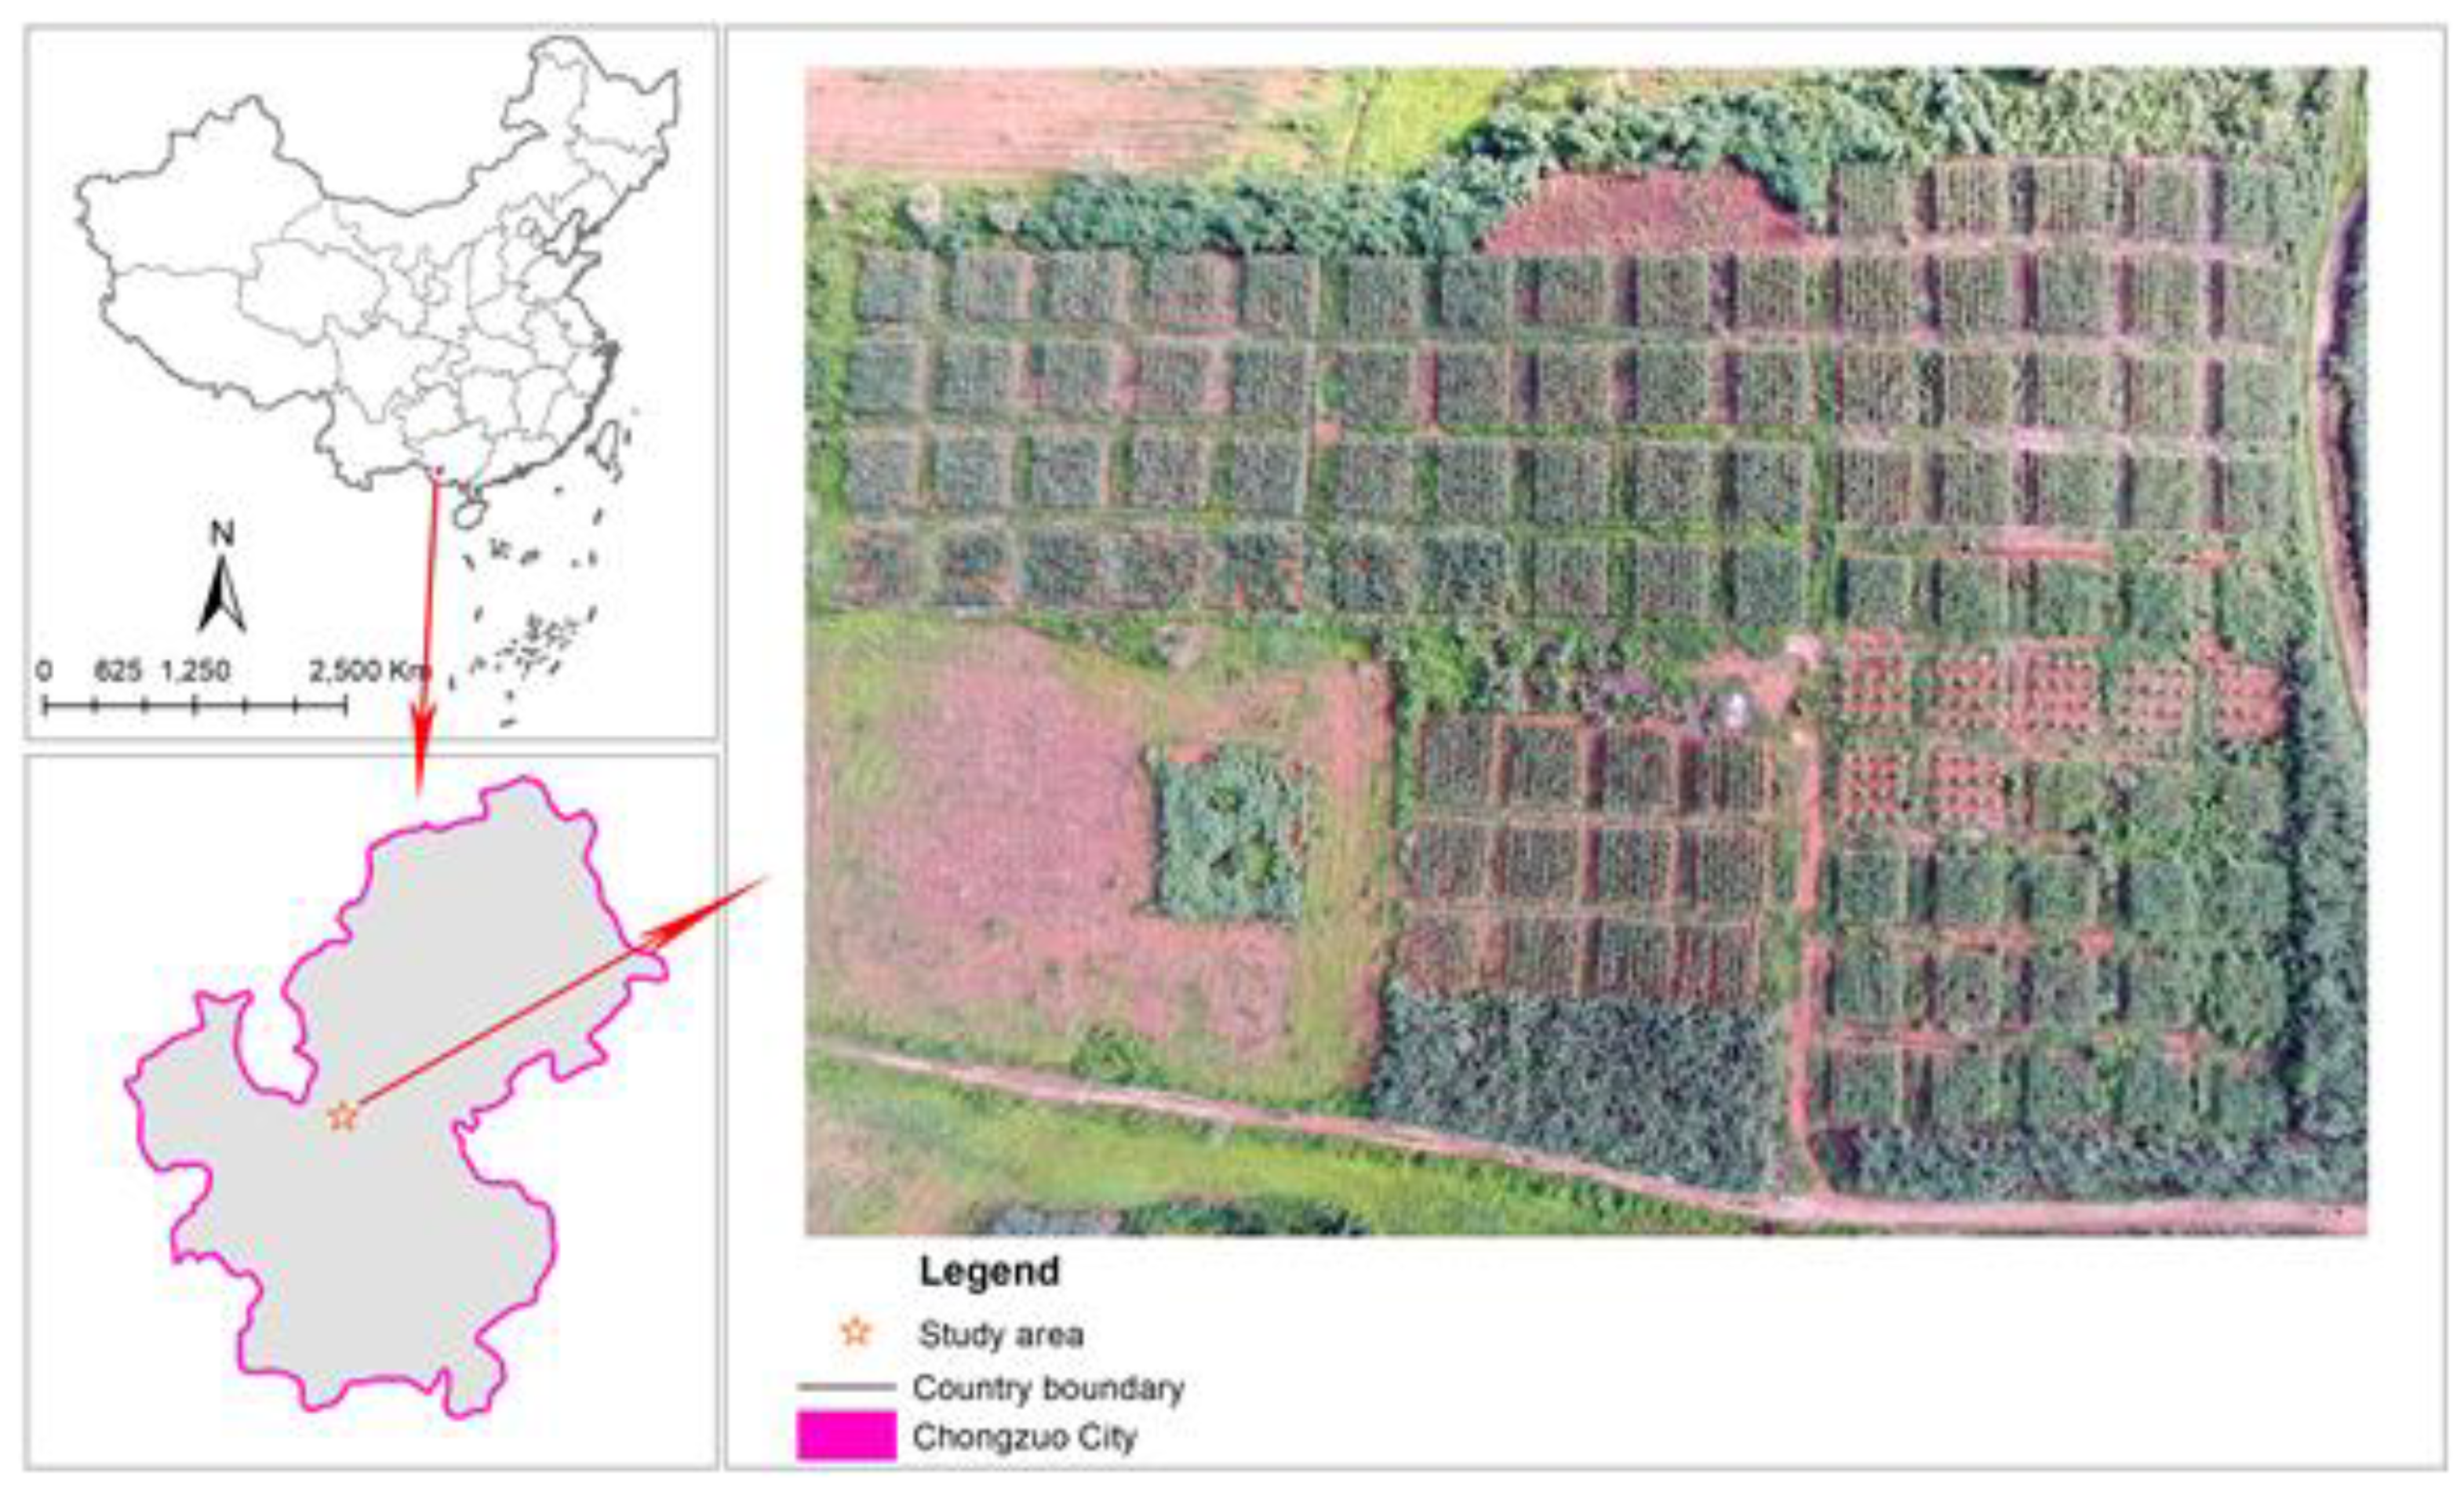
The study area was in Jiangzhou county, Guangxi province, a typical sugarcane-producing area in China (Figure 1). Jiangzhou county is located in the subtropical humid monsoon climate zone, with mean annual precipitation of 1500 mm and mean annual temperature of 22 °C. Sugarcane in Guangxi plays a crucial role in China’s sugar production and regional economic development. The province has the largest sugarcane area and is the largest producer of sugar in China, accounting for around 63.1% of national sugarcane area, producing 7.29 million tons sugar per annum (67.5% of national sugarcane output), and contributing about 7 billion USDto the gross domestic product (GDP) of China in 2018. The area of sugarcane crop increased from 4543 km2 in 1995 to 8864 km2 in 2018, representing 7.9% and 14.8%, respectively, of the total sown area in Guangxi province [39]. Abundant light and heat resources are of great benefit to the yield of sugarcane. Following adjustment of the planting system, sucrose production has been strongly increased in Guangxi.
2.2. Experiment Design
The experiment was carried out at Longze in Jiangzhou county. Each plot was 8 m × 8 m and was equipped with one of two irrigation methods, drip (D) or spray (S) irrigation, and different fertilizer levels. The drip irrigation zone was surrounded by cement and bricks, to form a relatively independent experimental plot. The spray irrigation zone had a 2 m wide isolation zone. The treatments comprised 0, 50%, and 100% of the optimal irrigation level, and 0, 50% and 100% of the optimal fertilization level (Table 1). The experiment was laid out in a completely random design, with eight treatments in total, and three replicate plots per treatment. Taking the triangles as position references in each square, three sugars were then selected and their roots pulled out at different growth stages of sugarcane, for biomass and δ15N content. Taking the extracted sugarcane as the center point, within a radius of 20 cm, we followed the triangles and take soil samples from 0–20 cm underground. In total, there were nine soil samples from soil drills in each square, which were mixed thoroughly. 500 g were placed in a ziplock bag as a sample, and the δ15N value of the soil recorded for laboratory analysis.
2.3. Measured Parameters and Methods
2.3.1. Sugarcane Biomass
Sugarcane selection needed to consider growth status in the square, where three grades of coarse, medium, and fine were selected as appropriate. Roots, stems, and leaves were collected and weighed fresh. After measuring leaf area index, leaves, stems, and roots were placed in a drying oven at 105 °C for 0.5 h, dried at 70 °C to constant weight, and weighed separately.
2.3.2. Leaf Area Index
Sugarcane leaf area index (LAI) of each plot was estimated with the help of a canopy analyzer (LAI-2200 Plant Canopy Analyzer, LI-COR, Lincoln, NE, USA). In each square, three sugarcanes were randomly selected (the selected sugarcane should be representative, so the study choose one with good growth, one with normal growth, and one with poor growth), the length and width of their leaves measured, and LAI-2200 Plant Canopy Analyzer used to measure the leaf area of each sugarcane leaf. The leaf area index (LAI) was then calculated as follows:
LAI = the total area of the leaf/the occupied land area
2.3.3. δ15N Content
The stable isotope of nitrogen (15N) occurs in nature at lower concentrations than its 14N counterpart. The use of N isotopes was based on the fact that the ratio 14N/15N occurs naturally at a nearly constant ratio of 273:1 (0.3663% of 15N atoms). Techniques based on the measurement of the relative concentrations of these isotopes are useful to evaluate several phenomena linked to the nitrogenous nutrition of plants. Work with N fertilizers labeled with the 15N isotope showed that the fertilizer N utilization by the sugarcane plant was variable.
The nitrogen isotope (δ15N) concentration in plant and soil samples was determined by a stable isotope mass spectrometer (Isoprime100, ElementarAnalysensystemeGmbH, Heraeus, Germany). δ15N is affected by multiple processes and interactions of the nitrogen cycle, which can comprehensively reflect the characteristics of the nitrogen cycle. Generally speaking, the higher the δ15N content, the higher the nitrogen cycle efficiency and nitrogen utilization. The isotope ratio of nitrogen was defined as:
δ15N = [(15N/14N) sample − (15N/14N) standard]/(15N/14N) standard × 1000‰
2.3.4. Photosynthesis and Transpiration
Indicators of photosynthesis were recorded on three cloudless days during the elongation stage of sugarcane using a portable photosynthesis meter (Li-6400; LI-COR Inc., Lincoln, NE, USA). The gas flow rate in the system was set to 500 µmol s−1 during measurements, the dedicated built-in red and blue light sources used, and the light intensity set to 1000 µmol m−2 s−1 photons. In each treatment, three representative sugarcane plants with good growth were selected. Measurements were taken every 2 h from 09:00 to 17:00. The net rate of photosynthesis (Pn) and transpiration (Tr) in leaves were measured separately at high, middle, and low points on the plant. Measurements of each leaf were taken three times, before calculating their average.
2.3.5. Soil Respiration
The LI-6400 portable photosynthesis meter was also used to measure CO2 flux. Before measurement, an isolation ring was placed in the soil, in the area to be tested on the next day, with the rim set 2–3 cm above the surface. To measure CO2 concentration at the soil surface, the soil respiration chamber was fitted onto the soil ring, the measured soil area and the target CO2 value were entered into the meter, and the measurement cycle was started. Three rings were set up at each point and treated as separate replicates.
2.3.6. Soil Electrical Conductivity
Representative soils were selected in the three plots of each irrigation mode, that is, near the pulled sugar cane, and measured with the WET three-parameter meter.
2.4. Statistical Analysis
All statistical analyses were performed using the software R. The mean and standard error (SE) of each group were calculated, and all pair-wise comparisons of the treatment means were performed using the least significant difference (LSD) test, with significance set at p < 0.05. The relationship between fertilizer application, water consumption, and sugarcane properties was plotted using Matlab.
3. Results
3.1. Combined Effect of Water and Fertilization on Sugarcane Biomass
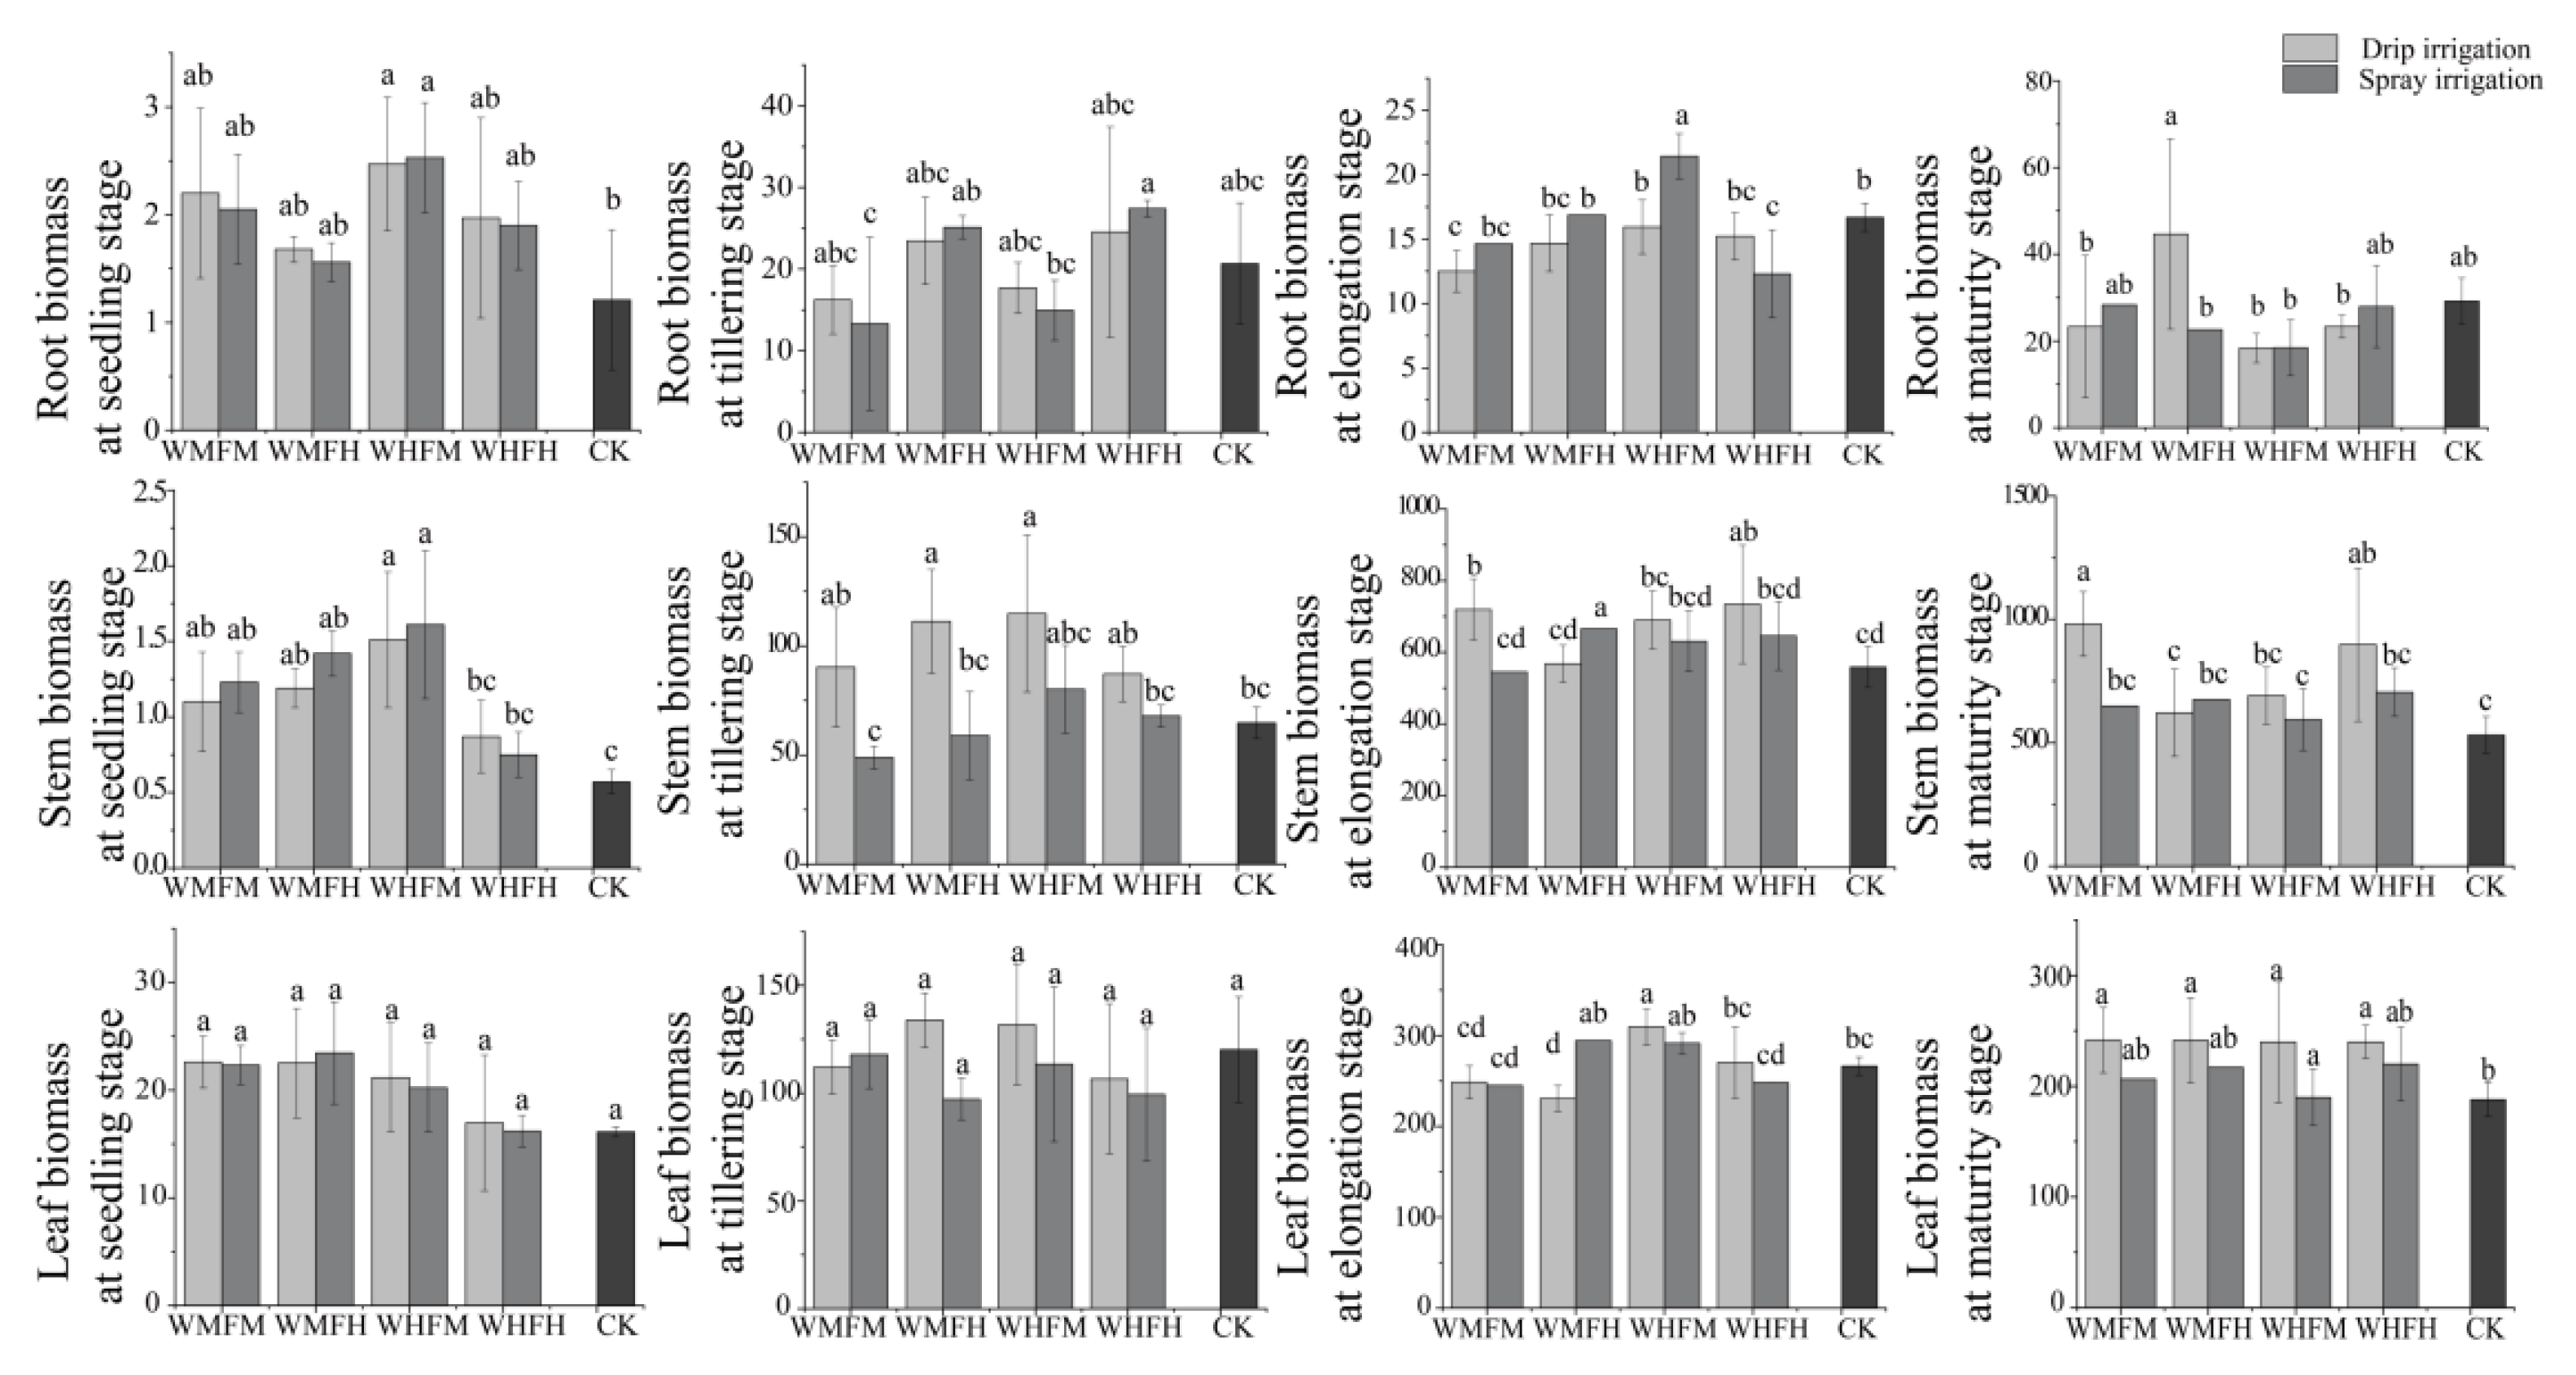
Fertilization had a significant effect on root biomass (p < 0.05) in the seeding and tillering stages and had a stronger significant effect on stem biomass (p < 0.01) in the seeding and elongation stages. Water had a significant effect on root biomass in the elongation stage and on leaf biomass in the seedling and tillering stages (p < 0.05). Irrigation type had a significant effect on root biomass (p < 0.05) in the elongation stage, and on stem and leaf biomass (p < 0.05) in the maturity stage. The interaction between water and fertilizer was significant for stem biomass in the seeding, tillering, and maturity stages, and highly significant for root and leaf biomass (p < 0.001) in the elongation stage (Figure 2).
For a given type of irrigation (drip, spray), root and stem biomass generally higher in the high water-medium fertilization (WHFM) treatment. Leaf biomass in the seedling stage was highest under the medium water-high fertilization (WMFH) treatment. In the tillering stage, root and stem biomass was highest in the high water-high fertilization drip irrigation (DWHFH) treatment, but leaf biomass was highest in the medium water-high fertilization spray irrigation (SWMFH) treatment. In the elongation stage, root and stem biomass was highest in DWHFM, but leaf biomass was highest in the SWHFM treatment. In the maturity period, sugarcane biomass was highest in DWMFH (Table 2).
3.2. Combined Effect of Water and Fertilization on Nitrogen Fixation by Sugarcane Plants
3.2.1. Combined Impact of Water and Nitrogen on Sugarcane δ15N Content
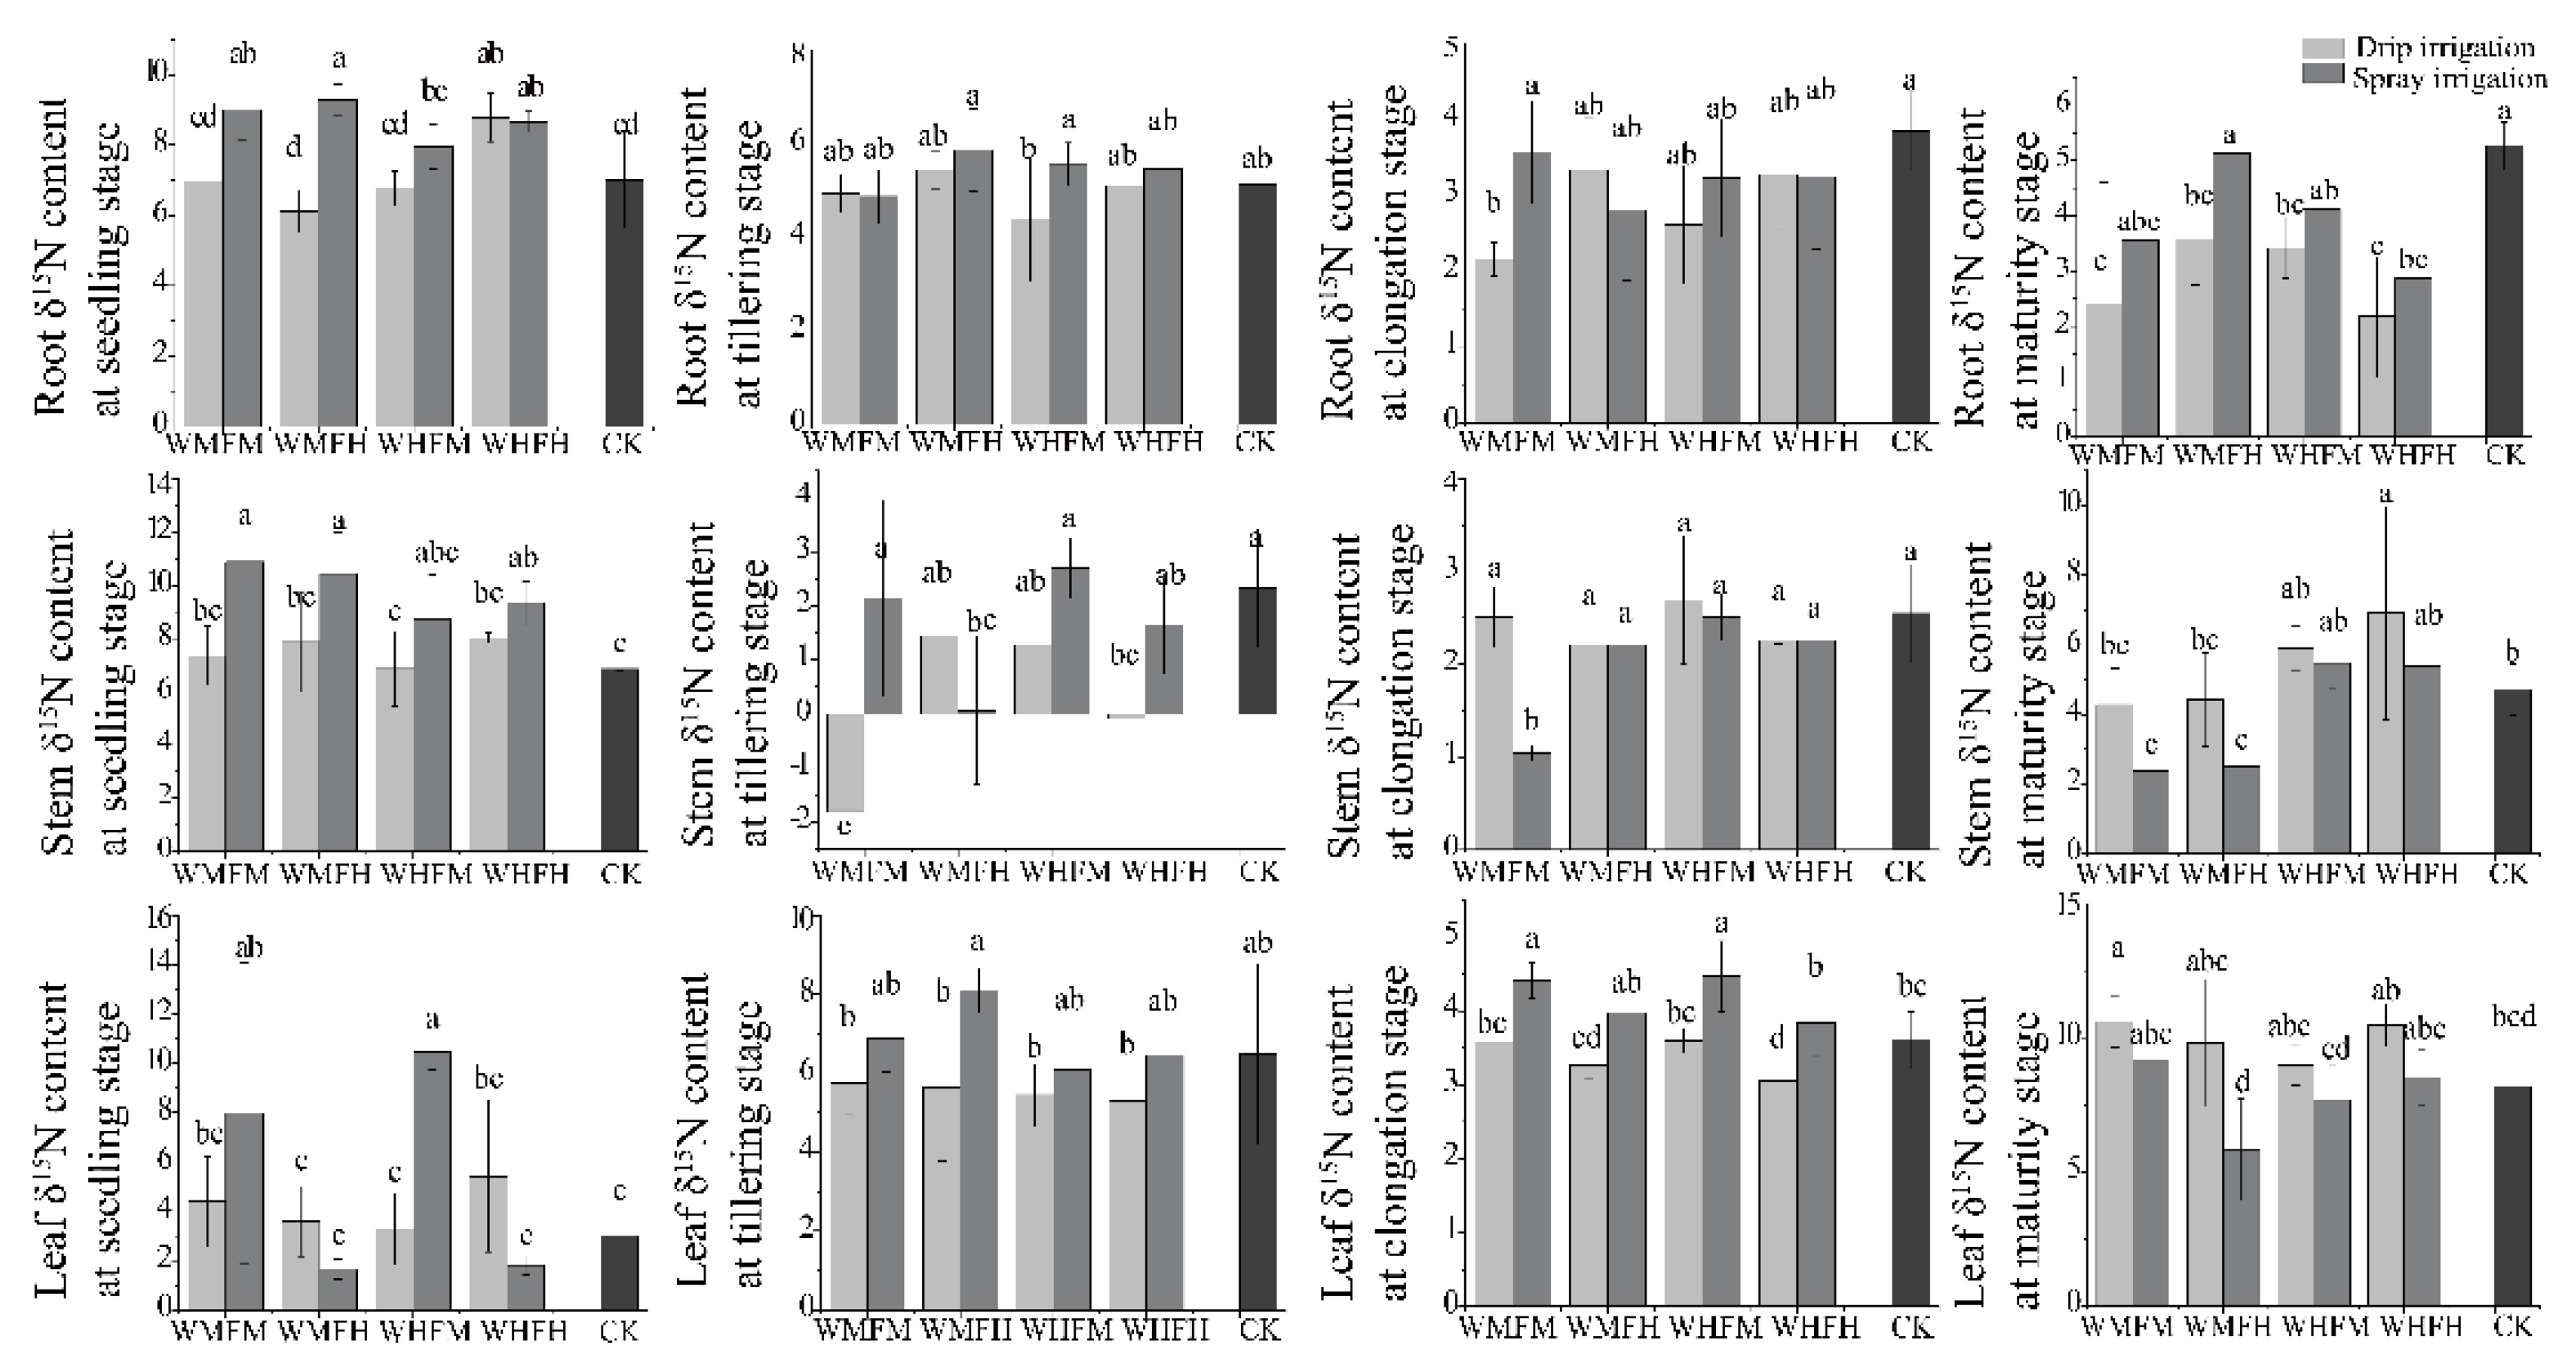
Fertilizer had a significant effect on the δ15N content of leaves (p < 0.05) in the seedling, tillering, and elongation stages, and a significant effect on root δ15N content (p < 0.05) in the maturity stage. Water had a significant effect on the stem δ15N content of sugarcane in both the elongation and maturity stages. The effect of irrigation type on the δ15N content of roots and stems was highly significant (p < 0.001) in the seedling stage, and significant for stem (p < 0.01) and leaf (p < 0.001) δ15N content in the elongation stage. In the maturity stage, irrigation type had a significant effect on the δ15N content of sugarcane (Figure 3).
Fertilizer-water interaction had a significant effect on root δ15N content (p < 0.05) in the seedling and maturity stages, and on stem δ15N content (p < 0.01) in the tillering stage. Fertilizer-irrigation type interaction was significant for stem δ15N content (p < 0.05) in the tillering stage and leaf δ15N content (p < 0.001) in the seedling and tillering stages. In the elongation stage, water-irrigation type, fertilizer-irrigation type, and fertilizer-water-irrigation type all had significant interaction effects on stem δ15N content (p < 0.05) (Figure 3).
The average δ15N content of sugarcane in the seedling stage and tillering stage was higher under spray irrigation than under drip irrigation. Root δ15N content in the seedling stage was highest in the SWMFH treatment. Leaf δ15N content in the seedling and elongation stages was highest in the SWHFM treatment. Stem δ15N content was highest in SWMFM in the seedling stage, in SWHFM in the tillering stage, and in the DWHFM treatment in the elongation stage. Stem and leaf δ15N content in the maturity stage was highest in the DWHFH treatment (Table 3).
3.2.2. Combined Impact of Water and Nitrogen on Soil δ15N Content
Fertilizer had a significant effect on soil δ15N content in the seedling, tillering, and elongation stages. Water had a significant effect only in the tillering stage, while irrigation type had an effect in the tillering, elongation, and maturity stages. During the tillering stage, fertilization-water interaction, fertilization-irrigation type interaction, and fertilization-water-irrigation type interaction all had significant effects on soil δ15N content. Water-irrigation type interaction had a significant effect on soil δ15N content at the seedling stage (Table 4).
In the WHFH treatment, soil δ15N content under drip irrigation was highest in the seedling and tillering stages. The best irrigation treatments for soil δ15N content in the elongation period were the control and SWMFM, while the best treatment in the maturity period was DWHFH (Table 4).
3.3. Combined Effect of Water and Fertilization on Photosynthesis, Transpiration, Leaf Area Index, and Soil Respiration
The results of nonlinear multivariate regression between the level of irrigation water or the dose of the fertilizer and the photosynthetic, transpiration, mean leaf area index and soil respiration at different growth stages of sugarcane are shown in Table 5. Water had a positive effect on photosynthesis, and fertilizer had a negative effect, in both the seedling and elongation stages. In the tillering stage, water, and fertilizer both had a negative effect on photosynthesis. The effect of water on photosynthesis was greater than that of fertilizer in all growth stages. Water-fertilizer interaction had a negative effect on transpiration in the seedling and tillering stages, and a positive effect on transpiration in the elongation stage. The effect of water on transpiration was greater than that of fertilizer in all growth stages. For leaf area index, fertilizer had a negative effect in both the seedling and tillering stages, but a positive effect in the elongation stage. Water had a positive effect in both the seedling and elongation stages, and a negative effect in the tillering stage. The effect of water on leaf area index was greater than that of fertilizer in all growth stages. For soil respiration, water had a positive effect in the seedling stage and a negative effect in the tillering and elongation stages. Fertilizer had a negative effect in the seedling and elongation stages, but a positive effect in the tillering stage.
3.4. Correlation Analysis of Nitrogen Fixation with Various Influencing Factors
In the seedling stage, the main factors affecting the δ15N content of sugarcane were mean leaf area index, soil water, soil temperature, and electrical conductivity, while the main factors affecting the soil δ15N content were photosynthesis and soil temperature (Table 6). During the tillering stage, transpiration significantly affected stem δ15N content, while leaf area index was the main factor affecting leaf δ15N content. In the maturity stage, the main factors affecting leaf δ15N content were soil δ15N content, temperature, electrical conductivity, and respiration, the main factor affecting root δ15N content was water, and the main factors affecting soil δ15N content were leaf area index and soil electrical conductivity (Table 6).
4. Discussion
4.1. Effects of Different Irrigation-Fertilization Combinations on Sugarcane Biomass
Biomass production is known to be strongly influenced by irrigation and fertilization, as well as other agronomic measures [40,41,42]. Sugarcane responded differently to water during the different phenological phases, where in contrast to the initial and final stages of sugarcane development, the intermediate stage of stem elongation did not show a clear response to water supply [30,43]. While a previous study showed that water was an important factor in the elongation of sugarcane stems [44] our study suggested that water had no significant effect on stem biomass in the growth of sugarcane (Table 2), that stem biomass in the tillering stage was most vigorous in the WHFH treatment (734.21 g plant-1), and that in the mature period it was most vigorous in WMFM (980.94 g plant-1) (Figure 2). After Inman-Bamber and Smith [32] clearly demonstrated that reducing irrigation during the maturation phase saves water and increases the sucrose content in sugarcane, it is now common practice in irrigated sugarcane production to suspend irrigation before harvesting, claiming the additional advantage of reducing moisture content of the biomass taken to the sugar mill [32,45].
During the seedling and elongation periods of sugarcane, fertilization was an important limiting factor for stem biomass, and at the seeding, tillering and maturity stages, water-fertilizer coupling had a significant effect on stem biomass (Table 2), indicating that, fertilizer is an important factor for sugarcane growth in the seedling stage. Indeed, these results are consistent with other studies which have demonstrated the importance of fertilizers in the emergence and growth of sugarcane seedlings. For stems, the best water and fertilizer treatment was found to be WHFM at the seedling and elongation stages, but WMFM at the maturity stage (Figure 2).
For a particular irrigation type (drip, spray), sugarcane stems were most vigorous under high water (WH) treatments, reaching 1.51 g plant-1 and 114.74 g plant-1 during the seedling and tillering stages, respectively. Irrigation type had a significant effect on sugarcane stem biomass at the elongation stage, and the stem biomass of spray irrigation in the seedling stage was higher than that of drip irrigation, while during the growth and maturity period, the biomass of drip irrigation was generally higher than that of spray irrigation. Considering all the stages, then, drip irrigation appears to be more conducive to the accumulation of sugarcane biomass than spray irrigation (Figure 2). According to the nutrient and water needs of sugarcane growth stages, water-fertilizer integrated drip irrigation should be carried out to ensure effective stems, thereby maximizing sugarcane production [45]. Within a certain range of water and fertilization inputs, sugarcane yield in the present study increased as irrigation and fertilization increased but decreased when exceeded certain thresholds. Reasonable water and fertilization inputs, therefor, can be expected to achieve high crop yields [26].
4.2. Effects of Different Irrigation-Fertilization Combinations on Nitrogen Fixation in Sugarcane
Plants are able to assimilate inorganic forms of N and NO2 absorbed from the soil or obtained from fertilizer. Fertilizer had a significant effect on leaf δ15N content in the seedling, tillering and elongation stages, water and irrigation type had a significant effect on stem δ15N content in the elongation and maturity stages, and drip irrigation have a more significant effect on stem δ15N content than spray irrigation (Figure 3, Table 3). In the elongation period, nitrogen use efficiency of the roots, stems, and leaves was highest under the DWHFM treatment in all cases. With regards the nitrogen fixation effect on the soil, soil δ15N content in the seedling, tillering, and maturity stages was highest in the DWHFH treatment (Table 4).
Use of the 15N isotopic tracer technique to measure N-fertilizer absorption by the plant reported a low recovery of N by sugarcane derived from mineral fertilizers. According to [46], during the early stages of sugarcane, fertilizer is the crop’s main source of the nutrient, accounting for more than 70% of N extracted by the plants. However, sugarcane is a semi-perennial crop, remaining in the field for at least 10 months, and recovery of fertilizer N decreases over the course of the cycle [47]. During the sugarcane harvest, N fertilizer participation in the total N of the plant is significantly reduced [48,49], which corresponds with our finding that the δ15N content was 10.88% in the seedling stage and 2.69% in the tillering stage. In many studies, meanwhile, there was no response to N fertilization.
In the seedling and tillering stages of sugarcane, the present study found that the nitrogen cycle of sugarcane stems was fastest, and the nitrogen use efficiency highest under spray irrigation and low fertilization. Nitrogen is an important nutrient in soil, and is involved in the processes of ammonification, nitrification, denitrification, and mineralization. Studies have reported significant variation in the amplitude and temporal dynamics of N2O emissions from soil in response to nitrogen fertilization, suggesting that these dynamics depend on fertilizer type and application method, soil type, and frequency of rainfall and irrigation [50,51]. In sugarcane fields in Australia and in corn cultivated for biofuel production [52], emissions of N2O increased significantly with the application of fertilizer, with most increases occurring shortly after fertilization. While our study, did not test for the release of N2O, it did analyze the utilization efficiency and the role of nitrogen fixation in the soil during the entire growth period of sugarcane. Nitrogen use efficiency was found to be higher under DWHFM treatment, while under the same treatment, the nδ15N content in the soil was higher.
4.3. Effects of Different Irrigation-Fertilizer Combinations on Photosynthesis, Transpiration, Leaf Area Index, and Soil Respiration
In general, full irrigation can increase the stomatal conductance of leaves, while low fertilizer rates can increase their chlorophyll content, promoting photosynthetic efficiency. Photosynthesis in our sugarcane crop was at its maximum under high water (WH) in the seedling and elongation stages (Table 5), confirming that adequate irrigation is an important factor underlying efficient photosynthesis [53]. Chen et al. (2013) found that the peak rate of photosynthesis in maize plants was higher at higher doses of fertilizer than at lower doses [54], while Wang et al. (2016) found that the maximum value of photosynthesis in buckwheat was obtained at intermediate doses of fertilizer [55]. In our study, photosynthesis was negatively correlated with fertilization at all growth stages of sugarcane. Such discrepancies may be due to an oversupply of fertilizer, which may have reduced the photosynthetic capacity of plant mesophyll cells.
Transpiration in both the seedling and tillering stages at the lowest level of irrigation (WL) was generally higher than in the treatments with higher levels of irrigation, contradicting previous findings for monoculture systems. This discrepancy may be attributable to a particular chain of events, in which low irrigation slowed down the expansion of sugarcane leaf area, thereby lowering the crown density, which in turn meant greater illumination and higher temperatures at the soil surface on account of increased direct radiation and ultimately lead to higher transpiration [56].
Leaf area index is an important indicator for the population growth of crops and has been shown to increase with increased crop water usage [57]. In this study, leaf area index of the sugarcane was greatest in the full irrigation and low fertilizer (WHFL) treatment, suggesting that excessive fertilization actually inhibits the growth and development of sugarcane. This may be due to inhibition of root development at the elongation stage, when sugarcane requires less fertilizer (Figure 2).
Different water and fertilizer management regimens can significantly affect soil respiration rate. Yang et al. (2015) concluded that soil respiration rate is greater under controlled irrigation than under full-scale submerged irrigation [58]. Under the experimental conditions in the present study, increasing fertilizer application caused the soil respiration rate to increase at first, but then to decrease. A possible reason for this could be that excessive fertilizer application not only inhibits the growth of sugarcane, but also reduces soil organic matter content and the soil content of micro-organisms and plant roots, ultimately bringing about a decrease in soil respiration rate.
4.4. Optimizing Water-Fertilizer Combinations
Agriculture is recognized as a source of high GHG emissions on a CO2-equivalent basis [59], especially owing to its emissions of gases that have relatively high global warming potential such as N2O [40]. Therefore, if production of sugarcane is to become an important measure for reducing N2O emissions associated with global energy production, it is clear that we require more sophisticated information on GHG emissions pertaining to sugarcane agriculture. Sugarcane cropping involves a series of management and fertilization practices, and a clear understanding of how these practices can affect emissions is lacking, especially for China, the third largest producer of sugarcane in the world. Using isotope detection measurements of δ15N content in sugarcane and soil, this study showed that the nitrogen fixation effect of sugarcane grown in China can vary significantly according to irrigation and fertilization regimen, and that sugarcane biomass can vary significantly with irrigation system.
Sugarcane root and leaf biomass production was restricted by lack of water. Combining high fertilizer doses with irrigation by methods that are more tolerant to water deprivation can save on in irrigation costs and improve sugar biomass. In the initial development stages of sugarcane, fertilizer did not play a key role in the nitrogen nutrition of the crop, but it did play a key role in soil nitrogen content. Irrigation type had a significant effect on the nitrogen content in both crop and soil. Spray irrigation appeared to be the optimal method in the initial development stages, while drip irrigation was beneficial for stem growth in the elongation stage. However, there was no significant difference between drip irrigation and spray irrigation within water-fertilizer treatments, drip irrigation is appropriate for field planting. The best treatment for sugarcane was to combine medium water with high fertilization in the seedling and tillering stages, and high water with medium fertilization in the elongation stage.
5. Conclusions
(1) Applying different ratios of fertilizer to water in different growth stages of sugarcane can improve nitrogen availability, resulting in higher biomass production and reducing the severity of GHG emissions from sugarcane fields.
(2) Based on the relationships observed between water and fertilization inputs, spray irrigation supplying 2250 m3 ha−1 and a fertilizer dose of 2700 kg ha−1 maximized sugarcane biomass and nitrogen fixation in the seedling and tillering stages, while drip irrigation supplying 7500 m3 ha−1 and a fertilizer dose of 1890 kg ha−1 maximized sugarcane biomass and nitrogen fixation in the elongation and maturity stages.
(3) In summary, optimization of water-fertilizer combinations at different stages of sugarcane is expected to see wide application in sugar agriculture and horticulture, particularly in regions similar with Guangxi.
(4) Naturally, the experiment has its limitations. Going forward, the coupling of water and fertilizer should be carried out in relation to sugarcane yield, sugar content, etc., and further studies are needed to evaluate the residual effect of N in the soils and verify the potential impact on greenhouse gases.
Author Contributions
Conceptualization, Z.M. and Y.B.; methodology, W.W.; software, Z.M.; validation, J.M.A. and W.F.; formal analysis, W.F.; investigation, W.W.; resources, W.W.; data curation, Z.M.; writing—original draft preparation, Z.M.; writing—review and editing, J.M.A.; visualization, Z.M.; supervision, Y.B.; project administration, Y.B.; funding acquisition, W.W. All authors have read and agreed to the published version of the manuscript.
Funding
This research was funded by Guangxi Key R&D Program, grant number Guike AB19245040.
Institutional Review Board Statement
Not applicable.
Informed Consent Statement
Not applicable.
Data Availability Statement
This study did not report any data.
Acknowledgments
The authors thank Guangxi Key R&D Program (Guike AB19245040) assisted with data presentation.
Conflicts of Interest
The authors declare no conflict of interest.
References
- Denman, K.L. Couplings between Changes in the Climate System and Biogeochemistry; Cambridge University Press: Cambridge, UK; New York, NY, USA, 2007. [Google Scholar]
- Forster, P.; Ramaswamy, V. Changes in Atmospheric Constituents and in Radiative Forcing; Cambridge University Press: Cambridge, UK, 2007. [Google Scholar]
- Davis, M.P.; Groh, T.A.; Jaynes, D.B.; Parkin, T.B.; Isenhart, T.M. Nitrous Oxide Emissions from Saturated Riparian Buffers: Are We Trading a Water Quality Problem for an Air Quality Problem? Environ. Qual. 2019, 48, 261–269. [Google Scholar] [CrossRef] [PubMed] [Green Version]
- Carmo, J.B.d.; Filoso, S.; Zotelli, L.C.; de Sousa Neto, E.R.; Pitombo, L.M.; Duarte-Neto, P.J.; Vargas, V.P.; Andrade, C.A.; Gava, G.J.C.; Rossetto, R.; et al. Infield greenhouse gas emissions from sugarcane soils in Brazil: Effects from synthetic and organic fertilizer application and crop trash accumulation. GCB Bioenergy 2013, 5, 267–280. [Google Scholar] [CrossRef]
- Oliveira, B.G.; Nunes Carvalho, J.L.; Chagas, M.F.; Pellegrino Cerri, C.E.; Cerri, C.C.; Feigl, B.J. Methane emissions from sugarcane vinasse storage and transportation systems: Comparison between open channels and tanks. Atmos. Environ. 2017, 159, 135–146. [Google Scholar] [CrossRef]
- Paredes, D.; Alves, B.; Santos, M.; Bolonhezi, D.; Boddey, R.M. Nitrous oxide and methane fluxes following ammonium sulfate and vinasse application on sugar cane soil. Environ. Sci. Technol. 2015, 49, 11209–11217. [Google Scholar] [CrossRef]
- Cerri, C.C.; Maia, S.; Galdos, M.V.; Cerri, C.; Feigl, B.J.; Bernoux, M. Brazilian greenhouse gas emissions: The importance of agriculture and livestock. Sci. Agric. 2009, 66, 831–843. [Google Scholar] [CrossRef] [Green Version]
- Stocker, T.F.; Qin, D.; Plattner, G.K.; Midgley, P.M.; IPCC. The physical science basis. Contribution of working group I to the fifth assessment report of the Intergovernmental Panel on climate change. Comput. Geom. 2013, 1138–1191. [Google Scholar]
- Ramzan, S.; Rasool, T.; Bhat, R.A.; Ahmad, P.; Ashraf, I.; Rashid, N.; UI Shafiq, M.; Mir, I.A. Agricultural soils a trigger to nitrous oxide: A persuasive greenhouse gas and its management. Environ. Monit. Assess. 2020, 192, 436. [Google Scholar] [CrossRef]
- Stehfest, E.; Bouwman, L. N2O and NO emission from agricultural fields and soils under natural vegetation: Summarizing available measurement data and modeling of global annual emissions. Nutr. Cycl. Agroecosyst. 2006, 74, 207–228. [Google Scholar] [CrossRef]
- McSwiney, C.P.; Robertson, G.P. Nonlinear response of N2O flux to incremental fertilizer addition in a continuous maize (Zea mays L.) cropping system. Glob. Chang. Biol. 2005, 11, 1712–1719. [Google Scholar] [CrossRef]
- Mosier, A.; Wassmann, R.; Verchot, L.; King, J.; Palm, C. Methane and Nitrogen Oxide Fluxes in Tropical Agricultural Soils: Sources, Sinks and Mechanisms. In Tropical Agriculture in Transition-Opportunities for Mitigating Greenhouse Gas Emissions; Wassmann, R., Vlek, P.L.G., Eds.; Springer: Dordrecht, The Netherlands, 2004. [Google Scholar]
- Sutton, M.A.; Howard, C.M.; Kanter, D.R.; Lassaletta, L.; Móring, A.; Raghuram, N.; Read, N. The nitrogen decade: Mobilizing global action on nitrogen to 2030 and beyond. One Earth 2021, 4, 10–14. [Google Scholar] [CrossRef]
- Billen, G.; Aguilera, E.; Einarsson, R.; Garnier, S.; Grizzetti, B.; Lassaletta, L.; Le Noë, J.; Sanz-Cobena, A. Reshaping the European agro-food system and closing its nitrogen cycle: The potential of combining dietary change, agroecology, and circularity. One Earth 2021, 4, 839–850. [Google Scholar] [CrossRef]
- Raboni, M.; Viotti, P.; Rada, E.C.; Conti, F.; Boni, M.R. The Sensitivity of a Specific Denitrification Rate under the Dissolved Oxygen Pressure. Int. J. Environ. Res. Public Health 2020, 17, 9366. [Google Scholar] [CrossRef] [PubMed]
- Feng, M.; Ullah, S.; Gorelick, S.M.; Hannah, D.M.; Krause, K. Increasing nutrient inputs risk a surge of nitrous oxide emissions from global mangrove ecosystems. One Earth 2021, 4, 742–748. [Google Scholar]
- Hélias, A. At the boundary between anthropogenic and environmental systems: The neglected emissions of indirect nitrous oxide. Int. J. Life Cycle Assess. 2019, 24, 412–418. [Google Scholar] [CrossRef] [Green Version]
- Shakoor, A.; Shahzad, S.M.; Chatterjee, N.; Arif, M.S.; Farooq, M.H.; Altaf, M.M.; Tufail, M.A.; Dar, A.A.; Mehmood, T. Nitrous oxide emission from agricultural soils: Application of animal manure or biochar? A global meta-analysis. J. Environ. Manag. 2021, 285, 112170. [Google Scholar] [CrossRef]
- Wassman, R.; Vlek, P.L.G. Mitigating greenhouse gas emissions from tropical agriculture: Scope and research priorities. Environ. Dev. Sustain. 2004, 6, 1–9. [Google Scholar] [CrossRef]
- Goldemberg, J.; Mello, F.; Cerri, C.; Davies, C.A.; Cerri, C.C. Meeting the global demand for biofuels in 2021 through sustainable land use change policy. Energy Policy 2014, 69, 14–18. [Google Scholar] [CrossRef]
- FAO. Food and Agriculture Organization Corporate Statistical Database. FAOSTAT. 2019. Available online: http://www.fao.org/faostat/en/#home (accessed on 11 February 2020).
- Li, Y.R.; Yang, L.T. Sugarcane agriculture and sugar industry in china. Sugar Tech. 2015, 17, 1–8. [Google Scholar] [CrossRef]
- Li, Y.R. Beneficial effects of ethephon application on sugarcane under sub-tropical climate of china. Sugar Tech. 2004, 6, 235–240. [Google Scholar] [CrossRef]
- Li, Y.R. China: An emerging sugar super power. Sugar Tech. 2004, 6, 213–227. [Google Scholar] [CrossRef]
- Li, Y.R. Heralding a new era for sugar industry in china: Post is-2004 scenario. Sugar Tech. 2005, 7, 1–3. [Google Scholar] [CrossRef]
- Wu, L.; Zhang, F.C.; Fan, J.L.; Zhou, H.M.; Liang, F.; Gao, Z.J. Effects of Water and Fertilizer Coupling on Cotton Yield, Net Benefits and Water Use Efficiency. Trans. Chin. Soc. Agric. Mach. 2015, 46, 164–172. [Google Scholar]
- Xing, Y.; Zhang, F.; Wu, L.; Fan, J.; Li, J. Determination of optimal amount of irrigation and fertilizer under drip fertigated system based on tomato yield, quality, water and fertilizer use efficiency. Agric. Eng. 2015, 31, 110–121. [Google Scholar]
- Oweis, T.Y.; Farahani, H.J.; Hachum, A.Y. Evapotranspiration and water use of full and deficit irrigated cotton in the mediterranean environment in northern Syria. Agric. Water Manag. 2011, 98, 1239–1248. [Google Scholar] [CrossRef]
- Pene, C.; Edi, G.K. Sugarcane yield response to deficit irrigation at two growth stages. In Crop Yield Response to Deficit Irrigation; Kirda, C., Moutonette, P., Hera, C., Nielsen, D.R., Eds.; Kluwer Academic Publishers: Dordrecht, The Netherlands; Boston, MA, USA; London, UK, 1996; pp. 136–157. [Google Scholar]
- Rossler, R.; Singels, A.; Olivier, F.; Steyn, J.M. Growth and yield of a sugarcane plant crop under water stress imposed through deficit drip irrigation. Proc. S. Afr. Sug. Technol. Assoc. 2014, 86, 170–183. [Google Scholar]
- McConnell, J.S.; Wilkerson, M.H.; Mitchell, G.A. Influences of nitrogen treatments and irrigation methods on soil chemical properties. Commun. Soil Sci. Plant Anal. 1988, 19, 1925–1943. [Google Scholar] [CrossRef]
- Inman-Bamber, N.G.; Smith, D.M. Water relations in sugarcane and response to water deficits. Field Crop. Res. 2005, 92, 185–202. [Google Scholar] [CrossRef]
- Cia, M.C.; Guimaraes, A.C.R.; Medici, L.O.; Chabregas, S.M.; Azevedo, R.A. Antioxidant responses to water deficit by drought-tolerant and -sensitive sugarcane varieties. Ann. Appl. Biol. 2012, 161, 313–324. [Google Scholar] [CrossRef]
- Graham, M.H.; Haynes, R.J.; Meyer, J.H. Soil organic matter content and quality: Effects of fertilizer applications, burning and trash retention on a long-term sugarcane experiment in South Africa. Soil Biol. Biochem. 2002, 34, 93–102. [Google Scholar] [CrossRef]
- Dellabiglia, W.J.; Gava, G.J.C.; Arlanch, A.B.; Villas Boas, R.L.; Cantarella, H.; Rossetto, R. Produtividade de cana-de-açúcar fertirrigada com doses de N e inoculadas com bactérias diazotróficas. Irriga 2018, 1, 29–34. [Google Scholar] [CrossRef]
- Singh, H.; Singh, R.K.; Meena, R.N.; Kumar, V. Nitrogen fertigation schedule and irrigation effects on productivity and economics of spring sugarcane. Indian J. Agric. Res. 2019, 53, 405–410. [Google Scholar] [CrossRef] [Green Version]
- Denmead, O.T.; Macdonald, B.C.T.; Bryant, G.; Naylor, T.; Wilson, S.; Griffith, D.W.T.; Wang, W.J.; Salter, B.; White, I.; Moody, P.W. Emissions of methane and nitrous oxide from Australian sugarcane soils. Agric. For. Meteorol. 2010, 150, 748–756. [Google Scholar] [CrossRef]
- Allen, D.E.; Kingston, G.; Rennenberg, H.; Dalal, R.C.; Schmidt, S. Effect of nitrogen fertilizer management and waterlogging on nitrous oxide emission from subtropical sugarcane soils. Agric. Ecosyst. Environ. 2010, 136, 209–217. [Google Scholar] [CrossRef]
- CSY, Guangxi Statistical Yearbook. China Statistical Publishing House, Beijing 2010–2019. Available online: http://tjj.gxzf.gov.cn/tjsj/tjnj/material/tjnj20200415/2019/zk/indexeh.htm (accessed on 14 October 2021).
- Herzog, T. World Greenhouse Gas Emissions in 2005. WRI Working Paper. World Resources Institute, 2009. Available online: http://www.wri.org/publication/navigating-the-numbers (accessed on 14 October 2021).
- Wang, E.; Attard, S.; Linton, A.; Mcglinchey, M.; Everingham, Y. Development of a closed-loop irrigation system for sugarcane farms using the internet of things. Comput. Electron. Agric. 2020, 172, 105376. [Google Scholar] [CrossRef]
- Zhang, D.; Luo, Z.; Liu, S.; Li, W.; Dong, H. Effects of deficit irrigation and plant density on the growth, yield and fiber quality of irrigated cotton. Field Crop. Res. 2016, 197, 1–9. [Google Scholar] [CrossRef]
- Wiedenfeld, R.P. Water stress during different sugarcane growth periods on yield and response to n fertilization. Agric. Water Manag. 2002, 43, 173–182. [Google Scholar] [CrossRef]
- Meng, S.X.; Wang, X.M.; Huang, G.S.; Lu, Y.F.; Huang, P.X.; Lu, G.Y. Different Fertilization Modes of Sugarcane in Latosolic Red Soil of Guangxi. Asian Agric. Res. 2019, 4, 292418. [Google Scholar]
- Olivier, F.C.; Singels, A. Increasing water use efficiency of irrigated sugarcane production in South Africa through better agronomic practices. Field Crop. Res. 2015, 176, 87–98. [Google Scholar] [CrossRef] [Green Version]
- Franco, H.C.J.; Otto, R.; Faroni, C.E.; Vitti, A.C.; Oliveira, E.C.A.D.; Trivelin, P.C.O. Nitrogen in sugarcane derived from fertilizer under Brazilian field conditions. Field Crop. Res 2011, 121, 29–41. [Google Scholar] [CrossRef]
- Prasertsak, P.; Freney, J.; Denmead, O.; Sagna, P.; Prove, B.; Reghenzani, J. Effect of fertilizer placement on nitrogen loss from sugarcane in tropical Queensland. Nutr. Cycl. Agroecosyst. 2002, 62, 229–239. [Google Scholar] [CrossRef]
- Otto, R.; Mulvaney, R.L.; Khan, S.A.; Trivelin, P.C.O. Quantifying soil nitrogen mineralization to improve fertilizer nitrogen management of sugarcane. Boil. Fertil. Soils 2013, 49, 893–904. [Google Scholar] [CrossRef]
- Megda, M.M.; Mariano, E.; Leite, J.M.; Franco, H.C.J.; Vitti, A.C.; Megda, M.M.; Khan, S.A.; Mulvaney, R.L.; Trivelin, P.C.O. Contribution of fertilizer nitrogen to the total nitrogen extracted by sugarcane under Brazilian field conditions. Nutr. Cycl. Agroecosyst. 2015, 101, 241–257. [Google Scholar] [CrossRef]
- Dalal, R.C.; Wang, W.; Robertson, G.P.; Parton, W.J. Nitrous oxide emission from australian agricultural lands and mitigation options: A review. Soil Res. 2003, 41, 165–195. [Google Scholar] [CrossRef]
- Granli, T.; Bøckman, O.C. Nitrous oxide (N2O) emissions from soils in warm climates. Fertil. Res. 1995, 42, 159–163. [Google Scholar] [CrossRef]
- Gagnon, B.; Ziadi, N.; Rochette, P.; Chantigny, M.H.; Angers, D.A. Fertilizer source influenced nitrous oxide emissions from a clay soil under corn. Soil Sci. Soc. Am. J. 2011, 75, 595–604. [Google Scholar] [CrossRef]
- Lin, Y.; Zeng, Z.; Ren, C.; Yuegao, H.U. Water use efficiency and physiological responses of oat under alternate partial root-zone irrigation in the semiarid areas of northeast china. Procedia Eng. 2012, 28, 33–42. [Google Scholar]
- Chen, J.W.; Yang, Z.Q.; Zhou, P.; Hai, M.R.; Tang, T.X.; Liang, Y.L. Biomass accumulation and partitioning, photosynthesis, and photosynthetic induction in field-grown maize (Zea mays L.) under low- and high-nitrogen conditions. Acta Physiol. Plant 2012, 35, 95–105. [Google Scholar] [CrossRef]
- Wang, C.; She, H.Z.; Liu, X.B.; Hu, D.; Ruan, R.W.; Shao, M.B.; Zhang, L.Y.; Zhou, L.B.; Zhang, G.B.; Wu, D.Q.; et al. Effects of fertilization on leaf photosynthetic characteristics and grain yield in tartary buckwheat Yunqiao1. Photosynthetica 2017, 55, 77–84. [Google Scholar] [CrossRef]
- Du, S.Q.; Kang, S.Z.; Li, F.S.; Du, T.S. Water use efficiency is improved by al- ternate partial root-zone irrigation of apple in arid northwest China. Agric. Water Manag. 2017, 179, 184–192. [Google Scholar] [CrossRef]
- Mustafa, Ü.; Kanber, R.; Ko, D.L.; Tekin, S.; Kapur, B. Effects of deficit irrigation on the yield and yield components of drip irrigated cotton in a mediterranean environment. Agric. Water Manag. 2011, 98, 597–605. [Google Scholar]
- Yang, X.; Li, C.; Zhang, Q.; Liu, Z.; Geng, J.; Zhnag, M. Effects of polymer-coated potassium chloride on cotton yield: Leaf senescence and soil potassium. Field Crop. Res 2017, 212, 145–152. [Google Scholar] [CrossRef]
- Burney, J.A.; Davis, S.J.; Lobell, D.B. Greenhouse gas mitigation by agricultural intensification. Proc. Natl. Acad. Sci. USA 2010, 107, 12052–12057. [Google Scholar] [CrossRef] [PubMed] [Green Version]
Figure 1.
Location of the study site in Guangxi province, southern China, and the experimental sugarcane plot.
Figure 1.
Location of the study site in Guangxi province, southern China, and the experimental sugarcane plot.

Figure 2.
Biomass in roots (top panels), stems (center), and leaves (bottom) of sugarcane in (left to right) the seedling, tillering, elongation, and maturity stages under different water-fertilizer treatments (for treatment abbreviations, see Table 1) (Different letters a, b, c and d in the figure indicate significant differences between treatments).

Figure 3.
Nitrogen isotope (δ15N) content in (top panels) roots, (center) stems, and (bottom) leaves of sugarcane in (left to right) the seedling, tillering, elongation, and maturity stages under different water-fertilizer treatments (for treatment abbreviations, see Table 1) (Different letters a, b, c and d in the figure indicate significant differences between treatments).


Table 1.
Experimental design: Drip (D) or spray (S) irrigation, and 0% (Water Low, WL), 50% (WM), or 100% (WH) of the optimal irrigation level, and 0% (Fertilizer Low, FL), 50% (FM), or 100% (FH) of the optimal fertilization level, at three different growth stages of sugarcane.
Table 1.
Experimental design: Drip (D) or spray (S) irrigation, and 0% (Water Low, WL), 50% (WM), or 100% (WH) of the optimal irrigation level, and 0% (Fertilizer Low, FL), 50% (FM), or 100% (FH) of the optimal fertilization level, at three different growth stages of sugarcane.
| Treatment | Seedling Stage | Tillering Stage | Elongation Stage | |||
|---|---|---|---|---|---|---|
| Water (m3 ha−1) | Fertilizer (kg ha−1) | Water (m3 ha−1) | Fertilizer (kg ha−1) | Water (m3 ha−1) | Fertilizer (kg ha−1) | |
| DWMFM | 2250 | 1350 | 2250 | 2700 | 7500 | 9450 |
| DWMFH | 2250 | 2700 | 2250 | 5400 | 7500 | 18,900 |
| DWHFM | 4500 | 1350 | 4500 | 2700 | 15,000 | 9450 |
| DWHFH | 4500 | 2700 | 4500 | 5400 | 15,000 | 18,900 |
| SWMFM | 2250 | 1350 | 2250 | 2700 | 7500 | 9450 |
| SWMFH | 2250 | 2700 | 2250 | 5400 | 7500 | 18,900 |
| SWHFM | 4500 | 1350 | 4500 | 2700 | 15,000 | 9450 |
| SWHFH | 4500 | 2700 | 4500 | 5400 | 15,000 | 18,900 |
| Control (WLFL) | 0 | 0 | 0 | 0 | 0 | 0 |
Table 2.
Results of multivariate analysis of variance (ANOVA) of biomass at different growth stages of sugarcane under different water-fertilizer-irrigation method treatments.
Table 2.
Results of multivariate analysis of variance (ANOVA) of biomass at different growth stages of sugarcane under different water-fertilizer-irrigation method treatments.
| Biomass ANOVA(F) | ||||||||||||
|---|---|---|---|---|---|---|---|---|---|---|---|---|
| Treatment | Seedling Stage | Tillering Stage | Elongation Stage | Maturity Stage | ||||||||
| Root | Stem | Leaves | Root | Stem | Leaves | Root | Stem | Leaves | Root | Stem | Leaves | |
| Fertilizer | 4.62 * | 13.55 *** | 2.40 NS | 6.0658 ** | 1.0568 NS | 0.5297 NS | 2.187 NS | 3.8977 * | 1.6136 NS | 1.7942 NS | 2.4173 NS | 2.4818 NS |
| Water | 1.89 NS | 0.022 NS | 6.45 * | 0.3452 NS | 1.5247 NS | 0.0591 NS | 4.1561 * | 0.0003 NS | 12.56 ** | 3.4798 NS | 0.0285 NS | 0.1204 NS |
| Irrigation type | 0.07 NS | 0.73 NS | 0.03 NS | 0.0101 NS | 19.9948 *** | 1.9567 NS | 5.1464 * | 0.0322 NS | 0.5127 NS | 0.5534 NS | 5.7069 * | 7.4467 * |
| Fertilizer: Water | 0.02 NS | 19.11 *** | 2.06 NS | 0.0006 NS | 4.6203 * | 0.994 NS | 21.917 *** | 0.6355 NS | 16.13 *** | 0.0051 NS | 7.5205 * | 0.1745 NS |
| Fertilizer: Irrigation type | 0.01 NS | 0.09 NS | 0.05 NS | 0.8626 NS | 0.0181 NS | 0.6036 NS | 7.5522 * | 10.345 ** | 5.0004 * | 1.8445 NS | 1.5065 NS | 0.7521 NS |
| Water: Irrigation type | 0.08 NS | 0.85 NS | 0.14 NS | 0.0163 NS | 1.4698 NS | 0.0159 NS | 0.3192 NS | 3.8835 * | 12.52 ** | 1.7179 NS | 0.0022 NS | 0.0533 NS |
| Fertilizer: Water: Irrigation type | 0.03 NS | 0.60 NS | 0.03 NS | 0.0087 NS | 0.6298 NS | 1.757 NS | 7.7459 * | 13.2488 ** | 6.3025 * | 3.6437 NS | 4.1081 NS | 0.1701 NS |
Note: * p < 0.05); ** p < 0.01, *** p < 0.001; NS = not significant (p < 0.05).
Table 3.
Results of multivariate analysis of variance (ANOVA) of nitrogen isotope (δ15N) content in sugarcane at different growth stages under different water-fertilizer-irrigation method treatments.
Table 3.
Results of multivariate analysis of variance (ANOVA) of nitrogen isotope (δ15N) content in sugarcane at different growth stages under different water-fertilizer-irrigation method treatments.
| δ15N Content ANOVA(F) | ||||||||||||
|---|---|---|---|---|---|---|---|---|---|---|---|---|
| Treatment | Seedling Stage | Tillering Stage | Elongation Stage | Maturity Stage | ||||||||
| Root | Stem | Leaves | Root | Stem | Leaves | Root | Stem | Leaves | Root | Stem | Leaves | |
| Fertilizer | 3.1535 NS | 3.193 NS | 6.197 ** | 1.8479 NS | 2.442 NS | 6.20 ** | 2.1273 NS | 1.4997 NS | 8.44 ** | 5.78 * | 0.1766 NS | 0.6603 NS |
| Water | 0.4023 NS | 3.0349 NS | 0.6727 NS | 0.3144 NS | 4.2454 NS | 0.6727 NS | 0.1676 NS | 10.3 ** | 0.2794 NS | 2.0286 NS | 23.87 *** | 0.009 NS |
| Irrigation type | 26.02 *** | 20.55 *** | 1.5934 NS | 3.081 NS | 10.11 ** | 1.5934 NS | 1.5365 NS | 9.50 ** | 44.40 *** | 7.87 * | 7.7821 * | 14.68 ** |
| Fertilizer: Water | 7.1714 * | 0.7072 NS | 0.0224 NS | 0.667 NS | 4.0186 NS | 0.0224 NS | 0.0454 NS | 8.45 ** | 0.7439 NS | 12.89 ** | 0.1057 NS | 8.20 * |
| Fertilizer: Irrigation type | 0.0169 NS | 0.5526 NS | 15.64 *** | 0.0856 NS | 7.8639 * | 15.64 *** | 4.74 * | 9.50 ** | 0.1627 NS | 0.0663 NS | 0.2831 NS | 2.1108 NS |
| Water: Irrigation type | 11.40 ** | 1.998 NS | 0.2123 NS | 1.1769 NS | 0.0976 NS | 0.2123 NS | 0.0555 NS | 5.86 * | 0.0435 NS | 0.8021 NS | 0.8056 NS | 0.9115 NS |
| Fertilizer: Water: Irrigation type | 3.936 NS | 0.0375 NS | 1.6263 NS | 1.427 NS | 9.83 ** | 1.6263 NS | 1.1962 NS | 5.86 ** | 0.0017 NS | 0.0735 NS | 0.2695 NS | 0.7191 NS |
Note: * p < 0.05; ** p < 0.01, *** p < 0.001; NS = not significant (p < 0.05).
Table 4.
Nitrogen isotope (δ15N) content in soil at different growth stages of sugarcane under different water-fertilizer treatments (for abbreviations, see Table 1).
Table 4.
Nitrogen isotope (δ15N) content in soil at different growth stages of sugarcane under different water-fertilizer treatments (for abbreviations, see Table 1).
| Soil δ15N | |||||
|---|---|---|---|---|---|
| Treatment | Seedling Stage | Tillering Stage | Elongation Stage | Maturity Stage | |
| Drip irrigation | DWMFM | 5.61 ± 2.05 c | 7.30 ± 0.17 c | 8.31 ± 0.31 ab | 7.99 ± 0.18 ab |
| DWMFH | 7.94 ± 0.08 ab | 7.31 ± 0.36 c | 7.50 ± 0.77 bc | 7.95 ± 0.62 ab | |
| DWHFM | 7.73 ± 0.02 ab | 7.24 ± 0.50 c | 7.96 ± 0.38 abc | 7.58 ± 0.23 bc | |
| DWHFH | 8.11 ± 0.16 a | 8.30 ± 0.32 a | 7.03 ± 1.08 c | 8.18 ± 0.49 a | |
| Spray irrigation | SWMFM | 7.12 ± 0.37 abc | 7.69 ± 0 bc | 8.78 ± 0.06 a | 7.64 ± 0.17 bc |
| SWMFH | 6.98 ± 0.47 abc | 7.64 ± 0 bc | 8.10 ± 0.60 abc | 7.72 ± 0.02 abc | |
| SWHFM | 5.27 ± 1.50 c | 7.90 ± 0.37 ab | 8.57 ± 0.23 ab | 7.47 ± 0 bc | |
| SWHFH | 6.17 ± 2.09 abc | 7.91 ± 0.06 ab | 8.08 ± 1.15 abc | 7.33 ± 0 c | |
| Control | WLFL | 8.07 ± 0.35 ab | 7.99 ± 0.20 ab | 9.00 ± 0.15 a | 7.59 ± 0.37 bc |
| ANOVA(F) | |||||
| Fertilizer | 3.3368 * | 4.5668 * | 6.7433 ** | 0.7322 | |
| Water | 0.0407 | 9.9021 ** | 0.9674 | 2.0059 | |
| Irrigation type | 4.4094 | 4.9108 * | 6.7418 * | 8.9748 ** | |
| Fertilizer: Water | 0.2463 | 6.0143 * | 0.0044 | 0.6871 | |
| Fertilizer: Irrigation type | 1.1312 | 6.0869 * | 0.2994 | 1.4266 | |
| Water: Irrigation type | 7.2302 * | 0.9507 | 0.3205 | 0.5249 | |
| Fertilizer: Water: Irrigation type | 2.6952 | 4.7163 * | 0.0757 | 2.8576 | |
Values within Columns (treatments) followed by different letters (a,b,c) are significantly different (* p < 0.05; ** p < 0.01; NS = not significant).
Table 5.
Regression curves for photosynthesis, transpiration, leaf area index, and soil respiration at different growth stages of sugarcane under different water (x)-fertilizer (y) treatments.
Table 5.
Regression curves for photosynthesis, transpiration, leaf area index, and soil respiration at different growth stages of sugarcane under different water (x)-fertilizer (y) treatments.
| Response Variable/Z | Growth Stages of Sugarcane | Regression Equation | R2 |
|---|---|---|---|
| Photosynthetic/Z1 | Seedling | Z1 = 13.65 − 0.006x + 0.01y + 1.068x2 − 2.77E−7y2 | 0.252 |
| Tillering | Z1 = 26.78 − 9.71E−6x + 4.36yE−4 − 1.40E−7x2 + 3.24E−7y2 | 0.328 | |
| Elongation | Z1 = 11.49 − 2.88E−5x − 3.64E−5y − 6.43E−9x2 + 5.52E−9y2 | 0.206 | |
| Transpiration/Z2 | Seedling | Z2 = 1.33 − 0.003x − 0.005y − 3.83E−7x2 − 1.31E−6y2 | 0.259 |
| Tillering | Z2 = 5.22 − 1.45E−7x − 2.69E−5y − 3.64E−8x2 − 8.17E−7y2 | 0.241 | |
| Elongation | Z2 = 2.39 + 4.84E−6x + 6.10E−6y − 3.02E−9x2 − 5.57E−10y2 | 0.370 | |
| Mean leaf area index/Z3 | Seedling | Z3 = 0.55 − 1.32E−5x + 9.39E−5y − 3.70E−10x2 + 2.72E−10y2 | 0.191 |
| Tillering | Z3 = 0.87 − 1.19E−5x − 1.04E−4y + 7.26E−9x2 + 3.76E−8y2 | 0.185 | |
| Elongation | Z3 = 1.097+2.17E−6x + 2.74E−6y + 1.556E−9x2 − 1.44E−9y2 | 0.499 | |
| Soil respiration/Z4 | Seedling | Z4 = 3.02 − 0.001x + 0.003y + 1.84E−7x2 − 6.07E−7y2 | 0.005 |
| Tillering | Z4 = 3.98 + 7.75E−5x − 6.38E−4y + 1.26E−9x2 + 1.27E−7y2 | 0.058 | |
| Elongation | Z4 = 2066 − 4.37E−5x − 5.51E−5y + 1.77E−9x2 + 2.86E−9y2 | 0.147 |
Table 6.
Results of correlation analysis between soil nitrogen isotope (δ15N) content in different growth stages of sugarcane and different plant and soil parameters.
Table 6.
Results of correlation analysis between soil nitrogen isotope (δ15N) content in different growth stages of sugarcane and different plant and soil parameters.
| Seedling Stage | Tillering Stage | Elongation Stage | ||||||||||
|---|---|---|---|---|---|---|---|---|---|---|---|---|
| Root δ15N | Stem δ15N | Leaf δ15N | Soil δ15N | Root δ15N | Stem δ15N | Leaf δ15N | Soil δ15N | Root δ15N | Stem δ15N | Leaf δ15N | Soil δ15N | |
| Photosynthesis | 0.5328 | 0.2318 | 0.906 | 0.008 | 0.2304 | 0.631 | 0.4559 | 0.1302 | 0.582 | 0.7312 | 0.789 | 0.2715 |
| Mean transpiration | 0.9773 | 0.6276 | 0.539 | 0.52 | 0.9094 | 0.0424 | 0.7124 | 0.1364 | 0.474 | 0.6846 | 0.2777 | 0.6968 |
| Total leaf area index | 0.5184 | 0.1731 | 0.049 | 0.775 | 0.6713 | 0.2921 | 0.0076 | 0.6224 | 0.819 | 0.9371 | 0.0607 | 0.0052 |
| Mean leaf area index | 0.1732 | 0.0385 | 0.233 | 0.880 | 0.6747 | 0.2826 | 0.0082 | 0.6118 | 0.820 | 0.9321 | 0.0606 | 0.0051 |
| Soil water | 0.0007 | 0.0002 | 0.503 | 0.145 | 0.9862 | 0.7678 | 0.8841 | 0.5547 | 0.011 | 0.4652 | 0.6391 | 0.7835 |
| Soil temperature | 0.0353 | 0.0043 | 0.497 | 0.023 | 0.0602 | 0.7234 | 0.1011 | 0.1295 | 0.228 | 0.4214 | 0.078 | 0.0931 |
| Soil electrical conductivity | 0.0307 | 0.0275 | 0.840 | 0.135 | 0.6173 | 0.3567 | 0.5065 | 0.0173 | 0.604 | 0.9897 | 0.0102 | 0.0001 |
| Soil respiration | 0.4552 | 0.6968 | 0.456 | 0.414 | 0.1811 | 0.1961 | 0.882 | 0.1661 | 0.273 | 0.3582 | 0.0085 | 0.1303 |
Publisher’s Note: MDPI stays neutral with regard to jurisdictional claims in published maps and institutional affiliations. |
© 2021 by the authors. Licensee MDPI, Basel, Switzerland. This article is an open access article distributed under the terms and conditions of the Creative Commons Attribution (CC BY) license (https://creativecommons.org/licenses/by/4.0/).
Share and Cite
MDPI and ACS Style
Ma, Z.; Wu, W.; Alatalo, J.M.; Fu, W.; Bai, Y. Optimal Water-Fertilizer Combinations for Efficient Nitrogen Fixation by Sugarcane at Different Stages of Growth. Water 2021, 13, 2895. https://doi.org/10.3390/w13202895
AMA Style
Ma Z, Wu W, Alatalo JM, Fu W, Bai Y. Optimal Water-Fertilizer Combinations for Efficient Nitrogen Fixation by Sugarcane at Different Stages of Growth. Water. 2021; 13(20):2895. https://doi.org/10.3390/w13202895
Chicago/Turabian StyleMa, Zhanxia, Weixiong Wu, Juha M. Alatalo, Wuxiang Fu, and Yang Bai. 2021. "Optimal Water-Fertilizer Combinations for Efficient Nitrogen Fixation by Sugarcane at Different Stages of Growth" Water 13, no. 20: 2895. https://doi.org/10.3390/w13202895
Note that from the first issue of 2016, this journal uses article numbers instead of page numbers. See further details here.