
Seasonal Variations in Dissolved Organic Carbon in the Source Region of the Yellow River on the Tibetan Plateau

1
College of Resources and Environmental Engineering, Tianshui Normal University, Tianshui 741000, China
2
Shaanxi Key Laboratory of Earth Surface System and Environmental Carrying Capacity, Northwest University, Xi’an 710127, China
3
College of Urban and Environmental Sciences, Northwest University, Xi’an 710127, China
*
Author to whom correspondence should be addressed.
Water 2021, 13(20), 2901; https://doi.org/10.3390/w13202901
Submission received: 6 August 2021
/
Revised: 24 September 2021
/
Accepted: 4 October 2021
/
Published: 15 October 2021
(This article belongs to the Special Issue Vulnerability of Mountainous Water Resources and Hydrological Regimes)
Abstract
:Rivers as the link between terrestrial ecosystems and oceans have been demonstrated to transport a large amount of dissolved organic carbon (DOC) to downstream ecosystems. In the source region of the Yellow River (SRYR), climate warming has resulted in the rapid retreat of glaciers and permafrost, which has raised discussion on whether DOC production will increase significantly. Here, we present three-year data of DOC concentrations in river water and precipitation, explore the deposition and transport processes of DOC from SRYR. Results show that annual mean concentrations of riverine DOC ranged from 2.03 to 2.34 mg/L, with an average of 2.21 mg/L. Its seasonal variation is characterized by the highest concentration in spring and summer (2.65 mg/L and 2.62 mg/L, respectively), followed by autumn (1.95 mg/L), and the lowest in winter (1.44 mg/L), which is closely related to changes in river runoff under the influence of precipitation and temperature. The average concentration of DOC in precipitation (2.18 mg/L) is comparable with riverine DOC, while the value is inversely related to precipitation amount and is considered to be the result of precipitation dilution. DOC deposition flux in precipitation that is affected by both precipitation amount and DOC concentration roughly was 86,080, 105,804, and 73,072 tons/year from 2013 to 2015, respectively. DOC flux delivered by the river ranged from 24,629 to 37,539 tons/year and was dominated by river discharge. Although permafrost degradation in SRYR is increasing, DOC yield is not as significant as previously assumed and is much less than other large rivers in the world.
1. Introduction
Dissolved organic carbon (DOC) in surface water has crucial implications as a source of biological production [1,2]. It also has a close impact on dominant mechanisms leading the dynamic of the aquatic biogeochemical cycle or on other factors including light penetration, transportation of trace metals, secondary production, or the flow of nitrogen [3,4,5,6,7,8]. Due to the formation of DOM organic pollutant colloid, DOC is considered to increase the solubility of some organic pollutants, thus affecting the distribution of organic pollutants in water [9]. Every year, rivers probably carry up to 0.38–0.5 Gt of organic carbon (OC) to the oceans globally, and 55% of the carried OC is in the dissolved form [10,11]. The pursuit of new cognition of migration characteristics of DOC in rivers and determine its sources is of great significance to understand the global carbon cycle and its application mechanism.
To date, many studies conducted on rivers around the world have reported that DOC levels change over time and space due to complex sources of catchments and aquatic ecosystems [12,13,14,15,16,17,18]. Factors such as river discharge, basin precipitation, air temperature, the metabolism of phytoplankton, and atmospheric carbon dioxide concentration affect both the quality and quantity of DOC [12]. For instance, several studies on rivers in the US and China have proved that DOC is related to river discharge and basin precipitation [19,20]. In rivers in the UK, the increase in DOC concentration is associated with an increase in the temperature and the frequency of severe droughts [21]. In addition to climatic and hydrological factors, anthropogenic activities also have a great impact on the transport of DOC in rivers, e.g., acid deposition, nitrogen deposition, and agricultural activities [22,23,24,25,26,27]. In particular, land use and cover change will greatly affect the variation of riverine DOC due to its profound impact on the surrounding ecosystem [21]. Some studies have shown that DOC amount in river ecosystem is potentially increasing with global warming as an extensive release from permafrost degradation and glacier retreat [28,29].
The Tibetan Plateau (TP) is one of the most vital and susceptible regions in the global climate system [30]. Global warming has resulted in the rapid shrinkage of glaciers and permafrost in this region [30,31,32], which has had a significant impact on carbon balance [33,34,35]. As the “water tower” of Asia, TP holds the headwaters of numerous large rivers, and the Yellow River is one of them. The Yellow River is located in the middle latitude and flows through arid and semi-arid areas, which is famous for a large amount of sediment delivery. Carbon in rivers mainly exists in dissolved form, except during the flood period [36]. DOC involving the spatiotemporal distribution, seasonal fluxes, and source variation has been studied in the middle and lower reaches of the Yellow River [36,37,38,39], in which DOC production is closely related to soil erosion and human activities [33,37]. Subjected to the influence of topographic features, lithology, hydrology, and climate, the output, and transportation of DOC in the different sections of the Yellow River are discrepant. Previous studies showed that a profound change has occurred in the source region of the Yellow River (SRYR). For example, annual runoff has decreased from the late 1980s to the 2000s owing to precipitation decline, and permafrost degradation has exerted more influence on surface runoff than glacier retreat [40]. These processes may affect soil/rock erosion and solute release [41]. However, research on DOC concentration level and its influencing factors in SRYR is limited, and only a few studies are based on a single sampling event. Therefore, to obtain a comprehensive understanding of DOC in the Yellow River basin, we need to make clear how much DOC is transported downstream, and under the considerable impact of climate change, what influence could be produced by hydrological and meteorological factors on DOC in SRYR.
Herein, we present continuous data set of the concentrations and fluxes of DOC in river and precipitation in SRYR during three consecutive years (2013–2015). These data, combined with river discharge, temperature, and precipitation amount, provide a comprehensive understanding of the temporal evolution of riverine and precipitation DOC in a warming climate. This paper primarily focused on the seasonal and annual variations of DOC concentrations, fluxes, and yields estimation in SRYR, the potential influence of hydrological and meteorological factors, as well as a comparison with other watersheds around the world.
2. Data and Methods
2.1. Study Area
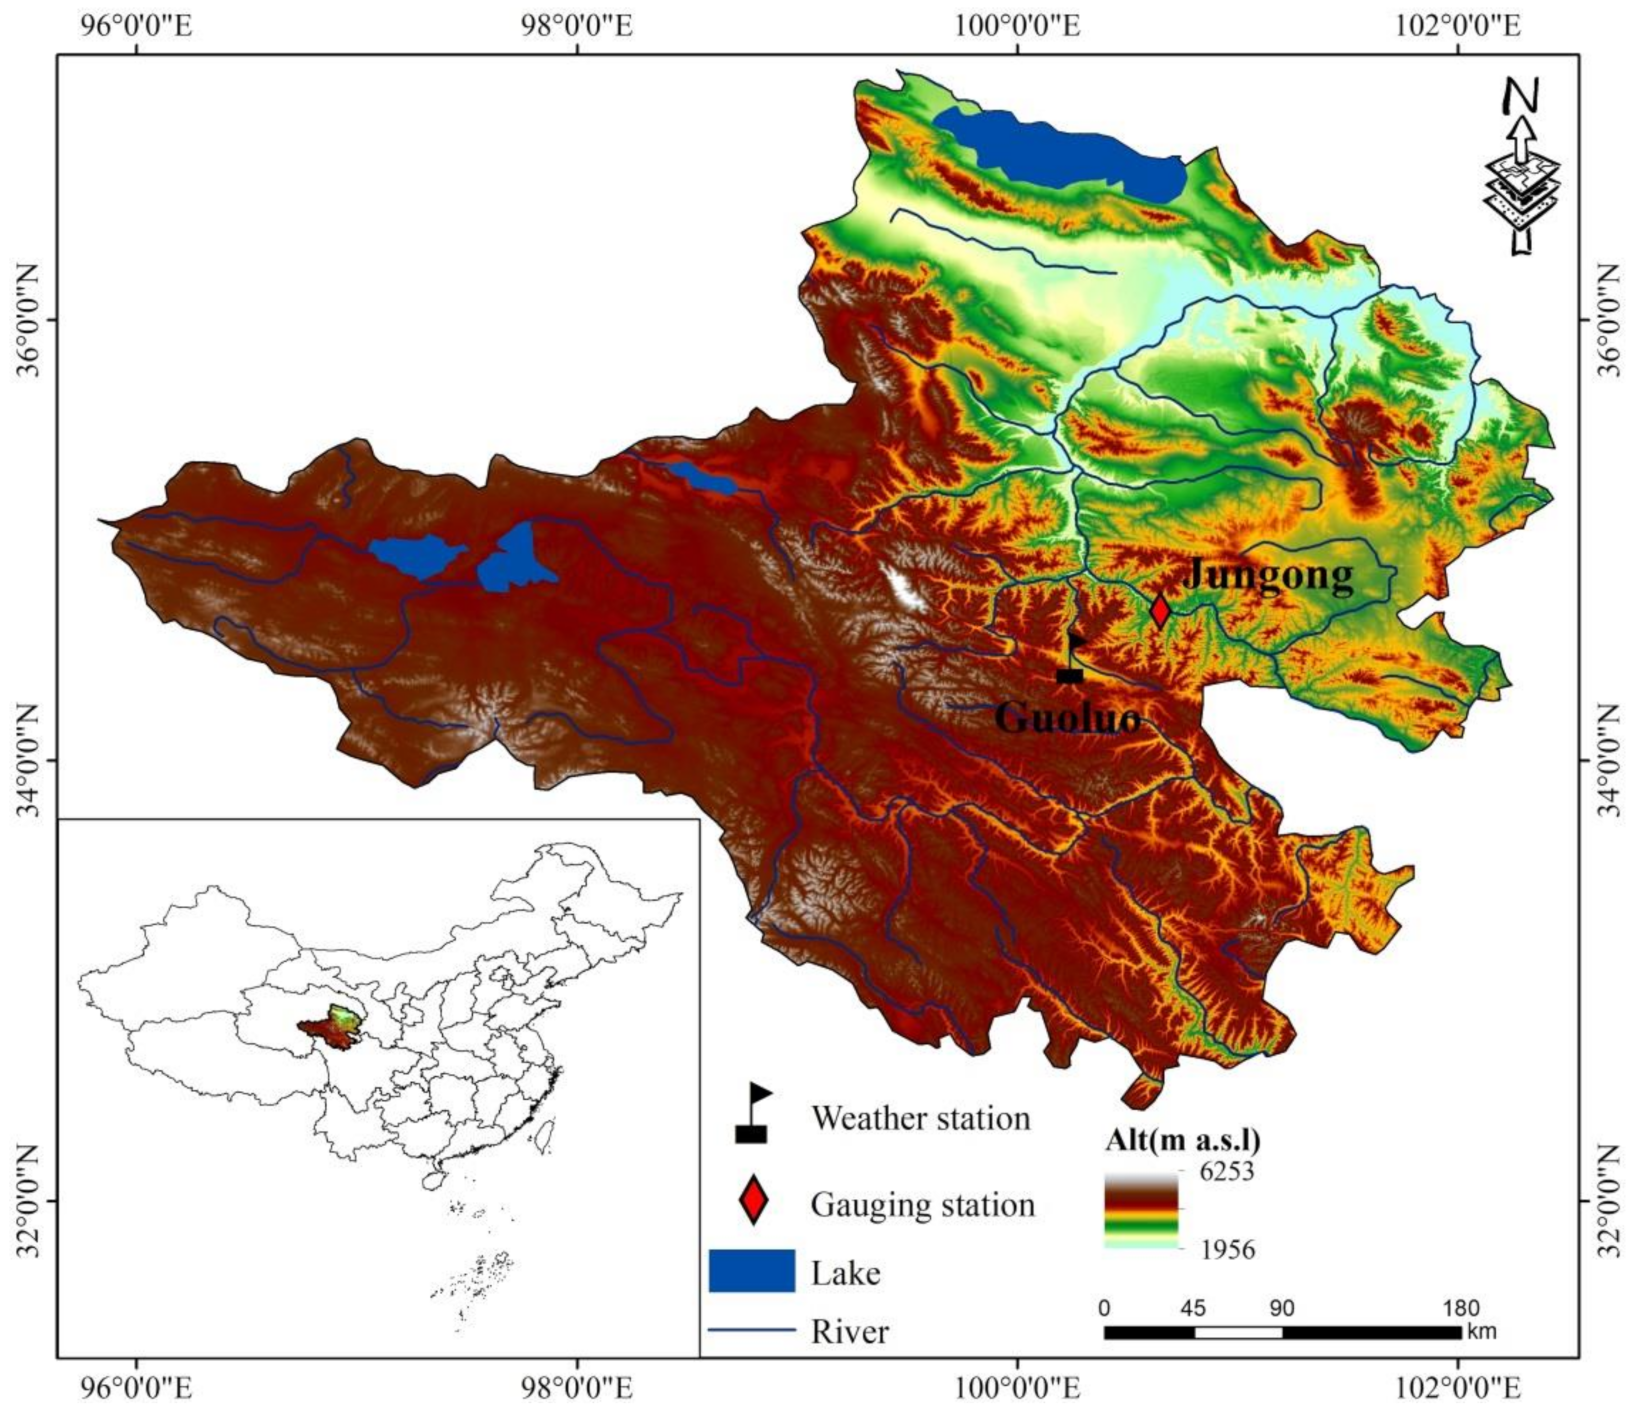
SRYR lies in the eastern Tibetan Plateau, covering an area of 121,972 km2 (Figure 1). Glaciers and frozen soil mostly covered the areas above Huangheyan hydrological station, with a glacier area of 134.2 km2 in total [42]. The continuous sampling point was at the Jungong gauging station (JGS) (34°68″ N, 100°65″ E, 3719 m), which is situated in the eastern part of SRYR. Its catchment area is 98,414 km2 and is controlled by a typical continental climate, with daily average air temperature ranging between −33 °C and 28 °C during the sampling period. Negative temperatures generally continued from October to the following April. Average annual precipitation in the area ranges from 300 to 350 mm, mostly concentrated from July to September in the form of rainfall. Snowfall is the main type of precipitation during January–May and October–December, occupying 33.2% of annual precipitation.
2.2. Sample Collection
River water (n = 614) was collected at ~10 cm beneath the water surface at 8:00 a.m., with an interval of two days at JGS in SRYR from 2013 to 2015. Sampling was absent from January to February in 2013, January in 2014, and November to December in 2015. Precipitation (n = 146) was sampled from May to September in 2013–2015, with 44 samples in 2013, 72 samples in 2014, and 30 samples in 2015. After sampling, river water was immediately filtered through precombusted Whatman glass fiber membranes (pore size 0.7 μm) for DOC analysis and Whatman nitrate cellulose filters for ion analysis. The sampling and storage containers were precleaned, using 10% hydrochloric acid and MilliQ deionized water [43]. Field samples were kept frozen in a refrigerator and then transported to the State Key Laboratory of Cryospheric Science (SKLCS) of the Chinese Academy of Sciences (CAS) and Environmental Comprehensive Analysis Laboratory (ECAL) of Tianshui Normal University (TNU) until laboratory analysis. Data of river discharge, air temperature, and precipitation were provided by JGS and the Guoluo weather station.
2.3. Laboratory Analysis
DOC concentrations were analyzed by Vario EL TOC/TNb analyzer (Elementar, Hanau, Germany) in the ECAL. The system was calibrated using potassium hydrogen phthalate standards for DOC. The limit of detection was 30 μg/L, and the reproducibility was better than 5% [43]. The mean blank value was detected as 76 μg/L, which was subtracted by all the DOC concentration data. Concentrations of cations (Ca2+, Mg2+, K+, Na+) were analyzed by Dionex-600 ion chromatography, using a CS12A separation column, 20 mM MSA eluent, and CSRS-ULTRA-II suppressor in the SKLCS. Concentrations of major anions (Cl−, NO3−, SO42−) were analyzed by Dionex-2500 ion chromatography, using an IonPac AS11-HC column, 25 mM KOH eluent, and ASRSULTRA-II suppressor. The detection limit of these ions was below 10 μg/L, with a precision of ±1% [44].
2.4. Flux Calculation and Statistical Analysis
Daily flux (Fd) of riverine DOC from SRYR was calculated by daily DOC concentration (Cd) multiplied by daily average discharge (Qd). The annual flux (Fy) of DOC was reckoned with the accumulation of daily flux in one year. The errors in DOC budgets were defined as the standard deviations of DOC concentration multiplied by river runoff. This method has been adopted in recent estimates [45,46]. The calculation formula is as follows in Equation (1):
Flux emphasized DOC output throughout the watershed; however, the impact from the watershed area was not considered. In recent years, yield (Yyear) is often used to express the DOC production capacity of a watershed, which can be obtained from annual flux (Fy) divided by watershed area (Swater). Compared with flux, yield can eliminate the influence of the watershed area and better contrast with the other basins in the world on DOC output capacity (Equation (2)).
The monthly wet deposition flux of DOC at JGS was calculated by monthly precipitations multiplied by monthly mean DOC concentrations. Annual wet deposition flux was obtained through the annual average DOC concentration in precipitation multiplied by the annual total precipitation. The sediment flux of DOC in the whole basin was approximately estimated from the DOC annual deposition flux multiplied by the watershed area.
Correlation analysis was carried out using Pearson correlation for exploring the impact of meteorological and hydrological factors on DOC. Statistically significant values were determined at p < 0.05 unless stated otherwise. All statistical analyses were performed with Origin Pro 9.0 (OriginLab, Inc., Northampton, MA, USA).
3. Results and Discussion
3.1. Seasonal Variations in DOC Concentrations in the River
Annual mean DOC concentrations in SRYR were 2.3 ± 1.1 mg/L in 2013, 2.2 ± 1.4 mg/L in 2014, and 2.0 ± 0.5 mg/L in 2015 (Table 1). It was much lower than those in tropical areas (5.2 − 9.0 mg/L) [15], Arctic regions (12 mg/L) [47], and the global average (5.9 mg/L) [48], and was comparable with rivers in the Tibetan Plateau (2.09 ± 0.41 mg/L) [49].
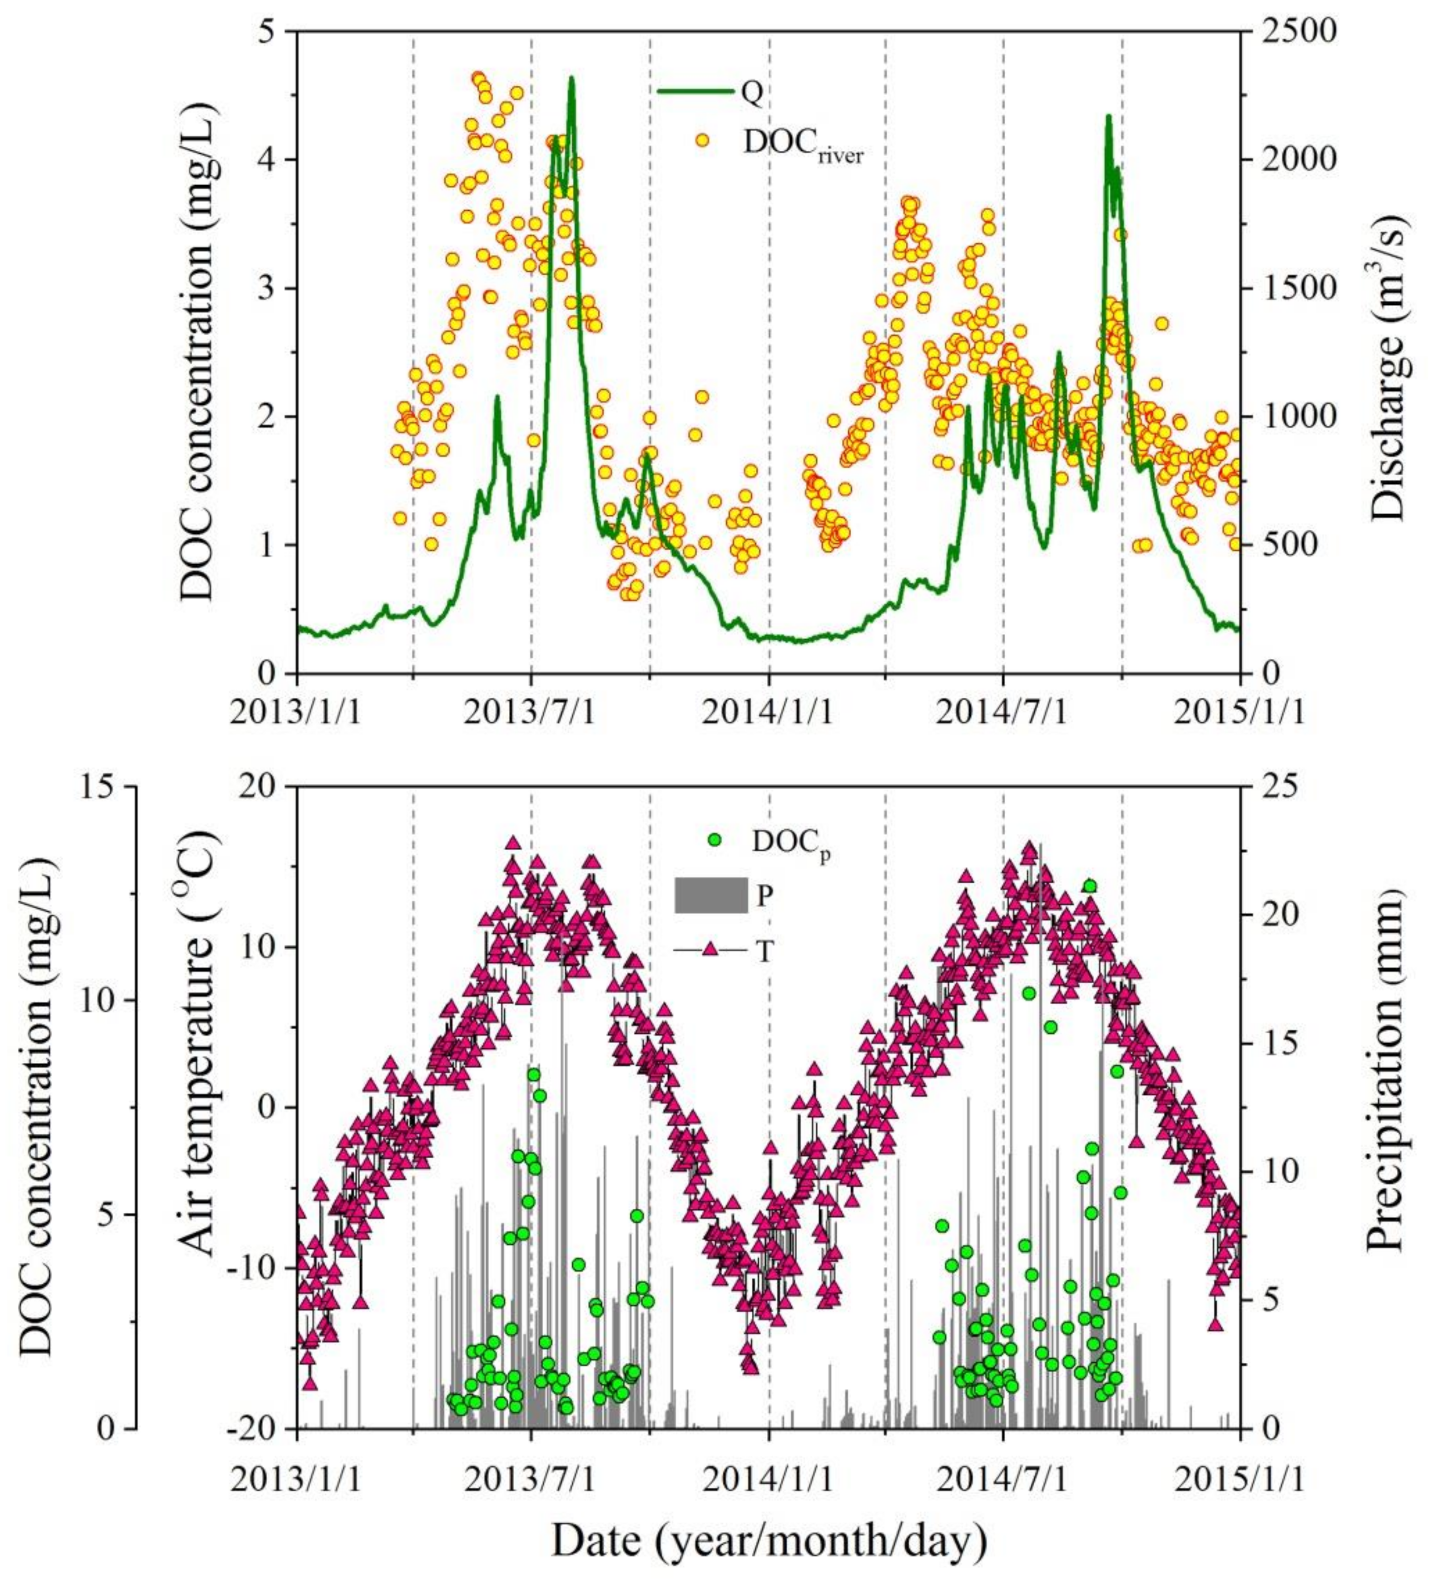
The temporal variations in river discharge, air temperature, precipitation, and riverine DOC concentration from SRYR during 2013 to 2014 are shown in Figure 2, in order to present the seasonal and interannual characteristics of DOC concentration and its relationship with meteorological and hydrological elements. With the seasonal variation of precipitation, temperature, and runoff, the concentration of DOC in the river displayed obvious seasonality. The average ion concentrations in spring, summer, autumn, and winter were 2.65, 2.62, 1.95, and 1.44 mg/L, respectively, indicating a significant trend with the maximum in summer and the minimum in winter. Specifically, three decreasing peaks of DOC could be observed. In 2013, they were displayed in the middle of May (4.6 mg/L), the end of July (4.1 mg/L), and a small peak in October (1.9 mg/L). In 2014, three peaks were found at the end of April (5.4 mg/L), in the middle of June (3.5 mg/L), and October (2.8 mg/L) (Figure 2). The first concentration peaks appeared in the period of rapidly climbing temperatures, during which the daily average temperature increased rapidly from 0 °C to more than 10 °C roughly from mid-April to the end of May. Frequent precipitation occurred (127.5 mm), and the runoff formed a small peak (1065 m3/s) in the same duration of 2013. However, this DOC peak did not correspond to runoff and precipitation in 2014. The second concentration peak, occurring from June to August, corresponded very well to the runoff peak in both 2013 and 2014, during which the temperature reached its maximum in a year (above 20 °C), and more than 40% of precipitation of the year dropped. Although the third DOC peaks that appeared in October were small, they still obtained a better response from runoff, especially in 2014 (the runoff reached its maximum in that year, with the value of 2170 m3/s).
Correlation analysis indicates that a significant positive correlation between DOC concentration and discharge (R = 0.5, p < 0.05) exists (Table 2), even though the occurrence time and strength of both DOC and discharge peaks are not completely consistent. In 2013, maximum DOC concentration appeared, accompanied by the first small peak of discharge in June, and the highest discharge was synchronous with the relatively lower DOC concentration in August. In 2014, the strongest indication of DOC arrived ahead of the first peak of discharge and the smallest peak of DOC was reached, along with the largest peak of discharge in October. This is consistent with a previous study, in which maximum DOC concentrations were observed up to a few days ahead of peak runoff. It may suggest either a large amount of DOC is easily mobilized with the arrival of the first peak of discharge, or that a concentrated large amount of runoff produces a dilution effect [50].
Variations in DOC concentrations are closely associated with the biogeochemical processes [51,52]. At the beginning of ablation seasons (spring or early summer), the temperature rises to more than 0 °C, and frozen soil and glaciers begin to melt. Increasing snowmelt and/or runoff causes sharp accumulation and input of allochthonous DOC [50]. Meltwater runoff is limited on the soil surface due to the still frozen soils, then it immerses with decrepit plants and detritus when it is concentrated near the snow–soil interface or soil surface. This process that facilitates the separation of DOC from the senescent plant would lead to the first peak of DOC in the spring or early summer [53]. Runoff also has a small peak during this period, indicating that DOC concentration from April to May is mainly related to the recharge of the glacier and frozen soil meltwater. In the summer (roughly from June to August), runoff, daily average temperature, and precipitation reach their maximum value, and therefore, more meltwater causes soil erosion and stronger flushing, which carries the water into deeper soil layers, and then OC transformation and transport are possible. Increasing temperature and more ablation enhanced river flow and formed the second discharge peak, suggesting that DOC produced in this period may have mainly come from soil erosion driven by precipitation and meltwater. However, a large amount of DOC in surface soils was delivered in the first peak flow, leading to an obvious reduction in DOC concentration in the river. Previous research indicated that once melt flow penetrated into deeper soil layers, increased capability for trapping DOC rather than eluviation of DOC would result as a consequence of adsorption [53]. In the autumn, a small peak of DOC is completely related to the last summit of discharge, which may be induced by frequent precipitation or the lag effects of deeper frozen ablation, suggesting that precipitation deposition may mainly contribute to DOC in the river water during this period.
3.2. DOC Fluxes in the River
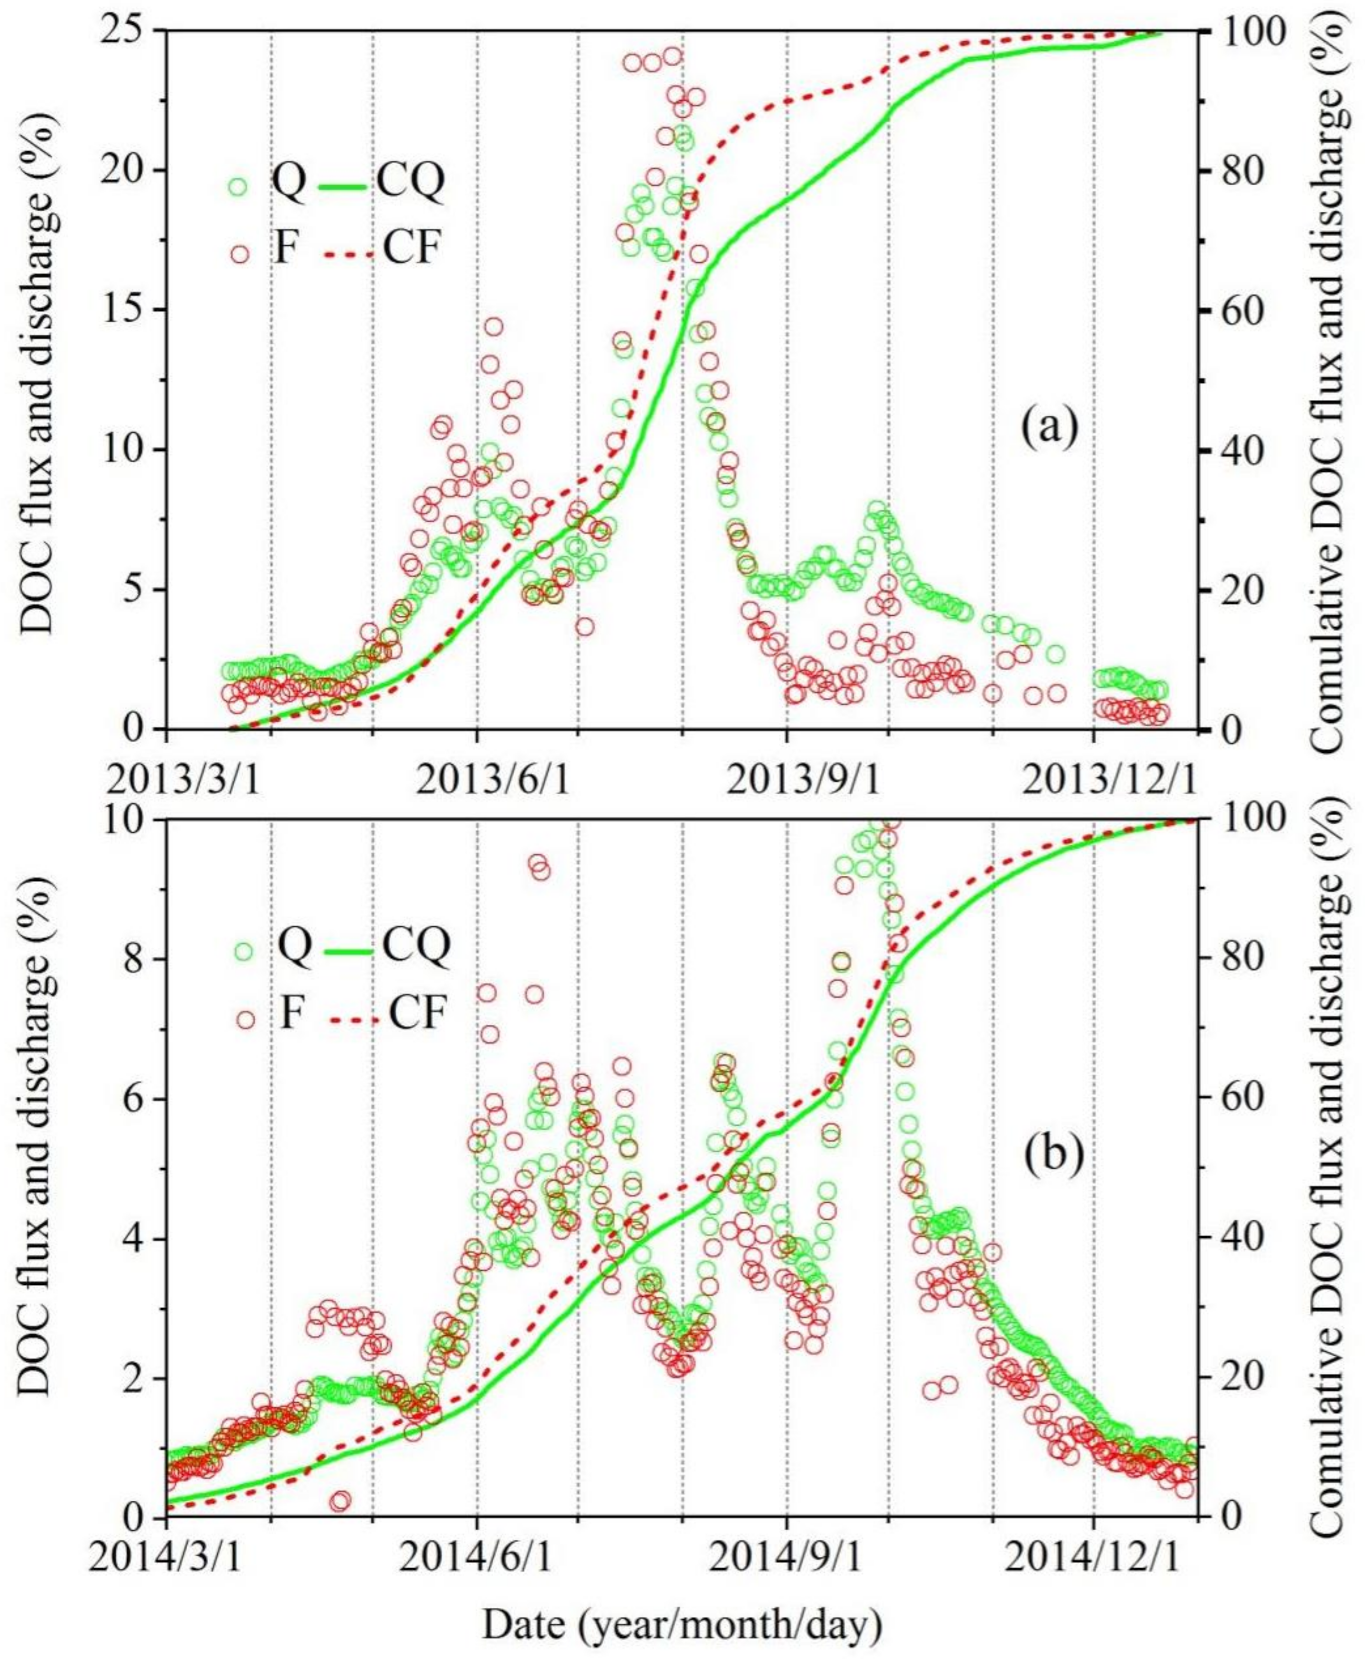
Figure 3 shows the temporal variation in the daily and cumulative DOC fluxes from 2013 to 2014. Cumulative discharge and fluxes raised rapidly when the first peak runoff arrived in early May 2013 and early July 2014. The largest daily fluxes appeared during August in 2013 (740.8 tons) and September in 2014 (524.2 tons), and the smallest ones appeared during December (11.9 tons in 2013 and 13.3 tons in 2014) (Figure 3). Total daily cumulative discharges were 9.4 × 10⁹ m3 in 2013, 1.7 × 10¹⁰ m3 in 2014, and 8.6 × 10⁹ m3 in 2015, which transported an estimated 26,058 tons, 37,539 tons, and 24,629 tons of DOC, respectively (Table 1). A previous study estimated that 60,000 tons/year of DOC were transported to the ocean by the Yellow River [39], which means that nearly half of DOC is produced in the upper part of the Yellow River and delivered downstream. The significant seasonality of DOC fluxes from SRYR is closely related to river discharge. Fluxes from runoff in the late ablation period (roughly from September to October) are significant, compared with those from the water carried by melt snow or soil water during the early ablation period (roughly from the end of April to early May). At the beginning of the ablation period, DOC fluxes occupied only 11.3 % (2013) and 8.2 % (2014) of total DOC fluxes despite higher DOC concentrations. At the end of the ablation period, although DOC concentrations were lower, DOC fluxes accounted for 94.6 % (2013) and 79.2 % (2014) due to high discharge (Figure 3). Previous studies also concluded that DOC fluxes were dominated more by water discharge than DOC concentrations [6,20].
We established a database of DOC fluxes and yields in rivers from major world temperate zones (Table 3). Most of the drainage basin covers multiple climatic zones, but only the dominated climate type is considered in this paper. Although DOC fluxes in SRYR are totally very small, compared with other large rivers in the world, especially the rivers in the tropical wet area represented by the Amazon (26.3 × 10⁶ tons/year), Zaire (9.1 × 10⁶ tons/year) [54,55,56], and Orinoco (3.3 × 10⁶ tons/year) rivers [7], the yields exceed that of many rivers in the tropical and temperate dry zones (Table 3), indicating a potential DOC output capacity in SRYR. For instance, the fluxes in SRYR are less than the Nile River, but the yield is much greater than the latter. Moreover, Tundra and Taiga zones also provide adequate sources of DOC, such as Ob (1.4 tons/km2/year), as well as the Yukon River basin (1.8 tons/km2/year), which has lower air temperature but could release massive DOC, only less than tropical wet climate [57]. This means that DOC is more likely to be generated in the environment condition characterized by higher coverage of vegetation, extensive permafrost distribution, and a humid environment. DOC in rivers are generally subdivided into allochthonous carbon produced by the terrestrial biosphere on land and autochthonous carbon produced by the phytoplankton in lakes and in the river itself, the soil is the major allochthonous contributor to riverine DOC [58,59]. The humid climate and environment nourish plants more, but also leach the organic matter from the soil more easily. Furthermore, the developed hydrological connectivity in the humid climate area easily discharges the organic matter from the soil into the stream, resulting in a higher riverine DOC concentration [60]. The reason that SRYR has a higher DOC yield than other temperate regions is likely to be the contribution from frozen soil degradation. For instance, the DOC flux in SRYR is far less than that in the whole Yellow River, but the yield is comparable to it (Table 3). The permafrost area is regarded as one of the largest DOC reservoirs on the continent [61]. In the past few decades, similar to other permafrost areas, SRYR has experienced more swift warming [62,63]. As a consequence, glacier shrinkage and permafrost degradation are accelerating [64,65,66], and thus, the water environment has undergone profound changes [67,68]. The temperature of permafrost has increased [69], and the soil active layer has deepened [70], resulting in the increase in runoff and DOC concentration in the water body. That is why the potential ability of frozen soil to release DOC in SRYR has attracted more attention. However, thus far, DOC released from SRYR is not considered as we have expected; with the intensification of global warming, we can speculate that the permafrost distribution area represented by SRYR will play a more important role in DOC release.
3.3. DOC Concentrations and Fluxes in Precipitation
Mean DOC concentration in precipitation was 2.2 mg/L during 2013–2015, ranging from 0.59 to 12.1 mg/L. Compared with the human settlements, it is higher than in Lhasa (1.10 mg/L) [77] and slightly lower than in Beijing (3.5 mg/L) [78]. DOC concentrations in a single precipitation event showed a great fluctuation. In 2013, they waved from 1.1 to 8.2 mg/L in July and 0.7 to 4.9 mg/L in September; in 2014, two fluctuations occurred in May and September, separately with the range of 1.1 to 4.7 mg/L and 0.7 to 12.1 mg/L. Evidently, these four fluctuations corresponded to the DOC concentration peak in the river, respectively (Figure 2). There was no significant correlation between DOC concentration and the precipitation amount in a single rainfall event, yet the monthly average concentration had the opposite trend with the monthly precipitation (Figure 4). Similar results were also found in the study of Lhasa [77], which is probably related to the fact that the fossil fuel and biomass-burning activities in this area are limited, and more precipitation may dilute DOC concentrations. This is also an indication of the discrepancy of DOC sources between precipitation and river water: previous studies have stated clearly that DOC concentrations in precipitation are primarily controlled by atmospheric conditions, e.g., mineral dust, fossil fuel, and biomass-burning activities [79,80].
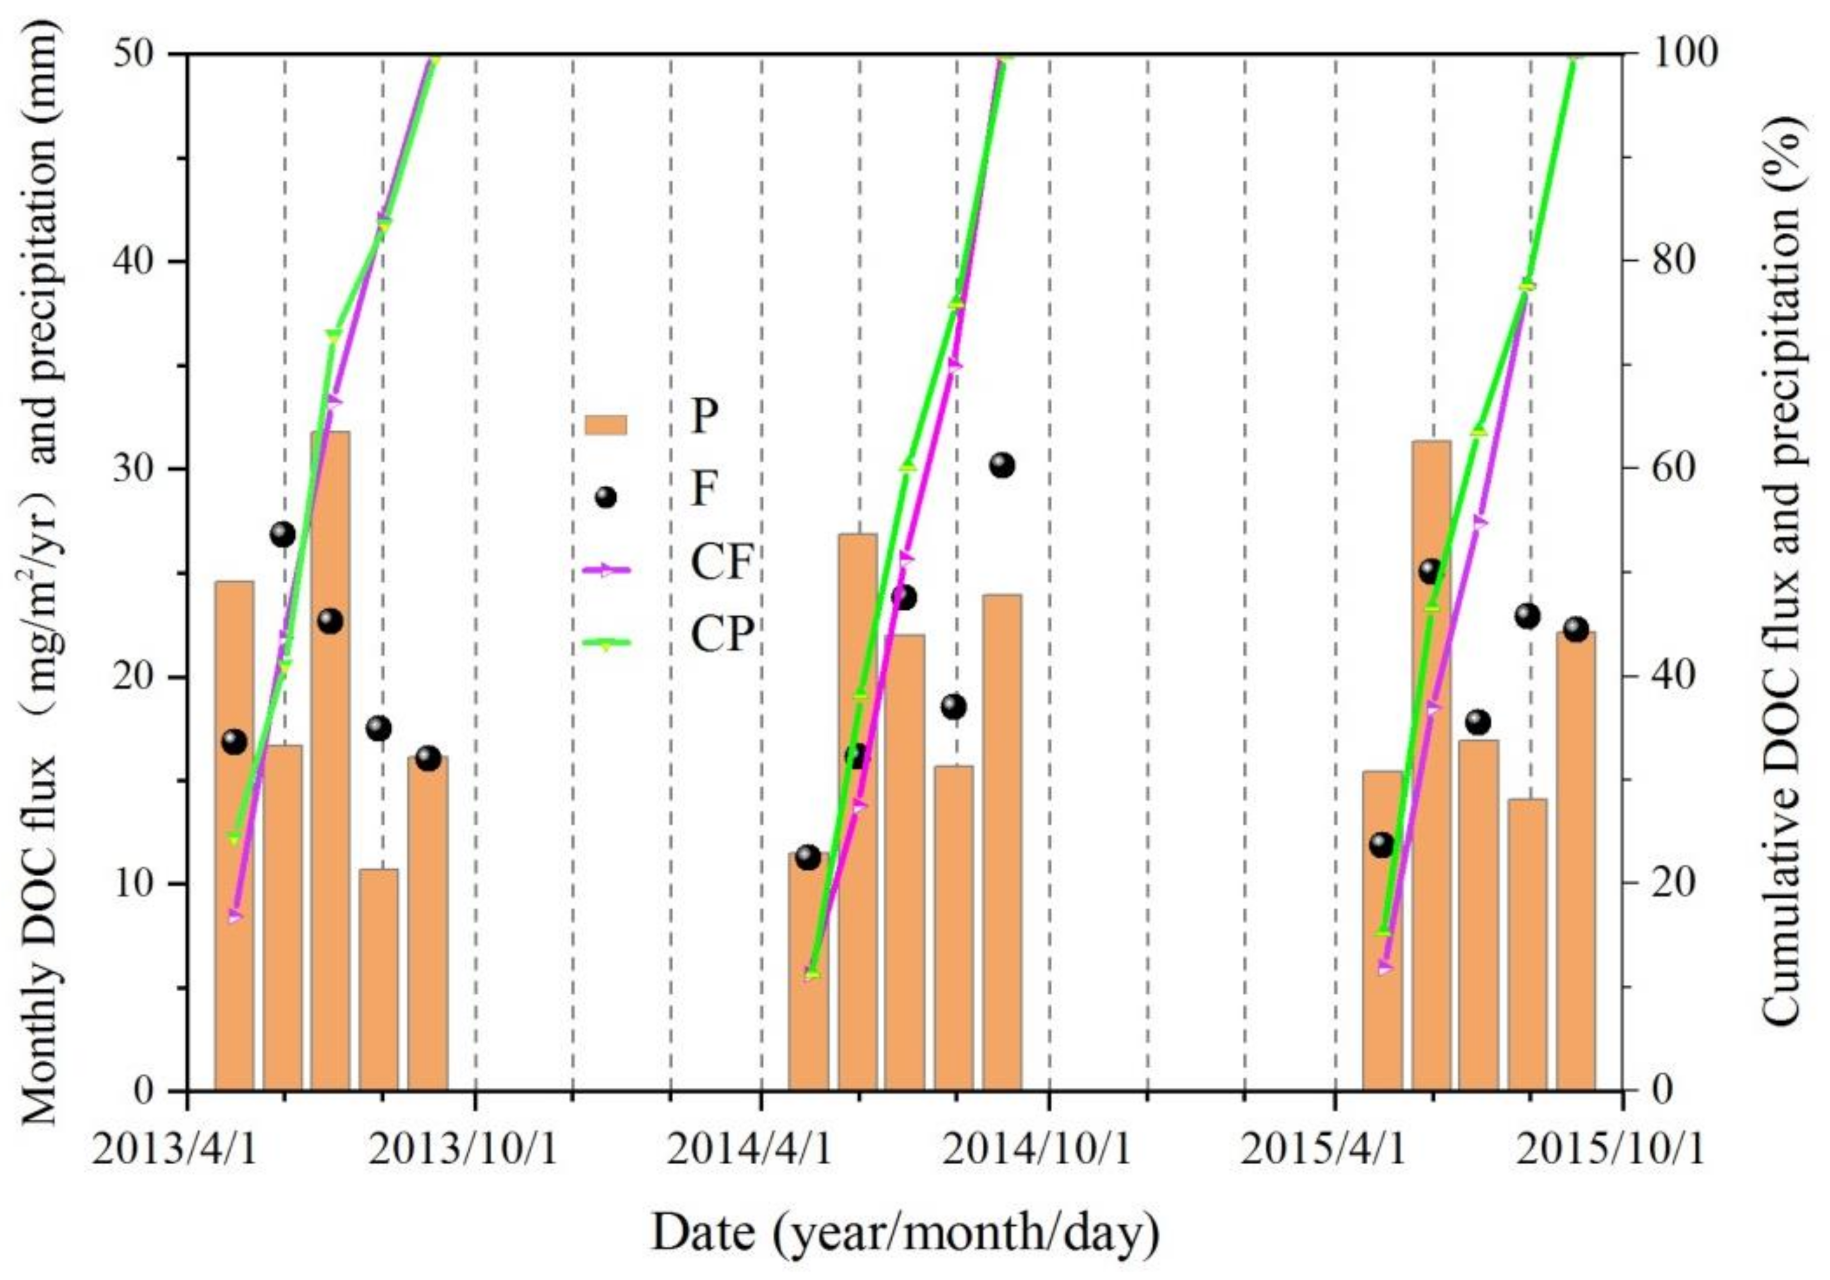
DOC fluxes in precipitation give us a chance to understand the wet deposition of DOC in the watershed basin and its possible relationship with that delivered by river water. According to approximate estimation (detailed in the part of flux calculation and statistical analysis), from 2013 to 2015, about 86,080, 105,804, and 73,072 tons of DOC were brought to SRYR, by 485.4, 487.1, and 463.1 mm precipitation, respectively (Table 1). This estimation result ignores the discrepancy of precipitation and its DOC concentration in different areas of the basin. The error is that the precipitation and DOC concentration in JGS do not reflect the actual situation of the whole basin. Nevertheless, we collected the precipitation data from the other meteorological stations in SRYR 2013, such as Dari and Xinhai stations, and their average values are comparable with JGS. Figure 5 indicates the variation in precipitation, accumulated precipitation, DOC wet deposition fluxes, and DOC-accumulated deposition fluxes from 2013 to 2015. The cumulative curve of precipitation and DOC flux are identical basically, illustrating that DOC deposition flux is remarkably controlled by precipitation. However, the effect of increment/decrement of monthly precipitation on DOC concentration is not prominent, demonstrating that the wet deposition flux is also controlled by DOC concentration. DOC deposition flux at Beijing is roughly 2–4 times higher than the value in SRYR mainly because of its large number of DOC produced by critical air pollution [78]. At Araraquara, it is about 6–12 times larger than the value reported here [81] owing to both larger DOC quantity and heavier precipitation. The value in this study is comparable to that of Lhasa in the central Tibetan Plateau [77], which reveals limited precipitation amount and lower DOC concentration, probably also reflecting low levels of air pollution (Figure 5).
The concentration of DOC in precipitation is comparable with that in the river water; however, its flux is much greater than the latter. Then, two questions are worth exploring: how is the DOC allocated after it settles to the ground? and does this mean that DOC in rivers dominantly comes from precipitation rather than catchment? Based on the above research, we assert that there is a certain correlation between precipitation and DOC concentration in river water. On account of the dilution effect of precipitation on rainfall DOC, we can speculate that precipitation does not increase DOC concentration mainly by carrying DOC to river water but under the influence of the precipitation scouring and surface erosion controlled by rainfall and/or slope flow. On the one hand, DOC enters the river directly through wet deposition, which brings comparable DOC concentration with that in the river water. On the other hand, DOC is carried to the land surface by rainfall and is redistributed with the local water circulation. In addition to the DOC that is brought by surface runoff straightly into the river (together with the ones from scouring and erosion of precipitation and surface flow), some of them are filled into the soil layer through downward infiltration and soil water flow. In this process, the DOC loaded by water blends fully with the soil layer, make biochemical reactions to be possible, and further alter the occurrence state of DOC [53]. In general, the water circulation and intricate hydraulic connection have a great impact on the occurrence status and quantity of DOC, and the complex biological effects and surface erosion in the catchment also have a potential effect on it.
The fact that the DOC flux in precipitation is greater than in the river reminds us that DOC concentration in the river water is not a simple combination of wet deposition and catchment scouring; its migration from the atmosphere to land surface is much more complex than we believed, and it is necessary to distinguish and quantify the contribution of different sources in further research.
3.4. DOC and Inorganic Ions
The sources of ions in rivers have been widely studied. If the relationship between DOC and ions in rivers could be established, the influencing factors of DOC concentration in the river water can be further discussed. For this purpose, DOC, major ions, discharge, precipitation, and air temperature were adopted to understand the possible effects of riverine DOC from in SRYR by establishing the relevance matrix (Table 2). Generally speaking, Ca2+ ions are primarily derived from calcite and dolomite weathering [41], while Na+ and K+ mainly come from weathering of silicate minerals (e.g., montmorillonite, illite, and feldspar), which may also contribute a certain amount of Mg2+ ion. This could be supported by significant correlations among Na+, K+, and Mg2+ ions in this paper (Table 2). The close relationships between Cl− and SO42− ions (r = 0.5, p < 0.05) and weak relationships between SO42− and NO3− ions (r = 0.4, p < 0.05) prove that they may have the same source of atmospheric aerosol output [82,83,84], except for the SO42− ion released from weathering of sulfide minerals [84]. Most inorganic ions are not related to DOC, aside from NO3− and Cl− ions, relatively having an inverse correlation with the r value of 0.5 and 0.4 (p < 0.05), which could also be found in the temporal variation of ions and DOC (Figure 6). In 2013, the riverine DOC concentration increased swiftly, along with the rapid reduction in NO3− and Cl− ion concentrations from April to May; the low DOC concentration from June to July corresponded to the high ion concentration; after August, accompanied by the rapid decrease in DOC concentration, the two ions’ concentrations increased in fluctuation.
Previous studies have shown that variation in the chemistry of atmospheric deposition provided the only regionally consistent explanation for widespread upward trends in surface water DOC concentration [23]. Monteith et al. concluded that atmospheric deposition can affect soil organic matter solubility through at least two mechanisms—by changing either the acidity of soils or the ionic strength of soil solution or both. The first mechanism is declining acid deposition, and a decline in the frequency and intensity of sea salt episodes may increase DOC concentrations by increasing soil PH directly. A second mechanism involves the effect of ionic strength on the coagulation of DOC [35]. Decreasing inputs of acidic deposition or sea salt should lead to lower concentrations of a suite of multivalent ions found in soil solution that exert a large influence on ionic strength. Relevant studies have shown that increasing the ionic strength of soil solutions will reduce the rate of DOC flux [85,86]; conversely, a reduction in ionic strength (for example, through decreasing atmospheric deposition) should lead to a DOC increase. This is the only correlation we can conclude between inorganic ions and DOC concentration in river water, indicating that chemical action in river water is also a potential and important impact mechanism in addition to climatic, hydrological, and environmental factors. This fully demonstrates the complexity of changes in DOC concentrations in the river.
4. Conclusions
Combined with the data of discharge, precipitation, air temperature, and ion concentration, concentrations of DOC from river and precipitation at Jungong gauging station (JGS) in the source region of the Yellow River (SRYR) were continuously monitored and analyzed from 2013 to 2015; some results are as follows:
- Annual mean DOC concentrations in the river during the three years were 2.3 ± 1.1, 2.2 ± 1.4, and 2.0 ± 0.5 mg/L, respectively. Closely related to the local biogeochemical and hydrographic processes, a significant seasonal variation could be observed, with the maximum in summer (2.65 mg/L) and the minimum in winter (1.44 mg/L). Runoff and precipitation, involving glacier and frozen soil meltwater are the main reasons affecting riverine DOC concentration. Concentrations of DOC in rainfall ranged from 0.59 to 12.1 mg/L, with an inverse relationship with precipitation amount, illustrating that heavier precipitation could dilute DOC concentrations.
- Transportation of DOC by the river was estimated as 26,058 tons in 2013, 37,539 tons in 2014, and 24,629 tons in 2015, which was dominated by river discharge. Compared with the rivers in other climatic zones in the world, it is transparent that humid climate, high rate of vegetation coverage, and developed water system can increase the riverine DOC concentration; DOC yield in SRYR is much less than that of rivers in tropical humid climate areas, also less than the cold areas covered by Tundra and Taiga but greater than tropical and temperate dry areas, suggesting that the melting of glaciers and frozen soil is an important factor affecting the DOC yield in SRYR.
- About 86,080, 105,804, and 73,072 tons of DOC during 2013 to 2015 respectively were brought to SRYR by rainfall, which was controlled both by DOC concentrations and precipitations. Although the DOC levels deposited by rainfall were far greater than that of river delivery, only a small part of DOC in precipitation directly entered the river, and most of it fell on the land surface and was distributed under the influence of the local water cycle. Therefore, the main source of riverine DOC was catchment scouring, including both surface runoff and precipitation flushing. The intricate hydraulic connection and complex biological processes also had a potential effect on it.
- The variation trend of DOC concentrations was contrary to that of ions in the river, especially for NO3− and Cl− ions (r = 0.5, p < 0.05 for NO3−; r = 0.4, p < 0.05 for Cl−), which confirms the previous studies indicating that a possible relationship exists between DOC concentration and acid deposition.
Author Contributions
Conceptualization, X.Y. and X.L.; methodology, X.Y.; software, X.Y.; validation, X.Y. and X.L.; formal analysis, X.L.; investigation, X.L. and X.Y.; resources, X.Y. and X.L.; data curation, X.Y.; writing—original draft preparation, X.Y.; writing—review and editing, X.L.; visualization, X.Y.; supervision, X.Y.; project administration, X.L.; funding acquisition, X.Y. All authors have read and agreed to the published version of the manuscript.
Funding
This work is funded by the National Natural Science Foundation of China (grant numbers 41761017, 41261017, 42171053, 41671053), the Natural Science Foundation of Gansu Province (18JR3RE247) and the Open Foundation of State Key Laboratory of Frozen Soil Engineering (SKLFSE201901).
Institutional Review Board Statement
Not applicable.
Informed Consent Statement
Not applicable.
Data Availability Statement
Some or all data that support the findings of this study are available from the corresponding author upon reasonable request.
Acknowledgments
This work is funded by the National Natural Science Foundation of China (grant numbers 41761017, 41261017, 42171053, 41671053), the Natural Science Foundation of Gansu Province (18JR3RE247) and the Open Foundation of State Key Laboratory of Frozen Soil Engineering (SKLFSE201901). We thank Lixia Wang and Peng Zheng for sample analysis; Rong Wang for drawing of sampling point diagram; Hongliang Li for field assistance and sample collection.
Conflicts of Interest
The authors declare no conflict of interest. The funders had no role in the design of the study; in the collection, analyses, or interpretation of data, in the writing of the manuscript, or in the decision to publish the results.
References
- McClelland, J.; Townsend-Small, A.; Holmes, R.M.; Pan, F.; Stieglitz, M.; Khosh, M.; Peterson, B.J. River export of nutrients and organic matter from the North Slope of Alaska to the Beaufort Sea. Water Resour. Res. 2014, 50, 1823–1839. [Google Scholar] [CrossRef] [Green Version]
- Smith, H.J.; Foster, R.A.; McKnight, D.M.; Lisle, J.T.; Littmann, S.; Kuypers, M.M.M.; Foreman, C.M. Microbial formation of labile organic carbon in Antarctic glacial environments. Nat. Geosci. 2017, 10, 356–359. [Google Scholar] [CrossRef] [Green Version]
- Watanabe, K.; Kuwae, T. How organic carbon derived from multiple sources contributes to carbon sequestration processes in a shallow coastal system? Glob. Chang. Biol. 2015, 21, 2612–2623. [Google Scholar] [CrossRef] [PubMed]
- Li, M.; Peng, C.; Zhou, X.; Yang, Y.; Guo, Y.; Shi, G.; Zhu, Q. Modeling Global Riverine DOC Flux Dynamics from 1951 to 2015. J. Adv. Model. Earth Syst. 2019, 11, 514–530. [Google Scholar] [CrossRef] [Green Version]
- Mayorga, E.; Aufdenkampe, A.; Masiello, C.; Krusche, A.; Hedges, J.I.; Quay, P.D.; Richey, J.E.; Brown, T. Young organic matter as a source of carbon dioxide outgassing from Amazonian rivers. Nature 2005, 436, 538–541. [Google Scholar] [CrossRef]
- Mora, A.; Alfonso, J.A.; Baquero, J.C.; Balza, L.; Pisapia, D. Caura River basin: Weathering rates, CO2 consumption, and chemistry of major and trace elements in an Orinoco River tributary coming from the Precambrian Guayana Shield, Venezuela. Geochem. Geophy. Geosy. 2010, 11. [Google Scholar] [CrossRef]
- Mora, A.; Laraque, A.; Moreira-Turcq, P.; Alfonso, J.A. Temporal variation and fluxes of dissolved and particulate organic carbon in the Apure, Caura and Orinoco rivers, Venezuela. J. South. Am. Earth Sci. 2014, 54, 47–56. [Google Scholar] [CrossRef]
- Musilova, M.; Tranter, M.; Wadham, J.; Telling, J.; Tedstone, A.; Anesio, A.M. Microbially driven export of labile organic carbon from the Greenland ice sheet. Nat. Geosci. 2017, 10, 360–365. [Google Scholar] [CrossRef] [Green Version]
- Li, Y.L.; He, W.; Wu, R.L.; Xing, B.; Xu, F.L. A general-applicable model for estimating the binding coefficient of organic pollutants with dissolved organic matter. Sci. Total Environ. 2019, 670, 226–235. [Google Scholar] [CrossRef]
- Blair, N.E.; Aller, R.C. The Fate of Terrestrial Organic Carbon in the Marine Environment. Annu. Rev. Mar. Sci. 2012, 4, 401–423. [Google Scholar] [CrossRef]
- Aufdenkampe, A.K.; Mayorga, E.; Raymond, P.A.; Melack, J.M.; Doney, S.; Alin, S.; Aalto, R.E.; Yoo, K. Riverine coupling of biogeochemical cycles between land, oceans, and atmosphere. Front. Ecol. Environ. 2011, 9, 53–60. [Google Scholar] [CrossRef] [Green Version]
- Spencer, R.G.M.; Aiken, G.R.; Wickland, K.; Striegl, R.G.; Hernes, P.J. Seasonal and spatial variability in dissolved organic matter quantity and composition from the Yukon River basin, Alaska. Glob. Biogeochem. Cycles 2008, 22. [Google Scholar] [CrossRef]
- Griffin, C.G.; Finlay, J.; Brezonik, P.L.; Olmanson, L.; Hozalski, R. Limitations on using CDOM as a proxy for DOC in temperate lakes. Water Res. 2018, 144, 719–727. [Google Scholar] [CrossRef]
- Galy, V.; Peucker-Ehrenbrink, B.; Eglinton, T. Global carbon export from the terrestrial biosphere controlled by erosion. Nature 2015, 521, 204–207. [Google Scholar] [CrossRef]
- Spencer, R.G.; Hernes, P.J.; Aufdenkampe, A.K.; Baker, A.; Gulliver, P.; Stubbins, A.; Aiken, G.R.; Dyda, R.Y.; Butler, K.D.; Mwamba, V.L.; et al. An initial investigation into the organic matter biogeochemistry of the Congo River. Geochim. Cosmochim. Acta 2012, 84, 614–627. [Google Scholar] [CrossRef]
- Wu, Y.; Zhang, J.; Liu, S.; Zhang, Z.; Yao, Q.; Hong, G.; Cooper, L. Sources and distribution of carbon within the Yangtze River system. Estuar. Coast. Shelf Sci. 2007, 71, 13–25. [Google Scholar] [CrossRef]
- Yan, F.; Kang, S.; Li, C.; Zhang, Y.; Qin, X.; Li, Y.; Zhang, X.; Hu, Z.; Chen, P.; Li, X.; et al. Concentration, sources and light absorption characteristics of dissolved organic carbon on a medium-sized valley glacier, northern Tibetan Plateau. Cryosphere 2016, 10, 2611–2621. [Google Scholar] [CrossRef] [Green Version]
- Zhang, L.; Xue, M.; Wang, M.; Cai, W.-J.; Wang, L.; Yu, Z. The spatiotemporal distribution of dissolved inorganic and organic carbon in the main stem of the Changjiang (Yangtze) River and the effect of the Three Gorges Reservoir. J. Geophys. Res. Biogeosci. 2014, 119, 741–757. [Google Scholar] [CrossRef] [Green Version]
- Raymond, P.A.; Oh, N.H. An empirical study of climatic controls on riverine C export from three major U.S. watersheds. Glob. Biogeochem. Cycles 2007, 21, GB2022. [Google Scholar] [CrossRef] [Green Version]
- Li, X.Y.; Ding, Y.J.; Han, T.D.; Xu, J.Z.; Kang, S.C.; Wu, Q.B.; Sillanpää, M.; Yu, Z.B.; Yu, C.R. Seasonal variations of organic carbon and nitrogen in the upper basins of Yangtze and Yellow Rivers. J. Mt. Sci. 2017, 14, 1577–1590. [Google Scholar] [CrossRef]
- Worrall, F.; Harriman, R.; Evans, C.D.; Watts, C.D.; Adamson, J.; Neal, C.; Tipping, E.; Burt, T.P.; Grieve, I.; Monteith, D.; et al. Trends in Dissolved Organic Carbon in UK Rivers and Lakes. Biogeochemistry 2004, 70, 369–402. [Google Scholar] [CrossRef]
- Clark, J.; Bottrell, S.; Evans, C.; Monteith, D.; Bartlett, R.; Rose, R.; Newton, R.; Chapman, P. The importance of the relationship between scale and process in understanding long-term DOC dynamics. Sci. Total Environ. 2010, 408, 2768–2775. [Google Scholar] [CrossRef] [PubMed]
- Monteith, D.T.; Stoddard, J.; Evans, C.; de Wit, H.A.; Forsius, M.; Høgåsen, T.; Wilander, A.; Skjelkvåle, B.L.; Jeffries, D.S.; Vuorenmaa, J.; et al. Dissolved organic carbon trends resulting from changes in atmospheric deposition chemistry. Nature 2007, 450, 537–540. [Google Scholar] [CrossRef] [PubMed]
- Findlay, S.E. Increased carbon transport in the Hudson River: Unexpected consequence of nitrogen deposition? Front. Ecol. Environ. 2005, 3, 133–137. [Google Scholar] [CrossRef]
- Garnett, M.H.; Ineson, P.; Stevenson, A.C. Effects of burning and grazing on carbon sequestration in a Pennine blanket bog, UK. Holocene 2000, 10, 729–736. [Google Scholar] [CrossRef] [Green Version]
- Evans, C.D.; Chapman, P.J.; Clark, J.M.; Monteith, D.T.; Cresser, M.S. Alternative explanations for rising dissolved organic carbon export from organic soils. Glob. Change Biol. 2006, 12, 2044–2053. [Google Scholar] [CrossRef]
- Zhang, S.; Bai, Y.; Wen, X.; Ding, A.; Zhi, J. Seasonal and downstream alterations of dissolved organic matter and dissolved inorganic ions in a human-impacted mountainous tributary of the Yellow River, China. Environ. Sci. Pollut. Res. 2018, 25, 17967–17979. [Google Scholar] [CrossRef]
- Schuur, E.A.G.; McGuire, A.D.; Schadel, C.; Grosse, G.; Harden, J.W.; Hayes, D.; Hugelius, G.; Koven, C.; Kuhry, P.; Lawrence, D.; et al. Climate change and the permafrost carbon feedback. Nature 2015, 520, 171–179. [Google Scholar] [CrossRef]
- Campeau, A.; Soerensen, A.L.; Martma, T.; Kerblom, S.; Zdanowicz, C. Controls on the 14C content of dissolved and particulate organic carbon mobilized across the mackenzie river basin, Canada. Glob. Biogeochem. Cycles 2020, 34, e2020GB006671. [Google Scholar] [CrossRef]
- Zou, D.; Zhao, L.; Sheng, Y.; Chen, J.; Hu, G.; Wu, T.; Wu, J.; Xie, C.; Wu, X.; Pang, Q.; et al. A new map of permafrost distribution on the Tibetan Plateau. Cryosphere 2017, 11, 2527–2542. [Google Scholar] [CrossRef] [Green Version]
- Kang, S.; Wang, F.; Morgenstern, U.; Zhang, Y.; Grigholm, B.; Kaspari, S.; Schwikowski, M.; Ren, J.; Yao, T.; Qin, D.; et al. Dramatic loss of glacier accumulation area on the Tibetan Plateau revealed by ice core tritium and mercury records. Cryosphere 2015, 9, 1213–1222. [Google Scholar] [CrossRef] [Green Version]
- Wu, T.; Zhao, L.; Li, R.; Wang, Q.; Xie, C.; Pang, Q. Recent ground surface warming and its effects on permafrost on the central Qinghai-Tibet Plateau. Int. J. Clim. 2012, 33, 920–930. [Google Scholar] [CrossRef]
- Wang, X.; Ma, H.; Li, R.; Song, Z.; Wu, J. Seasonal fluxes and source variation of organic carbon transported by two major Chinese Rivers: The Yellow River and Changjiang (Yangtze) River. Glob. Biogeochem. Cycles 2012, 26. [Google Scholar] [CrossRef]
- Mu, C.; Zhang, T.; Wu, Q.; Peng, X.; Cao, B.; Zhang, X.; Cheng, G. Organic carbon pools in permafrost regions on the Qinghai–Xizang (Tibetan) Plateau. Cryosphere 2015, 9, 479–486. [Google Scholar] [CrossRef] [Green Version]
- Köhler, S.; Buffam, I.; Seibert, J.; Bishop, K.; Laudon, H. Dynamics of stream water TOC concentrations in a boreal headwater catchment: Controlling factors and implications for climate scenarios. J. Hydrol. 2009, 373, 44–56. [Google Scholar] [CrossRef]
- Liu, D.; Pan, D.; Bai, Y.; He, X.; Wang, D.; Zhang, L. Variation of dissolved organic carbon transported by two Chinese rivers: The Changjiang River and Yellow River. Mar. Pollut. Bull. 2015, 100, 60–69. [Google Scholar] [CrossRef]
- Ran, L.; Lu, X.X.; Sun, H.; Han, J.; Li, R.; Zhang, J. Spatial and seasonal variability of organic carbon transport in the Yellow River, China. J. Hydrol. 2013, 498, 76–88. [Google Scholar] [CrossRef]
- Xia, X.; Dong, J.; Wang, M.; Xie, H.; Xia, N.; Li, H.; Zhang, X.; Mou, X.; Wen, J.; Bao, Y. Effect of water-sediment regulation of the Xiaolangdi reservoir on the concentrations, characteristics, and fluxes of suspended sediment and organic carbon in the Yellow River. Sci. Total Environ. 2016, 571, 487–497. [Google Scholar] [CrossRef] [Green Version]
- Wen, Z.; Song, K.; Shang, Y.; Lyu, L.; Tao, H.; Liu, G. Natural and anthropogenic impacts on the DOC characteristics in the Yellow River continuum. Environ. Pollut. 2021, 287, 117231. [Google Scholar] [CrossRef]
- Lan, Y.; Zhao, G.; Zhang, Y.; Wen, J.; Liu, J.; Hu, X. Response of runoff in the source region of the Yellow River to climate warming. Quat. Int. 2010, 226, 60–65. [Google Scholar] [CrossRef]
- Li, X.; Ding, Y.; Han, T.; Sillanpää, M.; Jing, Z.; You, X.; Liu, S.; Yang, C.; Yu, C.; Li, G. Seasonal and interannual changes of river chemistry in the source region of Yellow River, Tibetan Plateau. Appl. Geochem. 2020, 119, 104638. [Google Scholar] [CrossRef]
- Liu, S.; Yao, X.; Guo, W.; Xu, J.; Shangguan, D.; Wei, J.; Bao, W.; Wu, L. The contemporary glaciers in China based on the Second Chinese Glacier Inventory. Acta Geogr. Sin.-Chin. Ed. 2015, 70, 3–16. [Google Scholar]
- Li, X.; Ding, Y.; Xu, J.; He, X.; Han, T.; Kang, S.; Wu, Q.; Mika, S.; Yu, Z.; Li, Q. Importance of Mountain Glaciers as a Source of Dissolved Organic Carbon. J. Geophys. Res. Earth Surf. 2018, 123, 2123–2134. [Google Scholar] [CrossRef]
- Li, X.; Ding, Y.; Han, T.; Kang, S.; Yu, Z.; Jing, Z. Seasonal controls of meltwater runoff chemistry and chemical weathering at Urumqi Glacier No.1 in central Asia. Hydrol. Process. 2019, 33, 3258–3281. [Google Scholar] [CrossRef]
- Hood, E.W.; Battin, T.J.; Fellman, J.B.; O’Neel, S.; Spencer, R.G.M. Storage and release of organic carbon from glaciers and ice sheets. Nat. Geosci. 2015, 8, 91–96. [Google Scholar] [CrossRef]
- Bhatia, M.P.; Das, S.B.; Xu, L.; Charette, M.A.; Wadham, J.L.; Kujawinski, E.B. Organic carbon export from the Greenland ice sheet. Geochim. Cosmochim. Acta 2013, 109, 329–344. [Google Scholar] [CrossRef]
- Dittmar, T.; Kattner, G. The biogeochemistry of the river and shelf ecosystem of the Arctic Ocean: A review. Mar. Chem. 2003, 83, 103–120. [Google Scholar] [CrossRef]
- Dai, M.; Yin, Z.; Meng, F.; Liu, Q.; Cai, W.J. Spatial distribution of riverine DOC inputs to the ocean: An updated global synthesis. Curr. Opin. Environ. Sustain. 2012, 4, 170–178. [Google Scholar] [CrossRef]
- Qu, B.; Sillanpää, M.; Li, C.; Kang, S.; Stubbins, A.; Yan, F.; Aho, K.S.; Zhou, F.; Raymond, P.A. Aged dissolved organic carbon exported from rivers of the Tibetan Plateau. PLoS ONE 2017, 12, e0181295. [Google Scholar] [CrossRef]
- Mann, P.; Davydova, A.; Zimov, N.; Spencer, R.G.; Davydov, S.; Bulygina, E.; Zimov, S.; Holmes, R. Controls on the composition and lability of dissolved organic matter in Siberia’s Kolyma River basin. J. Geophys. Res. Biogeosci. 2012, 117. [Google Scholar] [CrossRef] [Green Version]
- Bhandari, R.; Routh, J.; Sharma, S.; Joshi, R. Contrasting lipid biomarkers in mountain rivers in the Nepal Himalayas: Organic matter characteristics and contribution to the fluvial carbon pool. Geosci. Front. 2021, 12, 101231. [Google Scholar] [CrossRef]
- Zeng, Y.; Feng, Z.; Cao, G.; Xue, L. The soil organic carbon storage and its spatial distribution of alpine grassland in the source 529 region of the Yellow River. Acta Geogr. Sin.-Chin. Ed. 2004, 59, 497–504. [Google Scholar]
- Petrone, K.C.; Jones, J.B.; Hinzman, L.D.; Boone, R.D. Seasonal export of carbon, nitrogen, and major solutes from Alaskan catchments with discontinuous permafrost. J. Geophys. Res. Biogeosci. 2006, 111, G2. [Google Scholar] [CrossRef]
- Nkounkou, R.R.; Probst, J.L. Hydrology and geochemistry of the Congo river system. SCOPE/UNEP-Sonderband 1987, 64, 483–508. [Google Scholar]
- Probst, J.; Mortatti, J.; Tardy, Y. Carbon river fluxes and weathering CO2 consumption in the Congo and Amazon river basins. Appl. Geochem. 1994, 9, 1–13. [Google Scholar] [CrossRef]
- Richey, J.E.; Hedges, J.I.; Devol, A.H.; Quay, P.D.; Victoria, R.; Martinelli, L.; Forsberg, B.R. Biogeochemistry of carbon in the Amazon River. Limnol. Oceanogr. 1990, 35, 352–371. [Google Scholar] [CrossRef]
- Holmes, R.M.; McClelland, J.; Peterson, B.J.; Tank, S.; Bulygina, E.; Eglinton, T.I.; Gordeev, V.V.; Gurtovaya, T.Y.; Raymond, P.A.; Repeta, D.J.; et al. Seasonal and Annual Fluxes of Nutrients and Organic Matter from Large Rivers to the Arctic Ocean and Surrounding Seas. Chesap. Sci. 2011, 35, 369–382. [Google Scholar] [CrossRef]
- Kempe, S.; Depetris, P.J. Factors controlling the concentration of particulate carbohydrates and amino acids in the Paraná River. Hydrobiologia 1992, 242, 175–183. [Google Scholar] [CrossRef]
- Ludwig, W.; Probst, J.L.; Kempe, S. Predicting the oceanic input of organic carbon by continental erosion. Glob. Biogeochem. Cycles 1996, 10, 23–41. [Google Scholar] [CrossRef] [Green Version]
- Khosh, M.S.; McClelland, J.W.; Jacobson, A.D.; Douglas, T.A.; Barker, A.J.; Lehn, G.O. Seasonality of dissolved nitrogen from spring melt to fall freeze up in Alaskan Arctic tundra and mountain streams. J. Geophys. Res. Biogeosci. 2017, 122, 1718–1737. [Google Scholar] [CrossRef]
- Hugelius, G.; Strauss, J.; Zubrzycki, S.; Harden, J.W.; Schuur, E.A.G.; Ping, C.-L.; Schirrmeister, L.; Grosse, G.; Michaelson, G.J.; Koven, C.D.; et al. Estimated stocks of circumpolar permafrost carbon with quantified uncertainty ranges and identified data gaps. Biogeosciences 2014, 11, 6573–6593. [Google Scholar] [CrossRef] [Green Version]
- Immerzeel, W.W.; van Beek, L.P.H.; Bierkens, M.F.P. Climate Change Will Affect the Asian Water Towers. Science 2010, 328, 1382–1385. [Google Scholar] [CrossRef]
- Yang, X.; Yao, T.; Joswiak, D.; Yao, P. Integration of Tibetan Plateau ice-core temperature records and the influence of atmospheric circulation on isotopic signals in the past century. Quat. Res. 2014, 81, 520–530. [Google Scholar] [CrossRef]
- Jin, H.; He, R.; Cheng, G.; Wu, Q.; Wang, S.; Chang, X. Changes in frozen ground in the source area of the yellow river on the Qinghai-Tibet Plateau, China, and their eco-environmental impacts. Environ. Res. Lett. 2009, 4, 045206. [Google Scholar] [CrossRef]
- Pohl, E.; Gloaguen, R.; Andermann, C.; Knoche, M. Glacier melt buffers river runoff in the Pamir Mountains. Water Resour. Res. 2017, 53, 2467–2489. [Google Scholar] [CrossRef]
- Kraaijenbrink, P.; Bierkens, M.F.; Lutz, A.; Immerzeel, W. Impact of a global temperature rise of 1.5 degrees Celsius on Asia’s glaciers. Nature 2017, 549, 257–260. [Google Scholar] [CrossRef]
- Lutz, A.; Immerzeel, W.; Shrestha, A.B.; Bierkens, M.F. Consistent increase in High Asia’s runoff due to increasing glacier melt and precipitation. Nat. Clim. Chang. 2014, 4, 587–592. [Google Scholar] [CrossRef] [Green Version]
- Pritchard, H.D. Asia’s glaciers are a regionally important buffer against drought. Nature 2017, 545, 169–174. [Google Scholar] [CrossRef]
- Romanovsky, V.E.; Drozdov, D.S.; Oberman, N.G.; Malkova, G.V.; Kholodov, A.L.; Marchenko, S.; Moskalenko, N.G.; Sergeev, D.O.; Ukraintseva, N.G.; Abramov, A.; et al. Thermal state of permafrost in Russia. Permafr. Periglac. Process. 2010, 21, 136–155. [Google Scholar] [CrossRef]
- Frey, K.E.; McClelland, J.W. Impacts of permafrost degradation on arctic river biogeochemistry. Hydrol. Process. 2008, 23, 169–182. [Google Scholar] [CrossRef]
- Zhang, S.; Gan, W.B.; Ittekkot, V. Organic matter in large turbid rivers: The Huanghe and its estuary. Mar. Chem. 1992, 38, 53–68. [Google Scholar] [CrossRef]
- Leenheer, J. United States geological survey data information service. In Transport of Carbon and Minerals in Major World Rivers. Part I; Geologisch-Palaontologischen Institut der Universitat Hamburg: Hamburg, Germany, 1982; Volume 1, pp. 355–356. [Google Scholar]
- Hart, R. Carbon transport in the upper Orange River. In Transport of Carbon and Minerals in Major World Rivers. Part I; Geologisch-Palaontologischen Institut der Universitat Hamburg: Hamburg, Germany, 1987; Volume 4, pp. 509–512. [Google Scholar]
- Dahm, C.N.; Gregory, S.V.; Park, P.K. Organic carbon transport in the Columbia River. Estuar. Coast. Shelf Sci. 1981, 13, 645–658. [Google Scholar] [CrossRef]
- Abu El Ella, E. Preliminary studies on the geochemistry of the Nile river basin, Egypt. In Transport of Carbon and Minerals in Major World Rivers; Geologisch-Palaontologischen Institut der Universitat Hamburg: Hamburg, Germany, 1993; Volume 6, pp. 115–135. [Google Scholar]
- Lesack, L.F.W.; Hecky, R.E.; Melack, J.M. Transport of carbon, nitrogen, phosphorus, and major solutes in the Gambia River, West Africa. Limnol. Oceanogr. 1984, 29, 816–830. [Google Scholar] [CrossRef]
- Li, C.; Yan, F.; Kang, S.; Chen, P.; Qu, B.; Hu, Z.; Sillanpää, M. Concentration, sources, and flux of dissolved organic carbon of precipitation at Lhasa city, the Tibetan Plateau. Environ. Sci. Pollut. Res. 2016, 23, 12915–12921. [Google Scholar] [CrossRef]
- Pan, Y.; Wang, Y.; Xin, J.; Tang, G.; Song, T.; Wang, Y.; Li, X.; Wu, F. Study on dissolved organic carbon in precipitation in Northern China. Atmos. Environ. 2010, 44, 2350–2357. [Google Scholar] [CrossRef]
- Huang, J.; Kang, S.; Shen, C.; Cong, Z.; Liu, K.; Wang, W.; Liu, L. Seasonal variations and sources of ambient fossil and biogenic-derived carbonaceous aerosols based on 14C measurements in Lhasa, Tibet. Atmos. Res. 2010, 96, 553–559. [Google Scholar] [CrossRef]
- Yan, G.; Kim, G. Dissolved organic carbon in the precipitation of Seoul, Korea: Implications for global wet depositional flux of fossil-fuel derived organic carbon. Atmos. Environ. 2012, 59, 117–124. [Google Scholar] [CrossRef]
- Coelho, C.H.; Francisco, J.G.; Nogueira, R.P.; Campos, M.L.A.M. Dissolved organic carbon in rainwater from areas heavily impacted by sugar cane burning. Atmos. Environ. 2008, 42, 7115–7121. [Google Scholar] [CrossRef]
- Yde, J.C.; Knudsen, N.T.; Nielsen, O.B. Glacier hydrochemistry, solute provenance, and chemical denudation at a surge-type glacier in Kuannersuit Kuussuat, Disko Island, West Greenland. J. Hydrol. 2005, 300, 172–187. [Google Scholar] [CrossRef]
- Hodgkins, R.; Tranter, M.; Dowdeswell, J.A. Solute provenance, transport and denudation in a high arctic glacierized catchment. Hydrol. Process. 1997, 11, 1813–1832. [Google Scholar] [CrossRef]
- Yu, Z.; Wu, G.; Keys, L.; Li, F.; Yan, N.; Qu, D.; Liu, X. Seasonal variation of chemical weathering and its controlling factors in two alpine catchments, Nam Co basin, central Tibetan Plateau. J. Hydrol. 2019, 576, 381–395. [Google Scholar] [CrossRef]
- Evans, A.; Zelazny, L.W.; Zipper, C. Solution parameters influencing dissolved organic carbon levels in three forest soils. Soil Sci. Soc. Am. J. 1988, 52, 1789–1792. [Google Scholar] [CrossRef]
- Tipping, E.; Woof, C. The distribution of humic substances between the solid and aqueous phases of acid organic soils; a description based on humic heterogeneity and charge-dependent sorption equilibria. J. Soil Sci. 1991, 42, 437–448. [Google Scholar] [CrossRef]
Figure 1.
Map showing the sampling site—Jungong gauging station (JGS)—along with the Guoluo weather station (GLS) in the source region of the Yellow River (SRYR) in the northeastern Tibetan Plateau.
Figure 1.
Map showing the sampling site—Jungong gauging station (JGS)—along with the Guoluo weather station (GLS) in the source region of the Yellow River (SRYR) in the northeastern Tibetan Plateau.

Figure 2.
Seasonal and annual variations in the daily concentration of dissolved organic carbon in river water (DOCriver) and precipitation (DOCp) in comparison to daily changes in air temperature (T), river discharge (Q), and precipitation (P) during 2013 to 2014.
Figure 2.
Seasonal and annual variations in the daily concentration of dissolved organic carbon in river water (DOCriver) and precipitation (DOCp) in comparison to daily changes in air temperature (T), river discharge (Q), and precipitation (P) during 2013 to 2014.

Figure 3.
Seasonal variations in the daily (F) and cumulative (CF) dissolved organic carbon fluxes in comparison to the daily (Q) and cumulative (CQ) river discharges during 2013 (a) to 2014 (b).
Figure 3.
Seasonal variations in the daily (F) and cumulative (CF) dissolved organic carbon fluxes in comparison to the daily (Q) and cumulative (CQ) river discharges during 2013 (a) to 2014 (b).

Figure 4.
Relationship between monthly DOC concentration in precipitation (DOC) and simultaneous monthly precipitation amount (P) during 2013 to 2015.
Figure 4.
Relationship between monthly DOC concentration in precipitation (DOC) and simultaneous monthly precipitation amount (P) during 2013 to 2015.

Figure 5.
Monthly wet deposition flux (F) and cumulative wet deposition flux (CF) of DOC from precipitation in comparison to precipitation (P) and cumulative precipitation (CP) in 2013, 2014, and 2015.
Figure 5.
Monthly wet deposition flux (F) and cumulative wet deposition flux (CF) of DOC from precipitation in comparison to precipitation (P) and cumulative precipitation (CP) in 2013, 2014, and 2015.

Figure 6.
Relationships between DOC and Cl− and NO3− ion concentrations in the river water from April to December 2013. The dotted solid box indicates the period from May to August 2013, during which DOC concentrations were higher, while Cl− and NO3− ion concentrations were low.
Figure 6.
Relationships between DOC and Cl− and NO3− ion concentrations in the river water from April to December 2013. The dotted solid box indicates the period from May to August 2013, during which DOC concentrations were higher, while Cl− and NO3− ion concentrations were low.


Table 1.
DOC concentrations in river (mg/L) and precipitation (mg/L), DOC fluxes in river (tons/year) and precipitation (tons/year), and DOC yield (tons/km2/year) during 2013 to 2015.
Table 1.
DOC concentrations in river (mg/L) and precipitation (mg/L), DOC fluxes in river (tons/year) and precipitation (tons/year), and DOC yield (tons/km2/year) during 2013 to 2015.
| 2013 | 2014 | 2015 | |
|---|---|---|---|
| DOC concentration in river | 2.3 ± 1.1 | 2.2 ± 1.3 | 2.0 ± 0.5 |
| DOC concentration in precipitation | 2.0 ± 1.4 | 2.8 ± 2.5 | 1.8 ± 1.2 |
| DOC flux from river | 26,058.2 ± 174.1 | 37,539.6 ± 100.1 | 24,629.3 ± 153.2 |
| DOC deposition flux from precipitation | 86,080.1 ± 451.3 | 105,804.5 ± 887.4 | 73,072.6 ± 364.2 |
| DOC yield | 0.2 | 0.4 | 0.3 |
Table 2.
Correlation coefficients among DOC concentrations (C), DOC fluxes (F), daily discharges (Q), air temperatures (T), precipitations (P), and major ions over 2013.
Table 2.
Correlation coefficients among DOC concentrations (C), DOC fluxes (F), daily discharges (Q), air temperatures (T), precipitations (P), and major ions over 2013.
| C | F | P | Q | T | Na+ | K+ | Mg2+ | Ca2+ | Cl− | SO42− | NO3− | |
|---|---|---|---|---|---|---|---|---|---|---|---|---|
| C | 1.00 | 0.72 * | 0.16 | 0.50 * | 0.55 * | −0.01 | −0.16 * | −0.06 | −0.20 * | −0.41 * | −0.19 * | −0.51 * |
| F | 1.00 | 0.03 | 0.94 * | 0.54 * | −0.27 * | −0.10 | −0.12 | −0.03 | −0.49 * | −0.17 * | −0.36 * | |
| P | 1.00 | −0.04 | 0.11 | −0.18 | −0.17 | −0.17 | −0.04 | −0.13 | −0.16 | −0.19 | ||
| Q | 1.00 | 0.57 * | −0.38 * | −0.04 | −0.23 * | −0.01 | −0.52 * | −0.11 | −0.23 * | |||
| T | 1.00 | −0.37 * | −0.05 | −0.32 * | −0.39 * | −0.48 * | −0.01 | −0.29 * | ||||
| Na+ | 1.00 | 0.73 * | 0.90 * | 0.29 * | 0.51 * | 0.17 * | 0.04 | |||||
| K+ | 1.00 | 0.80 * | 0.48 * | 0.17 * | 0.08 | 0.03 | ||||||
| Mg2+ | 1.00 | 0.52 * | 0.37 * | 0.12 | 0.04 | |||||||
| Ca2+ | 1.00 | 0.01 | −0.04 | 0.27 * | ||||||||
| Cl− | 1.00 | 0.71 * | 0.27 * | |||||||||
| SO42− | 1.00 | 0.44 * | ||||||||||
| NO3− | 1.00 |
* indicates a significant correlation at the 0.05 level.
Table 3.
Comparison of the fluxes (103 tons/year) and yields (tons/km2/year) of DOC in SRYR with some of the world rivers in different climate zones.
Table 3.
Comparison of the fluxes (103 tons/year) and yields (tons/km2/year) of DOC in SRYR with some of the world rivers in different climate zones.
| Rivers | Area (103 km2) | Flux (103 tons/year) | Yields (tons/km2/year) | Temperature Zone | Source |
|---|---|---|---|---|---|
| Yellow | 823 | 396 | 4.81 | Temperate wet | [71] |
| Changjiang | 1817 | 1580 | 0.87 | Temperate wet | [33] |
| Ob’ | 2990 | 4119 | 1.40 | Tundra and Taiga | [57] |
| Yukon | 830 | 1472 | 1.77 | Tundra and Taiga | [57] |
| Mackenzie | 1780 | 1377 | 0.82 | Tundra and Taiga | [57] |
| Orinoco | 1000 | 3280 | 3.28 | Tropical wet | [7] |
| Amazon | 5903 | 26,333 | 4.46 | Tropical wet | [55] |
| Zaire | 3704 | 9130 | 2.47 | Tropical wet | [54] |
| Mississippi | 3243 | 4278 | 1.32 | Temperate wet | [72] |
| Orange | 716 | 179 | 0.25 | Tropical dry | [73] |
| Brazos | 127 | 31 | 0.24 | Tropical dry | [74] |
| Nile | 1874 | 167 | 0.09 | Tropical dry | [75] |
| SRYR | 122 | 29 | 0.31 | Sub cold zone dry | This study |
| Gambia | 63 | 17 | 0.26 | Tropical dry | [76] |
Publisher’s Note: MDPI stays neutral with regard to jurisdictional claims in published maps and institutional affiliations. |
© 2021 by the authors. Licensee MDPI, Basel, Switzerland. This article is an open access article distributed under the terms and conditions of the Creative Commons Attribution (CC BY) license (https://creativecommons.org/licenses/by/4.0/).
Share and Cite
MDPI and ACS Style
You, X.; Li, X. Seasonal Variations in Dissolved Organic Carbon in the Source Region of the Yellow River on the Tibetan Plateau. Water 2021, 13, 2901. https://doi.org/10.3390/w13202901
AMA Style
You X, Li X. Seasonal Variations in Dissolved Organic Carbon in the Source Region of the Yellow River on the Tibetan Plateau. Water. 2021; 13(20):2901. https://doi.org/10.3390/w13202901
Chicago/Turabian StyleYou, Xiaoni, and Xiangying Li. 2021. "Seasonal Variations in Dissolved Organic Carbon in the Source Region of the Yellow River on the Tibetan Plateau" Water 13, no. 20: 2901. https://doi.org/10.3390/w13202901
Note that from the first issue of 2016, this journal uses article numbers instead of page numbers. See further details here.