Article

High Concentration Organic Wastewater with High Phosphorus Treatment by Facultative MBR

1
School of Municipal and Environmental Engineering, Shenyang Jianzhu University, Shenyang 110168, China
2
School of Ecological and Environmental Sciences, East China Normal University, Shanghai 200000, China
3
School of Civil and Environmental Engineering, Georgia Institute of Technology, Atlanta, GA 30332, USA
4
Department of Civil and Environmental Engineering, Rice University, Houston, TX 77005, USA
5
School of Transportation and Environment, Shenzhen Institute of Information Technology, Shenzhen 518172, China
*
Author to whom correspondence should be addressed.
Water 2021, 13(20), 2902; https://doi.org/10.3390/w13202902
Submission received: 6 September 2021 / Revised: 9 October 2021 / Accepted: 13 October 2021 / Published: 15 October 2021

Abstract

:
Phosphorus is one of the main factors causing water eutrophication, and the traditional phosphorus removal process causes phosphorus-rich sludge pollution. The facultative MBR process uses phosphate-reducing bacteria to convert phosphate into directly recyclable gaseous phosphine to solve this malpractice and make sewage become a new phosphorus resource. In order to investigate the phosphorus removal efficiency and the mechanism under facultative conditions, run the facultative MBR reactor for 30 days. The COD value, phosphate concentration, and phosphine yield were measured, and the changes of sludge metabolic pathway abundance and community composition in different periods were detected. According to the measurement, the maximum phosphorus removal efficiency is 43.11% and the maximum yield of phosphine is 320 μg/m3 (measured by the volume of sewage). Combined with thermodynamic analysis, the microbial mechanism of the reactor was proposed, and the possible transformation pathway of phosphorus was analyzed. At last, changes the phosphorus removal process from the ‘removal type’ to the ‘recycling type’.

Graphical Abstract

1. Introduction

Phosphorus is a kind of non-renewable and non-metallic mineral resource. However, there still exist widespread global contradictions between the reduction of phosphorus mineral resources and water eutrophication caused by too high phosphorus contents. Traditional biological phosphorus removal methods mainly focus on discharging the phosphorus-rich sludge. However, this method not only increases the cost of sludge treatment but is also inconducive to the recovery of phosphorus. Facultative MBR (Membrane BioReactor) based on phosphate reduction reaction realizes the phosphorus form transformation, the reduction of phosphorus-rich sludge, and the resource utilization of phosphorus-rich wastewater at the same time. Research on the efficiency and mechanism of phosphine generation process is of very important practical significance, because it not only provides a very important complement to the biochemical and chemical cycle of P but also reveals a new transformation pathway for phosphorus in the eutrophication of water bodies, meanwhile provides new ideas and methods.
Phosphine is a reduced state of the phosphorus compound, mostly present as matrix-bound phosphorus (MBP), a non-gaseous reducing phosphorus compound that binds to soil deposits, sludge, and other compressed media) [1,2,3]. Only a small amount of phosphine presents in the form of a free state (gaseous PH3) in the atmosphere [4,5]. It is generally accepted that phosphine in the ecosystem is produced by the reduction reaction of microorganisms [1,6,7], in which the phosphate-reducing bacteria use the energy and reducing forces produced by carbon source degradation to reduce the phosphate [8,9]. On this basis, the mechanism of phosphine production by phosphate-reducing bacteria was analyzed from the point of view of carbon source degradation. Finally, in order to find the metabolic pathway and microbial population related to the production process of phosphine, the biological metabolic pathway and microbial population structure of phosphorus in the system were studied.

2. Materials and Methods

2.1. Wastewater Quality

Glucose, potassium dihydrogen phosphate, and ammonium chloride were configured as carbon source, phosphorus source, and nitrogen source in wastewater with high COD and phosphorus concentration, respectively. Calcium chloride and trace element nutrient solution were added at the same time, sodium bicarbonate was added as a buffer solution, and the PH value was adjusted in the range of 7.0 ± 0.5. The basic index of livestock and poultry farm wastewater was used as the reference of the influent index of this experiment. The basic components are as follows [10]. The concentration of COD was controlled at 1900~2000 mg·L−1, the concentration of KH2PO4 was controlled at 40~45 mg·L−1, the concentration of NH4Cl was controlled at 90~100 mg·L−1 and the concentration of trace elements was controlled at 0.3 mL/L. The composition of the nutrient solution is shown in Table 1.

2.2. Seed Sludge

The seed sludge was from the second settling tank of the sewage treatment plant in Shenyang, and chicken manure was added with 30% of the volume fraction. The sludge structure was flocculent and loose, with the color of dark brown. The MLSS was 0.673 g·L−1, SVI (sludge volume index) was 98.14 mL·g−1, water content was more than 99%, and the specific gravity was 1.003.

2.3. Facultative MBR

The wastewater was pumped into the facultative (DO is between 1.0 and 2.0 mg/L) MBR (the volume was 19 L). Three flat ceramic membranes were placed in the tank, and the aeration device was set at the bottom of the reactor to create the facultative condition. The influent and effluent pumps were controlled by a microcomputer to keep the system running for 10 min then stopping for one minute. The reactor is shown in Figure 1.
The 1 L beaker was used to place 200 mL sludge and rest for 30 min, and the supernatant was discharged. The sludge was washed by NaHCO3 buffer solution three times and then added to the 1 L reactor together with 600 mL wastewater.

2.4. Analysis Methods

2.4.1. Phosphine Analysis

Argon was used to strip the PH3 produced in the system. The gas stream was passed through first a NaOH solution to remove impurities and then through KMnO4 solution. The stripped PH3 was oxidized to phosphate by KMnO4. By analyzing the initial and final KMnO4, through its reaction with Na2C2O4, so the concentration of PH3 can be calculated from the change of KMnO4.

2.4.2. COD Analysis

A 3 mL water sample was placed in a 50 mL heating tube, and 1 mL masking agent was added to stir evenly. Then the 3 mL digestion solution and 5 mL catalyst were added and stirred evenly. The heating tube was placed in a digester to heat for 22 min, then removed, and measured with a spectrophotometer after cooling.

2.4.3. P Analysis

The 1 mL water sample was added to the 100 mL volumetric bottle to dilute, the 25 mL diluted water sample was added to the colorimetric tube, 5 mL 5% potassium persulfate was added, and the 30 min was digested at 120 °C. After cooling, 1 mL 10% ascorbic acid solution was added and stirred evenly, and after 30 s, 2 mL molybdic acid solution was added and placed in 15 min. The spectrophotometer was used to measure the absorbance, and the absorbance value was brought into the standard curve to calculate the phosphorus concentration.

2.4.4. Microbial Community Analysis

Microbial community (MC) analysis was conducted by 16S ribosomal RNA gene sequencing (16S rRNA) when glucose was used as the carbon source and the remaining conditions selected the best conditions among the influencing factors studied. There were three samples. Sample 1 was the initial sample when phosphine was not detected. Sample 2 was at the operational midpoint when phosphine was detected but the production was not the highest. Sample 3 was taken when phosphine production was the highest. We determined the change in MC for three periods so we could see the changes in the sludge MC. The metabolic pathways for the different microbial communities were studied to find changes during these three periods.

Sample Collection and DNA Extraction

All the samples were recruited from the sludge and frozen at −80 °C within 3 h after sampling. DNA extraction was performed using a QIAamp Fast DNA Sludge Mini Kit. The concentration of bacterial DNA was measured using Nanodrop 2000 (Thermo Scientific, Waltham, MA, USA).

16S Ribosomal RNA Gene Sequencing

The V3–V4 region of the sludge bacteria’s 16S rRNA gene was amplified by PCR with the barcode-indexed primers of 338F and 806R, using FastPfu Polymerase. Amplicons were then purified by gel extraction and were quantified using QuantiFluor-ST. Purified amplicons were pooled in equimolar concentrations, and paired-end sequencing was performed using an Illumina MiSeq instrument.

Microbial Analysis

Sequencing reads were demultiplexed and filtered. Operational taxonomic units (OTUs) were picked at 97% similarity cut-off, and the identified taxonomy was then aligned using the Greengenes database. Chimeric sequences were identified and deleted. OTUs with a number of sequences < 0.005% of the total number of sequences were removed from the OTU table. After filtering, the average reads of sample 1 was 438.46 (min: 291; max: 458), the average reads of sample 2 was 443.25 (min: 318; max: 483) and the average reads of sample 3 was 444.93 (min: 315; max: 476).

Imputed Metagenomic Analysis

The metagenomes of the sludge microbiome were imputed from 16S rRNA sequences with PICRUSt whose software stores the COG information and KO information corresponding to the green gene id [11]. The influence of the number of copies of the 16S marker gene was removed in the species genome and then corresponded to each OTU. The green gene id obtained the COG family information and KEGG Ortholog (KO) information corresponding to the OTU. The abundance of each sludge sample was calculated. According to the information of the COG database, the description information of each COG and its function information can be parsed from the egg NOG database to obtain a functional abundance spectrum [12]. According to the information of the KEGG database, KO and the pathway can be obtained [13]. The abundance of each sludge sample functional category was calculated according to the OTU abundance. All the statistical analyses of the sludge sample were performed using R packages on www.i-sanger.com (accessed on 13 September 2017).

3. Results and Discussion

3.1. Operation Effect of Start-Up Period (Sludge Domestication Process in Facultative Phosphorus Removal System)

First, we followed the steps below to cultivate the sludge to improve its activity. The original sludge was allowed to settle for 24 h and then the clear liquid was decanted off. Then the strain was added to the MBR and operated with an HRT of 12 h and a DO in the range of 1.0~2.0 mg/L. After one cycle (12 h), the sludge precipitated for 30 min and then the supernatant was poured. The cycle was repeated over the next two days. The influent TP concentration was controlled at around 40 mg/L and the influent flow rate was 0.5 L/h. Then the influent COD concentration (C6H12O6) was increased from 800 mg/L to 1500 mg/L, and then 2000 mg/L respectively. The phosphate concentration and COD concentration were measured every day. The start-up phase ran for 30 days.
The influent phosphate was controlled in the range of 39~41 mg/L. Figure 2a shows that the average removal of phosphate was only 14.86% during days 1 to 5. During days 6 to 10, phosphate removal slightly increased to 22.41%. Finally, phosphate removal increased significantly from 27.02% to 43.11% from 11 days to 18 days. The results show that phosphate-reducing bacteria need time to adapt. Furthermore, the proliferation of other strains is inhibited, and phosphate-reducing bacteria begin to gain advantage. Then, from the 11th to 18th day, the phosphate-reducing bacteria are in the logarithmic growth phase, the system maximum phosphate removal rate is up to 45.63%. The removal of COD performs well, the treatment effect is satisfactory, and the system runs stably.
As shown in Figure 3, phosphine (measured by volume of sewage) is produced by microorganisms from phosphate and there is a good correlation between phosphate reduction and phosphine production. At the same time, COD is degraded. As shown in Figure 4, as COD destruction decreases, PH3 production gradually decreases. Liu et al. found that the phosphine concentration was positively correlated with a reduction in influent COD, total carbon, and organic phosphorus compounds [14], which is similar to the results of this study.
We measured the phosphorus index of the reactor before and after 30 days of operation. The results are shown in Table 2. The average influent phosphorus concentration was 39.58 mg/L, the effluent phosphorus concentration was 23.71 mg/L, and the average phosphorus removal was 15.88 mg/L. The average daily phosphorus removal was 190.56 mg 30-day phosphorus removal was 5716.8 mg. The sludge concentration was 7102 mg/L at the initial operation and 9811 mg/L at the end of the 30th day. The initial phosphorus concentration in the sludge was 12.09 mg. After 30 days, the phosphorus concentration was 27.71 mg/g. It can be calculated that the content of total phosphorus in liquid phase and solid phase decreases 2183 mg, which is also an indirect proof of the production of gaseous phosphine. The average reduction of phosphorus was 6.06 mg/L, which is obviously higher than the measured phosphine production 320 μg/m3. This may be due to the fact that some of the bound phosphine was not effectively measured.

3.2. Gasification and Phosphorus Removal in the Facultative MBR

According to recent research, the phosphine production occurs during the anaerobic processes, but also has low DO concentrations [15]. In this study, PH3 was detected under the condition of facultative and different carbon sources. Consequently, sufficient reducing power and energy are available for phosphate-reducing bacteria, during COD degradation. For facultative conditions (low DO), there are three basic glycolysis pathways, the Embden-Meyerhof-Parnas pathway (EMP), the Hexose Monophosphate Pathway (HMP), and the Entner-Doudoroff.
In the EMP (Embden-Meyerhof-Parnas pathway) pathway, first, the phosphate-reducing bacteria degrade C6H12O6, producing most of the energy stored by the ATP, and the hydrogen and electron are transferred to the dehydrogenase coenzyme NAD+ to produce NADH + H+. Second, the phosphate-reducing bacteria reduce phosphate to generate PH3 by the energy provided by the ATP, and the reduction force is provided by the NADH + H+. Under facultative conditions (low DO), the intracellular intermediate metabolites such as hydrogen can be used. Consequently, there may be some phosphorus-containing compounds which can accept the electrons and the hydrogen that is released by NADH under the catalytic reactions with specific enzymes. Thus, the transformation process from phosphate to phosphine can occur.
The reducing power in the form of NADPH can be produced during the process of HMP (pentose phosphate pathway). NADPH itself cannot be used to form ATP, mainly for a variety of intracellular reactions to provide intermediates and reducing power. NADPH is essential in the nitrate reduction, the nitrite reduction, the ammonia assimilation process, the reduction of sulfate, and other processes. It can be concluded that the phosphate-reducing bacteria may use the reducing power and energy generated by the HMP pathway to complete the phosphate reduction process and produce gaseous phosphine.
The ED (Entner-Doudoroff) pathway is another alternative to EMP. The ED pathway produces pyruvate in four steps, with lower energy for reduction and energy than the HMP pathway. If the phosphate-reducing bacteria cannot use the EMP pathway, then it can be speculated that the bacteria can still use the ED pathway to produce phosphine.
With respect to dehydrogenation, the reduction potential and energy can be produced in a variety of ways in the process of carbon degradation. There are many ways to produce reducing force, and many kinds of reactions can be realized with these kinds of force. For example, N2 can be produced by nitrate-reducing bacteria through reducing reaction [16], and H2S can be produced by sulfate-reducting bacteria [17]. It can be deduced that phosphine can also be produced from the phosphate via the reduction potential and energy by specific microorganisms and enzymes.
From the perspective of the electron acceptor, there are two conditions in which phosphate can be reduced to phosphine. First, certain bacteria use inorganic phosphate or phosphite as electron acceptors and produce phosphine, with the help of specific enzymes. Second, phosphorus as an element exists in a variety of substances for biological energy metabolism, and many intermediates contain phosphate groups. Thus, carbon source degradation can provide energy for reduction reactions which in turn, produce phosphine, since various oxidized phosphorus molecules including organic phosphorus can act as electron acceptors.

3.3. The Microbial Mechanism in the Facultative MBR

In the KEGG library comparison, the corresponding KO information was obtained to calculate the abundance of the metabolic pathway information which is shown in Table 3.
The phosphotransferase system pathway (PTS) is shown in the Figure 5 and exists only in an anoxic environment. The possible reason for its existence in the anoxic environment from the energy analysis was that bacteria with glucose as a carbon source consumed one ATP to transport and phosphorylate glucose through the PTS system. Conversely, when the bacteria lacked the PTS system, it took one ATP to transport glucose and one ATP was required for phosphorylate glucose in the hexokinase reaction. Therefore, in the absence of oxygen, bacteria used the PTS system to ferment glucose as an effective way to preserve energy. The PTS system allowed glucose to be transported in one direction. At the optimal time, the relative abundance value of the pathway increased by 1.96 times than the initial period, which was a significant increase. It had catalytic and regulatory functions which catalyzed the transportation and phosphorylation of carbohydrate and their derivatives [18,19]. It also played a role in the metabolism of carbon, nitrogen, phosphate, and potassium transport with an energy-coupling mechanism [20]. It was believed that the phosphate reduction system used the PTS pathway to transport glucose to conserve energy.
Figure 6 showed the phosphatidylinositol signaling system pathway, which was a signal promoting cell transmembrane signaling when it was stimulated by the external environment. The relative abundance value of metabolic pathways in the optimal period increased by 5.10% compared with the initial period. It was believed that this pathway provided favorable intracellular reaction environmental conditions such as pH and Ca+ for the system.
Figure 7 shows the phosphonate and phosphonate metabolism pathway which could produce C-P compounds. At the optimal time, the relative abundance value of the pathway increased by 75.73% compared with the initial period, which was a significant increase.
As is shown in Figure 8, the pentose phosphate metabolic pathway could produce the energy required by cells and the NADPH produced provides reducing power. At the optimal time, the relative abundance of the pathway increased by 2.24% compared with the initial period.

3.4. The Microbial Mechanism Combined with Thermodynamic

Combining metabolic pathways and thermodynamics to analyze the mechanism of phosphine production in facultative MBR, it was believed that the production of phosphine was caused by microbes with special enzyme-catalyzed reactions [21]. The calculation of ΔrGmθ was in the formula. Each speculative reaction was as shown in Table 4 and the thermodynamic properties were shown in Table 5. The calculation results were shown in Table 6.
Since the temperature had a significant influence on the Gibbs function, but the influence on the Δ H and Δ S were small, the formula for calculating ΔrGmθ at the temperature T in the standard state was approximate:
Δ r G m θ   ( T ) = Δ r H m θ   ( 298.15   K ) T Δ r S m θ   ( 298.15   K )
The cell was an isothermal system, so the intracellular reaction was carried out under normal temperature and pressure. Cells could only use Gibbs free energy. Heterotrophic cells obtained free energy in chemical form from the catabolism of nutrient molecules and presented free energy in ATP and other potent compounds. Through thermodynamic calculation, the reactions were all endothermic reactions and could not proceed spontaneously. It was speculated that the phosphate reduction reaction was carried out in the phosphate-reducing bacteria cells. Due to external environmental conditions, the phosphate-reducing bacteria were allowed to receive external signals. The PTS system was used to absorb and C6H12O6. The phosphine-producing reaction was catalyzed by a special phosphate oxidoreductase to reduce the activation energy which was powered by ATP. Since the free energy ΔrGmθ represented a driving force, different speculations on the intracellular phosphate reactions are shown in Table 5. Comparing ΔrGmθ of different reactions, the ΔrGmθ of 2C6H12O6 + H2PO4 + H+ = 4C3H4O3 + PH3 + 4H2O was the smallest of all the reactions. As a result, the reaction required a minimum of energy to couple with ATP degradation or hydrolysis of a rich compound, so the reaction was more likely to occur. The produced phosphine spilled out of the cell, giving the phosphate-reducing bacteria a competitive advantage because of its toxicity.

3.5. The Community of the Facultative MBR

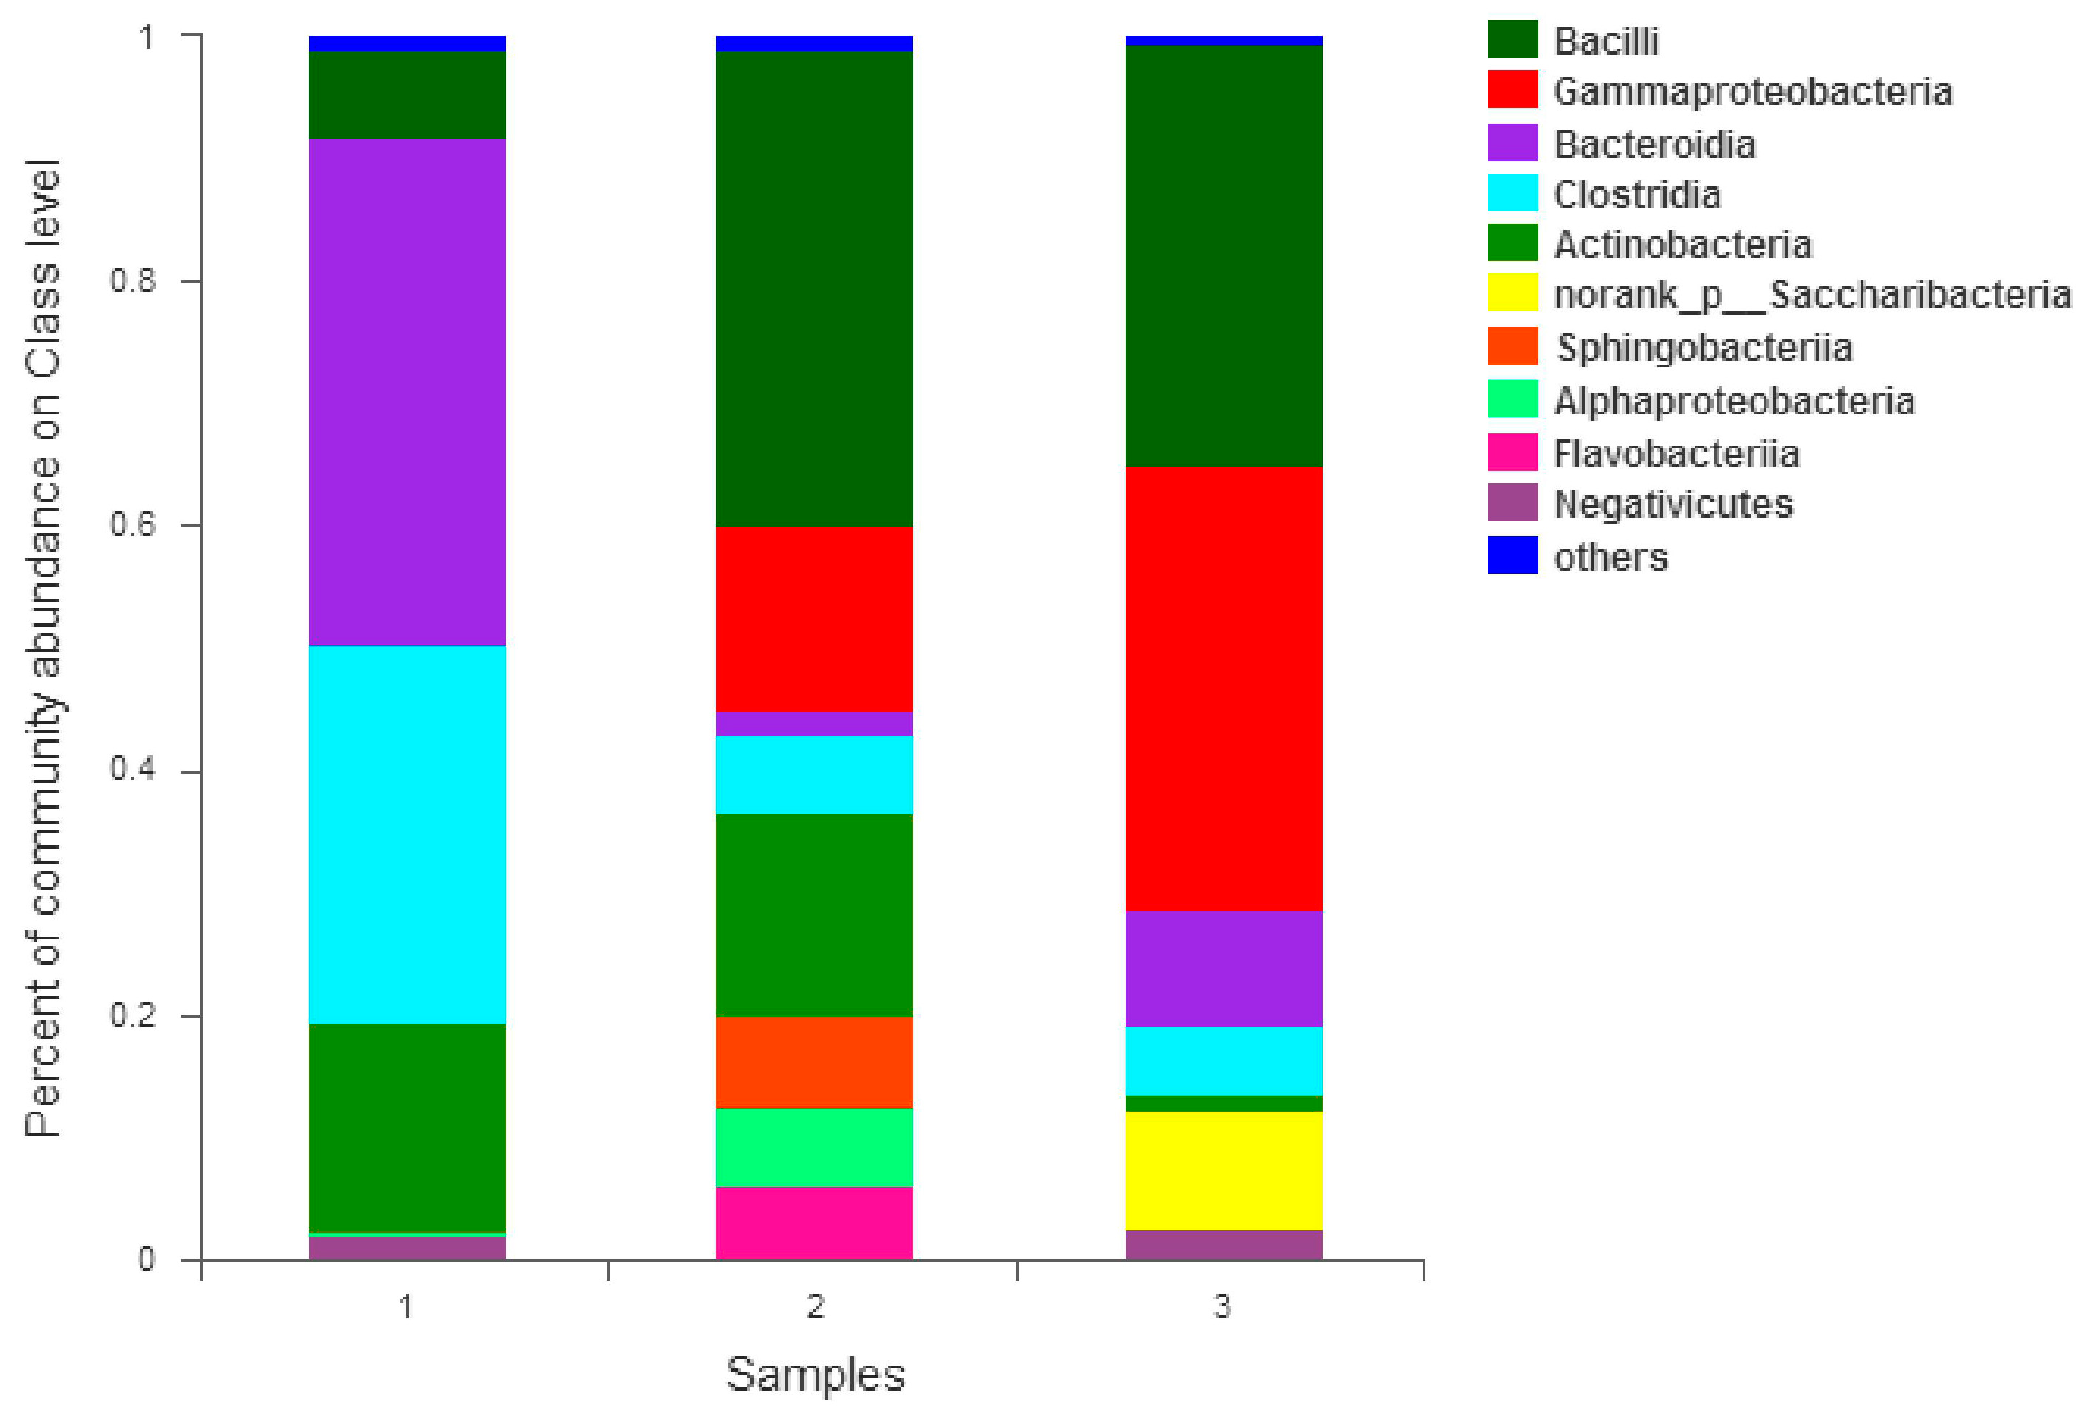
The colonies of the activated sludge samples for the three periods were columned (bar plot, combined with less than 1% of the area) at the “class” taxonomic level. As shown in Figure 9, according to the relative abundance of strains, the effect was estimated in different periods. The relative abundance values of Bacilli in the early, middle, and best periods were 7.09%, 39.00%, and 34.55% respectively. The abundance of the Bacilli increased significantly from the initial to the mid-term by 82.8%. The abundance value of the best period decreased, which was 11.4% lower than the medium term. It is thought that the species that compete with phosphate-reducing bacteria may belong to this class; the relative abundance values of Gammaproteobacteria in the early, middle, and best periods were 0.00%, 14.97%, and 36.37% respectively. In the initial stage, the abundance value was close to zero. The best period abundance increased by 58.8% compared with the medium term. Reducing bacteria or strains that are synergistic with phosphate-reducing bacteria may belong to this class. The relative abundance values of Bacteroidia in the early, middle and best periods were 41.45%, 2.08%, and 9.43%, respectively. The mid-term abundance value decreased by 95.0% from the initial period. The best period of abundance increased by 77.9% compared with the medium term. The abundance was significantly reduced with the increase of phosphine production. It was possible to theorize that strains that compete with phosphate-reducing bacteria may belong to this class. The relative abundance values of Clostridia in the early, middle, and best periods were 30.94%, 6.36%, and 5.66%, respectively. The abundance showed a significant downward trend. The medium-term abundance value decreased by 79.4% compared with the initial period. The best period of abundance was 11.0% lower than the medium term. With the increase of phosphine production, the abundance value decreased. The strains that are competitive with phosphate-reducing bacteria may belong to the class; the relative abundance values of Actinobacteria in the early, middle, and best periods were 17.36%, 16.61%, and 1.40% respectively. The abundance value was in a downward trend. The intermediate period decreased by 4.3% compared with the initial period, and the best period was 91.6% lower than the medium term. Species that compete with phosphate-reducing bacteria may belong to this class; the relative abundance values of norank_p_Saccharibacteria in the early, middle, and best periods were 0.00%, 0.01%, and 9.65% respectively. The initial abundance was close to zero, the mid-abundance was also very small and the best period abundance improved. Analysis of phosphate-reducing bacteria or strains that are synergistic with phosphate-reducing bacteria may belong to this class; the relative abundance values of Sphingobacteria in the early, middle, and best periods were 0.00%, 7.47%, and 0.02% respectively. The relative abundance of Alphaproteobacteria in the initial, middle, and best periods were 0.01%, 6.48%, and 0.02% respectively. The relative abundance values of Flavobacteria in the early, middle, and best periods were 0.00%, 6.06%, and 0.00% respectively. Their initial abundance values were close to zero, the mid-abundance value increased and the abundance values were close to zero, which was a significant decline in the best period. The analysis suggests that the species that compete with phosphate may belong to these classes. The relative abundance values of Negativicutes in the early, middle, and best periods were 2.16%, 0.01%, and 2.49% respectively. The abundance value decreased by 99.5% in the middle of the period, which was significantly lower. The abundance value of the best period rebounded. In the medium term, its competition was at a disadvantage, resulting in a significant decrease in abundance. In the best period, due to the abundance of environmental adaptability, the competition was at a disadvantage. The rebound was not obvious. It is believed that the species that compete with phosphate may belong to this class; The relative abundance values of Others, which were less than 1%, in the initial, medium, and best periods, were 0.98%, 0.97%, and 0.40%, respectively. In summary, it can be seen that phosphate-reducing bacteria or bacteria that were synergistic with phosphate-reducing bacteria may belong to norank_p_Saccharibacteria and Gammaproteobacteria.

4. Conclusions

(1) The TP removal was 45.63%, and PH3 was generated. It is shown that the phosphate-reducing bacteria can reduce the phosphate to PH3 under the facultative condition using the specific enzymes.
(2) In terms of the microbial mechanism, it was believed that the reaction of phosphine production coupled with ATP degradation or hydrolysis of a rich compound to produce energy. Because of minimum energy by thermodynamics analysis, the reaction 2 C 6 H 12 O 6 + H 2 PO 4 + H + = 4 C 3 H 4 O 3 + PH 3 + 4 H 2 O was more likely to occur.
(3) Phosphate-reducing bacteria or bacteria that were synergistic with phosphate-reducing bacteria may belong to norank_p_Saccharibacteria and Gammaproteobacteria. Because these strains can produce toxic phosphine, they formed a competitive advantage in the domestication process.

Author Contributions

Conceptualization, B.W. and P.A.; methodology, B.W.; software, Y.L.; validation, B.W., P.A. and J.C.C.; formal analysis, S.Z.; investigation, S.L.; resources, B.W.; data curation, B.S.; writing—original draft preparation, Y.L.; writing—review and editing, B.W.; visualization, Z.R.; supervision, K.Z.; project administration, L.Y.; funding acquisition, B.W. All authors have read and agreed to the published version of the manuscript.

Funding

This research was funded by National Natural Science Foundation of China, grant number 5150834. This research was funded by Project of science and Technology Department of Liaoning Province, grant number 2019-ZD-0298.

Institutional Review Board Statement

Not applicable.

Informed Consent Statement

Not applicable.

Data Availability Statement

The data presented in this study are available on request from the corresponding author. The data are not publicly available because the author wants to be private.

Conflicts of Interest

The authors declare no conflict of interest. The funders had no role in the design of the study; in the collection, analyses, or interpretation of data; in the writing of the manuscript, or in the decision to publish the results.

References

  1. Roels, J.; Huyghe, G.; Verstraete, W. Microbially mediated phosphine emission. Sci. Total Environ. 2005, 338, 253–265. [Google Scholar] [CrossRef] [PubMed]
  2. Zhu, R.; Liu, Y.; Sun, J.; Sun, L.; Geng, J. Stimulation of gaseous phosphine production from Antarctic seabird guanos and ornithogenic soils. J. Environ. Sci. 2009, 21, 150–154. [Google Scholar] [CrossRef]
  3. Hou, L.J.; Chen, H.; Yang, Y.; Jiang, J.M.; Lin, X.; Liu, M. Occurrence of matrix-bound phosphine in intertidal sediments of the Yangtze Estuary. Chemosphere 2009, 76, 1114–1119. [Google Scholar] [CrossRef] [PubMed]
  4. Zhu, R.; Glindemann, D.; Kong, D.; Sun, L.; Geng, J.; Wang, X. Phosphine in the marine atmosphere along a hemispheric course from China to Antarctica. Atmos. Environ. 2007, 41, 1567–1573. [Google Scholar] [CrossRef]
  5. Fan, Y.; Niu, X.; Zhang, D.; Lin, Z.; Fu, M.; Zhou, S. Analysis of the characteristics of phosphine production by anaerobic digestion based on microbial community dynamics, metabolic pathways, and isolation of the phosphate-reducing strain. Chemosphere 2021, 262, 128213. [Google Scholar] [CrossRef]
  6. Roels, J.; Verstraete, W. Biological formation of volatile phosphorus compounds. Bioresour Technol. 2001, 79, 243–250. [Google Scholar] [CrossRef]
  7. Jenkins, R.O.; Morris, T.A.; Craig, P.J.; Ritchie, A.W.; Ostah, N. Phosphine generation by mixed- and monoseptic-cultures of anaerobic bacteria. Sci. Total Environ. 2000, 250, 73–81. [Google Scholar] [CrossRef]
  8. Bains, W.; Petkowski, J.J.; Sousa-Silva, C.; Seager, S. New environmental model for thermodynamic ecology of biological phosphine production. Sci. Total Environ. 2019, 658, 521–536. [Google Scholar] [CrossRef]
  9. Fan, Y.M.; Lv, M.Y.; Niu, X.J.; Ma, J.L.; Song, Q. Evidence and mechanism of biological formation of phosphine from the perspective of the tricarboxylic acid cycle. Int. Biodeterior. Biodegrad. 2020, 146, 104791. [Google Scholar] [CrossRef]
  10. Zheng, T.; Li, P.; Ma, X.; Sun, X.; Wu, C.; Wang, Q.; Gao, M. Pilot-scale multi-level biological contact oxidation system on the treatment of high concentration poultry manure wastewater. Process Saf. Environ. Prot. 2018, 120, 187–194. [Google Scholar] [CrossRef]
  11. Langille, M.G.; Zaneveld, J.; Caporaso, J.G.; McDonald, D.; Knights, D.; Reyes, J.A.; Clemente, J.C.; Burkepile, D.E.; Vega Thurber, R.L.; Knight, R.; et al. Predictive functional profiling of microbial communities using 16S rRNA marker gene sequences. Nat. Biotechnol. 2013, 31, 814–821. [Google Scholar] [PubMed]
  12. YU, X.; Gao, J.; LI, Y.; LI, J. Transcriptome Analysis of Arabidopsis thaliana and Changes of Glucosinolates Metabolism Pathway Induced by Flg22. China Biotechnol. 2014, 34, 30–38. [Google Scholar]
  13. Li, X.; Liu, Z.; Li, J.; Fang, H. Recent Progress and Application of KEGG Database in the Research of Bioinformatics. Pharm. Biotechnol. 2012, 19, 535–539. (In Chinese) [Google Scholar]
  14. Liu, Z.; Jia, S.; Wang, B.; Liu, S. Differences in phosphine contents of various environment samples and the effecting factors. Acta Sci. Circumstantiae 2004, 24, 852–857. [Google Scholar]
  15. Zhang, K.; Zhang, C.; Wei, W.; Rong, H.; Liu, T. Phosphine Release in Aerobic Sequencing Reactor Process and Anaerobic/Aerobic Sequencing Reactor Process. Environ. Eng. 2011, 29, 127–129. [Google Scholar]
  16. Marietou, A. Nitrate reduction in sulfate-reducing bacteria. Fems Microbiol. Lett. 2016, 363, fnw155. [Google Scholar] [CrossRef]
  17. Barton, L. Sulfate-Reducing Bacteria; Plenum Press: New York, NY, USA, 1995. [Google Scholar]
  18. Deutscher, J.; Ake, F.M.; Derkaoui, M.; Zebre, A.C.; Cao, T.N.; Bouraoui, H.; Kentache, T.; Mokhtari, A.; Milohanic, E.; Joyet, P. The bacterial phosphoenolpyruvate:carbohydrate phosphotransferase system: Regulation by protein phosphorylation and phosphorylation-dependent protein-protein interactions. Microbiol. Mol. Biol. Rev. 2014, 78, 231–256. [Google Scholar] [CrossRef] [PubMed] [Green Version]
  19. Plumbridge, J. Expression of ptsG, the gene for the major glucose PTS transporter in Escherichia coli, is repressed by MIc and induced by growth on glucose. Mol. Microbiol. 1998, 29, 1053–1063. [Google Scholar] [CrossRef] [PubMed]
  20. Zeppenfeld, T.; Larisch, C.; Lengeler, J.W.; Jahreis, K. Glucose transporter mutants of Escherichia coli K-12 with changes in substrate recognition of IICBGlc and induction behavior of the ptsG gene. J. Bacteriol. 2000, 182, 4443–4452. [Google Scholar] [PubMed] [Green Version]
  21. Roels, J.; Verstraete, W. Occurrence and origin of phosphine in landfill gas. Sci. Total Environ. 2004, 327, 185–196. [Google Scholar] [CrossRef] [PubMed]
  22. Dean, J.A.; Lange, N.A. Lange’s Handbook of Chemistry; McGraw-Hill: New York, NY, USA, 1973. [Google Scholar]
Figure 1. Facultative MBR flowchart: 1. influent pump, 2. temperature controller, 3. flat ceramic membrane, 4. aeration device, 5. gas flowmeter, 6. air pump, 7. emptying pipe, 8. effluent pump, 9. agitator.
Water 13 02902 g001
Figure 2. Change of carbon and phosphorus index in influent and effluent. (a) PO43− concentrations dissolved in water during start-up period. (b) COD concentrations during start-up period.
Water 13 02902 g002
Figure 3. The correlation between the phosphate reduction and the phosphine production.
Water 13 02902 g003
Figure 4. The correlation between the COD removal and the phosphine production.
Water 13 02902 g004
Figure 5. Phosphotransferase pathway.
Water 13 02902 g005
Figure 6. Phosphotransferase system pathway.
Water 13 02902 g006
Figure 7. Phosphonate and phosphinate metabolism pathway.
Water 13 02902 g007
Figure 8. Pentose phosphate metabolic pathway.
Water 13 02902 g008
Figure 9. Community bar plot analysis.
Water 13 02902 g009
Table 1. The nutrient solution composition.
NutrientConcentration/g·L−1NutrientConcentration/g·L−1
ZnSO4·7H2O0.330CoD2·6H2O0.440
NaMoO4·2H2O0.290NiCl2·6H2O0.290
CuSO4·5H2O0.290H3BO40.024
MnCl12·4H2O0.990
Table 2. Calculation of phosphorus balance in sewage and sludge.
SourceCalculation ProjectValue
Waste water
30-day average influent TP39.58 mg/L
30-day average effluent TP23.71 mg/L
Average phosphorus removal15.88 mg/L
Daily influent volume12 L
Total phosphorus removal in 30 days5716.8 mg
Sludge
Initial sludge concentration7102 mg/L
TP in initial sludge12.09 mg/g
Final sludge concentration9811 mg/L
TP in final sludge27.71 mg/g
Reactor volume19 L
Increased P in sludge3534 mg
Difference2183 mg
Table 3. The abundance of the metabolic pathways.
Pathway123Definition
ko00440647117,20328,541Phosphonate and phosphinate metabolism
ko0206067,286149,148499,389Phosphotransferase system (PTS)
ko0407011,28323,15529,763Phosphatidylinositol signaling system
ko00030121,303191,449311,269Pentose phosphate pathway
Table 4. The abundance of the metabolic pathway.
Serial NumberReaction
(1) 2 C 6 H 12 O 6 + H 2 PO 4 + H + = 4 C 3 H 4 O 3 + PH 3 + 4 H 2 O
(2) C 6 H 12 O 6 + 3 H 2 PO 4 = 3 PH 3 + 6 HCO 3 + 3 H +
(3) C 6 H 12 O 6 + 3 H 2 PO 4 = 3 PH 3 + 3 HCO 3 + 3 H 2 O + 3 CO 2
(4) 4 H 2 + H + + H 2 PO 4 PH 3 + 4 H 2 O
(5) 2 CH 3 CHOHCOO + H 2 PO 4 2 CH 3 COO + 2 HCO 3 + H + + PH 3
Table 5. Thermodynamic properties table.
SubstancePhysical StateΔfHmθ (kcal·mol−1)ΔfGmθ (kcal·mol−1)Sθ (cal·mol−1·°C−1)
PH3g1.292.7950.24
H2PO4aq−309.82−270.1721.6
HCO3aq−165.39−140.2621.8
H+aq000
H2Ol−68.315−56.68716.71
C3H4O3l−139.7−110.7542.9
C6H12O6c−304.26−217.650.7
CO2g−94.05−94.2651.07
H2g0031.211
CH3CHOHCOOl−161.21−123.8545.91
Note: Data source “LANGE’S HANDBOOK OF CHEMISTRY” [22].
Table 6. Thermodynamic calculations.
ReactionΔrHmθ (kcal·mol−1)ΔrSθ (cal·mol−1·K−1)25 °C, ΔrGmθ (kcal·mol−1)30 °C, ΔrGmθ (kcal·mol−1)
(1)91.78165.6841.7241.55
(2)257.88166.02204.85207.55
(3)266.96303.96172.79174.81
(4)42.06−29.3649.5250.96
(5)103.9442.0670.6991.19
Publisher’s Note: MDPI stays neutral with regard to jurisdictional claims in published maps and institutional affiliations.

