
Trends of Nitrogen and Phosphorus in Surface Sediments of the Lagoons of the Northern Adriatic Sea

 , , , ,
Abstract
:
1. Introduction
2. Materials and Methods
2.1. Description of Study Areas and Sampling Campaigns
2.1.1. The Venice Lagoon
2.1.2. The Lagoon of Marano-Grado
2.1.3. Po Delta Lagoons and Ponds
2.1.4. Comacchio Valleys
2.1.5. Pialassa Della Baiona
2.2. Sediment Sampling
2.3. Nutrient Determination in Surface Sediments
2.4. Map Preparation
2.5. Sediment Characteristic Determination
2.6. Statistical Analyses
3. Results
3.1. Nutrient Concentrations and Sediment Characteristics
3.2. Nutrient Variations in the Venice Lagoon
3.3. Statistical Analyses
4. Discussion
Supplementary Materials
Author Contributions
Funding
Acknowledgments
Conflicts of Interest
References
- Solidoro, C.; Bandelj, V.; Bernardi, F.A.; Camatti, E.; Ciavatta, S.; Cossarini, G.; Facca, C.; Franzoi, P.; Libralato, S.; Melaku Canu, D.; et al. Response of the Venice Lagoon Ecosystem to Natural and Anthropogenic Pressures over the last 50 years. In Coastal Lagoons—Critical Habitats of Environmental Change; Kennish, M.J., Paerl, H.W., Eds.; CRC Press: Boca Raton, FL, USA, 2010; Chapter 19; pp. 483–511. [Google Scholar]
- Sfriso, A.; Buosi, A.; Mistri, M.; Munari, C.; Franzoi, P.; Sfriso, A.A. Long-Term Changes of the Trophic Status in Transitional Ecosystems of the Northern Adriatic Sea, Key Parameters and Future Expectations: The Lagoon of Venice as a Study Case. Nat. Conserv. 2019, 34, 193–215. [Google Scholar] [CrossRef]
- Jessen, C.; Bednarz, V.N.; Rix, L.; Teichberg, M.; Wild, C. Marine Eutrophication. In Environmental Indicators; Armon, R.H., Hänninen, O., Eds.; Springer: Berlin, Germany, 2015; pp. 177–203. [Google Scholar]
- Wolfe, D.A. Estuarine Variability; Academic Press, Inc: Orlando, FL, USA, 1986; p. 509. [Google Scholar]
- Schramm, W.; Nienhuis, P.H. Marine Benthic Vegetation. Recent Changes and Effects of Eutrophication; Springer: Berlin, Germany, 1990; p. 470. [Google Scholar]
- Nedwell, D.B.; Jickells, T.D.; Trimmer, M.; Sanders, R. Nutrients in Estuaries. Estuaries 1999, 29, 43–92. [Google Scholar]
- Pastres, R.; Solidoro, C.; Ciavatta, S.; Petrizzo, A.; Cossarini, G. Long-term changes of inorganic nutrients in the Lagoon of Venice (Italy). J. Mar. Syst. 2004, 51, 179–189. [Google Scholar] [CrossRef]
- Velasco, J.; Lloret, J.; Millan, A.; Marin, A.; Barahona, J.; Abellan, P.; Sanchez-Fernandez, D. Nutrient and particulate inputs into the mar menor lagoon (Se Spain) from an intensive agricultural watershed. Water Air Soil Pollut. 2006, 176, 37–56. [Google Scholar] [CrossRef]
- Moutin, T.; Raimbault, P.; Golterman, H.L.; Coste, B.; Rouzic, B. The input of nutrients by the Rhône river into the Mediterranean Sea: Recent observations and comparison with earlier data. Hydrobiologia 1997, 373, 237–246. [Google Scholar] [CrossRef]
- Brown, J.B.; Sprague, L.A.; DuPree, J.A. Nutrient sources and transport in the Missouri River basin, with emphasis on the effects of irrigation and reservoirs1. JAWRA J. Am. Water Resour. Assoc. 2011, 47, 1034–1060. [Google Scholar] [CrossRef] [Green Version]
- Collavini, F.; Bettiol, C.; Zaggia, L.; Zonta, R. Pollutant loads from the drainage basin to the Venice Lagoon (Italy). Environ. Int. 2005, 31, 939–947. [Google Scholar] [CrossRef] [PubMed]
- Bartoli, M.; Nizzoli, D.; Viaroli, P.; Turolla, E.; Castaldelli, G.; Fano, E.A.; Rossi, R. Impact of Tapes philippinarum farming on nutrient dynamics and benthic respiration in the Sacca di Goro. Hydrobiologia 2001, 455, 203–212. [Google Scholar] [CrossRef]
- Castaldelli, G.; Mantovani, S.; Welsh, D.T.; Rossi, R.; Mistri, M.; Fano, E.A. Impact of commercial clam harvesting on water column and sediment physicochemical characteristics and macrobenthic community structure in a lagoon (Sacca di Goro) of the Po River Delta. Chem. Ecol. 2003, 19, 161–171. [Google Scholar] [CrossRef]
- Pranovi, F.; Da Ponte, F.; Torricelli, P. Historical changes in the structure and functioning of the benthic community in the lagoon of Venice. Estuar. Coast. Shelf Sci. USA 2008, 76, 753–764. [Google Scholar] [CrossRef] [Green Version]
- Sfriso, A.; Facca, C.; Ceoldo, S.; Silvestri, S.; Ghetti, P.F. Role of macroalgal biomass and clam fishing on spatial and temporal changes in N and P sedimentary pools in the central part of the Venice lagoon. Oceanol. Acta 2003, 26, 3–13. [Google Scholar] [CrossRef] [Green Version]
- Sfriso, A.; Facca, C.; Marcomini, A. Sedimentation rates and erosion processes in the lagoon of Venice. Environ. Int. 2005, 31, 983–992. [Google Scholar] [CrossRef] [PubMed]
- Cunha, D.G.F.; Calijuri, M.D.C.; Dodds, W.K. Trends in nutrient and sediment retention in great plains reservoirs (USA). Environ. Monit. Assess. 2014, 186, 1143–1155. [Google Scholar] [CrossRef] [PubMed]
- Sfriso, A.; Pavoni, B.; Marcomini, A.; Orio, A.A. Annual variations of nutrients in the lagoon of Venice. Mar. Pollut. Bull. 1988, 19, 54–60. [Google Scholar] [CrossRef]
- Song, Y.; Zhou, Q.; Song, X.; Zhang, W.; Sun, T. Accumulation of pollutants in sediments and their eco-toxicity in the wastewater irrigation channel of western Shenyang. Ying yong sheng tai xue bao = J. Appl. Ecol. 2004, 15, 1926–1930. [Google Scholar]
- Sakan, S.M.; Đorđević, D.S.; Manojlović, D.D.; Predrag, P. Assessment of heavy metal pollutants accumulation in the Tisza river sediments. J. Environ. Manag. 2009, 90, 3382–3390. [Google Scholar] [CrossRef] [PubMed]
- Marcomini, A.; Sfriso, A.; Zanette, M. Macroalgal Blooms, Nutrient and Trace Metal Cycles in a Coastal Lagoon. In Macroalgae, Eutrophication and Trace Metal Cycling in Estuaries and Lagoons; Rijstenbil, J.W., Haritonidis, S., Eds.; Proceedings of the COST-48 Symposium of Sub Group III Thessaloniki, Commission of the European Communities, Biotechnology Research for Innovation, Development and Growth in Europe (BRIDGE); Thessaloniki, Greece, 24–26 September 1993, pp. 66–90.
- Clavier, J.; Chardy, P.; Chevillon, C. Sedimentation of particulate matter in the south-west lagoon of New Caledonia: Spatial and temporal patterns. Estuar. Coast. Shelf Sci. 1995, 40, 281–294. [Google Scholar] [CrossRef]
- Sfriso, A.; Pavoni, B.; Marcomini, A.; Raccanelli, S.; Orio, A. Particulate matter deposition and nutrient fluxes onto the sediments of the venice lagoon. Environ. Technol. 1992, 13, 473–483. [Google Scholar] [CrossRef]
- Sfriso, A.A.; Buosi, A.; Facca, C.; Sfriso, A.A. Role of environmental factors in affecting macrophyte dominance in transitional environments: The Italian Lagoons as a study case. Mar. Ecol. 2017, 105, 13. [Google Scholar] [CrossRef]
- Giordani-Soika, A.; Perin, G. L’inquinamento della laguna di Venezia: Studio delle modificazioni chimiche e del popolamento sottobasale dei sedimenti lagunari negli ultimi vent’anni. Boll. Mus. Civico Storia Nat. Venezia. 1974, 26, 25–68. [Google Scholar]
- Cossu, A.; De Fraja-Frangipane, E. Stato delle conoscenze sullo inquinamento della laguna di Venezia; Progetto Venezia, Ministero dei Lavori Pubblici, Magistrato alle Acque, Consorzio Venezia Nuova: Venezia, Italy, 1985; 4 vol. [Google Scholar]
- Consorzio Venezia Nuova (CVN); Magistrato alle Acque (MAV). Nuovi Interventi per la Salvaguardia di Venezia; Rapporto sullo Stato Attuale dell’Ecosistema Lagunare. Studio 1.3.9: Final Report: Venice, Italy, 1990; p. 361. [Google Scholar]
- Pavoni, B.; Sfriso, A.; Donazzolo, R.; Orio, A.A. Influence of waste waters from the city of Venice and the hinterland on the eutrophication of the lagoon. Sci. Total. Environ. 1990, 96, 235–252. [Google Scholar] [CrossRef]
- Marcomini, A.; Sfriso, A.; Pavoni, B.; Orio, A.A. Eutrophication of the Lagoon of Venice: Nutrient Loads and Exchanges. In Eutrophic Shallow Estuaries and Lagoons; Mc Comb, A.J., Ed.; CRC Press: Boca Raton, FL, USA, 1995; pp. 59–80. [Google Scholar]
- Sfriso, A.; Marcomini, A. The Lagoon of Venice (Italy). In Marine Benthic Vegetation, Ecological Studies; Schramm, W., Nienhuis, P.N., Eds.; Springer Verlag: Berlin/Heidelberg, Germany, 1996. [Google Scholar]
- Sfriso, A.; Facca, C.; Ceoldo, S.; Marcomini, A. Recording the occurrence of trophic level changes in the lagoon of Venice over the ‘90s. Environ. Int. 2005, 31, 993–1001. [Google Scholar] [CrossRef]
- Falace, A.; Curiel, D.; Sfriso, A. Study of the macrophyte assemblages and application of phytobenthic indices to assess the Ecological Status of the Marano-Grado Lagoon (Italy). Mar. Ecol. 2009, 30, 480–494. [Google Scholar] [CrossRef]
- Sfriso, A.; Facca, C.; Bon, D.; Giovannone, F.; Buosi, A. Using phytoplankton and macrophytes to assess the trophic and eco-logical status of some Italian transitional systems. Cont. Shelf Res. 2014, 81, 88–98. [Google Scholar] [CrossRef]
- Sfriso, A.; Facca, C. Distribution and production of macrophytes in the lagoon of Venice. Comparison of actual and past abundance. Hydrobiologia 2007, 577, 71–85. [Google Scholar] [CrossRef]
- Gačić, M.; Mosquera, I.M.; Kovačević, V.; Mazzoldi, A.; Cardin, V.; Arena, F.; Gelsi, G. Temporal variations of water flow between the Venetian lagoon and the open sea. J. Mar. Syst. 2004, 51, 33–47. [Google Scholar] [CrossRef]
- Masiol, M.; Facca, C.; Visin, F.; Sfriso, A.; Pavoni, B. Interannual heavy element and nutrient concentration trends in the top sediments of Venice Lagoon (Italy). Mar. Pollut. Bull. 2014, 89, 49–58. [Google Scholar] [CrossRef] [PubMed]
- Zuliani, A.; Zaggia, L.; Collavini, F.; Zonta, R. Freshwater discharge from the drainage basin to the Venice Lagoon (Italy). Environ. Int. 2005, 31, 929–938. [Google Scholar] [CrossRef]
- Cucco, A.; Umgiesser, G. Modeling the Venice Lagoon residence time. Ecol. Model. 2006, 193, 34–51. [Google Scholar] [CrossRef]
- Sfriso, A.; Marcomini, A. Decline of Ulva growth in the lagoon of Venice. Bioresour. Technol. 1996, 58, 299–307. [Google Scholar] [CrossRef]
- Gatto, F.; Marocco, R. Morfometria e geometria idraulica dei canali della laguna di Grado (Friuli-Venezia Giulia). Geogr. Fis. e Din. 1993, 16, 107–120. [Google Scholar]
- Marocco, R. Sediment distribution and dispersal in northern Adriatic lagoons (Marano and Grado paralic system). Geologia, serie 3a 1995, 57, 77–89. [Google Scholar]
- Falace, A.; Sfriso, A.; Curiel, D.; Matassi, G.; Aleffi, I.F. The Marano and Grado lagoon (North Adriatic Sea). In Flora and Vegetation of the Italian Transitional Water Systems; Cecere, E., Petrocelli, A., Izzo, G., Sfriso, A., Eds.; CoRiLa, Multigraf: Spinea, Italy, 2009; pp. 1–16. [Google Scholar]
- Sfriso, A.; Facca, C.; Bon, D.; Buosi, A. Macrophytes and ecological status assessment in the Po delta transitional systems, Adriatic Sea (Italy). Application of Macrophyte Quality Index (MaQI). Acta Adriat. 2016, 57, 209–226. [Google Scholar]
- Sorokin, Y.; Gnes, A. Structure and functioning of the anthropogenically transformed Comacchio lagoonal ecosystem (Ferrara, Italy). Mar. Ecol. Prog. Ser. 1996, 133, 57–71. [Google Scholar] [CrossRef] [Green Version]
- Sorokin, Y.I.; Zakuskina, O.Y. Features of the comacchio ecosystem transformed during persistent bloom of picocyano-bacteria. J. Oceanogr. 2010, 66, 373–387. [Google Scholar] [CrossRef]
- Munari, C.; Mistri, M. Ecological status assessment and response of benthic communities to environmental variability: The Valli di Comacchio (Italy) as a study case. Mar. Environ. Res. 2012, 81, 53–61. [Google Scholar] [CrossRef]
- Sfriso, A.; Buosi, A.; Wolf, M.A.; Sfriso, A.A. Invasion of alien macroalgae in the Venice Lagoon, a pest or a resource? Aquat. Invasions 2020, 15, 245–270. [Google Scholar] [CrossRef]
- Covelli, S.; Emili, A.; Acquavita, A.; Koron, N.; Fraganeli, J. Benthic biogeo-chemical cycling of mercury in two contaminated northern Adriatic coastal lagoons. Cont. Shelf Res. 2011, 31, 1777–1789. [Google Scholar] [CrossRef]
- Perin, G. L’inquinamento della Laguna di Venezia: Sintesi di sette anni di ricerche. Convegno: Tavola Rotonda “Problemi dell’inquinamento lagunare” 1974, 1, 47–89. [Google Scholar]
- Perin, G.; Pastre, B.; Orio, A.A.; Carniel, A.; Gabelli, A.; Pavoni, B.; Donazzolo, R.; Pasquetto, A. Inquinamento chimico del-la laguna di Venezia: Nutrienti e metalli pesanti nei sedimenti. Acqua Aria 1983, 6, 623–632. [Google Scholar]
- Aspila, K.I.; Agemian, H.; Chau, A.S.Y. A semi-automated method for the determination of inorganic, organic and total phosphate in sediments. Analyst 1976, 101, 187–197. [Google Scholar] [CrossRef]
- Vaze, J.; Chew, F.H.S. Nutrient loads associated with different sediment sizes in urban stormwater and surface pollutants. J. Environ. Eng. 2004, 130, 391–396. [Google Scholar] [CrossRef]
- Sfriso, A.; Marcomini, A. Macrophyte production in a shallow coastal lagoon. Part I. Coupling with physico-chemical param-eters and nutrient concentrations in waters. Mar. Environ. Res. 1997, 44, 351–375. [Google Scholar] [CrossRef]
- Ferrari, C.; Pirola, A.; Piccoli, F. Carta della vegetazione delle Valli di Comacchio [1:33.000] [Emilia- Romagna]. Ricerche Idro-biologiche nelle Valli di Comacchio. ll. Saggio cartografico della vegetazione delle Valli di Comacchio. Ann. Univ. Ferrara 1972, 1, 35–54. [Google Scholar]
- Giaccone, G. Features and changes of the vegetation of the lagoons of the northern Adriatic Sea as a result of pollution. (Lin-eamenti della vegetazione lagunare dell’Alto Adriatico ed evoluzione in conseguenza dell’inquinamento). Boll. Mus. Civico Storia Nat. Venezia 1974, 26, 87–98. [Google Scholar]
- Facco, S.; Degobbis, D.; Sfriso, A.; Orio, A.A. Space and Time Variability of Nutrients in the Venice Lagoon. In Estuarine Variability; Wolfe, D.A., Ed.; Academic Press, Inc.: New York, NY, USA, 1996; pp. 307–318. [Google Scholar]
- Pavoni, B.; Marcomini, A.; Sfriso, A.; Donazzolo, R.; Orio, A.A. Changes in an Estuarine Ecosystem. The Lagoon of Venice as a Case Study. In The Science of Global Change; Dunnette, D.A., O’Brien, R.J., Eds.; American Chemical Society: Washington, DC, USA, 1992; pp. 287–305. [Google Scholar]
- Sfriso, A.; Marcomini, A. Gross primary production and nutrient behaviours in shallow lagoon waters. Bioresour. Technol. 1994, 47, 59–66. [Google Scholar] [CrossRef]
- Sfriso, A.; Buosi, A.; Tomio, Y.; Juhmani, A.-S.; Facca, C.; Wolf, M.; Sfriso, A.A.; Franzoi, P.; Scapin, L.; Bonometto, A.; et al. Environmental restoration by aquatic angiosperm trans-plants in transitional water systems: The Venice Lagoon as a case study. Sci. Total Environ. 2021, 795, 148859. [Google Scholar] [CrossRef]
- Sørensen, T.H.; Vølund, G.; Armah, A.K.; Christiansen, C.; Jensen, L.B.; Pedersen, S.T. Temporal and spatial variations in concentrations of sediment nutrients and carbon in the Keta Lagoon, Ghana. West Afr. J. Appl. Ecol. 2003, 4, 91–105. [Google Scholar]
- Lopez, P.; Lluch, H.; Vidal, M.; Morguí, S.A. Adsorption of phosphorus on sediments of the Balearic islands (Spain) related to their composition. Estuar. Coast. Shelf Sci. 1996, 42, 185–196. [Google Scholar] [CrossRef]
- Pedersen, O.B.; Christiansen, C.; Laursen, M.B. Wind induced longterm increase and shortterm fluctuations of shallow water suspended material and nutrient concentration, Ringkøbing fiord, Denmark. Ophelia 1995, 41, 273–287. [Google Scholar] [CrossRef]
- de la Lanza-Espino, G.; Flores-Verdugo, F.J.; Hernandez-Pulido, S.; Penié-Rodríguez, I. Concentration of nutrients and C:N:P ratios in surface sediments of a tropical coastal lagoon complex affected by agricultural runoff. Universidad y Ciencia Trópico Húmedo 2011, 27, 145–155. [Google Scholar]
- Gomez, E.; Millet, B.; Picot, B. Accumulation des sels nutritifs dans un sediment lagunaire et environnement hydrody-namique. Oceanol. Acta 1998, 21, 805–817. [Google Scholar] [CrossRef] [Green Version]
- Zayas, R.G.-D.; Yera, A.B.; Artiles, M.M.; González, J.A.L.; Sandoval, F.S.C.; Merino-Ibarra, M. Trace metals in sediments of seven coastal lagoons of the Sabana-Camagüey Archipelago, Cuba. Soil Sediment Contam. Int. J. 2021, 30, 331–349. [Google Scholar] [CrossRef]


| Phosphorus and Nitrogen Changes in the Whole Venice Lagoon | ||||||||||||
|---|---|---|---|---|---|---|---|---|---|---|---|---|
| 2003–2018 | ||||||||||||
| Sediment | Total Phosphorus | Total Nitrogen | ||||||||||
| Years | Thickness | Stations | µg g−1 | mg g−1 | ||||||||
| cm | N° | Mean | Std | min | max | Mean | STD | min | max | |||
| 2003 | 5 | 165 | 409 | ± | 113 | 201 | 677 | 1.42 | ± | 1.42 | 0.09 | 12.9 |
| 2011 | 5 | 118 | 403 | ± | 113 | 199 | 684 | 1.19 | ± | 1.95 | 0.03 | 11.5 |
| 2014 | 5 | 88 | 412 | ± | 111 | 212 | 707 | 1.38 | ± | 1.30 | 0.17 | 6.98 |
| 2018 | 5 | 88 | 403 | ± | 116 | 180 | 716 | 1.28 | ± | 1.09 | 0.19 | 6.98 |
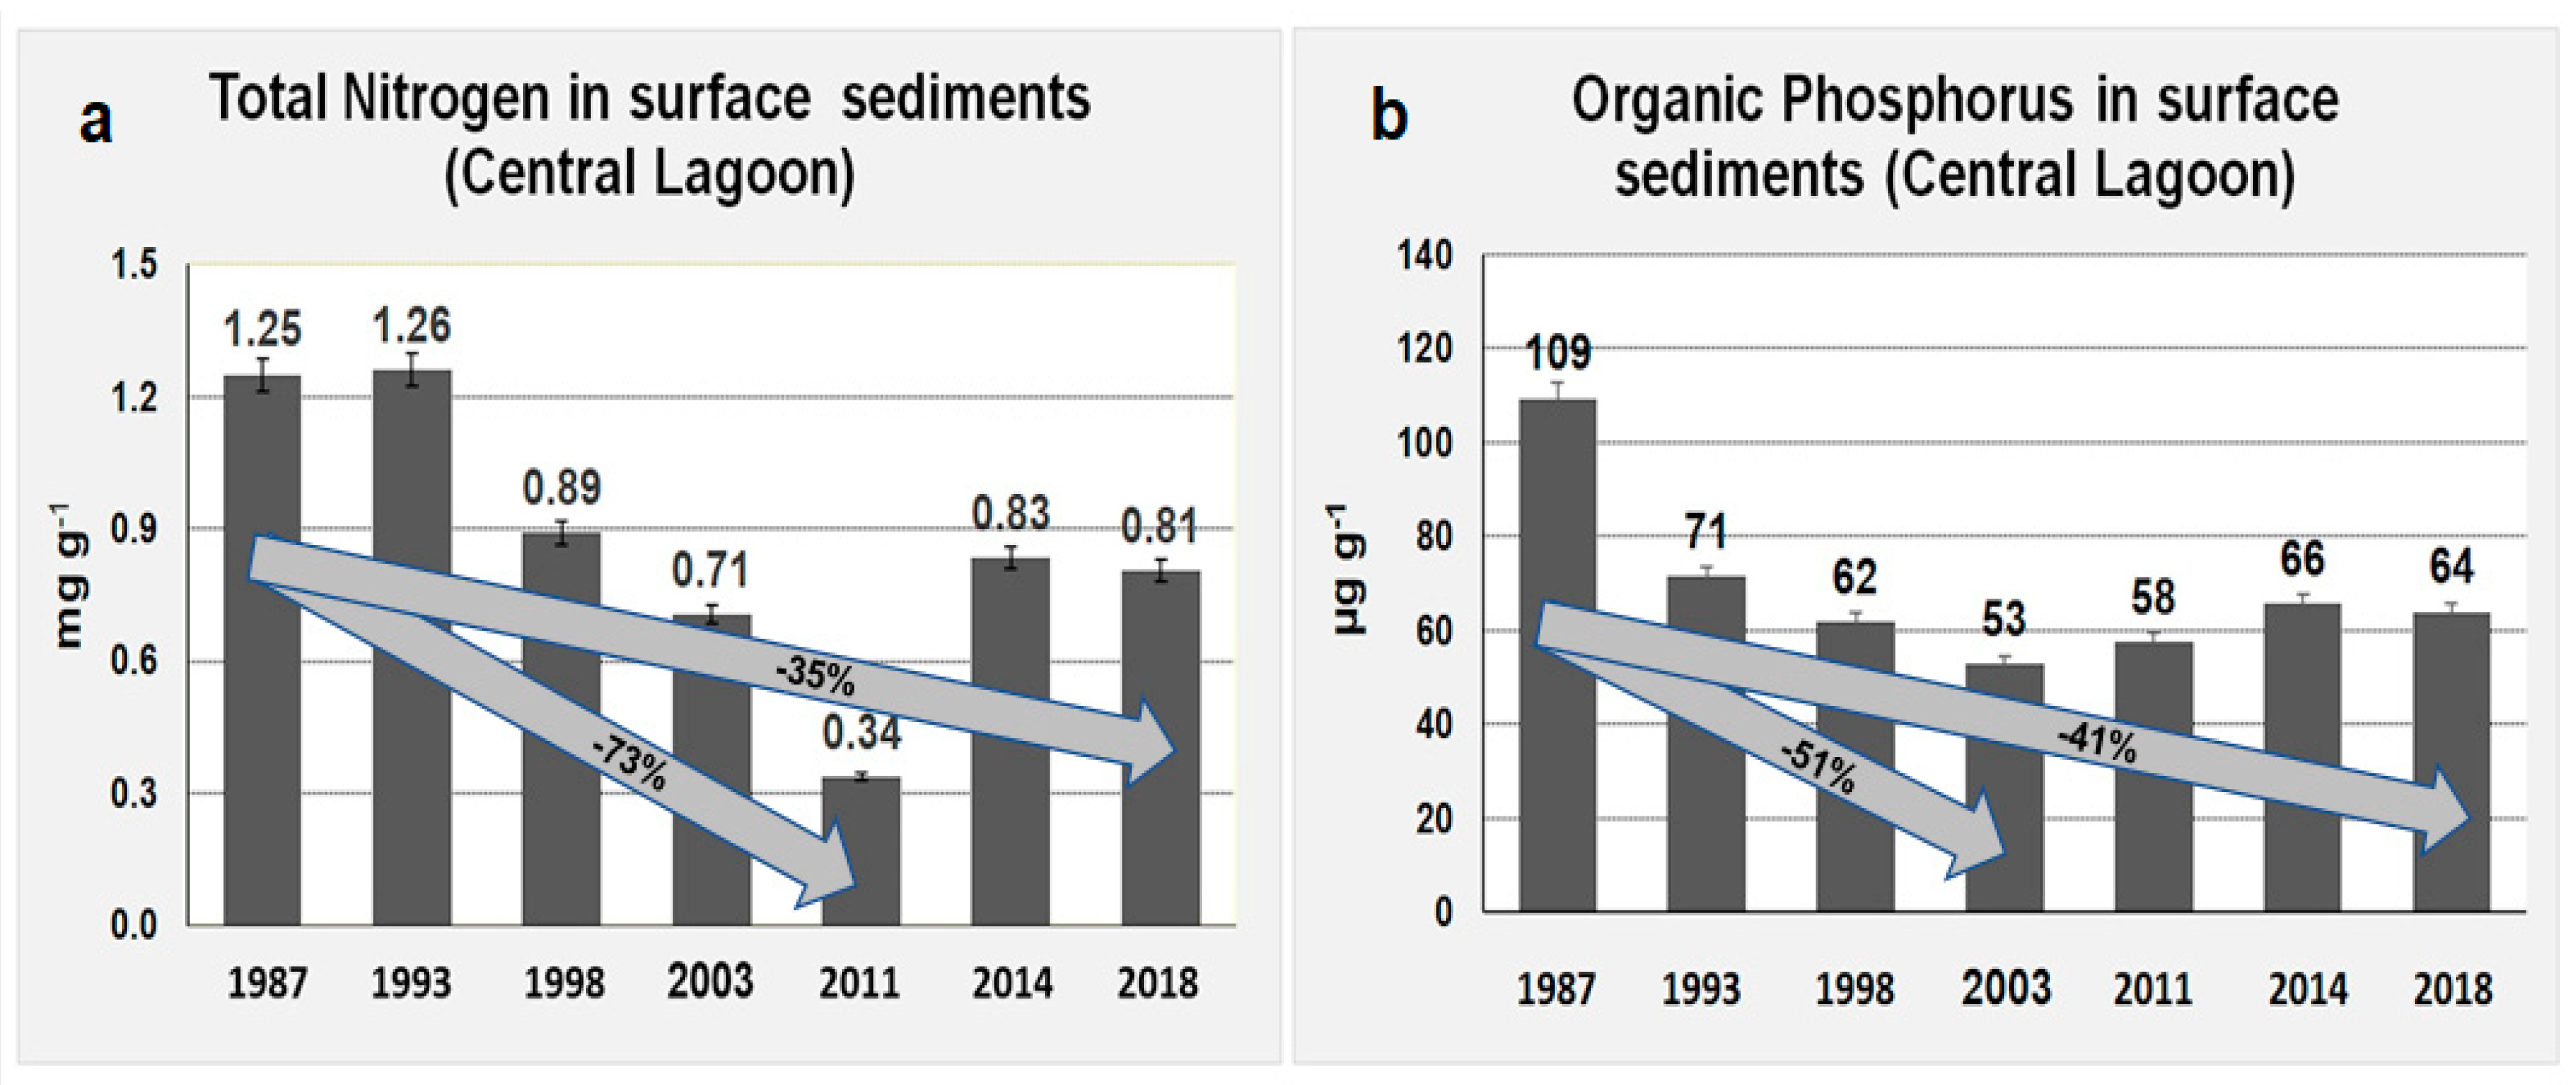
| Total Nitrogen (Central Lagoon) | Inorganic Phosphorus (Central Lagoon) | ||||||||||||||
| 1987 | 1993 | 1998 | 2003 | 2011 | 2014 | 2018 | 1987 | 1993 | 1998 | 2003 | 2011 | 2014 | 2018 | ||
| mg/g | µg/g | ||||||||||||||
| Stations N° | 34 | 34 | 34 | 34 | 35 | 34 | 34 | Stations N° | 34 | 34 | 34 | 34 | 35 | 34 | 34 |
| Mean | 1.25 | 1.26 | 0.89 | 0.71 | 0.34 | 0.83 | 0.81 | Mean | 287 | 301 | 308 | 305 | 283 | 309 | 293 |
| Std | 0.59 | 0.70 | 0.38 | 0.36 | 0.52 | 0.47 | 0.45 | Std | 53 | 66 | 53 | 76 | 62 | 62 | 65 |
| Min | 0.16 | 0.25 | 0.13 | 0.09 | 0.03 | 0.17 | 0.22 | Min | 193 | 185 | 202 | 199 | 179 | 179 | 164 |
| Max | 2.72 | 2.85 | 1.45 | 1.48 | 2.07 | 2.02 | 2.37 | Max | 423 | 461 | 430 | 485 | 454 | 424 | 467 |
| Total Phosphorus (Central Lagoon) | Organic Phosphorus (Central Lagoon) | ||||||||||||||
| 1987 | 1993 | 1998 | 2003 | 2011 | 2014 | 2018 | 1987 | 1993 | 1998 | 2003 | 2011 | 2014 | 2018 | ||
| mg/g | µg/g | ||||||||||||||
| Stations N° | 34 | 34 | 34 | 34 | 34 | 34 | 34 | Stations N° | 34 | 34 | 34 | 34 | 34 | 34 | 34 |
| Mean | 397 | 372 | 370 | 358 | 341 | 375 | 357 | Mean | 109 | 71 | 62 | 53 | 58 | 66 | 64 |
| Std | 82 | 86 | 79 | 99 | 84 | 85 | 86 | Std | 47 | 34 | 41 | 35 | 34 | 33 | 35 |
| Min | 240 | 236 | 221 | 201 | 199 | 212 | 180 | Min | 45 | 22 | 12 | 2 | 10 | 20 | 10 |
| Max | 577 | 597 | 560 | 635 | 563 | 547 | 548 | Max | 240 | 149 | 195 | 150 | 149 | 143 | 166 |
| Total Nitrogen (One-Way ANOVA 34 Stations) | ||
| Period | Significance | Scenario |
| 1987–1993 | n.s. | Macroalgal biomass decrease |
| 1993–1998 | p < 8.47 × 10⁻³ | Clam harvesting |
| 1998–2003 | p < 4.27 × 10⁻² | |
| 2003–2011 | p < 7.81 × 10⁻⁴ | |
| 2011–2014 | p < 8.68 × 10⁻⁵ | Lagoon resilience |
| 2014–2018 | n.s. | |
| 1987–2018 | p < 6.97 × 10⁻⁴ | Total |
| Organic Phosphorus (One-Way ANOVA 34 Stations) | ||
| Period | Significance | Scenario |
| 1987–1993 | p < 2.86 × 10⁻⁴ | Macroalgal biomass decrease |
| 1993–1998 | n.s. | Clam harvesting |
| 1998–2003 | n.s. | |
| 2003–2011 | n.s. | |
| 2011–2014 | n.s. | Lagoon resilience |
| 2014–2018 | n.s. | |
| 1987–2018 | p < 2.53 × 10⁻⁵ | Total |
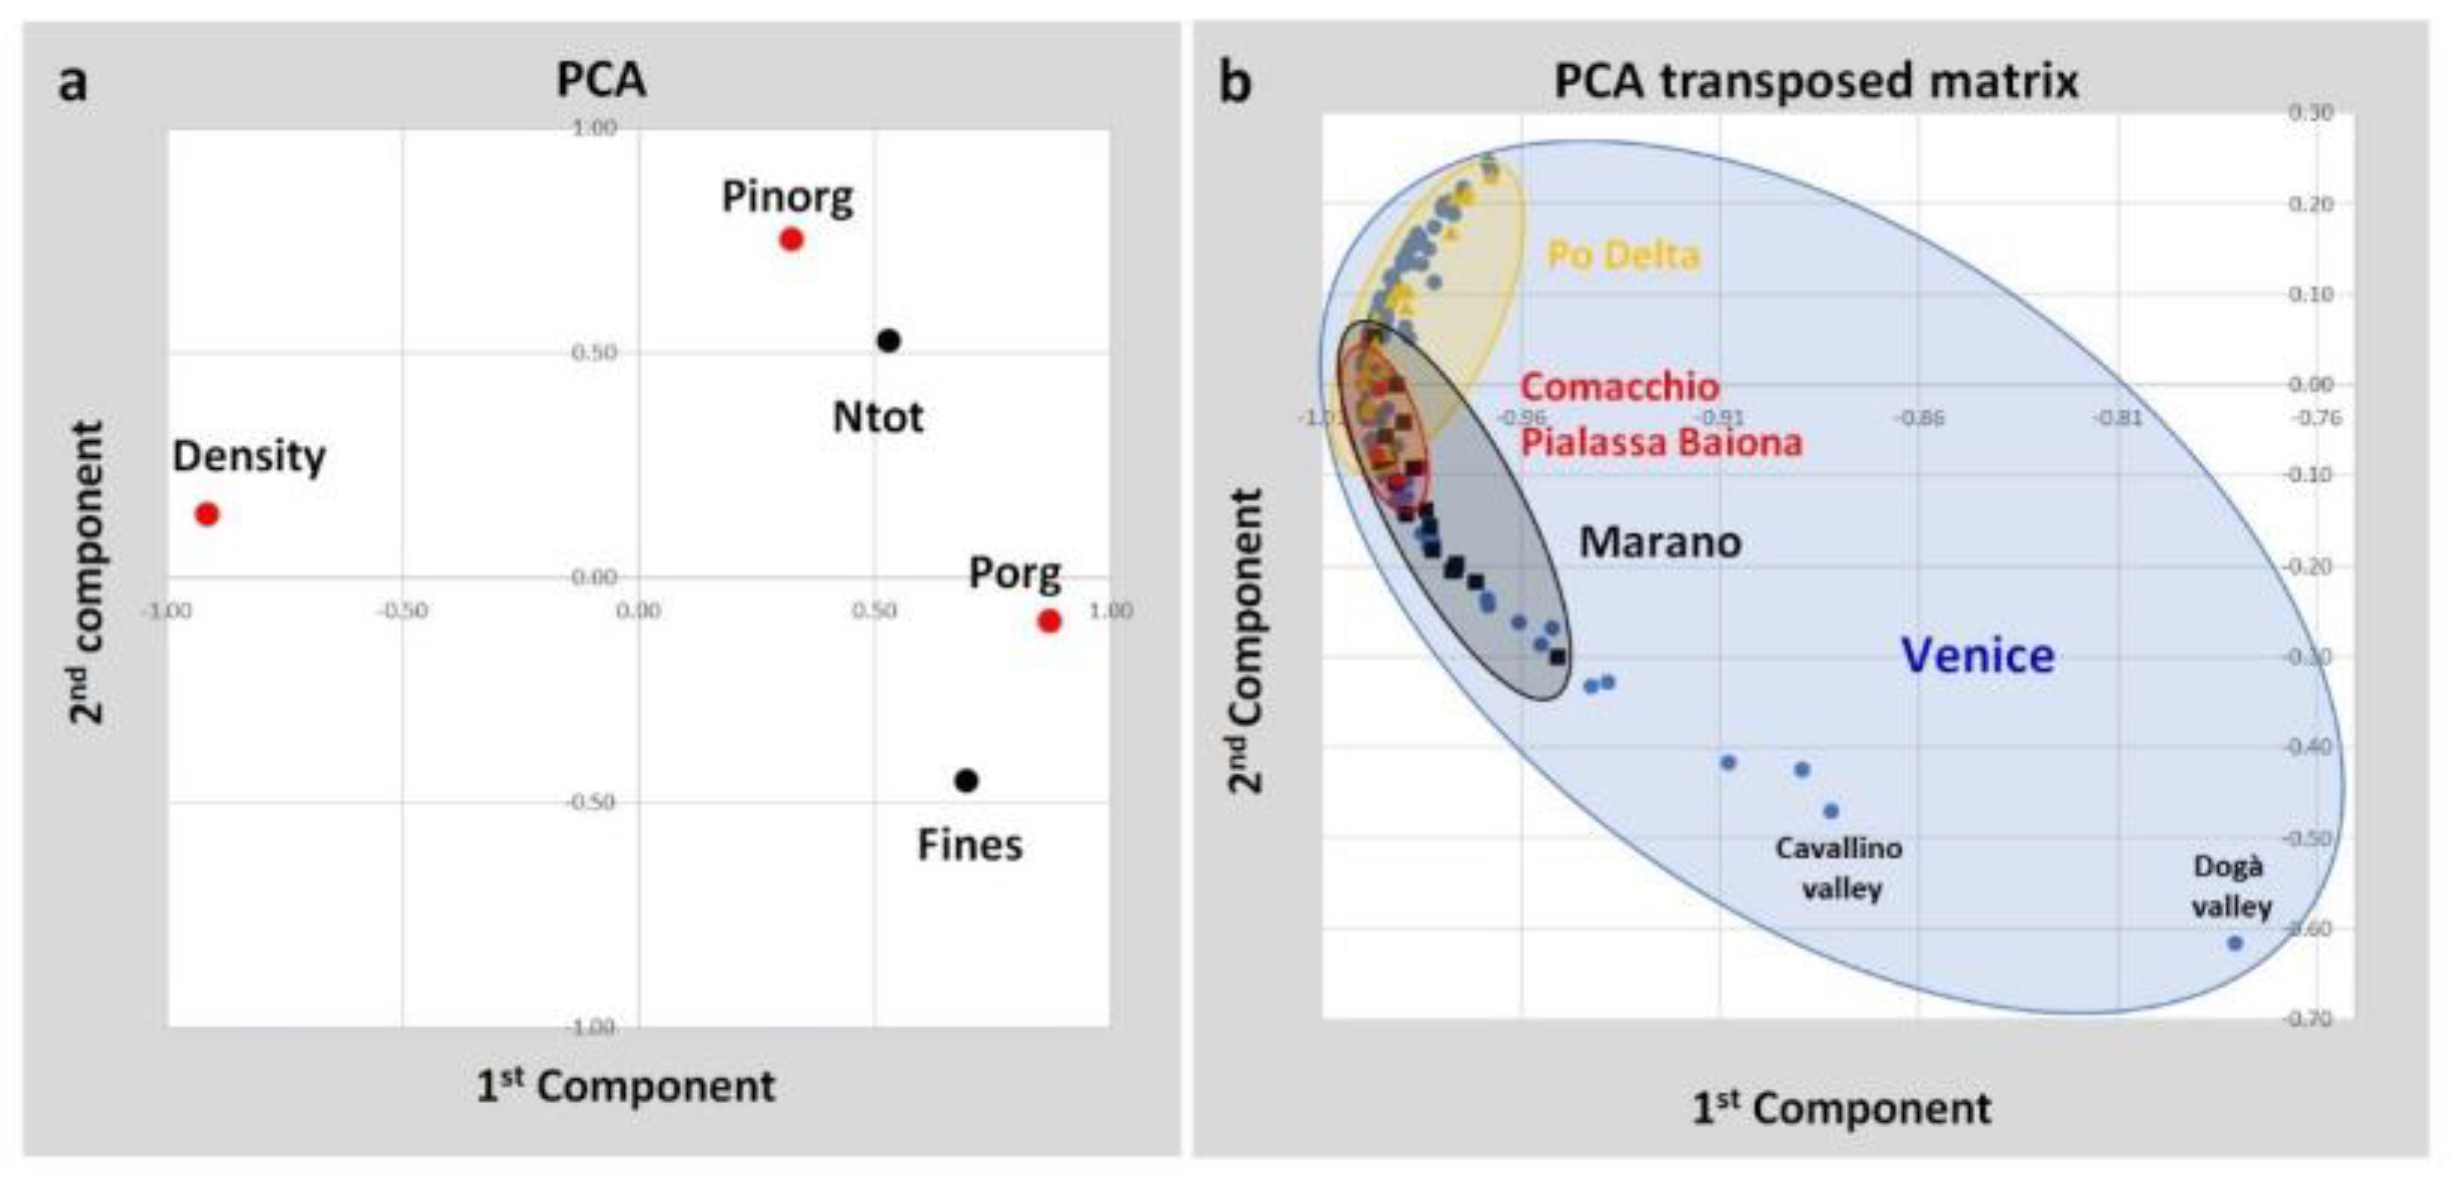
| Spearman’s Non Parametric Coefficients | ||||||
|---|---|---|---|---|---|---|
| Fines | Density | Ptot | Pinorg | Porg | Ntot | |
| Fines | 1.00 | |||||
| Density | −0.55 | 1.00 | ||||
| Ptot | 0.22 | −0.50 | 1.00 | |||
| Pinorg | 0.08 | −0.14 | 0.85 | 1.00 | ||
| Porg | 0.49 | −0.84 | 0.57 | 0.13 | 1.00 | |
| Ntot | 0.19 | −0.46 | 0.41 | 0.20 | 0.51 | 1.00 |
| Phosphorus and Nitrogen Changes in the Whole Lagoon | |||||||||||||
|---|---|---|---|---|---|---|---|---|---|---|---|---|---|
| 1948–2018 | |||||||||||||
| Sediment | Stations | Total Phosphorus | Total Nitrogen | ||||||||||
| Authors | Year | thickness | µg g−1 | mg g−1 | |||||||||
| cm | N° | Mean | Std | Min | Max | Mean | Std | Min | Max | ||||
| Perin, 1974 [49] | 1948–1949 | 30 | - | 24 | ± | 16 | - | 50 | 1.00 | ± | 0.86 | - | 1.96 |
| Perin, 1974 [49] | 1968–1973 | 30 | - | 164 | ± | 79 | - | 250 | 1.86 | ± | 2.20 | - | 3.56 |
| Perin et al., 1983 [50] | 1983 | 20 | - | 454 | ± | 126 | - | 682 | 1.33 | ± | 0.59 | - | 2.74 |
| CVN, MAV, 1990 [27] | 1987–1988 | 20 | - | 339 | ± | 215 | - | 1102 | 1.33 | ± | 0.89 | - | 4.80 |
| This paper | 2003 | 5 | 165 | 409 | ± | 113 | 201 | 677 | 1.42 | ± | 1.42 | 0.09 | 12.9 |
| 2011 | 5 | 118 | 403 | ± | 113 | 199 | 684 | 1.19 | ± | 1.95 | 0.03 | 11.5 | |
| 2014 | 5 | 88 | 412 | ± | 111 | 212 | 707 | 1.38 | ± | 1.30 | 0.17 | 6.98 | |
| 2018 | 5 | 88 | 403 | ± | 116 | 180 | 716 | 1.28 | ± | 1.09 | 0.19 | 6.98 | |
Publisher’s Note: MDPI stays neutral with regard to jurisdictional claims in published maps and institutional affiliations. |
© 2021 by the authors. Licensee MDPI, Basel, Switzerland. This article is an open access article distributed under the terms and conditions of the Creative Commons Attribution (CC BY) license (https://creativecommons.org/licenses/by/4.0/).
Share and Cite
Sfriso, A.; Buosi, A.; Tomio, Y.; Juhmani, A.-S.; Mistri, M.; Munari, C.; Sfriso, A.A. Trends of Nitrogen and Phosphorus in Surface Sediments of the Lagoons of the Northern Adriatic Sea. Water 2021, 13, 2914. https://doi.org/10.3390/w13202914
Sfriso A, Buosi A, Tomio Y, Juhmani A-S, Mistri M, Munari C, Sfriso AA. Trends of Nitrogen and Phosphorus in Surface Sediments of the Lagoons of the Northern Adriatic Sea. Water. 2021; 13(20):2914. https://doi.org/10.3390/w13202914
Chicago/Turabian StyleSfriso, Adriano, Alessandro Buosi, Yari Tomio, Abdul-Salam Juhmani, Michele Mistri, Cristina Munari, and Andrea Augusto Sfriso. 2021. "Trends of Nitrogen and Phosphorus in Surface Sediments of the Lagoons of the Northern Adriatic Sea" Water 13, no. 20: 2914. https://doi.org/10.3390/w13202914