
An Overview of Crop and Crop Residue Management Impacts on Crop Water Use and Runoff in the Canadian Prairies


1
Department of Soil Science, University of Manitoba, Winnipeg, MB R3T 2N2, Canada
2
Global Institute for Water Security, School of Environment and Sustainability, University of Saskatchewan, Saskatoon, SK S7N 3H5, Canada
*
Author to whom correspondence should be addressed.
Water 2021, 13(20), 2929; https://doi.org/10.3390/w13202929
Submission received: 9 September 2021
/
Revised: 4 October 2021
/
Accepted: 15 October 2021
/
Published: 19 October 2021
(This article belongs to the Special Issue Research on Cold Regions Hydrology)
Abstract
:Although crop and crop residue management practices are mainly used for increasing crop yield, they and the resulting changes in crop growth affect one or more hydrological components, including runoff. Based on published research in the Canadian Prairies, this paper reviews the effects of crop type, quantity of crops and crop residues, crop variability within landscapes, tillage, and stubble management practices on crop water use (termed including evaporation, transpiration and interception), snow trapping, and water infiltration, with the aim to discuss major impacts of crop and residue management on runoff. Rainfall runoff is influenced by rain interception and crop water use, and it can be reduced by choosing appropriate crop types, increasing above-ground biomass, or increasing coverage on the soil surface, activities which coincide with the farmer’s efforts of increasing crop productivity. However, although high stubble and reduced tillage for maintaining good residue cover help conserve soil moisture and improve soil health, they increase snowmelt runoff potential. The review emphasizes the need of future research to assess the agronomic and environmental trade-offs of crop residue management, the linkage between crop water use and runoff, and the impacts of crop and residue management on runoff across various temporal and spatial scales.
1. Introduction
Dry and cold regions play a key role in producing small grains and oilseeds of the world. In Canada, about 85% of the national field-crop area, 95% of total wheat (Triticum aestivum L.) and almost all canola (Brassica napus L.) production is found in the Prairie provinces of Saskatchewan, Alberta and Manitoba [1]. In the agricultural region of the Canadian Prairies, where semi-arid and sub-humid continental climates dominate, crop production is constrained by water availability. Due to the dry climates, runoff volumes generated in this region are low, as compared to more humid regions which, at the edges of fields, usually accounts for less than 20% of annual precipitation in 80% of years [2]. However, runoff has important water quality implications, as phosphorus concentrations in runoff [3] often exceeds the threshold value for causing eutrophication in lakes and rivers [4]. Agronomic water deficiency and environmental nutrient runoff constitute the co-existing challenges for water management in the Prairies.
Canadian farmers strive to improve agronomic production. While the total cropland area has remained rather stable since 1970s, crop yield per unit area has almost doubled. In Saskatchewan, Manitoba and Alberta, average wheat yield increased from 1740, 1770 and 1870 kg ha−1 year−1 in 1970–1979 to 2740, 3410 and 3440 kg ha−1 year−1, respectively [5]. Meanwhile, average canola yield increased from 1080, 1100 and 1040 kg ha−1 year−1 to 1990, 2070 and 2230 kg ha−1 year−1, respectively [5]. The increase in crop yield is largely due to improved crop breeding and farming practices, including crop and crop residue management. Although many of the practices related to crop and crop residue management, such as crop rotation, stubble management and conservation tillage, are mainly used in order to improve soil and crop productivity, these practices also impact various hydrological processes, i.e., rain interception, transpiration, evaporation, snow trapping, water infiltration, and runoff.
The impact of crop and crop residue management on the hydrological cycle and runoff can be considerable, as differing management practices influence the hydrological processes in different ways and/or to different extents. The relevant past field research in the Canadian Prairies has mostly focused on understanding management impacts on soil water availability and crop production [6,7,8,9,10,11,12,13,14,15], with limited direct linkage to snowmelt [16,17,18,19] or rainfall runoff [3,17,20,21,22]. Still, there is a lack of synthesized information to elucidate the crop and residue management impacts in the contexts of the hydrological cycle and runoff.
In this paper, we review how crop and crop residue management (i.e., type, quantity and coverage of crops and residues, tillage, etc.) affect the hydrological processes of evapotranspiration, interception, snow trapping, water infiltration and runoff in the Canadian Prairies, and attempt to use the findings of the literature to assess the potential direct and indirect impacts of management on runoff. The papers used in the review were collected from the Web of Science database and based on expert knowledge of the relevant research conducted in the Canadian Prairies. A summary of papers by topics reviewed is given in Table A1. Given the overall lack of research directly addressing the crop–hydrology relationship, the review aims to identify some of the related knowledge gaps and research needs for developing field-level options for managing runoff.
2. An Overview of How Crops and Crop Residues Affect the Hydrological Cycle
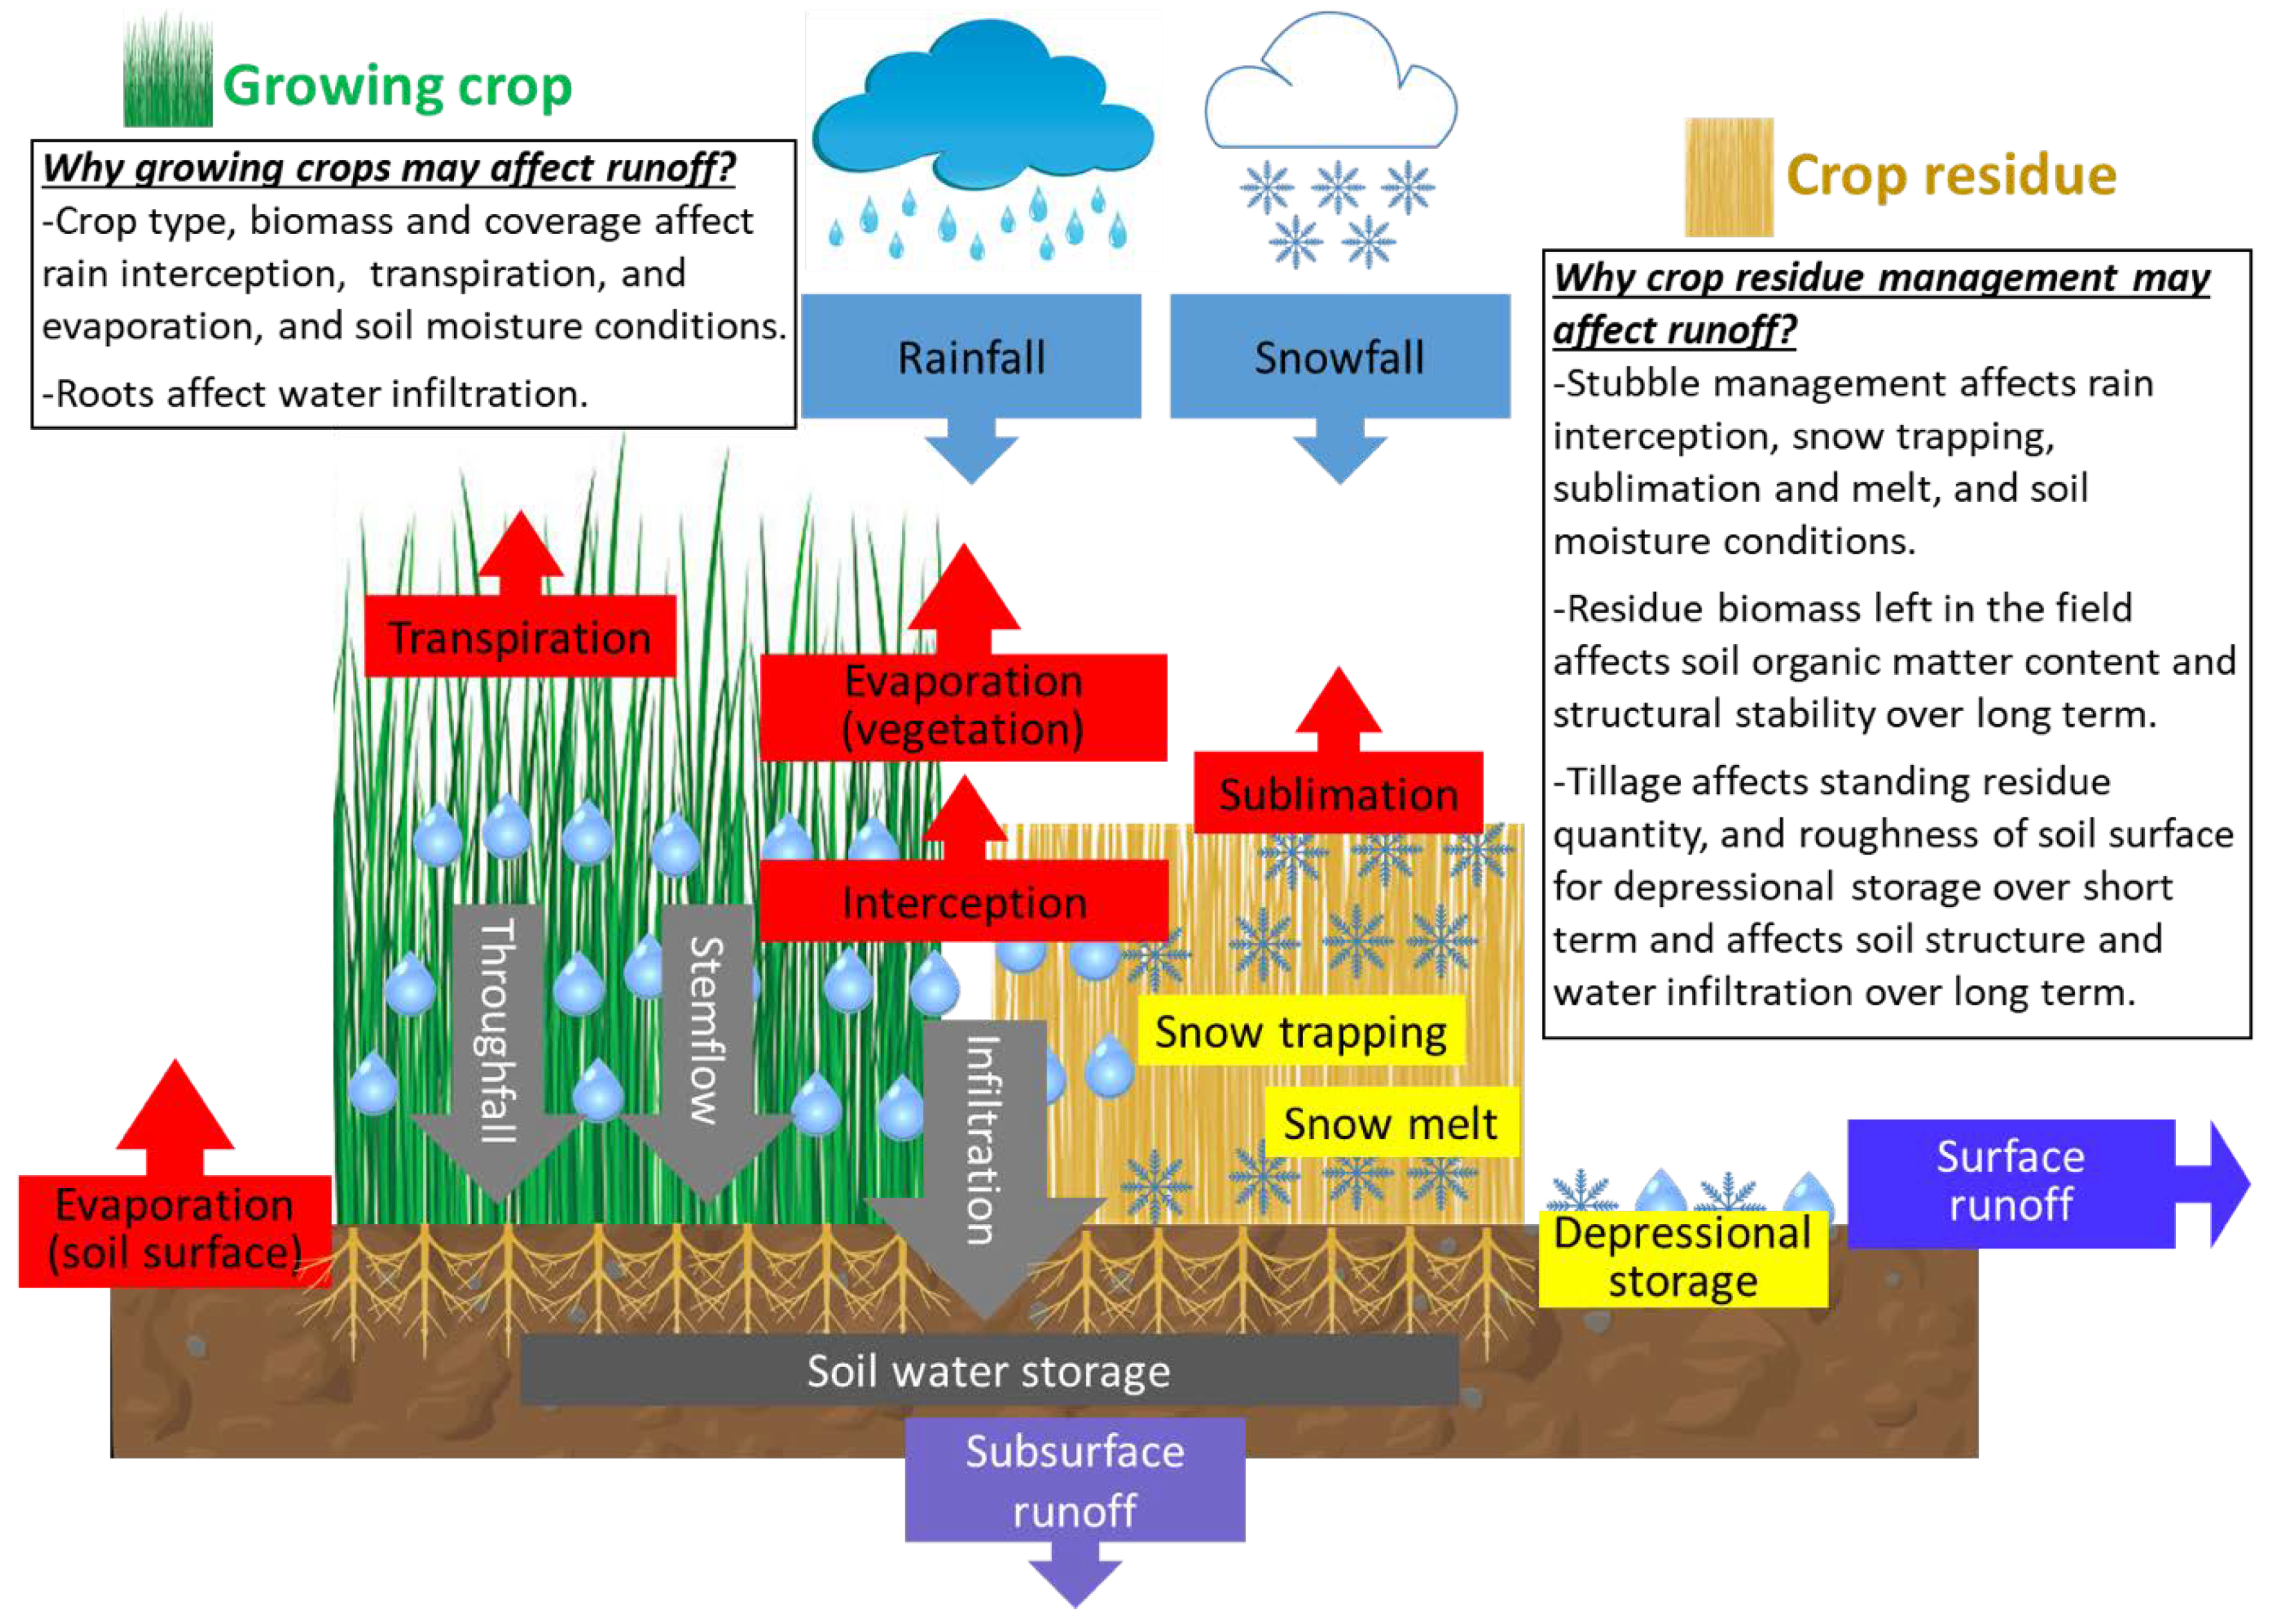
In the Canadian Prairies, both rainfall and snowfall derive runoff, and runoff generation can be affected by growing crops and crop residues through their involvement in the processes of interception, transpiration, evaporation, snow trapping, melt and sublimation, and water infiltration (Figure 1). Interception describes the stopping of rain and snow by crop canopy or crop residue from reaching the ground. This water is lost to the atmosphere through evaporation or sublimation. Transpiration describes the movement of water within a plant and the subsequent loss of water as vapor from the plant through stomata. Evaporation describes the loss of soil water to the atmosphere from the soil surface, and of interception water from surface of the crop canopy and residue. Interception, transpiration and evaporation are hard to separate in field experiments, and they are often lumped and simply referred to as evapotranspiration when being measured with the commonly used methods, such as eddy covariance and water balance [23]. Snow trapping describes the capture of snow by the above-ground part of a plant, melt describes the process of snow becoming liquefied due to heat, and sublimation describes the loss of snow by changing into water vapor in the air without first melting into water. Infiltration describes the process by which water on the soil surface enters the soil.
When rainfall occurs, part of the water is intercepted by growing crops and/or crop residues and subsequently evaporated to the air, and the rest of water reaches on the ground via throughfall and stemflow [24]. Along with depressional storage, which is impacted by soil surface roughness and tillage [25], and water infiltration, which is impacted by both soil and root characteristics [26], rain interception significantly affects the availability of water for runoff during a rainfall event. During the growing season, crops consume soil water, leading to water loss from the soil-plant system by transpiration. This is contrasting to evaporative water loss directly from the soil when a growing crop is absent. Evapotranspiration affects soil water storage [23], or the so-called antecedent soil moisture condition, which plays an important role in generating runoff from subsequent rainfall events [27]. During the non-growing season, when most of the snowfall occurs, crop stubble traps snow [9], and affects the snow melt process and sublimation by influencing microclimates [28,29]. Moreover, stubble management by tillage not only affects the amount of residue left on the soil surface for snow trapping and the roughness of soil surface for depression storage over the short term, but also affects soil organic matter content and structural stability and eventually soil water infiltration capacity over the long term [30]. Consequently, crop residue management affects both the availability of melt water and antecedent soil moisture conditions for runoff. Given the hydrological processes that growing crops and crop residues are involved in, crop management during the growing season and crop residue management during the non-growing season both have a potential to impact runoff. Potentially, the impacts are affected by management practices that influence the type, quantity and coverage of growing crops and crop residues.
3. Impacts of Crop Type and Biomass on Crop Water Use (Evapotranspiration)
Farmers choose crops based on agronomic and economic considerations, with very rare considerations of environmental impacts, such as runoff and nutrient transport. In the Canadian Prairies, crop production is widely limited by soil moisture, and thus agronomic water research has been largely focused on understanding crop water demand and crop water use. Crop water demand is the amount of water that a particular crop can use given an unlimited supply of water, which is the potential of water use based on the crop type, climate and soil conditions. Crop water use is the actual amount of water used by a crop for growth and cooling. It is alternatively called evapotranspiration, and is usually estimated as the difference between soil moisture at seeding and soil moisture at harvest, plus precipitation during the growing season [8,11]. Thus, it is a lumped estimation of interception, transpiration and evaporation.
Previous agronomy research in the Canadian Prairies showed that both crop water demand and crop water use varied widely by region and year, as a result of climate variability [8,10,11,12,14,15,31]. Even so, certain crops tend to use more water than others (Table 1). In southwestern Manitoba, for example, Martel et al. [15] observed that crop water use followed: soybean (Glycine max L., 400 mm) > fall rye (Avena sativa L., 370 mm) > canola (350 mm) = spring wheat (350 mm) > proso millet (Panicum miliaceum L., 240 mm). In west-central Saskatchewan, crop water use was estimated as 450 mm for alfalfa (Medicago sativa L.), 400 mm for canola, 350 mm for wheat and fall rye, and 300 mm for barley (Hordeum vulgare L.) [32]. The differing amounts of water use by different crop types have important implications on runoff, as they affect water balance in the soil. It is anticipated that the more water a crop uses, the less water contributes to runoff. Moreover, crop water use also affects antecedent soil moisture conditions for runoff events: drier soils lead to lower likelihood of runoff generation [27]. Currently, however, there is a general lack of research data that directly relates the agronomic crop water use to runoff implications.
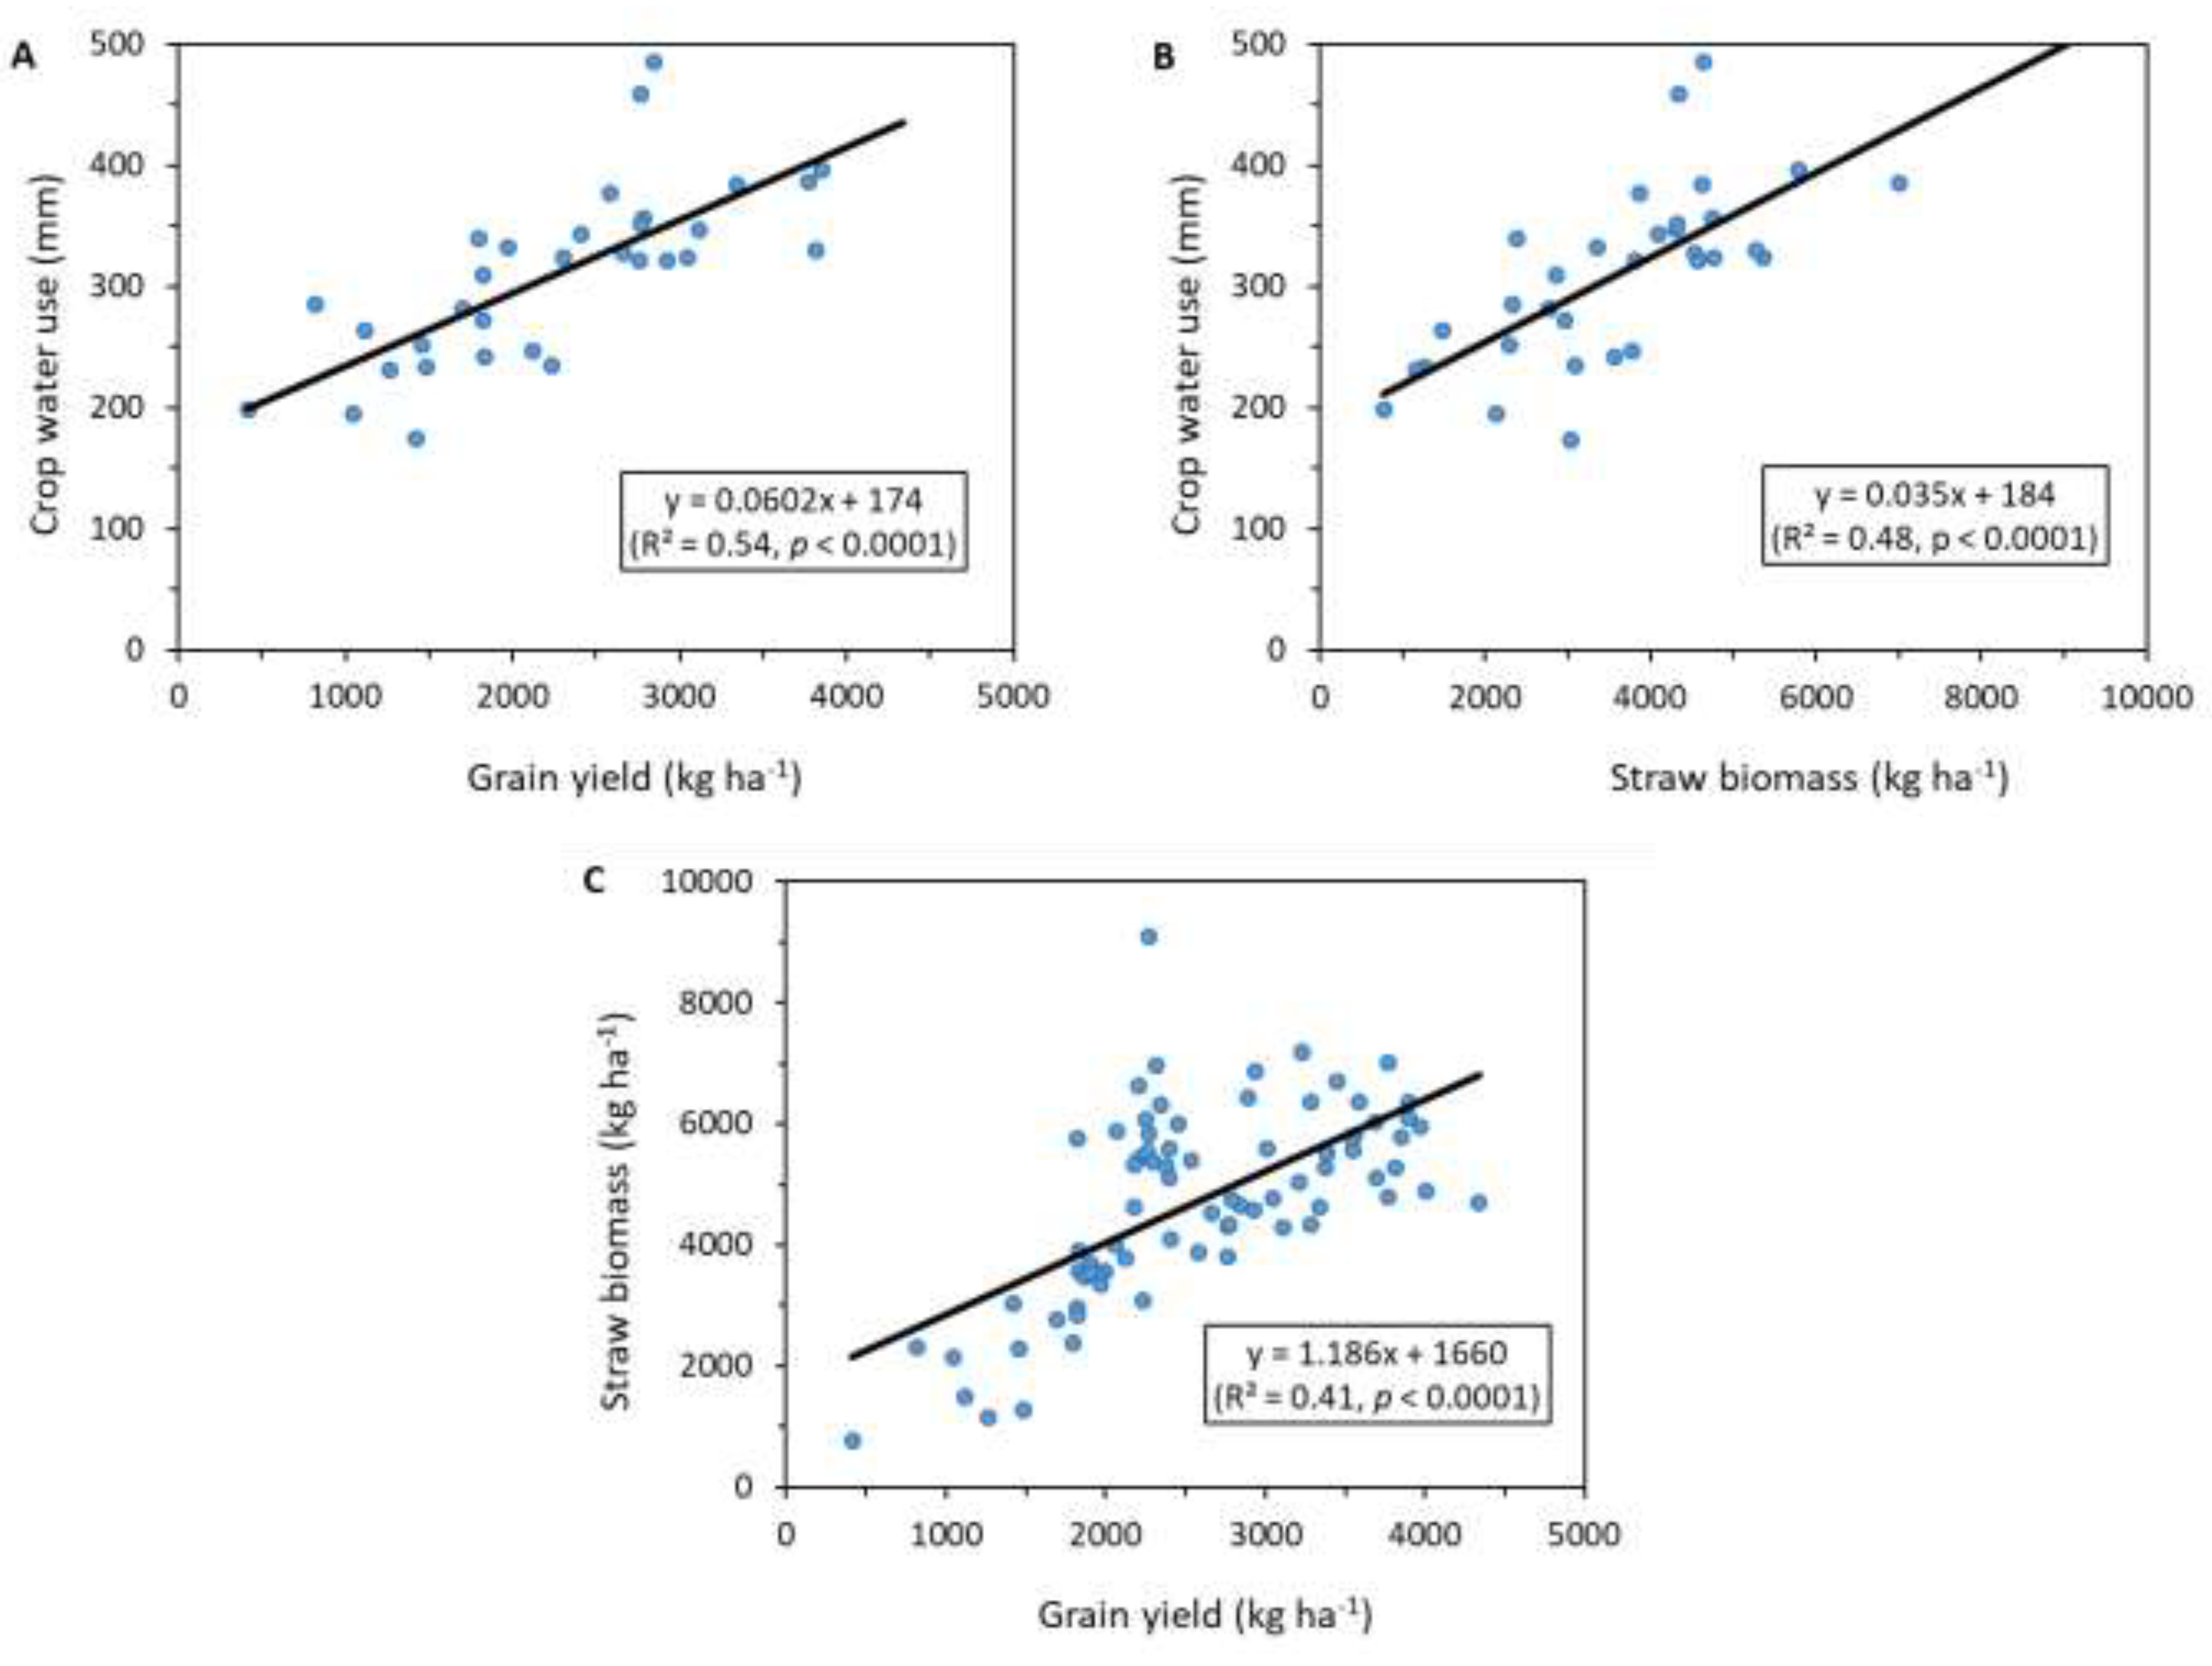
A quantitative analysis based on published data [8,11] shows that growing season crop water use of spring wheat significantly increases with increasing grain yield (Figure 2A) and increasing straw biomass (Figure 2B). This suggests that there is large potential to increase crop water use and thus reduce runoff volume by increasing crop production. As straw biomass is positively correlated to grain yield (Figure 2C), grain yield can be used as an indicator of the overall production of the above-ground biomass, and a predictor of water use by the crop. The analyses here and above suggest that runoff can be reduced by increasing crops’ use of water (including both transpiration and interception), which can be achieved by choosing appropriate crop types and/or increasing crop production.
Impacts of Crop Type and Biomass on Rain Interception
In the Canadian Prairies, rain interception by crops has not been explicitly studied as an individual hydrological component. However, studies outside the Prairies have shown that different types of crops have differing rain interception storage capacities and rain interception losses by canopy (Table 1). For example, Lull [35] reported that wheat (36%), corn (Zea mays L., 16%), and soybean (15%) had much greater rain interception loss than rye (7%). This indicates that rain interception alone may play a critical role in affecting runoff volume. Notably, the rain interception losses reported in the literature ranged widely even for the same crop used in different studies (Table 1), which is probably due to varying canopy parameters and rainfall characteristics among the studies. The quantity of crop canopy appears to be a key factor influencing rain interception, as rain interception storage capacity is found to be related to the weight of canopy [45] and the leaf area index [33]. Moreover, crop residues also have considerably high rain interception storage capacity, which, similarly to that of crop canopy, varies by type and quantity of the residue [41] (Table 1). Rain interception by vegetation was found to significantly affect hydrological effective rain, which is the portion of rain that arrives on the soil surface during a rainfall event, and affects runoff hydrology in forests [46]. Similarly, it may have a profound impact on runoff from arable land, which should be further evaluated by using the crop, soil and weather data representative of the Canadian Prairies. In addition, the impact may vary from region to region, and thus needs to be evaluated through a rigorous cross-region assessment.
4. Impacts of Crop Residue Management on Snow Trapping, Sublimation and Melt
Crop residue management affects various snow processes, including snow trapping, sublimation and melt. To address the crop production challenge associated with the low precipitation during the growing season, the Prairie farmers have developed measures to conserve snow water, using snow ridging [47], row crops or summer-fallow substitutes [48], and maintenance of stubble [49]. Maintaining higher and/or more crop stubble has been found to be more effective in trapping snow than shorter and/or less stubble (Table 2). Several studies have shown greater amounts of snow trapping in the presence of a perennial crops or crop stubble than in summer fallow [6,7,16]. For example, a 15-year field study in Saskatchewan showed that standing wheat stubble on average conserved almost 60 mm water over fall and winter as compared to only 10 mm conserved by bare soil/land fallow [6]. Moreover, another 10-year study from Saskatchewan showed that tall wheat stubble trapped on average about 70 mm snow water equivalent as compared to 40 mm by short stubble [9].
Crop residue management is often associated with tillage operations, which have varying impacts on snow trapping. In both Manitoba and Saskatchewan, conservation tillage and zero-till (direct-seeding or no-till), which maintained substantially more crop residues on the soil surface, were found to trap more snow than conventional tillage that incorporated most of the residues into the soil [17,19]. In Alberta, confounding findings were reported. While Maule and Chanasyk [7] found that zero-till and chisel plows trapped significantly more snow than disc plows, Puurveen et al. [16] reported even a greater amount of snow trapping by conventional tillage than conservation tillage. The trend in Puurveen et al. [16] may be due to the fact that conventional tillage can increase the roughness of soil surface and somewhat help to trap snow. The greater amounts of snow trapped due to higher and/or more crop stubble remaining on the soil surface or increasing surface roughness can increase snowmelt runoff in spring.
In addition to affecting snow trapping, residue management also influences snow transport and sublimation losses (Table 3), by influencing microclimates. Compared to bare soil, standing stubble decreases wind speed near the soil surface [12], delays the initiation of blowing snow, and decreases sublimation losses and the transport of snow [28]. Moreover, stubble expedites snowmelt by intercepting and absorbing more solar radiation than snow, by conducting heat and by reflecting energy to the snowpack [50,51]. Both snow and crop residue have high albedos and they have insolation capacity, which can slow the warming and drying of the soil and indirectly increase soil moisture content. All these effects indicate that the presence of stubble expedites snowmelt generation as compared to bare soil. However, one exception may exist in stubble burning, which removes crop residues and leaves black ash on the soil surface. After stubble burning, the soil has very low albedo, which potentially increases the interception and absorption of solar radiation and expedites the generation of snowmelt. Stubble is often burned as a crop residue management practice in the Red River Valley of Manitoba [52], however, research is lacking to assess its impacts on the water cycle and runoff.
5. Impacts of Crop and Residue Management on Water Infiltration
Crop and residue management affect water infiltration, which is a key driver of surface runoff. By intercepting rainfall and reducing raindrop impact, crop and crop residue reduce soil crust formation [55]. Also, roots enhance water infiltration by creating macropores and stabilizing soil aggregates [56]. Moreover, the amount of crop residue that is returned to the soil affects soil organic matter content, soil structure and infiltration over the long term [57]. Quantities of roots and crop residue, and their consequent effects on the soil increase with increasing crop yield. Given that different types of crops have different rain interception capacities, rooting systems and quantities of residues, they are expected to affect infiltration by varying extents. Gray et al. [58] reported that infiltration rate followed: good pasture > small grains > poor pasture > row crop > bare soil. However, Pikul et al. [59] found greater infiltration rates in fallow than in lentils, which indicates that crop impact on water infiltration is also affected by factors other than the crop itself, including soil and rainfall characteristics.
Tillage affects water infiltration by influencing soil surface roughness, soil bulk density and porosity in the short term, and organic matter content and aggregate stability in the long term. Studies have found that long-term conservation tillage or zero-till helps increase soil organic matter content, improve soil structure and aggregate stability, developing stable and continuous pores and thus increasing water infiltration [60,61,62]. In the short term, however, zero-tillage may have undesirable effects on infiltration. Singh et al. [63] found that zero-tillage increased bulk density and penetration resistance in both a Black Chernozem and a Gray Luvisol in Alberta as compared to tillage, and that zero-tillage reduced the infiltration rate in the Black Chernozem (not in the Gray Luvisol). In contrast, tillage creates increased soil surface roughness that increases water detention and infiltration.
6. Impacts of Crop and Residue Management on Runoff
Given the aforementioned crop and residue effects on rain interception, transpiration, evaporation, snow trapping and water infiltration, using a particular crop or crop rotation method over others is expected to have a different impact on runoff. Table 4 summarizes a collection of published work that has evaluated the impacts of crop and residue management on runoff in the Canadian Prairies. Indeed, the findings show varying impacts by different crops and management practices.
For rainfall runoff, a forage crop was shown to reduce runoff as compared to fallow or an annual crop in most cases [2,20,21]. In few cases, forage had similar runoff volume to an annual crop [20]. The reduction in runoff by forage is likely associated with its denser coverage on the soil surface and longer growing season than other crops, which increases rain interception and transpiration. Although summer fallow is widely believed to increase rainfall runoff as compared to annual crops, comparisons between summer fallow and other crops have shown inconsistent patterns. Fallow was found to generate more runoff than barley in Alberta [20], but it had lower runoff volume than wheat and corn in most of the site-years evaluated in Manitoba [21]. The different patterns may be due to differing weather conditions and soil properties of the studies, which need to be further evaluated. With regard to crop types, corn appeared to consistently generate more runoff than wheat [21]. Native grass and Russian wild rye were found to reduce runoff by more than 50% as compared to wheat and crested wheatgrass [64]. In addition to crop type, other management practices can also affect runoff. Growing barley in rows perpendicular to a slope was found to reduce runoff more than the rows parallel to the slope [20]. Light grazing, which keeps more crop biomass in the field, reduced runoff as compared to heavy grazing [22]. Overall, the findings point to the importance of maintaining crop biomass to reduce rainfall runoff.
For snowmelt runoff, on the contrary, perennial forages generally increase runoff volume as compared to annual crops [16,18], as their denser coverage on the soil surface and prolonged growing season help trap more snow over winter. Moreover, conservation tillage and zero-till were found to significantly increase snowmelt runoff and conventional tillage [17,19]. Similarly, light grazing increased snowmelt runoff more than heavy grazing [22].
Challenges remain when crop type and management practices are considered at a year-round level. While a greater crop cover, larger biomass, or longer growing season is preferred for increasing crop productivity and reducing rainfall runoff, it can increase unfavorable snowmelt runoff. A similar situation exists for conservation tillage and zero-till, which are beneficial for improving soil health and meeting crop water demands, but increase snowmelt runoff. In practice, it should be noted that the extent of land cover by crop residues can differ greatly among crops, even with the same tillage method. For instance, a chisel plow (twisted points) in corn and small grain fields often leaves 50–70% of residue coverage on the soil surface but only 30–40% in soybean fields [65]. The different residue coverage will have varying influences on rain interception, snow trapping, and runoff. Due to the differences in crop water use and land coverage, crop rotations (e.g., typical corn-soybean versus wheat-canola) can have very different implications on total runoff. Under zero-till, theoretically, a corn-soybean rotation in place of wheat-canola may increase both rainfall and snowmelt runoff, given a smaller soil coverage of corn during the growing season but a greater residue quantity for trapping snow during the non-growing season. Such impacts need to be assessed and verified through more field research.
Within a crop field, topographic and soil variability results in variability in crop growth and yield (Table 5), as well as crop residue production [66]. In hummocky moraine areas of central Saskatchewan, for example, Moulin et al. [67] found that wheat yield ranged 500–4300 kg ha−1 at different positions of a cultivated transect. In another glacial till landscape, Walley et al. [68] found that average spring wheat yield ranged from 1900 kg ha−1 in upper slope positions to 3200 kg ha−1 in lower slope positions. At upper slope positions, the soil is often drier and more eroded, and has lower fertility than that at lower positions. In dry years, when soil moisture critically determines crop growth, upper slope positions commonly have lower crop yield than lower positions do [69]. In wet years, nevertheless, the trend may become the opposite because waterlogging can reduce crop yield in depressional areas [69]. Moreover, crop variability within landscapes can result from soil conditions that affect crop growth, such as pH, salinity, compaction, management, and other factors such as pests [70]. It should be noted that soil erosion is a major cause of the observed variability in soil and crop properties within fields at this scale [66]. The crop variability within fields and watersheds can play a critical role in influencing soil hydrology, nutrient uptake, and water and nutrient losses at different landscape locations, which require a place-based management approach for soil and water conservation. However, research related to examining the hydrological and environmental effects of such variability and addressing place-based management is generally lacking in the literature.
7. Implications in Changing Management, Crop Productivity and Climate
Although it has not been well assessed, crop impacts on runoff have likely changed over time, as a result of changing crop production system and climate. Indeed, crop production in the Canadian Prairies has experienced dramatic changes in management and productivity during the last several decades. When Manitoba, Saskatchewan and Alberta are considered together, the percentage of seeded cropland that was managed as conservation tillage or zero-till increased from 0% in 1971 to 87% in 2016 (Table 6).
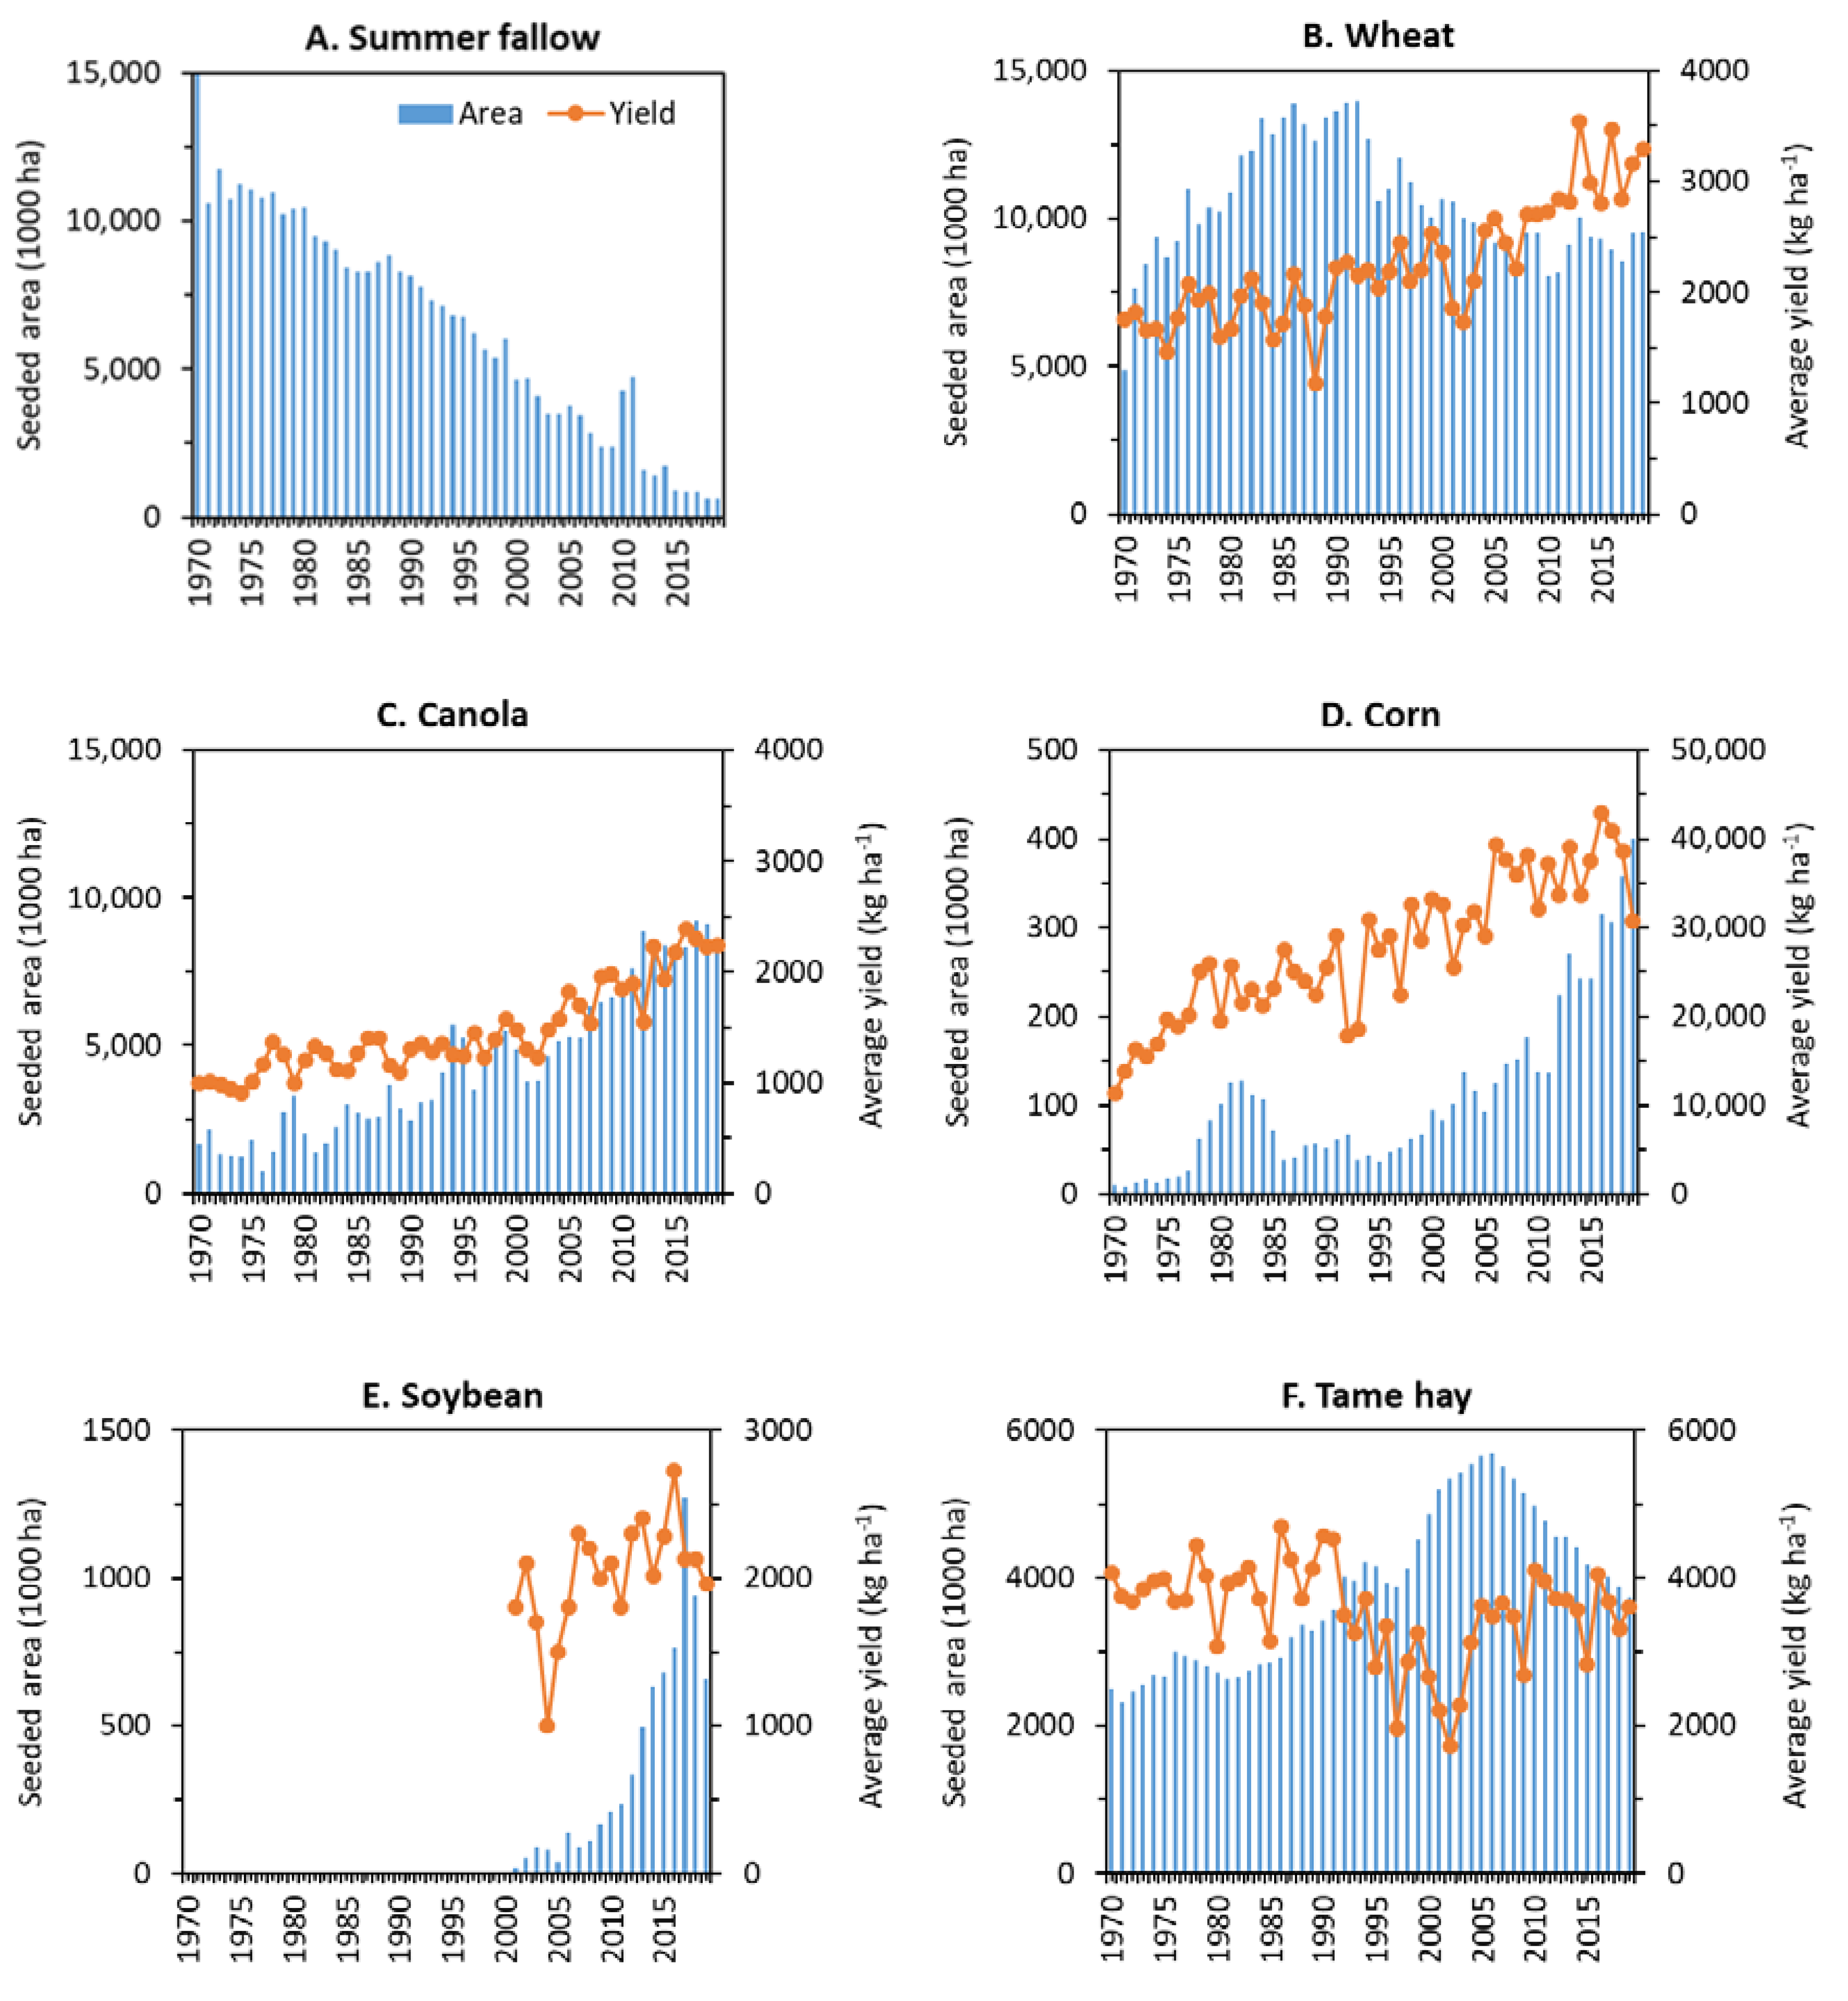
Land area for summer fallow decreased sharply from about 15 million ha in 1970 to 0.6 million ha in 2019 (Figure 3A), while wheat seeding area peaked around 1990 (Figure 3B), and seeding areas of canola (Figure 3C), corn (Figure 3D) and soybean (Figure 3E) dramatically increased from 1970s to 2010s. During the same time span, notably, yields of wheat (Figure 3B), canola (Figure 3C) and corn silage (Figure 3D) about doubled. Moreover, there is a tendency of increasing land area for pulse crops (e.g., lentils and dry peas; Table A2), and increasing land area for corn–soybean rotation in place of traditional cereal-canola rotation in certain areas, such as the Red River Valley in southern Manitoba. The trend of tame hay production was different from that of grain crops. While the seeding area of tame hay peaked around 2005, its yield was generally stable during 1970–1991, decreased during 1992–2002, and increased during 2003–2019 (Figure 3F).
All the changes are expected to have affected runoff at the field, watershed and regional scales over the long term, providing the profound impacts of tillage, land cover, crop and residue type, and biomass on snow trapping, rain interception, evaporation, transpiration, and water infiltration as discussed in the sections above. There is a growing interest among Prairie farmers in using cover crops to improve soil health, which was considered unfeasible in the past due to their poor establishment in the cold climate and consumption of soil water that was limited for the main crop. This change would need to be considered in the context of similar changes resulting from increasing land cover and crop yields.
The impacts of changing management and crop productivity on runoff might have also been complicated by a changing climate. In southwest Saskatchewan, Coles et al. [74] observed a 51% increase in annual rainfall, an 18% decrease in annual snowfall, an increasing number of multi-day rain events, and increasing rain volume during the events from 1962 to 2013. During the same time period, snowmelt runoff decreased but rainfall runoff had no significant response [74]. There is a need to better evaluate historical changes in crop production, climate and runoff to make predictions for future climates and cropping systems.
8. Concluding Remarks
Through the analysis of published studies that have documented the impacts of crop and crop residue management on rain interception, evaporation, transpiration, snow trapping, water infiltration and runoff, this review demonstrates that crop and residue management have high potential to affect the hydrological cycle and runoff. The effects are influenced by farmers’ selection of crop types and tillage method over the short- term, by regional trends of changing climate and cropping systems over the long term, and by factors affecting crop variability within landscapes such as topographic and soil variability. Rainfall runoff can potentially be reduced by using crops that intercept and use more water, which can be achieved by choosing appropriate crop types, increasing above-ground biomass, or increasing coverage on the soil surface. The potential reduction of rainfall runoff coincides with farmers’ efforts to increase crop productivity. However, it should be noted that although high stubble and reduced tillage for maintaining good residue cover have agronomic benefits in helping conserve soil moisture and improve soil health, they increase the potential of snowmelt runoff. As snowmelt runoff often constitutes 80% of annual runoff and has important water quality implications in the Canadian Prairies [2], the agronomic and environmental trade-offs of crop residue management should be further evaluated. The review shows that there are still considerable knowledge gaps with regards to the linkage between crop water use and runoff, and the impacts of crop and residue manage on runoff across various temporal and spatial scales. The gaps should be further explored with field research and/or modelling exercises.
Author Contributions
Conceptualization, J.L. and D.A.L.; investigation, J.L.; writing—original draft preparation, J.L.; writing—review and editing, D.A.L.; funding acquisition, D.A.L. All authors have read and agreed to the published version of the manuscript.
Funding
This research was funded by Environment and Climate Change Canada’s Lake Winnipeg Basin Program (ECCC-LWBP).
Institutional Review Board Statement
Not applicable.
Informed Consent Statement
Not applicable.
Data Availability Statement
The data presented in the paper are sourced from published studies in literature.
Acknowledgments
We thank Paul Bullock (U. Manitoba), Brian Amiro (U. Manitoba), Phillip Harder (U. Saskatchewan), Helen Baulch (U. Saskatchewan), Jane Elliott (ECCC), Dale Tomasiewicz (AAFC) and Henry Wilson (AAFC) for providing relevant references and/or sharing insights for some of the discussions.
Conflicts of Interest
The authors declare no conflict of interest.
Appendix A

Table A1.
Summary of papers reviewed for different topics.
| Topics Reviewed | References |
|---|---|
| Impacts of crop type and biomass on crop water use (evapotranspiration) | Entz and Fowler [8], Gan [10], Zentner et al. [11], Cutforth et al. [12], Cardillo [14], Martel et al. [15], Nadler [31], ICDC [32] |
| Impacts of crop type and biomass on rain interception | Von Hoyningen-Huene [33], Horton [37], Kontorshchikov and Eremina [34], Lull [35], Baver [36], Drastig et al. [38], Merriam [39], Musgrave and Norton [40], Savabi and Stott [41], Couturier and Ripley [45] |
| Relationship between crop straw biomass and grain yield | Entz and Fowler [8], Zentner et al. [11], Germida and Walley [42], Wiebe et al. [43], Kubota et al. [44] |
| Impacts of crop residue management on snow trapping, sublimation and melt | Kirkland and Keys [6], Maule and Chanasyk [7], Campbell et al. [9], Cutforth et al. [12], Cade-Menun et al. [13], Puurveen et al. [16], Tiessen et al. [17], Schneider et al. [19], Pomeroy et al. [28,54], Harder et al. [29], Matthews [47], Champlin [48], Johnson [49], Willis et al. [50], Nicholaichuk and Gray [51], Pomeroy and Gray [53] |
| Impacts of crop and residue management on water infiltration | Zhang et al. [30], Burk et al. [55], Morin and Kosovsky [56], Boyle et al. [57], Gray et al. [58], Pikul et al. [59], Arshad et al. [60], Carter [61], Bedard-Haughn [62], Singh and Malhi [63] |
| Impacts of crop and residue management on runoff | Liu et al. [2,3,18], Puurveen et al. [16], Tiessen et al. [17], Schneider et al. [19], Beke et al. [20], Hargrave [21], Gill et al. [22], Burk et al. [55], Murphy et al. [64] |
| Impacts of landscape variability, and crop growth and yield | Lobb [66], Moulin et al. [67], Walley et al. [68], Chi et al. [69], Aspinall [70] |
Table A2.
Summary of seeded area and average yield for major field crops in Manitoba, Saskatchewan and Alberta from 1970 to 2019 (based on Statistics Canada [5]). Each value is an average for a period of every ten years.
Table A2.
Summary of seeded area and average yield for major field crops in Manitoba, Saskatchewan and Alberta from 1970 to 2019 (based on Statistics Canada [5]). Each value is an average for a period of every ten years.
| Crop and Year Duration | Alberta | Saskatchewan | Manitoba | All Provinces | ||||
|---|---|---|---|---|---|---|---|---|
| Area (103 ha) | Yield (kg ha−1) | Area (103 ha) | Yield (kg ha−1) | Area (103 ha) | Yield (kg ha−1) | Area (103 ha) | Yield (kg ha−1) | |
| Wheat a | ||||||||
| 1970–1979 | 1799 | 1873 | 5990 | 1737 | 1166 | 1774 | 8955 | 1769 |
| 1980–1989 | 2905 | 2041 | 8076 | 1661 | 1820 | 1980 | 12,801 | 1793 |
| 1990–1999 | 2914 | 2510 | 7269 | 2090 | 1781 | 2350 | 11,964 | 2231 |
| 2000–2009 | 2675 | 2700 | 5597 | 2050 | 1354 | 2760 | 9626 | 2330 |
| 2010–2019 | 2837 | 3436 | 5010 | 2735 | 1210 | 3412 | 9057 | 3045 |
| Barley | ||||||||
| 1970–1979 | 2140 | 2293 | 1549 | 2173 | 727 | 2170 | 4416 | 2231 |
| 1980–1989 | 2359 | 2687 | 1456 | 2249 | 754 | 2569 | 4569 | 2528 |
| 1990–1999 | 2111 | 3140 | 1607 | 2720 | 518 | 3120 | 4236 | 2978 |
| 2000–2009 | 1900 | 3120 | 1771 | 2640 | 393 | 3260 | 4064 | 2924 |
| 2010–2019 | 1397 | 3729 | 990 | 3230 | 162 | 3559 | 2549 | 3524 |
| Oats | ||||||||
| 1970–1979 | 892 | 2101 | 824 | 1880 | 485 | 1820 | 2201 | 1956 |
| 1980–1989 | 721 | 2417 | 506 | 1852 | 245 | 2008 | 1472 | 2155 |
| 1990–1999 | 584 | 2490 | 665 | 2250 | 290 | 2550 | 1539 | 2398 |
| 2000–2009 | 513 | 2570 | 845 | 2370 | 362 | 2850 | 1720 | 2531 |
| 2010–2019 | 311 | 3235 | 598 | 3313 | 202 | 3488 | 1111 | 3323 |
| Corn b | ||||||||
| 1970–1979 | 4 | 7085 | 1 | 782 | 25 | 17,656 | 30 | 15,684 |
| 1980–1989 | 13 | 36,623 | 0 | n.a. | 70 | 16,392 | 83 | 19,561 |
| 1990–1999 | 8 | 33,916 | 0 | n.a. | 45 | 23,014 | 53 | 24,660 |
| 2000–2009 | 27 | 37,402 | 9 | 25,785 | 94 | 31,190 | 130 | 32,106 |
| 2010–2019 | 74 | 37,683 | 26 | 34,592 | 172 | 35,865 | 272 | 36,238 |
| Canola | ||||||||
| 1970–1979 | 714 | 1035 | 795 | 1079 | 253 | 1100 | 1762 | 1064 |
| 1980–1989 | 1046 | 1261 | 1019 | 1240 | 407 | 1175 | 2472 | 1238 |
| 1990–1999 | 1515 | 1360 | 1997 | 1261 | 795 | 1510 | 4307 | 1342 |
| 2000–2009 | 1652 | 1740 | 2522 | 1450 | 1055 | 1740 | 5229 | 1600 |
| 2010–2019 | 2572 | 2233 | 4469 | 1991 | 1314 | 2068 | 8355 | 2078 |
| Soybean | ||||||||
| 1970–1979 | n.a. | n.a. | n.a. | n.a. | n.a. | n.a. | n.a. | n.a. |
| 1980–1989 | n.a. | n.a. | n.a. | n.a. | n.a. | n.a. | n.a. | n.a. |
| 1990–1999 | n.a. | n.a. | n.a. | n.a. | n.a. | n.a. | n.a. | n.a. |
| 2000–2009 | n.a. | n.a. | n.a. | n.a. | 88 | 1822 | 88 | 1822 |
| 2010–2019 | 5 | 1769 | 136 | 1717 | 525 | 2265 | 666 | 2149 |
| Flax seed | ||||||||
| 1970–1979 | 91 | 992 | 276 | 911 | 303 | 790 | 670 | 867 |
| 1980–1989 | 37 | 1232 | 214 | 1026 | 339 | 1020 | 590 | 1035 |
| 1990–1999 | 29 | 1400 | 390 | 1250 | 255 | 1350 | 674 | 1294 |
| 2000–2009 | 20 | 1520 | 519 | 1170 | 142 | 1290 | 681 | 1205 |
| 2010–2019 | 36 | 1892 | 348 | 1415 | 44 | 1494 | 428 | 1463 |
| Lentils | ||||||||
| 1970–1979 | n.a. | n.a. | n.a. | n.a. | n.a. | n.a. | n.a. | n.a. |
| 1980–1989 | 3 | 852 | 82 | 983 | 14 | 1187 | 99 | 1008 |
| 1990–1999 | 11 | 1141 | 287 | 1331 | 29 | 1291 | 327 | 1321 |
| 2000–2009 | 9 | 1063 | 674 | 1243 | 6 | 1240 | 689 | 1241 |
| 2010–2019 | 103 | 1832 | 1350 | 1549 | 1 | 897 | 1454 | 1569 |
| Dry peas | ||||||||
| 1970–1979 | 6 | 1847 | 5 | 1569 | 20 | 1592 | 31 | 1638 |
| 1980–1989 | 14 | 2387 | 55 | 1606 | 50 | 1762 | 119 | 1763 |
| 1990–1999 | 132 | 2490 | 393 | 2030 | 67 | 2040 | 592 | 2134 |
| 2000–2009 | 260 | 2280 | 1028 | 1950 | 52 | 2450 | 1340 | 2033 |
| 2010–2019 | 552 | 2729 | 910 | 2349 | 32 | 2772 | 1494 | 2498 |
| Tame hay | ||||||||
| 1970–1979 | 1378 | 4023 | 786 | 3524 | 517 | 4231 | 2681 | 3917 |
| 1980–1989 | 1591 | 4270 | 760 | 2970 | 567 | 4011 | 2918 | 3881 |
| 1990–1999 | 2042 | 3590 | 1152 | 2708 | 784 | 3785 | 3978 | 3373 |
| 2000–2009 | 2528 | 3016 | 1902 | 2452 | 941 | 3490 | 5371 | 2899 |
| 2010–2019 | 1916 | 3997 | 1698 | 3113 | 695 | 4026 | 4309 | 3653 |
| Summer fallow | ||||||||
| 1970–1979 | 2866 | n.r. | 7352 | n.r. | 1051 | n.r. | 11,269 | n.r. |
| 1980–1989 | 2137 | n.r. | 6240 | n.r. | 532 | n.r. | 8909 | n.r. |
| 1990–1999 | 1533 | n.r. | 4887 | n.r. | 300 | n.r. | 6720 | n.r. |
| 2000–2009 | 896 | n.r. | 2439 | n.r. | 186 | n.r. | 3521 | n.r. |
| 2010–2019 | 344 | n.r. | 1214 | n.r. | 207 | n.r. | 1765 | n.r. |
a Wheat includes winter wheat, spring wheat and durum. b Corn seeding area is the sum of areas for both corn for grain and corn for silage, while only the yield of corn for silage is presented in the table. n.a.: data not available, presumably due to their relatively small numbers in most cases. n.r.: not relevant.
References
- Statistics Canada. Saskatchewan Remains the Breadbasket of Canada. Available online: https://www150.statcan.gc.ca/n1/pub/95-640-x/2016001/article/14807-eng.htm (accessed on 19 August 2020).
- Liu, J.; Elliott, J.A.; Wilson, H.F.; Macrae, M.L.; Baulch, H.M.; Lobb, D.A. Phosphorus runoff from Canadian agricultural land: A cross-region synthesis of edge-of-field results. Agric. Water Manag. 2021, 255, 107030. [Google Scholar] [CrossRef]
- Liu, J.; Elliott, J.A.; Wilson, H.F.; Macrae, M.L.; Baulch, H.M.; Lobb, D.A. Phosphorus runoff from Canadian agricultural land: A dataset for 30 experimental fields. Data Brief. 2021, 38, 107405. [Google Scholar] [CrossRef]
- Canadian Council of Ministers of the Environment. Canadian water quality guidelines for the protection of aquatic life: Phosphorus: Canadian Guidance Framework for the Management of Freshwater Systems. In Canadian Environmental Quality Guidelines; Canadian Council of Ministers of the Environment: Winnipeg, MB, Canada, 2004. [Google Scholar]
- Statistics Canada. Table 32-10-0359-01 Estimated Areas, Yield, Production, Average Farm Price and Total Farm Value of Principal Field Crops, in Metric and Imperial Units; Government of Canada: Ottawa, ON, Canada, 2020. [Google Scholar] [CrossRef]
- Kirkland, K.J.; Keys, C.H. The effect of snow trapping and cropping sequence on moisture conservation and utilization in west-central Saskatchewan. Can. J. Plant Sci. 1981, 61, 241–246. [Google Scholar] [CrossRef] [Green Version]
- Maule, C.P.; Chanasyk, D.S. The effects of tillage upon snow cover and spring soil water. Can. Agric. Eng. 1990, 32, 25–31. [Google Scholar]
- Entz, M.H.; Fowler, D.B. Agronomic performance of winter versus spring wheat. Agron. J. 1991, 83, 527–532. [Google Scholar] [CrossRef]
- Campbell, C.A.; McConkey, B.G.; Zentner, R.P.; Selles, F.; Dyck, F.B. Benefits of wheat stubble strips for conserving snow in southwestern Saskatchewan. J. Soil Water Conserv. 1992, 47, 112–115. [Google Scholar]
- Gan, Y.T.; Lafond, G.P.; May, W.E. Grain yield and water use: Relative performance of winter vs. spring cereals in east-central Saskatchewan. Can. J. Plant Sci. 2000, 80, 533–541. [Google Scholar] [CrossRef]
- Zentner, R.P.; Campbell, C.A.; Selles, F.; McConkey, B.G.; Jefferson, P.G.; Lemke, R. Cropping frequency, wheat classes and flexible rotations: Effects on production, nitrogen economy, and water use in a Brown Chernozem. Can. J. Plant Sci. 2003, 83, 667–680. [Google Scholar] [CrossRef] [Green Version]
- Cutforth, H.W.; Angadi, S.V.; McConkey, B.G. Stubble management and microclimate, yield and water use efficiency of canola grown in the semiarid Canadian prairie. Can. J. Plant Sci. 2006, 86, 99–107. [Google Scholar] [CrossRef]
- Cade-Menun, B.J.; Bell, G.; Baker-Ismail, S.; Fouli, Y.; Hodder, K.; McMartin, D.W.; Perez-Valdivia, C.; Wu, K. Nutrient loss from Saskatchewan cropland and pasture in spring snowmelt runoff. Can. J. Soil Sci. 2013, 93, 445–458. [Google Scholar] [CrossRef]
- Cardillo, M.J. Stubble Management Effects on Microclimate and Performance of Canola across Different Climatic Regions in Western Canada. Master’s Thesis, University of Manitoba, Winnipeg, MB, Canada, 2014. [Google Scholar]
- Martel, M.; Glenn, A.; Wilson, H.; Kröbel, R. Simulation of actual evapotranspiration from agricultural landscapes in the Canadian Prairies. J. Hydrol. Reg. Stud. 2018, 15, 105–118. [Google Scholar] [CrossRef]
- Puurveen, H.; Izaurralde, R.C.; Chanasyk, D.S.; Williams, J.R.; Grant, R.F. Evaluation of EPIC’s snowmelt and water erosion submodels using data from the Peace River region of Alberta. Can. J. Soil Sci. 1997, 77, 41–50. [Google Scholar] [CrossRef]
- Tiessen, K.H.D.; Elliott, J.A.; Yarotski, J.; Lobb, D.A.; Flaten, D.N.; Glozier, N.E. Conventional and conservation tillage: Influence on seasonal runoff, sediment, and nutrient losses in the Canadian prairies. J. Environ. Qual. 2010, 39, 964–980. [Google Scholar] [CrossRef] [Green Version]
- Liu, K.; Elliott, J.A.; Lobb, D.A.; Flaten, D.N.; Yarotoski, J. Nutrient and sediment losses in snowmelt runoff from perennial forage and annual cropland in the Canadian prairies. J. Environ. Qual. 2014, 43, 1644–1655. [Google Scholar] [CrossRef]
- Schneider, K.D.; McConkey, B.G.; Thiagarajan, A.; Elliott, J.A.; Reid, D.K. Nutrient loss in snowmelt runoff: Results from a long-term study in a dryland cropping system. J. Environ. Qual. 2019, 48, 831–840. [Google Scholar] [CrossRef] [Green Version]
- Beke, G.J.; Foroud, N.; Channappa, T.C.; Entz, T. Runoff and soil loss from experimental plots in southern Alberta using simulated rainfall. Can. Agric. Eng. 1990, 33, 205–210. [Google Scholar]
- Hargrave, A.P. Nitrogen and Phosphorus Losses in Surface Runoff due to Rainfall in Manitoba. Master’s Thesis, University of Manitoba, Winnipeg, MB, Canada, 1992. [Google Scholar]
- Gill, S.I.; Naeth, M.A.; Chanasyk, D.S.; Baron, V.S. Runoff and sediment yield from snowmelt and rainfall as influenced by forage type and grazing intensity. Can. J. Soil Sci. 1998, 78, 699–706. [Google Scholar] [CrossRef]
- Amatya, D.M.; Irmak, S.; Gowda, P.; Sun, G.; Nettles, J.E.; Douglas-Mankin, K.R. Ecosystem evapotranspiration: Challenges in measurements, estimates, and modeling. Trans. ASABE 2016, 59, 555–560. [Google Scholar] [CrossRef]
- Gavazzi, M.G.; Sun, G.; McNulty, S.G.; Treasure, E.A.; Wightman, M.G. Canopy rainfall interception measured over ten years in a coastal plain loblolly pine (Pinus taeda L.) plantation. Trans. ASABE 2016, 59, 601–610. [Google Scholar] [CrossRef]
- Guzha, A.C. Effects of tillage on soil microrelief, surface depression storage and soil water storage. Soil Till. Res. 2014, 76, 105–114. [Google Scholar] [CrossRef]
- Liu, Y.; Cui, Z.; Huang, Z.; Lopez-Vicente, M.; Wu, G. Influence of soil moisture and plant roots on the soil infiltration capacity at different stages in arid grasslands of China. Catena 2019, 182, 104147. [Google Scholar] [CrossRef]
- Macrae, M.L.; English, M.C.; Schiff, S.L.; Stone, M. Influence of antecedent hydrologic conditions on patterns of hydrochemical export from a first-order agricultural watershed in Southern Ontario, Canada. J. Hydrol. 2010, 389, 101–110. [Google Scholar] [CrossRef]
- Pomeroy, J.W.; Gray, D.M.; Landine, P.G. Modelling the Transport and Sublimation of Blowing Snow on the Prairies. In Proceedings of the Eastern Snow Conference, Guelph, ON, Canada, 5–7 July 1991; pp. 175–188. [Google Scholar]
- Harder, P.; Pomeroy, J.W.; Helgason, W.D. Implications of stubble management on snow hydrology and meltwater partitioning. Can. Water Res. J. 2019, 44, 193–204. [Google Scholar] [CrossRef]
- Zhang, G.S.; Chan, K.Y.; Oates, A.; Heenan, D.P.; Huang, G.B. Relationship between soil structure and runoff/soil loss after 24 years of conservation tillage. Soil Till. Res. 2007, 92, 122–128. [Google Scholar] [CrossRef]
- Nadler, A.J. An Agroclimatic Risk Assessment of Crop Production on the Canadian Prairies. Master’s Thesis, University of Manitoba, Winnipeg, MB, Canada, 2007. [Google Scholar]
- Irrigation Crop Diversification Corporation (ICDC). Irrigation Economics and Agronomics. Available online: https://irrigationsaskatchewan.com/icdc/publications/c-irrigation-economics-agronomics/ (accessed on 5 July 2020).
- Von Hoyningen-Huene, J. Die Interzeption Des Niederschlags in Landwirtschaftlichen Pflanzenbestanden; Deutscher Verband fur Wasserwirtschaft und Kulturbau (DVWK): Braunschwig, Germany, 1981; p. 73. [Google Scholar]
- Kontorshchikov, A.S.; Eremina, K.A. Interception of precipitation by spring wheat during the growing season. Sov. Hydrol. 1963, 2, 400–409. [Google Scholar]
- Lull, H.W. Ecological and silvicultural aspects. In Handbook of Applied Hydrology; Chow, V.T., Ed.; McGraw-Hill: New York, NY, USA, 1964; pp. 6.01–6.30. [Google Scholar]
- Baver, L.D. Ewald Wollny𠄴A pioneer in soil and water conservation research. Soil Sci. Soc. Proc. 1938, 3, 330–333. [Google Scholar] [CrossRef]
- Horton, R.E. Rainfall interception. Mon. Weather Rev. 1919, 47, 603–623. [Google Scholar] [CrossRef]
- Drastig, K.; Quinones, T.S.; Zare, M.; Dammer, K.H.; Prochnow, A. Rainfall interception by winter rapeseed in Brandenburg (Germany) under various nitrogen fertilization treatments. Agric. For. Meteorol. 2019, 268, 308–317. [Google Scholar] [CrossRef]
- Merriam, R.A. Surface water storage on annual ryegrass. J. Geophys. Res. 1961, 66, 1833–1838. [Google Scholar] [CrossRef]
- Musgrave, G.W.; Norton, R.A. Soil and water conservation in investigation (progress report). U.S. Dept. Agr. Tech. Bul. 1937, 558, 54–56. [Google Scholar]
- Savabi, M.R.; Stott, D.E. Plant residue impact on rainfall interception. Trans. ASAE 1994, 37, 1093–1098. [Google Scholar] [CrossRef]
- Germida, J.J.; Walley, F.L. Plant growth-promoting rhizobacteria alter rooting patterns and arbuscular mycorrhizal fungi colonization of field-grown spring wheat. Biol. Fertil. Soils 1996, 23, 113–120. [Google Scholar] [CrossRef]
- Wiebe, L.; Fox, S.L.; Entz, M.H. Organic selection may improve yield efficiency in spring wheat: A preliminary analysis. Can. J. Plant Sci. 2017, 97, 298–307. [Google Scholar] [CrossRef]
- Kubota, H.; Iqbal, M.; Dyck, M.; Quideau, S.; Yang, R.C.; Spaner, D. Investigating genetic progess and variation for nitrogen use efficiency in spring wheat. Crop Sci. 2018, 58, 1542–1557. [Google Scholar] [CrossRef]
- Couturier, D.E.; Ripley, E.A. Rainfall interception in mixed grass prairie. Can. J. Plant Sci. 1973, 53, 659–663. [Google Scholar] [CrossRef]
- Reid, L.M.; Lewis, J. Rates, timing, and mechanisms of rainfall interception loss in a coastal redwood forest. J. Hydrol. 2009, 375, 459–470. [Google Scholar] [CrossRef]
- Matthews, G.D. Canada Dep. Agric. Publ. 696: Snow Utilization in Prairie Agriculture; Canada Department of Agriculture: Ottawa, ON, Canada, 1940; p. 23. [Google Scholar]
- Champlin, M.J. University of Saskatchewan Agricultural Extension Bulletin 129: A Quarter Century of Crop Rotation Experiments; University of Saskatchewan: Saskatoon, SK, Canada, 1951. [Google Scholar]
- Johnson, W.E. The Integration of Crop Production Practices in Western Canada; Saskatchewan Department of Agriculture: Regina, SK, Canada, 1977; p. 49. [Google Scholar]
- Willis, W.O.; Haas, H.J.; Carlson, C.W. Snowpack Runoff as Affected by Stubble Height. Soil Sci. 1969, 107, 256–259. [Google Scholar] [CrossRef]
- Nicholaichuk, W.; Gray, D.M. Snow Trapping and Moisture Infiltration Enhancement. In Proceedings of the Fifth Annual Western Provinces Conference, Saskatoon, SK, Canada, 18–20 November 1986. [Google Scholar]
- Lobb, D.; Erb, M. Straw and Stubble Burning and Residue Management Alternatives in the Red River Valley; Report for Manitoba Agriculture, Food and Rural Initiatives: Winnipeg, MB, Canada, 2009; p. 26. [Google Scholar]
- Pomeroy, J.W.; Gray, D.M. National Hydrology Research Institute Science Report No. 7: Snow Accumulation, Relocation and Management; Environment Canada: Saskatoon, SK, Canada, 1995; p. 144. [Google Scholar]
- Pomeroy, J.W.; de Boer, D.; Martz, L.W. Centre for Hydrology Report No. 1: Hydrology and Water Resources of Saskatchewan; University of Saskatchewan: Saskatoon, SK, Canada, 2005; p. 25. [Google Scholar]
- Burk, A.R.; Chanasyk, D.S.; Mapfumo, E. Influences of land disturbance and management regime on infiltration and runoff. Can. Agric. Eng. 1999, 41, 127–134. [Google Scholar]
- Morin, J.; Kosovsky, A. The surface infiltration model. J. Soil Water Conserv. 1995, 50, 470–476. [Google Scholar]
- Boyle, M.; Frankenberger, W.T., Jr.; Stolzy, L.H. The influence of organic matter on soil aggregation and water infiltration. J. Prod. Agr. 1989, 2, 290–299. [Google Scholar] [CrossRef]
- Gray, D.M.; Norum, D.I.; Wigham, J.M. Infiltration and the Physics of Flow of Water through Porous Media. In Handbook on the Principles of Hydrology; Gray, D.M., Ed.; Water Information Center, Inc.: New York, NY, USA, 1970; pp. 5.01–5.58. [Google Scholar]
- Pikul, J.L., Jr.; Schwartz, R.C.; Benjamin, J.G.; Baumhardt, R.L.; Merrill, S. Cropping system influences on soil physical properties in the Great Plains. Renew. Agric. Food Syst. 2006, 21, 15–25. [Google Scholar] [CrossRef]
- Arshad, M.A.; Schnitzer, M.; Angers, D.A.; Ripmeester, J.R. Effects of till vs. no till on the quality of soil organic matter. Soil Biol. Biochem. 1990, 22, 595–599. [Google Scholar] [CrossRef]
- Carter, M.R. Characterizing the soil physical conditions in reduced tillage systems for winter wheat on a fine sandy loam using small cores. Can. J. Soil Sci. 1992, 72, 395–402. [Google Scholar] [CrossRef]
- Bedard-Haughn, A. Managing excess water in Canadian prairie soils: A review. Can. J. Soil Sci. 2009, 89, 157–168. [Google Scholar] [CrossRef]
- Singh, B.; Malhi, S.S. Response of soil physical properties to tillage and residue management on two soils in a cool temperate environment. Soil Till Res. 2006, 85, 143–153. [Google Scholar] [CrossRef]
- Murphy, S.R.; Larney, F.J.; Willms, W.D.; DeMaere, P.R.; Harden, S. Surface runoff response of native and introduced grasses under simulated rainfall in southern Alberta. Can. J. Soil Sci. 2008, 88, 337–348. [Google Scholar] [CrossRef]
- Reetz, H.F., Jr. Crop residue management raises soil fertility questions. Better Crop 1993, Spring, 8–12. [Google Scholar]
- Lobb, D.A. Understanding and managing the causes of soil variability. J. Soil Water Conserv. 2011, 66, 175A–179A. [Google Scholar] [CrossRef] [Green Version]
- Moulin, A.P.; Anderson, D.W.; Mellinger, M. Spatial variability of wheat yield, soil properties and erosion in hummocky terrain. Can. J. Soil Sci. 1994, 74, 219–228. [Google Scholar] [CrossRef]
- Walley, F.; Pennock, D.; Solohub, M.; Hnatowich, G. Spring wheat (Triticum aestivum) yield and grain protein responses to N fertilizer in topographically defined landscape positions. Can. J. Soil Sci. 2001, 81, 505–514. [Google Scholar] [CrossRef]
- Chi, B.; Si, B.; Walley, F.; Yates, T. Topographic indices and yield variability in a rolling landscape of western Canada. Pedosphere 2009, 19, 362–370. [Google Scholar] [CrossRef]
- Aspinall, J.D. The Ontario Site Specific Cropping Management Project. In Precision Farming: Challenges and Opportunities for Atlantic Canada; Lobb, D.A., Ed.; Eastern Canada Soil and Water Conservation Centre: Grand Falls, NB, Canada, 1997; pp. 5–8. [Google Scholar]
- Lobb, D.A.; Huffman, E.C.; Reicosky, D.C. Importance of information on tillage practices in the modeling of environmental processes and in the use of environmental indicators. J. Environ. Manag. 2007, 82, 377–387. [Google Scholar] [CrossRef] [PubMed]
- Statistics Canada. Section 5—Techniques and Technology, Canada and Provinces: Census Years 1991 to 2006. Available online: https://www150.statcan.gc.ca/n1/pub/95-632-x/2007000/t/4129758-eng.htm#46 (accessed on 19 August 2020).
- Statistics Canada. Table 32-10-0408-01 Tillage Practices Used to Prepare Land for Seeding; Government of Canada: Ottawa, ON, Canada, 2021. [Google Scholar] [CrossRef]
- Coles, A.E.; McConkey, B.G.; McDonnell, J.J. Climate change impacts on hillslope runoff on the northern Great Plains, 1962–2013. J. Hydrol. 2017, 550, 538–548. [Google Scholar] [CrossRef]
Figure 1.
A diagram of the water cycle and how management of growing crops and crop residues affects runoff in the Canadian Prairies, where both snowfall and rainfall derive runoff, and surface runoff overwhelms subsurface runoff. In field research, interception, transpiration and evaporation are often measured together and simply defined as evapotranspiration.

Figure 2.
Relationships between growing season crop water use and grain yield (A, n = 32), between growing season crop water use and straw biomass (B, n = 32), and between crop straw biomass and grain yield (C, n = 78), all for spring wheat. The data were obtained from published work in the Canadian Prairies: [8,11] for (A,B), and [8,11,42,43,44] for (C). Each data point represents a site-year field experiment.

Figure 3.
Total seeded area and average yield for major field crops in the Canadian Prairie provinces of Manitoba, Saskatchewan and Alberta from 1970 to 2019 (data source: Statistics Canada [5]). Wheat includes winter wheat, spring wheat and durum. Corn seeding area is the sum of areas for both corn grain and corn silage, while only the yield of corn silage is presented in the figure.

Table 1.
Summary of rain interception storage capacity, rain interception loss, and evapotranspiration by different types of crop canopy and residue.
Table 1.
Summary of rain interception storage capacity, rain interception loss, and evapotranspiration by different types of crop canopy and residue.
| Category | Crop Water Demand (mm) | Actual Evapo-Transpiration (mm) | Rain Interception Storage Capacity (mm) | Rain Interception Loss (%) |
|---|---|---|---|---|
| Crop canopy | ||||
| Spring wheat (Triticum aestivum L.) | 275–325 [31] | 174–485 [8,11,15] | 2.1 [33] | 10–36 [34,35] |
| Barley (Hordeum vulgare L.) | n.a. | 250–350 [32] | 1.9 [33] | n.a. |
| Oat (Avena sativa L.) | n.a. | n.a. | 3.0 [33] | 7–58 [34,35,36] |
| Fall rye (Secale cereal L.) | n.a. | 140–370 [10] | 1.2 [37] | 4–6 [34] |
| Corn (Zea mays L.) | 375–450 [31] | 300–400 [32] | 3.2 [33] 1 | 16–22 [35,36] |
| Canola (Brassica napus L.) | n.a. | 260–450 [12,14] | n.a. | 56 [38] |
| Soybean (Glycine max L.) | n.a. | 400 [15] | n.a. | 15–35 [35,36] |
| Annual ryegrass (Lolium multiflorum L.) | n.a. | n.a. | 2.8 [39] | n.a. |
| Alfalfa (Medicago sativa L.) | 400–450 [31] | 400–500 [32] | n.a. | n.a. |
| Clover (Trifolium spp. L.) | n.a. | n.a. | 3.1 [40] | n.a. |
| Crop residue | ||||
| Wheat (Triticum aestivum L.) | n.a. | n.a. | 1.1–2.4 [41] † | n.a. |
| Corn (Zea mays L.) | n.a. | n.a. | 0.7–1.7 [41] † | n.a. |
| Soybean (Glycine max L.) | n.a. | n.a. | 0.7–1.8 [41] † | n.a. |
1 Average for multiple plant densities; † Each value is an average of two rainfall intensities, and the range is for 2–6 Mg residue ha−1. n.a.: value not available or not applicable.
Table 2.
Snow trapping (snow water equivalent, mm) as affected by different types of crops and crop residue management practices.
Table 2.
Snow trapping (snow water equivalent, mm) as affected by different types of crops and crop residue management practices.
| Experimental Location | Summer Fallow | Perennial Crop | Annual Crop | ||||||
|---|---|---|---|---|---|---|---|---|---|
| Type | Conservation or Zero Tillage | Short Stubble | High Stubble | Conventional Tillage | Chisel Plow | Disc Plow | |||
| La Glace, AB [16] | 67 ‡ | 82 ‡ | Barley, canola | 79 ‡ | n.a. | n.a. | 83 ‡ | n.a. | n.a. |
| Edmonton, AB [7] | 8 # | n.a. | Barley | 23 # | n.a. | n.a. | n.a. | 24 # | 13 # |
| Scott, SK [6] | 10 ‡ | n.a. | Wheat | 59 ‡ | n.a. | n.a. | n.a. | n.a. | n.a. |
| Swift Current, SK [9] | n.a. | n.a. | Wheat | n.a. | 38 ‡ | 68 ‡ | n.a. | n.a. | n.a. |
| Swift Current, SK [19] | n.a. | n.a. | Green manure | 44 ‡ | n.a. | n.a. | 30 ‡ | n.a. | n.a. |
| Southeastern SK [13] | n.a. | 6 # | Wheat | 8 # | n.a. | n.a. | n.a. | n.a. | n.a. |
| Miami, MB [17] | n.a. | n.a. | Cereals, canola | 65 ‡ | n.a. | n.a. | 53 ‡ | n.a. | n.a. |
‡ Average of multiple years. # Average for multiple times or locations of measurements within a year. Tillage refers to the previous fall. n.a.: value not available or not applicable.
Table 3.
Snow balance in fallow and stubble fields of 1 km length in Saskatchewan (adapted from [53,54]). The components of snow balance include snowfall in snow water equivalent, and blowing snow transport loss, sublimation loss and snow accumulation as percentages of snowfall.
| Site (Winter Temperature and Wind Speed) | Land Cover | Snowfall (mm) | Transport (%) | Sublimation (%) | Accumulation (%) |
|---|---|---|---|---|---|
| Prince Albert (−11.6 °C, 4.5 m/s) | Fallow | 103 | 13 | 27 | 60 |
| Stubble | 103 | 9 | 23 | 68 | |
| Yorkton (−10.6 °C, 4.7 m/s) | Fallow | 125 | 13 | 23 | 64 |
| Stubble | 125 | 8 | 15 | 77 | |
| Regina (−8.9 °C, 6.0 m/s) | Fallow | 113 | 36 | 41 | 23 |
| Stubble | 113 | 19 | 34 | 48 | |
| Swift Current (−6.7 °C, 6.6 m/s) | Fallow | 132 | 29 | 29 | 42 |
| Stubble | 132 | 11 | 22 | 67 |
Table 4.
Rain or snow water equivalent (SWE), and runoff volume (all in mm) as affected by different crop types and residue management practices in the Canadian Prairies. Values of medians or averages (when medians are not available) are given, with ranges in parentheses. A-crop: annual crops; C-wheatgrass: crested wheatgrass; P-forage: perennial forages; R-wildrye: Russian wild rye; S-bromegrass: smooth bromegrass; F.: fallow; G.: grazing; CV-Till: conventional tillage; CS-Till: conservation tillage; ZR-till: zero tillage.
| Experimental Location and Year | Rain or SWE | Runoff Volume as Affected by Different Treatments | |||||
|---|---|---|---|---|---|---|---|
| Rainfall runoff | |||||||
| Lethbridge, AB 1985–1987 [20] a | 168 (142–194) 1 | F. 28 (13–43) 1 | Barley-S 17 (11–23) 1 | Barley-C 8 (7–8) 1 | Forage 9 (7–10) 1 | ||
| Lethbridge, AB 2006 [64] b | 53 | Native grass 9 | C-wheatgrass 20 | R-wildrye 7 | Wheat 28 | ||
| Keephills, AB 1995–1997 [55] c | 53 | F. hay field 25 (23–25) ‡ | Hayed hay 18 (10–23) ‡ | Mowed hay 24 (12–25) ‡ | F. pasture 25 (23–26) ‡ | G. pasture 27 (24–29) ‡ | |
| Lacombe, AB 1994–1995 [22] d | 429 (335–523) 1 | Barley/triticale 5 (4–6) 1 | Triticale 2 (1–2) 1 | S-bromegrass 1 (<1–3) 1 | Light G. <1 (<1–1) 1 | Medium G. 3 (2–3) 1 | Heavy G. 5 |
| Miami, MB 1988–1990 [21] | 182 (100–331) 1 | F. 9 (5–112) 1 | Wheat, CV-till 16 (11–128) 1 | Corn 18 (5–240) 1 | Alfalfa 2 (0–7) 1 | ||
| Roseisle, MB 1988–1990 [21] | 138 (101–292) 1 | F. 25 (7–94) 1 | Wheat, CV-till 8 (2–157) 1 | Corn 12 (8–73) 1 | Alfalfa 2 (0–5) 1 | ||
| Boissevain, MB 1988–1990 [21] | 161 (87–238) 1 | F. 13 (6–26) 1 | Wheat, CV-till 15 (4–49) 1 | Corn 21 (8–53) 1 | Alfalfa 1 (0–1) 1 | Wheat, CV-till 16 (4–40) 1 | |
| Brandon, MB 1988&1990 [21] | 279 (269–288) 1 | F. 36 (10–61) 1 | Wheat, CV-till 36 (19–54) 1 | Corn 47 (26–68) 1 | Alfalfa 12 (3–20) 1 | Wheat, CV-till 31 (16–46) 1 | |
| Mami, MB 2007–2009 [3] | 431 (231–535) 1 | A-crop 5 (1–11) 1 | P-forage 0 | ||||
| Miami, MB 1997–2007 [17] | 363 (63–507) 1 | A-crop, CS-till 6 (0–30) 1 | A-crop, CV-till 14 (0–59) 1 | ||||
| Snowmelt runoff | |||||||
| La Glace, AB 1985–1986 [16] | 80 (67–92) 1 | F. 52 (41–62) 1 | Barley, till 75 (58–92) 1 | Barley, stubble 70 (61–79) 1 | Forage 77 (67–87) 1 | Canola, till 62 (56–68) 1 | Canola, stubble 65 (60–70) 1 |
| Lacombe, AB 1993–1996 [22] d | 73 (49–97) 1 | Barley/triticale 60 (26–94) 1 | Triticale 52 (11–93) 1 | S-bromegrass 60 (18–101) 1 | Light G. 72 (21–122) 1 | Medium G. 38 (9–67) 1 | Heavy G. 60 (21–98) 1 |
| Swift Current, SK 1995–2011 [19] | 26 (5–109) 1 | F., ZR-till 29 (5–185) 1 | F., CV-till 4 (1–26) 1 | Wheat, ZR-till 9 (2–38) 1 | Wheat, CV-till 7 (2–30) 1 | ||
| Miami, MB 2005–2012 [18] e | n.a. | A-crop 39 | P-forage 59 | ||||
| Miami, MB 1997–2007 [17] | 80 (6–99) 1 | A-crop, CS-till 59 (8–96) 1 | A-crop, CV-till 45 (0–120) 1 | ||||
a Simulated rainfall. Barley-S: barley sown in rows parallel to the slope; and Barley-C: sown perpendicular to the slope. b Simulated rainfall. The experiment was conducted at one site-year. c Simulated rainfall. Three sites for each of the hay treatments and two sites for each of the pasture treatments. d Each value for a crop is an average of three grazing treatments; and each value for a grazing treatment is an average of four crops. e Each value is an average of multiple years. 1 The range shows difference between years. ‡ The range shows the difference between sites.
Table 5.
Examples of wheat grain yield variability within landscapes in Saskatchewan.
| Site | Year | Landscape Position | Yield (kg ha−1) |
|---|---|---|---|
| Hepburn [68] | Three-year average | Upper slope | 1910 |
| Mid-slope | 2760 | ||
| Lower slope | 3160 | ||
| Alvena [69] | Dry year | Knoll | 710 |
| Back slope | 1240 | ||
| Front slope | 1270 | ||
| Depression | 2230 | ||
| Wet year | Knoll | 3000 | |
| Back slope | 2380 | ||
| Front slope | 3120 | ||
| Depression | 1960 |
Table 6.
Summary of tillage operations in the Canadian Prairies in 1971, 1991, and 2016, showing the increasing trend of conservation tillage and zero-till.
Table 6.
Summary of tillage operations in the Canadian Prairies in 1971, 1991, and 2016, showing the increasing trend of conservation tillage and zero-till.
| Category | 1971 a | 1991 b | 2016 c | ||||||||||||
|---|---|---|---|---|---|---|---|---|---|---|---|---|---|---|---|
| AB | SK | MB | All | % e | AB | SK | MB | All | % e | AB | SK | MB | All | % e | |
| Land for seeding (103 ha) | 5514 | 9656 | 2751 | 17,921 | 100 | 7966 | 13,035 | 4219 | 25,220 | 100 | 8866 | 15,202 | 4169 | 28,237 | 100 |
| Conventional till (103 ha) d | 5514 | 9656 | 2751 | 17,921 | 100 | 5783 | 8334 | 2797 | 16,914 | 67 | 1028 | 1043 | 1720 | 3791 | 13 |
| Conservation till (103 ha) d | 0 | 0 | 0 | 0 | 0 | 1934 | 3348 | 1209 | 6491 | 26 | 1697 | 2842 | 1612 | 6151 | 22 |
| Zero-till (103 ha) d | 0 | 0 | 0 | 0 | 0 | 249 | 1353 | 212 | 1814 | 7 | 6142 | 11,317 | 837 | 18,296 | 65 |
a Total land area prepared for seeding is from Statistics Canada [5], and areas for individual tillage operations are based on Lobb et al. [71]. b Data are from Statistics Canada [72]. c Data are from Statistics Canada [73]. d Defined in the Census of Agriculture as: conventional tillage incorporates most of the crop residue into the soil; conservation tillage retains most of the crop residue on the soil surface; and zero tillage prior to seeding. e % of total land area prepared for seeding in the three provinces.
Publisher’s Note: MDPI stays neutral with regard to jurisdictional claims in published maps and institutional affiliations. |
© 2021 by the authors. Licensee MDPI, Basel, Switzerland. This article is an open access article distributed under the terms and conditions of the Creative Commons Attribution (CC BY) license (https://creativecommons.org/licenses/by/4.0/).
Share and Cite
MDPI and ACS Style
Liu, J.; Lobb, D.A. An Overview of Crop and Crop Residue Management Impacts on Crop Water Use and Runoff in the Canadian Prairies. Water 2021, 13, 2929. https://doi.org/10.3390/w13202929
AMA Style
Liu J, Lobb DA. An Overview of Crop and Crop Residue Management Impacts on Crop Water Use and Runoff in the Canadian Prairies. Water. 2021; 13(20):2929. https://doi.org/10.3390/w13202929
Chicago/Turabian StyleLiu, Jian, and David A. Lobb. 2021. "An Overview of Crop and Crop Residue Management Impacts on Crop Water Use and Runoff in the Canadian Prairies" Water 13, no. 20: 2929. https://doi.org/10.3390/w13202929
Note that from the first issue of 2016, this journal uses article numbers instead of page numbers. See further details here.