
Matrix Suction Evaluation of Soil-Rock Mixture Based on Electrical Resistivity


1
Engineering Research Center of Diagnosis Technology of Hydro-Construction, Chongqing Jiaotong University, Chongqing 400074, China
2
Changjiang Fuling Waterway Division, Chongqing 408099, China
*
Author to whom correspondence should be addressed.
Water 2021, 13(20), 2937; https://doi.org/10.3390/w13202937
Submission received: 9 September 2021
/
Revised: 18 October 2021
/
Accepted: 18 October 2021
/
Published: 19 October 2021
(This article belongs to the Special Issue Advanced Technologies and Methods for Soil Water Monitoring and Management)
Abstract
:The soil-rock mixture is an important construction material in practical engineering. Its physical properties, especially soil-water properties, are particularly important for on-site construction, while both matrix suction and electrical resistivity in unsaturated soils depend on the magnitude of moisture content, and a certain relationship can be established between the two physical quantities. Therefore, in this paper, we designed a matrix suction–electrical resistivity synergistic test device and conducted indoor physical tests on common soil-rock mixtures in the Chongqing area to investigate the correlation between matrix suction and electrical resistivity in soil-rock mixtures. The electrical resistivity comprehensive parameter was used to represent the electrical resistivity characteristics of rock and soil. Based on the experimental results, a matrix suction–electrical resistivity comprehensive parameter model applicable to soil-rock mixtures was established, and the sensitivity analysis of the model parameters was carried out. The results show that the soil-water characteristic curve of the soil-rock mixture has a double-step shape, and the shape of the curve under different compaction degrees is similar. The matrix suction and mass moisture content of the soil-rock mixture were positively correlated with the compaction degree. There was good consistency between the experimentally measured matrix suction and the matrix suction reflected by the electrical resistivity in the model. Moreover, the model curve was able to reflect the drainage process of pores in the soil for soil–stone mixtures with a bimodal pore size distribution, thus providing a new way to measure the matrix suction of unsaturated soil–stone mixtures in practical engineering.
1. Introduction
Geotechnical bodies exist mostly in unsaturated form in nature as well as in geotechnical engineering. Currently, in studies related to unsaturated soils, matrix suction is the fundamental characteristic used to distinguish saturated from unsaturated soils. Soil water characteristic curves (SWCC) are an important way to determine the properties of unsaturated soils and are usually used to describe the relationship between the moisture content or saturation of unsaturated soils and their matrix suction [1,2]. Balam et al. and Tarantino et al. [3,4] found that the water holding capacity of soil is related to its water absorption rate, and the higher the water absorption rate, the stronger the water holding capacity of the soil. Therefore, the water absorption test can be used to test the water holding capacity of the soil. Soil–water characteristic curves are commonly tested on various types of soils, including chalk, clay, loess, and expansive soils, etc. In specific engineering studies, remodeled soil samples from engineering sites are also used to study their soil-water characteristics. Hedayati et al. [5] compared SWCC measured in the laboratory and obtained in the field, and found that the laboratory data had better consistency with the saturation-based curves in the field. Wang et al. [6] applied the filter paper method and the centrifugal method measurement of SWCC to study soil-water characteristics under different conditions. Alowaisy et al. [7] developed an automatic system using a continuous pressure method, which can directly and reliably measure SWCC. At present, experimental data on SWCC of unsaturated soils are still in the research stage. Therefore, according to the correlation between the three critical points (C1, C2, and S) of SWCC, points C1 and C2 are the points of maximum curvature of the SWCC curve, and point S is the point with the maximum slope on the SWCC curve. Additionally, Ren et al. [8], based on an analysis of SWCC shape characteristics, provided an innovative method for predicting more reliable SWCC.
Studies [9,10,11] in the past decades have shown that if we ignore the effect of matrix suction, we cannot robustly explain the phenomenon of soil sliding induced by rainfall. Therefore, matrix suction is an important factor affecting the strength of unsaturated soils, and it is also a physical variable that is difficult to measure. It is difficult to measure a wide range of suction values by accurate and reliable means, and often two or more measurement methods need to be used simultaneously. Various measurement methods have their limitations or defects, such as the measurement range of the tensiometer, which is limited by the inlet valve of the geotechnical body and the long equilibration time required for the pressure plate meter method. In view of this, many scholars have optimized and improved the above experimental methods. For example, Leng et al. [12] were able to automate the completion of matrix suction measurements by improving the active control system of the pressure plate apparatus, and Suwal et al. [13] could simultaneously measure the matrix suction and elastic wave by improving a triaxial test apparatus.
For soil-rock mixtures with the same properties, the magnitude of electrical resistivity depends mainly on the magnitude of water content, and the magnitude of matrix suction also depends on the magnitude of water content. Therefore, there must be some intrinsic connection between the matrix suction and the electrical resistivity of the soil-rock mixture [14]. Since the electrical resistivity of soil and rock media is closely related to their structural parameters (including soil-to-rock ratio, water content, compactness, and porosity, etc.), the electrical resistivity testing technique, as one of the commonly used physical investigation methods, has been widely used in the engineering inspection and quality evaluation of various types of geotechnical bodies [15]. Merritt et al. [16] investigated a large number of samples containing clay minerals by Waxman–Smits equation and proposed how to establish a clayey landslide-related method for the water content–electrical resistivity relationship. Since the distribution of water in the soil is related to soil properties (such as structure, organic content, texture, thickness, etc.), Qu et al. [17] found that there is a certain relationship between electrical resistivity and the most representative soil moisture in Brazil and used it as a predictive method to assess soil moisture. Loke et al. [18] proposed that electrical resistivity tomography has very high sensitivity to soil moisture content and can be used as a method for underground monitoring and spatial characterization. Since soil subsurface moisture dynamics can also cause changes in electrical resistivity [19,20], Supper et al. [21] proposed that electrical resistivity tomography (ERT) could be used to monitor unstable landslides that are susceptible to rainfall. Compared with the matrix suction measurement device, the electrical resistivity measurement device is more concise and easy to operate, and the electrical resistivity measurement results are real-time, without the need to wait for the equilibrium of the specimen and the instrument.
At present, the research on SWCC has focused on fine-grained soils such as red clay [22], chalk and loess [23], and sand and chalk mixtures, while the soil-water characteristics of soil-rock mixtures have been less studied [24]. Different from homogeneous geotechnical materials, the mechanical properties of soil-rock mixtures largely depend on their own structural characteristics [25]. Under the action of different external forces, the various components of the soil-rock mixture have different mechanical properties and at the same time, there are complex interactions. In view of this, in this paper, aiming at the soil-water characteristics of soil-rock mixtures, we designed a soil-water characteristic electrical resistivity synergistic test device to test the electrical resistivity, water content, and matrix suction of unsaturated soil-rock mixtures. By analyzing the experimentally measured results, the matrix suction–electrical resistivity comprehensive parameter model of the soil-rock mixtures was established. This study aimed to use electrical resistivity to predict the matrix suction of soil-rock mixtures in practical applications, and also to provide a new measurement method for matrix suction in soil-rock mixtures, which is beneficial to promote the development and application of soil-rock mixture materials.
2. Test Setup
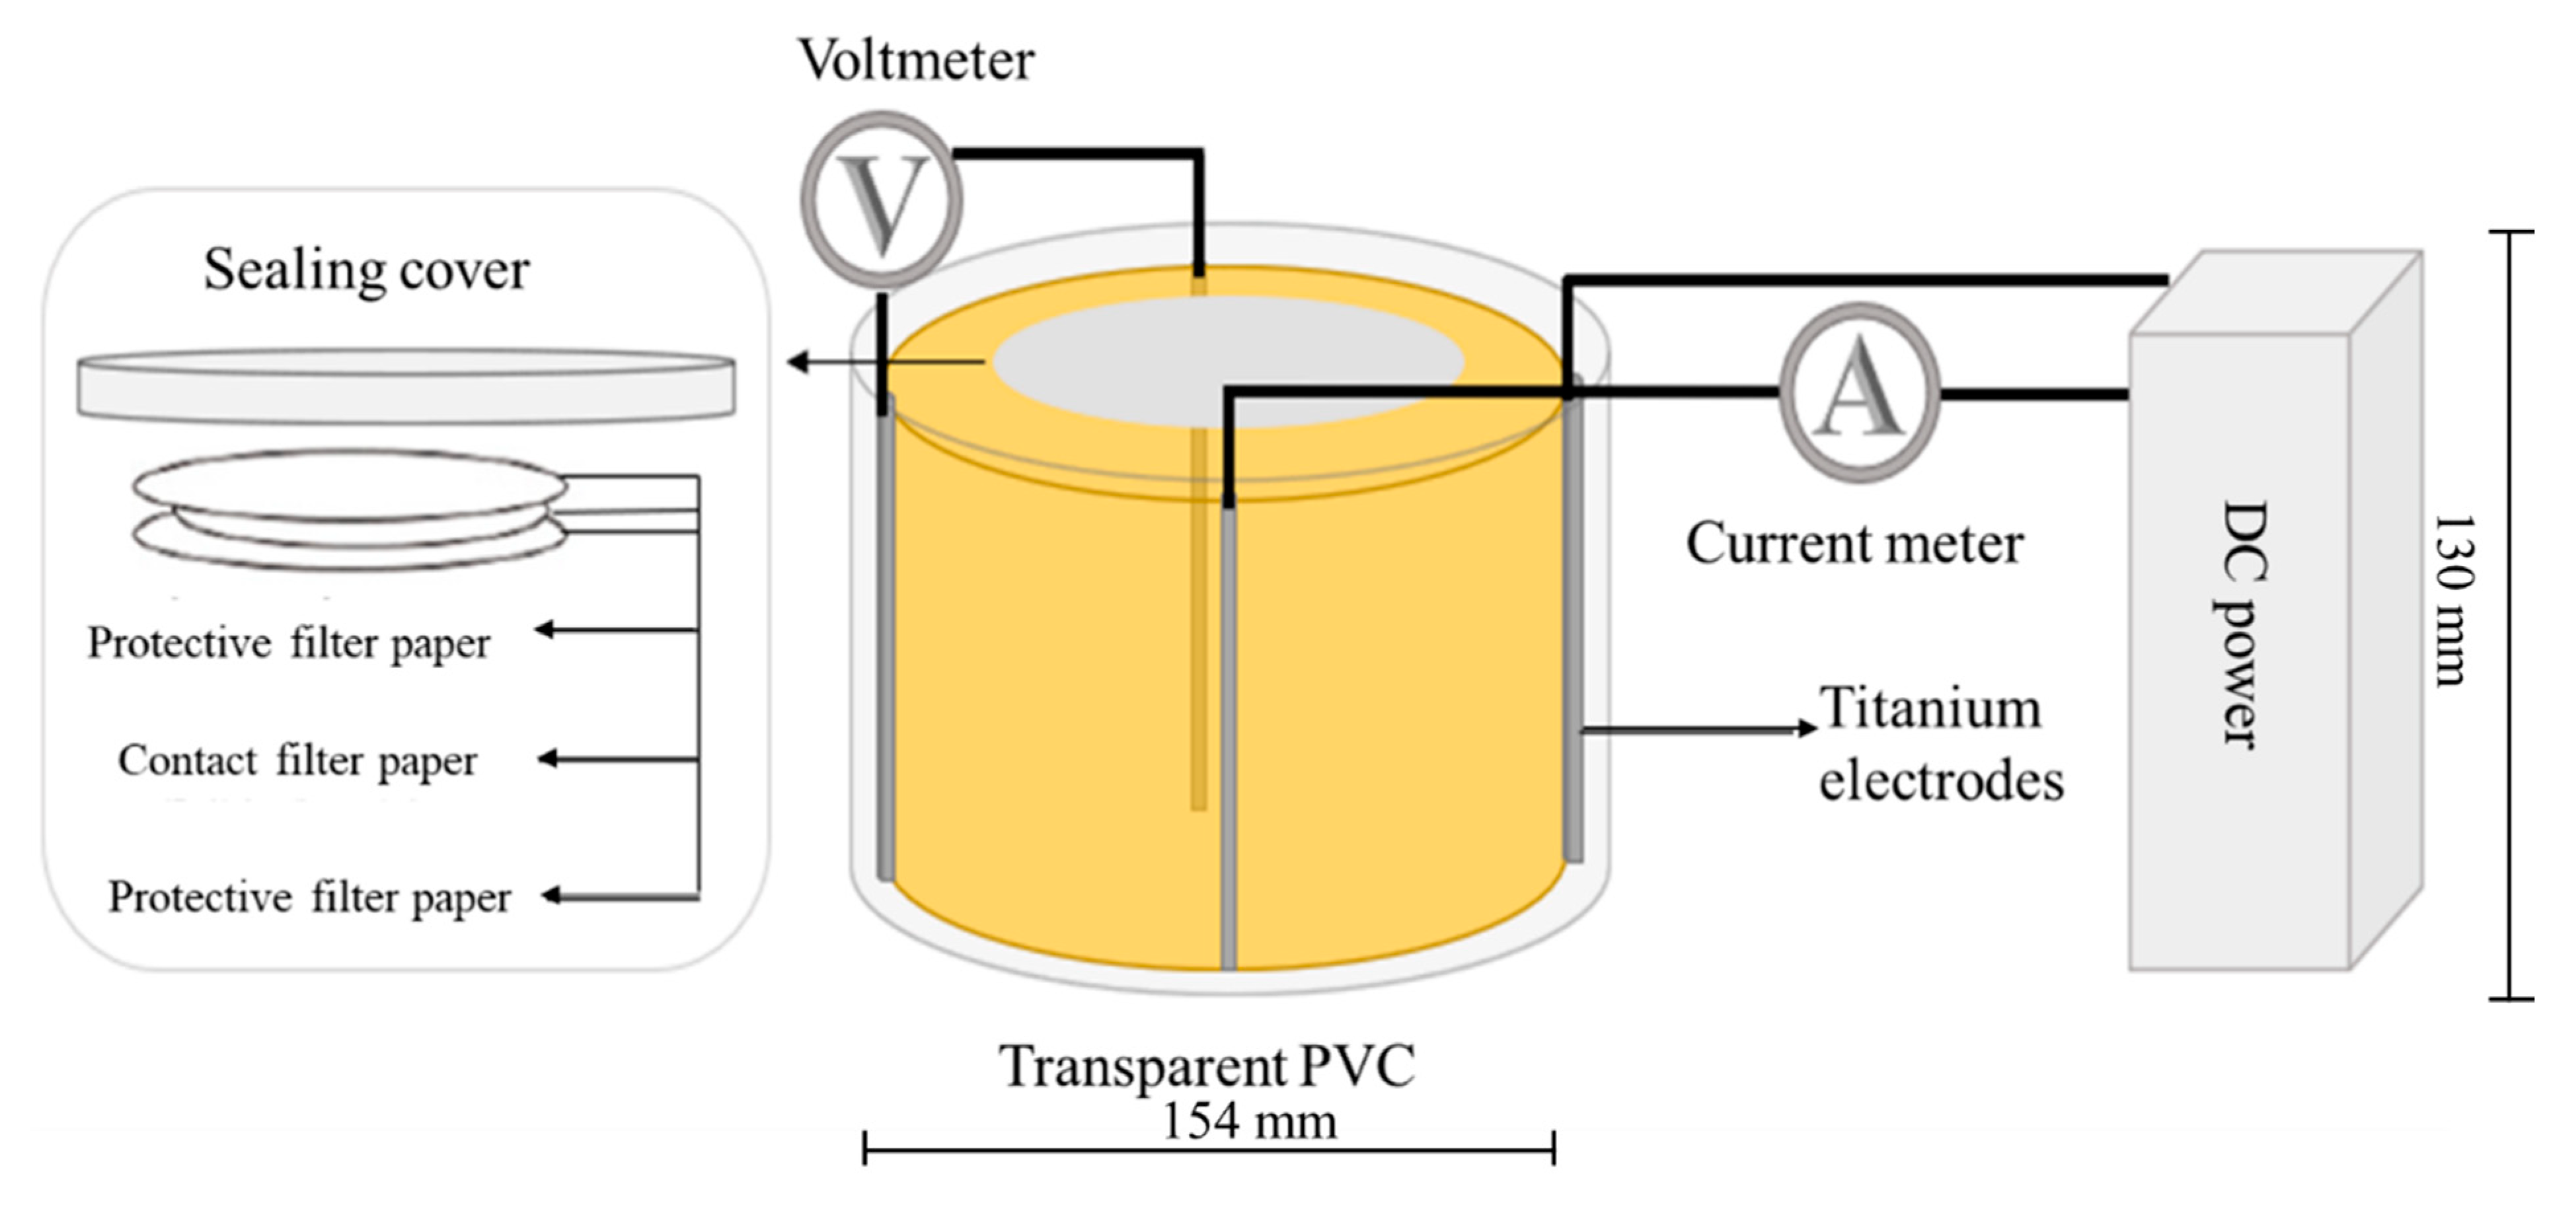
The electrical resistivity measurements for the experiments in this paper were performed using the Van Der Pauw (Vdp) method, which is a widely used electrical resistivity test method. The Vdp method can measure the thickness of uniform semiconductors, solid metals, electrolyte solutions, etc., and is not limited by the shape and thickness of the measured object [26]. The principle of the Vdp method is that four electrodes are placed around the measurement sample, as shown in Figure 1, where any two adjacent electrodes (a and b) are supplied with a constant current , and the voltage generated on the other two electrodes (c and d) is measured, from which the test resistance can be calculated , while changing the electrodes to obtain the resistance . The electrical resistivity of the measured sample can be calculated from the following equation.
in the formula
d—Test sample thickness (m).
—sample electrical resistivity (Ω·m). Equation (1) cannot be solved directly, but as its value about is monotonically decreasing, it is easier to find its value using the dichotomous method or Newton’s iterative method.
Although there are various methods for testing soil-water characteristic curves, the filter paper method [27], which is easy to operate, theoretically mature, and less costly, is one of the widely used suction measurement methods and is also the substrate suction test method used in this paper. The measured filter paper was GE Healthcare Life Sciences’ Whatman No. 42 ash-free quantitative filter paper (W42), and the mass moisture content of the filter paper was calculated based on the wet and dry weights of the filter paper, and when combined with the rate equation of the filter paper as Equation (1) to calculate the matrix suction of the specimen at the equilibrium moisture content.
in the formula
—matrix suction of the specimen (kPa).
—mass moisture content of filter paper (%).
The design of the test device is shown in Figure 1 and consists of four main parts: test electrode, measurement meter and power supply, specimen container, and filter paper.
2.1. Test Electrode
Preventing polarization and good flexibility are two key factors in choosing electrode materials. In this paper, titanium electrodes produced by Jiangsu Taizhou Juntong Electronic Commerce Co., Ltd., China, with a thickness of 0.2 mm were used, which had good conductive properties and anti-polarization performance compared to copper and other materials. The length of the titanium electrode was consistent with the height of the specimen, and the thickness of the specimen was the controlling factor to determine the length of the electrode; the electrical resistivity value obtained by this method is a constant value.
2.2. Measuring Equipment
An MS-30100 DC, made in China, regulated power supply produced by MAISHENG BaiYing Instruments Co., Ltd., with maximum voltage of 60 V, was selected as the power supply. The FY51458 four-digit half-digital ammeter produced by Shenzhen, China Feiyang Measurement and Control Co., Ltd. was selected as the current meter. The current meter range was DC2A, and the accuracy was 0.1%. The range of the voltmeter was DC20V, and the accuracy was 0.1%.
2.3. Specimen Container
PVC material, which does not easily form condensation on the wall, was chosen as the specimen container, as shown in Figure 1. The PVC material was transparent on the upper cover to facilitate operation and observation during the test. Since the container plays the role of sealing the specimen and fixing the electrode in the test engineering, it was designed to be cylindrical with slightly larger internal dimensions than the heavy-duty compaction instrument to ensure that the filter paper placed at the top could be in close contact with the soil-rock specimen and minimize the external space.
2.4. Filter Paper
The technical specifications of Whatman 42 ash-free grade quantitative filter paper from GE Healthcare Life Sciences were used: thickness 0.2 mm, diameter 55 mm, and ash content 0.007%. The technical specifications of the protective filter paper using Xinxing brand quantitative filter paper from Hangzhou Special Paper Co., Ltd. were diameter 70 mm, ash content less than 0.1 mg, and slow filtration speed [28].
3. Test Materials and Methods
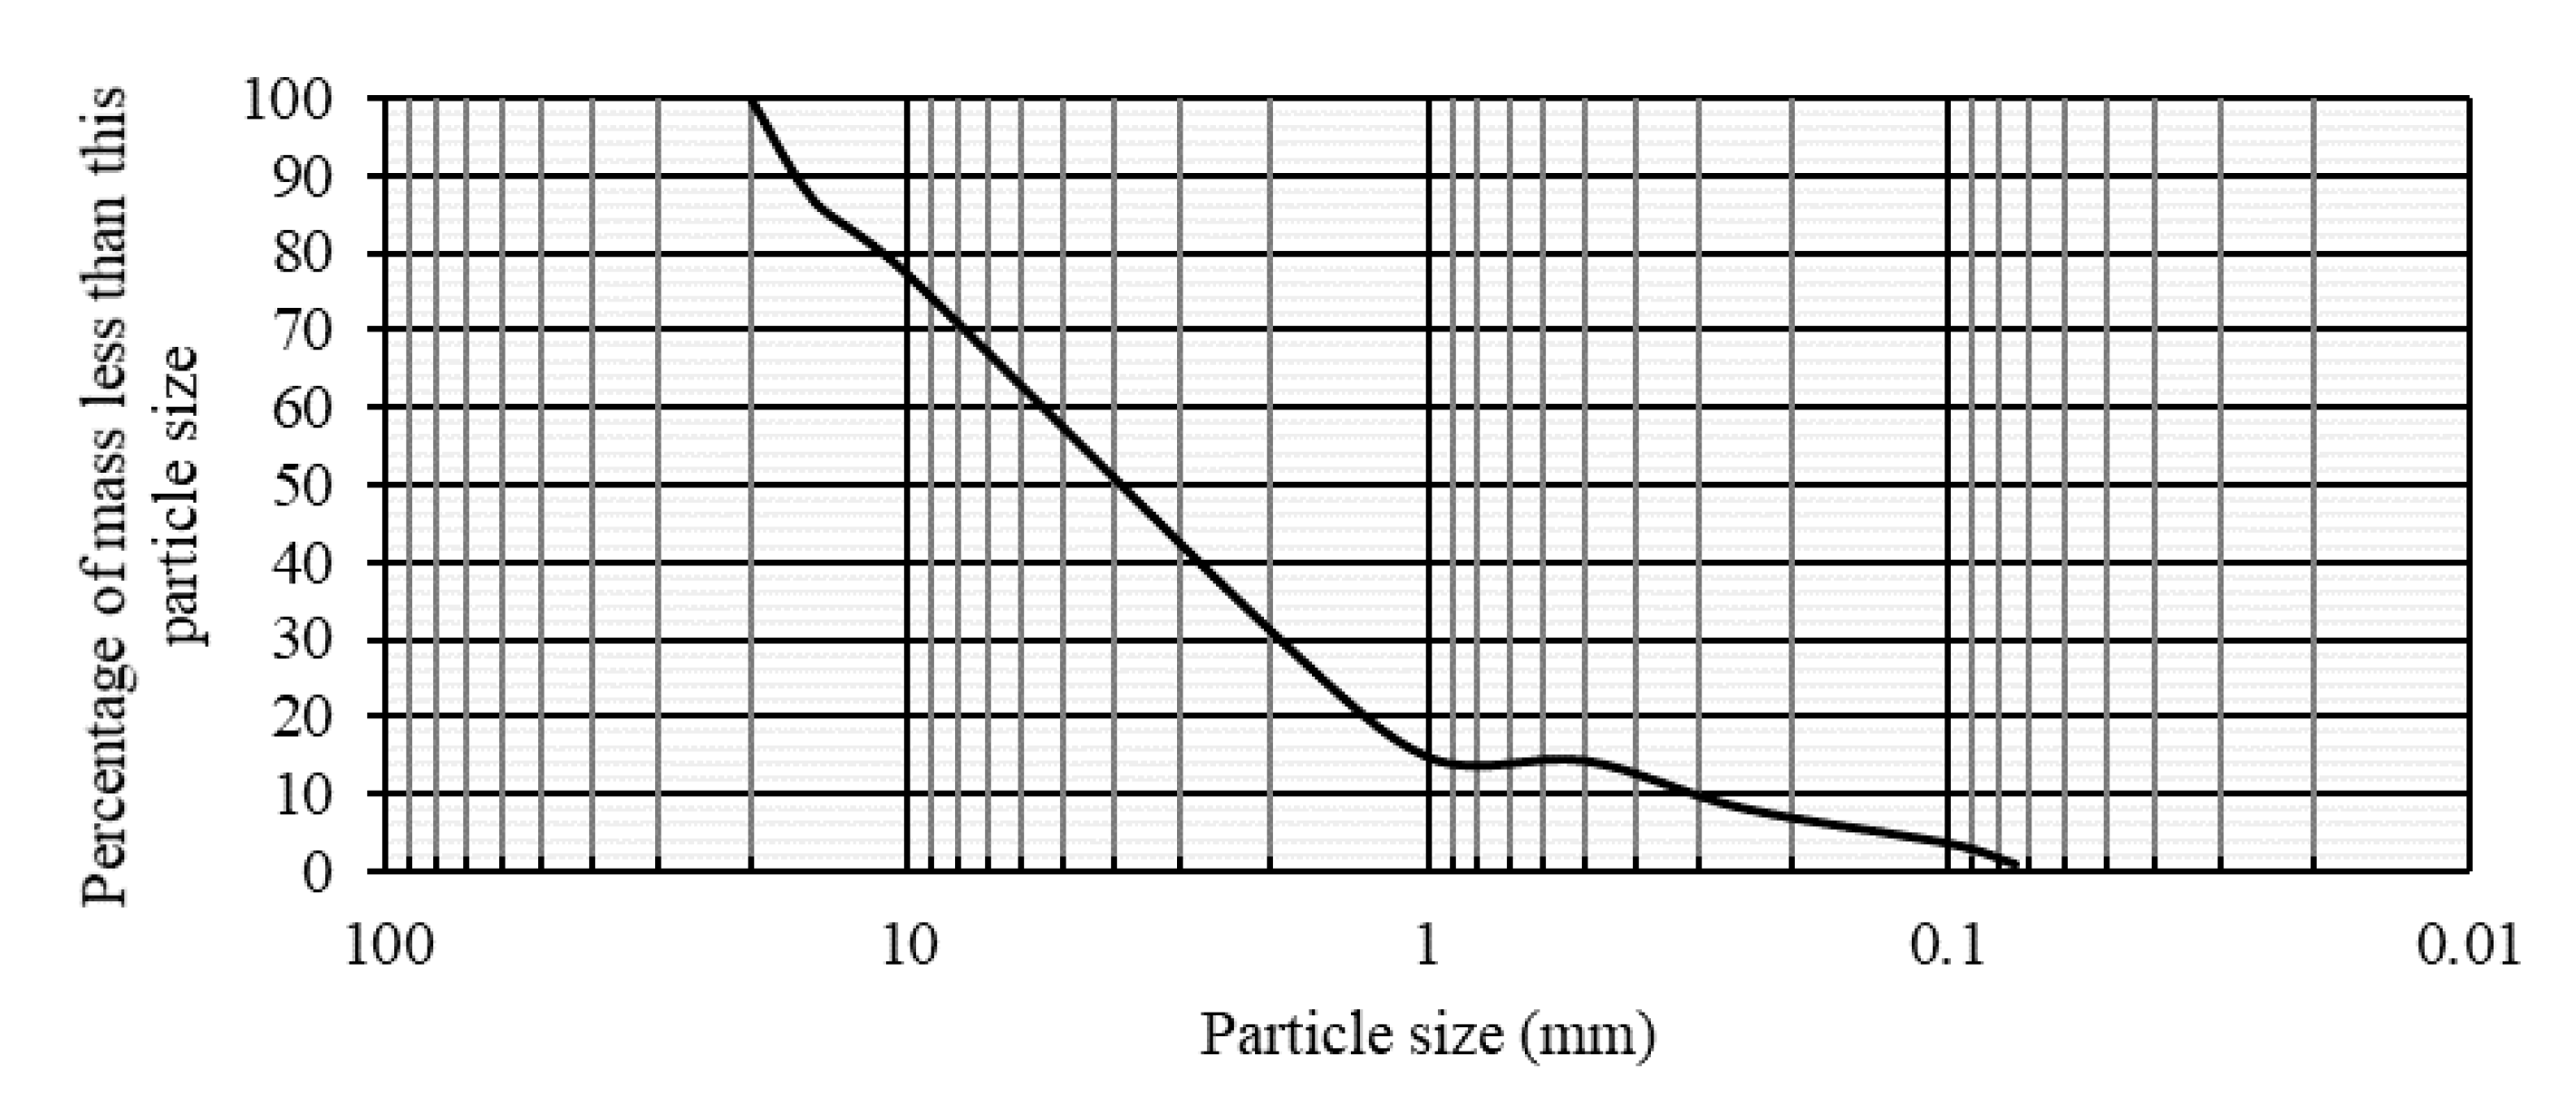
The typical mudstone in the Chongqing area was selected as the soil-rock mixture for the tests, and the moisture content test, particle analysis test, and compaction test were carried out, respectively. The maximum dry density of the test material was obtained as 2.206 g/cm3, and the optimum moisture content was 7.94%. The gradation curve of the soil-rock mixture was obtained by the particle analysis test, as shown in Figure 2. In our study, particles with a diameter of 5 mm–20 mm were defined as rock particles, and particles below 5 mm were defined as soil particles.
As shown in Table 1, soil-rock mixture specimens with different target compaction and target mass moisture content were produced by the compaction method. Three samples were prepared for each group, and the average of the test results was taken. To avoid water evaporation, the test was conducted by mixing each material configured quickly and evenly, then compaction and demolding were carried out, and finally, the specimens were loaded into PVC molds, covered with upper lids to prevent dehydration, and numbered on the outside of the molds. Before the test, the test filter paper and the protective filter paper were put in the oven to dry at 100 °C for 12 h and then placed at a temperature of 20 °C ± 2 °C for 1 h. The test procedure was to load and seal the sample, measure the substrate suction, measure the electrical resistivity, and measure the moisture content; the specific operation steps are as follows [29].
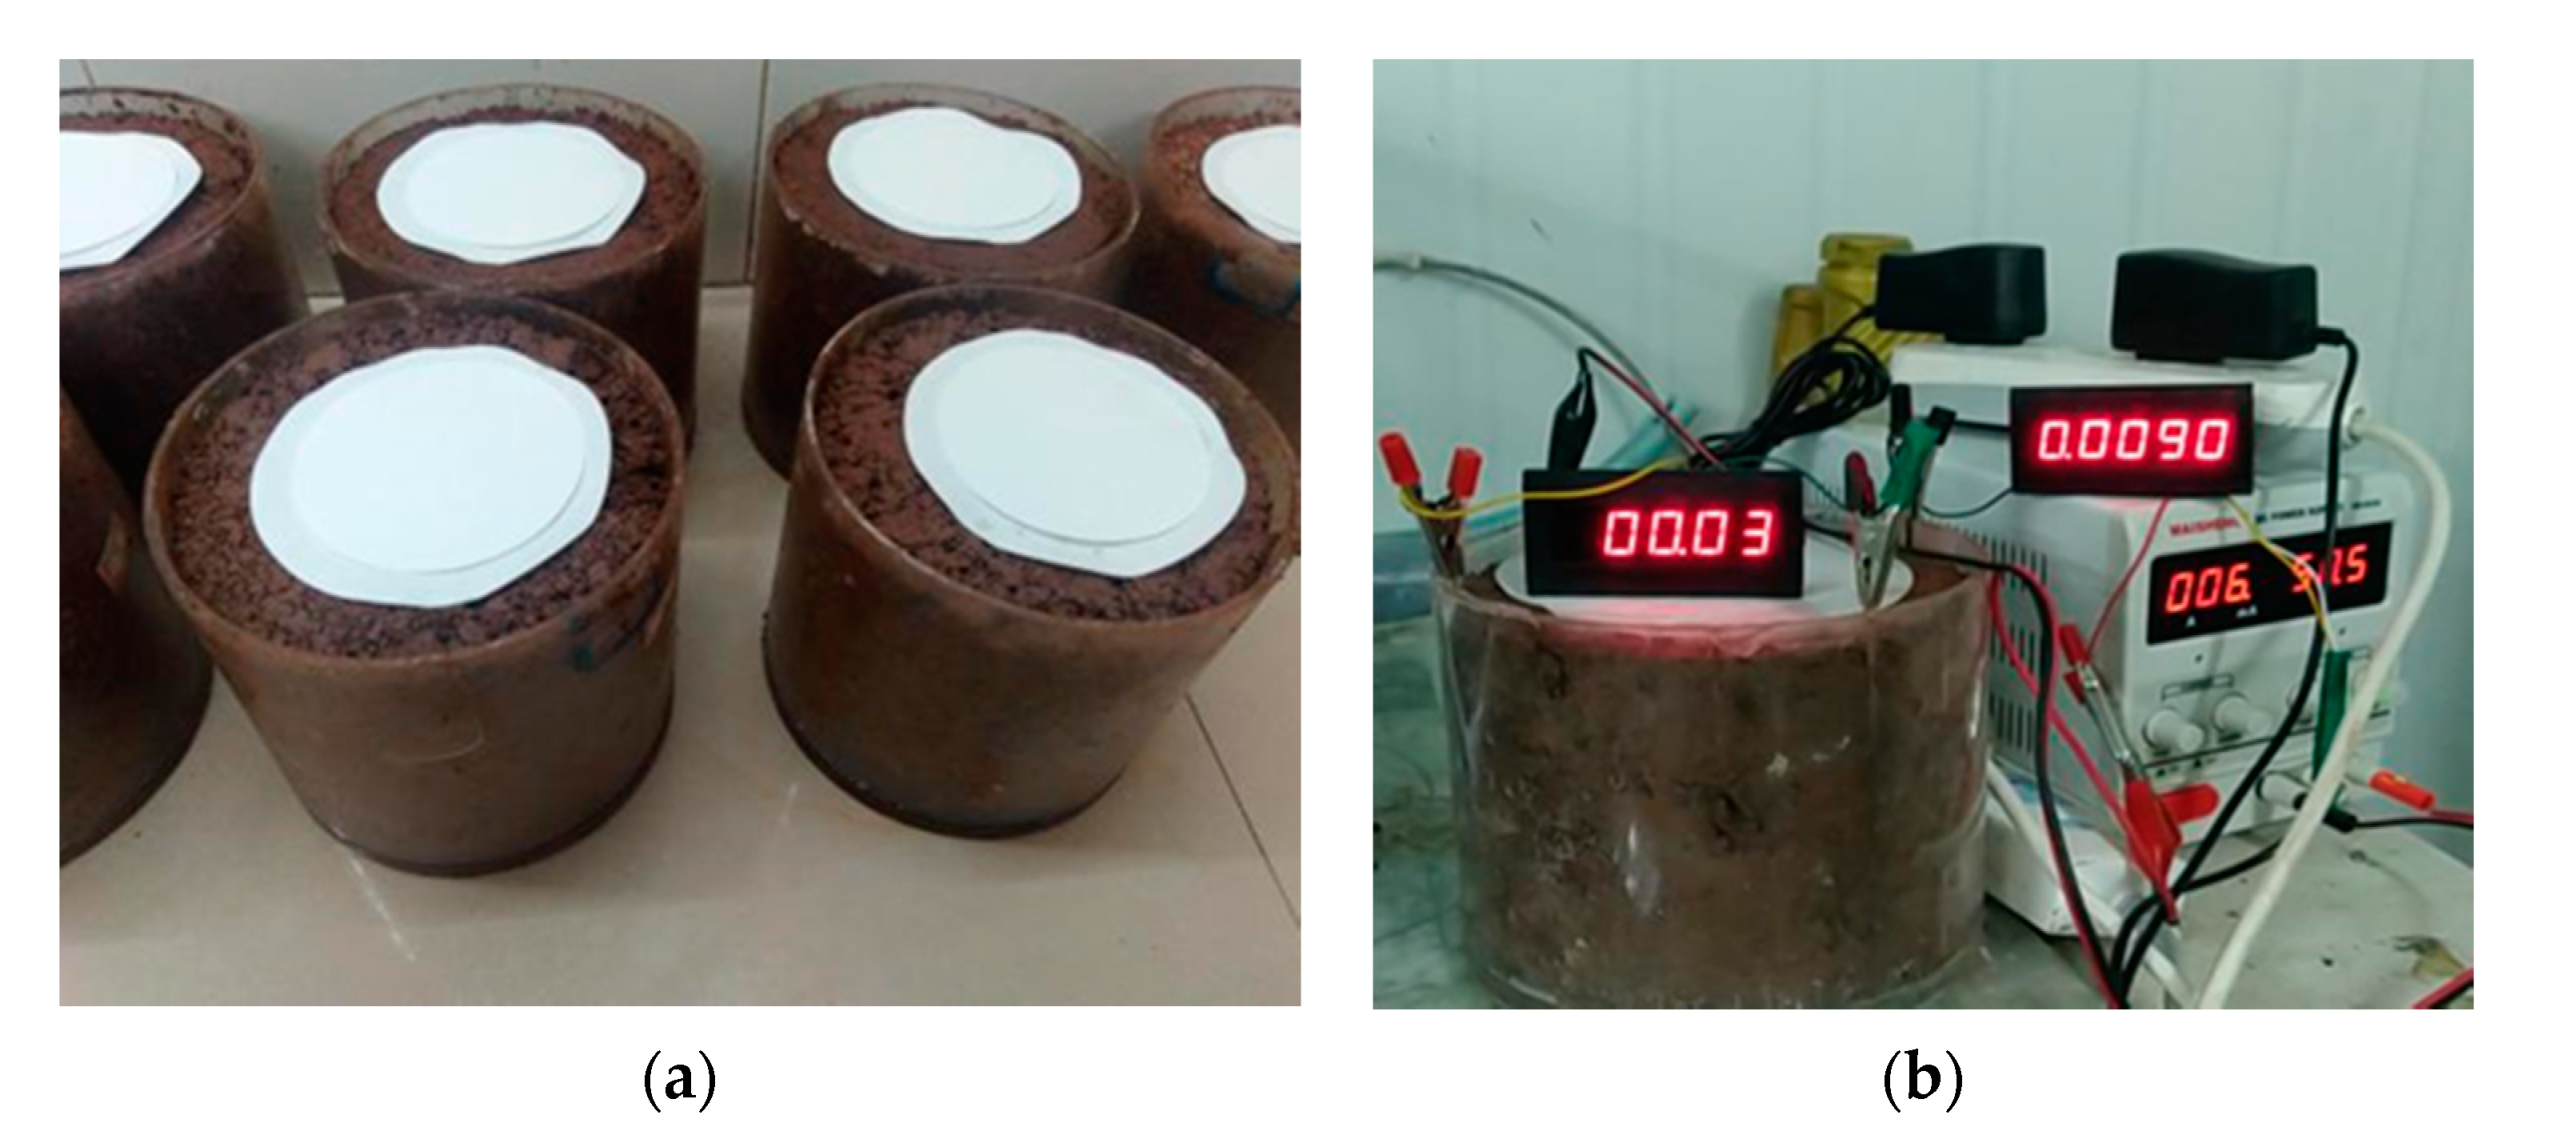
a. Take out the mold with the test piece installed, open the upper cover, and use tweezers to take one piece of protective filter paper, measurement filter paper, and protective filter paper in turn and stack them on the top of the specimen, as shown in Figure 3a. Then, cover the lid and press the lid down firmly to ensure that the filter paper is in close contact with the test specimen. To prevent contamination of the filter paper, hands can not directly touch the filter paper during the operation.
b. Next, apply a thick layer of Vaseline along the mouth of the vessel and seal by wrapping with PTFE tape. Place the sealed specimens in a constant temperature chamber at 20 °C ± 2 °C for more than 10 d to reach equilibrium.
c. After reaching the equilibrium time, open the lid and put the measuring filter paper into the high precision balance with tweezers to measure the wet weight. Care must be exercised during the weighing process, and the time from opening the container to the end of filter paper transfer should be kept within 30 s. After transferring the filter paper, seal the container quickly to prevent the loss of water in the soil sample and put the filter paper into the drying box after measuring. The electrical resistivity of the specimen is then measured by inserting four titanium electrodes from top to bottom at the gap between the specimen and the mold, with the electrodes evenly distributed along the side of the specimen. The four electrodes are connected to the meter and power supply respectively according to the measurement circuit, and the output voltage is set and then connected to the circuit for simultaneous reading of the voltmeter and ammeter. Subsequently, the electrodes are switched and the circuit is changed for the second reading, as shown in Figure 3b. At the same time, the indoor temperature is measured to facilitate subsequent temperature correction of the data.
d. Put the measurement filter paper together with the drying box into the oven to dry at 100 °C for 12 h, then put the filter paper together with the container at 20 °C for 1 h to weigh the quality of the filter paper as the quality of the dried filter paper.
e. Remove the specimen from the mold after the measurement is finished and put it into the drying tray to crush; weigh its wet weight first, then put it into the oven to dry at 100 °C for 12 h, then put the soil sample with the drying tray in the environment of 20 °C for 1 h, wait for it to cool, and then weigh its dry weight.
4. Matrix Suction–Electrical Resistivity Model for Soil-Rock Mixtures
4.1. Experimental Results
In the compaction process of a soil-rock mixture, fine particles are bonded to form an aggregate structure, and the pore distribution is usually bimodal. The SWCC curve is usually a double-step shape consisting of two “S” shapes combined up and down [30].
Compaction degree, also known as compaction coefficient, is the ratio of the actual dry density of the fill to the maximum dry density, and the compaction coefficient of each specimen is calculated according to Equation (3).
in the formula:
—compaction coefficient.
—target dry density of the specimen (g/cm3).
—the maximum dry density of the prepared specimen (g/cm3).
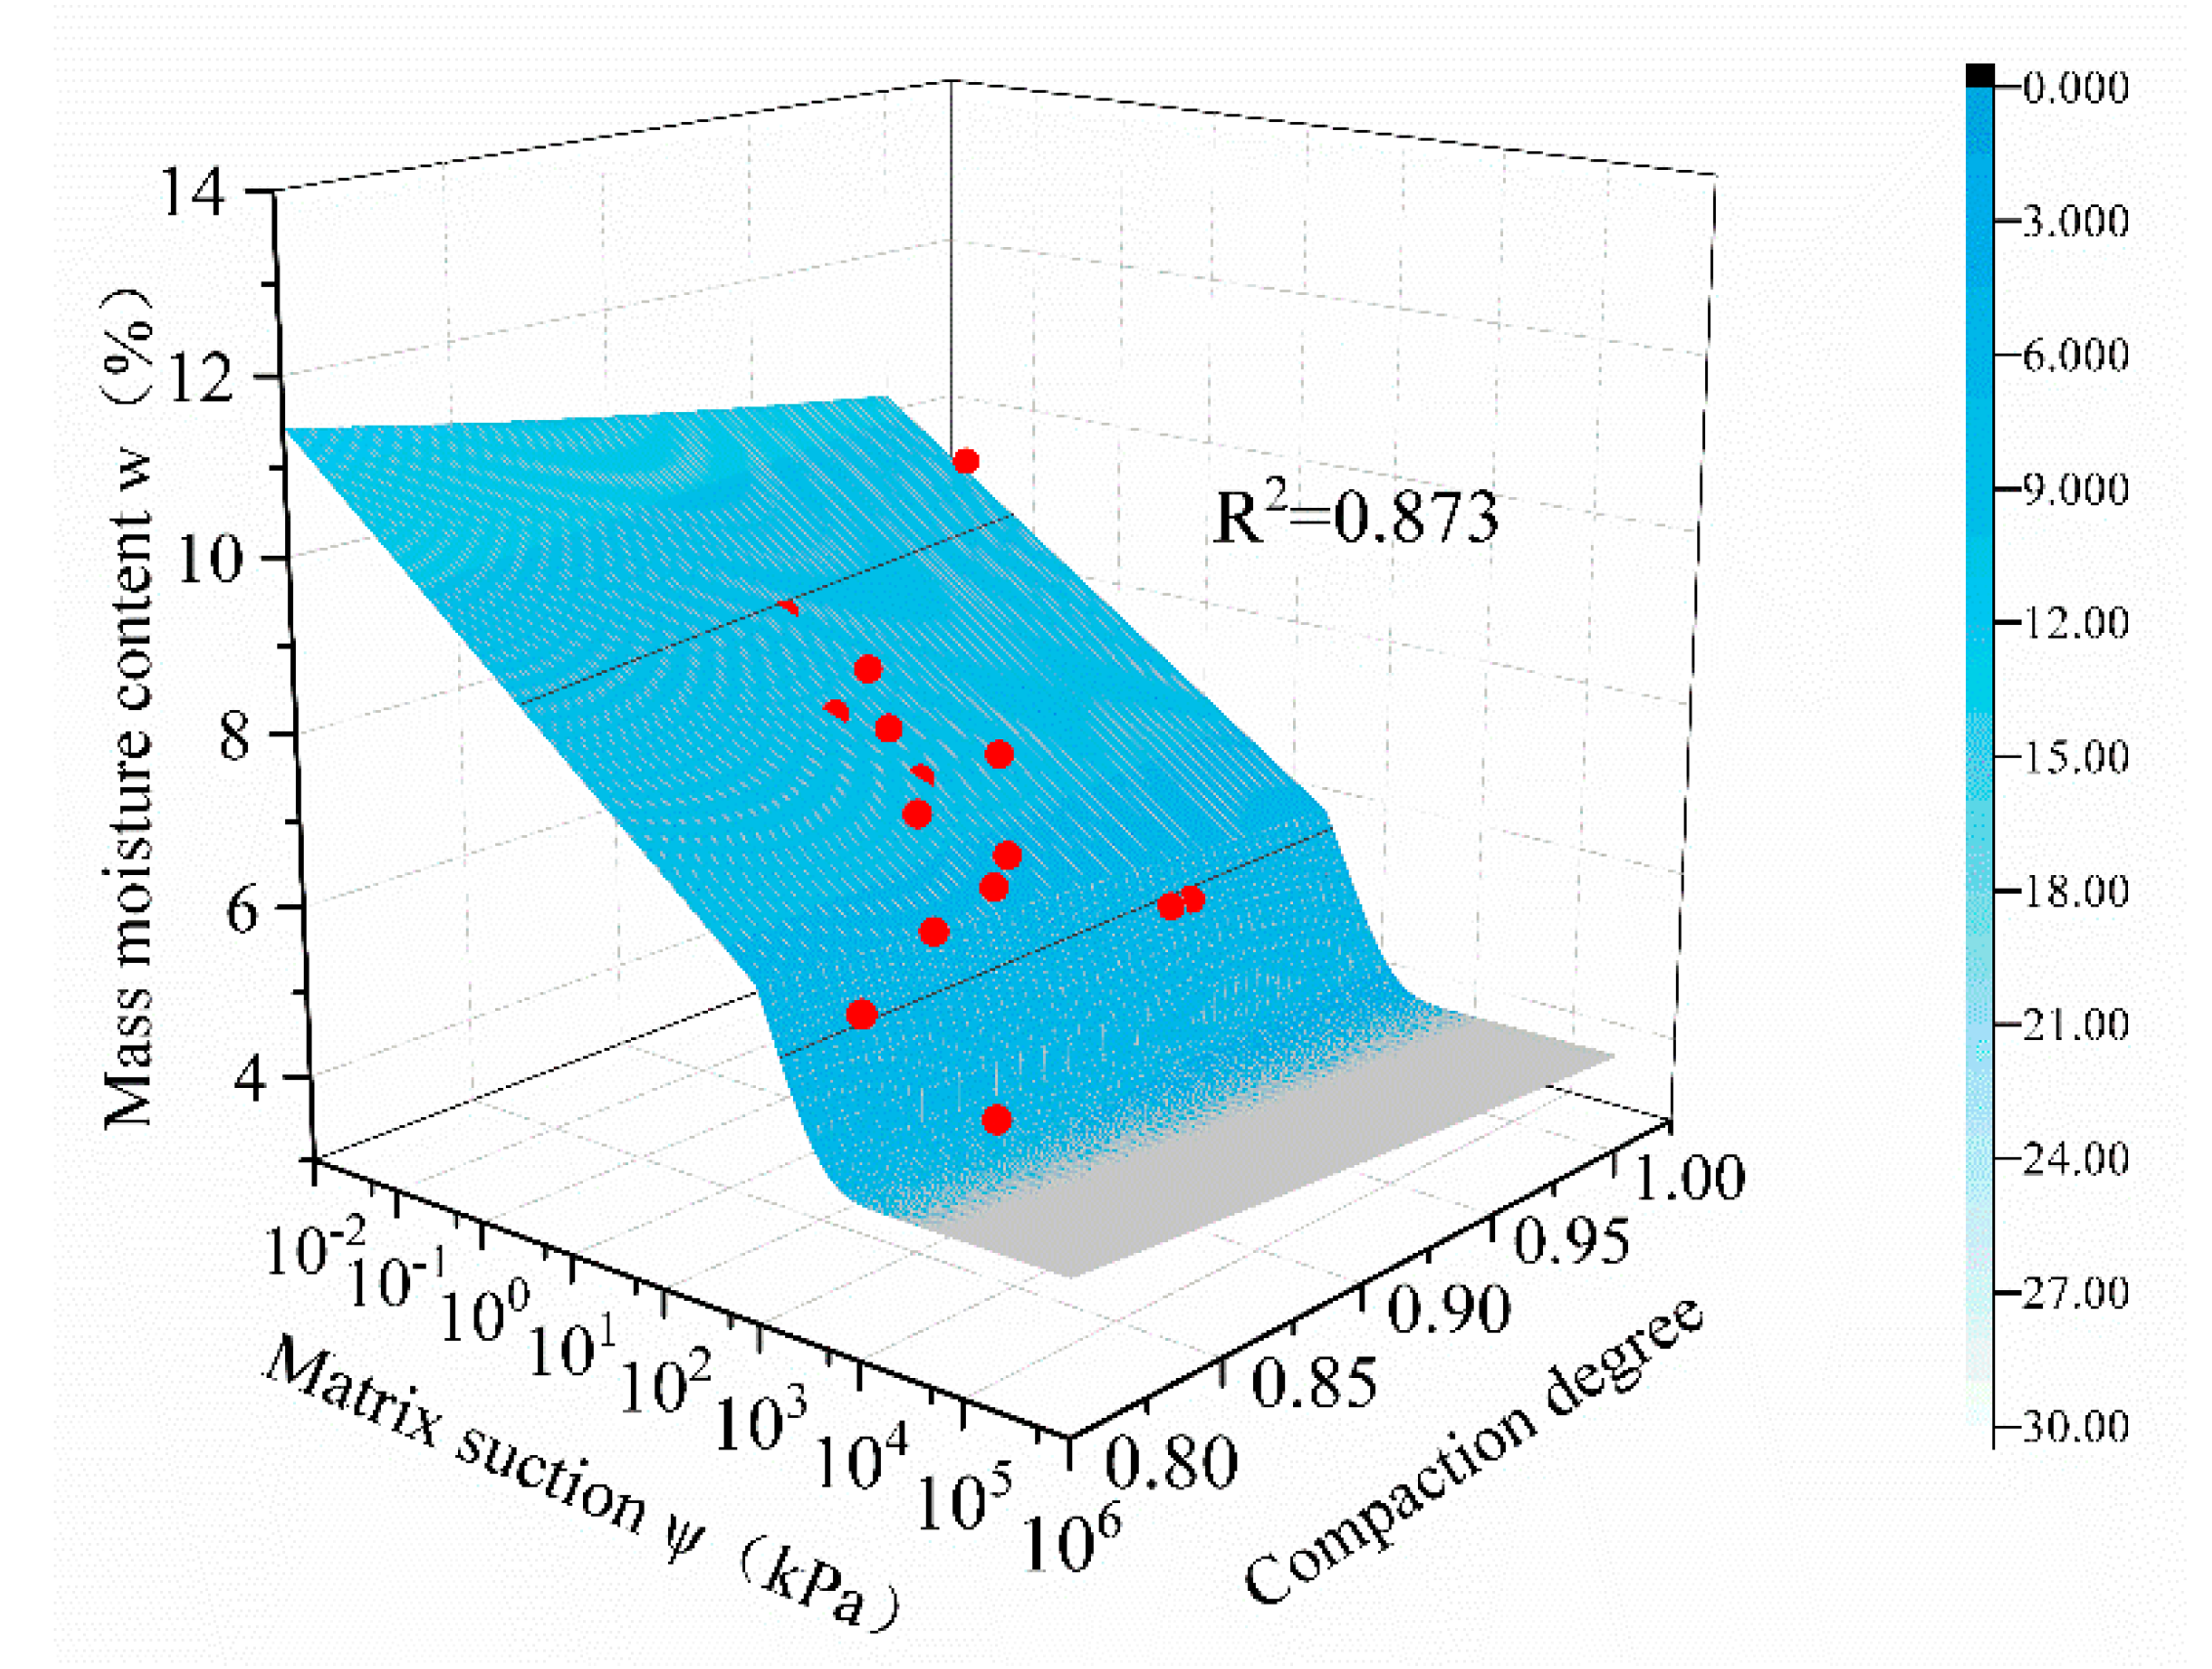
Since there is a large error between the actual compaction degree of the specimens produced by the compaction method and the target compaction degree, the soil-water characteristic surface model of coupled moisture content-matrix suction-compaction degree is used to fit the test data, and the specific expression of the mathematical model is:
in the formula:
, ,—fitting parameters.
—mass moisture content (%).
—Compaction degree.
—Substrate suction (kPa).
With the semi-logarithmic horizontal coordinate indicating the matrix suction and the vertical coordinate indicating the mass moisture content, the soil-water characteristic surface plot of the soil-rock mixture is shown in Figure 4, and the surface fit was 0.873. The fitted values of P1, P2, P3, P4, P5 were 2.8450, 1.0178, 1.1654, 0.0004, and 0.9827, respectively. There was good agreement between the test data and the model, and the model fit was successful.
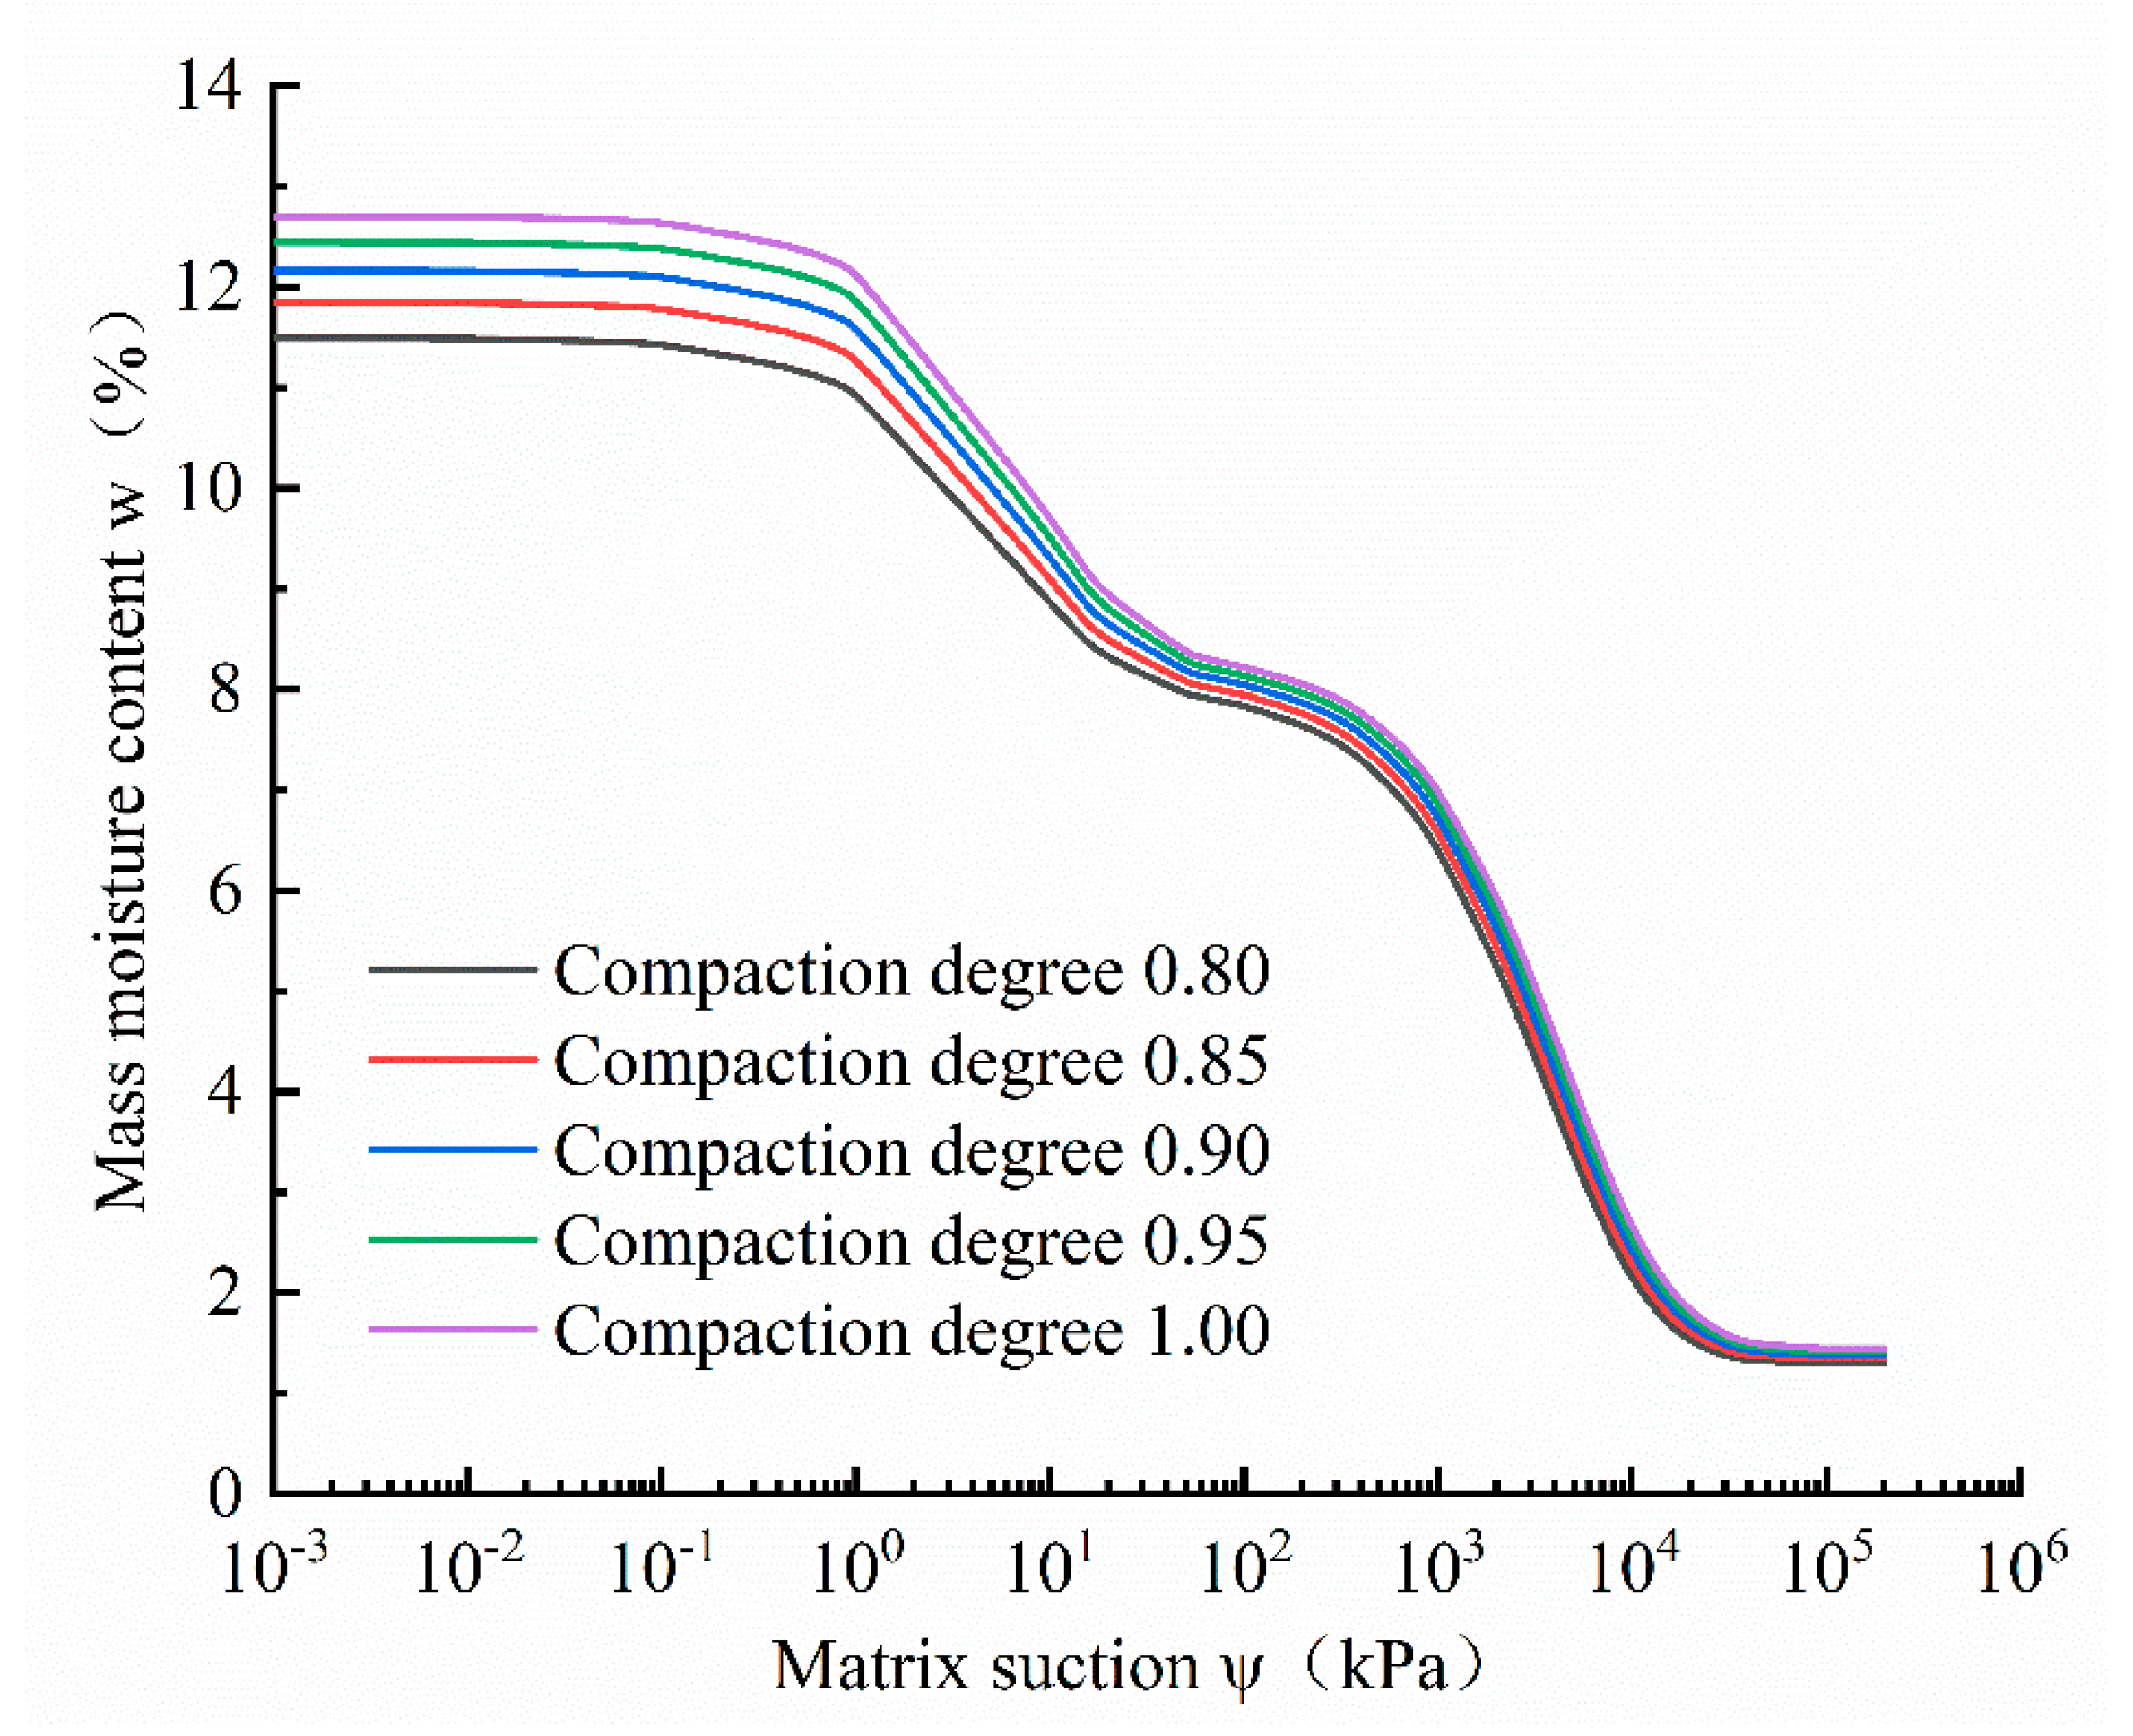
As shown in Figure 5, the soil-water characteristic curves were obtained from the surface in Figure 4 at compaction degrees of 0.8, 0.85, 0.90, 0.95, and 1.0, respectively, by controlling the compaction degree. From the figure, it can be seen that each curve has an obvious double-step shape, describing the drainage processes of large and small pores in the boundary effect section, transition section, and unsaturated residual section, respectively. Similarly to Wang’s [6] and Su’s [24] studies, the two steps on the curve reflected the soil-water characteristics of large and small pores in the soil from top to bottom, respectively. The shapes of the SWCC curves for different compaction degrees were almost the same. Under the condition of equal suction, the mass moisture content of the soil-rock mixture was larger as the compaction degree increased; under the condition of equal mass moisture content, the suction of the soil-rock mixture was larger as the compaction degree increased.
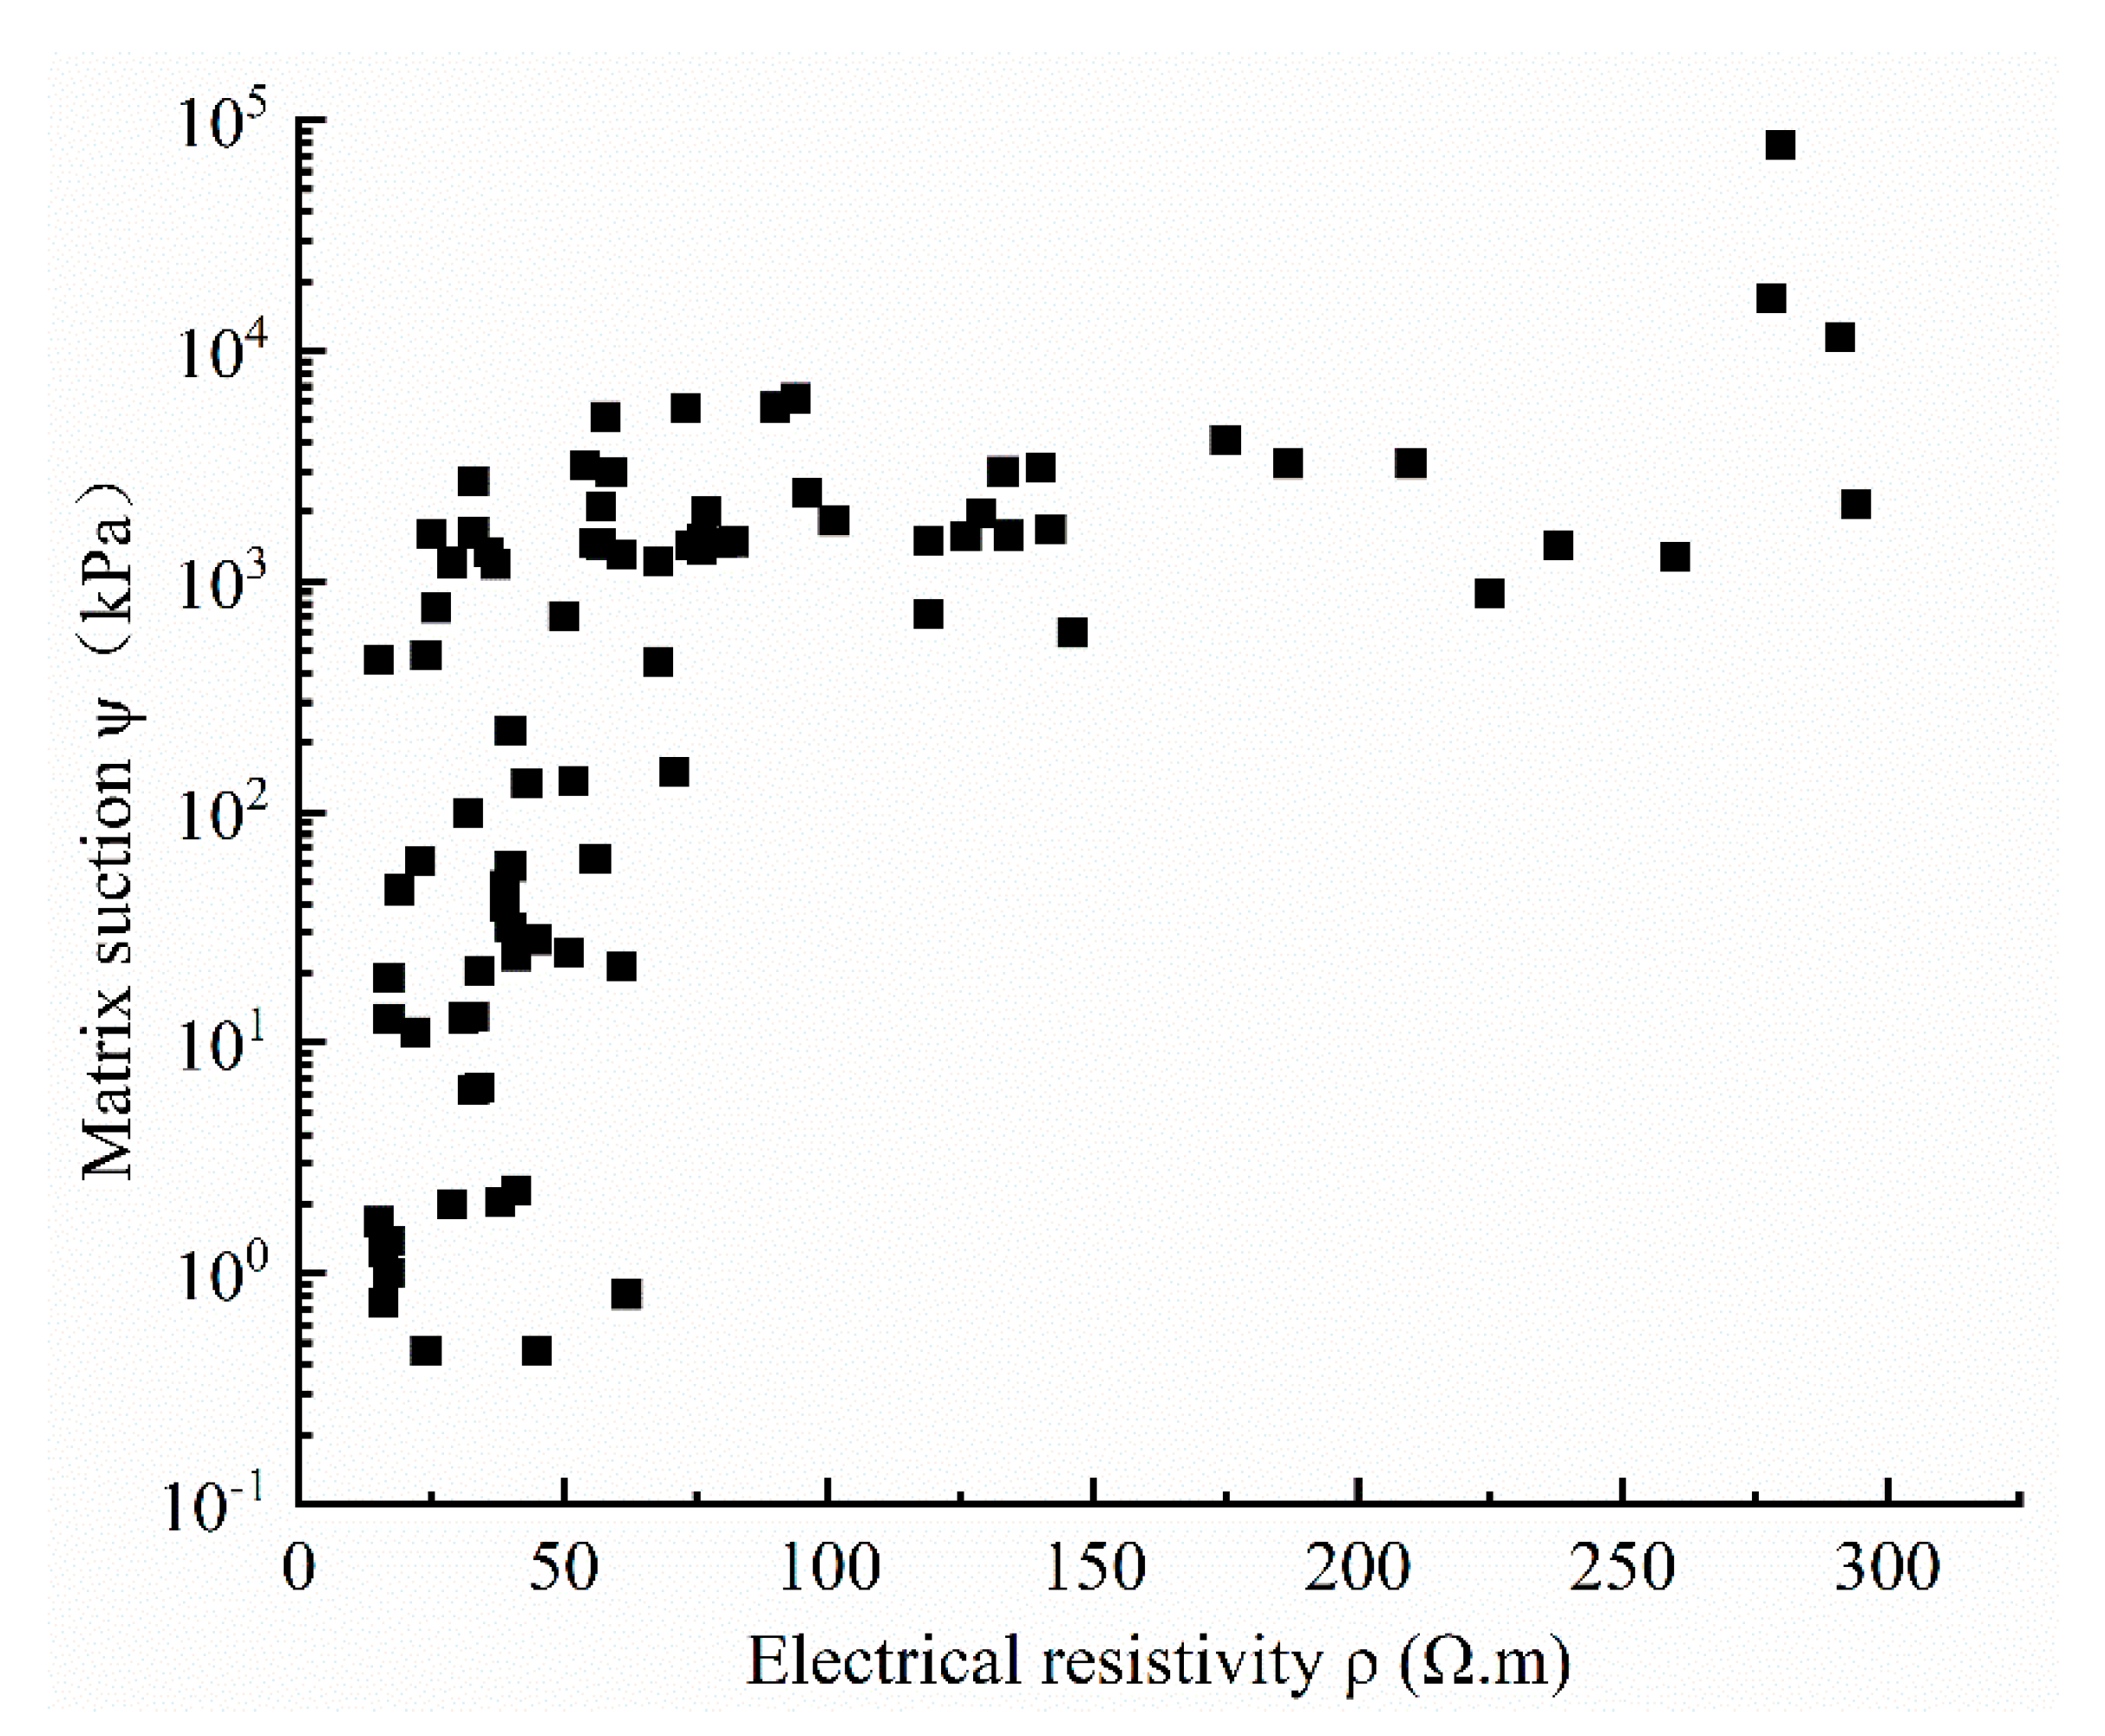
With the semi-logarithmic vertical coordinate indicating the matrix suction and the horizontal coordinate indicating the electrical resistivity, Figure 6 shows the relationship between the electrical resistivity of the soil-rock mixture specimen and the matrix suction . From the figure, it can be seen that in the 0 ≤ < 100 kPa range, the width of the data point distribution was 50, which meant that a certain determination corresponding to the had a large range of values, and the functional correspondence was not precise enough.
4.2. Electrical Resistivity Comprehensive Parameter
The matrix suction of unsaturated soils is the result of the combined action of soil structure, particle composition, particle arrangement, and moisture content, etc. Therefore, the structural parameters of soil electrical resistivity were combined to form a electrical resistivity comprehensive parameter that could be used to represent the electrical resistivity characteristics of the soil and reflect the intrinsic variation law of matrix suction [31]. Zha [32] proposed the electrical resistivity comprehensive parameter in the study of electrical resistivity parameters of unsaturated soils, and its expression is as follows.
in the formula
—electrical resistivity comprehensive parameter.
—electrical resistivity structure factor. , represents the electrical resistivity of soil-rock mass, and represents the electrical resistivity of pore water.
—shape factor; there is a functional relationship between the shape factor and the structure factor of the soil-rock mass. .
—porosity.
—The anisotropy parameter, which is taken as 1 in this paper.
The electrical resistivity comprehensive parameter of the calculated values and the measured values of electrical resistivity are shown in Figure 7; a linear fit of the two was performed using Origin software, and the fitting formula was
where , are fitting parameters, and the curve values in the figure are 0.4 and 0.03, respectively.
From Figure 7, it can be seen that the fitting degree between electrical resistivity comprehensive parameter and electrical resistivity was 0.97, and the linear relationship was significant. The electrical resistivity comprehensive parameter could be used to represent the electrical resistivity characteristics of the soil-rock mixture.
4.3. - Curve
- (1)
- Fitting of the - curve
Combining the electrical resistivity comprehensive parameter with the substrate suction, nonlinear fit was performed. The fitting toolbox of Origin was used to find the best basic functional relationship between and , and the composite optimization of the base functional relationship equation was conducted. The optimized mathematical model is as follows.
where , and are fitting parameters that are related to the physical properties of the soil.
The model was used to fit and , and the fitting results of the fit are shown in Table 2. Adjusted R-Square, the corrected coefficient of determination, was used to determine the degree of fit of a multiple linear regression equation. The closer the values of R2 and adjusted R-Square are to 1, the better the fit of the regression line to the observed values. Root-mean-square error (RMSE) indicates the standard error, which is the square of the ratio of the deviation between the predicted value and the true value to the number of observations . RMSE can be used to measure the deviation of the observed value from the true value, which well reflects the precision of the measurement. Each decision index indicates the success of curve fitting.
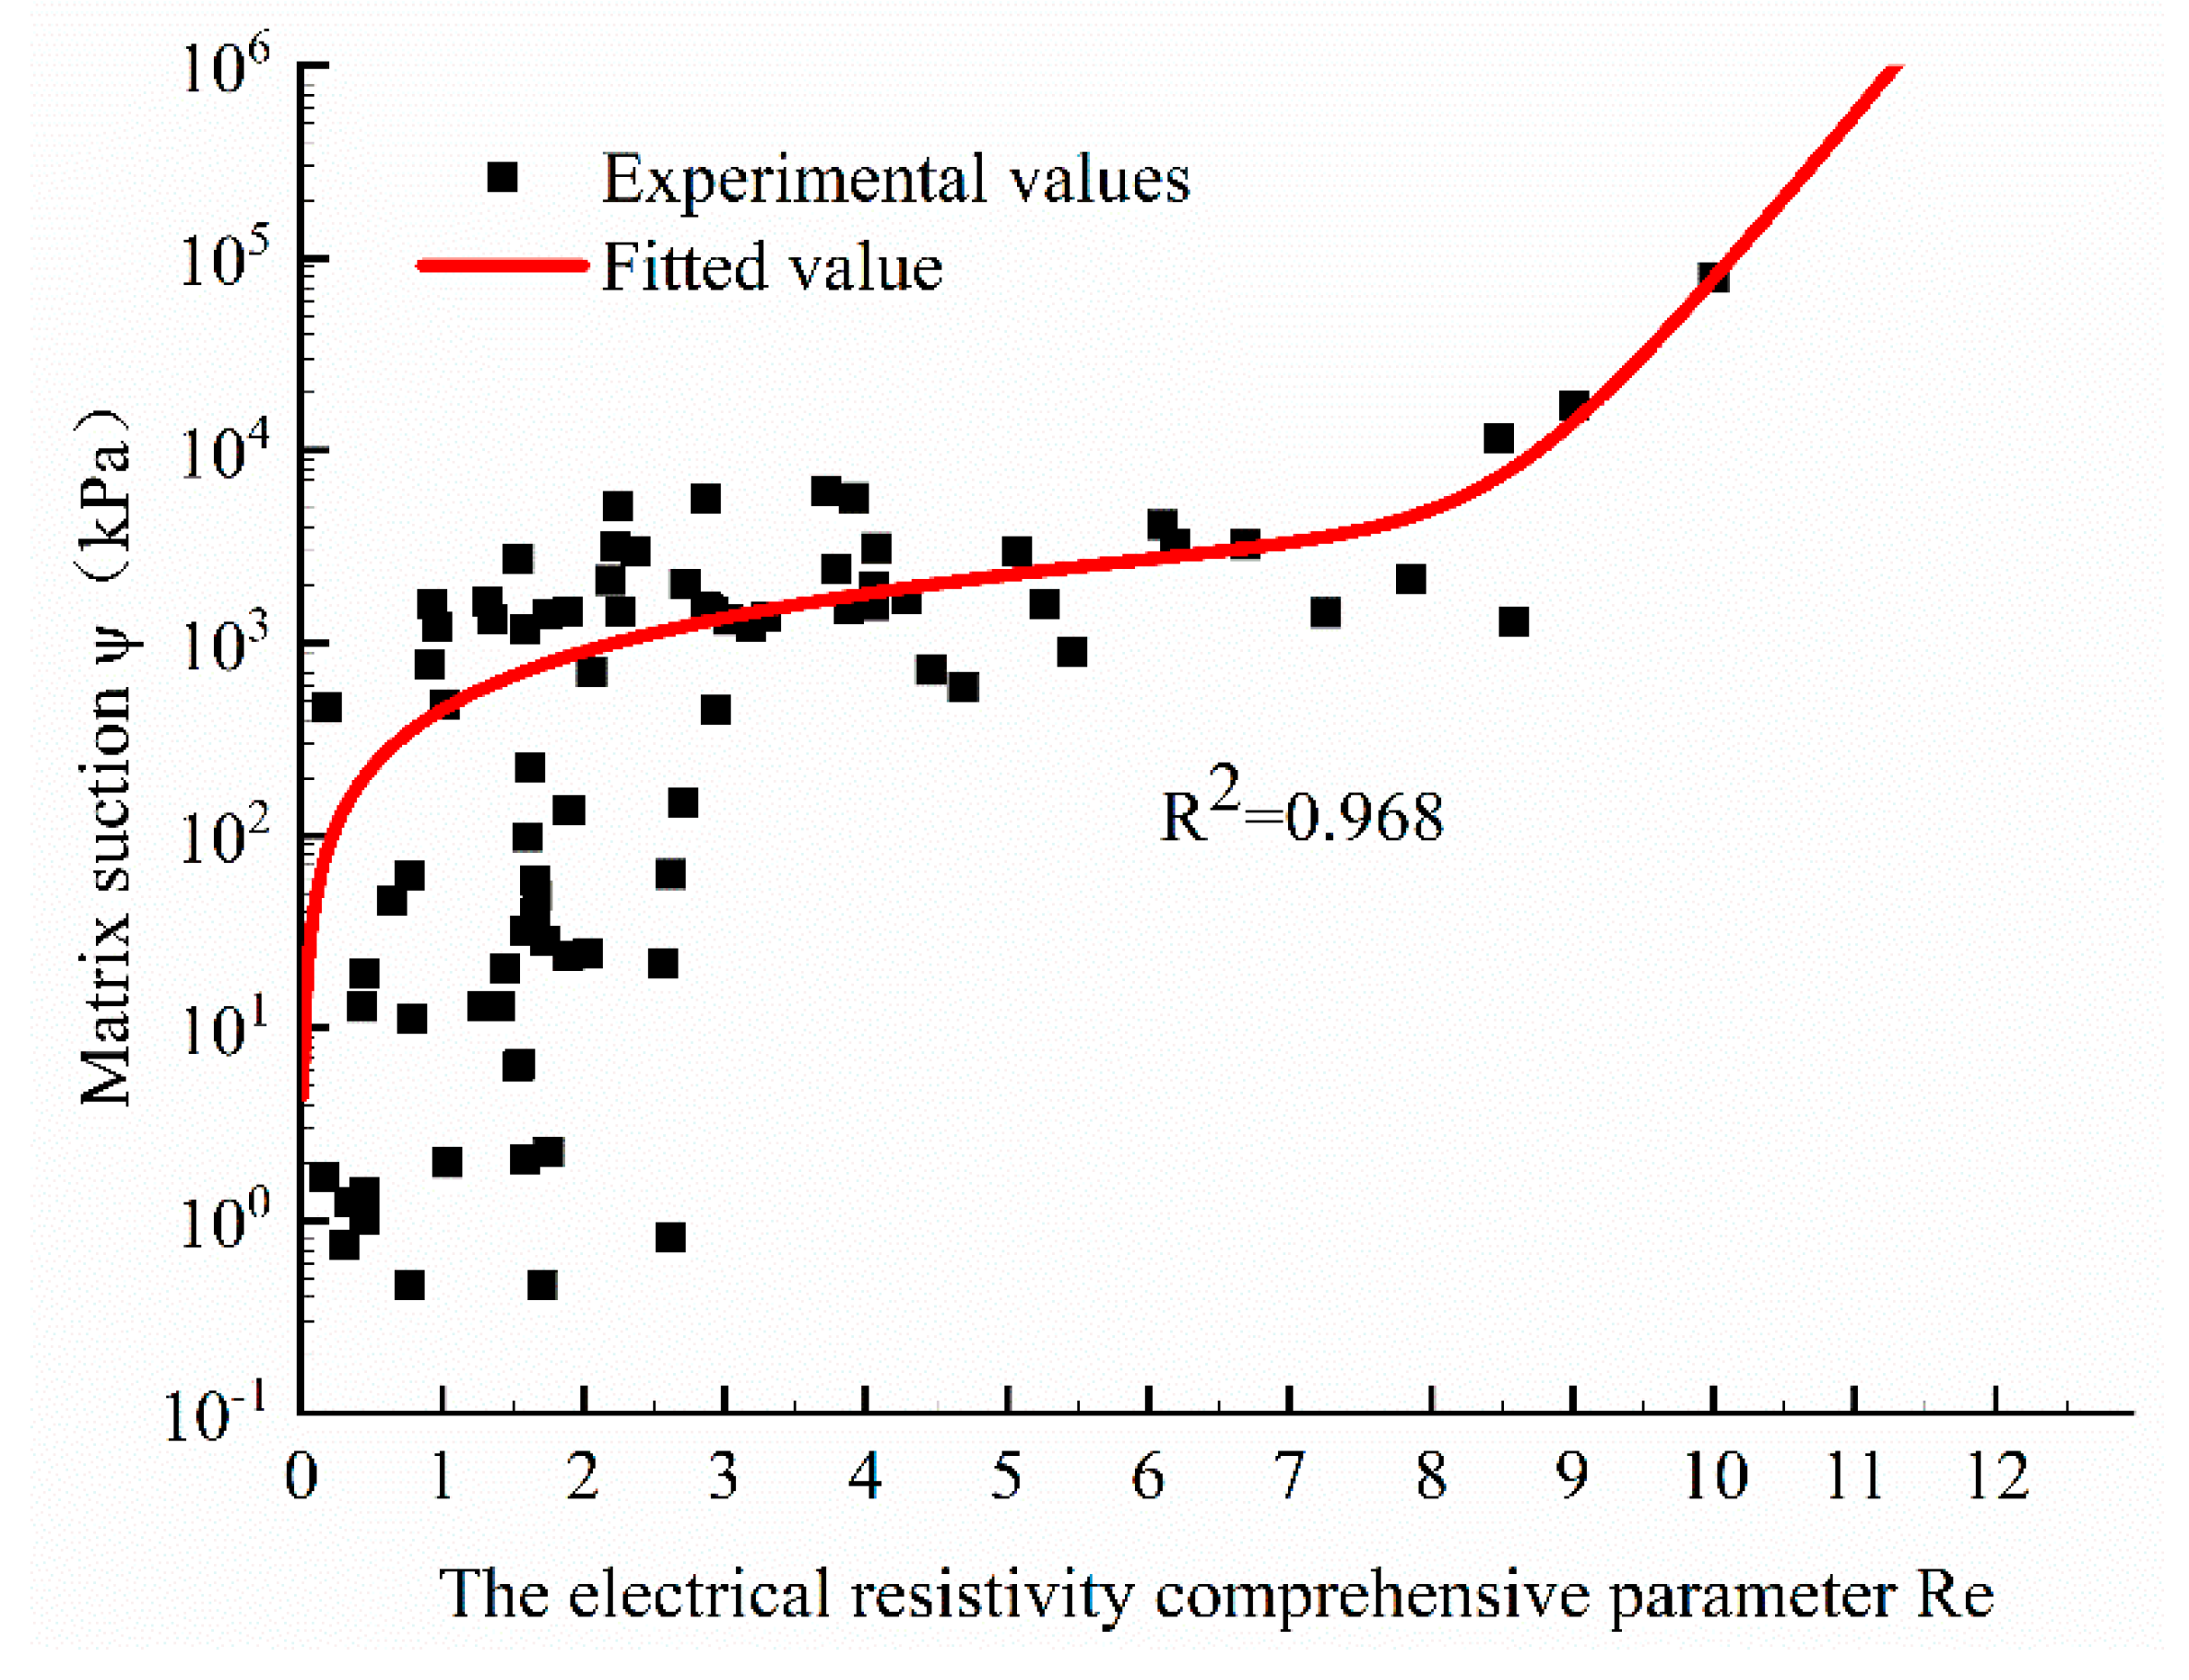
With as the semi-logarithmic vertical coordinate and as the horizontal coordinate, the fitted curve is plotted as shown in Figure 8. It can be seen from the diagram that there is a certain exponential function relationship between the substrate suction and the electrical resistivity comprehensive parameter . The value of increases with the increase in , and the overall increase rate of is also increasing. When , -curve is very steep and increases rapidly from 0 kPa to 1000 kPa; when , the - curve slows down, but the increment of is 9000 kPa, and the increment of is not weakened; when , the slope of the - curve continues to increase, and the increment of reaches 90,000 kPa.
- (2)
- Physical meaning of the - curve
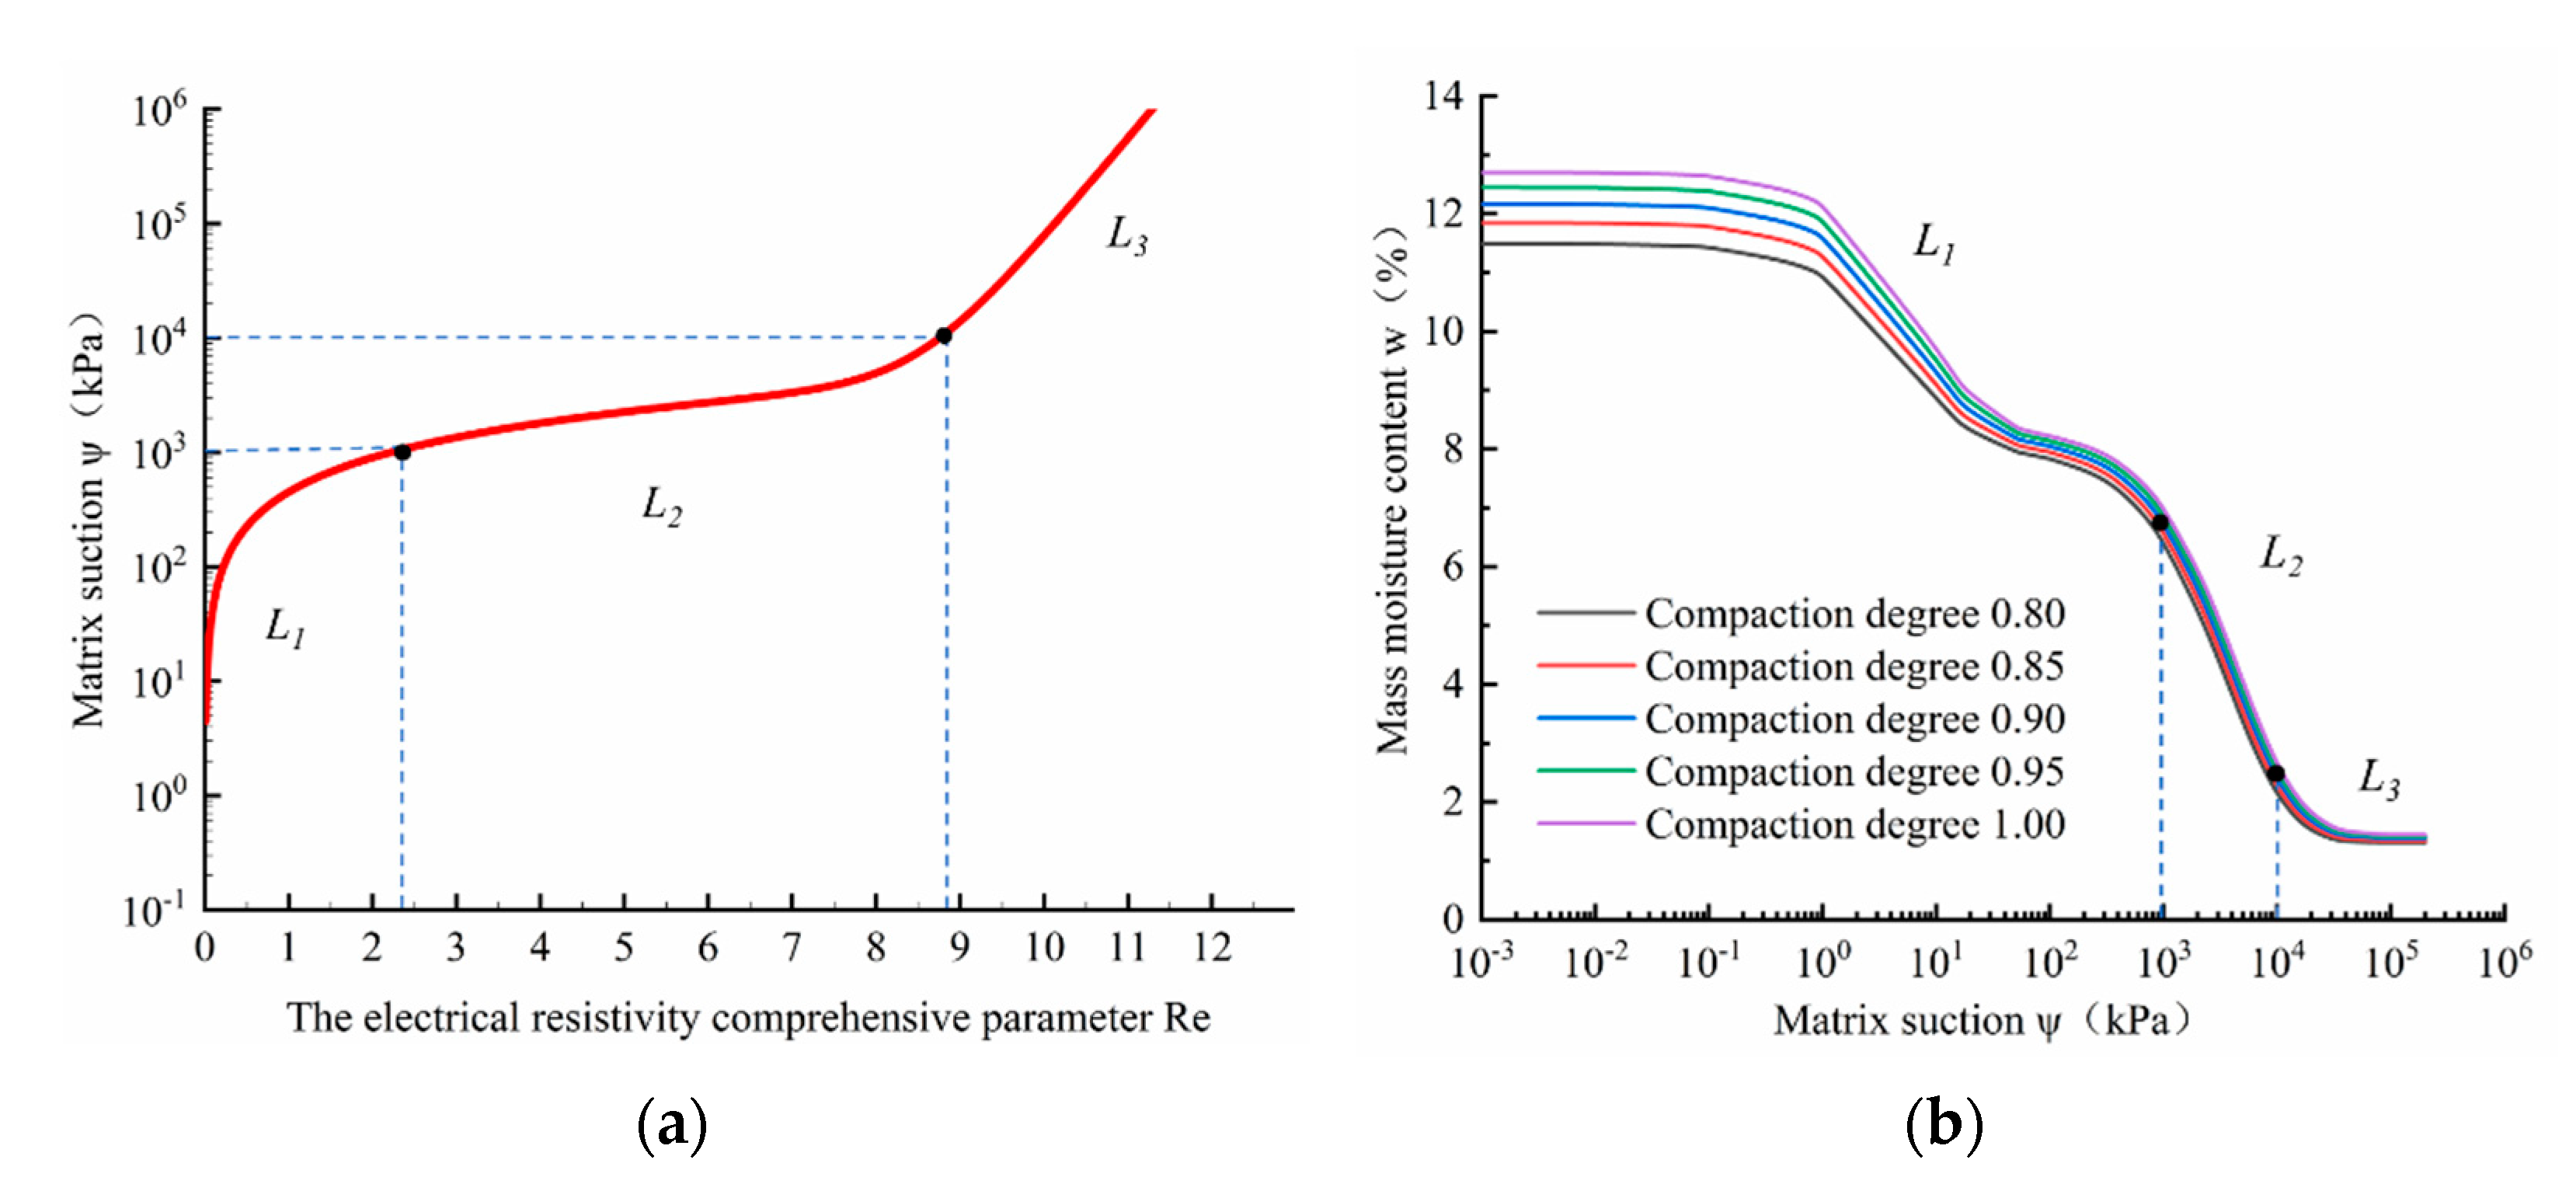
According to the trend of the - curve, the curve can be divided into three segments: with the increase in, the order is , and ; at the intersection of and is 1000 kPa, and ψ at the intersection of and is 10,000 kPa, as shown in Figure 9a. By fitting the measured mass moisture content and matrix suction, combined with the previous analysis of the SWCC curve, it can be found that when 1000 ≤ < 10,000 kPa, the SWCC curve is exactly the oblique part of the small pore, that is, the stage when the drainage of the large pores in the soil has been completed and the small pores are about to start draining in large quantities. The SWCC curve is divided into the three segments , and by using the points corresponding to at 1000 kPa and 10,000 kPa, respectively, as shown in Figure 9b.
As can be seen in Figure 9, reflects the entire large pore drainage phase of the - relationship curve; at this stage, the water discharged from the large pores is about half of the total, and the moisture content of the soil at this time is higher, so the reflecting the electrical resistivity characteristics takes a low value, approximately equal to 2. reflects the large-scale drainage stage of the small pores of the - relationship curve; in this stage, the water discharged from small pores is about the same as that from large pores, but the increment of is about four times that of , which shows that increases with the decrease in , and the rate of increase increases accordingly. reflects the unsaturated residual phase of the SWCC curve; in this phase, the weak decrease in the moisture content of the soil increases the and rapidly, and the rate of increase exceeds that of the phase. Overall, the matrix suction and electrical resistivity keep increasing as the water in the soil decreases, and the lower the moisture content of the soil, the higher the corresponding growth rate of matrix suction and electrical resistivity.
In general, it is seen from Figure 9a,b that the pore structure and water content are the main factors affecting electrical resistivity and matrix suction. Additionally, the change in pore structure and the increase in water content during the water absorption process are the main reasons for this phenomenon. However, further research is needed on the change in pore structure of soil-rock mixtures during water absorption; this problem will be further studied from the perspective of meso-structure in future studies.
4.4. Parameter Sensitivity Analysis of - Model
As shown in Figure 10, the model parameters are = 0.0001, = 2. = 0.8, = −400, and the control variable method is used to plot - curves under the influence of each parameter.
From Figure 10a, it can be seen that when the substrate suction is less than 1000 kPa, the parameter takes different values of the curves to overlap, and the change in has no effect on the segment curves. In the segment, the slope of - is constant, and with the change in , the left and right shifts. It can be seen that the change in parameter affects the horizontal width of the segment of the curve; when increases, the horizontal width of the segment decreases.
From Figure 10b, it can be seen that when the substrate suction is less than 1000 kPa, the curves of different parameter values coincide and the change in has no effect on the segment curves. When is greater than 1000 kPa, the parameter changes affect the curves of the and segments, and with the increase in , the horizontal width of the segment decreases and the slope of the segment increases.
From Figure 10c, it can be seen that with the increase in , the - curve in the the segment is shifted upward, and the shifted curves keep overlapping toward the starting and ending directions. Therefore, the change in parameter has an impact on , and but it mainly affects the height of , and the degree of influence gradually decreases toward the two ends of the curve.
Through this experimental study, the mathematical model of the matrix suction- electrical resistivity comprehensive parameter (-) of soil-rock mixture was developed, and the results can be applied to hidden danger detection and quality evaluations in geotechnical engineering. However, from the fitting of the -model to the experimental data, the points with larger matrix suction were concentrated near the model curve, while the points with smaller matrix suction were distributed and more scattered, and the application of the model was not perfect. This problem can be studied further in the future.
5. Conclusions
Taking the typical mudstone in the Chongqing area as the research object, a soil-water characteristic- electrical resistivity synergistic test device was designed, and matrix suction, moisture content, and electrical resistivity tests were conducted to investigate the relationship between matrix suction and electrical resistivity of soil-rock mixtures. The following conclusions were drawn.
(1) The soil-water characteristic curve of the soil–stone mixture showed a double-step shape. The shapes of the curve under different compaction degrees were similar. Under the same suction conditions, the mass moisture content of the soil-rock mixture increased with the increase in compaction degree; under the same mass moisture content conditions, the matrix suction of the soil-rock mixture increased with the increase in compaction degree.
(2) There was a significant linear relationship between the electrical resistivity comprehensive parameter and the electrical resistivity of the soil-rock mixture, and the electrical resistivity comprehensive parameter could represent the electrical resistivity characteristics of the soil.
(3) The performance of the matrix suction- electrical resistivity comprehensive parameter model showed good consistency with the experimental data, and the model curve was able to reflect the drainage process of pore spaces in the soil for soil-rock mixtures with a bimodal pore size distribution, thus providing a new way to measure the matrix suction of unsaturated soil-rock mixtures in practical engineering.
Author Contributions
Conceptualization, K.W.; Data curation, X.L.; Funding acquisition, K.W.; Investigation, K.W.; Methodology, K.W.; Visualization, K.W.; Writing—original draft, Z.X.; Writing—review and editing, Z.X. All authors have read and agreed to the published version of the manuscript.
Funding
The authors gratefully acknowledge the financial support from the National Natural Science Foundation of China (Grant No. 51879017) and Chongqing Research Program of Basic Research and Frontier Technology (Grant No. cstc2017jcyjBX0066).
Institutional Review Board Statement
Not applicable.
Informed Consent Statement
Not applicable.
Data Availability Statement
The data used to support the findings of this study are available from the corresponding author upon request.
Conflicts of Interest
The authors declare no conflict of interest.
References
- Zhai, Q.; Rahardjo, H.; Satyanaga, A. Priono Effect of bimodal soil-water characteristic curve on the estimation of permeability function. Eng. Geol. 2017, 230, 142–151. [Google Scholar] [CrossRef]
- Cao, J.; Jung, J.; Song, X.; Bate, B. On the soil water characteristic curves of poorly graded granular materials in aqueous polymer solutions. Acta Geotech. 2017, 13, 103–116. [Google Scholar] [CrossRef]
- Hosseini Balam, N.; Mostofinejad, D.; Eftekhar, M. Effects of bacterial remediation on compressive strength, water absorption, and chloride permeability of lightweight aggregate concrete. Constr. Build. Mater. 2017, 145, 107–116. [Google Scholar] [CrossRef]
- De Sarno, D.; Vitale, E.; Deneele, D.; Nicotera, M.V.; Papa, R.; Russo, G.; Urciuoli, G. Effects of cement and foam addition on chemo-mechanical behaviour of lightweight cemented soil (LWCS). E3S Web Conf. 2019, 92, 11006. [Google Scholar] [CrossRef]
- Hedayati, M.; Ahmed, A.; Hossain, M.; Hossain, J.; Sapkota, A. Evaluation and comparison of in-situ soil water characteristics curve with laboratory SWCC curve. Transp. Geotech. 2020, 23, 100351. [Google Scholar] [CrossRef]
- Wang, Y.; Zhang, A.; Ren, W.; Niu, L. Study on the soil water characteristic curve and its fitting model of Ili loess with high level of soluble salts. J. Hydrol. 2019, 578, 124067. [Google Scholar] [CrossRef]
- Alowaisy, A.; Yasufuku, N.; Ishikura, R.; Hatakeyama, M.; Kyono, S. Continuous pressurization method for a rapid determination of the soil water characteristics curve for remolded and undisturbed cohesionless soils. Soils Found. 2020, 60, 634–647. [Google Scholar] [CrossRef]
- Ren, X.; Kang, J.; Ren, J.; Chen, X.; Zhang, M. A method for estimating soil water characteristic curve with limited experimental data. Geoderma 2019, 360, 114013. [Google Scholar] [CrossRef]
- Ridley, A.M.; Dineen, K.; Burland, J.B.; Vaughan, P.R. Soil matrix suction: Some examples of its measurement and application in geotechnical engineering. Géotechnique 2003, 53, 241–253. [Google Scholar] [CrossRef]
- Wang, X.-Q.; Xie, N.i.; Zou, W.e.i.-l.i.e.; Luo, Y.-D.; Liu, W. Field trial for characteristics of matrix suction and infiltration of slope of unsaturated subgrade under artificial rainfall. Wuhan Ligong Daxue Xuebao/J. Wuhan Univ. Technol. 2010, 32, 107–110. [Google Scholar]
- Jeng, C.-J.; Lin, T.-A. A Case Study on the in-situ Matrix Suction Monitoring and Undisturbed-Sample Laboratory Test for the Unsaturated Colluvium Slope. Soils Found. 2011, 51, 321–331. [Google Scholar] [CrossRef] [Green Version]
- Leong, E.; Lee, C.; Low, K.S. An Active Control System for Matric Suction Measurement. Soils Found. 2009, 49, 807–811. [Google Scholar] [CrossRef] [Green Version]
- Suwal, L.P.; Kuwano, R. Triaxial apparatus equipped with elastic waves and matric suction measurement techniques. Soils Found. 2018, 58, 1553–1562. [Google Scholar] [CrossRef]
- Di Maio, R.; Piegari, E.; Todero, G.; Fabbrocino, S. A combined use of Archie and van Genuchten models for predicting hydraulic conductivity of unsaturated pyroclastic soils. J. Appl. Geophys. 2015, 112, 249–255. [Google Scholar] [CrossRef]
- Lee, H.; Lee, J.-W.; Oh, T.-M. Permeability evaluation for artificial single rock fracture according to geometric aperture variation using electrical resistivity. J. Rock Mech. Geotech. Eng. 2021, 13, 787–797. [Google Scholar] [CrossRef]
- Merritt, A.; Chambers, J.; Wilkinson, P.; West, L.; Murphy, W.; Gunn, D.; Uhlemann, S. Measurement and modelling of moisture—electrical resistivity relationship of fine-grained unsaturated soils and electrical anisotropy. J. Appl. Geophys. 2016, 124, 155–165. [Google Scholar] [CrossRef] [Green Version]
- de Cássia Goulart Ferreira, Q.; de Almeida Prado Bacellar, L.; Moreira Viana, J.H. Evaluation of soil moisture by electrical resistivity in Oxisols of the central Brazilian savanna. Geoderma Reg. 2021, 26, e00408. [Google Scholar] [CrossRef]
- Loke, M.; Chambers, J.; Rucker, D.; Kuras, O.; Wilkinson, P. Recent developments in the direct-current geoelectrical imaging method. J. Appl. Geophys. 2013, 95, 135–156. [Google Scholar] [CrossRef]
- Chambers, J.E.; Gunn, D.A.; Wilkinson, P.B.; Meldrum, P.I.; Haslam, E.; Holyoake, S.; Kirkham, M.; Kuras, O.; Merritt, A.; Wragg, J. 4D electrical resistivity tomography monitoring of soil moisture dynamics in an operational railway embankment. Near Surf. Geophys. 2012, 12, 61–72. [Google Scholar] [CrossRef] [Green Version]
- Brunet, P.; Clement, R.; Bouvier, C. Monitoring soil water content and deficit using Electrical Resistivity Tomography (ERT)—A case study in the Cevennes area, France. J. Hydrol. 2010, 380, 146–153. [Google Scholar] [CrossRef]
- Supper, R.; Ottowitz, D.; Jochum, B.; Kim, J.H.; Römer, A.; Baron, I.; Pfeiler, S.; Lovisolo, M.; Gruber, S.; Vecchiotti, F. Geoelectrical monitoring: An innovative method to supplement landslide surveillance and early warning. Near Surf. Geophys. 2013, 12, 133–150. [Google Scholar] [CrossRef] [Green Version]
- Ma S-k Huang M-s Hu, P.; Yang, C. Soil-water characteristics and shear strength in constant water content triaxial tests on Yunnan red clay. J. Cent. South Univ. 2013, 20, 1412–1419. [Google Scholar]
- Jiang, Y.; Chen, W.; Wang, G.; Sun, G.; Zhang, F. Influence of initial dry density and water content on the soil-water characteristic curve and suction stress of a reconstituted loess soil. Bull. Int. Assoc. Eng. Geol. 2016, 76, 1085–1095. [Google Scholar] [CrossRef]
- Su, Y.; Cui, Y.-J.; Dupla, J.-C.; Canou, J. Soil-water retention behaviour of fine/coarse soil mixture with varying coarse grain contents and fine soil dry densities. Can. Geotech. J. 2021. [Google Scholar] [CrossRef]
- Shan, P.; Lai, X. Mesoscopic structure PFC∼2D model of soil rock mixture based on digital image. J. Vis. Commun. Image Represent. 2019, 58, 407–415. [Google Scholar] [CrossRef]
- Feng, H.P.; Ma, D.L.; Wang, Z.P.; Chang, J.M. Measurement of resistivity of unsaturated soils using van der Pauw method [J]. Chin. J. Geotech. Eng. 2017, 39, 690–696. [Google Scholar]
- ASTM D5298-10, Standard Test Method for Measurement of Soil Potential (Suction) Using Filter Paper. ASTM International: West Conshohocken, PA, USA, 2010. Available online: www.astm.org (accessed on 8 September 2021).
- Sun, D.; Zhang, J.; Song, G. Experimental Study of Soil-Water Characteristic Curve of Chlorine Saline Soil. Rock Soil Mech. 2013, 34, 955–960. [Google Scholar]
- Bao, D.; Yu, Y.; Yang, K. Study on Soil-Water Characteristic Curve of Salt-Bearing Red Bed Mudstone in Lanzhou Area. J. Lanzhou Jiaotong Univ. 2019, 38, 25–34. [Google Scholar]
- Cai, G.; Liu, Y.; Xu, R.; Li, J.; Zhao, C. Experimental Investigation For Soil-Water Characteristic Curve Of Red Clay In Full Suction Range. Chin. J. Geotech. Eng. 2019, 41, 13–16. [Google Scholar]
- Huang, K.; Wan, J.; Chen, G.; Zeng, Y. Testing Study Of Relationship Between Water Content And Shear Strength Of Unsaturated Soils. Rock Soil Mech. 2012, 33, 2600–2604. [Google Scholar]
- Zha, F.; Liu, S.; Du, Y.; Cui, K. Prediction Of Matric Suction Of Unsaturated Soil Based On Electrical Resistivity. Rock Soil Mech. 2010, 31, 1003–1008. [Google Scholar]
Figure 1.
Schematic diagram of the test setup.

Figure 2.
Grading curve of soil-rock mixture.

Figure 3.
Sandstone specimen. (a) Substrate suction test; (b) electrical resistivity test.

Figure 4.
Soil–water characteristic surface.

Figure 5.
Soil–water characteristic curve.

Figure 6.
ψ-ρ relationship diagram.

Figure 7.
Fitting relationship.

Figure 8.
Fitting curve.

Figure 9.
Schematic diagram of the segmentation. (a) relationship diagram; (b) SWCC.

Figure 10.
Sensitivity analysis of model parameters. (a) Parameter . (b) Parameter (c) Parameter .


Table 1.
Target value of compaction test.
| NO. | Target Compaction | Target Mass Moisture Content (%) |
| 1 | 0.85 | 3.0 |
| 4.0 | ||
| 5.0 | ||
| 6.5 | ||
| 7.0 | ||
| 7.5 | ||
| 8.0 | ||
| 9.0 | ||
| 10.0 | ||
| 2 | 0.9 | 3.0 |
| 4.0 | ||
| 5.0 | ||
| 6.5 | ||
| 7.0 | ||
| 7.5 | ||
| 8.0 | ||
| 9.0 | ||
| 10.0 | ||
| 3 | 0.95 | 3.0 |
| 4.0 | ||
| 5.0 | ||
| 6.5 | ||
| 7.0 | ||
| 7.5 | ||
| 8.0 | ||
| 9.0 | ||
| 10.0 |
Table 2.
- Fitting statistics.
| Fitting Parameters | Fitted Value | RMSE | R2 | Adjusted R-Square | Fitting State |
|---|---|---|---|---|---|
| 1.37 × 10⁻⁴ | 1.84 × 10⁻⁴ | 0.9681 | 0.96731 | Success | |
| 2.01025 | 0.12729 | ||||
| −450.3301 | 60.63361 |
Publisher’s Note: MDPI stays neutral with regard to jurisdictional claims in published maps and institutional affiliations. |
© 2021 by the authors. Licensee MDPI, Basel, Switzerland. This article is an open access article distributed under the terms and conditions of the Creative Commons Attribution (CC BY) license (https://creativecommons.org/licenses/by/4.0/).
Share and Cite
MDPI and ACS Style
Wang, K.; Xia, Z.; Li, X. Matrix Suction Evaluation of Soil-Rock Mixture Based on Electrical Resistivity. Water 2021, 13, 2937. https://doi.org/10.3390/w13202937
AMA Style
Wang K, Xia Z, Li X. Matrix Suction Evaluation of Soil-Rock Mixture Based on Electrical Resistivity. Water. 2021; 13(20):2937. https://doi.org/10.3390/w13202937
Chicago/Turabian StyleWang, Kui, Zhengting Xia, and Xue Li. 2021. "Matrix Suction Evaluation of Soil-Rock Mixture Based on Electrical Resistivity" Water 13, no. 20: 2937. https://doi.org/10.3390/w13202937
Note that from the first issue of 2016, this journal uses article numbers instead of page numbers. See further details here.