
Resilience Assessment and Critical Point Identification for Urban Water Supply Systems under Uncertain Scenarios


1
School of Management Engineering, Qingdao University of Technology, Qingdao 266520, China
2
Tongji University Sustainable Development and New-Type Urbanization Think-Tank, Shanghai 200092, China
*
Authors to whom correspondence should be addressed.
Water 2021, 13(20), 2939; https://doi.org/10.3390/w13202939
Submission received: 10 August 2021
/
Revised: 15 October 2021
/
Accepted: 15 October 2021
/
Published: 19 October 2021
(This article belongs to the Section Urban Water Management)
Abstract
:The urban water supply system environment is becoming more complicated and unpredictable than ever before in the context of global climate change and expanding urbanization. Existing studies have adopted either static or dynamic approaches to assess the resilience of water supply systems without combining the two. Previous literature mostly establishes rigid quantitative metrics for resilience assessment, often without depicting the dynamics and adaptability of system resilience. For example, these studies usually fail to provide a critical point for identifying system resilience. To accurately describe the dynamics and adaptability of water supply system resilience under uncertain scenarios, in this study, we constructed a comprehensive framework based on the qualitative assessment of the input parameters, combining static and dynamic assessment, with the latter playing a dominant role based on the system perspective of pressure-state-influence-response. Taking Qingdao as a case study, we combined this framework with the system resilience theory, and statically assessed the five types of capitals and three attributes of resilience with the capital portfolio approach (CPA). Then, we dynamically assessed the resilience of urban water supply systems and identified critical points with the dynamic socio-technical model coupled with system resilience and the fitting analysis method. The results are as follows: (1) the static assessment results demonstrate an imbalanced development in the levels of the five types of capitals (financial capital, management efficiency, infrastructure, available water resources, and adaptation) and three attributes (robustness, recoverability, and adaptability) in the water supply systems of Qingdao. (2) The dynamic assessment results show that the current resilience trajectory of the water supply systems in Qingdao is that of a city in transition. (3) The fitting analysis shows that robustness (RB) has a linear relationship with resilience, recoverability (RE) has a non-linear relationship with resilience, and the critical points are RB = 0.70 and RE = 1.20. The research findings provide a reference for studying resilience mechanisms, internal attribute relationships, and resilience enhancement measures of urban water supply systems.
1. Introduction
The current scientific consensus is that, under the background of global climate change and rapid urbanization, the future of extreme weather events (for example, extreme temperature, continuous drought, extreme rainfall) may increase in intensity and frequency in the urban environment, becoming unprecedentedly complex and uncertain. As such, the water sector should assess the safety and resilience of urban water supply systems under multiple simultaneous extreme events [1,2,3,4]. Coastal urban water supply systems are not only faced with the huge internal pressure of population growth, but also with increasing external disturbance events, such as seawater intrusion, saltwater intrusion, and storm surges. During extreme climate events, a variety of compound and superimposed disturbance events aggravate the security of urban water supply facilities [5]. The excessive groundwater extraction in many coastal cities due to insufficient surface freshwater resources has led to ground subsidence, and water quality is susceptible to seawater intrusion, which further deteriorates urban water supply security [6]. For example, California’s coastal aquifers are already under pressure due to excessive water extraction and sustained and severe drought. The main cause of the saltwater invasion of the freshwater aquifers in the coastal California region is groundwater overruns, especially in Southern California. A clear example of complex interactions on the urban scale is the issue of land subsidence. The over-abstraction of ground water in many coastal cities, most notably Jakarta, causes subsidence, resulting in increasing coastal, fluvial, and pluvial flood hazards, and water quality is affected through saline intrusion. Lack of good-quality surface water, inadequate investments in and governance of water supply, and poor enforcement of ground water pumping contribute to worsening urban water security [7]. Therefore, coastal urban water managers need to consider a variety of event scenarios to be able to analyze and evaluate the safety and resilience of urban water supply systems under complex and variable extreme scenarios in the future.
Cubillo and Martinez-Codina [8] used the resilience curve to quantitatively assess the resilience of urban water supply systems under drought, pipeline fracture, and water pollution. Balaei et al. [9] found that the resilience index of water supply systems is a comprehensive index, which should include the technical, organizational, social, economic, and environmental dimensions that may affect the system performance under natural disasters. Joannou et al. [10] applied the SOS model to the resilience assessment of a water supply network during floods, identified the vulnerable parts of the system, and discussed the adaptive capacity of the water sector from multiple perspectives. Rehak et al. [11,12] argued that the resilience of critical infrastructure systems is determined in two basic areas: technical and physical protection and organizational management. The system resilience of the former is called technical resilience, which is determined by the robustness and recoverability of system elements. The latter is called organizational resilience and relates to the ability of system elements to adapt to changes. According to the study by Krueger et al. [13], the security resilience of a water supply system refers to its dynamic behavior in response to shocks. Dynamic responses require several kinds of interacting capital, whereas the actions taken by human participants are considered adaptive management that mobilizes available capital through capital robustness.
Zhao et al. [14] studied the recovery strategy of water supply systems under sudden water pollution events and established a model for the optimization and selection of the recovery strategy. The findings show that reasonable strategy optimization and selection can effectively shorten the emergency recovery time and improve the recovery capacity of a water supply system. Li et al. [15] constructed a lifeline system resilience assessment system with two dimensions, technology and organization, and comprehensively assessed urban water supply network resilience in these two dimensions under earthquake disasters. Liu and Huang [16] constructed an index system for evaluating the resilience of urban water supply systems, reflecting three dimensions of the system: absorptive capacity, adaptive capacity, and recovery capacity, and visually assessed the resilience of the water supply system using GIS. Liu et al. [17] evaluated the resilience of the water supply system of Qingdao, China, under the situations of flood and drought, and described an improvement strategy.
International scholars have studied the resilience of urban water supply systems. Since 2016, the number of studies and cited frequency in the relevant literature have increased rapidly. The static assessment method, based on the comprehensive assessment index of resilience, and the dynamic assessment method, based on the dynamic curve of resilience, have been used. The related research has mainly focused on environmental science and ecology, water resources, engineering, and science and technology, with few studies in the field of urban research. Related domestic research started later, and most of this literature is in the preliminary, theoretical stage. The number of studies is small; primarily single assessment methods have been used; the assessment index is rigid, with a single-dimension focus; the assessment model is difficult to apply in practice; and empirical research is rare.
At present, regarding the study of risk and uncertainty scenarios, most of the literature mainly establishes a quantitative index of rigidity for resilience assessment, and the assessment method is relatively simple. If an index value corresponds to a specific resilience value, the index is defined as a rigid index. The resilience of the system varies with a rigid index. If the index value changes within a certain range, the system resilience performance is the same, and the index is defined as a soft index. For example, the parameters of water supply system collapse studied in this paper are not unique.
Rigid and soft indexes are proposed for the first time in this paper. No definitions of the above indexes exist in prior studies, so there is no relevant reference. Therefore, enriching the connotation of the two concepts is the focus and difficulty of our future research. As an example of a rigid index, Bruneau et al. [18] constructed a resilience curve function where the system resilience varies over time and each specific time point has a specific resilience value. Due to the interdependency and complexity of the connections amongst subsystems in the water supply system, rigid quantitative indexes usually cannot accurately describe the dynamics and adaptability of socio-technical systems, which are crucial to the recovery of system performance [19]. If resilience is defined in terms of performance, resilience is not just something that the system has, but something that the system can become. That is, resilience is not a capability, but a responsive behavior. In general, the term socio-technical refers to the interaction between the social and technical aspects of a system. As a result of the interaction between society and technology, the system exhibits resilient behavior. The rigidity quantification index can express the current state of system resilience but cannot describe the relationship between system resilience properties. A simple linear relationship exists between the rigidity quantization index and resilience, with a complex relationship between resilience and indexes composed of linearity and nonlinearity [20]. Therefore, based on the perspective of the pressure → state → influence → response system, we explored and established a comprehensive assessment framework that combines static and dynamic aspects and focuses on dynamic assessment. This framework combines system resilience theory; we selected the coastal city of Qingdao as the research object and used the capital portfolio approach (CPA) to evaluate the five types of capital and three attributes of resilience. Furthermore, based on the results of CPA analysis, the resilience of the urban water supply system under uncertain scenarios was dynamically evaluated using the socio-technical coupled dynamic model of system resilience. We identified and analyzed the critical points of resilience improvement to provide a reference for decision-making on the sustainability of water supply management in water utilities.
2. Research Methods and Data Sources
2.1. The Concept of a Water Supply System and the Definition of Resilience
Water supply systems are one of the critical infrastructures responsible for the production and distribution of water fit for human consumption, that is, the volume, quality, and pressure of water to meet the end users’ needs. A water supply system usually consists of one or more water sources, water treatment plants, and large water supply and distribution networks. A schematic of a water supply system is shown in Figure 1. The system consists of two parts: water production and water distribution. The production of drinking water includes from the water inlet to the water outlet of the waterworks; drinking water distribution includes the distribution networks and storage tanks [21]. This definition means that the resilience of a water supply system can be considered individually for each subsystem (production or distribution) or as a whole.
In the first subsystem, the potable water system draws water directly from available sources, such as surface sources (rivers, lakes, streams, or natural springs), groundwater, or reservoirs. When local surface water sources are exposed to the external environment, they are vulnerable to hydrometeorological events or water pollution events.
The second subsystem starts with the effluent from the waterworks and ends with the delivery of drinking water to the end consumers. The completion of the water distribution task mainly depends on the underground water distribution network, which is less likely to be directly affected by hydrometeorological events but is susceptible to earthquakes. A sudden shock will lead to the dislocation and fracture of the pipeline, and power failure of the pump station, which will lead to the failure of the system’s functioning.
Due to different research perspectives, a clear definition of water supply system resilience is lacking. Prior studies mainly defined system resilience based on the following two perspectives: capability and response. From the perspective of resilience capability, Balaei et al. [9] stated that water system resilience refers to the performance of a water supply system after a disaster and the service capacity during post-disaster recovery. Indexes of resilience are relevant to society, economy, environment, technology, and organization. The final composite resilience index is obtained by summarizing the weights of the indexes. Rehak et al. [12] acknowledged that system resilience is identified in two basic areas: technology and organizational management. The system resilience of the former is called technical resilience, which is determined by the robustness and recoverability of system elements. The latter is called organizational resilience and is related to the ability of system elements to adapt to changes. The comprehensive resilience index is obtained by nonlinear aggregation of point, line, and plane infrastructure elements. The research perspective and methods of Xu et al. [22] and Behboudian et al. [23] are similar to the above research. Based on the perspective of dynamic response, Tantri and Amir [24], Vazquez et al. [25], and Krueger [13] defined system resilience as dynamic response behavior to shocks from a socio-technical perspective. Therefore, in this paper, the resilience of an urban water supply system is defined as the dynamic response of a system to shocks to maintain its service level within an acceptable range through timely and effective use of available capital under uncertain interference conditions.
2.2. Research Theory and Framework
Over time, a number of social, political, economic, and environmental drivers have adapted and transformed the resilience of urban water supply systems. Brown et al. [26] proposed a framework to understand how urban water management in cities generally transitions when moving toward sustainable urban water conditions. They distinguished between six subsequent stages in the urban water management transitions framework: the water supply city (water supply access and security), the sewered city (public health protection), the drained city (flood protection), the waterways city (social amenity and environment protection), the water cycle city (limits on resources), and the water-sensitive city (intergenerational equity and resilience to climate change). Daniell [27] likewise argued that in urban water systems, over time, a number of key water system management objectives have been linked to social values, the equivalent of the desired indicators of a system state that have driven transitions to different configurations of water systems that are designed to provide specific types of service delivery functions. These water system management objectives and resultant changes in idealized urban water system types have been produced as a result of a number of socio-economic, environmental, and governance-related drivers. In order to understand the complexity and time dimension of urban water supply resilience, we analyzed the resilience from the system dynamic perspective of pressure → state → influence → response [28]. For pressure in urban areas, the drivers affecting water supply systems are mainly internal and external pressures. State is mainly related to water quality, water quantity, and water distribution infrastructure. Influence represents the number of people with adequate water supplies or water services. Response comprises the adaptive measures (including adaptive and emergency measures) taken by water managers to reduce disruptive pressures, improve the functioning of the water supply system, and reduce the negative impact of system failures on water services and functions. The research framework is shown in Figure 2.
2.3. Static Assessment Model: Capital Portfolio Approach (CPA)
Developed and applied by Krueger et al. [29], the CPA includes public services provided by the main body of municipal management, as well as total services composed of public services and community adaptation generated by inadequate services. Based on the CPA method and social-technological system theory [30], we defined and classified five types of capital from the perspective of the water supply management subject:
- Financial resources (financial capital (F)), including the costs of adaptation measures in the water sector, such as the construction, operation, and maintenance of water supply systems, and the financial costs of expanding infrastructure;
- Managerial efficiency (political capital (P)), which is used to support the stable operation of the water supply system and maintain the system’s water service capacity;
- Infrastructure (physical capital (I)) for the storage, treatment, and distribution of potable water to the target;
- Available water resources (natural capital (W)), including the total amount of water that is naturally available: collected rainwater, recycled water, and desalinated water;
- Organizational adaptation (social capital (A)), measures taken by managers in response to disruptive events resulting in inadequate water services.
The first four items of capital are required by the technical system, and the fifth item is required by the social system. The technical capital required for water service is calculated as RPtech = {F, P, I, W}, and the total capital required for service is calculated as RPtotal = {F, P, I, W, A}.
We used four attributes to measure system resilience: robustness, recoverability (technical resilience), adaptability (organizational resilience), and risk. The unweighted harmonic mean or arithmetic mean was used for index aggregation [31]. The specific calculation of each attribute was as follows [12,13]: technical services do not contain organizational adaptation, whereas total services contain organizational adaptation.
Total service robustness was calculated as RBtotal = {FRB, PRB, IRB, WRB, ARB}, and technical service robustness was calculated as RBtech = {FRB, PRB, IRB, WRB}.
Recoverability was determined by the availability of various kinds of capital, that is, the number of operational infrastructure elements and the number of available resources were the basis for the implementation of recovery [32], so capital availability was used to represent recoverability in this paper. Total recoverable service was calculated as REtotal = {FRE, PRE, IRE, WRE, ARE} and the technical recoverable service was calculated as REtech = {FRE, PRE, IRE, WRE}.
Adaptability refers to the management in response to interference events, integrating various kinds of capital to restore the technical system to restore or improve the water supply service function. It represents the dynamic ability of the organization to adapt to environmental changes, Atotal = {ARB, ARE}.
Risk was considered as Risk = {RF, RP, RI, RW, RA}.
The robustness, recoverability, and risk of each capital were obtained by calculating the average score of the respective attributes.
Adaptability was formed from the aggregation of recoverability and robustness of organizational adaptation with the equation Atotal = 2/(ARB + ARE).
Total resilience was calculated as Total Resilience = 3/(1/RBtotal + 1/REtotal + 1/Atotal); robustness as (RBtotal) = (FRB + PRB + IRB + WRB + ARB)/5; recoverability as (REtotal) = REpublic + A; and adaptability as (Atotal) = 2/(ARB + ARE).
2.4. Dynamic Assessment Model: Dynamic Model of Coupled System
Klammler et al. [33] constructed a dynamic model of coupled social-technological systems, which represents two state variables: (1) critical service deficit, which represents the service or function that the technical system fails to provide to meet the requirements and (2) service management, which represents the adaptive capacity to manage the total resources available or social institutions to maintain and restore critical services. The above two variables show how different modeling parameters can lead to multiple system states, and how repeated random shock sequences can cause the system to shift from one state to another or force the system to collapse [34,35,36,37].
Service deficit Φ (0 ≤ Φ(t) ≤ 1) represents water service deficit. Service management Ω (0 ≤ Ω (t) ≤ 1) is the maintenance and recovery of critical services. The coupled system dynamics equations are shown in Equations (1) and (2).
The right side of Equation (1) corresponds to three key processes that drive the service deficit. The first term represents the gradual increase in Φ due to the growth in service demand and the gradual degradation of service. The second term is due to the first-order recovery: Φ gradually decreases. The third term is the dispersion increase in Φ caused by sudden shocks. Similarly, the right side of Equation (2) corresponds to the three key processes that affect service management: the first term indicates that Ω gradually increases due to the supply of Ω; the second term is the decrease in Ω due to the consumption of Ω; and the third term is the decrease in Ω dispersion due to the impact of buffering shock. ξ is a random external interference variable. The impact frequency obeys the Poisson distribution of the mean frequency λ, and the impact amplitude obeys the exponential distribution of the mean value α.
2.5. Calculation of Model Parameters
Service deficit, maintenance, and recovery of services were determined by the combination of robustness (RB) and recoverability (RE) parameters. We assumed that RP ≠ 0 in the urban system, and the parameters are described as follows.
Parameter b (the exponential growth rate of the service deficit in the absence of adaptation and shocks) is determined by two processes: demand growth and service degradation. Capital recoverability is required for demand growth, whereas capital robustness is required for service maintenance. As a result, the lack of capital makes it impossible for city managers to keep pace with the growth of demand, and the lack of robustness leads to a decline in service quality.
Efficiency coefficient ɑ, higher robustness, and recoverability lead to a more effective recovery of services.
Coupling parameter c1 determines the impact of service deficits on service management. Higher robustness and recoverability can mitigate the impact of service deficits on service management, so that Ω recoverability is limited in the absence of robustness.
The parameter r is the ratio of the consumption rate to the replenishment rate, corresponding to the maximum consumption rate. When the robustness and recoverability are low, the consumption of Ω is the highest. Therefore, the consumption rate r corresponds to the average missing value of robustness and recoverability.
Coupling parameter c2 indicates the direct impact of shocks on service management. The ability of service management to absorb shocks decreases with decreases in robustness and recoverability.
The scaling constant β represents the scale at which the decline in Ω begins to level off, that is, at a level of robustness.
When Ω reaches β, the non-unit coefficient n determines the steepness of service management transformation, a higher value of n leads to a steeper transformation around β, and a smaller value of n leads to a higher linearity of service management degradation. n indicates the effect of the rapid impact on Ω.
2.6. Setting Disturbance Variables
The influence of internal pressure on the system is realized by parameter b, as shown in Equation (3) above.
Random external disturbances are a combination of chronic and acute shock time series. The number of shocks follows the Poisson distribution of the average frequency (density) λ (1/T). The Poisson distribution is commonly used for shock modeling based on minimal information, as it only requires a single parameter (mean equals variance) and produces shock events that are uniformly distributed on average over time (totally random and independent). Furthermore, multiple dependent losses can be naturally modeled by assuming that all losses are related to one or more underlying Poisson shock processes [34]. The average impact amplitude α (-) is obtained from the exponential distribution of the impact amplitude relative to demand. The average frequency of chronic shock is shown in Equation (10).
where shock score is the sum of the total binary score of each risk type (occurrence probability = 1, exclusion probability = 0) divided by the sum of the total potential risks. The size of RBtech indicates the ability of the system to buffer shocks.
The average frequency of acute shock is shown in Equation (11).
2.7. Disturbance Mechanism
The scenarios that will face an urban water supply system are random, changeable, and have obvious spatio-temporal characteristics [38]. Risks can result from chronic (high frequency and low magnitude) or acute shocks (low frequency and high magnitude) [39]. To describe this highly uncertain scenario, the following random disturbance mechanism was applied for the resilience assessment of the system. According to Rasoulkhani [40], social-technological systems exhibit varying degrees of coupling when the system is subjected to the following two types of disturbances: (1) internal pressure, which refers to the system components being old or service demand growth, which leads to failure, for example, because of pipeline ageing, economic development, and population growth; and (2) external pressure, namely, random external interferences, which refers to a series of sudden, chronic, and random events with high probability and low shock, such as earthquakes, pipeline ruptures, and water quality pollution. In addition, acute, low-probability, high-shock impact events can occur, including earthquakes, droughts, and floods. The pressures on the system are shown in Figure 3.
2.8. Data Sources
Qingdao is located in the south of the Shandong Peninsula (Figure 4), bordering the Yellow Sea. Affected by global climate change, the ocean climate changes have become more prominent. Qingdao is subject to severe weather throughout the year, such as typhoons and heavy rains; especially during typhoons, the combination of wind, storms, and tides can lead to serious disasters. In recent years, a severe water supply crisis due to extreme weather has emerged. With the rapid development of the economy and society and the continuous increase in urbanization, water supply security has become the bottleneck factor restricting the sustainable development of economy and society in Qingdao. The data of this case were obtained from the Qingdao Water Resources Bulletin, Qingdao Statistical Yearbook, Qingdao Statistical Bulletin, Shandong Statistical Yearbook, China Urban Construction Statistical Yearbook, etc.
3. Results of Resilience Assessment
3.1. Results of Resilience Static Assessment
The five capital and resilience attribute combination processes are shown in Table 2.
The results of the five capital combinations of the Qingdao water supply system resilience are shown in Figure 5. In terms of capital robustness, financial and adaptation are high, whereas water resources, infrastructure, and management efficiency are low. In terms of capital resilience, financial and infrastructure are high, water resources are medium, and adaptive and management efficiency is low. In terms of risk, adaptation, infrastructure, and water resources are high, and financial and management efficiencies are low. The levels of robustness, recoverability, and risk internal capital are extremely uneven.
The aggregation results of the resilience attribute indicators are shown in Figure 6. The assessment results show that the total resilience index is 0.50. Overall, the technical resilience is high, but the organizational resilience is weak, indicating that the adaptive measures of the organization are insufficient. The recoverability of the three attributes is greater than the robustness, and the robustness is greater than the adaptability; the development of the three attributes is not balanced. High resilience and low adaptability indicate high resource availability, while the organization does not fully use its ability to actively adapt; in most cases, it adapts in response, because managers believe that the water service currently provided is acceptable.
3.2. Results of Resilience Dynamic Assessment
In order to further study the resilience dynamics, based on the static assessment results, the following variables were solved: (1) the equilibrium point (fixΩ and fixΦ) between Ω and Φ, indicating the balance between technical services and total services in the case study, was obtained. Equilibrium points are basins of system attraction, and in the absence of shocks, the system converges to these points. The closer the equilibrium point to the upper left corner of the phase diagram, the more stable the initial state of system resilience (the initial state level of system resilience). (2) The average value μ of Ω and Φ in the whole time series (the decrease in system performance after shock, robustness index) was obtained. (3) We determined travel through time utexΩ and utexΦ (system recovery time after shock and recovery speed indicator, respectively).As described, fixΦ is the equilibrium point of the service deficit of the coupled system, which is dynamic and varies with the magnitude of the external interference. If, under interference conditions, the system adaptability intervenes, the system equilibrium point moves to the top left area (phase diagram), and the system is more stable. The stronger the adaptation, the more the equilibrium point moves to the upper-left region. The equilibrium point can therefore represent adaptability. uΦ is the reduction in system performance after an impact: the smaller the reduction range, the stronger the resistance and the stronger the robustness, reflecting the robustness of the system robustness. utexΦ is the time required for system recovery after impact: the longer it takes to return to the initial performance level, the worse the system recovery. Recovery time was somewhat negatively correlated with recoverability. Numerical simulations of the above variable time series were performed by solving both Equations (1) and (2) using the MATLAB ordinary differential equation solver (ode45).
The input parameters of the coupled system dynamics model are shown in Table 3.
According to relevant literature [13,29], we obtained the values of the average impact: chronic impact αchronic = 0.03 and acute shock αacute = 0.2. The case study outputs are shown in Table 4.
We used multiple approaches that are well-known for the evaluation of complex system dynamics to examine the model simulations and assess coupled systems’ responses (time series of Ω and Φ) under stochastic shock regimes. First, we conducted stability analyses to investigate the presence of equilibrium points and system trajectories in direction fields and phase portraits [45] and to identify likely regime shifts (e.g., desirable, undesirable, or collapse) in performance. Second, we analyzed the simulation outputs in the time and frequency domains to generate empirical cumulative density functions (cdfs) for Ω and Φ for estimating various statistical moments (e.g., mean and variance). These cdfs enable estimation of the probability of undershooting certain thresholds set for service performance or adaptive capacity [46]. In addition, we examined threshold crossing times [47] to represent the mean duration of the system state below (or above) a given threshold.
According to the direction field and phase diagram in Figure 7a,b, it can be observed that for any initial condition except Ω = 0, the system always approximates to some equilibrium point (the intersection of zero lines). The slope change of two zero lines reflects that the service recovery is faster, but the adaptive recovery is slower. The black track line in Figure 7b shows the stability of the system state under the impact condition in the phase diagram. The black track line deviates far from the equilibrium point, indicating instability of the technical service system.
In Figure 7c, when t ≈ 75 and 97, large shocks make the service deficit close to one and considerably reduce the adaptive capacity of Ω ≈ 0.5. However, even with a subsequent impact of lesser strength, Ω and Φ begin to recover, but a larger impact occurs at t ≈ 119, further reducing service and adaptive capability. Compared with an impact of similar strength at t ≈ 75, the impact at t ≈ 119 occurs at a much lower adaptive capacity and results in a further decrease in Ω, which decreases to zero at t = 123.25. At this stage, the adaptive capacity Ω cannot be significantly recovered under a given shock condition, and a moderately large shock reduces the adaptive capacity to zero. The coupled system cannot recover from this situation (the system equilibrium point is unstable).
Figure 7c–e represents the time series of 100 time units before the system crashes (when Ω = 0 and Φ = 1), which further illustrates that when t = 80–90 and t = 100–110, the water service of the technical service system is limited to two consecutive times and its adaptability is poor (corresponding to the yellow circle in (Figure 7b). Similar to the final phase at collapse, this phase begins with an unusually strong shock (Figure 7c), followed by a series of shocks of shorter duration and lesser strength (Figure 7d). At t = 120, the system entered the collapse stage. At t = 123.25, the water supply system collapsed due to a sudden and unusually large shock (such as a large earthquake or severe water pollution event).
Under a random shock, compared with the technical service system, the total service system with increased adaptability did not collapse, and two strong shocks occurred at t = 968 and 982; the system recovered from both due to the adaptive measures implemented by the water management. The representative event was the severe droughts in Qingdao in 2011 and 2016. In order to alleviate the drought, the water supply department met 90% of the urban water consumption by diverting water from customers. Compared with Figure 7a and Figure 8b, the balance point of the system obviously moves to the security zone in the upper left corner (Ω = 1, Φ = 0). The tracks of Ω and Φ (black line) remain in a limited region near the equilibrium point, and the area in this region is significantly smaller than that in Figure 7b. The average state of the system (expressed as a yellow line indicating the moving average of Ωav and Φav) is also more stable, and the stability of the fixed point distance is closer. Figure 7f and Figure 8f show the cumulative probability value comparison results: uΩ and uΦ are above threshold Φth-above and below the threshold probability value Ωth-below, including Φth-above = 0.10, Ωth-below = 0.58 (Figure 8f) and Φth-above = 0.03, Ωth-below = 0.30 (Figure 7f). This also proves that the overall service system is more reliable.
Compared with the time series in Figure 7c and Figure 8c, the comparison of the resilience indicators of the total service system and technical service system shows that the total service system is more stable, and the system can recover to its original state through self-adaptation even in the face of unusually large shocks and a series of compound shocks of high frequency and low strength. It can be seen that implementing adaptive measures in the water sector can significantly improve the resilience of the system.
4. Results of Resilience Critical Points Identification
In order to identify the critical points of system resilience improvement, it was necessary to clarify the impact of the robustness and recoverability of the five capital items on the improvement in system resilience. The relationship between the robustness and recoverability and the resilience representative indexes fixΦ, uΦ, and utexΦ were analyzed separately.
4.1. Critical Point Identification of Robustness
The robustness of the five capital items is improved using the following methods: management efficiency is improved to the ideal state → management efficiency and infrastructure are improved to the ideal state → management efficiency, infrastructure, and water resources are improved to the ideal state → management efficiency, infrastructure, water resources, and adaptiveness are improved to the ideal state. Based on the results of the resilience dynamic model of the coupled system, the RB and fixΦ, uΦ, and utexΦ fitting analysis was obtained, as shown in Figure 9. RB and fixΦ, uΦ, and utexΦ are linear, increasing with capital robustness and decreasing proportionally to the resilience indicators associated with the service deficit, or a linear increase in resilience. From the slope of the three lines KuΦ > KfixΦ > KutexΦ, it can be seen that the sensitivity of the resilience index to capital robustness RB is uΦ > fixΦ > utexΦ. Golden section theory (0.618:1) and the initial level of the three lines suggest that the capital robustness level of 0.70 be set as the critical point of resilience improvement. For example, under the constraint of investment capital, the case study city water department can prioritize the improvements in management efficiency, infrastructure, and water resource robustness (RB = 0.70).
4.2. Critical Point Identification of Recoverability
The recoverability of the five capital types in increasing order is: finance to ideal state to financial and management efficiency to the ideal state → finance, management, efficiency, and infrastructure up to the ideal state → finance, management efficiency, infrastructure, and water up to the ideal state → finance, management efficiency, infrastructure, water, and adaptiveness to the ideal state. Based on the output results of the resilience dynamic model of the coupled system described above, the RE and fixΦ, uΦ, and utexΦ fitting analysis results were obtained, as shown in Figure 10. Figure 10 shows that RE and fixΦ, uΦ, and utexΦ have a nonlinear relationship (first-order exponential decay), the recoverable value is less than 1.20, the service deficit decay rate is fast, the recoverable value is more than 1.20, and the service deficit decay rate is basically flat. The recoverability value (1.20) is the critical point of resilience improvement. Rasoulkhani et al. [45] obtained a similar conclusion in their study: the water sector invests in adaptation under external pressure. When the level of capital investment is less than USD 2 billion, the resilience index increases rapidly and the marginal effect is obvious; when the level of capital investment is more than USD 2 billion, the growth rate of the resilience index slows significantly. Combined with the results of the case study in this paper, to improve the water supply system’s resilient behavior over a long time period, water managers should actively adapt rather than implement emergency response measures. Therefore, water managers need to actively seek the critical points of capital resilience and undertake corresponding adaptive behaviors accordingly. For example, the case study city can improve its financial, management efficiency, infrastructure, and water resource recoverability to an ideal state (RE = 1.20). In terms of the current state of Qingdao, the measures to improve the recoverability of capital involve improving the following management mechanisms or strategies (management efficiency):
- Communication protocol for sharing structured information;
- Feedback loop;
- Feedback loop mechanism for cross-department coordination;
- Training and training flexibility and sustainability innovation;
- Public participatory decision-making and management mechanism;
- Customer complaint tracking mechanism;
- Openness of government affairs;
- Flexible employing mechanism and perfect assessment and supervision mechanism;
- Urban and rural strategy;
- Transboundary agreements;
- Groundwater management mechanism;
- Surface water management mechanism.
4.3. Critical Point Identification of Resilience
There are 30 combinations of strategies for promoting capital robustness and recoverability. To simplify the calculation, the capital increase value is increased directly from zero to one. (Table 5).
The robustness, recoverability, and resilience indicators (fixΦ, uΦ, and utexΦ, respectively) together constitute a three-dimensional landscape of an improvement path, as shown in Figure 11a,b. From the upper-right area to the lower-left area, the resilience gradually increases, and the color changes from red to purple. The path landscape map shows a folding area in the figure and (0.70, 1.20, Z) is the critical point (red arrow) which is consistent with the results of the fitting analyses in Section 4.1 and Section 4.2 Beyond the critical point, the resilience growth of the system slows (dark blue and purple regions). In a 3D landscape diagram, countless improvement paths can theoretically exist. In the case study city, in combination with a resilience improvement strategy and strategy analysis, the management efficiency, infrastructure, robustness, and recoverability of water resources and finances can be improved to increase the recoverability to the ideal state; the resilience could be oriented toward the ideal path system (RB = 0.70, RE = 1.20).
5. Discussion
5.1. Discussion of Resilience Static Assessment Results
In terms of the types of capital, financial capital has high robustness and high recoverability, indicating that Qingdao has sufficient funds for the investment, construction, operation, and maintenance of the water supply infrastructure. In 2017, the general budget revenue of Qingdao’s local finance was RMB 115.7 billion, of which RMB 45.3 billion was invested in fixed assets: water conservancy, the environment, and public facilities management. The high recoverability and low robustness of the infrastructure indicate that the water sector can deliver most of the available urban water resources to all users in accordance with drinking water quality standards and requirements. However, it cannot ensure a continuous and high-quality water supply due to the ageing and nonregular maintenance of underground pipes and the lack of effective communication and coordination with other departments in emergency situations. In 2017, the penetration rate of water supply in Qingdao was 100%, and the water quality was strictly in accordance with the Hygienic Standard for Drinking Water (GB5749-2006). In order to further improve the water supply quality, the municipal government has invested more than RMB 600 million in the past three years to carry out the in-depth treatment and transformation of some water plants, and added international advanced water treatment technologies such as ozone-activated carbon and ultrafiltration membranes. The quality of the water supply is better than the national standard, and the annual qualified rate of water quality remains 100%.According to the Qingdao City Public Water Supply Emergency Plan (Qingdao Government Office (2015) 92) issued on 16 September 2015, the responsibilities of the Construction Bureau, Water Bureau, City Administration Bureau, and other departments after a water supply emergency are clearly defined, but fast and efficient communication amongst all departments is lacking. The high robustness and low recoverability of adaptiveness explain that water managers have more opportunities to have alternative available water sources and financial funds, but the degree of development and use of available capital is low. For example, Qingdao, being coastal, can make full use of desalination as one of the alternative water sources, but seawater desalination water supply currently only accounts for 8.6% of the total water supply. The high risk to water sources and infrastructure means that the city has a complex and volatile external environment: saltwater intrusion caused by rising sea levels; eroding underground water sources and pipelines; and storm surges, floods, and droughts constantly threatening water sources and water supply infrastructure.
Within the background of global climate change, Qingdao’s water supply system is facing an increasingly complex external environment. The rapid urbanization and the growing urban population are increasing the pressure on the water supply in Qingdao. Although GDP growth provided strong financial support for the city’s construction, the growth of industry and the expansion of cities have worsened the problem of water pollution. At present, the single water source and water supply infrastructure level obviously cannot meet the water demands of Qingdao. To ensure the safety of its water supply, Qingdao urgently needs to transform. The specific measures to be implemented include changing the concept of development, strengthening the protection of water resources, enhancing the resilience of the water ecological environment, adhering to the regional allocation of multiple water sources, increasing the intensity of passenger water diversion, fully developing local unconventional water sources, accelerating the construction of urban water supply infrastructure and transforming the old pipe network, promoting the equalization of urban and rural water supply security, and building an integrated urban and rural water supply system. The effects of these adaptations correspond to the items quantified in Table 2 in Section 2.1; for example, to strengthen water source protection, quantified through the water quality management level (water source and recoverability; Table 2), the specific quantitative standards are 1, monitoring; 2, emission regulations; 3, water source control and polluter payment treatment; and 4, preventive principles.
The initial metrics in the assessment framework were mainly obtained from relevant references [48,49,50,51,52,53,54,55,56]. For example, water resource robustness is estimated using, amongst others, metrics applied for country-scale water scarcity assessments [57,58,59]. They comprise storage flow ratio, external water dependence, water source connectivity, water quality management levels (1: monitoring, 2: discharge regulations, 3: water source control and polluter pays for treatment, and 4: precautionary principles) [60], water source diversity (1: one source, 2: one type of source, 3: two sources and types, and 4: multiple types).
5.2. Discussion of Resilience Dynamic Assessment Results
Without self-adaptability, Qingdao’s water supply system can recover by relying on its own robustness to small shocks (general tube burst accident, drought, etc.). However, in the event of a large shock, the water supply system broke down and a large area of water supply was interrupted. With the addition of an adaptive water supply system, the system can restore the water supply service level to the state prior to the interference through self-regulation, even in the event of an unusually strong shock, and the water supply system is relatively safe. Qingdao is a coastal city that is typically lacking water; in recent years, Qingdao has actively implemented adaptive measures to ensure the security of water supply, for example, in the 12th Five-Year period, Qingdao invested RMB 13.82 billion to construct three types of raw water supply: four lengthwise and three transverse pipe networks for distribution, the Qingdao three lines in the Qingdao Water Source Construction and Allocation 13th Five-Year Plan (2016) and Qingdao’s water security overall planning (2018).
The city, being in transition, is defined as a water supply system with no adaptiveness or inadequate adaptability, which is less impacted and can recover to its initial state by relying on its own robustness. However, due to a strong shock, the water supply system broke down and water supply safety accidents occurred. Given the adaptive behavior of the water supply system, under any shock, the system can return the initial state of water supply to ensure continuous and stable water supply. According to the coupled system model, cities in transition have obvious coupling shocks, and relatively frequent chronic and acute compound shocks reduce the robustness of the system (resulting in a large c2value), which has a significant impact on service management. Due to the strong coupling of critical service deficits and service management capabilities (c1after the shock; the recovery speed of the technical service system is slow and may eventually collapse). Based on the CPA assessment and model output results, we introduced four major categories of cities. Although there are no strict boundaries between groups and cities, there is a continuous decline in safety and resilience from low to high; we used these broad categories to facilitate outcome representation: (1) water-sustainable city, an ideal water-saving city, where the urban water system will not collapse under impacts, and the parts of the system are highly related (definition is similar to water-sensitive cities); (2) impact in all simulation operations, where water secure and resilient cities will fully recover; (3) water insecure and non-resilient cities, where technical services are impacted and adaptive total services collapse; and (4) cities in transition, where urban technical services collapse, and the total service system can recover. By studying different types of urban cases, we may find some correlation between the fixΦ, uΦ, and utexΦ metrics and urban interface division, which was the focus of the next step.
According to the simulation results of this case study, the resilience trajectory of Qingdao’s water supply system is categorized as a transition city, in a transition state between a city with high water security and high resilience and a city with low water security and low resilience. Robustness and recoverability are critical factors for improvement in the system resilience trajectory. According to the different degrees of robustness and recoverability, different methods can be used to explore the resilience trajectory of urban water supply systems, as shown in Figure 12. For cities lacking water security and resilience, the water sector cannot continuously and adequately provide water or conform to the drinking water quality standard due to the shortage of water resources, water supply infrastructure shortages or obsolete infrastructure, the lack of management ability, and increased water demand due to urban population growth. This type of urban water supply system has low robustness and low recoverability. Even if there is no acute external shock, the system may also experience the degradation of water service performance of the system (population growth, pipeline ageing, underinvestment, etc.) under the action of internal driving forces [38]. Water-secure and highly resilient urban water supply systems have high robustness and recoverability, which can absorb high-intensity interference, have a strong ability to reorganize to adapt to interference and can develop with interference while maintaining the necessary functions, and can automatically guide the adaptation path to a more ideal state. When a highly resilient system is subjected to strong interference, it not only has the ability to continue performing basic functions, but can also adapt to external changes, thus maintaining the sustainability of the system. The water supply system of a transition city has a strong coupling of service deficit and adaptive capacity, and the technical service system will collapse under the compound pressure of chronic and acute shocks. However, to solve the dilemma and complete the transformation, city managers are trying to improve the system through a series of adaptive resilience actions, for example, reforming old pipe networks, increasing the diversity of water supply (water desalination, rainwater harvesting, recycled water use, etc.), increasing distributed small water, and formulating plans for the sustainable development of water supply.
5.3. Discussion of the Critical Point Identification Result
If the system recoverability remains unchanged, the system robustness has a linear relationship with resilience. When the robustness level exceeds 0.7, the sensitivity of resilience to robustness decreases significantly. Under the condition that the robustness of the system remains unchanged, the relationship between recoverability and resilience is nonlinear. When the recoverability level exceeds 1.2, recoverability is no longer sensitive to resilience. In the three-dimensional landscape of the improvement path composed of robustness, recoverability, and resilience indicators, it is easy to find the inflection point. The robustness level is 0.7 and the recoverability level is 1.2. It is assumed that the ideal robustness level or initial robustness level of the system is 1.0 and the ideal recoverability level or initial recoverability level of the system is 1.0. The robustness level of 0.7 indicates that the system robustness level does not need to be restored to the original level or be unnecessarily improved in order to recover the resilience of the system after a composite impact. A recoverability level of 1.2 means that it is necessary to maintain some redundancy (20% redundancy) in the recoverability level in order to improve system resilience.
The principle of enhancing robustness is not simply the higher the better, because, on the one hand, although the development of surplus water supply infrastructure can well buffer the impact of environmental change and drought, it also produces huge sunk costs and high operation and maintenance costs in later periods. On the other hand, the water sector should not only rely on large capital investments to enhance the robustness of the system, but should also improve the resilience and adaptability to future uncertainties [19]. Purely robust systems focus on mitigating system failures by enhancing individual components, whereas system designs that focus on a single physical function may limit the system’s effectiveness in responding to specific events and lead to negative resilience consequences. A resilient system, on the other hand, tries to adapt to shocks by diversifying its flexibility and functional dependence, and can quickly recover its original function after a failure [61]. For example, firstly, the penetration rate of the urban public water supply in China is 96.7%. Although the centralized water supply system has strong robustness and can manage water supply facilities as a whole and ensure water quality, its construction requires the laying of a large number of pipes, resulting in high system costs and low efficiency. The cost of network laying usually accounts for the largest share of investment in water supply infrastructure. As systems age, the cost of managing, maintaining, and replacing large centralized system components increases significantly. Secondly, while a larger water supply system’s reserve capacity can enable reliable service delivery in the event of a system failure, a larger reserve capacity will extend system recovery time if the system is subjected to contaminant intrusion [62].
Given the current rainfall pattern changes, rising sea levels caused by climate change, the rapid growth in urban population, and requirements to improve capital robustness, if capital is only raised to drastically improve recoverability and the development of robustness is ignored (or even a recession, such as water supply infrastructure recession caused by a lack of regular maintenance and/or ageing), the urban water supply system resilience may fall into a “rigid trap” (RE > 1.00, RB < 0.30) [13]. For the specific dynamic evolution process of the resilience state, Figure 13 shows the system resilience evolution path triangle model. In a rigid trap, managers pool resources and efforts to adapt to specific external pressures and internal demands, resulting in a highly interconnected and self-reinforcing water supply system (e.g., highly centralized and less-resilient water supply facilities) [63]. At the same time, adaptive management is severely hampered by large sunk costs and the legacy effects of centralized and non-resilient water supply infrastructure. Eventually, the system falls into a vicious cycle of high recoverability, low robustness, and high recoverability.
In the past, for coping with water scarcity, the water sector has often implemented adaptation measures by increasing savings ability to increase the availability of water resources in reservoirs, but rainfall patterns have changed and sea levels have risen, causing external threats, such as salt water intrusion, which are likely to permanently reduce reservoir capacity or underground water resource availability; therefore, a large reservoir or underground water may no longer guarantee urban water security [64]. As previously stated, the combined pressures of increasing external environmental uncertainty and rapid urbanization require more transformative and sustainable adaptation measures to be implemented by water managers. In many cities, water availability is limited and water scarcity is an urgent problem for managers. Due to the lack of diversity of water sources, water authorities often struggle to meet the water supply demand in disaster and emergency situations [65].
Qingdao heavily relies on diverted passenger water (>90%) as the main water source, having a relatively singular water source. Any disaster affecting diverted passenger water will seriously impact urban water supply security. At the same time, the use of groundwater in the area is limited due to low recharge. In order to improve the restorability of the water supply system, Qingdao needs to increase its accessibility to various water sources, for example, by increasing the diversity of water sources, deepening the freshwater treatment process, and innovating desalination water treatment models.
6. Conclusions
The main conclusions of this paper are as follows:
- The static assessment results showed that the five capital levels (financial resources, management efficiency, infrastructure, available water resources, and organizational adaptation) and three attributes (robustness, recoverability, and adaptability) of Qingdao’s water supply system resilience are unbalanced.
- The dynamic assessment results showed that the current trajectory of Qingdao’s water supply system resilience is as a city in transition. Among them, in an uncertain scenario, the technical service system will collapse due to the limitation of its ability to adapt, and the system state is unstable. However, the total service system with organizational adaptation can always recover through its dynamic adaptability, avoiding collapse, which indicates that organizational adaptation can significantly improve system resilience.
- The fitting analysis showed that a linear relationship exists between robustness and resilience, and the resilience increases linearly with the increase in capital robustness. The relationship between recoverability and resilience is nonlinear. Before the critical point, the resilience increases exponentially with the increase in recoverability, and the marginal effect is obvious. After the critical point, the increase in resilience tends to flatten. The critical points of robustness and recoverability are 0.70 and 1.20, respectively. Combined with the resilience improvement path 3D landscape, to transform the current state of the water sector to ensure water security and high resilience, adaptive ability can be used to improve the system robustness and recoverability, but there should not be only one focus in the process of improvement. To achieve the critical point capital robustness and recoverability (RB = 0.70, RE = 1.20), the city should be aware of the trap of rigidity (RE > 1.00, RB < 0.30).
- We constructed a comprehensive assessment framework combining static and dynamic assessments, which can be used as a reference for the resilience assessment of similar coupled social-technological systems in cities. For example, the power system, the communication system, the drainage system, and the road system in the urban environment can be regarded as a coupled social-technological system. The coastal city selected as a typical case in this study, although it has certain limitations, helps provide information, but the long-term dynamic resilience of different urban water supply systems differs, and water managers actively adapt their behavior in close relation to the local complex environment that is uncertain. As such, a different regional comparative study on urban water supply systems should be conducted, and water management departments should be actively contacted to obtain more timely and effective information.
- We developed a comprehensive assessment framework that evaluates both the current resilience levels and the resilience dynamics under interference. In this study, we performed a correlation analysis of the relationships between resilience properties and presented the specific value of the key critical point.
First, although we developed a comprehensive assessment framework to assess the resilience of an urban water supply system under the influence of uncertain scenarios, this study was performed from the perspective of urban water management subjects, and we did not consider the dynamic impact of community adaptation on the resilience of urban water supply systems. Recently, researchers have been increasingly focusing on community adaptation to inadequate water services. For example, when urban water management or tap water suppliers cannot supply reliable drinking water to communities, community residents can purchase bottled water from supermarkets. Community residents in areas with prolonged severe water shortages or extremely unreliable water quality may find alternatives, such as drilling deep wells to obtain groundwater. Second, our acquisition of raw quantitative indicator data has limitations. Since some of the original data in this article were obtained from water management interviews or questionnaires, there is a possibility that the original data were intentionally concealed or exaggerated. Third, only a single case was used for the empirical study. Although the typical case of a coastal city selected for this research provides some reference value, the long-term resilience dynamics of different urban water supply systems and water management are closely related to the uncertainty of the complex environment. A future study should compare different regional urban water supply systems and actively contact water management departments to obtain more timely and effective information.
Past experience and risk awareness may provide reference for the near- or short-term resilience of the system, but past experience may not be useful based on the findings of long-term resilience research. Therefore, a method or model must be developed to study the long-term evolution of the resilience trajectories of affected water supply systems across different scales. Moreover, in the future sustainability research on urban water supply systems, the interactions and relationships of the water supply system and other systems or departments, such as energy, drainage, environmental protection, land resources, and agricultural management systems, should be considered.
Author Contributions
Methodology and Writing—Original Draft, J.L.; Writing—review & editing, Z.S.; Project administration, W.W. All authors contributed equally to this work. All authors have read and agreed to the published version of the manuscript.
Funding
This research was funded by the National Natural Science Foundation of China (grant Nos. 71874123, 71974122 and 71704162); the Humanities and Social Science Research Youth Fund Project of Ministry of Education (grant No. 17YJC630184); and Open Fund of innovation institute for Sustainable Maritime Architecture Research and Technology (iSMART), Qingdao University of Technology (No. C2020-043).
Institutional Review Board Statement
Not applicable.
Informed Consent Statement
Not applicable.
Data Availability Statement
Not applicable.
Acknowledgments
We thank Harald Klammler for providing the source code for the coupled system model.
Conflicts of Interest
The authors declare no conflict of interest.
References
- Minucci, G. Assessing adaptive capacity of water management organizations. The case study of the municipality of Tomave (Bolivia). J. Risk Res. 2016, 19, 847–872. [Google Scholar] [CrossRef]
- Ulibarri, N.; Scott, T.A. Environmental hazards, rigid institutions, and transformative change: How drought affects the consideration of water and climate impacts in infrastructure management. Glob. Environ. Chang. 2019, 59, 102005. [Google Scholar] [CrossRef] [PubMed]
- Simonovic, S.P. Systems Approach to Management of Water Resources—Toward Performance Based Water Resources Engineering. Water 2020, 12, 1208. [Google Scholar] [CrossRef]
- Sweya, L.N.; Wilkinson, S.; Mayunga, J.; Joseph, A.; Lugomela, G.; Victor, J. Development of a Tool to Measure Resilience against Floods for Water Supply Systems in Tanzania. J. Manag. Eng. 2020, 36, 0502007. [Google Scholar] [CrossRef]
- Short, M.D.; Peirson, W.L.; Peters, G.M.; Cox, R.J. Managing Adaptation of Urban Water Systems in a Changing Climate. Water Resour. Manag. 2012, 26, 1953–1981. [Google Scholar] [CrossRef]
- Hoover, D.J.; Odigie, K.O.; Swarzenski, P.W.; Barnard, P. Sea-level rise and coastal groundwater inundation and shoaling at select sites in California, USA. J. Hydrol. Reg. Stud. 2017, 11, 234–249. [Google Scholar] [CrossRef] [Green Version]
- Abidin, H.Z.; Andreas, H.; Gumilar, I.; Fukuda, Y.; Pohan, Y.E.; Deguchi, T. Land subsidence of Jakarta (Indonesia) and its relation with urban development. Nat. Hazards 2011, 59, 1753–1771. [Google Scholar] [CrossRef]
- Cubillo, F.; Martínez-Codina, Á. A metric approach to measure resilience in water supply systems. J. Appl. Water Eng. Res. 2019, 7, 67–78. [Google Scholar] [CrossRef]
- Balaei, B.; Wilkinson, S.; Potangaroa, R.; Hassani, N.; Alavi-Shoshtari, M. Developing a Framework for Measuring Water Supply Resilience. Nat. Hazards Rev. 2018, 19, 04018013. [Google Scholar] [CrossRef]
- Joannou, D.; Kalawsky, R.; Saravi, S.; Rivas Casado, M.; Fu, G.; Meng, F. A Model-Based Engineering Methodology and Architecture for Resilience in Systems-of-Systems: A Case of Water Supply Resilience to Flooding. Water 2019, 11, 496. [Google Scholar] [CrossRef] [Green Version]
- David, R.; Pavel, S.; Simona, S. Resilience of Critical Infrastructure Elements and Its Main Factors. Systems 2018, 6, 21. [Google Scholar]
- Rehak, D.; Senovsky, P.; Hromada, M.; Lovecek, T. Complex approach to assessing resilience of critical infrastructure elements. Int. J. Crit. Infrastruct. Prot. 2019, 25, 125–138. [Google Scholar] [CrossRef]
- Krueger, E.H.; Borchardt, D.; Jawitz, J.W.; Klammler, H.; Yang, S.; Zischg, J.; Rao, P.S.C. Resilience Dynamics of Urban Water Supply Security and Potential of Tipping Points. Earth’s Future 2019, 7, 1167–1191. [Google Scholar] [CrossRef] [Green Version]
- Zhao, S.; Liu, X.; Zhuo, Y.; Fan, B. Stuay on Recovery Strategies of Water Supply System under Emergent Water Pollution Events. Ind. Eng. Manag. 2015, 20, 135–141. [Google Scholar]
- Li, Q.; Chen, Z.; Zhao, X. Comprehensive Seismic resilience of Urban Lifeline System: Double-dimensional approach. China Civ. Eng. J. 2017, 50, 65–72. [Google Scholar]
- Liu, J.; Huang, W. Research on Resilience Capacity Assessment of Urban Water Supply System in Cities under Salt Tide Situation. Mod. City Res. 2017, 9, 32–40. [Google Scholar]
- Liu, J.; Wang, W.; Shao, Z. Research on resilience capacity assessment and promotion strategy of water supply system in Qingdao under flood and drought disaster. J. Inst. Disaster Prev. 2020, 22, 9–19. [Google Scholar]
- Bruneau, M.; Chang, S.E.; Eguchi, R.T.; Lee, G.C.; O’Rourke, T.D.; Reinhorn, A.M.; Shinozuka, M.; Tierney, K.; Wallace, W.A.; Von Winterfeldt, D. A Framework to Quantitatively Assess and Enhance the Seismic Resilience of Communities. Earthq. Spectra 2003, 19, 733–752. [Google Scholar] [CrossRef] [Green Version]
- Lawson, E.; Farmani, R.; Woodley, E.; Butler, D. A Resilient and Sustainable Water Sector: Barriers to the Operationalisation of Resilience. Sustainability 2020, 12, 1797. [Google Scholar] [CrossRef] [Green Version]
- Walker, G. Come back socio technical systems theory, all is forgiven. Civ. Eng. Environ. Syst. 2015, 32, 170–179. [Google Scholar] [CrossRef]
- Quitana, G.; Molinos-Senante, M.; Chamorro, A. Resilience of critical infrastructure to natural hazards: A review focused on drinking water systems. Int. J. Disaster Risk Reduct. 2020, 48, 101575. [Google Scholar] [CrossRef]
- Xu, W.; Zhong, Z.; Proverbs, D.; Xiong, S.; Zhang, Y. Enhancing the Resilience of the Management of Water Resources in the Agricultural Supply Chain. Water 2021, 13, 1619. [Google Scholar] [CrossRef]
- Behboudian, M.; Kerachian, R.; Pourmoghim, P. Evaluating the long-term resilience of water resources systems: Application of a generalized grade-based combination approach. Sci. Total. Environ. 2021, 786, 147447. [Google Scholar] [CrossRef]
- Tantri, F.; Amir, S. Modeling a Simulation for Sociotechnical Resilience. Complexity 2019, 2019, 7950629. [Google Scholar] [CrossRef]
- Vazquez, K.; Muneepeerakul, R. Modeling Resilience and Sustainability of Water-Subsidized Systems: An Example from Northwest Costa Rica. Sustainability 2021, 13, 2013. [Google Scholar] [CrossRef]
- Brown, R.R.; Keath, N.; Wong, T.H.F. Urban water management in cities: Historical, current and future regimes. Water Sci. Technol. 2009, 59, 847–855. [Google Scholar] [CrossRef] [PubMed]
- Daniell, K.A.; Rinaudo, J.D.; Chan, N.W.W.; Nauges, C.; Grafton, Q. Understanding and managing urban water in transition. In Understanding and Managing Urban Water in Transition; Springer: Dordrecht, The Netherlands, 2015; pp. 1–30. [Google Scholar]
- Hoekstra, A.Y.; Buurman, J.; Van Ginkel, K.C. Urban water security: A review. Environ. Res. Lett. 2018, 13, 053002. [Google Scholar] [CrossRef] [Green Version]
- Krueger, E.; Rao, P.S.C.; Borchardt, D. Quantifying urban water supply security under global change. Glob. Environ. Chang. 2019, 56, 66–74. [Google Scholar] [CrossRef]
- Appelbaum, S.H. Socio-technical systems theory: An intervention strategy for organizational development. Manag. Decis. 1997, 35, 452–463. [Google Scholar] [CrossRef]
- Langhans, S.D.; Reichert, P.; Schuwirth, N. The method matters: A guide for indicator aggregation in ecological assessments. Ecol. Indic. 2014, 45, 494–507. [Google Scholar] [CrossRef] [Green Version]
- Kong, J.; Simonovic, S.P.; Zhang, C. Resilience Assessment of Interdependent Infrastructure Systems: A Case Study Based on Different Response Strategies. Sustainability 2019, 11, 6552. [Google Scholar] [CrossRef] [Green Version]
- Klammler, H.; Rao, P.S.; Hatfield, K. Modeling dynamic resilience in coupled technological-social systems subjected to stochastic disturbance regimes. Environ. Syst. Decis. 2018, 38, 140–159. [Google Scholar] [CrossRef]
- Lindskog, F.; McNeil, A.J. Common Poisson shock models: Applications to insurance and credit risk modelling. ASTIN Bull. J. IAA 2003, 33, 209–238. [Google Scholar] [CrossRef] [Green Version]
- Angel, S.; Sheppard, S.; Civco, D.L.; Buckley, R.; Chabaeva, A.; Gitlin, L.; Kraley, A.; Parent, J.; Perlin, M. The Dynamics of Global Urban. Expansion; World Bank, Transport and Urban Development Department: Washington, DC, USA, 2005. [Google Scholar]
- Bettencourt, L.M.; Lobo, J.; Helbing, D.; Kühnert, C.; West, G.B. Growth, innovation, scaling, and the pace of life in cities. Proc. Natl. Acad. Sci. USA 2007, 104, 7301–7306. [Google Scholar] [CrossRef] [Green Version]
- Scheffer, M.; Carpenter, S.; Foley, J.A.; Folke, C.; Walker, B. Catastrophic shifts in ecosystems. Nature 2001, 413, 591–596. [Google Scholar] [CrossRef]
- Shin, S.; Lee, S.; Judi, D.R.; Parvania, M.; Goharian, E.; McPherson, T.; Burian, S.J. A Systematic Review of Quantitative Resilience Measures for Water Infrastructure Systems. Water 2018, 10, 164. [Google Scholar] [CrossRef] [Green Version]
- Garrick, D.; Hall, J.W. Water Security and Society: Risks, Metrics, and Pathways. Annu. Rev. Environ. Resour. 2014, 39, 611–639. [Google Scholar] [CrossRef] [Green Version]
- Rasoulkhani, K.; Mostafavi, A. Resilience as an emergent property of human-infrastructure dynamics: A multi-agent simulation model for characterizing regime shifts and tipping point behaviors in infrastructure systems. PLoS ONE 2018, 13, e0207674. [Google Scholar] [CrossRef] [PubMed] [Green Version]
- Qiu, W.; Chen, Y.; Wan, C. Emergency safeguard measures and thinking of water Group Company Limited during COVID-19 epidemic (Water supply). Water Wastewater Eng. 2020, 56, 44–47. [Google Scholar]
- Wen, L.J.; Jiang, C.B.; Ma, Z.J.; Di, Y.; Cao, Y.Z.; Liu, G.Y. The General Situation of Marine Disaster in Shandong Province during 2010–2014 and Defense Strategies. Ocean. Dev. Manag. 2016, 33, 98–104. [Google Scholar]
- Xu, Y. Development Strategy of China’s coastal cities for addressing Climate Change. Clim. Chang. Res. 2020, 16, 88–98. [Google Scholar]
- Cai, R.; Tan, H.; Guo, H. Response and Compound Risk of the Coastal China areas to Global Change. J. Appl. Oceanogr. 2019, 38, 514–527. [Google Scholar]
- Strogatz, S.H. Nonlinear Dynamics and Chaos with Student Solutions Manual: With Applications to Physics, Biology, Chemistry, and Engineering; CRC Press: Boca Raton, FL, USA, 2018. [Google Scholar]
- Laio, F.; Porporato, A.; Ridolfi, L.I.R.I.; Rodriguez-Iturbe, I. Mean first passage times of processes driven by white shot noise. Phys. Rev. E 2001, 63, 036105. [Google Scholar] [CrossRef] [Green Version]
- Tamea, S.; Laio, F.; Ridolfi, L.; Rodriguez-Iturbe, I. Crossing properties for geophysical systems forced by Poisson noise. Geophys. Res. Lett. 2011, 38, L18404. [Google Scholar] [CrossRef]
- Savenije, H.H.G. Water scarcity indicators; the deception of the numbers. Phys. Chem. Earth Part. B Hydrol. Ocean. Atmos. 2000, 25, 199–204. [Google Scholar] [CrossRef]
- Akhmouch, A.; Correia, F.N. The 12 OECD principles on water governance—When science meets policy. Util. Policy 2016, 43, 14–20. [Google Scholar] [CrossRef]
- Marlow, D.R.; Moglia, M.; Cook, S.; Beale, D.J. Towards sustainable urban water management: A critical reassessment. Water Res. 2013, 47, 7150–7161. [Google Scholar] [CrossRef] [PubMed]
- Padowski, J.C.; Carrera, L.; Jawitz, J.W. Overcoming urban water insecurity with infrastructure and institutions. Water Resour. Manag. 2016, 30, 4913–4926. [Google Scholar] [CrossRef]
- Mair, M.; Zischg, J.; Rauch, W.; Sitzenfrei, R. Where to find water pipes and sewers?—On the correlation of infrastructure networks in the urban environment. Water 2017, 9, 146. [Google Scholar] [CrossRef] [Green Version]
- Flörke, M.; Schneider, C.; McDonald, R.I. Water competition between cities and agriculture driven by climate change and urban growth. Nat. Sustain. 2018, 1, 51–58. [Google Scholar] [CrossRef]
- Christodoulou, S.E.; Fragiadakis, M. Vulnerability assessment of water distribution networks considering performance data. J. Infrastruct. Syst. 2015, 21, 04014040. [Google Scholar] [CrossRef]
- Chen, P.; Scown, C.; Matthews, H.S.; Garrett, J.H., Jr.; Hendrickson, C. Managing critical infrastructure interdependence through economic input-output methods. J. Infrastruct. Syst. 2009, 15, 200–210. [Google Scholar] [CrossRef] [Green Version]
- O’Rourke, T.D. Critical Infrastructure, Interdependencies, and Resilience. 2007. Available online: https://www.nae.edu/19582/Bridge/EngineeringfortheThreatofNaturalDisasters/CriticalInfrastructureInterdependenciesandResilience.aspx (accessed on 15 August 2021).
- Rasoulkhani, K.; Mostafavi, A.; Reyes, M.P.; Batouli, M. Resilience planning in hazards-humans-infrastructure nexus: A multi-agent simulation for exploratory assessment of coastal water supply infrastructure adaptation to sea-level rise. Environ. Model. Softw. 2020, 125, 104636. [Google Scholar] [CrossRef]
- Raskin, P.; Gleick, P.; Kirshen, P.; Pontius, G.; Strzepek, K. Comprehensive Assessment of the Freshwater Resources of the World. 1997. Available online: https://www.mendeley.com/catalogue/a135e25a-c98e-358f-a3bf-bbe90fcf8fbd/ (accessed on 20 August 2021).
- Liu, J.; Yang, H.; Gosling, S.N.; Kummu, M.; Flörke, M.; Pfister, S.; Hanasaki, N.; Wada, Y.; Zhang, X.; Zheng, C.; et al. Water scarcity assessments in the past, present and future. Earth’s Future 2017, 5, 545–549. [Google Scholar] [CrossRef]
- Borchardt, D.; Ibisch, R. Integrated Water Resources Management in a Changing World; IWA Publishing: London, UK, 2013. [Google Scholar]
- Leigh, N.G.; Lee, H. Sustainable and Resilient Urban Water Systems: The Role of Decentralization and Planning. Sustainability 2019, 11, 918. [Google Scholar] [CrossRef] [Green Version]
- Diao, K.; Sweetapple, C.; Farmani, R.; Fu, G.; Ward, S.; Butler, D. Global resilience analysis of water distribution systems. Water Res. 2016, 106, 383–393. [Google Scholar] [CrossRef] [PubMed] [Green Version]
- Carpenter, S.R.; Brock, W.A. Adaptive Capacity and Traps. Ecol. Soc. 2008, 13, 40. [Google Scholar] [CrossRef] [Green Version]
- Brown, T.C.; Mahat, V.; Ramirez, J.A. Adaptation to future water shortages in the United States caused by population growth and climate change. Earth’s Future 2019, 7, 219–234. [Google Scholar] [CrossRef] [Green Version]
- Mortula, M.M.; Ahmed, M.A.; Sadri, A.M.; Ali, T.; Ahmad, I.; Idris, A. Improving Resiliency of Water Supply System in Arid Regions: Integrating Centrality and Hydraulic Vulnerability. J. Manag. Eng. 2020, 36, 0502001. [Google Scholar] [CrossRef]
Figure 1.
Schematic diagram of a water supply system.

Figure 2.
Research framework.

Figure 3.
Schematic diagram of pressures affecting the system.

Figure 4.
Map of Qingdao: Schematic diagram of study area.

Figure 5.
Portfolio results.

Figure 6.
Aggregation results of resilience attributes.

Figure 7.
The direction field and phase diagram with the system trajectory (a,b). The green line is the zero line, and the intersection point of the zero line is the stable fixed point. The black and yellow lines in (b) correspond to the trajectories of Ω and Φ (ΩAV and ΦAV) under shock, respectively; The time series of ξ, Φ, and Ω parameters (c). Time series of the ξav, ΦAV, and ΩAV parameters (averages) (d). The time series of the traverse time tex parameter (e). Impact performance of technical service systems (f). the red point is the crash point. Cumulative probability distribution of Φ and Ω parameters. For better illustration, (c–e) are shown for an arbitrary interval of 100 time units, while (f) are for full simulation period of 1000 time units.


Figure 8.
Total service system impact performance: (a) direction field; (b) phase diagram; (c)the time series of ξ, Φ, and Ω parameters; (d) time series of the ξav, ΦAV, and ΩAV parameters; (e) the time series of the traverse time tex parameter; and (f) cumulative probability distribution of the Φ and Ω parameters.


Figure 9.
Fitting analysis results of RB (X) and fixΦ, uΦ, and utexΦ (Y).

Figure 10.
Fitting analysis results of RE (X) and fixΦ, uΦ, and utexΦ (Y).

Figure 11.
Three-dimensional landscape of the resilience evolution path: Red represents low resilience and purple represents high resilience(a,b). (a) shows the critical point of RB, and (b) shows the critical point of RE.
Figure 11.
Three-dimensional landscape of the resilience evolution path: Red represents low resilience and purple represents high resilience(a,b). (a) shows the critical point of RB, and (b) shows the critical point of RE.

Figure 12.
Exploring the resilience trajectory of urban water supply systems based on different levels of robustness and recoverability.
Figure 12.
Exploring the resilience trajectory of urban water supply systems based on different levels of robustness and recoverability.

Figure 13.
Triangular model of system resilience evolution path.


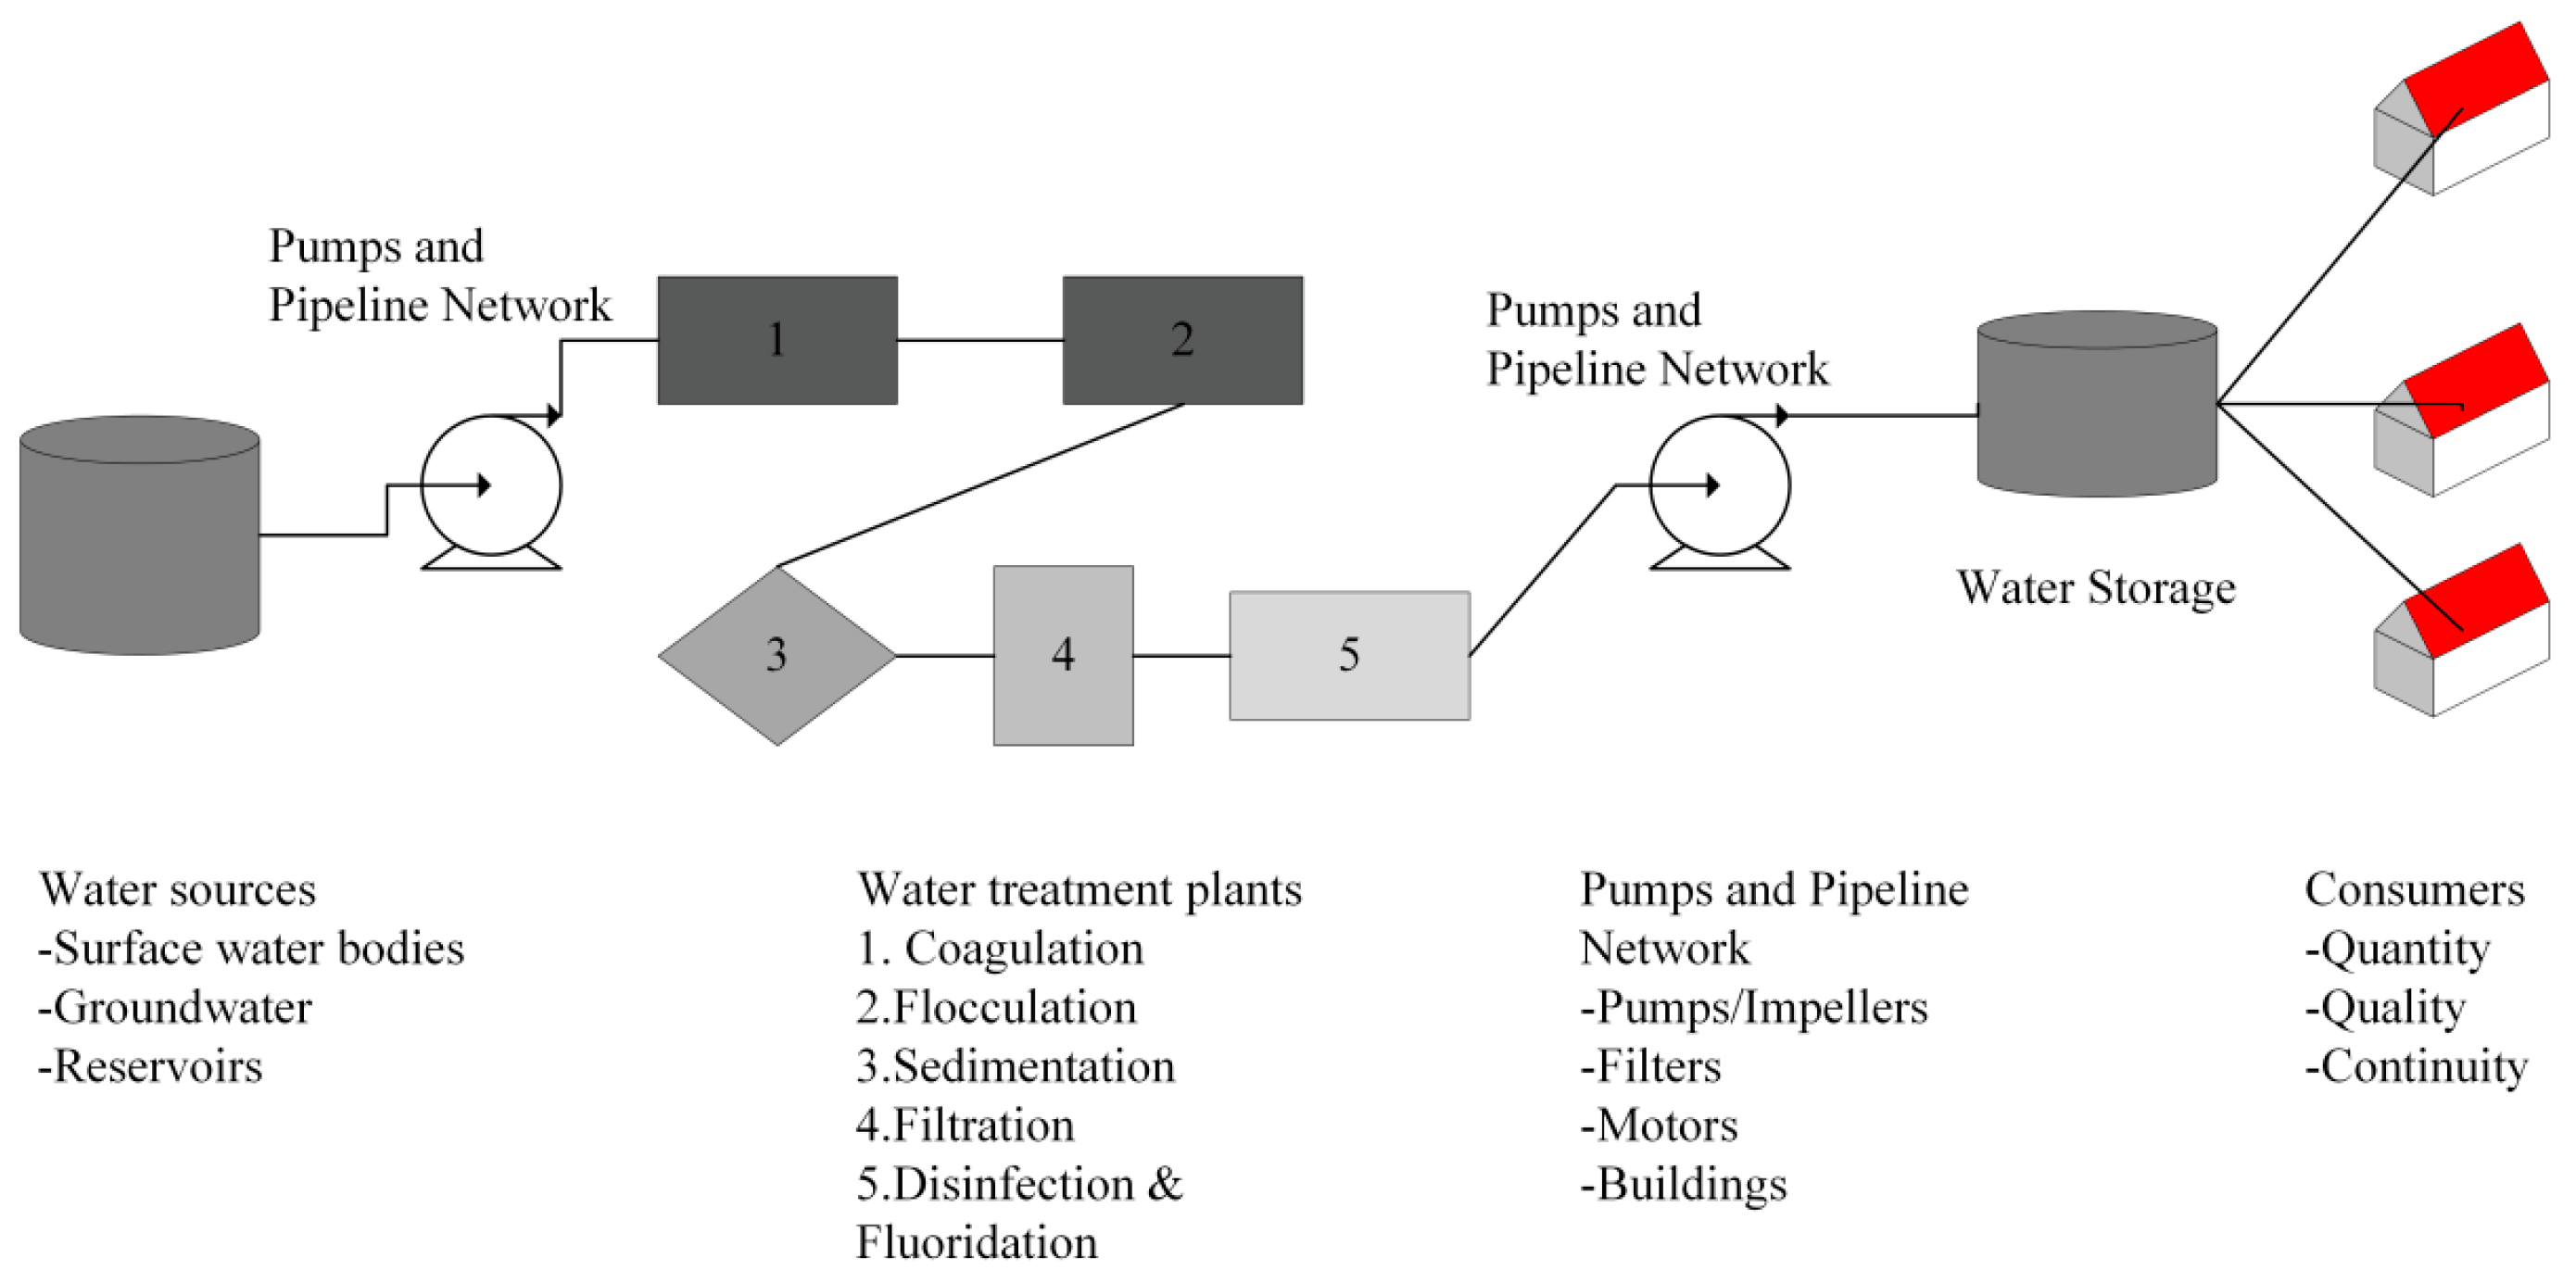
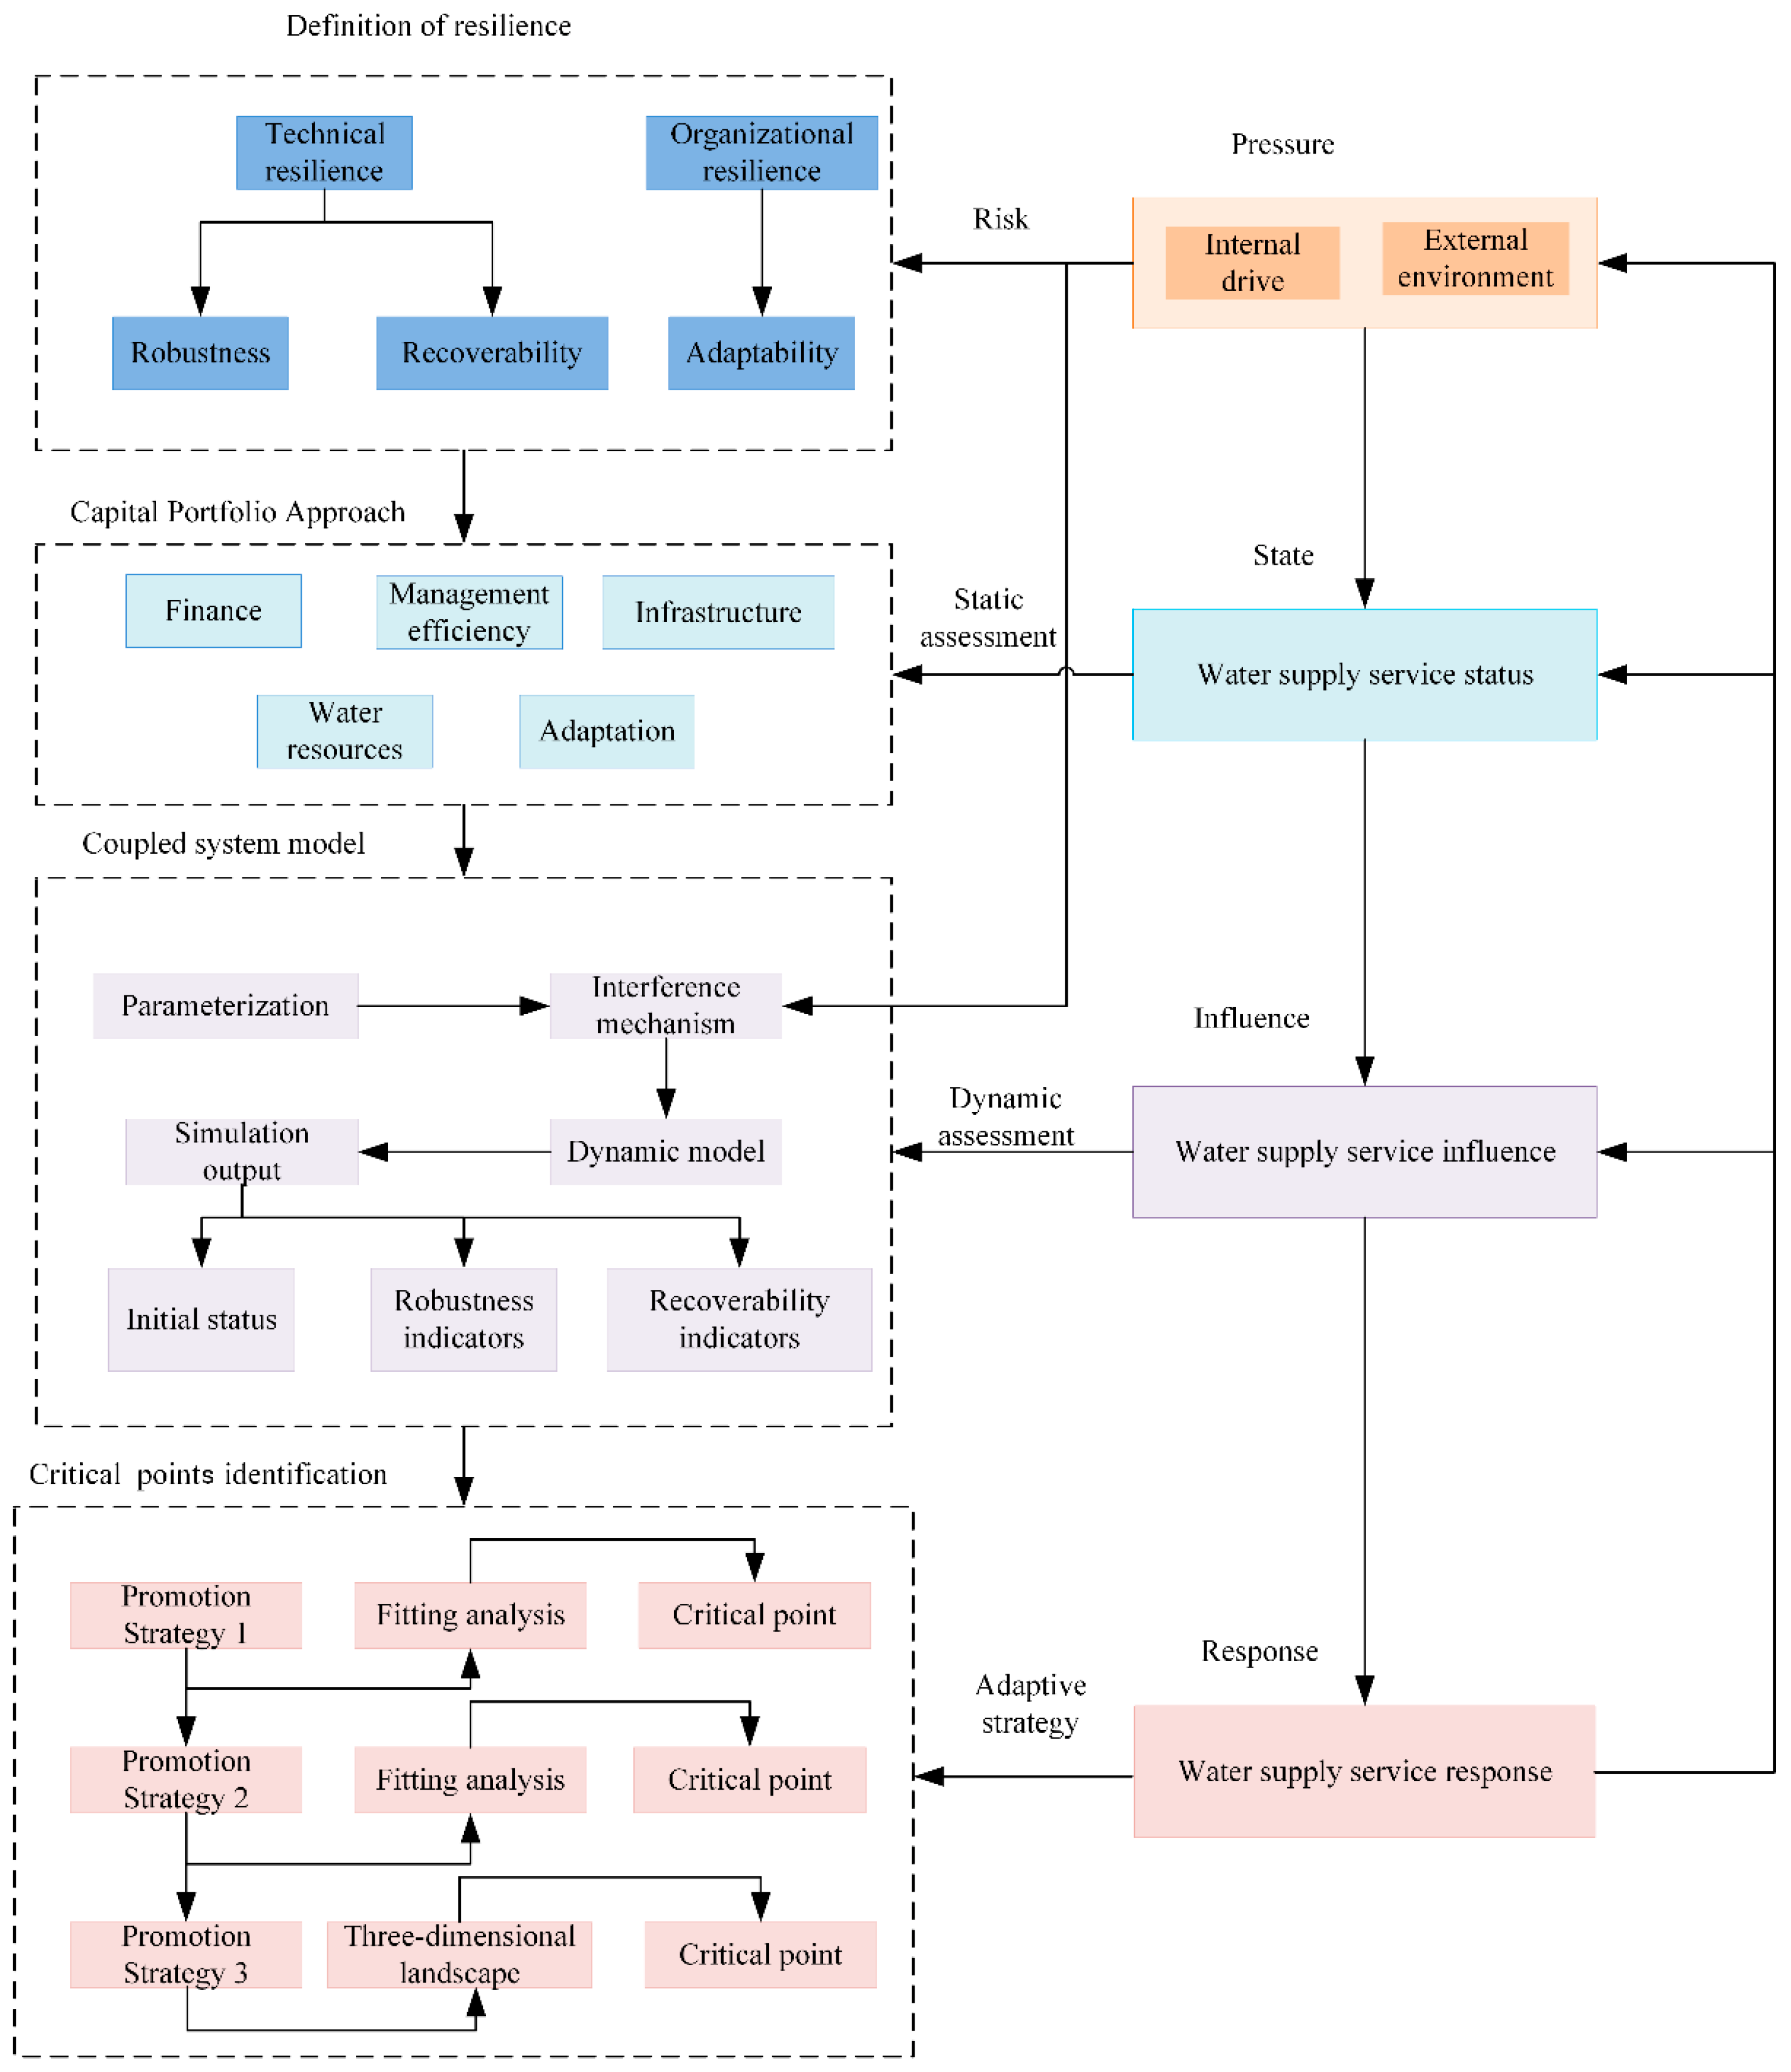
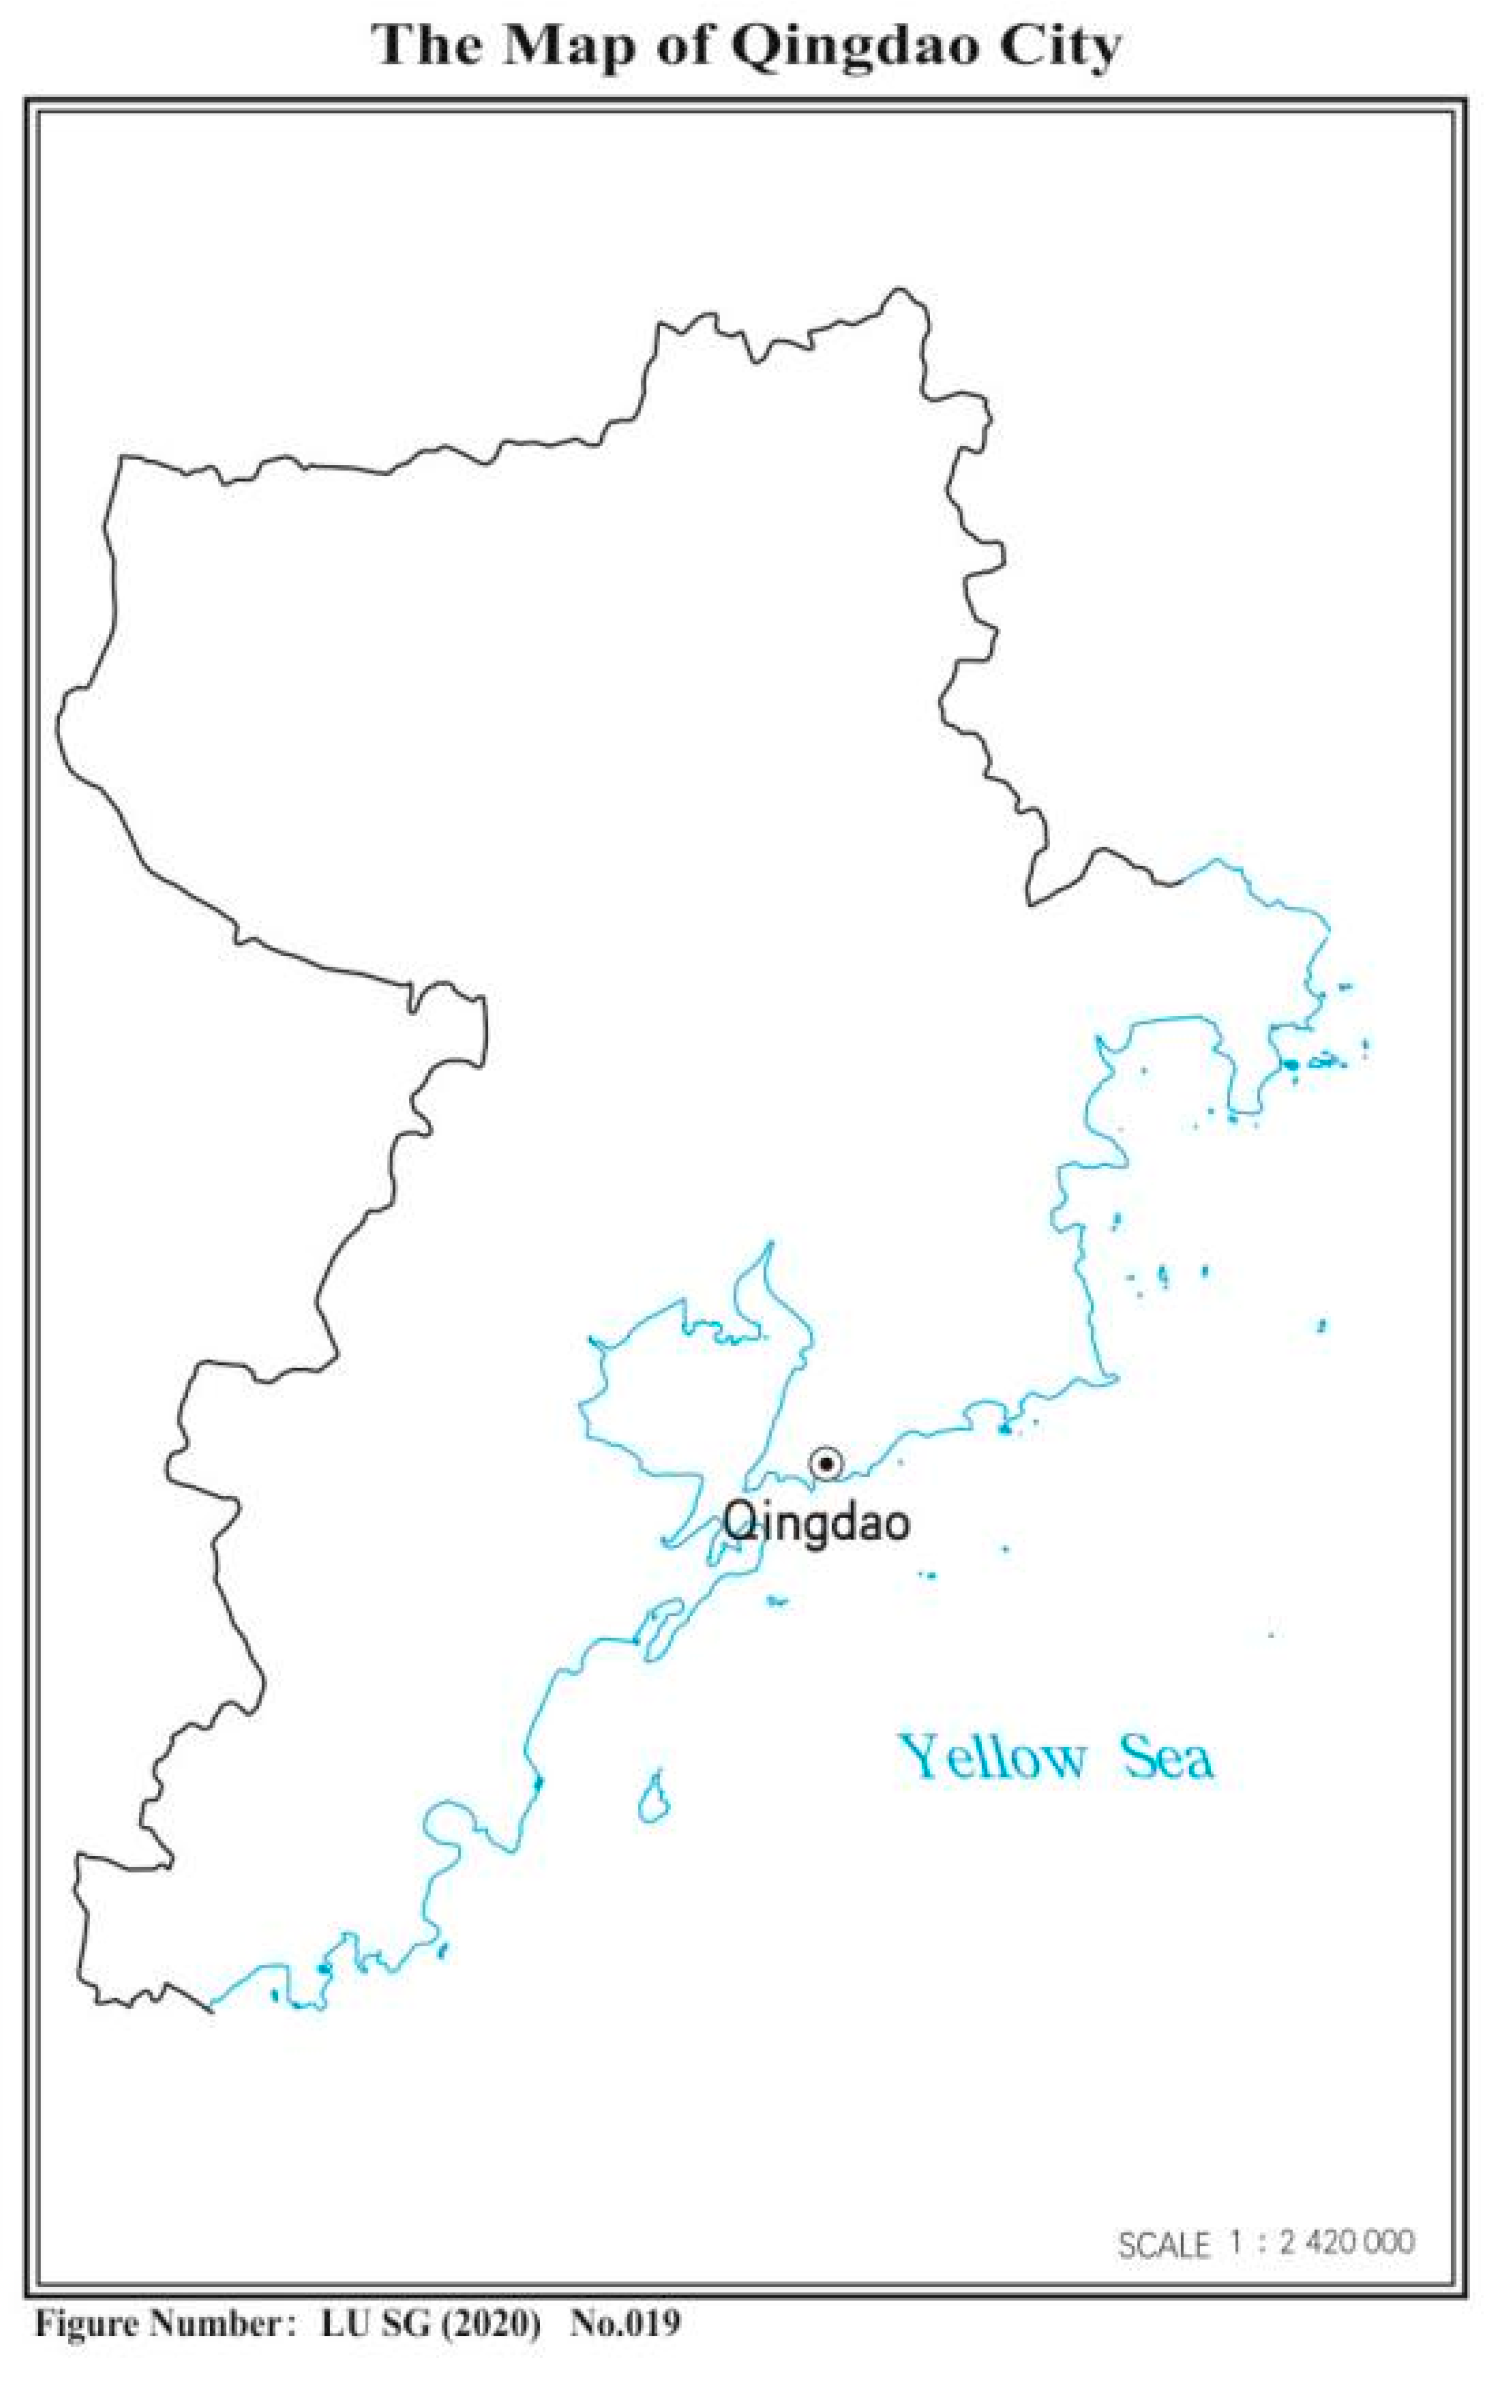
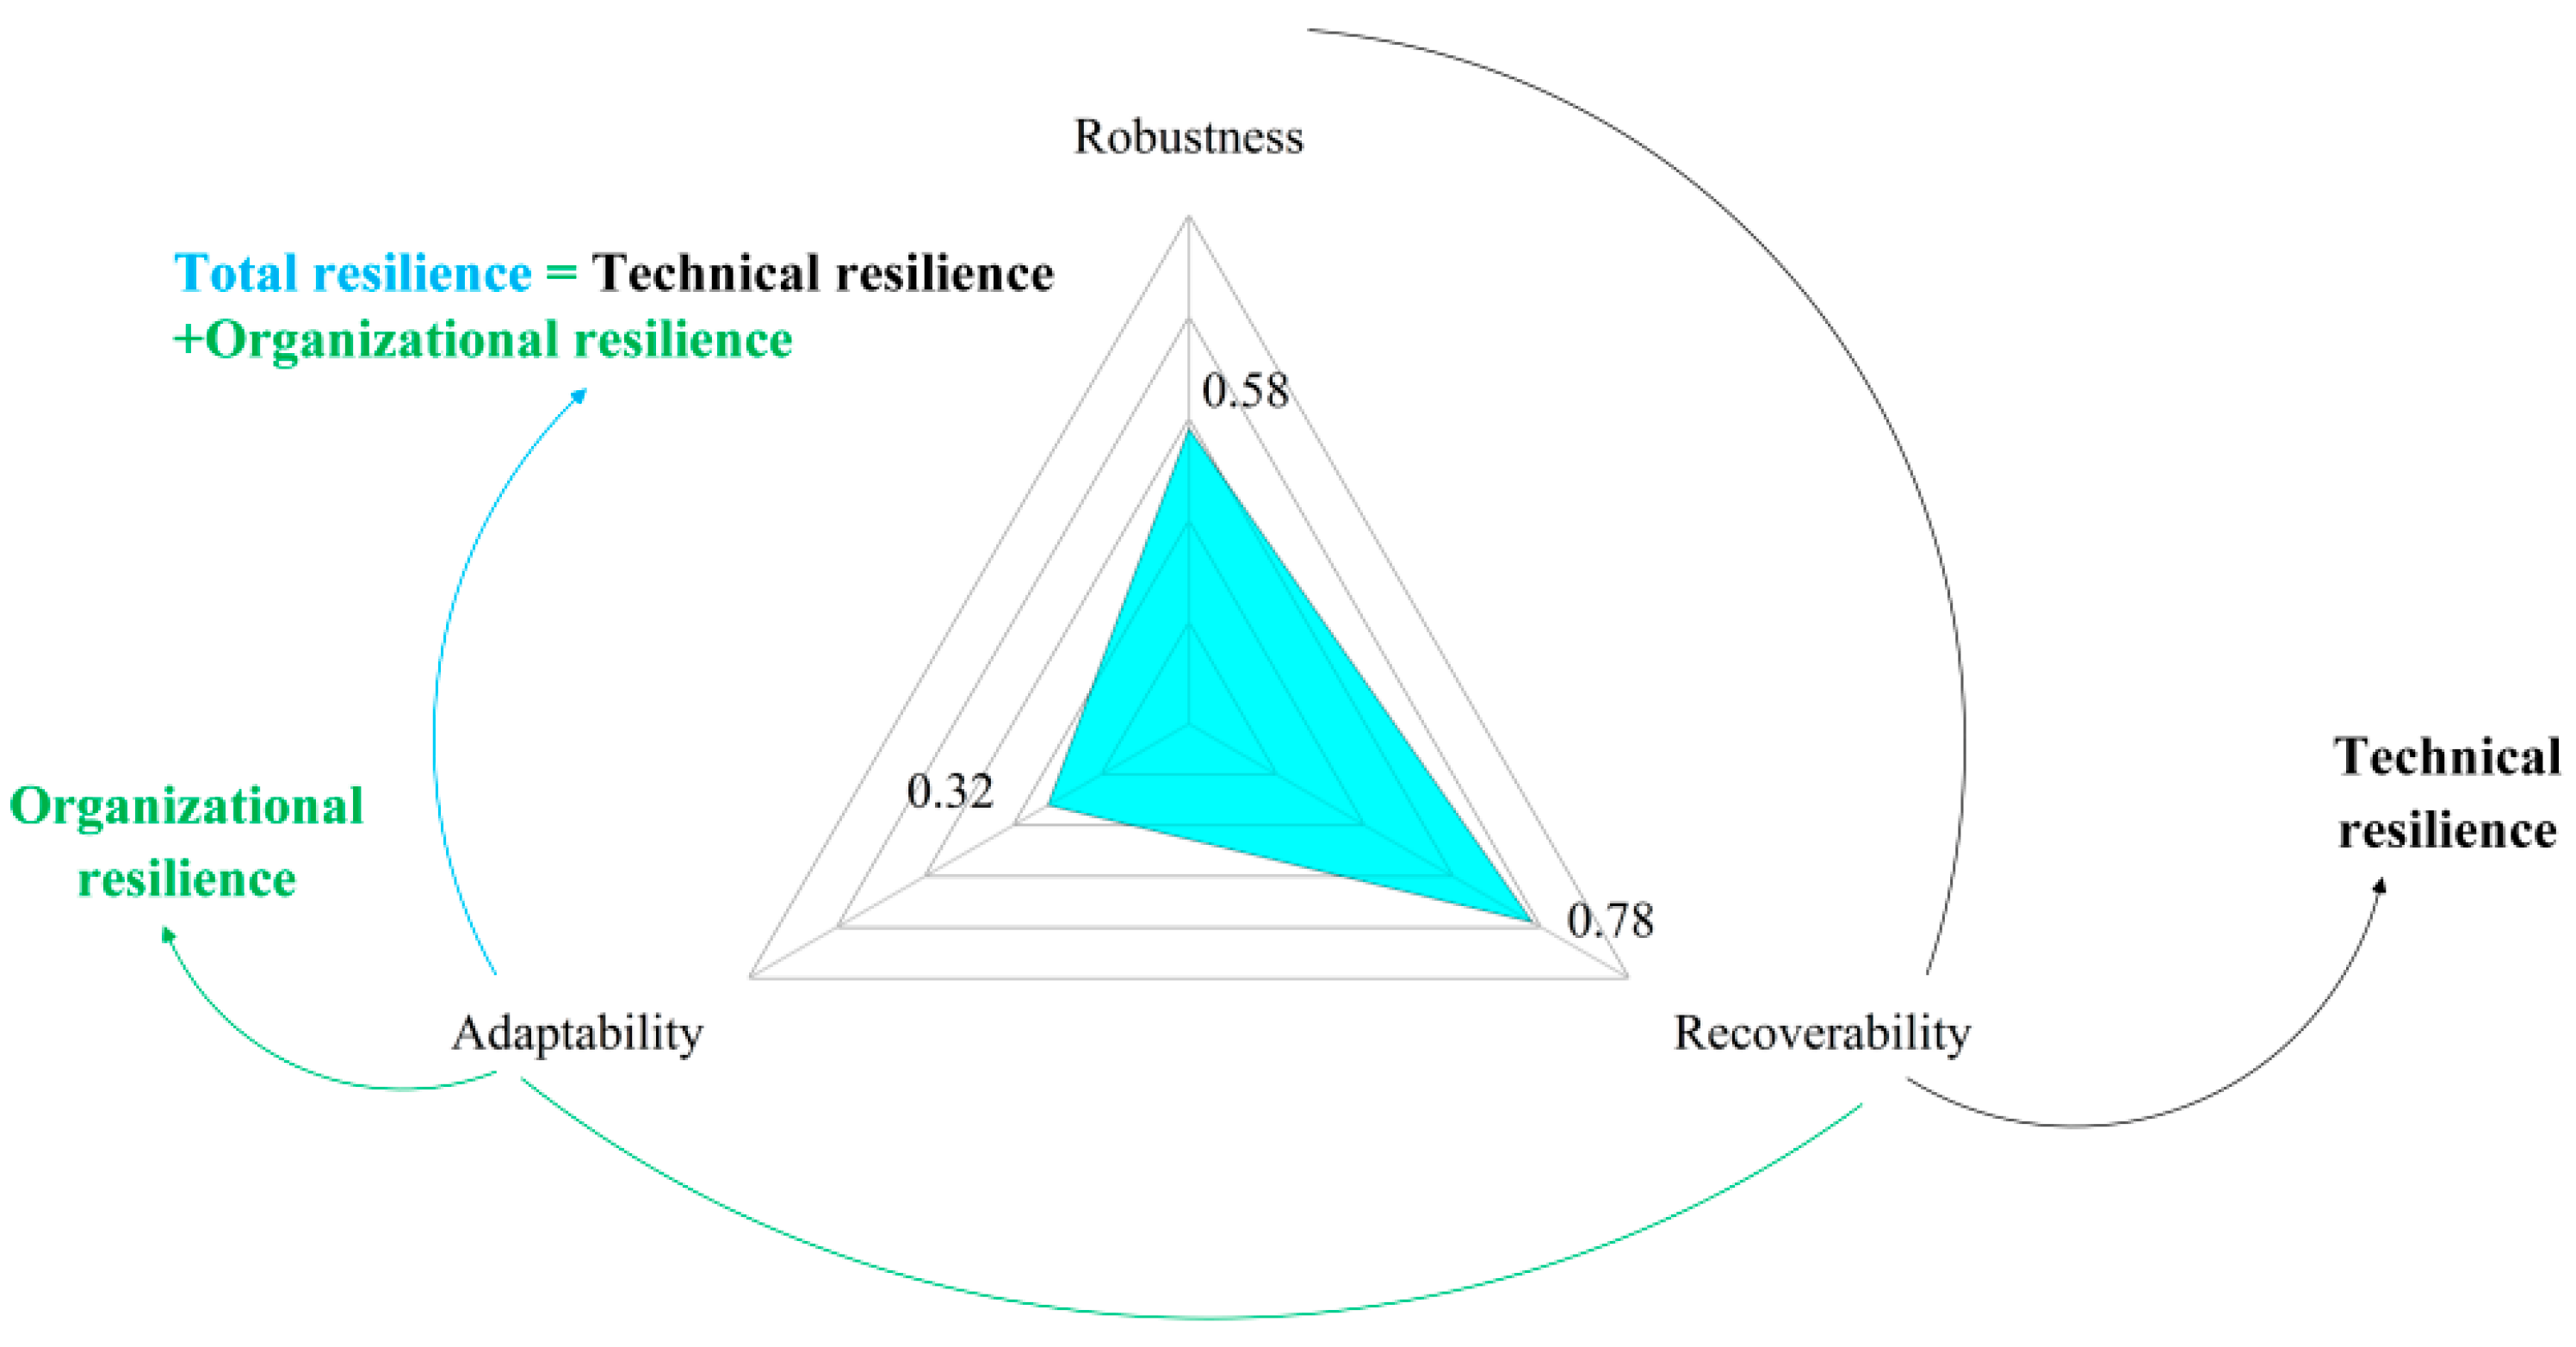
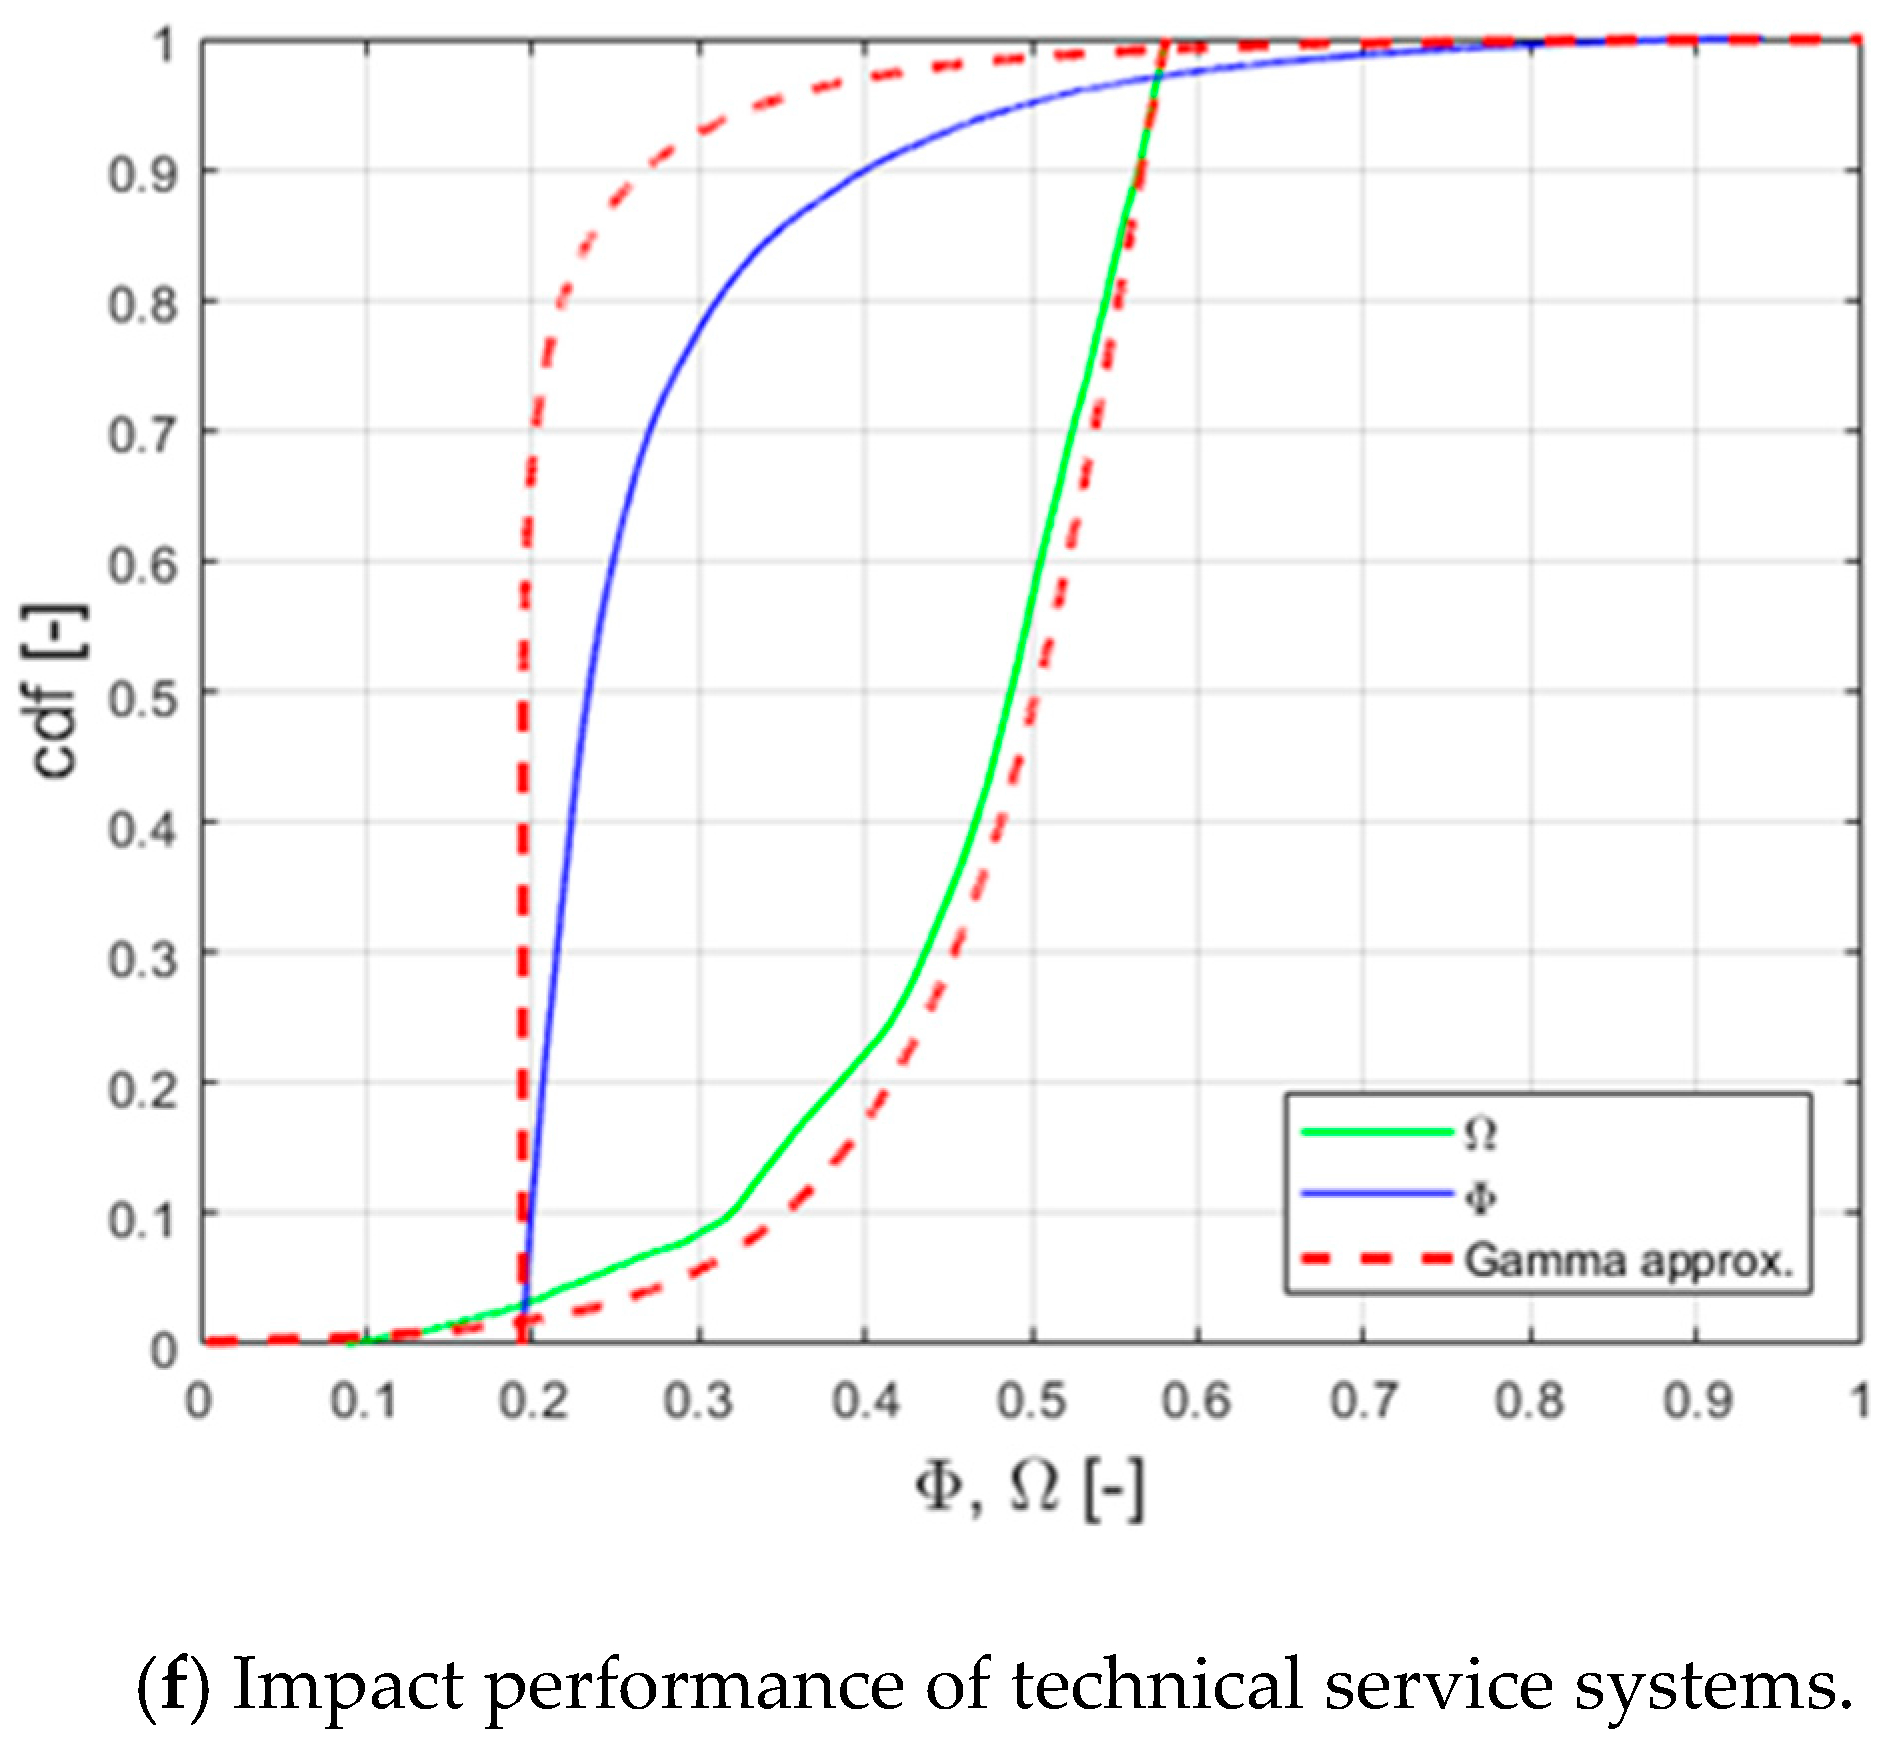
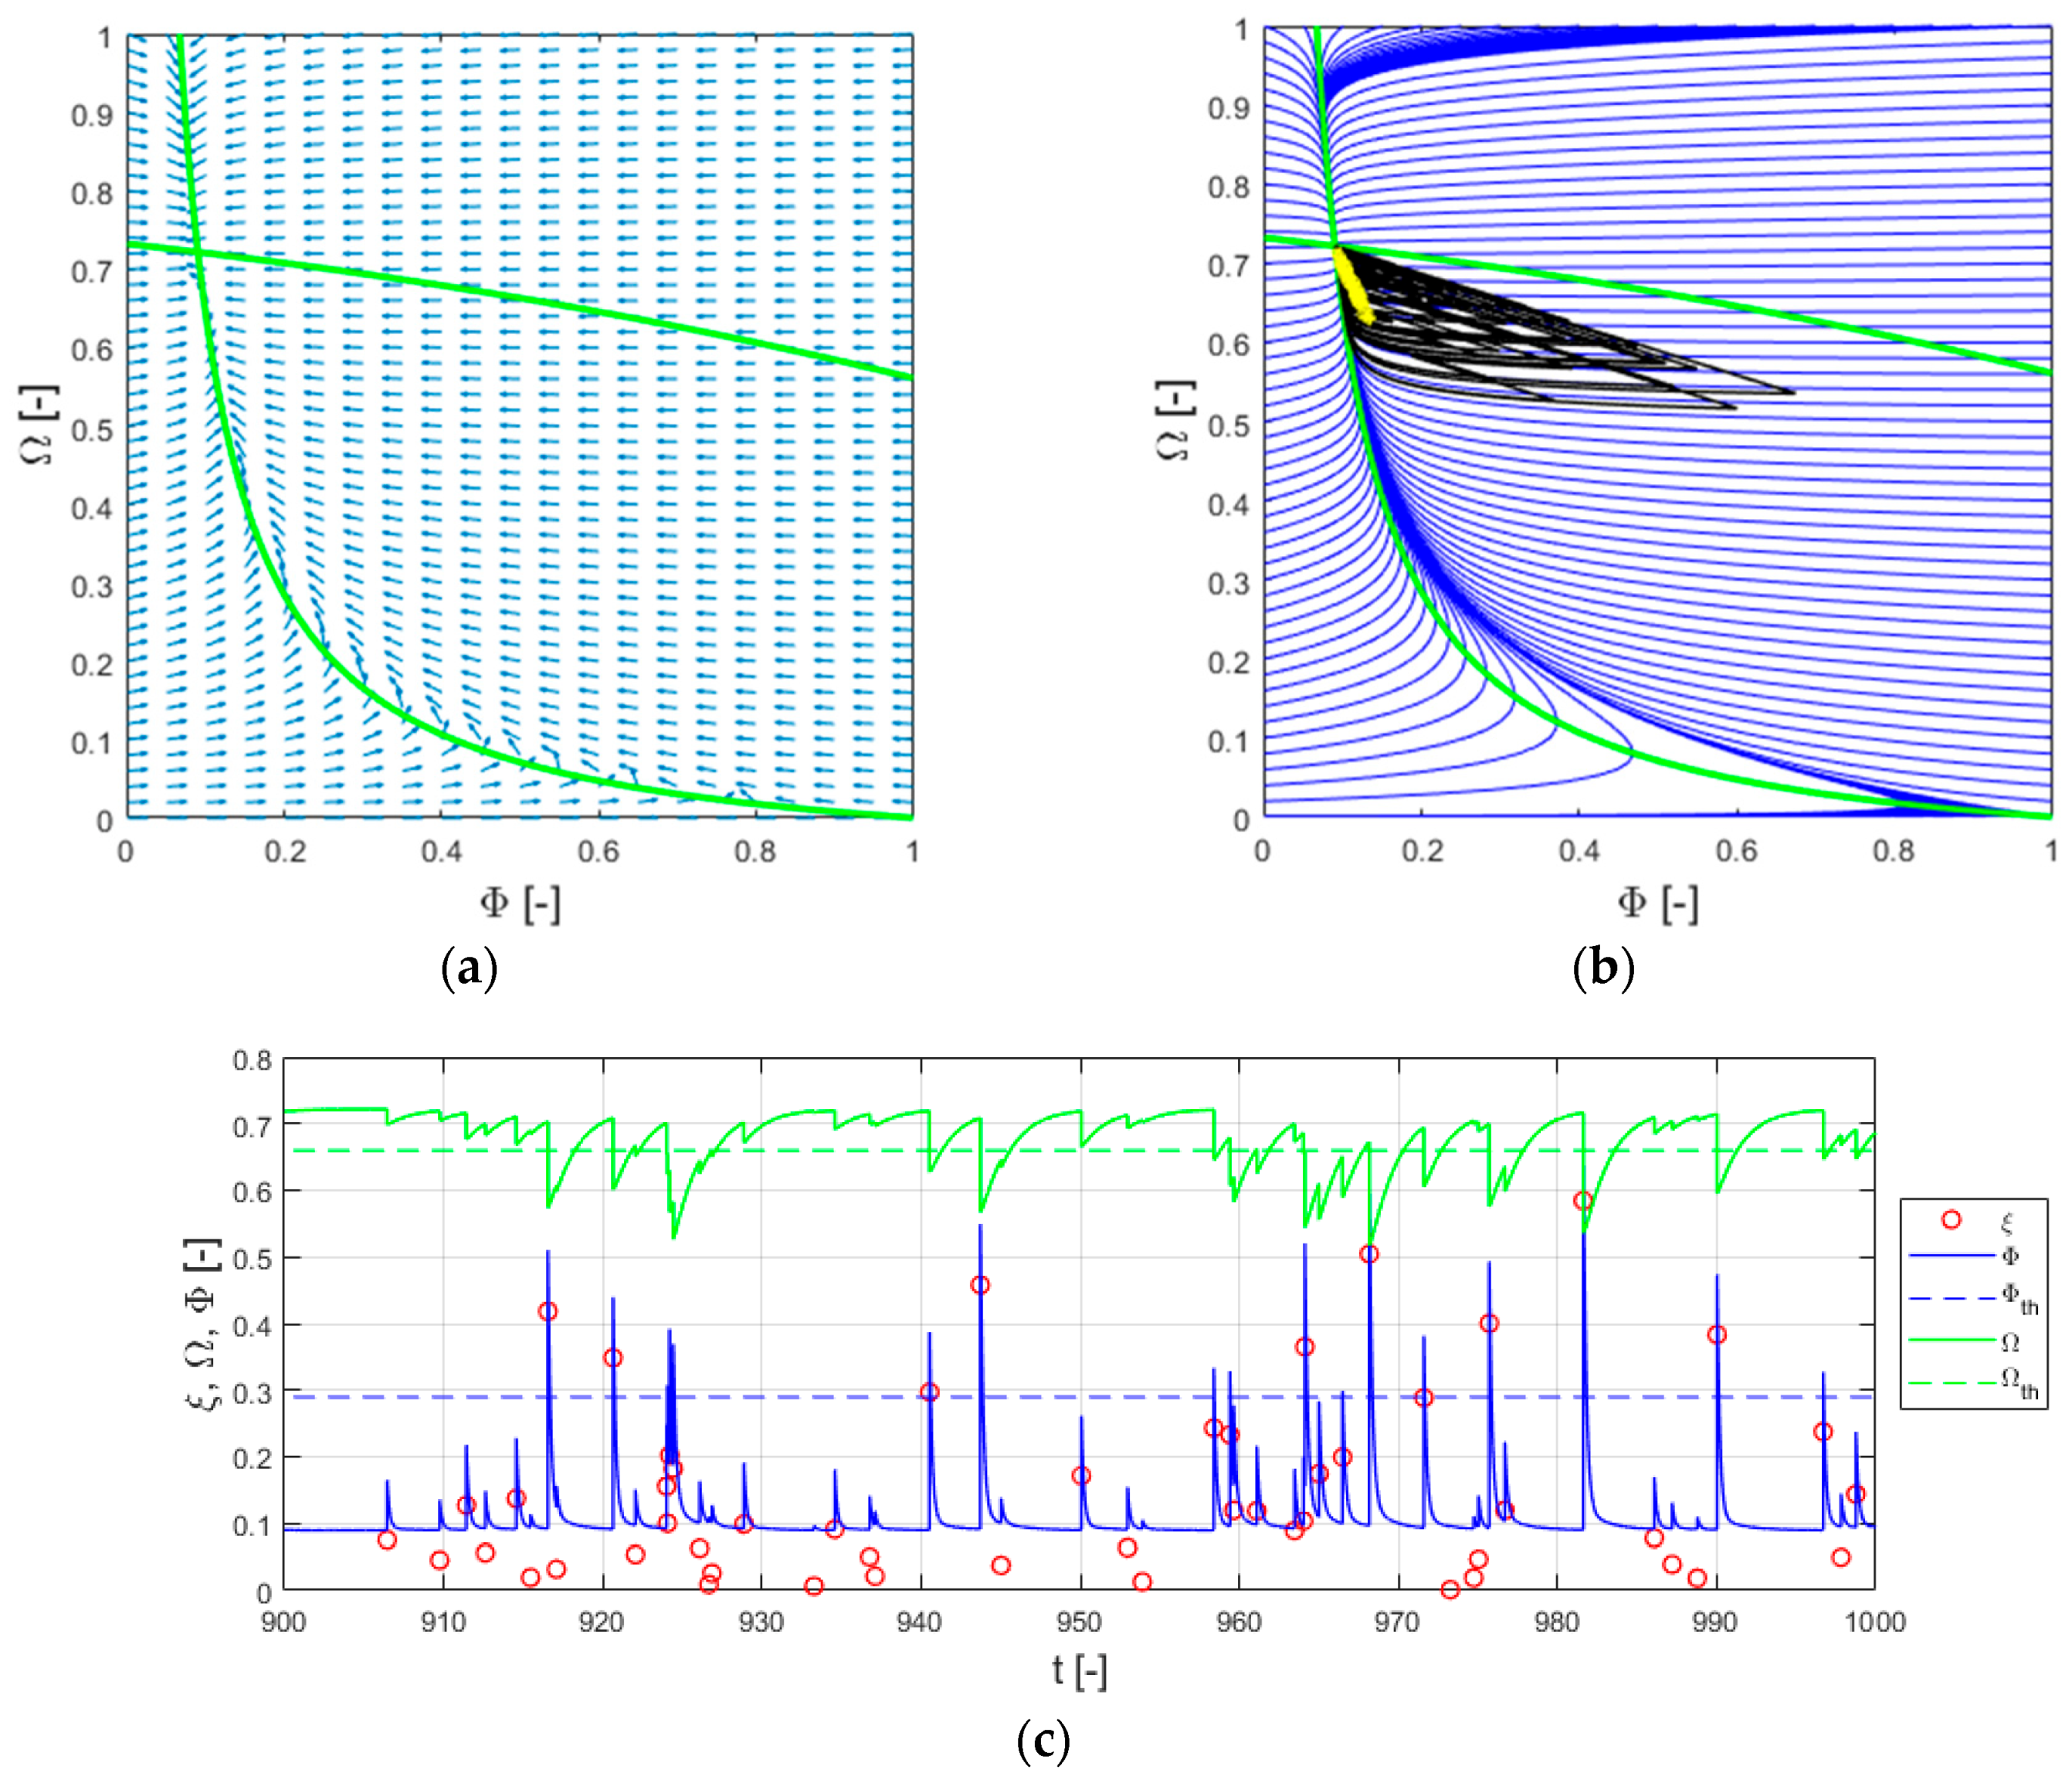
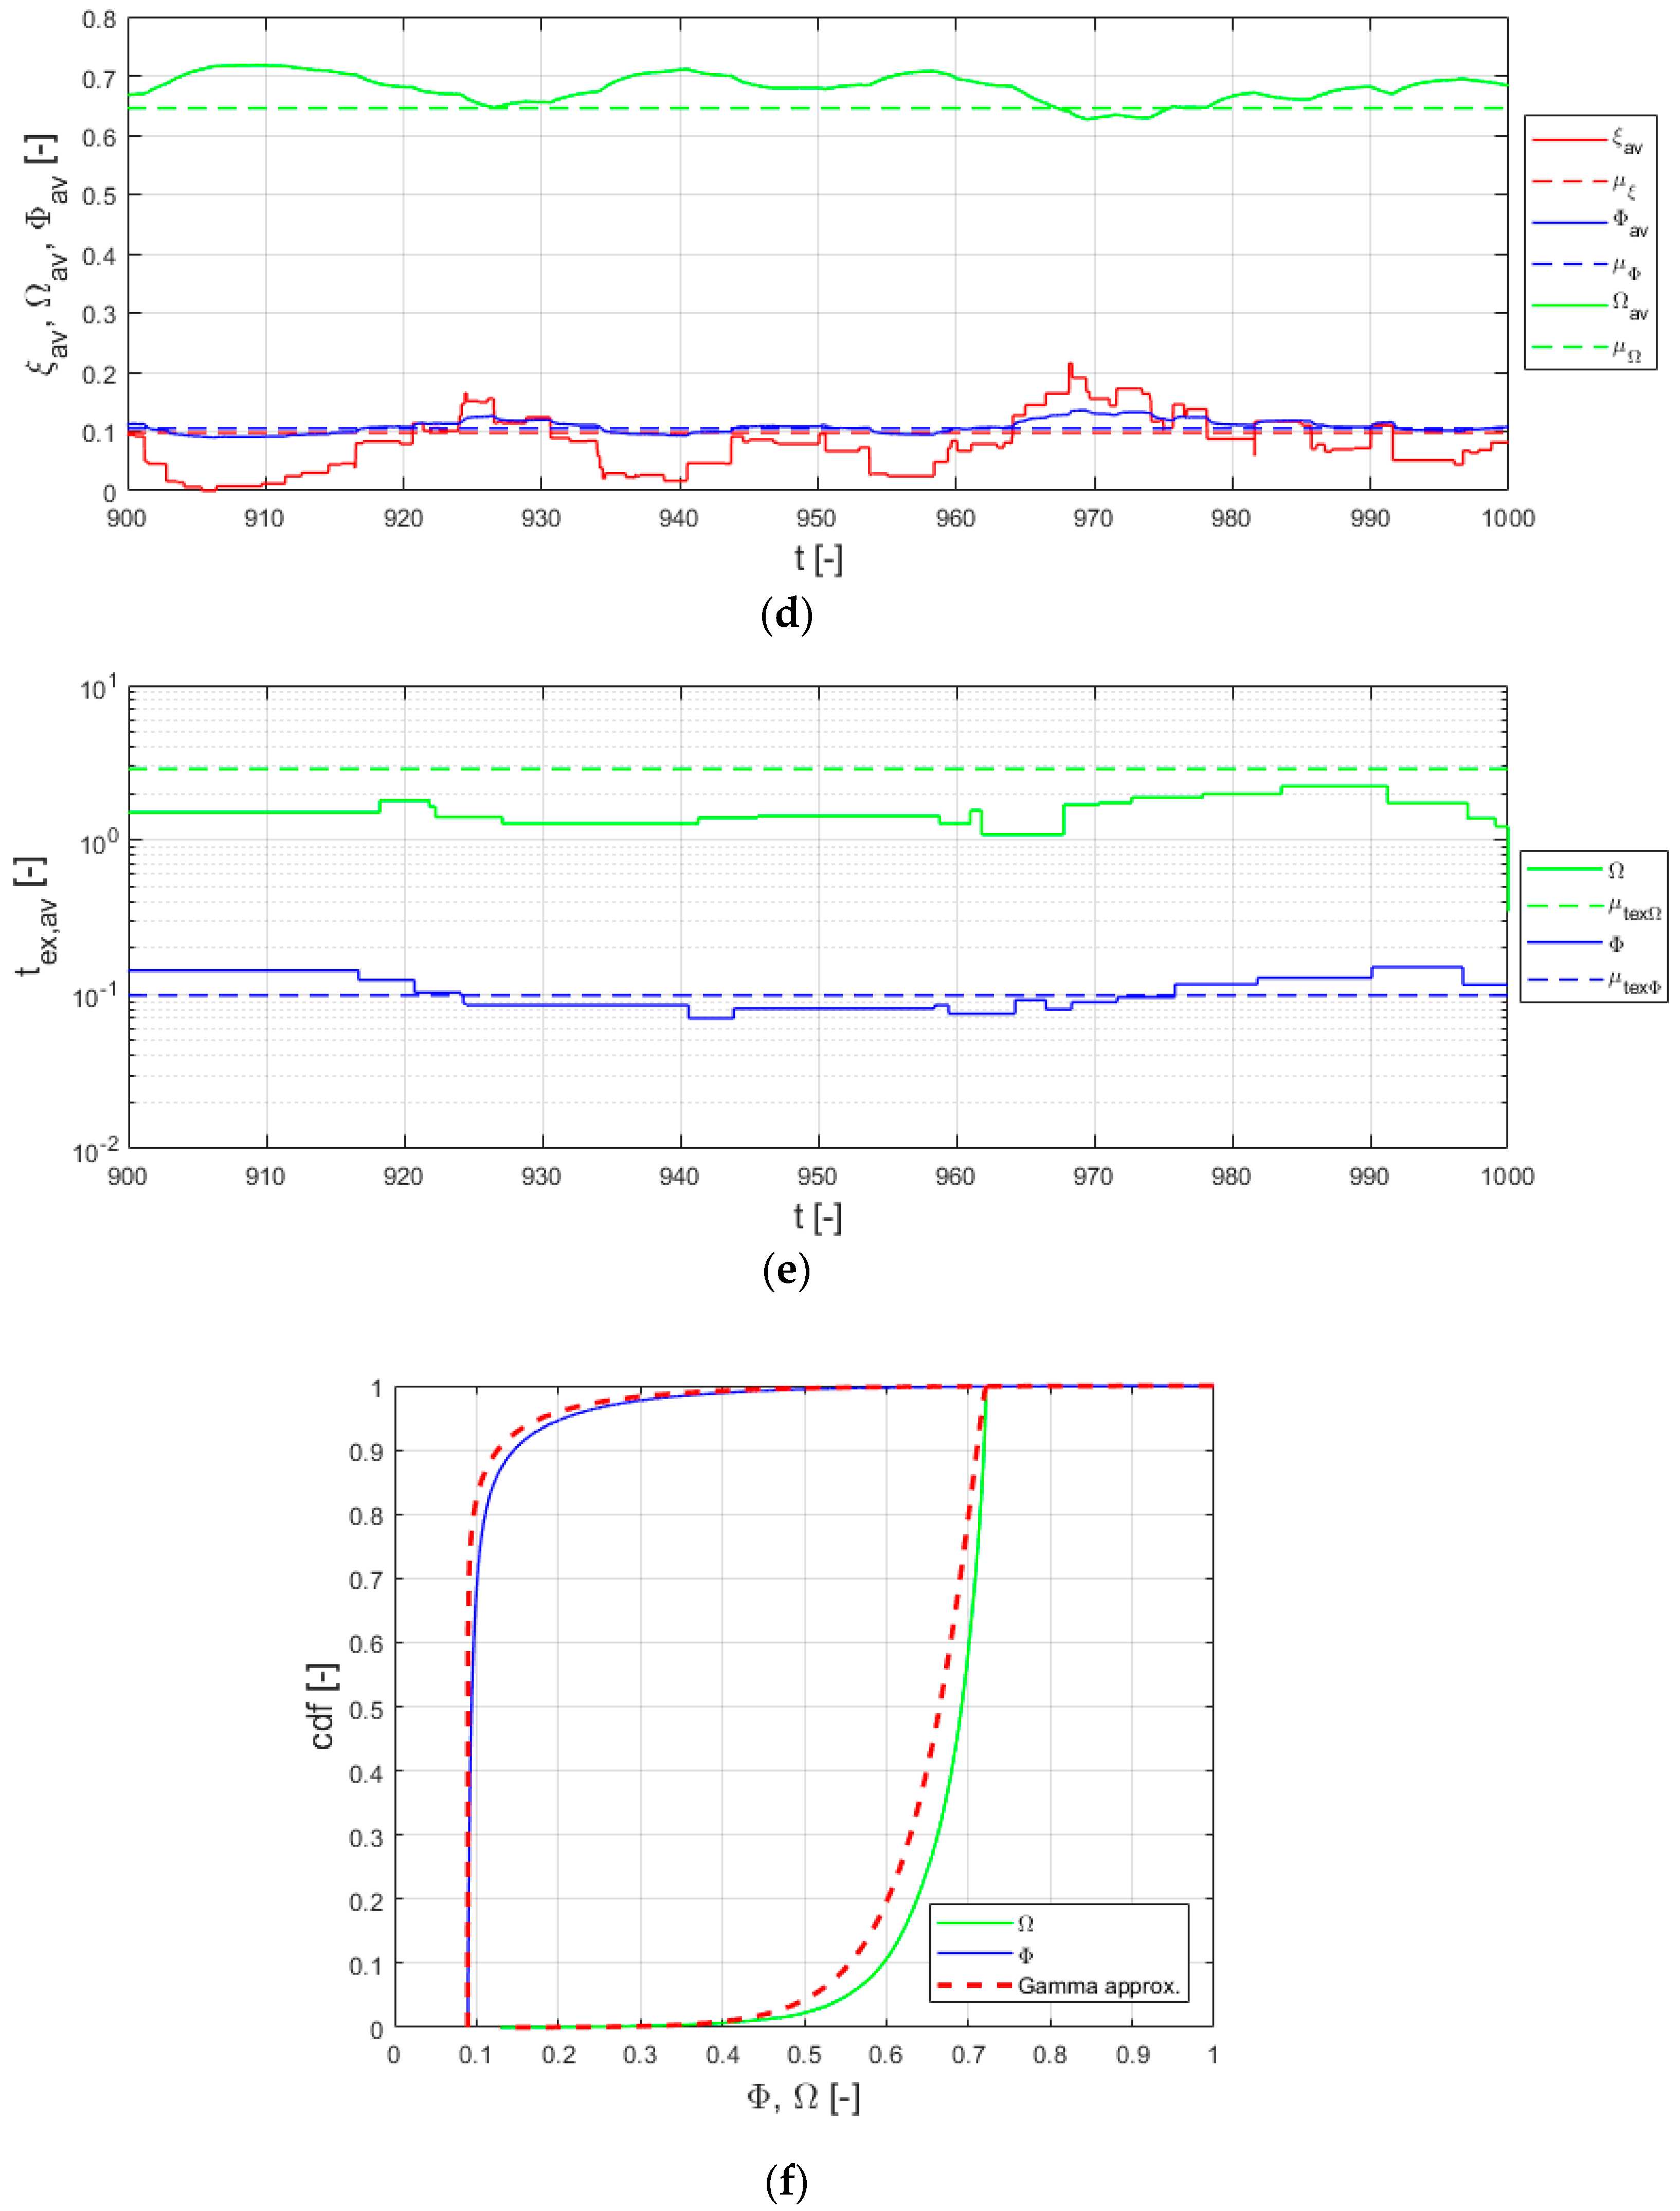
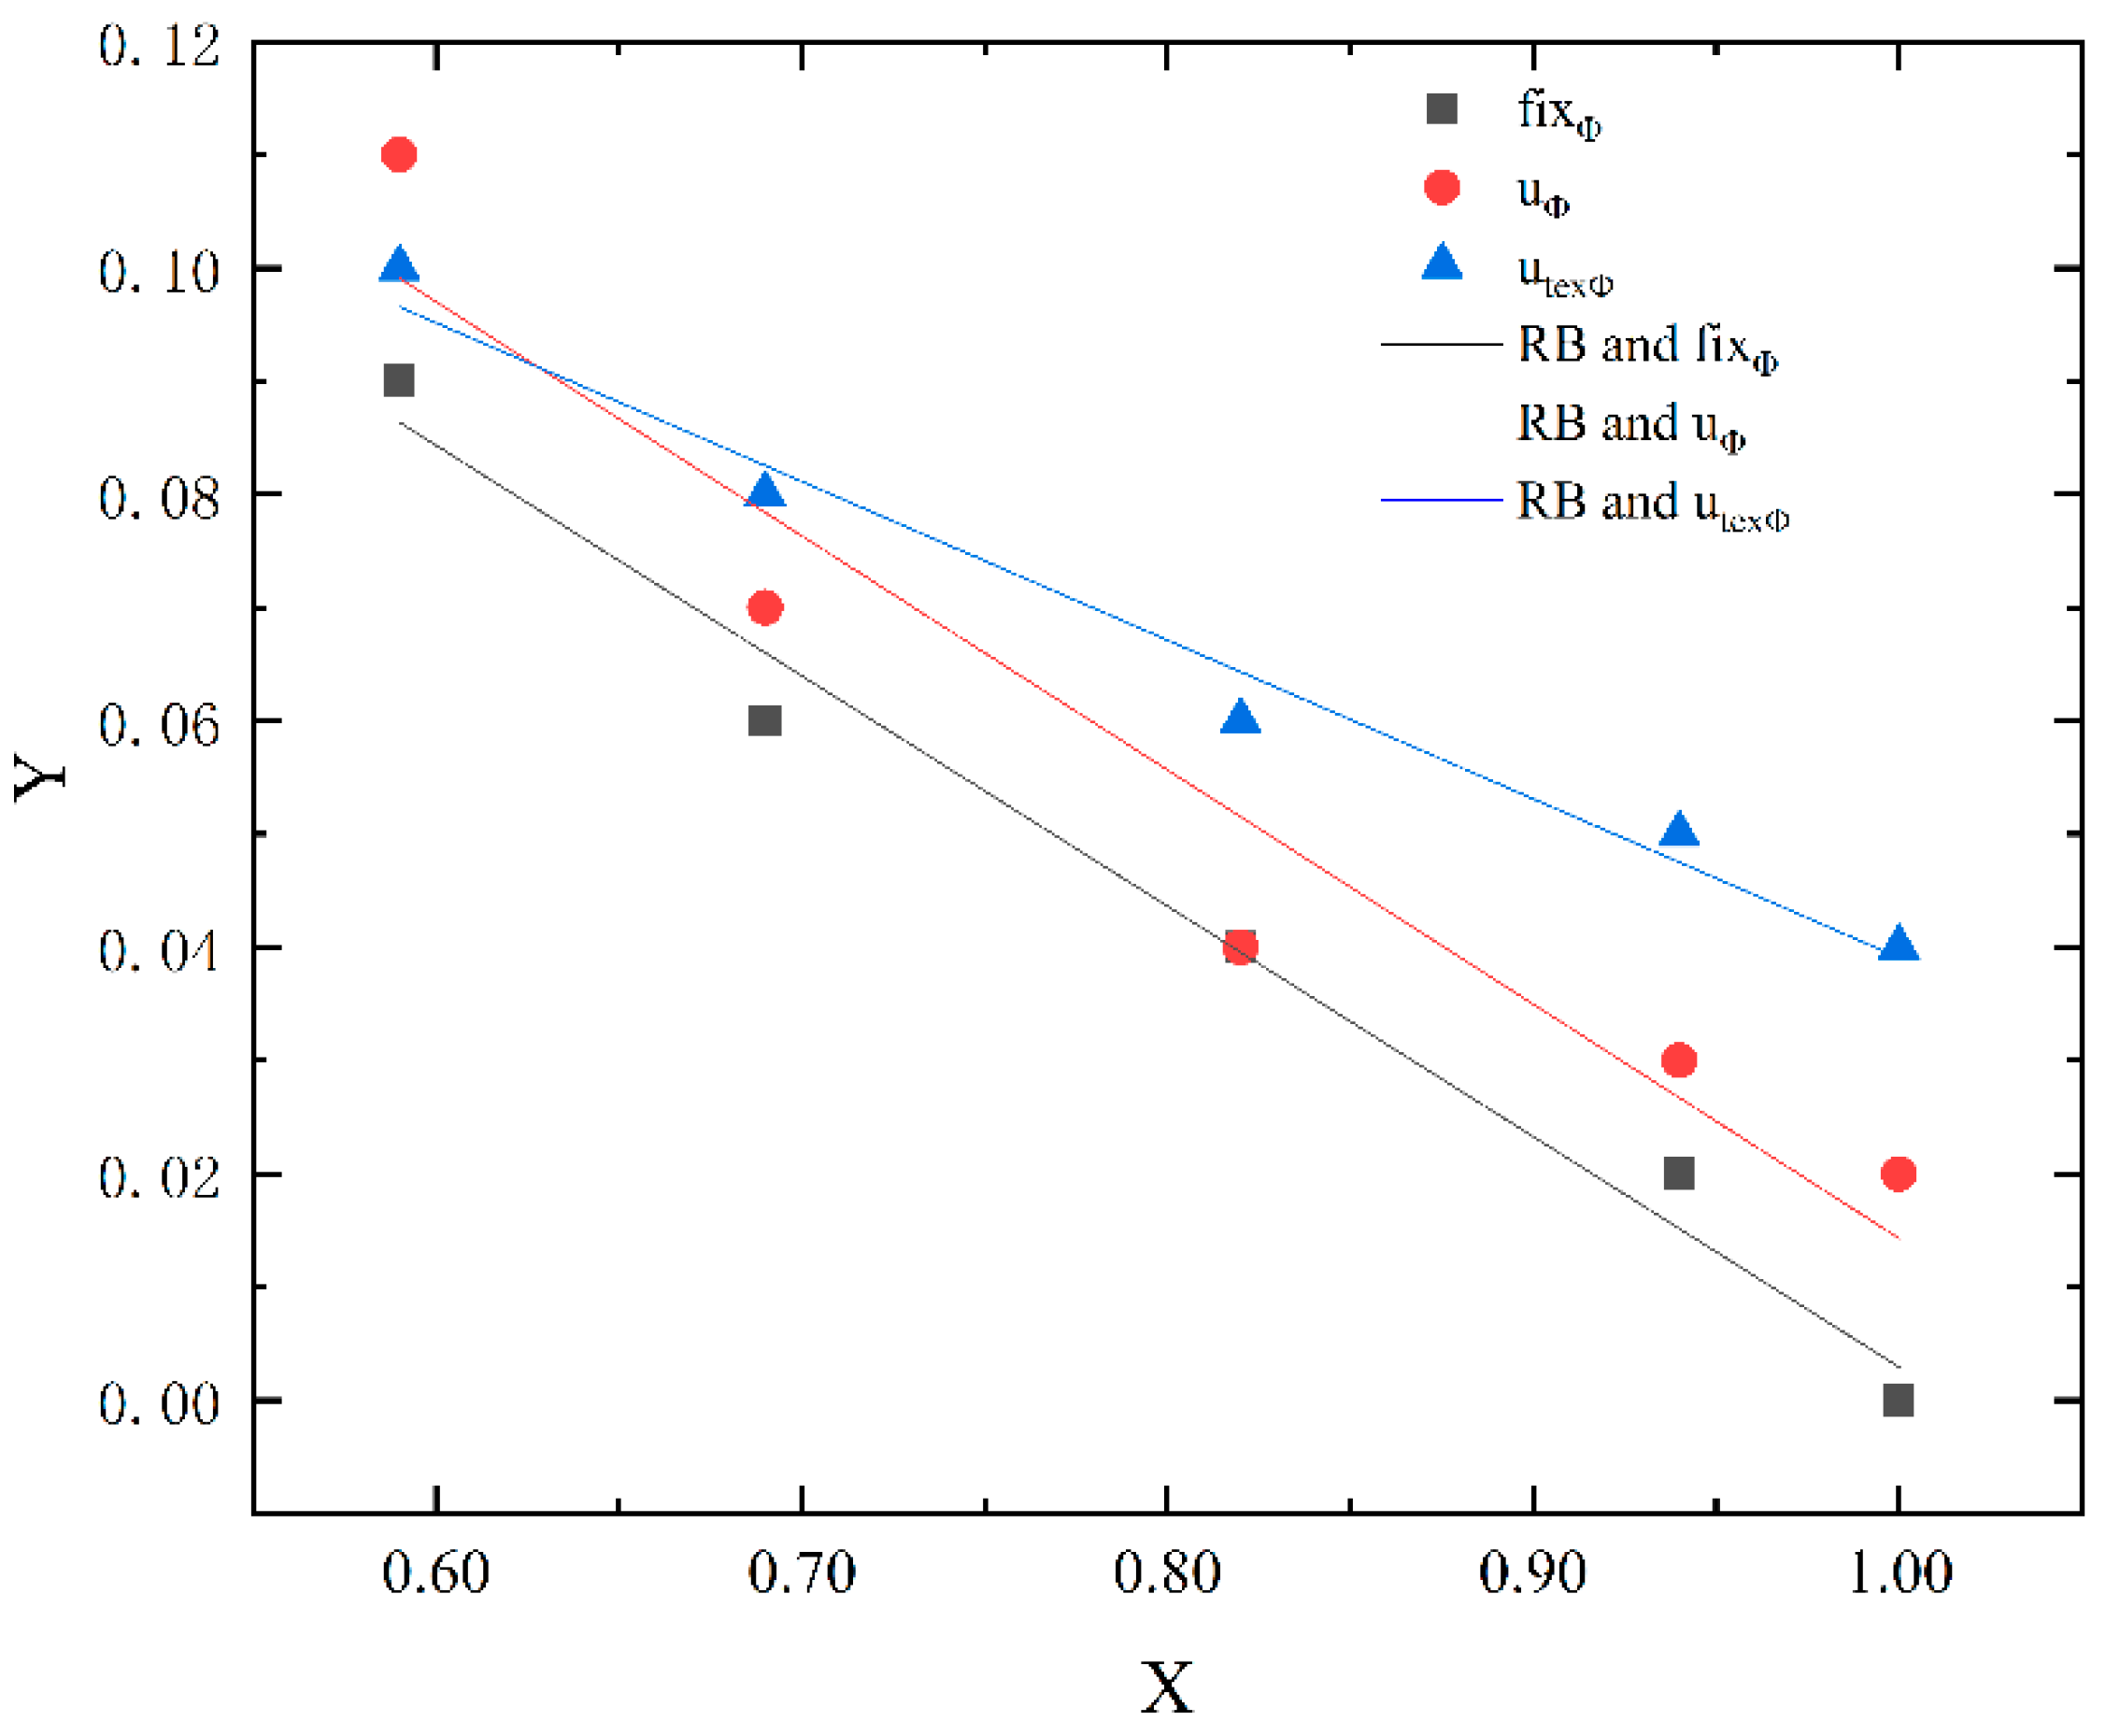
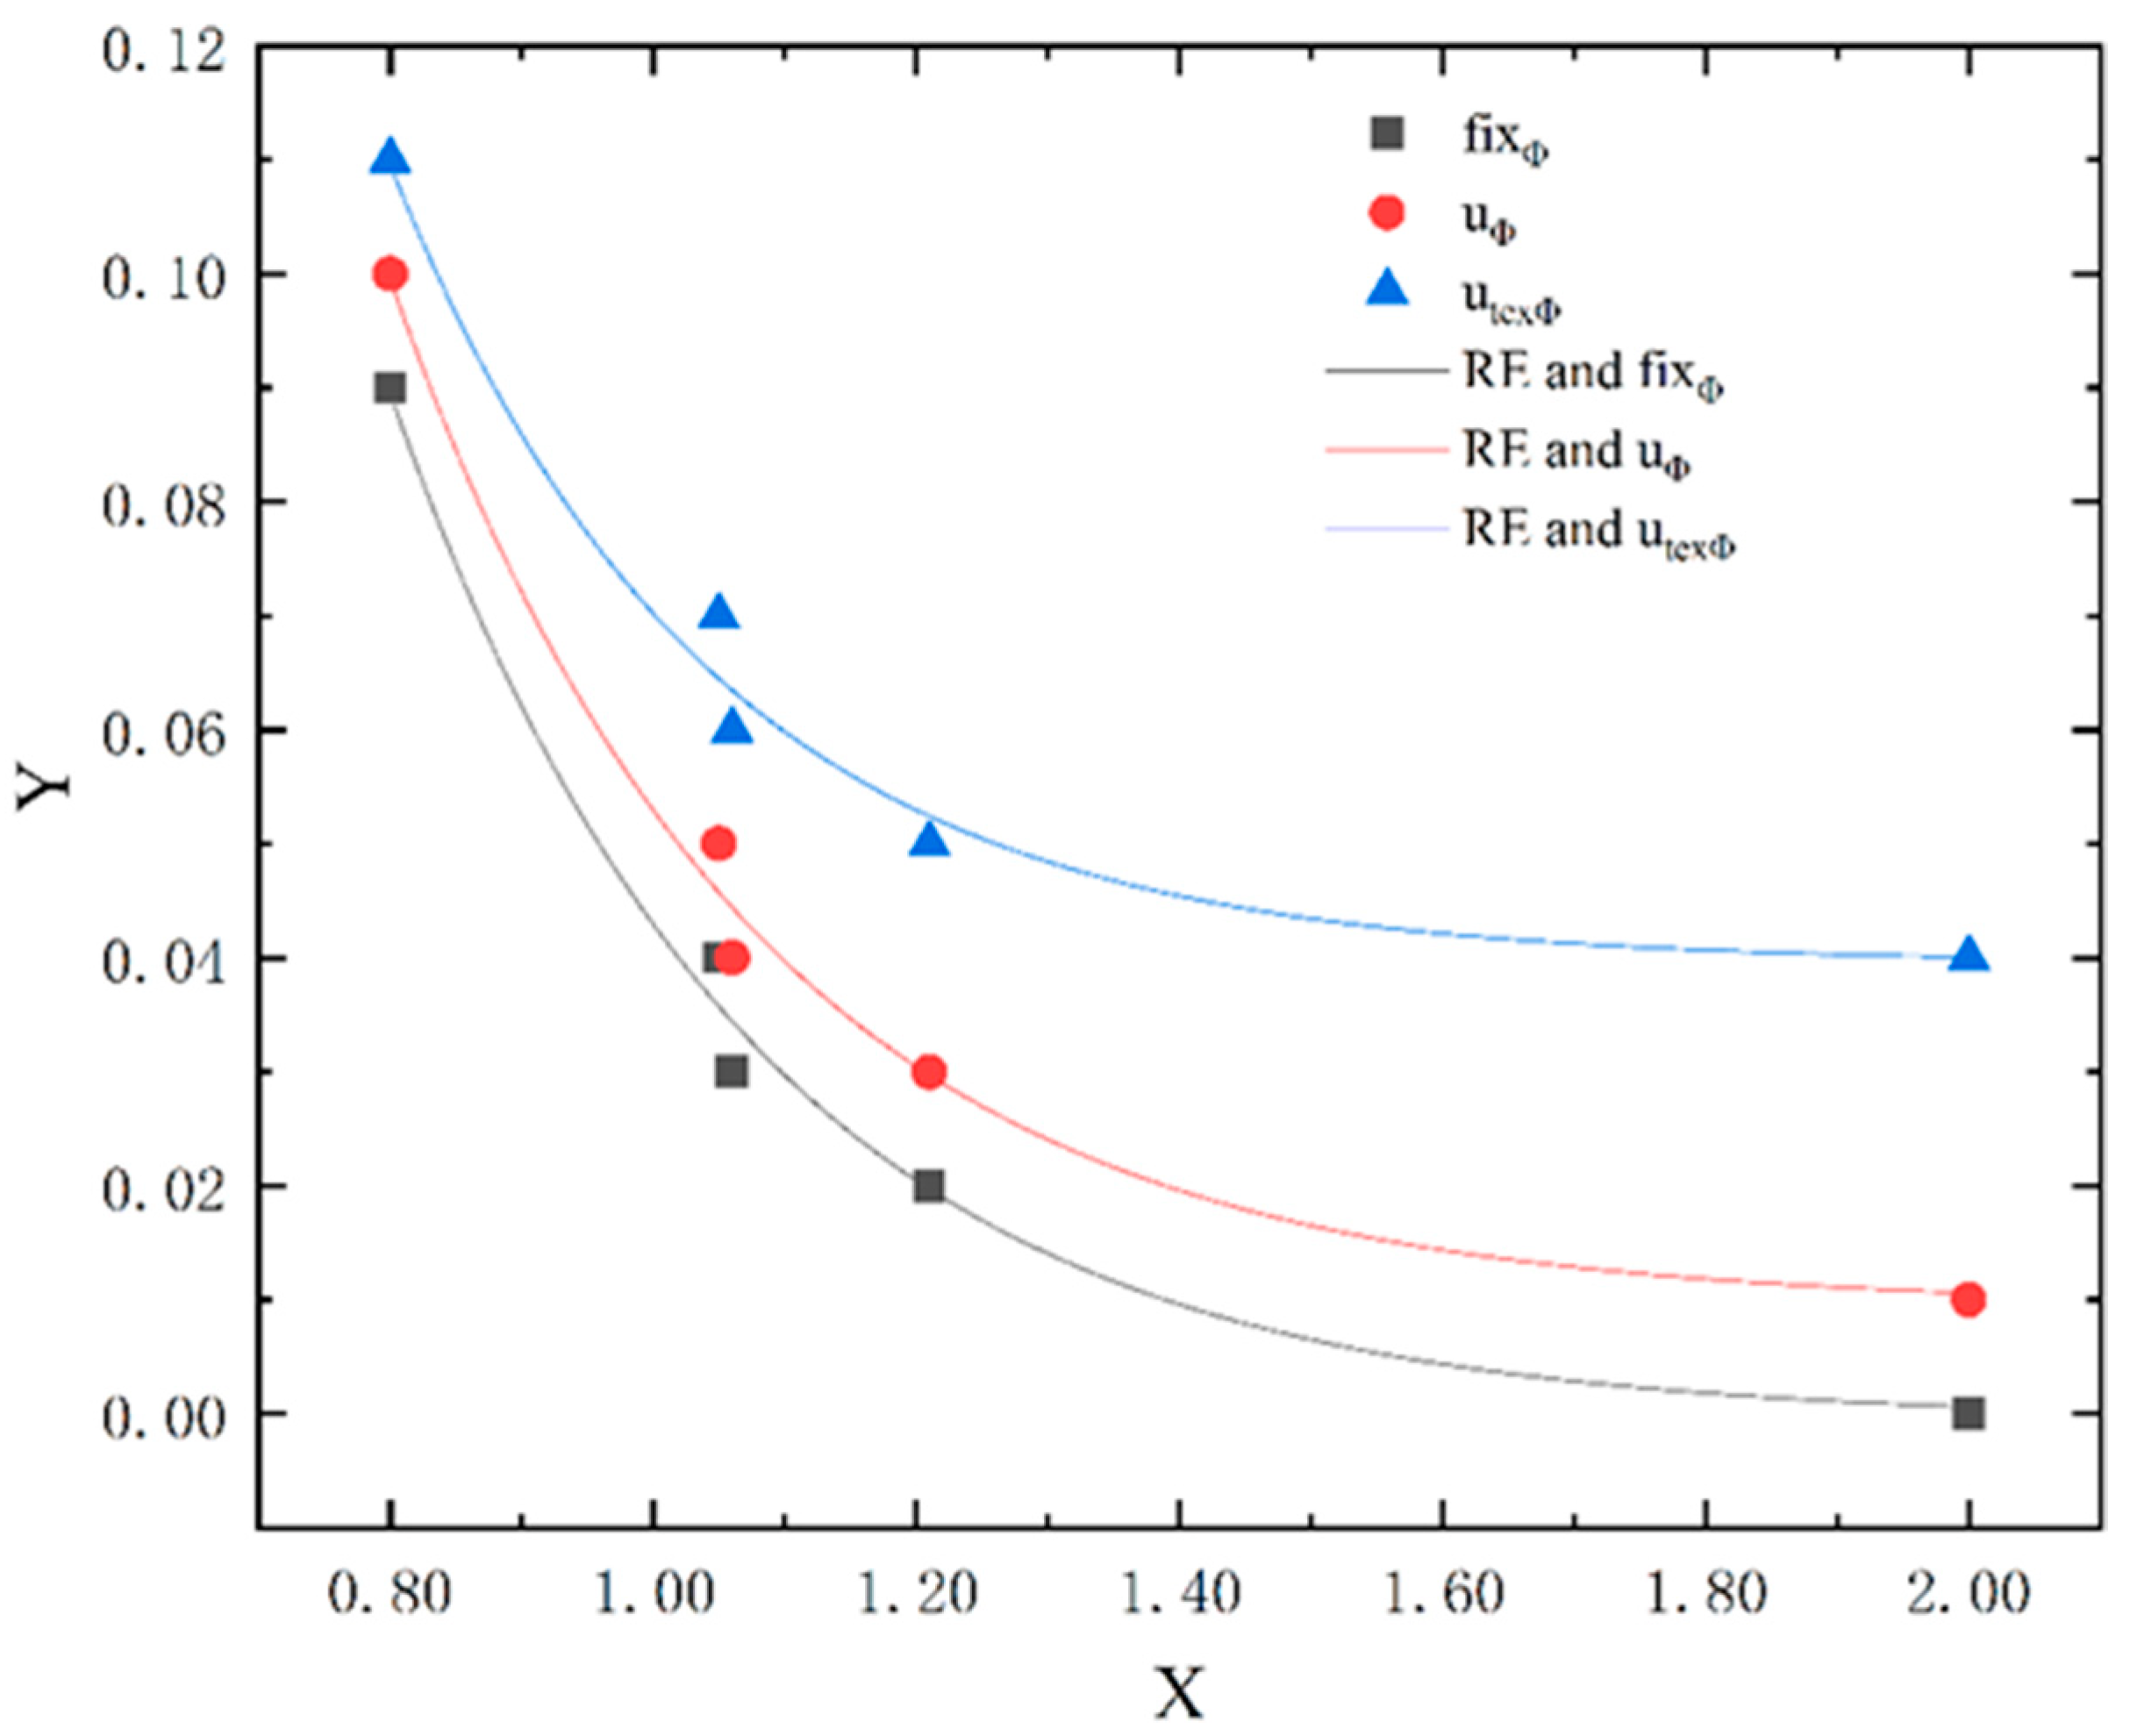
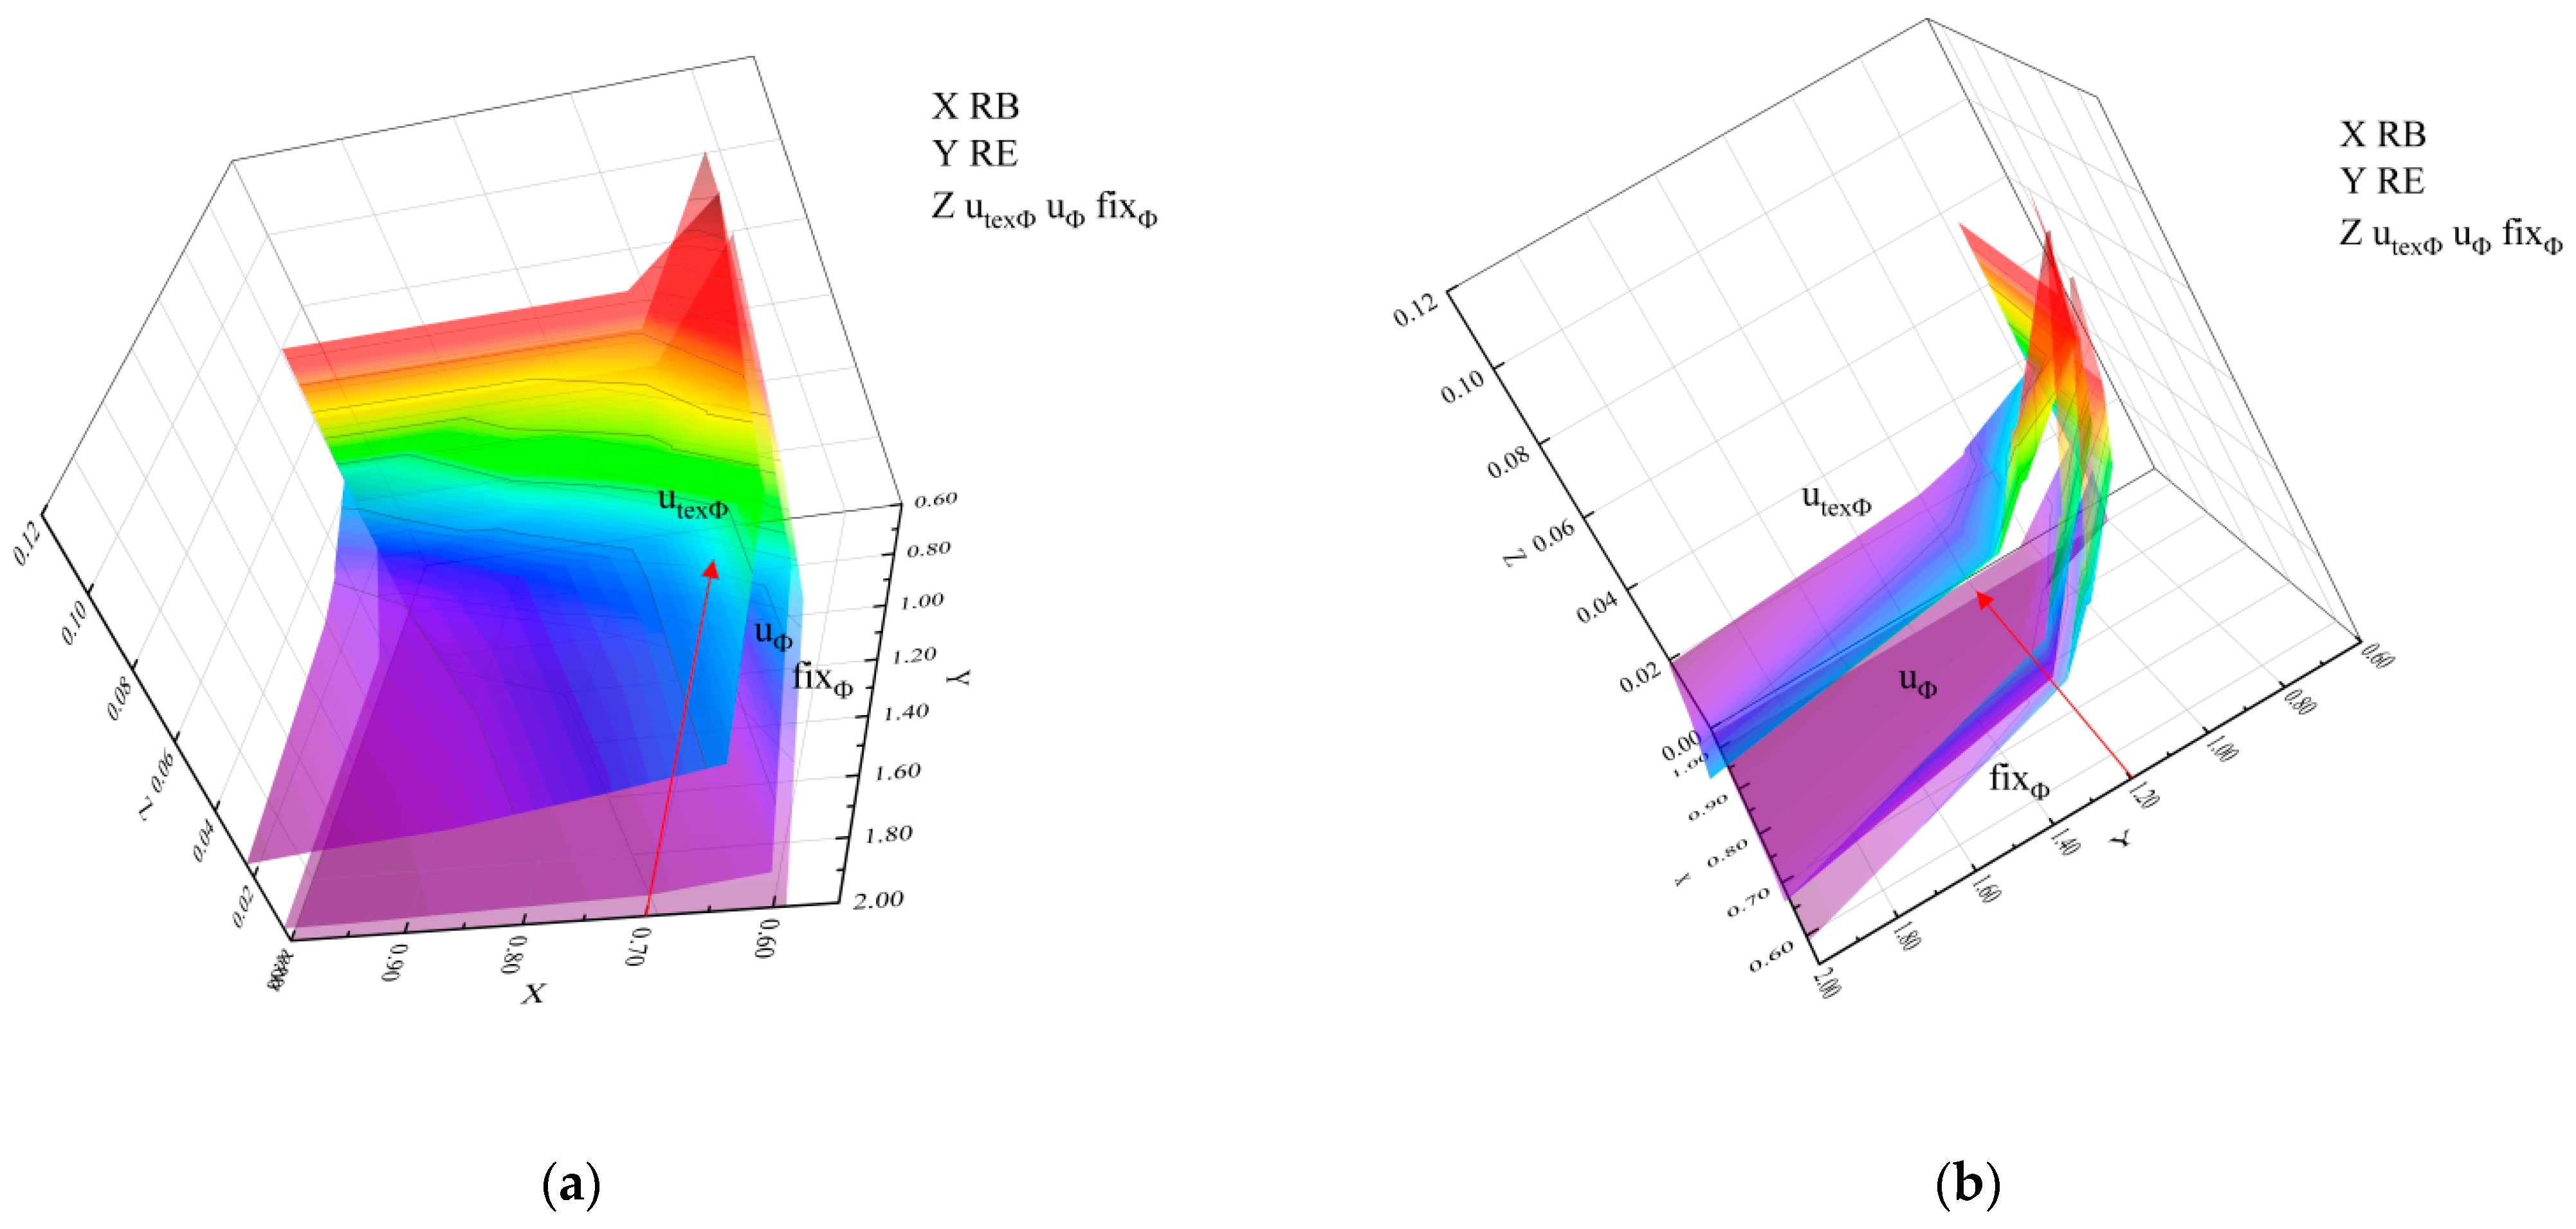
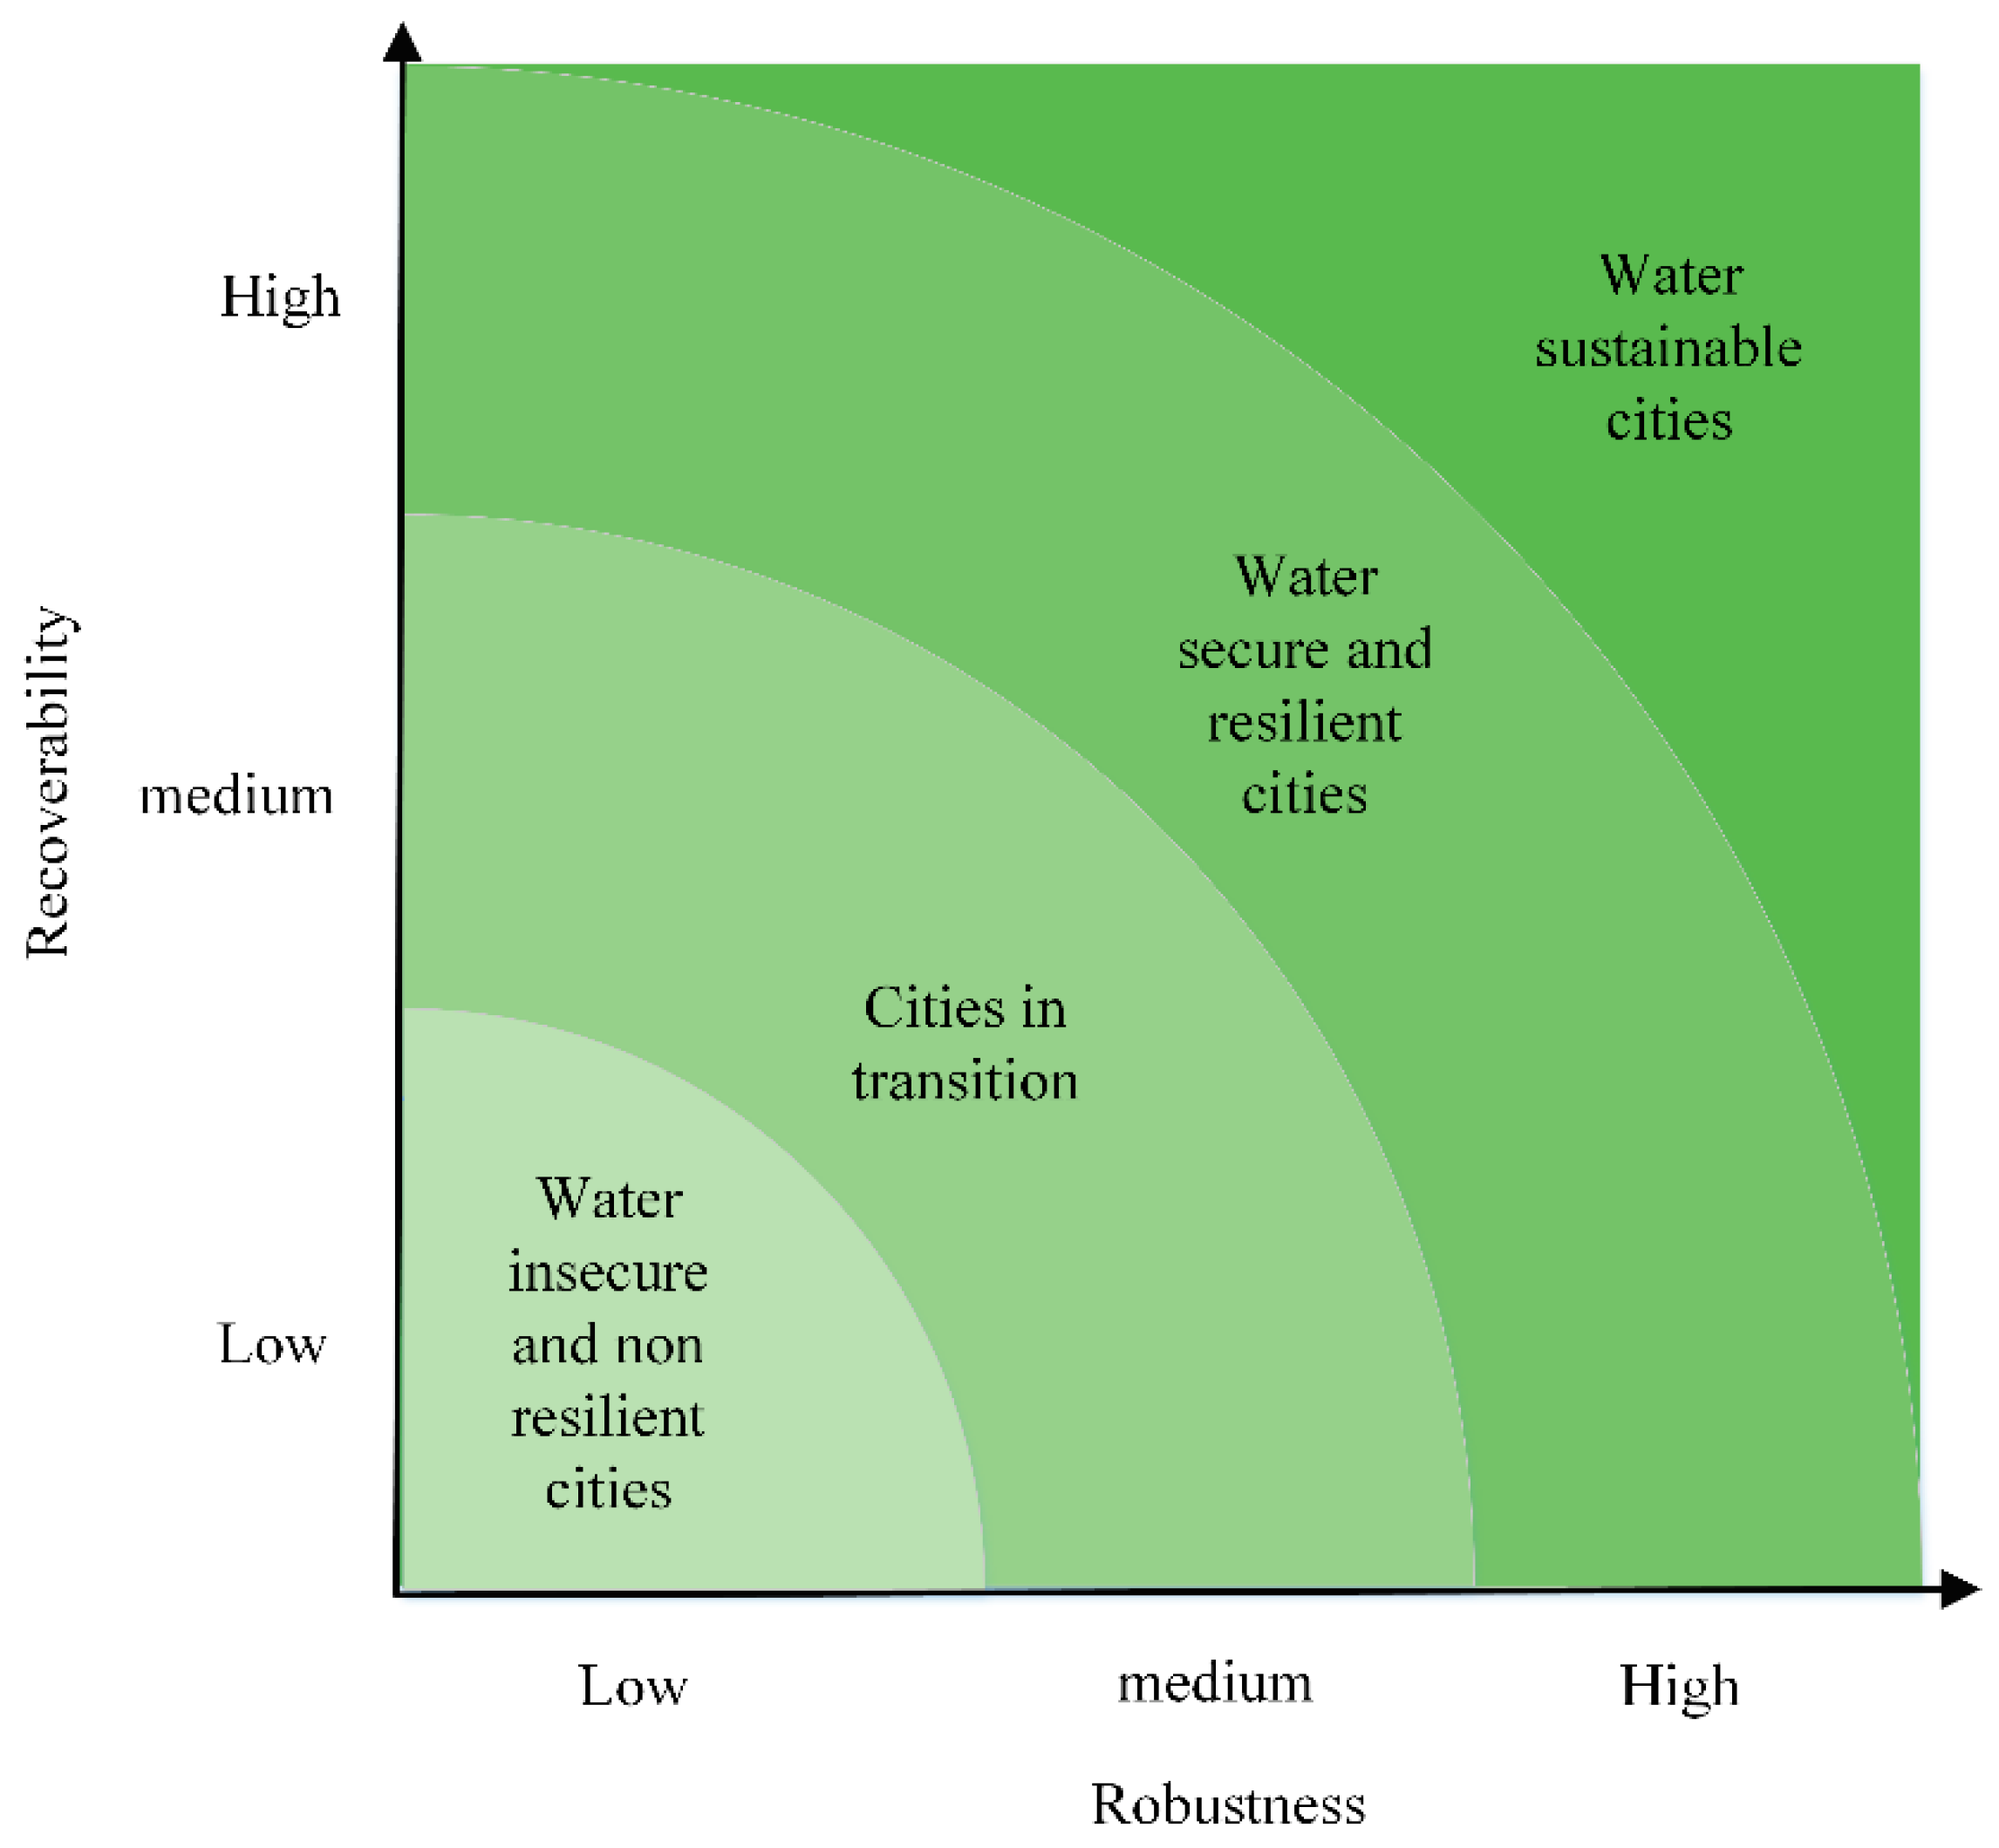
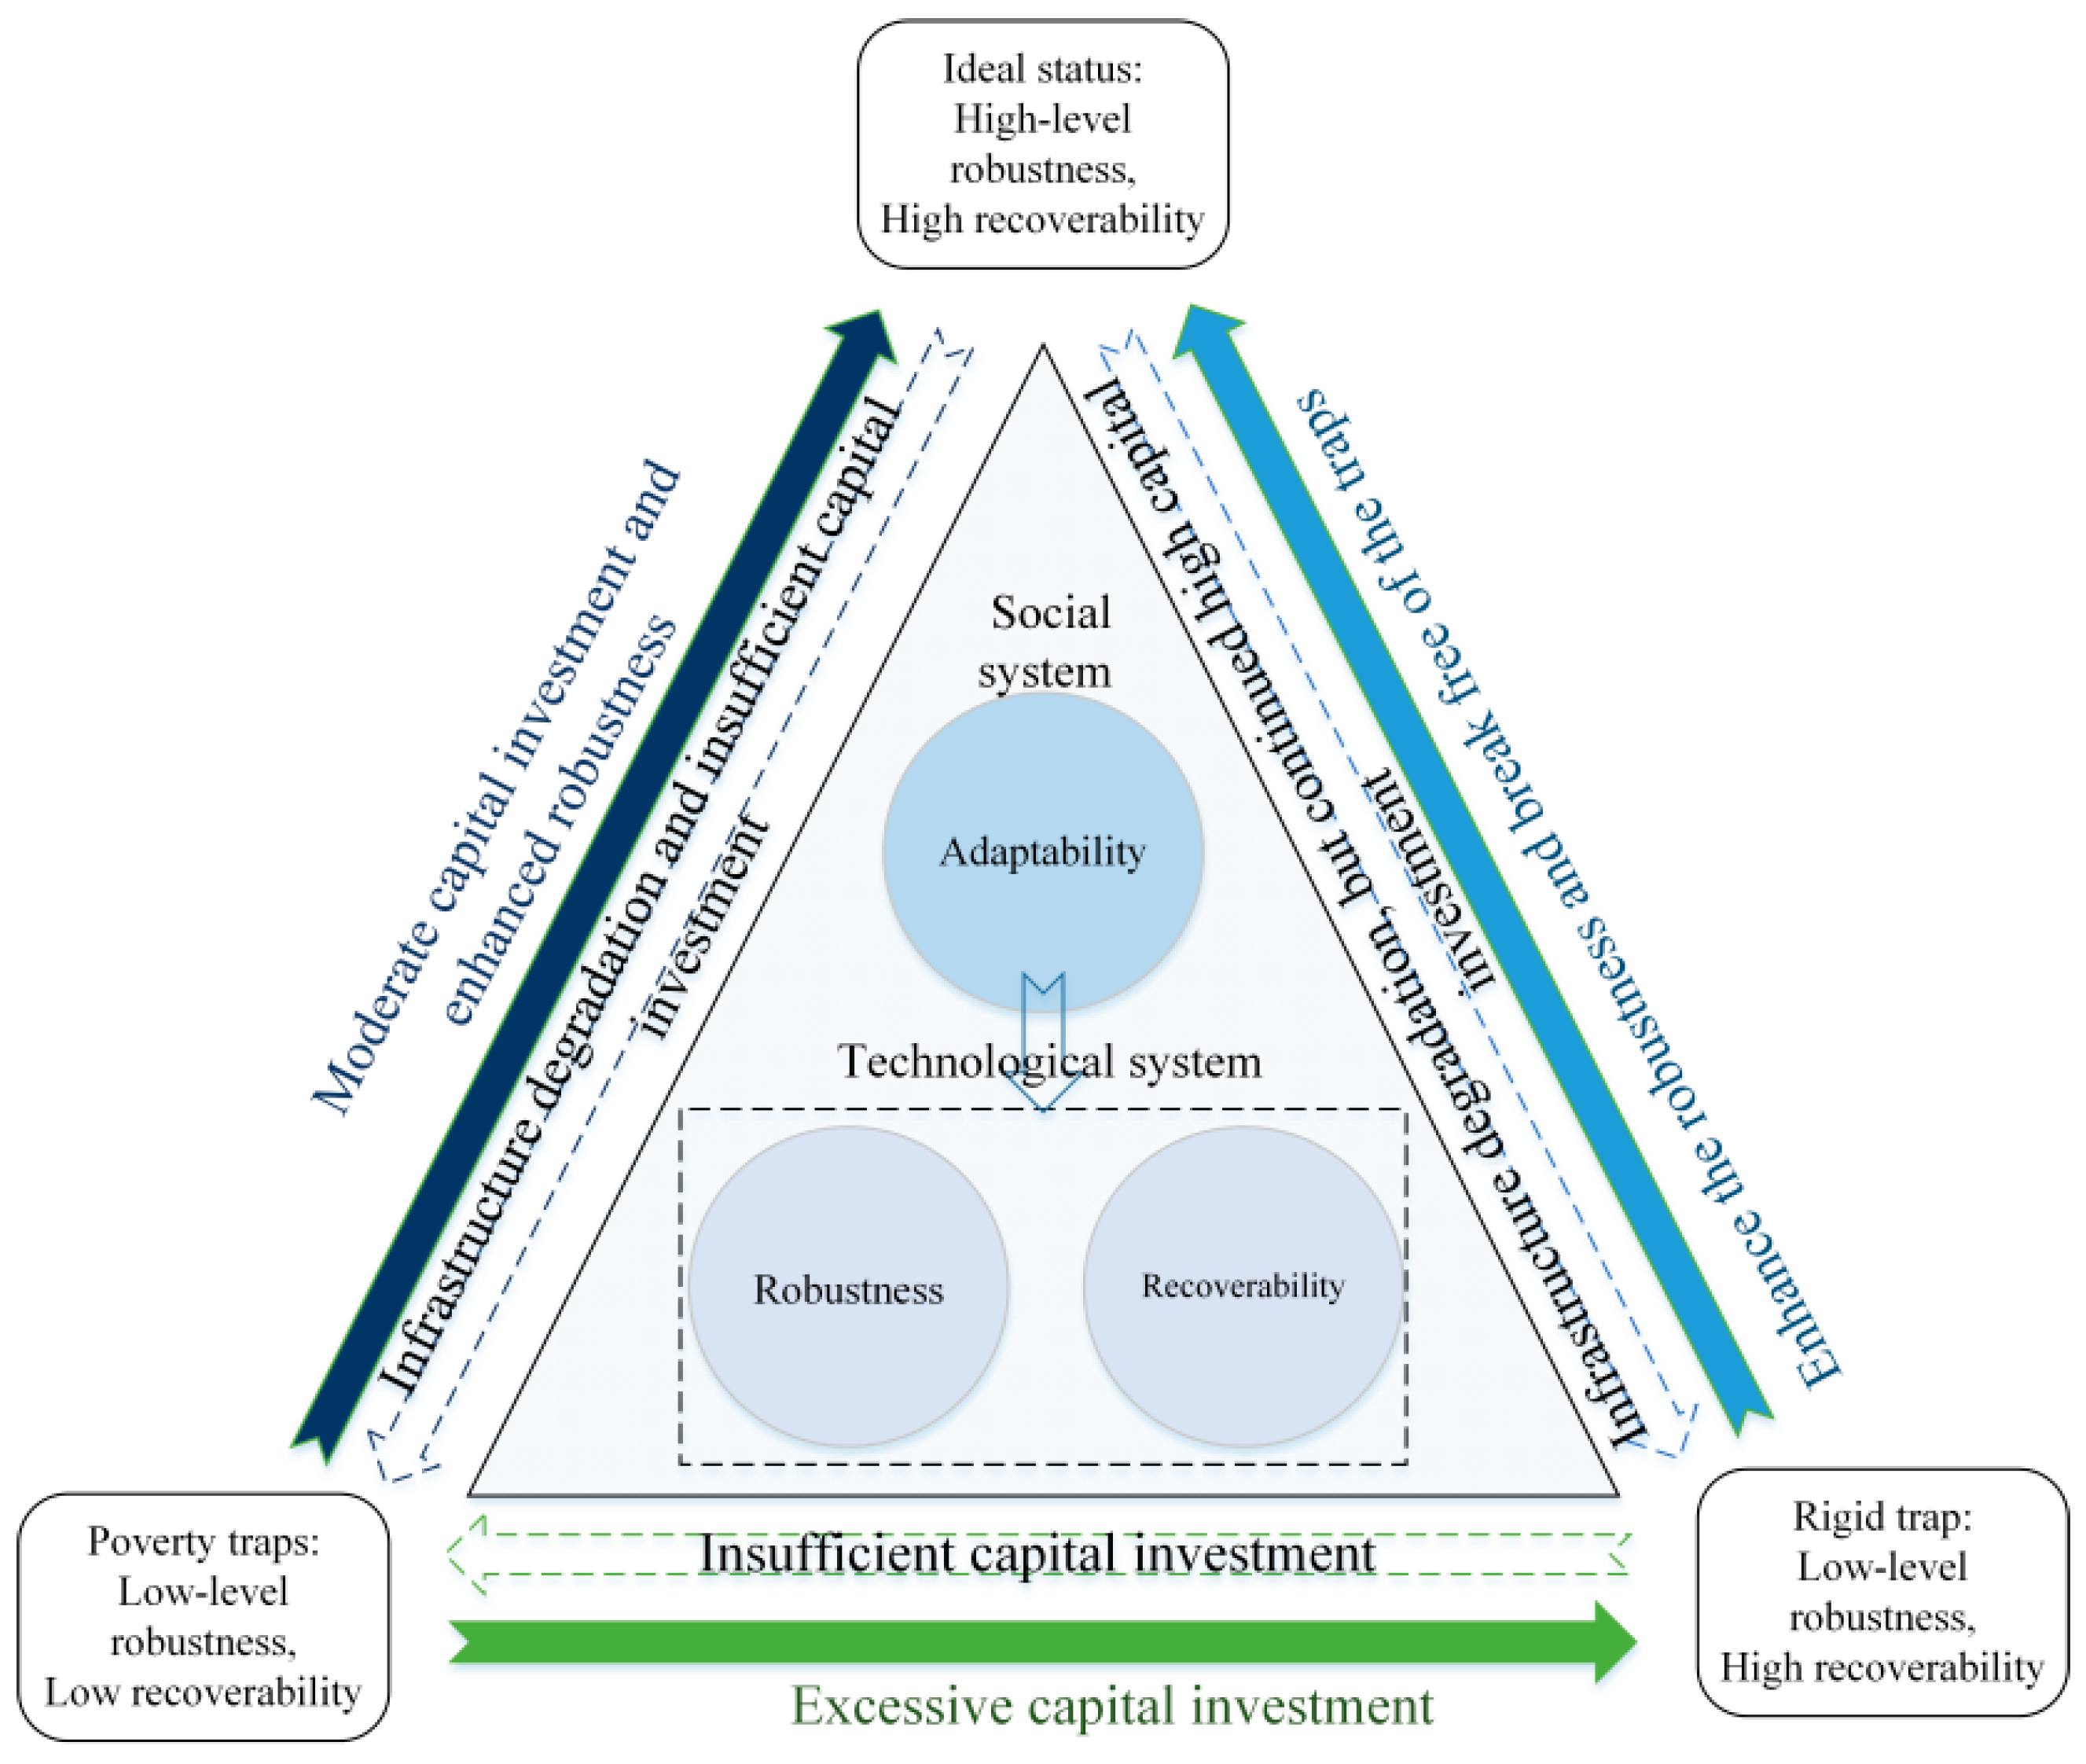
Table 1.
Types of risk and parameterization of shocks.
| Risk Category | Risk Type Description | Influence of Capital | Risk Attributes | Urban Risk Score (with, 1/without, 0) |
|---|---|---|---|---|
| Geology and geography | Earthquake, tsunami, landslide, etc. | I A | Acute | 1 |
| Land subsidence | I | Chronic | 1 | |
| Socio-economic and geopolitical threats | Socioeconomic and political changes, unpredictably high rates of immigration | W I F P A | Chronic | 0 |
| Direct threat of terrorism or war | W I F P A | Acute | 0 | |
| Competition for water resources | W P | Chronic | 1 | |
| Trespass into water pipes | I | Chronic | 0 | |
| Immediate threat of economic crisis | F P A | Acute | 0 | |
| Pollution hazard | Industrial leakage | W I A | Acute | 1 |
| Pandemic | W I A | Acute | 1 | |
| Impact of ageing infrastructure on water pollution, waterborne diseases after floods, intensive agriculture, lack of sanitation infrastructure on ground water quality | W I A | Chronic | 1 | |
| Climate and weather-related hazards | Storms | I | Acute | 1 |
| Flood, drought | W | Acute | 1 | |
| Extreme temperature (low temperatures, heat waves) | I | Chronic | 1 | |
| Saltwater intrusion | W I A | Chronic | 1 | |
| Storm surge | W I | Acute | 1 | |
| Seawater intrusion | W I A | Chronic | 1 | |
| Eutrophication in coastal waters | W | Chronic | 1 |
Table 2.
Five combination processes of capital and resilience properties.
| Capital | Resilience Properties | ||
|---|---|---|---|
| Robustness (RB): average of the binary fractions is calculated | Recoverability (RE) | Risk (R) | |
| Financial capital (F) | Medium to high income (income that can be used for unexpected expenses); foreign investment dependence on infrastructure investment <50%; whether the investment in water conservancy facilities is at a medium or high level | Ratio of annual water sector income (FI) to annual water sector expenditure (FS) multiplied by I (F = FI/FS Page: 11 × I) | 3 4 7 |
| Management effectiveness (P) | Emergency action plan; ability to improvise, innovate, expand action; national support plan for disaster recovery; city management efficiency ranking; | p: calculate the average of the nine binary fractions: communication protocol for sharing structured information; feedback loop; feedback loop mechanism of cross-department coordination; training and training flexibility and sustainability innovation;public participatory decision-making/management mechanism; tracking customer complaint mechanism; openness of government affairs; flexible employing mechanism and perfect assessment and supervision mechanism;urban and rural strategy; transboundary agreements; groundwater management mechanism; surface water management mechanism | 3 4 5 7 |
| Infrastructure (I) | Expected maintenance; emergency solution for power failure; cross-sectoral coordination (sanitation, drainage, energy, transport); continuous water supply; monitoring leaks;the average material life is less than 50 years;redundancy of key nodes; distributed resources;possibility of emergency quarantine | Infrastructure (I): SW = (UWA − Wleakage)/DW UWA refers to annual urban water supply, Wleakage refers to annual leakage, DW refers to annual water WDrink= Daily domestic water consumption per resident × 365 × population N/DW Annual water I = h × SW −q × WDrink h: penetration rate, q: proportion of drinking water contaminated (q = 1-water quality compliance rate) | 1 2 3 4 6 8 9 10 11 13 |
| Water resources (W) | Storage flow ratio; external water dependence; water source connectivity; water quality management levels (1: monitoring, 2: discharge regulations, 3: water source control and polluter pays for treatment, 4: precautionary principle); water source diversity (1: one source, 2: one type of source, 3: two sources and types, 4: multiple types) | Water source W = UWA city annual per capita water supply/water threshold QS | 3 4 5 8 9 10 12 |
| Organizational adaptation (A) | ARB: access to alternative water sources (e.g., desalination); ≥middle and high income cities (wages and benefits for practitioners); more than 7 days of continuous emergency water supply; access to emergency response information; an active organization; water treatment prior to water supply; direct access to backup water sources (e.g., wells, rivers, etc.) | ARE: Organizational adaptation (A): A = (passenger water + other unconventional water such as seawater desalination)/DW annual water consumption + q × WDrink + reserve water/DW annual water | 1 3 4 7 8 9 10 |
| Aggregation of summary | RBtotal = (FRB + PRB + IRB + WRB + ARB)/5; RBpublic = (FRB + PRB + IRB + WRB)/4 | REtotal = REpublic + A; REpublic = 4/(1/FRE + 1/PRE + 1/IRE + 1/WRE) | Rtotal = (RF + RP + RI + RW + RA)/5 |
| Atotal = 2/(ARB + ARE) | Total resilience = 3/(1/RBtotal + 1/REtotal + 1/Atotal) | ||
Table 3.
Input parameters of the coupled system model.
| Parameter | Technical Service | Total Service |
|---|---|---|
| b | 0.55 | 0.29 |
| ɑ | 9.92 | 14.09 |
| c1 | 0.26 | 0.21 |
| c2 | 0.29 | 0.08 |
| r | 0.29 | 0.08 |
| β | 0.74 | 0.79 |
| n | 3.34 | 3.55 |
| λchronic | 0.45 | 0.45 |
| λacute | 0.04 | 0.04 |
Table 4.
Outputs of the case studies.
| Parameter | Technical Service | Total Service |
|---|---|---|
| fixΩ | 0.58 | 0.72 |
| fixΦ | 0.19 | 0.09 |
| uΩ | 0.48 | 0.65 |
| uΦ | 0.22 | 0.11 |
| Φth-above (%) | 0.10 | 0.03 |
| Ωth-below (%) | 0.58 | 0.30 |
| utexΦ-above | 0.17 | 0.10 |
| utexΩ-below | 2.87 | 2.87 |
Table 5.
Combinations of promotion strategies: 0, a lack of improved capital; F, improvement in financial capital; P, improvement in management efficiency; I, improvement in infrastructure; W, improvement in available water resources; and A, improvement in organizational adaptation.
Table 5.
Combinations of promotion strategies: 0, a lack of improved capital; F, improvement in financial capital; P, improvement in management efficiency; I, improvement in infrastructure; W, improvement in available water resources; and A, improvement in organizational adaptation.
| Number | RB | RE |
|---|---|---|
| 0 | 0 | 0 |
| 1 | 0 | F |
| 2 | 0 | F + P |
| 3 | 0 | F + P + I |
| 4 | 0 | F + P + I + W |
| 5 | 0 | F + P + I + W + A |
| 6 | P | 0 |
| 7 | P | F |
| 8 | P | F + P |
| 9 | P | F + P + I |
| 10 | P | F + P + I + W |
| 11 | P | F + P + I + W + A |
| 12 | P + I | 0 |
| 13 | P + I | F |
| 14 | P + I | F + P |
| 15 | P + I | F + P + I |
| 16 | P + I | F + P + I + W |
| 17 | P + I | F + P + I + W + A |
| 18 | P + I + W | 0 |
| 19 | P + I + W | F |
| 20 | P + I + W | F + P |
| 21 | P + I + W | F + P + I |
| 22 | P + I + W | F + P + I + W |
| 23 | P + I + W | F + P + I + W + A |
| 24 | P + I + W + A | 0 |
| 25 | P + I + W + A | F |
| 26 | P + I + W + A | F + P |
| 27 | P + I + W + A | F + P + I |
| 28 | P + I + W + A | F + P + I + W |
| 29 | P + I + W + A | F + P + I + W + A |
Publisher’s Note: MDPI stays neutral with regard to jurisdictional claims in published maps and institutional affiliations. |
© 2021 by the authors. Licensee MDPI, Basel, Switzerland. This article is an open access article distributed under the terms and conditions of the Creative Commons Attribution (CC BY) license (https://creativecommons.org/licenses/by/4.0/).
Share and Cite
MDPI and ACS Style
Liu, J.; Shao, Z.; Wang, W. Resilience Assessment and Critical Point Identification for Urban Water Supply Systems under Uncertain Scenarios. Water 2021, 13, 2939. https://doi.org/10.3390/w13202939
AMA Style
Liu J, Shao Z, Wang W. Resilience Assessment and Critical Point Identification for Urban Water Supply Systems under Uncertain Scenarios. Water. 2021; 13(20):2939. https://doi.org/10.3390/w13202939
Chicago/Turabian StyleLiu, Jinning, Zhiguo Shao, and Wei Wang. 2021. "Resilience Assessment and Critical Point Identification for Urban Water Supply Systems under Uncertain Scenarios" Water 13, no. 20: 2939. https://doi.org/10.3390/w13202939
Note that from the first issue of 2016, this journal uses article numbers instead of page numbers. See further details here.